8-K
false000088462400008846242025-08-052025-08-05


UNITED STATES
SECURITIES AND EXCHANGE COMMISSION
WASHINGTON, D.C. 20549


FORM 8-K


CURRENT REPORT

Pursuant to Section 13 or 15(d) of the Securities Exchange Act of 1934

Date of Report (Date of earliest event reported): August 05, 2025


ORTHOFIX MEDICAL INC.

(Exact name of Registrant as Specified in Its Charter)


Delaware

000-19961

98-1340767

(State or Other Jurisdiction
of Incorporation)

(Commission File Number)

(IRS Employer
Identification No.)


3451 Plano Parkway


Lewisville, Texas


75056

(Address of Principal Executive Offices)


(Zip Code)


Registrant's Telephone Number, Including Area Code: (214) 937-2000


(Former Name or Former Address, if Changed Since Last Report)


Check the appropriate box below if the Form 8-K filing is intended to simultaneously satisfy the filing obligation of the registrant under any of the following provisions:

Written communications pursuant to Rule 425 under the Securities Act (17 CFR 230.425)
Soliciting material pursuant to Rule 14a-12 under the Exchange Act (17 CFR 240.14a-12)
Pre-commencement communications pursuant to Rule 14d-2(b) under the Exchange Act (17 CFR 240.14d-2(b))
Pre-commencement communications pursuant to Rule 13e-4(c) under the Exchange Act (17 CFR 240.13e-4(c))

Securities registered pursuant to Section 12(b) of the Act:


Title of each class


Trading
Symbol(s)


Name of each exchange on which registered

Common stock, $0.10 par value per share


OFIX


Nasdaq Global Select Market

Indicate by check mark whether the registrant is an emerging growth company as defined in Rule 405 of the Securities Act of 1933 (§ 230.405 of this chapter) or Rule 12b-2 of the Securities Exchange Act of 1934 (§ 240.12b-2 of this chapter).

Emerging growth company

If an emerging growth company, indicate by check mark if the registrant has elected not to use the extended transition period for complying with any new or revised financial accounting standards provided pursuant to Section 13(a) of the Exchange Act.


Item 2.02. Results of Operations and Financial Condition.

On August 5, 2025, Orthofix Medical Inc. (the "Company") issued a press release announcing, among other things, its financial results for the second quarter ended June 30, 2025. A copy of the press release is furnished herewith as Exhibit 99.1 and attached hereto.

The information furnished in this Item 2.02, including the exhibit furnished herewith as Exhibit 99.1, will not be treated as "filed" for the purposes of Section 18 of the Securities Exchange Act of 1934, as amended (the "Exchange Act"), or otherwise subject to the liabilities of that section. This information will not be deemed incorporated by reference into any filing under the Securities Act of 1933, as amended (the "Securities Act"), or into another filing under the Exchange Act, unless that filing expressly incorporates by reference this Item 2.02 of this report.

Discussion of Non-GAAP Financial Measures

In addition to using standard measures of performance and liquidity that are recognized in accordance with accounting principles generally accepted in the United States of America ("GAAP"), the Company uses additional financial measures excluding certain GAAP items ("non-GAAP measures"), such as:

Constant Currency

Constant currency is a non-GAAP measure, which the Company calculates by using foreign currency rates from the comparable, prior-year period, to present net sales at comparable rates. Constant currency can be presented for numerous GAAP measures, but is most commonly used by management to analyze net sales without the impact of changes in foreign currency rates.

Free Cash Flow

Free cash flow is a non-GAAP financial measure, which is calculated by subtracting capital expenditures from cash flow provided by or used in operating activities. Free cash flow is an important indicator of how much cash is generated or used by the Company's business operations, including capital expenditures. Management uses free cash flow to measure progress on its capital efficiency and cash flow initiatives.

Adjusted Gross Profit and Adjusted Gross Margin

Adjusted gross profit represents GAAP gross profit with adjustments to exclude the impact of the certain items recorded to cost of goods sold. Potential adjustments are listed within the section below under the header "Non-GAAP Adjustments." Adjusted gross margin represents adjusted gross profit as a percentage of GAAP net sales.

Adjusted Net Income (Loss)

Adjusted net income (loss) represents GAAP net loss with adjustments to exclude the impact of certain items recorded in such GAAP net loss. Potential adjustments are listed within the section below under the header "Non-GAAP Adjustments."

Adjusted Operating Expenses

Adjusted operating expenses represents GAAP operating expenses, such as sales, general, and administrative expense, and research and development expense, with adjustments to exclude the impact of certain items recorded in such GAAP operating expenses. Potential adjustments are listed within the section below under the header "Non-GAAP Adjustments."

Adjusted Non-Operating Expenses

Adjusted non-operating expenses represents GAAP non-operating expenses, such as interest income (expense), net and other income (expense), net, with adjustments to exclude the impact of certain items recorded in such GAAP non-operating expenses. Potential adjustments are listed within the section below under the header "Non-GAAP Adjustments."

EBITDA

EBITDA is a non-GAAP financial measure, which the Company calculates by adding interest expense (income), net; income tax expense (benefit); and depreciation and amortization to net income (loss). EBITDA provides management with additional insight into the Company's results of operations. Adjusted EBITDA, which is the primary metric used by the Company's chief operating decision maker in managing the business, consists of EBITDA with adjustments to exclude certain items listed within the section below under the header "Non-GAAP Adjustments."

Non-GAAP Adjustments

The Company's non-GAAP financial measures provide management with additional insight into the Company's results of operations and reflect the exclusion of the following items:

Share-based compensation expense – Costs related to awards granted under the Company's share-based compensation plans, which include stock options, performance-based or market-based stock options, restricted stock units, performance-based or market-based restricted stock units, and stock issued under the Company's stock purchase plan; see the share-based compensation footnote in the Company's Form 10-Q for the quarter ended June 30, 2025, for an allocation of these costs by consolidated statement of operations line item. Management excludes this item when evaluating the Company's operating performance as it represents a non-cash expense.

Foreign exchange impact – Gains and losses related to foreign currency transactions, which are recorded as other income (expense), net. Management excludes this item when evaluating the Company's operating results as it is primarily a non-cash expense or benefit and is non-operating in nature.
SeaSpine merger-related costs – Costs related to the Company's merger with SeaSpine Holdings Corporation ("SeaSpine"), which was consummated in January 2023, including costs relating to integration efforts, severance and retention costs, product rationalization charges, contract termination penalties, and professional fees related to the merger. Management excludes this item when evaluating the Company's operating results as these costs associated with this event are of a temporary nature, are not related to the Company's core operating performance, and are not expected to recur at a similar frequency and magnitude in the future.
Strategic investments – Costs related to the Company's strategic investments, such as due diligence and integration costs (unrelated to the merger with SeaSpine), which are primarily recorded as sales, general, and administrative expenses. These costs are not factored into the evaluation of the Company's performance by management because they are of a temporary nature, not related to the Company's core operating performance, and because the frequency and amount of such costs vary significantly based on the timing and magnitude of the Company's strategic investments.
Acquisition-related fair value adjustments – Comprised of (i) gains and losses related to remeasurement of contingent consideration to fair value, which are recorded as operating expenses, (ii) recognized costs related to acquired in-process research and development ("IPR&D") assets, which are expensed immediately, and (iii) amortization of acquired inventory fair market value adjustments. Management excludes these adjustments when evaluating the Company's operating results as (i) the remeasurement of contingent consideration is primarily non-cash in nature, (ii) the frequency and amount of IPR&D charges can vary significantly based on the timing and magnitude of the Company's acquisition transactions, and (iii) inventory fair market value adjustments are of a temporary and non-cash nature.
Amortization/depreciation of acquired long-lived assets – Amortization of intangible assets acquired in business combinations or asset acquisitions, including items such as developed technologies, customer relationships, trade names, manufacturing agreements, and other intangible assets, and any impairment of acquired goodwill, which are recorded in cost of sales or operating expenses. This item also includes depreciation recognized on adjustments to the fair value of certain long-lived assets acquired in the merger with SeaSpine. Management excludes this item when evaluating the Company's operating performance as it represents a non-cash expense.
Interest and gain (loss) on investments – Interest income and net gains or losses recognized (realized or unrealized) within interest income (expense), net and other income (expense), net, respectively, relating to certain of the Company's investments. Management excludes these items when evaluating the Company's operating performance as it typically represents a non-cash gain or loss and is not related to the Company's core operating performance.
Litigation and investigation-related costs – Inclusive of (i) adverse or favorable legal judgments or negotiated legal settlements and certain related legal expenses and (ii) amounts incurred in relation to and as a result of the Board of Directors' investigation conducted by independent outside legal counsel that resulted in the departure of three former executive officers and certain charges stemming from these actions. These charges are primarily recorded within sales, general, and administrative expenses. Management excludes these items when evaluating the Company's operating results as these costs and/or benefits can vary significantly based on the timing, frequency, and magnitude of litigation matters or investigations.
Succession charges – Costs related to the transition of certain executive officers, including any cessation and onboarding amounts, consulting services, and other related expenses, which are primarily recorded as sales, general, and administrative expenses. Management excludes this item when evaluating the Company's operating results as these costs are associated with events that are not expected to recur at a similar frequency and magnitude in the future.
Restructuring costs and impairments related to M6 product lines - Restructuring costs, including severance-related benefits, and impairment charges incurred as a result of the Company's decision to discontinue its M6 artificial disc product lines. Management excludes this item when evaluating the Company's operating results as these costs associated with this event are one-time in nature and are not related to the Company's expected ongoing operations.
Employee retention credit - Pertains to refunds received, interest earned, or professional fees incurred associated with the refundable payroll tax credit established by the Coronavirus Aid, Relief, and Economic Security Act. Management excludes this item when evaluating the Company's operating results as these amounts primarily relate to costs incurred in prior years, and are not related to the Company's ongoing operations.
Long-term income tax rate adjustment – Reflects management's expectation of a long-term normalized effective tax rate of 28% for 2024 and 2025 results, which is based on current tax law and current expected adjusted income; actual reported tax expense will ultimately be based on GAAP earnings and may differ from the expected long-term normalized effective tax rate due to a variety of factors, including the resolution of issues arising from tax audits with various tax authorities, the ability to realize deferred tax assets, and the tax impact of certain reconciling items that are excluded in determining adjusted net income (loss).

Usefulness and Limitations of Non-GAAP Financial Measures

Management uses non-GAAP measures to evaluate performance period-over-period, analyze the underlying trends in the Company's business, assess the Company's performance relative to its competitors, and establish operational goals and forecasts used in allocating resources. Management uses these non-GAAP measures as the basis for evaluating the ability of the Company's underlying operations to generate cash, prior to required investments in working capital, and to further its understanding of the performance of the Company's business units.

Material Limitations Associated with the Use of Non-GAAP Financial Measures

The non-GAAP financial measures described above may have limitations as analytical tools, and should not be considered in isolation or as a replacement for GAAP financial measures. Some of the limitations associated with the use of these non-GAAP financial measures are that they exclude items that reflect an economic cost and can have a material effect on cash flows. Similarly, certain non-cash expenses, such as share-based compensation, do not directly impact cash flows, but are part of total compensation costs accounted for under GAAP.

Compensation for Limitations Associated with Use of Non-GAAP Financial Measures

The Company compensates for the limitations of its non-GAAP financial measures by relying upon GAAP results to gain a complete picture of the Company's performance. GAAP results provide management with the ability to understand the Company's performance based on a defined set of criteria. The Company provides reconciliations of the non-GAAP financial measures to the most directly comparable GAAP measures and encourages investors to review these reconciliations.

Usefulness of Non-GAAP Financial Measures to Investors

The Company believes that providing non-GAAP financial measures, which exclude certain items, offers investors greater transparency into the information used by management in its financial and operational decision-making. Management believes it is important to provide investors with the same non-GAAP financial measures it uses to supplement information regarding the performance and underlying trends of the Company's business operations in order to facilitate comparisons to the Company's historical operating results and internally evaluate the effectiveness of the Company's operating strategies. The Company believes that these non-GAAP financial measures also facilitates comparisons of the Company's underlying operating performance with other companies in the industry that also supplement their GAAP results with non-GAAP financial measures.

Item 7.01 Regulation FD Disclosure.

The Company expects to use the corporate investor relations presentation furnished as Exhibit 99.2 to this report, in whole or in part, and possibly with modifications, in connection with presentations to investors, analysts, and others during the fiscal year ending December 31, 2025.

The information furnished in this Item 7.01, including the exhibit furnished herewith as Exhibit 99.2, will not be treated as "filed" for the purposes of Section 18 of the Exchange Act, or otherwise subject to the liabilities of that section. This information will not be deemed incorporated by reference into any filing under the Securities Act, or into another filing under the Exchange Act, unless that filing expressly incorporates by reference this Item 7.01 of this report.

Item 9.01. Financial Statements and Exhibits.

(d) Exhibits


99.1

Press release, dated August 5, 2025

99.2

Corporate Investor Relations Presentation, dated August 5, 2025

104

Cover Page Interactive Data File (embedded within the Inline XBRL document).


Pursuant to the requirements of the Securities Exchange Act of 1934, the registrant has duly caused this report to be signed on its behalf by the undersigned hereunto duly authorized.


Orthofix Medical Inc.


By:


/s/ JULIE ANDREWS


Julie Andrews

Chief Financial Officer


Date: August 5, 2025


Exhibit 99.1

img236010591_0.jpg

News Release

Orthofix Reports Second Quarter 2025 Financial Results

LEWISVILLE, Texas — August 5, 2025 — Orthofix Medical Inc. (NASDAQ:OFIX), a leading global medical technology company, today reported its financial results for the second quarter ended June 30, 2025, and reaffirmed its full-year 2025 financial guidance. All pro forma measures contained within this release exclude the impact of the Company's decision to discontinue its M6® product lines.

Highlights

Second quarter 2025 net sales of $203.1 million, including sales from M6® artificial cervical and lumbar discs, and pro forma net sales of $200.7 million, excluding sales from M6® discs, representing an increase of 2% on a reported basis and 4% on a pro forma constant currency basis compared to second quarter 2024
U.S. Spine Fixation1 net sales growth of 5% and procedure volume growth of 7% compared to second quarter 2024
Bone Growth Therapies ("BGT") net sales of $62.6 million, representing growth of 6%, with BGT Fracture net sales growth of 7% compared to second quarter 2024
Global Orthopedics net sales of $33.3 million, achieving constant currency growth of 5%, and U.S. Orthopedics net sales growth of 28% compared to second quarter 2024
Initiated global commercial launch of the TrueLok® Elevate Transverse Bone Transport ("TBT") System – the first FDA-cleared device for TBT to correct non-unions and bony or soft tissue deformities or defects
Announced U.S. commercial launch of the Reef® L Interbody System – completes Reef® interbody product family with a full-spectrum solution for lateral lumbar spinal fusion procedures
Second quarter 2025 net loss of $(14.1) million on a reported basis; Non-GAAP pro forma adjusted EBITDA of $20.6 million, with pro forma adjusted EBITDA margin expanding approximately 190 basis points compared to reported non-GAAP adjusted EBITDA for the second quarter 2024
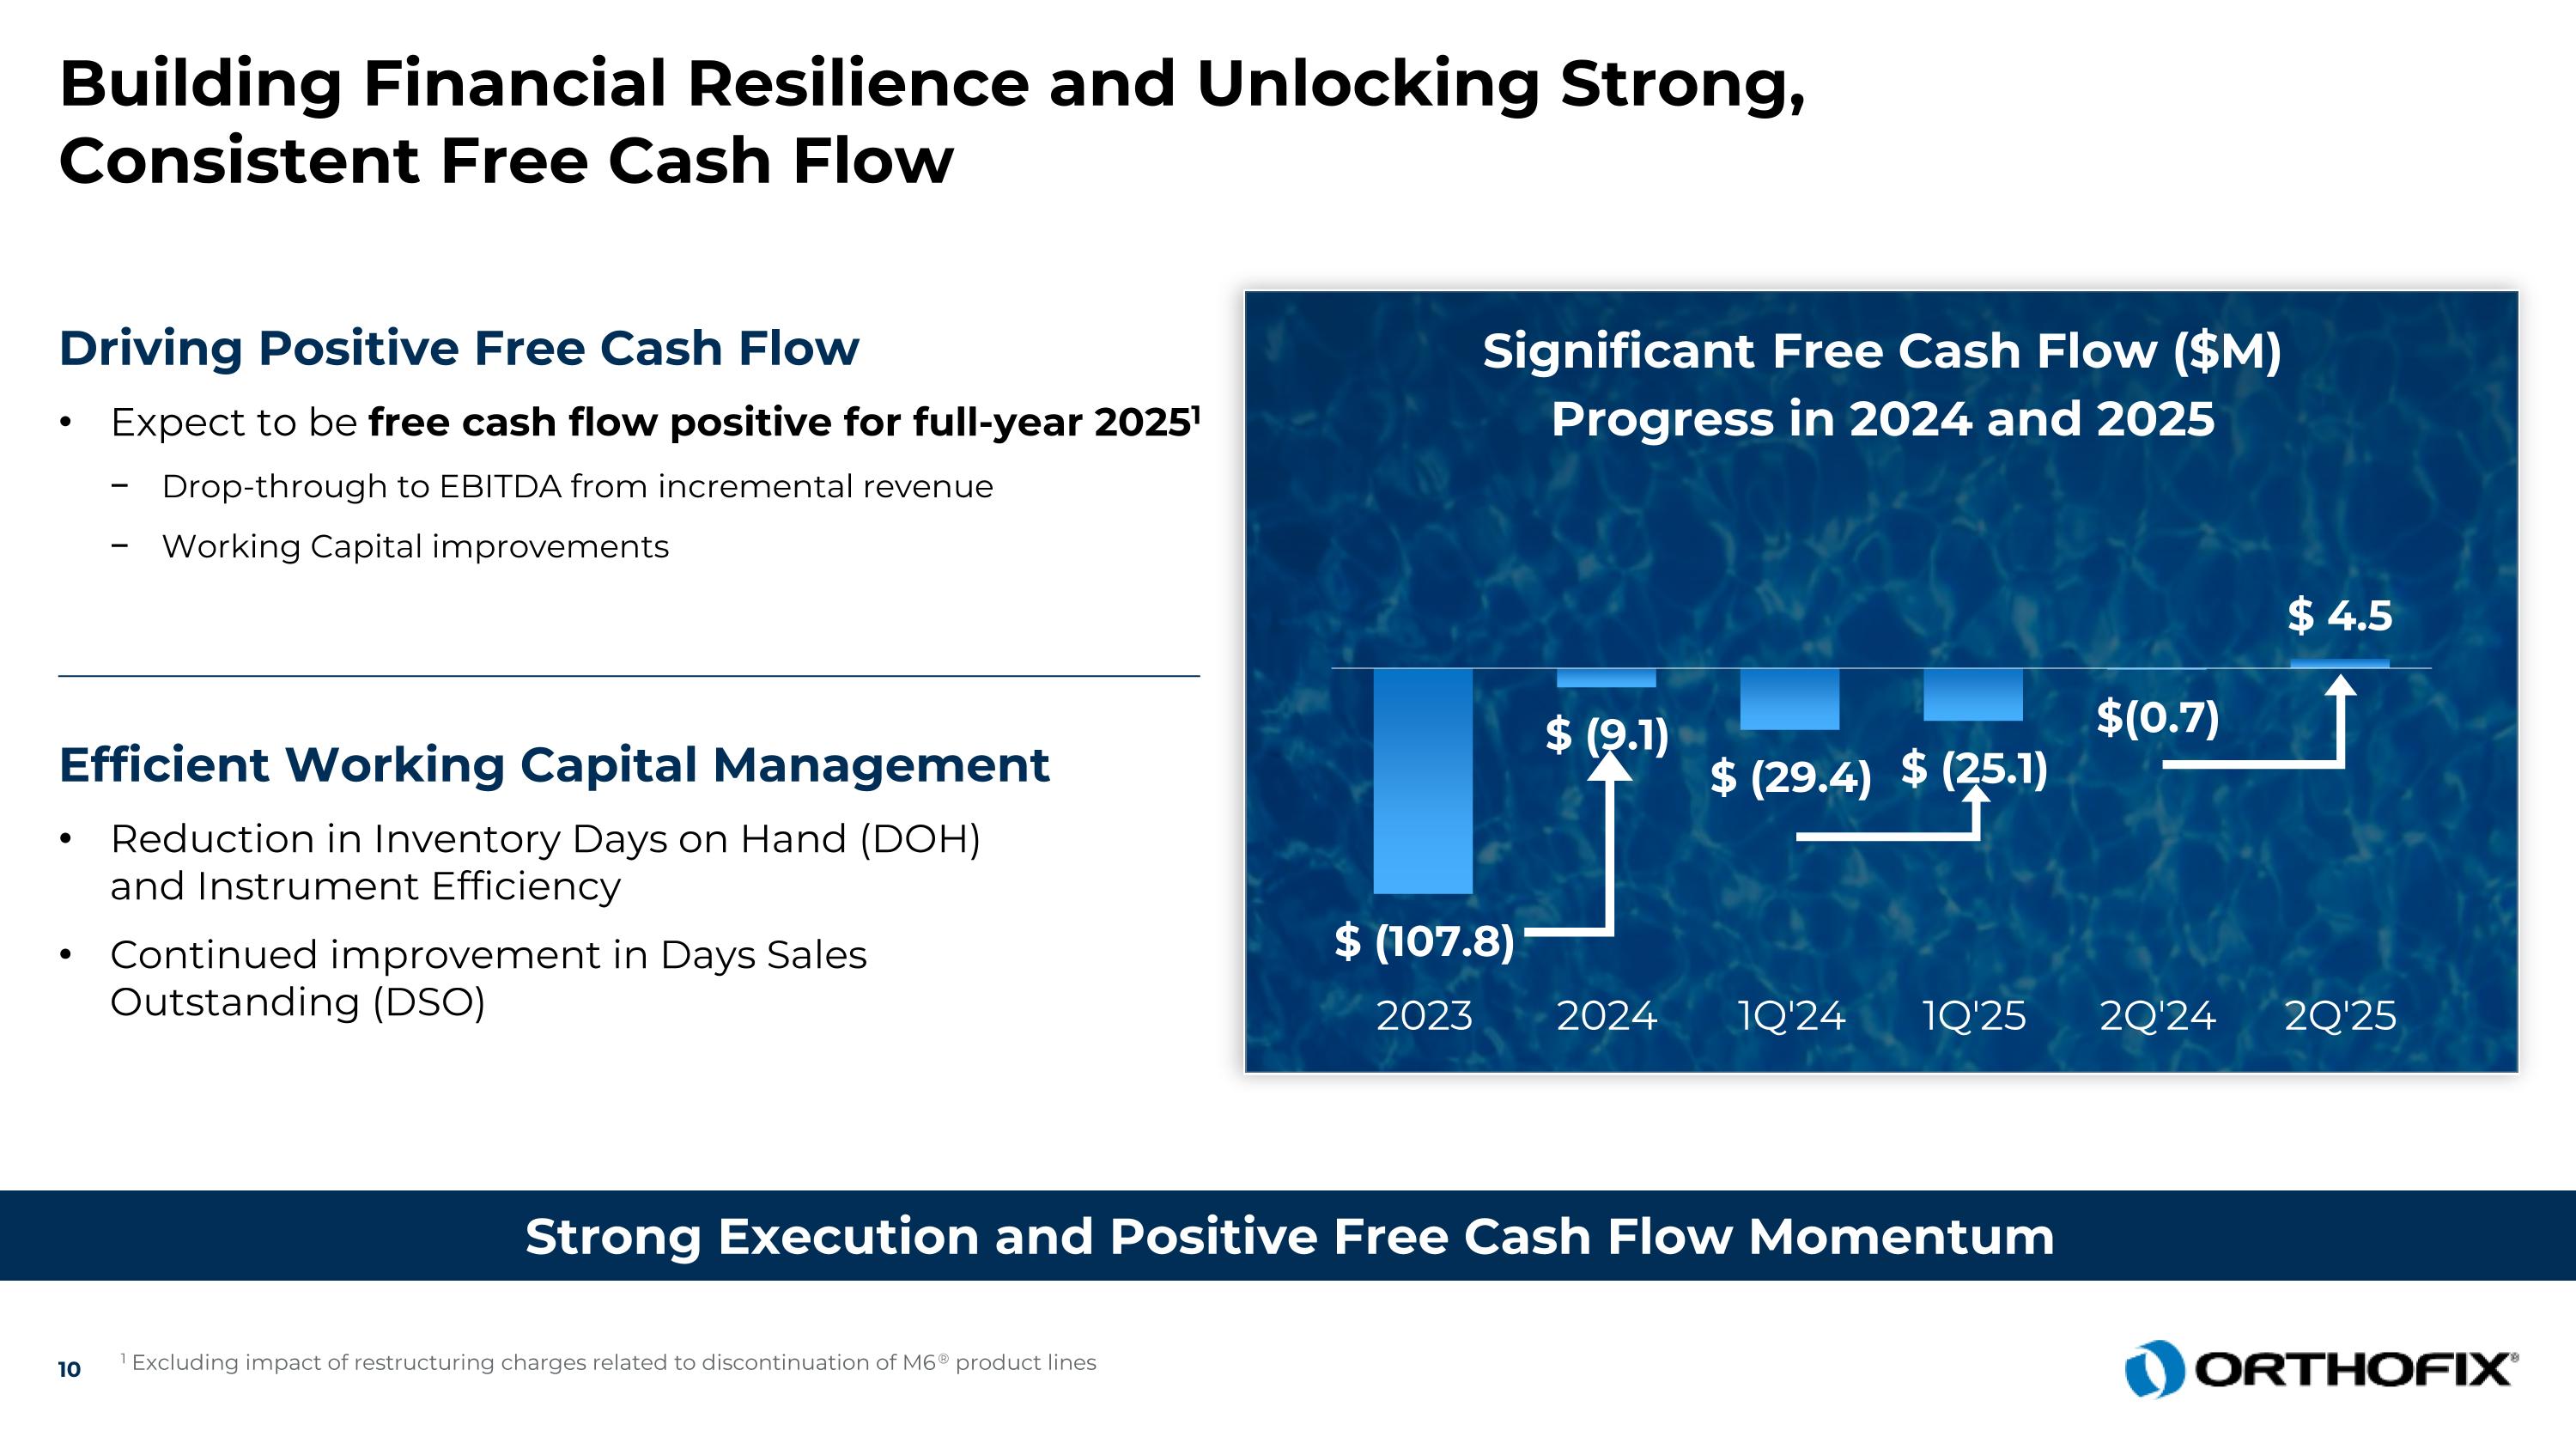
Six consecutive quarters of adjusted EBITDA margin expansion; Positive free cash flow of $4.5 million for second quarter 2025

Second quarter 2025 net sales were $203.1 million, including sales from M6® artificial cervical and lumbar discs, and pro forma net sales of $200.7 million, excluding sales from M6® discs, representing an increase of 2.3% on a reported basis and 3.5% on a pro forma constant currency basis compared to second quarter 2024. Net loss was $(14.1) million, or $(0.36) per share, on a reported basis. Non-GAAP pro forma adjusted EBITDA was $20.6 million for the second quarter of 2025, an increase of $4.0 million compared to reported non-GAAP adjusted EBITDA of $16.6 million for the second quarter of 2024, representing 24.1% growth over the prior year.

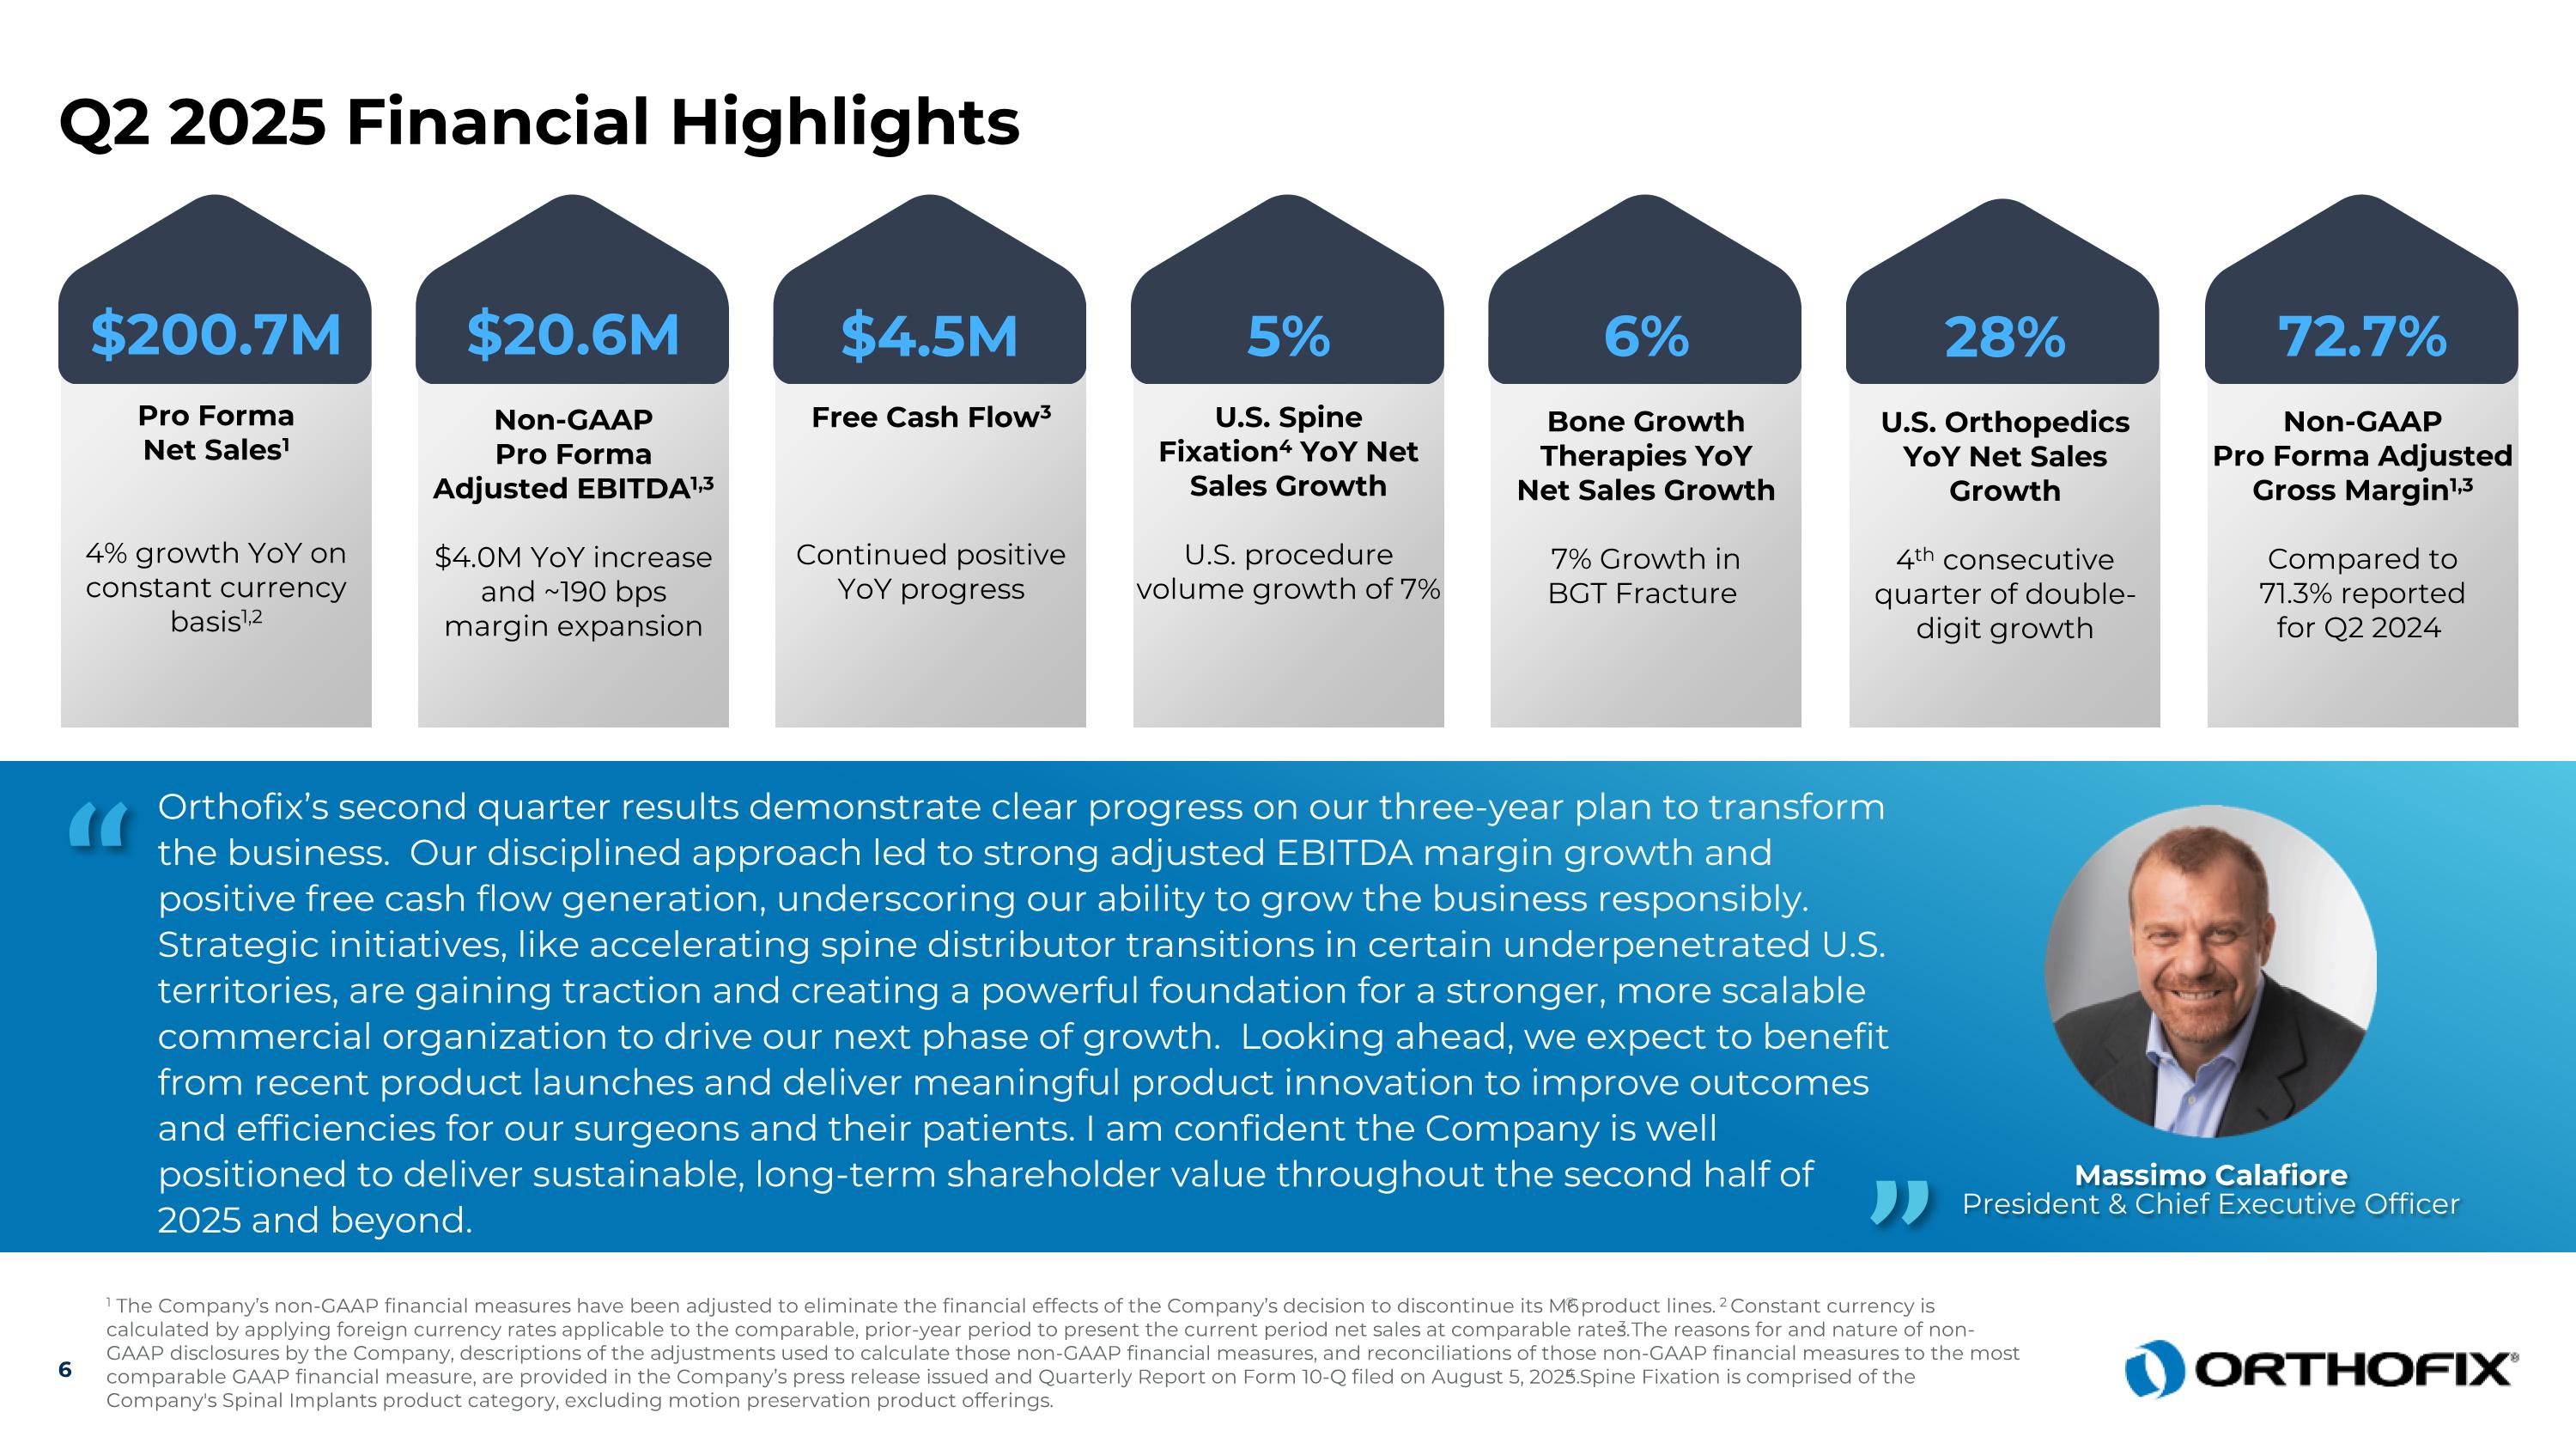
“Orthofix's second quarter results demonstrate clear progress on our three-year plan to transform the business,” said Massimo Calafiore, President and Chief Executive Officer. “Our disciplined approach led to strong adjusted EBITDA margin growth and positive free cash flow generation, underscoring our ability to grow the business responsibly. Strategic initiatives, like accelerating distributor transitions in certain underpenetrated U.S. territories, are gaining traction and creating a powerful foundation for a more scalable commercial organization to drive our next phase of growth. Looking ahead, we expect to benefit from our recent product launches and deliver meaningful product innovation to improve outcomes and efficiencies for our surgeons and their patients. I am confident the Company is well positioned to deliver sustainable, long-term shareholder value throughout the second half of 2025 and beyond.”

1 Spine Fixation is comprised of the Company’s Spinal Implants product category, excluding motion preservation product offerings.

1


Financial Results Overview

Second Quarter 2025 Net Sales and Financial Results

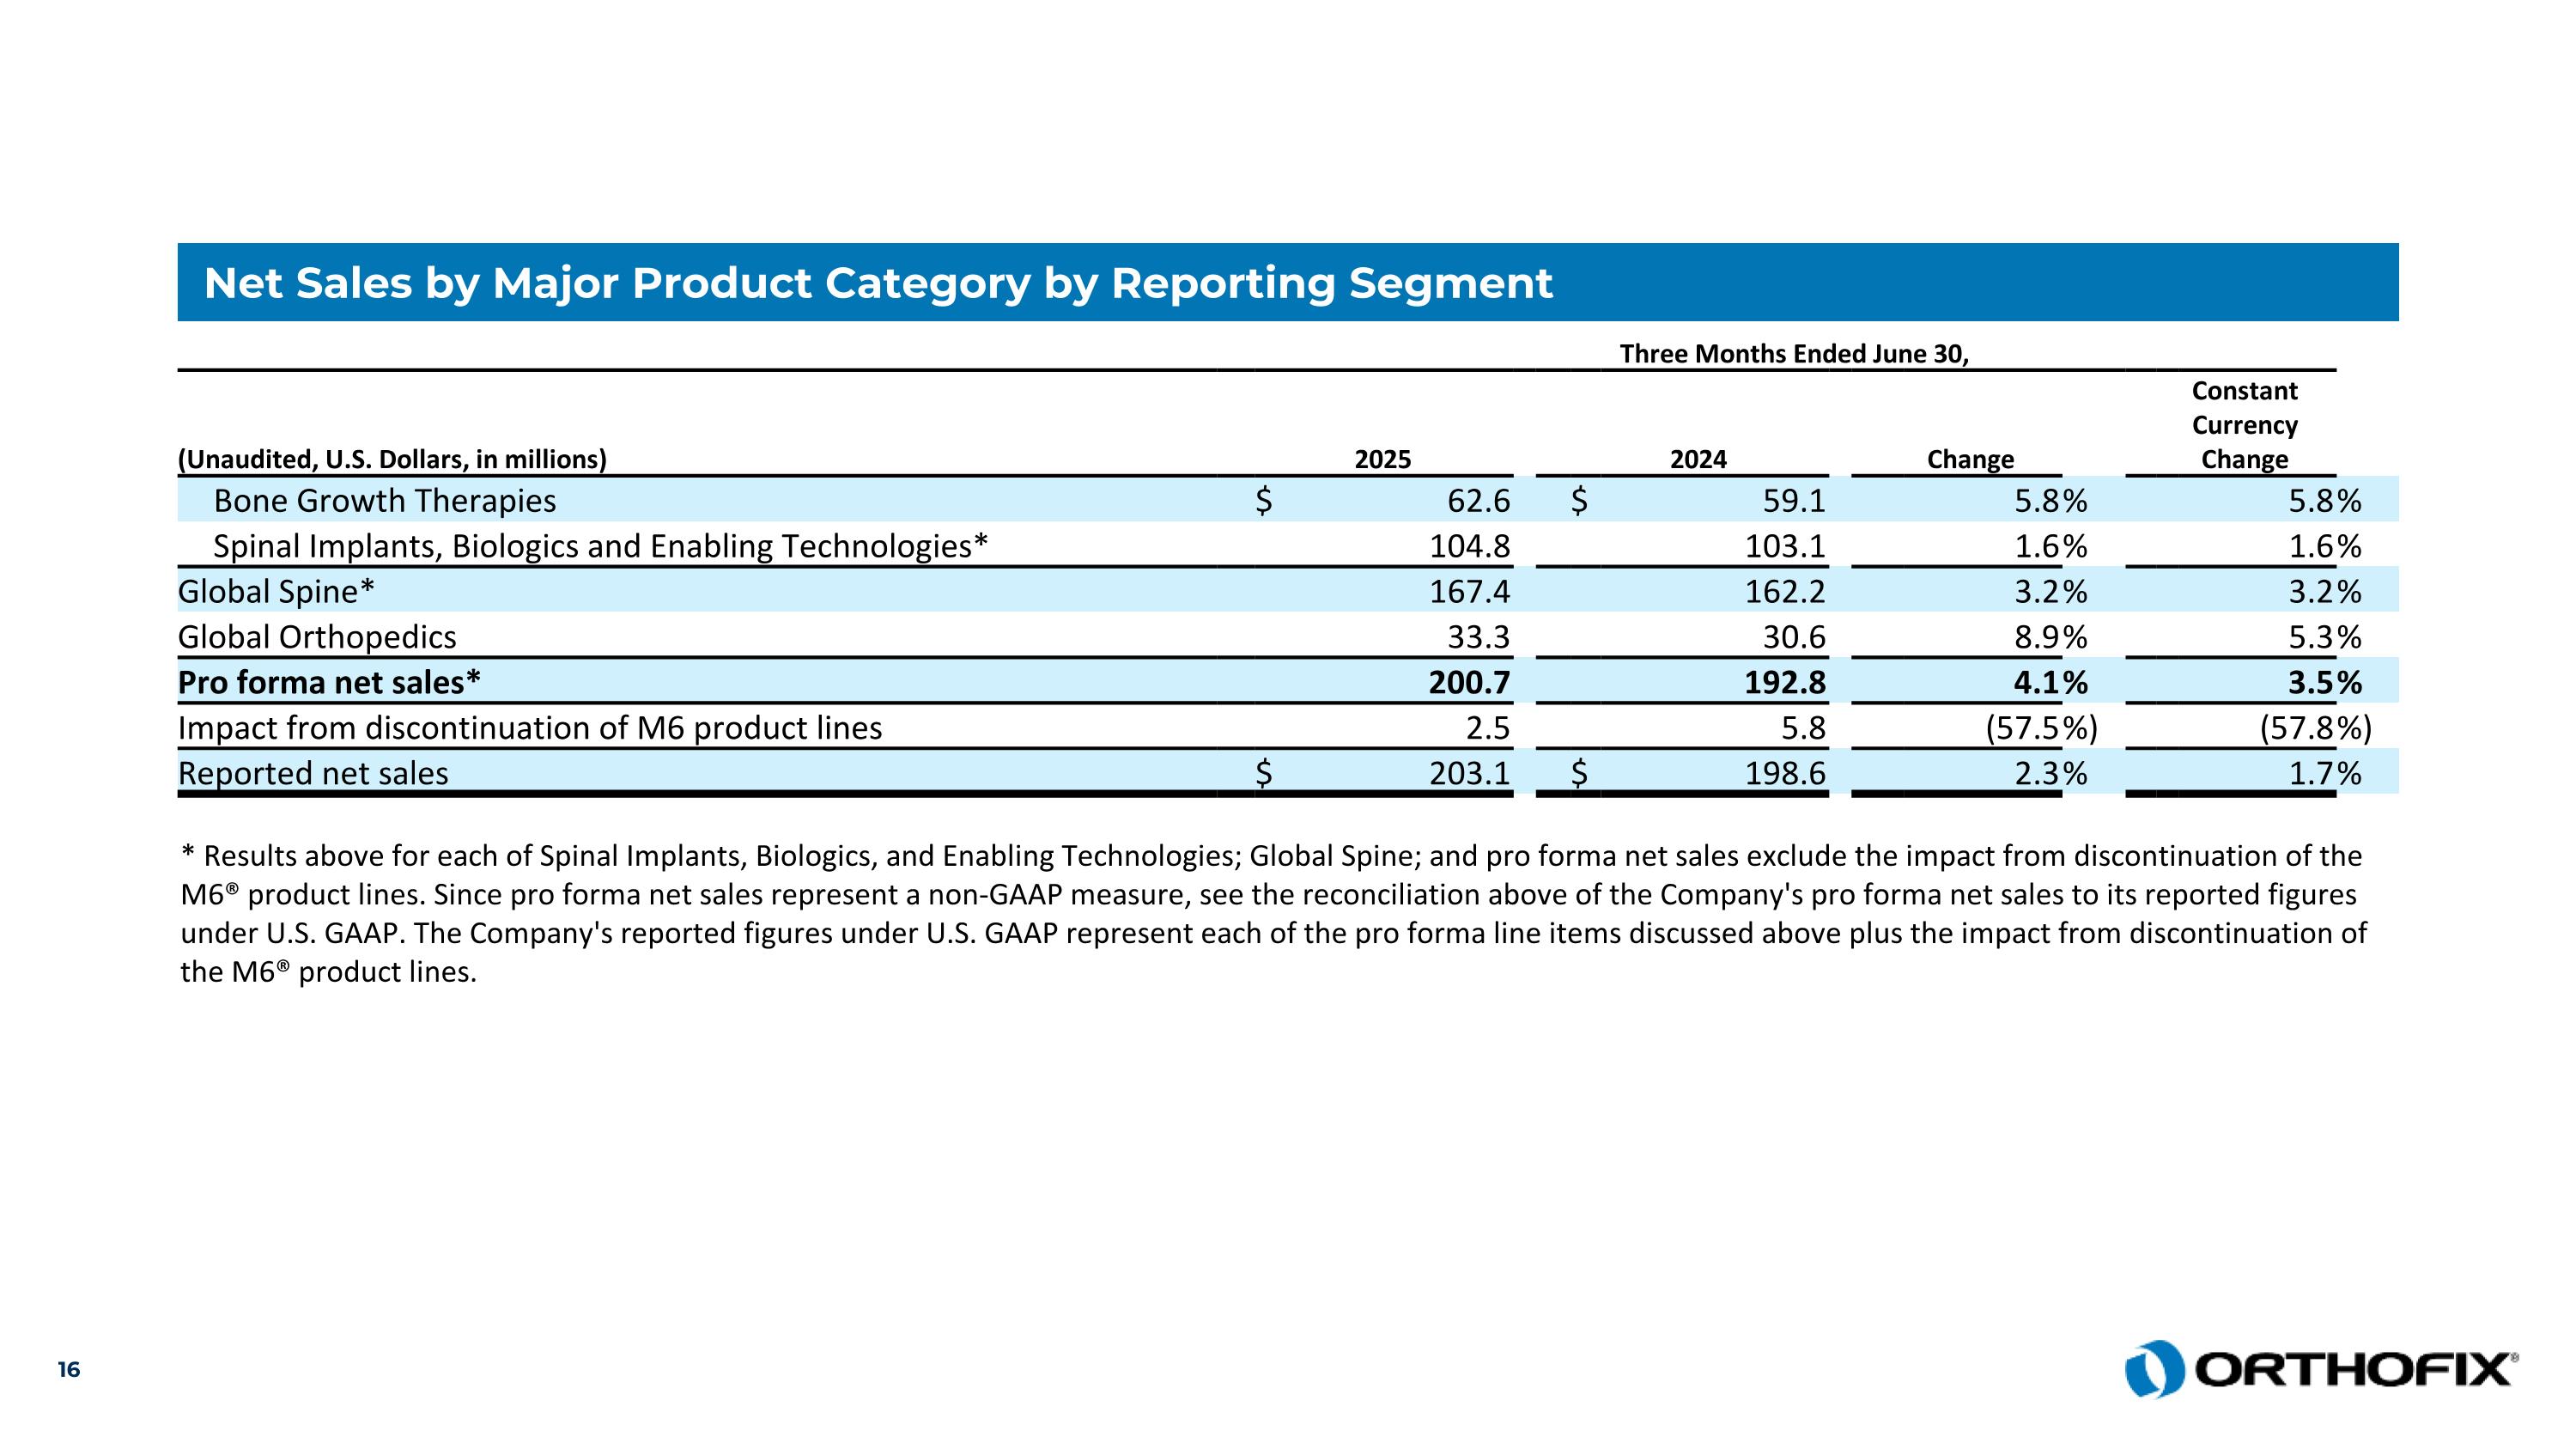
The following table provides net sales by major product category and by reporting segment on a pro forma basis, removing the effects of the Company's discontinued M6® product lines:


Three Months Ended June 30,


(Unaudited, U.S. Dollars, in millions)


2025


2024


Change


Constant
Currency
Change


Bone Growth Therapies


$

62.6


$

59.1


5.8

%


5.8

%

Spinal Implants, Biologics and Enabling Technologies*


104.8


103.1


1.6

%


1.6

%

Global Spine*


167.4


162.2


3.2

%


3.2

%

Global Orthopedics


33.3


30.6


8.9

%


5.3

%

Pro forma net sales*


200.7


192.8


4.1

%


3.5

%

Impact from discontinuation of M6 product lines


2.5


5.8


(57.5

%)


(57.8

%)

Reported net sales


$

203.1


$

198.6


2.3

%


1.7

%


* Results above for each of Spinal Implants, Biologics, and Enabling Technologies; Global Spine; and pro forma net sales exclude the impact from discontinuation of the M6® product lines. Since pro forma net sales represent a non-GAAP measure, see the reconciliation above of the Company's pro forma net sales to its reported figures under U.S. GAAP. The Company's reported figures under U.S. GAAP represent each of the pro forma line items discussed above plus the impact from discontinuation of the M6® product lines.

Gross margins were 68.7% for the quarter and were 72.7% on a non-GAAP pro forma adjusted basis.

Net loss was $(14.1) million, or $(0.36) per share, on a reported basis, compared to net loss of $(33.4) million, or $(0.88) per share in the prior year period. Non-GAAP pro forma adjusted EBITDA was $20.6 million, or 10.3% of pro forma net sales, compared to reported non-GAAP adjusted EBITDA of $16.6 million, or 8.4% of reported net sales, in the prior year period.

Liquidity

Cash, cash equivalents, and restricted cash on June 30, 2025 totaled $68.7 million compared to $60.5 million on March 31, 2025.

Business Outlook

The Company is reaffirming its full-year net sales guidance and its full-year 2025 adjusted EBITDA and free cash flow guidance as follows:

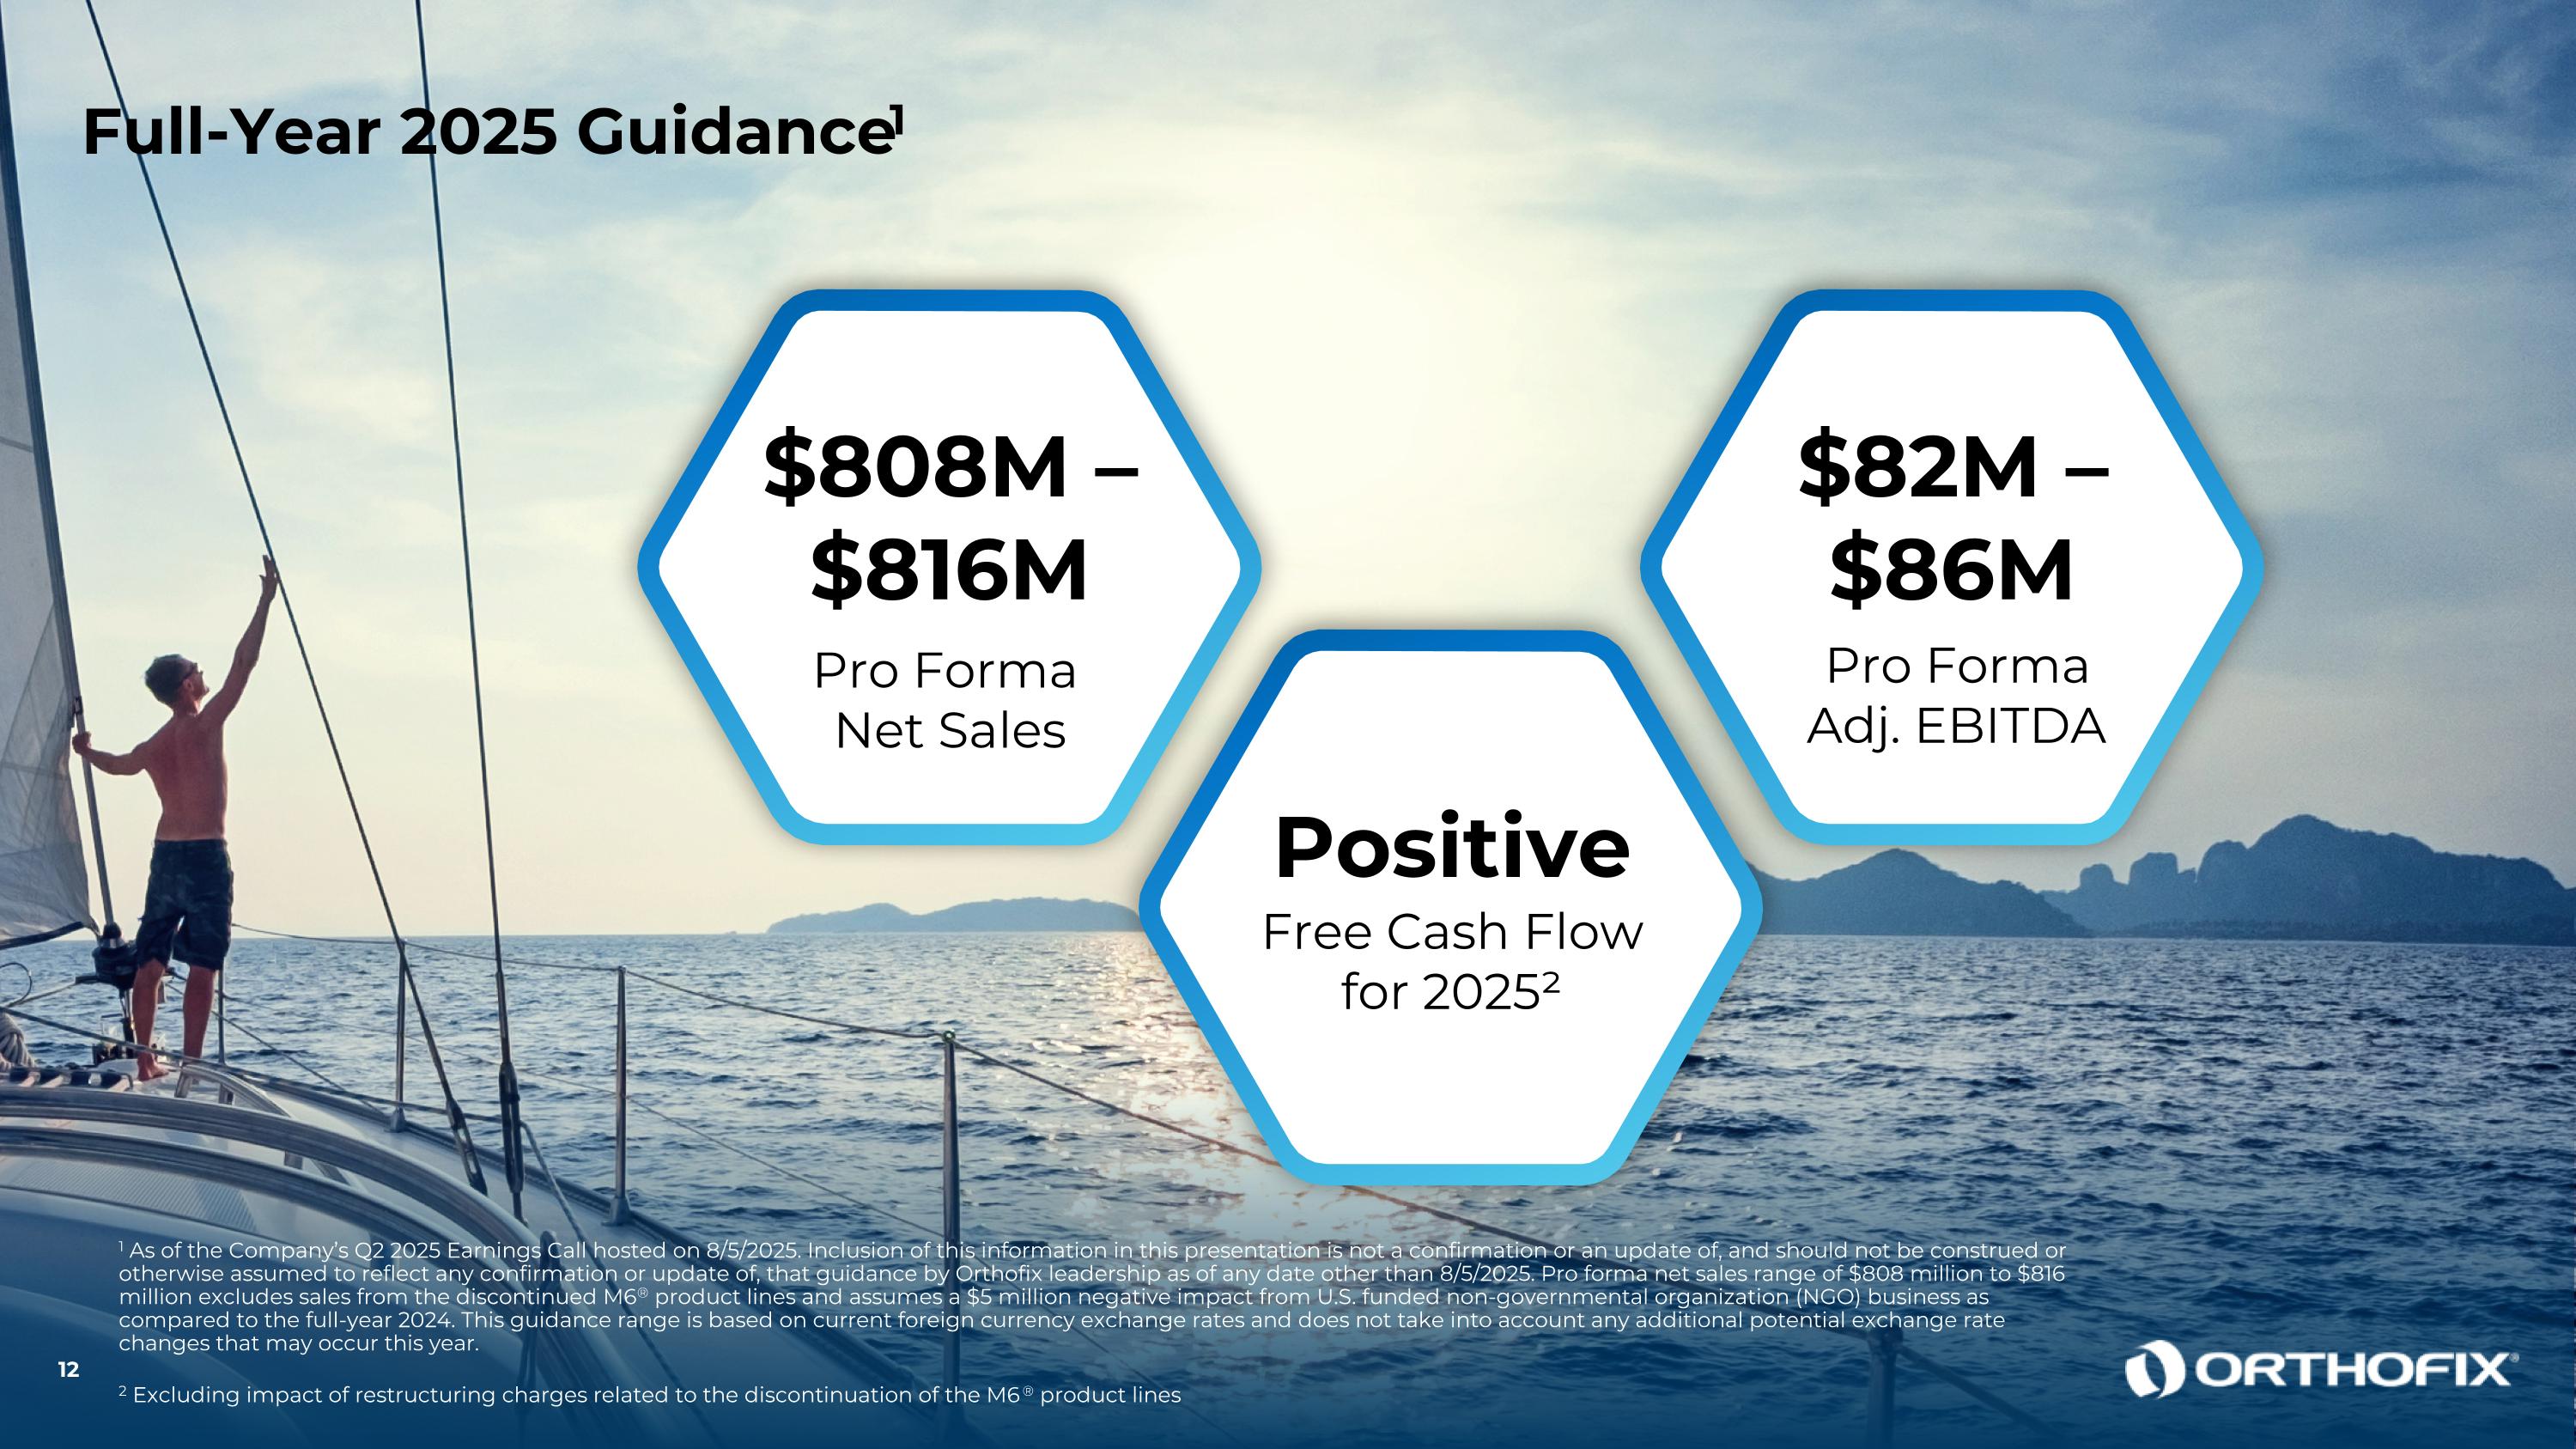
Pro forma net sales expected to range between $808 million to $816 million, excluding sales from the discontinued M6® product lines. This guidance range is based on current foreign currency exchange rates and does not take into account any additional potential exchange rate changes that may occur this year.
Pro forma non-GAAP adjusted EBITDA is expected to be $82 million to $86 million. This range includes the anticipated impact from the discontinuation of the M6® product lines that was previously announced in February 2025.
Free cash flow is expected to be positive for full-year 2025, excluding the impact of restructuring charges related to the discontinuation of the M6® product lines.

An investor presentation for the Company's second quarter 2025 financial results is available in the "Events & Presentations" section of the Orthofix Investor Relations Website at ir.orthofix.com.

Conference Call

Orthofix will host a conference call today at 8:30 AM Eastern time to discuss the Company's financial results for the quarter ended June 30, 2025. Interested parties may access the conference call by dialing (888) 596-4144 in the U.S., and (646) 968-2525 in all other locations, and referencing the conference ID 4830464. A webcast and replay of the conference call may be accessed in the "Events & Presentations" section of the Orthofix Investor Relations Website at ir.orthofix.com.

2


Internet Posting of Information

Orthofix regularly shares important updates in the “Investors” section of its website at www.orthofix.com. The Company encourages investors and potential investors to consult the Orthofix website regularly for important information about Orthofix.

About Orthofix

Orthofix is a global medical technology company headquartered in Lewisville, Texas. By providing medical technologies that heal musculoskeletal pathologies, Orthofix delivers exceptional experiences and life-changing solutions to patients around the world. Orthofix offers a comprehensive portfolio of spinal hardware, bone growth therapies, specialized orthopedic solutions, biologics and enabling technologies, including the 7D FLASH™ Navigation System. To learn more, visit Orthofix.com and follow on LinkedIn.

Forward-Looking Statements

This communication contains forward-looking statements within the meaning of Section 21E of the Securities Exchange Act of 1934, as amended, and Section 27A of the Securities Act of 1933, as amended, relating to our business and financial outlook, which are based on our current beliefs, assumptions, intentions, plans, expectations, estimates, forecasts and projections. In some cases, you can identify forward-looking statements by terminology such as “may,” “will,” “should,” “expects,” “plans,” “anticipates,” “believes,” “estimates,” “projects,” “intends,” “predicts,” “potential,” “positioned,” “deliver,” or “continue” or other comparable terminology. Forward-looking statements in this communication include the Company's expectations regarding net sales, adjusted EBITDA, and free cash flow for the year ended December 31, 2025. Forward-looking statements are not guarantees of our future performance, are based on our current expectations and assumptions regarding our business, the economy and other future conditions, and are subject to risks, uncertainties and changes in circumstances that are difficult to predict, including the risks described in Part I, Item 1A under the heading Risk Factors in our Annual Report on Form 10-K for the year ended December 31, 2024, and in Part II, Item 1A under the heading Risk Factors in our Quarterly Report on Form 10-Q for the quarter ended June 30, 2025. Factors that could cause future results to differ from those expressed by forward-looking statements include, but are not limited to, (i) our ability to maintain operations to support our customers and patients in the near-term and to capitalize on future growth opportunities, (ii) risks associated with acceptance of surgical products and procedures by surgeons and hospitals, (iii) development and acceptance of new products or product enhancements, (iv) clinical and statistical verification of the benefits achieved via the use of our products, (v) our ability to adequately manage inventory, (vi) our ability to successfully optimize our commercial channels, (vii) our success in defending legal proceedings brought against us, and (viii) the other risks and uncertainties more fully described in our periodic filings with the Securities and Exchange Commission (the “SEC”). As a result of these various risks, our actual outcomes and results may differ materially from those expressed in these forward-looking statements.

Further, any forward-looking statement speaks only as of the date hereof, unless it is specifically otherwise stated to be made as of a different date. The Company undertakes no obligation to update, and expressly disclaim any duty to update, its forward-looking statements, whether as a result of circumstances or events that arise after the date hereof, new information, or otherwise, except as required by law.

The Company is unable to provide expectations of GAAP net income (loss), the closest comparable GAAP measures to adjusted EBITDA (which is a non-GAAP measure), on a forward-looking basis because the Company is unable to predict, without unreasonable efforts, the ultimate outcome of matters (including acquisition-related expenses, accounting fair value adjustments, and other such items) that will determine the quantitative amount of the items excluded in calculating adjusted EBITDA, which items are further described in the reconciliation tables and related descriptions below. These items are uncertain, depend on various factors, and could be material to the Company's results computed in accordance with GAAP.

Company Contact


Investors and Media

Julie Dewey, IRC

Chief Investor Relations & Communications Officer

[email protected]

209.613.6945


3


ORTHOFIX MEDICAL INC.

Condensed Consolidated Statements of Operations


Three Months Ended


Six Months Ended


June 30,


June 30,


(Unaudited, U.S. Dollars, in thousands, except share and per share data)


2025


2024


2025


2024


Net sales


$

203,121


$

198,620


$

396,767


$

387,228


Cost of sales


63,588


63,871


135,615


125,237


Gross profit


139,533


134,749


261,152


261,991


Sales, general, and administrative


136,493


134,218


269,474


265,909


Research and development


15,934


18,049


35,700


37,541


Acquisition-related amortization, impairment, and remeasurement


3,109


7,388


20,854


12,784


Operating loss


(16,003

)


(24,906

)


(64,876

)


(54,243

)

Interest expense, net


(3,950

)


(4,943

)


(8,456

)


(9,501

)

Other income (expense), net


5,730


(2,510

)


6,976


(3,784

)

Loss before income taxes


(14,223

)


(32,359

)


(66,356

)


(67,528

)

Income tax benefit (expense)


142


(1,084

)


(819

)


(1,935

)

Net loss


$

(14,081

)


$

(33,443

)


$

(67,175

)


$

(69,463

)


Net loss per common share:


Basic


$

(0.36

)


$

(0.88

)


$

(1.71

)


$

(1.84

)

Diluted


(0.36

)


(0.88

)


(1.71

)


(1.84

)

Weighted average number of common shares (in millions):


Basic


39.5


38.0


39.3


37.8


Diluted


39.5


38.0


39.3


37.8


4


ORTHOFIX MEDICAL INC.

Condensed Consolidated Balance Sheets


(U.S. Dollars, in thousands, except par value data)


June 30,
2025


December 31,
2024


(Unaudited)


Assets


Current assets


Cash and cash equivalents


$

65,606


$

83,238


Restricted Cash


3,083


2,500


Accounts receivable, net of allowances of $8,909 and $7,418, respectively


129,556


134,713


Inventories


172,993


189,452


Prepaid expenses and other current assets


24,592


23,382


Total current assets


395,830


433,285


Property, plant, and equipment, net


129,200


139,804


Intangible assets, net


78,868


98,803


Goodwill


194,934


194,934


Other long-term assets


38,325


26,468


Total assets


$

837,157


$

893,294


Liabilities and shareholders’ equity


Current liabilities


Accounts payable


$

45,098


$

48,803


Current portion of finance lease liability


797


755


Other current liabilities


102,486


119,070


Total current liabilities


148,381


168,628


Long-term debt


157,047


157,015


Long-term portion of finance lease liability


17,448


17,835


Other long-term liabilities


55,934


46,692


Total liabilities


378,810


390,170


Contingencies


Shareholders’ equity


Common shares $0.10 par value; 100,000 shares authorized;
    39,483 and 38,486 issued and outstanding as of June 30,
    2025, and December 31, 2024, respectively


3,948


3,849


Additional paid-in capital


796,807


779,718


Accumulated deficit


(343,316

)


(276,141

)

Accumulated other comprehensive income (loss)


908


(4,302

)

Total shareholders’ equity


458,347


503,124


Total liabilities and shareholders’ equity


$

837,157


$

893,294


5


ORTHOFIX MEDICAL INC.
Non-GAAP Financial Measures

The following tables present reconciliations of various financial measures calculated in accordance with U.S. generally accepted accounting principles (“GAAP”), to various non-GAAP financial measures that exclude (or in the case of free cash flow, include) items specified in the tables. The GAAP measures shown in the tables below represent the most comparable GAAP measure to the applicable non-GAAP measure(s) shown in the table. For further information regarding the nature of these exclusions, why the Company believes that these non-GAAP financial measures provide useful information to investors, the specific manner in which management uses these measures, and some of the limitations associated with the use of these measures, please refer to the Company's Current Report on Form 8-K regarding this press release filed today with the SEC available on the SEC's website at www.sec.gov and on the “Investors” page of the Company's website at www.orthofix.com.

The Company's non-GAAP financial measures for the three and six months ended June 30, 2025, and 2024, have been adjusted to eliminate the financial effects of the Company's decision to discontinue its M6® product lines. Accordingly, previously reported figures for 2024 have been recast to reflect the financial impact of this decision.

Adjusted Gross Profit and Adjusted Gross Margin


Three Months Ended June 30,


Six Months Ended June 30,


(Unaudited, U.S. Dollars, in thousands)


2025


2024


2025


2024


Gross profit


$

139,533


$

134,749


$

261,152


$

261,991


Share-based compensation expense


467


497


929


1,034


SeaSpine merger-related costs


4,341


3,115


4,941


4,418


Restructuring costs and impairments related to M6 product lines


2,791


13,710


Strategic investments


43


64


56


129


Acquisition-related fair value adjustments


3,047


6,094


Amortization/depreciation of acquired long-lived assets


351


209


664


527


Adjusted gross profit


$

147,526


$

141,681


$

281,452


$

274,193


Adjusted gross margin as a percentage of reported net sales


72.6

%


71.3

%


70.9

%


70.8

%

Adjusted gross profit attributable to M6 product lines


(1,639

)


(2,943

)


(2,545

)


(5,838

)

Pro forma adjusted gross profit


$

145,887


$

138,738


$

278,907


$

268,355


Pro forma adjusted gross margin as a percentage of pro forma net sales


72.7

%


72.0

%


71.5

%


71.6

%


6


Adjusted EBITDA


Three Months Ended June 30,


Six Months Ended June 30,


(Unaudited, U.S. Dollars, in thousands)


2025


2024


2025


2024


Net loss


$

(14,081

)


$

(33,443

)


$

(67,175

)


$

(69,463

)

Income tax (benefit) expense


(141

)


1,084


819


1,936


Interest expense, net


3,950


4,943


8,456


9,501


Depreciation and amortization


16,871


14,032


51,302


28,894


Share-based compensation expense


7,824


9,959


14,293


18,759


Foreign exchange impact


(2,751

)


851


(3,795

)


2,439


SeaSpine merger-related costs


4,886


5,913


6,017


10,376


Restructuring costs and impairments related to M6 product lines


3,651


13,531


Strategic investments


353


319


3,867


431


Acquisition-related fair value adjustments


(763

)


6,117


(1,373

)


10,334


Interest and (gain) loss on investments


(31

)


1,806


(31

)


1,553


Litigation and investigation costs


4,029


(277

)


7,071


1,983


Succession charges


5,346


7,556


Employee retention credit


(2,854

)


(2,854

)


Adjusted EBITDA


$

20,943


$

16,650


$

30,128


$

24,299


Adjusted EBITDA as a percentage of reported net sales


10.3

%


8.4

%


7.6

%


6.3

%

Operating (income) losses attributable to M6 product lines


(297

)


1,794


1,949


3,648


Pro forma adjusted EBITDA


$

20,646


$

18,444


$

32,077


$

27,947


Adjusted EBITDA as a percentage of pro forma net sales


10.3

%


9.6

%


8.2

%


7.5

%

Adjusted Net Income (Loss)


Three Months Ended June 30,


Six Months Ended June 30,


(Unaudited, U.S. Dollars, in thousands)


2025


2024


2025


2024


Net loss


$

(14,081

)


$

(33,443

)


$

(67,175

)


$

(69,463

)

Share-based compensation expense


7,824


9,959


14,293


18,759


Foreign exchange impact


(2,751

)


851


(3,795

)


2,439


SeaSpine merger-related costs


7,786


5,968


9,260


10,815


Restructuring costs and impairments related to M6 product lines


4,257


34,461


Strategic investments


364


349


3,907


497


Acquisition-related fair value adjustments


(761

)


6,117


(1,371

)


10,334


Amortization/depreciation of acquired long-lived assets


4,221


4,648


8,853


9,440


Litigation and investigation costs


4,029


(277

)


7,071


1,983


Succession charges


5,346


7,556


Interest and (gain) loss on investments


(31

)


1,786


(31

)


1,504


Employee retention credit


(3,616

)


(3,616

)


Long-term income tax rate adjustment


(2,130

)


415


70


3,112


Adjusted net income (loss)


$

5,111


$

1,719


$

1,927


$

(3,024

)

Operating (income) losses attributable to M6 product lines


(766

)


2,245


1,922


4,645


Long-term income tax rate adjustment for M6 product lines


215


(629

)


(538

)


(1,301

)

Pro forma adjusted net income


$

4,560


$

3,335


$

3,311


$

320


7


Cash Flow and Free Cash Flow


Six Months Ended June 30,


(Unaudited, U.S. Dollars, in thousands)


2025


2024


Net cash used in operating activities


$

(6,752

)


$

(9,611

)

Net cash used in investing activities


(13,833

)


(20,583

)

Net cash provided by financing activities


1,989


21,678


Effect of exchange rate changes on cash


1,547


(375

)

Net change in cash and cash equivalents


$

(17,049

)


$

(8,891

)


Six Months Ended June 30,


(Unaudited, U.S. Dollars, in thousands)


2025


2024


Net cash used in operating activities


$

(6,752

)


$

(9,611

)

Capital expenditures


(13,845

)


(20,533

)

Free cash flow


$

(20,597

)


$

(30,144

)

Reconciliation of Non-GAAP Financial Measures to Reported Operating Expenses


Three Months Ended June 30,


Six Months Ended June 30,


(Unaudited, U.S. Dollars, in thousands)


2025


2024


2025


2024


Sales, general, and administrative


$

136,493


$

134,218


$

269,474


$

265,909


Reconciling items impacting sales, general, and administrative:


SeaSpine merger-related costs


(3,384

)


(2,784

)


(4,142

)


(6,134

)

Restructuring costs and impairments related to M6 product lines


(1,393

)


(4,729

)


Strategic investments


(194

)


(30

)


(1,741

)


(111

)

Amortization/depreciation of acquired long-lived assets


(121

)


(60

)


(369

)

Litigation and investigation costs


(3,579

)


277


(6,621

)


(1,983

)

Succession charges


(5,346

)


(7,556

)

Sales, general, and administrative expense, as adjusted


$

127,943


$

126,214


$

252,181


$

249,756


As a percentage of reported net sales


63.0

%


63.5

%


63.6

%


64.5

%

Sales, general, and administrative expense attributable to M6 product lines


(243

)


(3,144

)


(2,631

)


(7,299

)

Pro forma sales, general, and administrative expense, as adjusted


$

127,700


$

123,070


$

249,550


$

242,457


As a percentage of pro forma net sales


63.6

%


63.8

%


64.0

%


64.7

%


Three Months Ended June 30,


Six Months Ended June 30,


(Unaudited, U.S. Dollars, in thousands)


2025


2024


2025


2024


Research and development expense, as reported


$

15,934


$

18,049


$

35,700


$

37,541


Reconciling items impacting research and development:


SeaSpine merger-related costs


(62

)


(84

)


(178

)


(318

)

Restructuring costs and impairments related to M6 product lines


(77

)


(1,929

)


Strategic investments


(127

)


(255

)


(2,110

)


(258

)

Litigation and investigation costs


(450

)


(450

)


Research and development expense, as adjusted


$

15,218


$

17,710


$

31,033


$

36,965


As a percentage of reported net sales


7.5

%


8.9

%


7.8

%


9.5

%

Research and development expense attributable to M6 product lines


(602

)


(2,440

)


(1,794

)


(4,676

)

Pro forma research and development expense, as adjusted


$

14,616


$

15,270


$

29,239


$

32,289


As a percentage of pro forma net sales


7.3

%


7.9

%


7.5

%


8.6

%


8


Reconciliations of Non-GAAP Financial Measures to Reported Non-Operating (Income) Expense


Three Months Ended June 30,


Six Months Ended June 30,


(Unaudited, U.S. Dollars, in thousands)


2025


2024


2025


2024


Non-operating (income) expense


$

(1,780

)


$

7,453


$

1,480


$

13,285


Reconciling items impacting non-operating expense:


Restructuring costs and impairments related to M6 product lines


3


3


Foreign exchange impact


2,751


(851

)


3,795


(2,439

)

Interest and gain (loss) on investments


31


(1,786

)


31


(1,503

)

Employee retention credit


3,617


3,617


Non-operating expense, as adjusted


$

4,622


$

4,816


$

8,926


$

9,343


As a percentage of reported net sales


2.3

%


2.4

%


2.2

%


2.4

%

Losses attributable to M6 product lines


(26

)


(18

)


(41

)


(65

)

Pro forma non-operating expense, as adjusted


$

4,596


$

4,798


$

8,885


$

9,278


As a percentage of pro forma net sales


2.3

%


2.5

%


2.3

%


2.5

%


Source

Orthofix Medical Inc.


###

9


Slide 1

Clear Course for Profitable Growth 2Q 2025 Earnings Call August 5, 2025

Slide 2

Forward-Looking Statements This presentation contains forward-looking statements within the meaning of Section 21E of the Securities Exchange Act of 1934, as amended, and Section 27A of the Securities Act of 1933, as amended, relating to our business and financial outlook, which are based on our current beliefs, assumptions, intentions, plans, expectations, estimates, forecasts and projections. In some cases, you can identify forward-looking statements by terminology such as “may,” “will,” “should,” “expects,” “plans,” “anticipates,” “believes,” “estimates,” “projects,” “intends,” “predicts,” “potential,” “positioned,” “deliver,” or “continue” or other comparable terminology. Forward-looking statements in this presentation include the Company's expectations regarding net sales, adjusted EBITDA, and free cash flow for the year ended December 31, 2025. Forward-looking statements are not guarantees of our future performance, are based on our current expectations and assumptions regarding our business, the economy and other future conditions, and are subject to risks, uncertainties and changes in circumstances that are difficult to predict, including the risks described in Part I, Item 1A under the heading Risk Factors in our Annual Report on Form 10-K for the year ended December 31, 2024, and in Part II, Item 1A under the heading Risk Factors in our Quarterly Report on Form 10-Q for the quarter ended June 30, 2025. Factors that could cause future results to differ from those expressed by forward-looking statements include, but are not limited to, (i) our ability to maintain operations to support our customers and patients in the near-term and to capitalize on future growth opportunities, (ii) risks associated with acceptance of surgical products and procedures by surgeons and hospitals, (iii) development and acceptance of new products or product enhancements, (iv) clinical and statistical verification of the benefits achieved via the use of our products, (v) our ability to adequately manage inventory, (vi) our ability to successfully optimize our commercial channels, (vii) our success in defending legal proceedings brought against us, and (viii) the other risks and uncertainties more fully described in our periodic filings with the Securities and Exchange Commission (the “SEC”). As a result of these various risks, our actual outcomes and results may differ materially from those expressed in these forward-looking statements. Further, any forward-looking statement speaks only as of the date hereof, unless it is specifically otherwise stated to be made as of a different date. The Company undertakes no obligation to update, and expressly disclaim any duty to update, its forward-looking statements, whether as a result of circumstances or events that arise after the date hereof, new information, or otherwise, except as required by law. The Company is unable to provide expectations of GAAP net income (loss), the closest comparable GAAP measures to adjusted EBITDA (which is a non-GAAP measure), on a forward-looking basis because the Company is unable to predict, without unreasonable efforts, the ultimate outcome of matters (including acquisition-related expenses, accounting fair value adjustments, and other such items) that will determine the quantitative amount of the items excluded in calculating adjusted EBITDA, which items are further described in the reconciliation tables and related descriptions below. These items are uncertain, depend on various factors, and could be material to the Company’s results computed in accordance with GAAP.

Slide 3

Non-GAAP Financial Measures Management uses certain non-GAAP financial measures in this presentation, most specifically Adjusted EBITDA, Adjusted Gross Margin, Adjusted Net Income and Free Cash Flow, as a supplement to GAAP financial measures to further evaluate the Company’s operating performance period over period, analyze the underlying business trends, assess performance relative to competitors and establish operational objectives. ​ Management believes it is important to provide investors with the same non-GAAP metrics it uses to evaluate the performance and underlying trends of the Company’s business operations to facilitate comparisons to its historical operating results and evaluate the effectiveness of its operating strategies. Disclosure of these non-GAAP financial measures also facilitates comparisons of the Company’s underlying operating performance with other companies in the industry that also supplement their GAAP results with non-GAAP financial measures.​ Unless noted otherwise, full-year guidance is based on the current foreign currency exchange rates and does not take into account any additional potential exchange rate changes that may occur this year. These non-GAAP financial measures should not be considered in isolation from, or as replacements for, the most directly comparable GAAP financial measures, as these measures are not prepared in accordance with U.S. GAAP.​ Reconciliations between GAAP and non‐GAAP results are included at the end of this presentation and represent the most comparable GAAP measure(s) to the applicable non-GAAP measure(s) shown in the table. For further information regarding the nature of these exclusions, why the Company believes that these non-GAAP financial measures provide useful information to investors, the specific manner in which management uses these measures, and some of the limitations associated with the use of these measures, please refer to the Company's Current Report on Form 8-K regarding its second quarter 2025 press release filed on August 5, 2025 with the SEC and available on the SEC's website at www.sec.gov and on the “Investors” page of the Company’s website at www.orthofix.com. The Company’s non-GAAP financial measures for the three and six months ended June 30, 2025, and 2024, have been adjusted to eliminate the financial effects of the Company’s decision to discontinue its M6® product lines. Accordingly, previously reported figures for 2024 have been recast to reflect the financial impact of this decision. Amounts may not add due to rounding.​


Slide 4

TAKE OWNERSHIP INNOVATE BOLDLY WIN TOGETHER The unrivaled partner in Med Tech, delivering ​exceptional experiences and life-changing solutions. 4

Slide 5

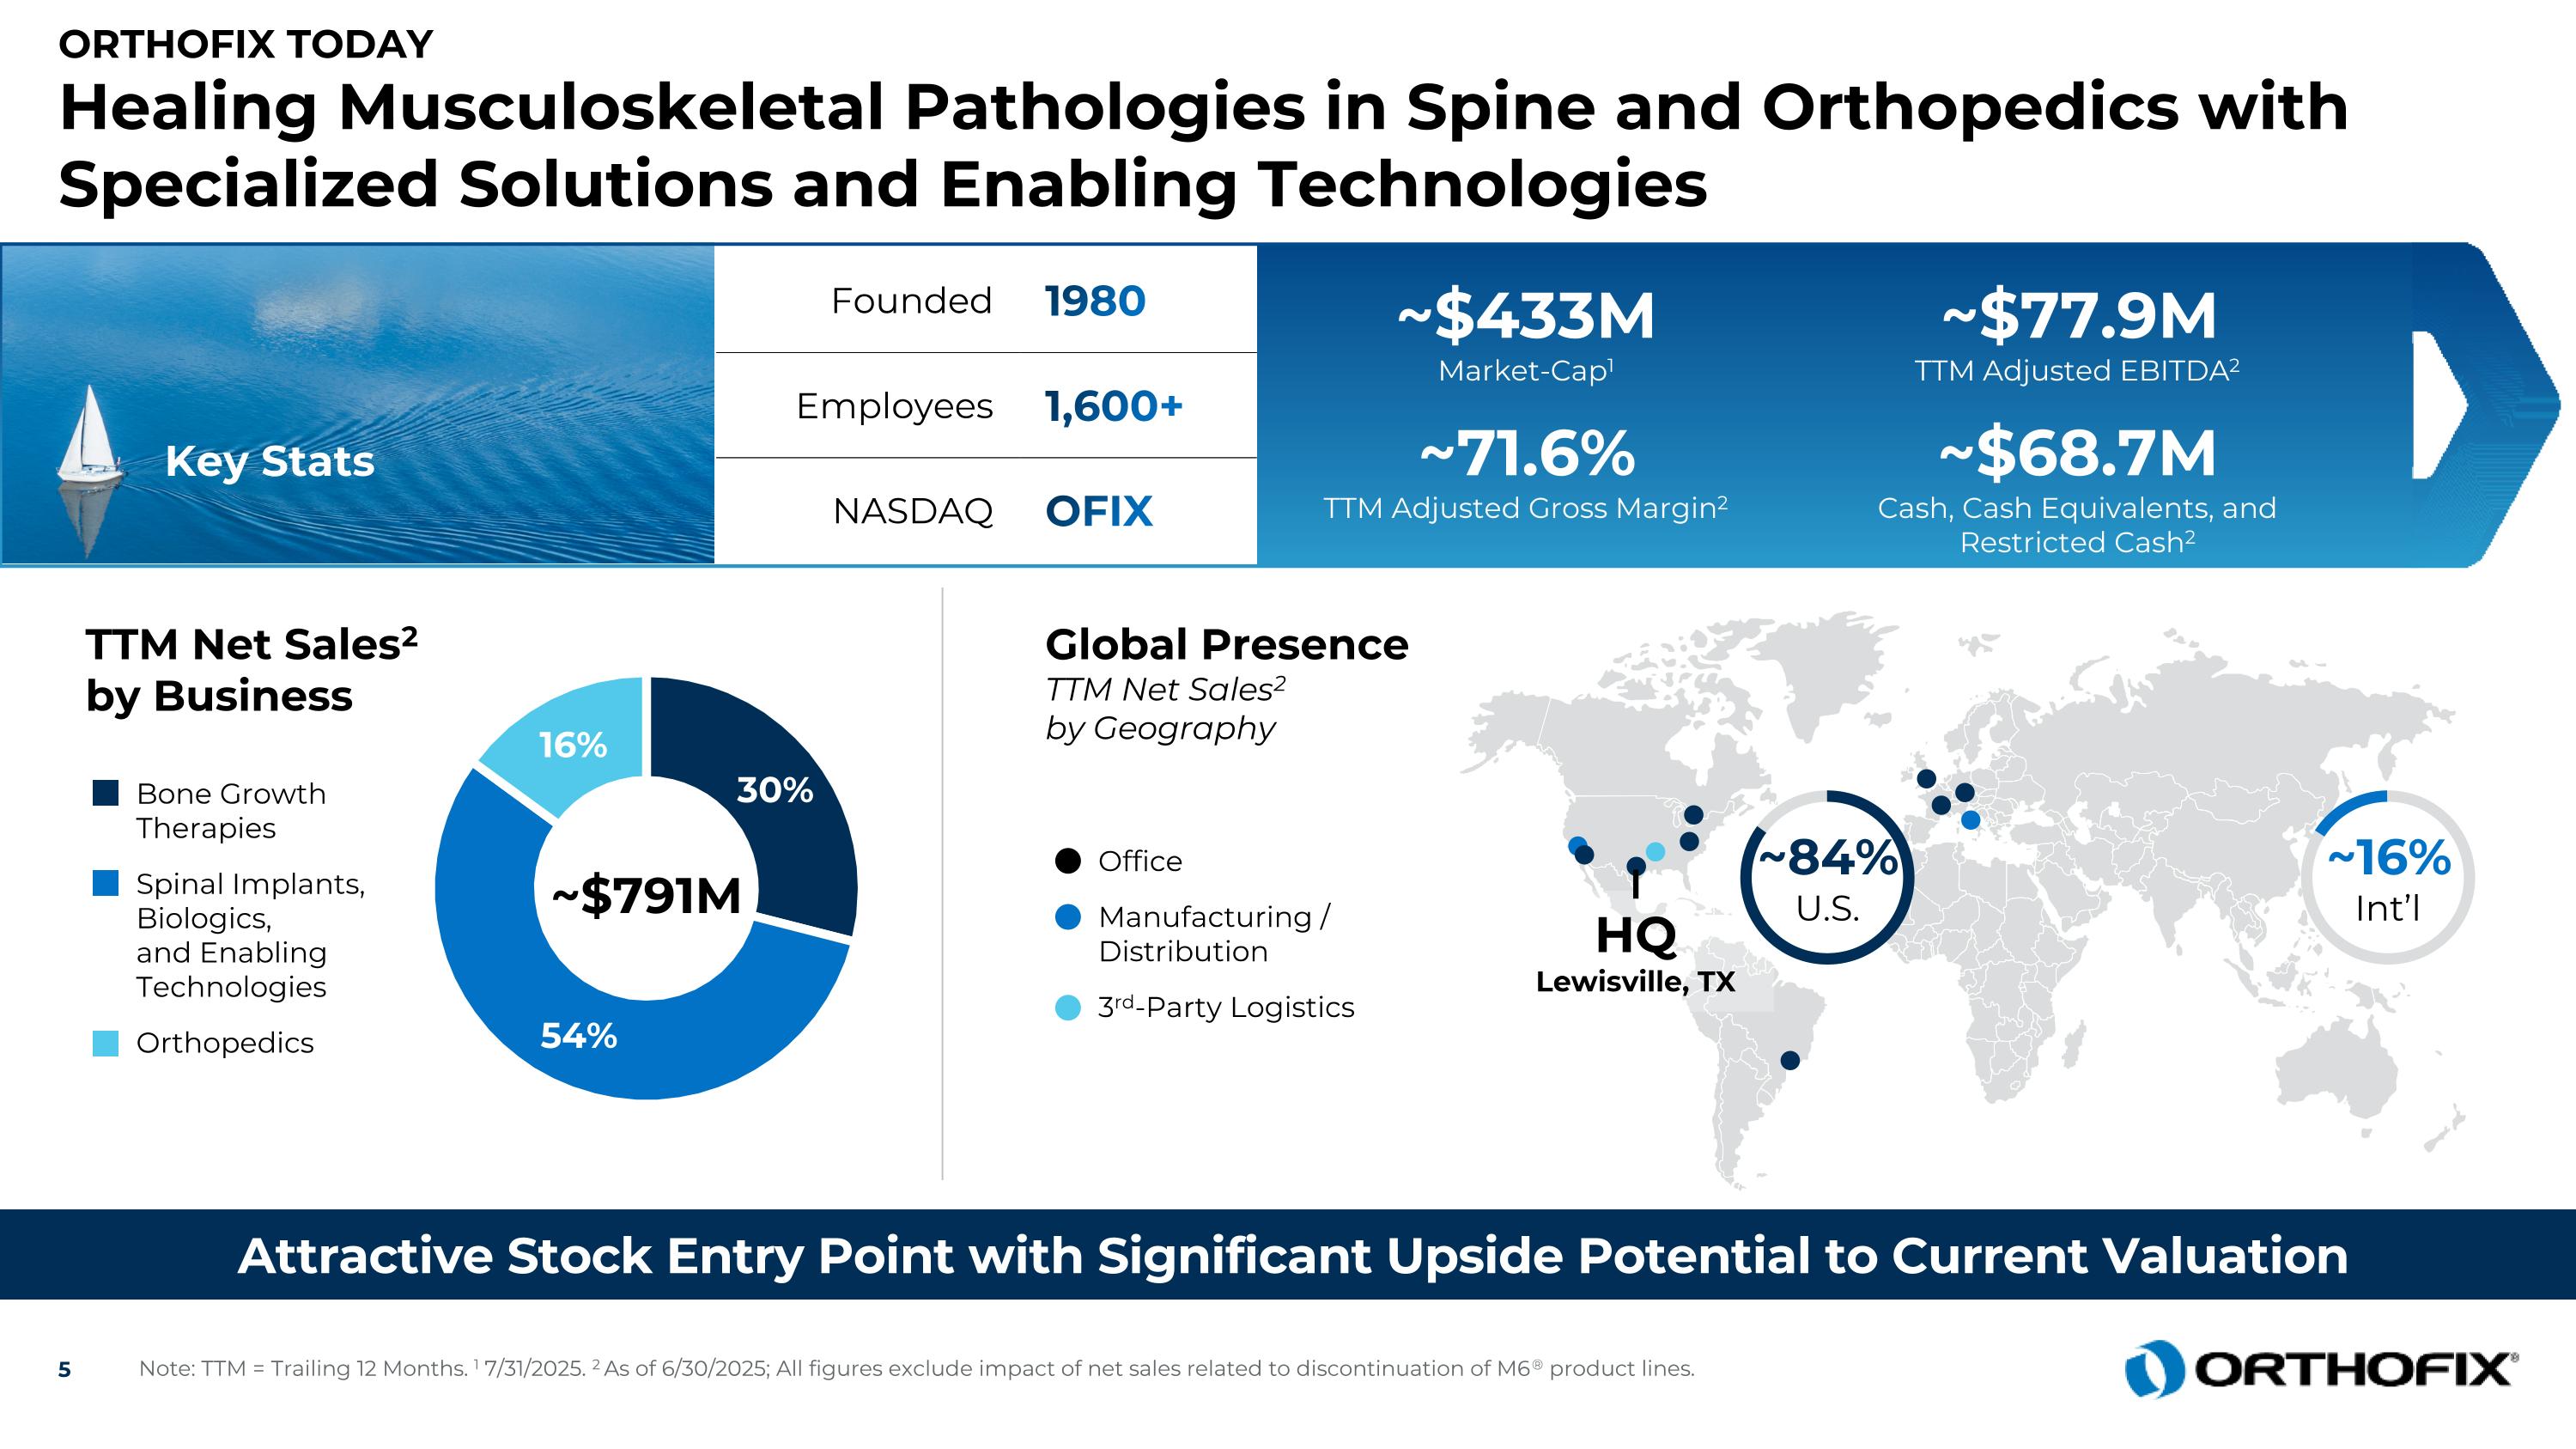
Orthofix Today Healing Musculoskeletal Pathologies in Spine and Orthopedics with Specialized Solutions and Enabling Technologies Attractive Stock Entry Point with Significant Upside Potential to Current Valuation Key Stats TTM Net Sales2 by Business ~$791M Bone Growth Therapies Spinal Implants, Biologics, and Enabling Technologies Orthopedics ~16% Int’l HQ Lewisville, TX ~84% U.S. Founded 1980 Employees 1,600+ NASDAQ OFIX Office Manufacturing / Distribution 3rd-Party Logistics Global Presence TTM Net Sales2 by Geography ~$433M Market-Cap1 ~$77.9M TTM Adjusted EBITDA2 ~71.6% TTM Adjusted Gross Margin2 ~$68.7M Cash, Cash Equivalents, and Restricted Cash2 Note: TTM = Trailing 12 Months. 1 7/31/2025. 2 As of 6/30/2025; All figures exclude impact of net sales related to discontinuation of M6® product lines.

Slide 6

Orthofix’s second quarter results demonstrate clear progress on our three-year plan to transform the business. Our disciplined approach led to strong adjusted EBITDA margin growth and positive free cash flow generation, underscoring our ability to grow the business responsibly. Strategic initiatives, like accelerating spine distributor transitions in certain underpenetrated U.S. territories, are gaining traction and creating a powerful foundation for a stronger, more scalable commercial organization to drive our next phase of growth. Looking ahead, we expect to benefit from recent product launches and deliver meaningful product innovation to improve outcomes and efficiencies for our surgeons and their patients. I am confident the Company is well positioned to deliver sustainable, long-term shareholder value throughout the second half of 2025 and beyond. “ Massimo Calafiore President & Chief Executive Officer ” 6 1 The Company’s non-GAAP financial measures have been adjusted to eliminate the financial effects of the Company’s decision to discontinue its M6® product lines. 2 Constant currency is calculated by applying foreign currency rates applicable to the comparable, prior-year period to present the current period net sales at comparable rates. 3 The reasons for and nature of non-GAAP disclosures by the Company, descriptions of the adjustments used to calculate those non-GAAP financial measures, and reconciliations of those non-GAAP financial measures to the most comparable GAAP financial measure, are provided in the Company’s press release issued and Quarterly Report on Form 10-Q filed on August 5, 2025.4 Spine Fixation is comprised of the Company's Spinal Implants product category, excluding motion preservation product offerings. Q2 2025 Financial Highlights $20.6M Non-GAAP Pro Forma Adjusted EBITDA1,3 $4.0M YoY increase and ~190 bps margin expansion $4.5M Free Cash Flow3 Continued positive YoY progress 5% U.S. Spine Fixation4 YoY Net Sales Growth U.S. procedure volume growth of 7% 6% Bone Growth Therapies YoY Net Sales Growth 7% Growth in BGT Fracture  72.7% Non-GAAP Pro Forma Adjusted Gross Margin1,3 Compared to 71.3% reported for Q2 2024  $200.7M Pro Forma Net Sales1 4% growth YoY on constant currency basis1,2 28% U.S. Orthopedics YoY Net Sales Growth 4th consecutive quarter of double-digit growth

Slide 7

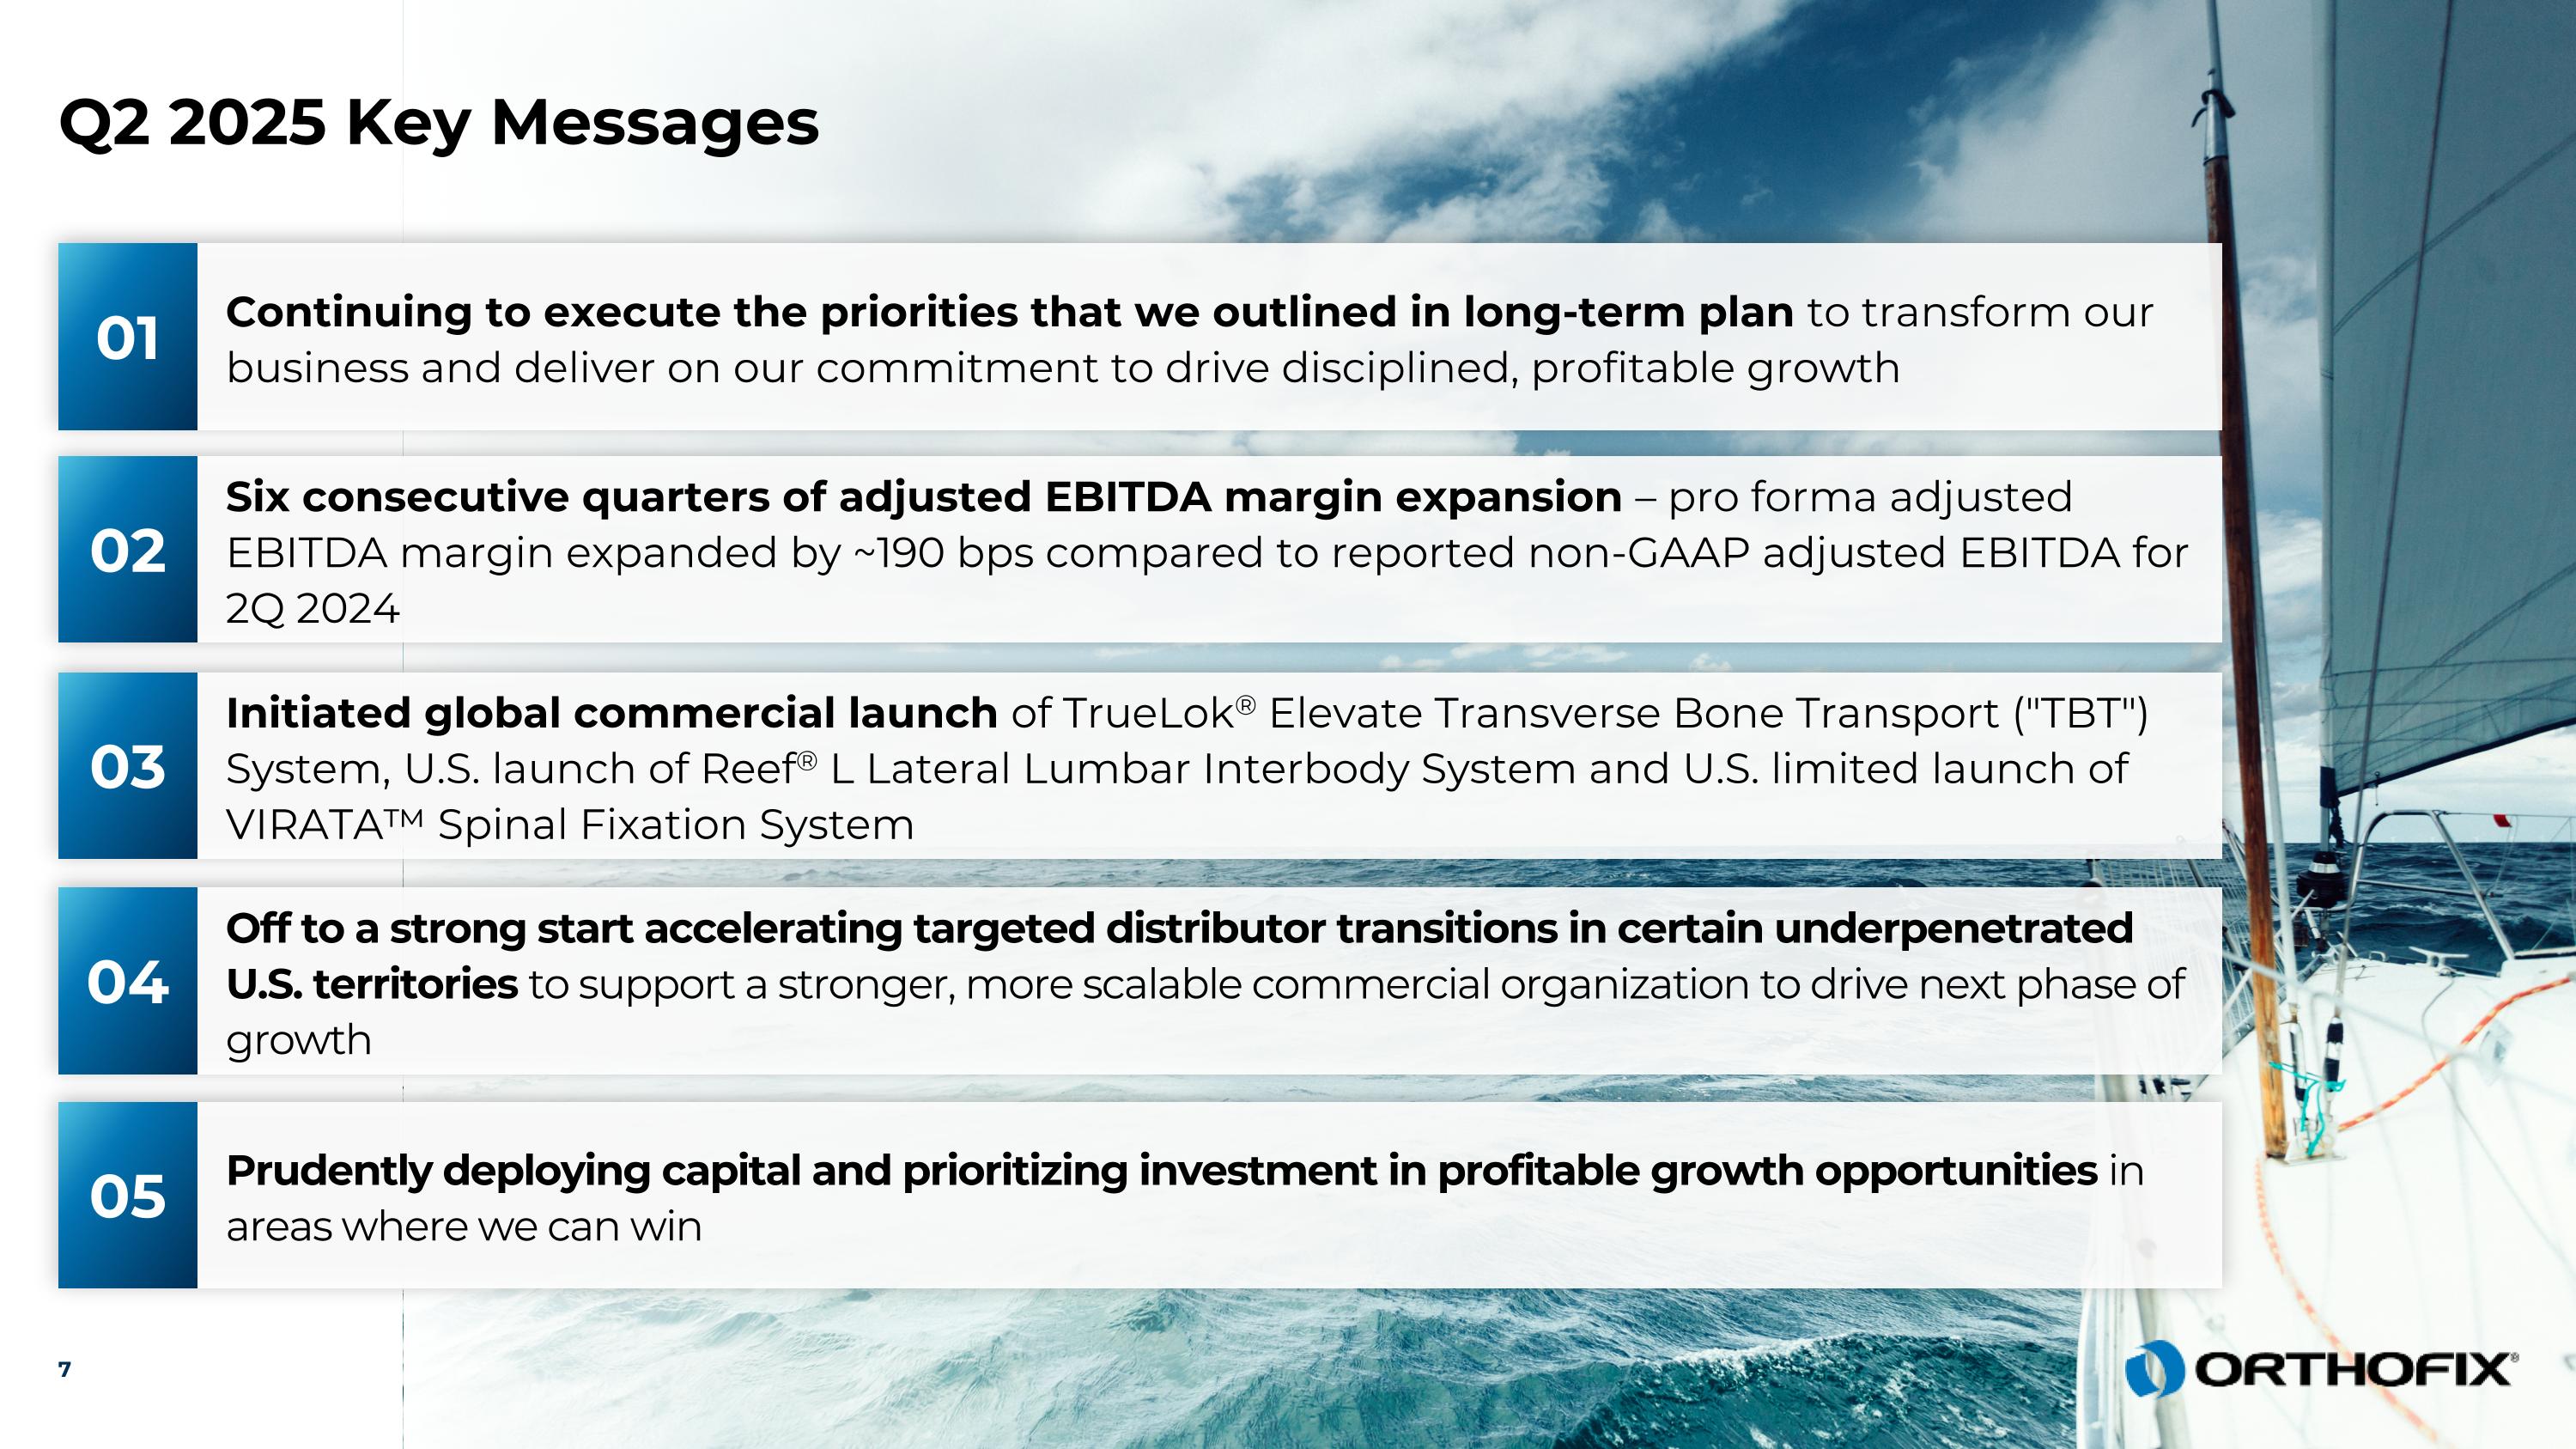
7 Continuing to execute the priorities that we outlined in long-term plan to transform our business and deliver on our commitment to drive disciplined, profitable growth 01 Six consecutive quarters of adjusted EBITDA margin expansion – pro forma adjusted EBITDA margin expanded by ~190 bps compared to reported non-GAAP adjusted EBITDA for 2Q 2024 02 Initiated global commercial launch of TrueLok® Elevate Transverse Bone Transport ("TBT") System, U.S. launch of Reef® L Lateral Lumbar Interbody System and U.S. limited launch of VIRATA™ Spinal Fixation System 03 Off to a strong start accelerating targeted distributor transitions in certain underpenetrated U.S. territories to support a stronger, more scalable commercial organization to drive next phase of growth 04 Prudently deploying capital and prioritizing investment in profitable growth opportunities in areas where we can win 05 Q2 2025 Key Messages

Slide 8

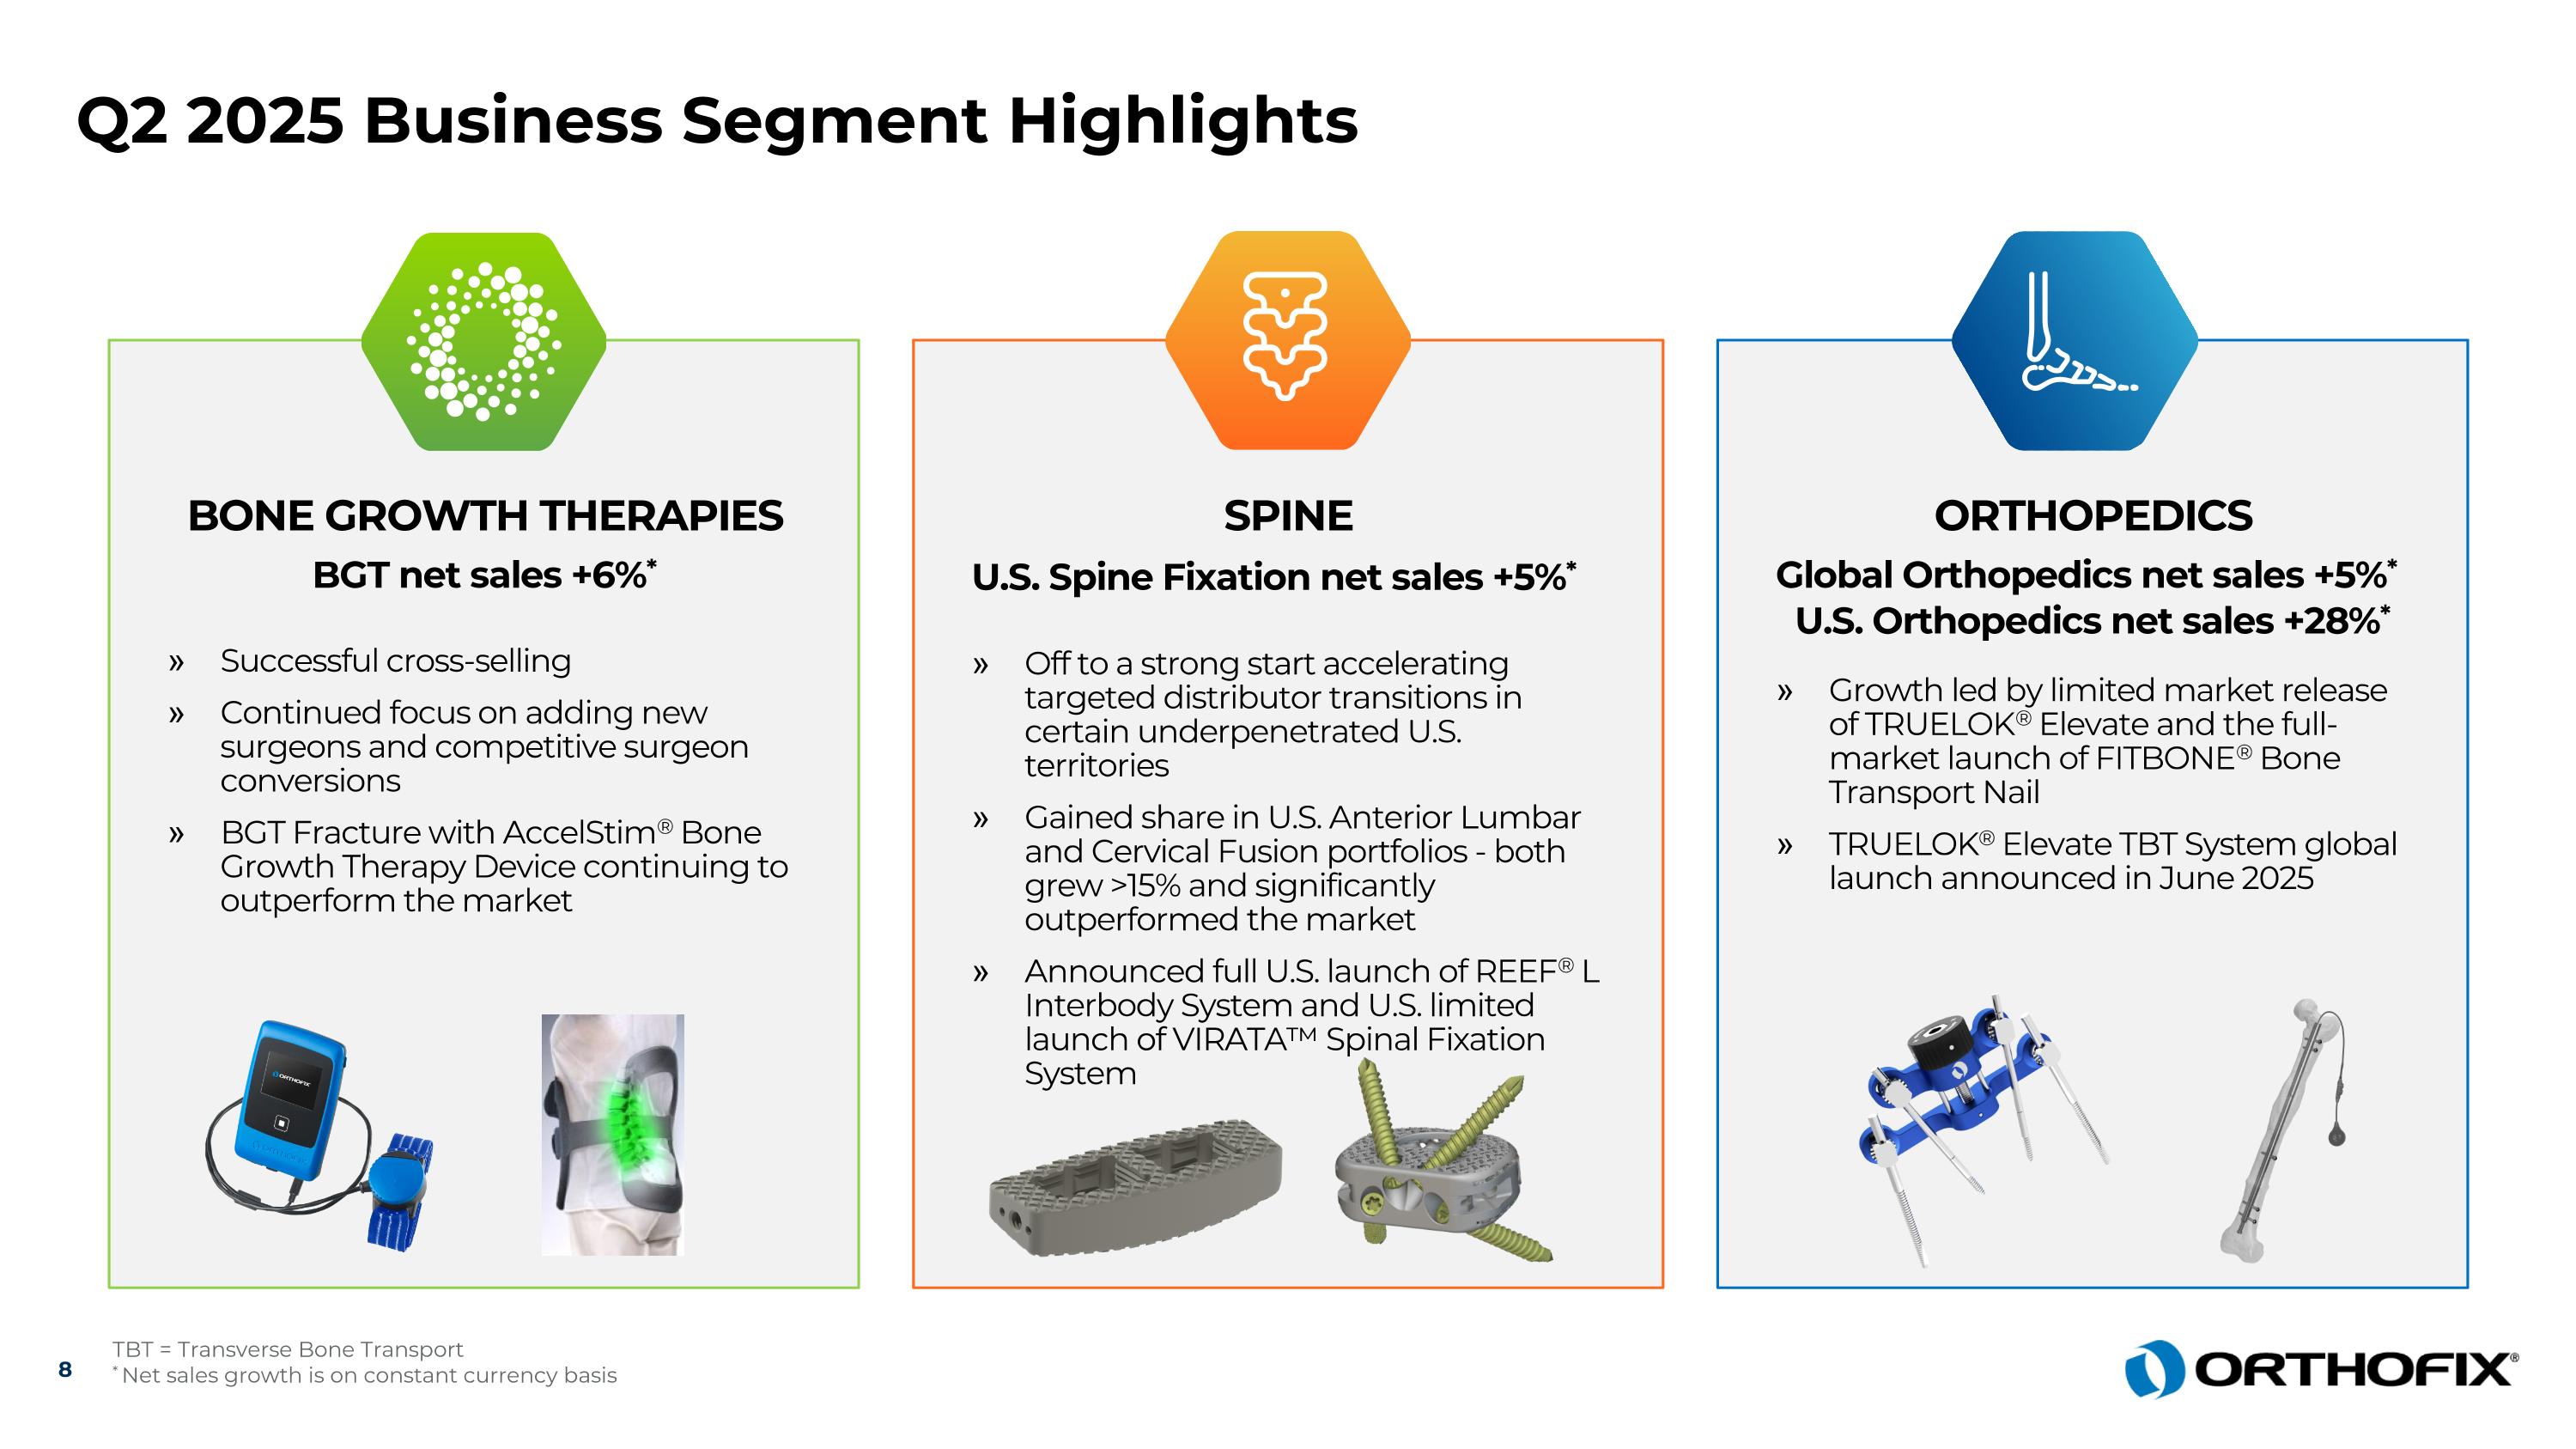
Q2 2025 Business Segment Highlights 8 TBT = Transverse Bone Transport * Net sales growth is on constant currency basis BONE GROWTH THERAPIES BGT net sales +6%* Successful cross-selling Continued focus on adding new surgeons and competitive surgeon conversions BGT Fracture with AccelStim® Bone Growth Therapy Device continuing to outperform the market ORTHOPEDICS Global Orthopedics net sales +5%* U.S. Orthopedics net sales +28%* Growth led by limited market release of TRUELOK® Elevate and the full-market launch of FITBONE® Bone Transport Nail TRUELOK® Elevate TBT System global launch announced in June 2025 SPINE U.S. Spine Fixation net sales +5%* Off to a strong start accelerating targeted distributor transitions in certain underpenetrated U.S. territories Gained share in U.S. Anterior Lumbar and Cervical Fusion portfolios - both grew >15% and significantly outperformed the market Announced full U.S. launch of REEF® L Interbody System and U.S. limited launch of VIRATA™ Spinal Fixation System

Slide 9

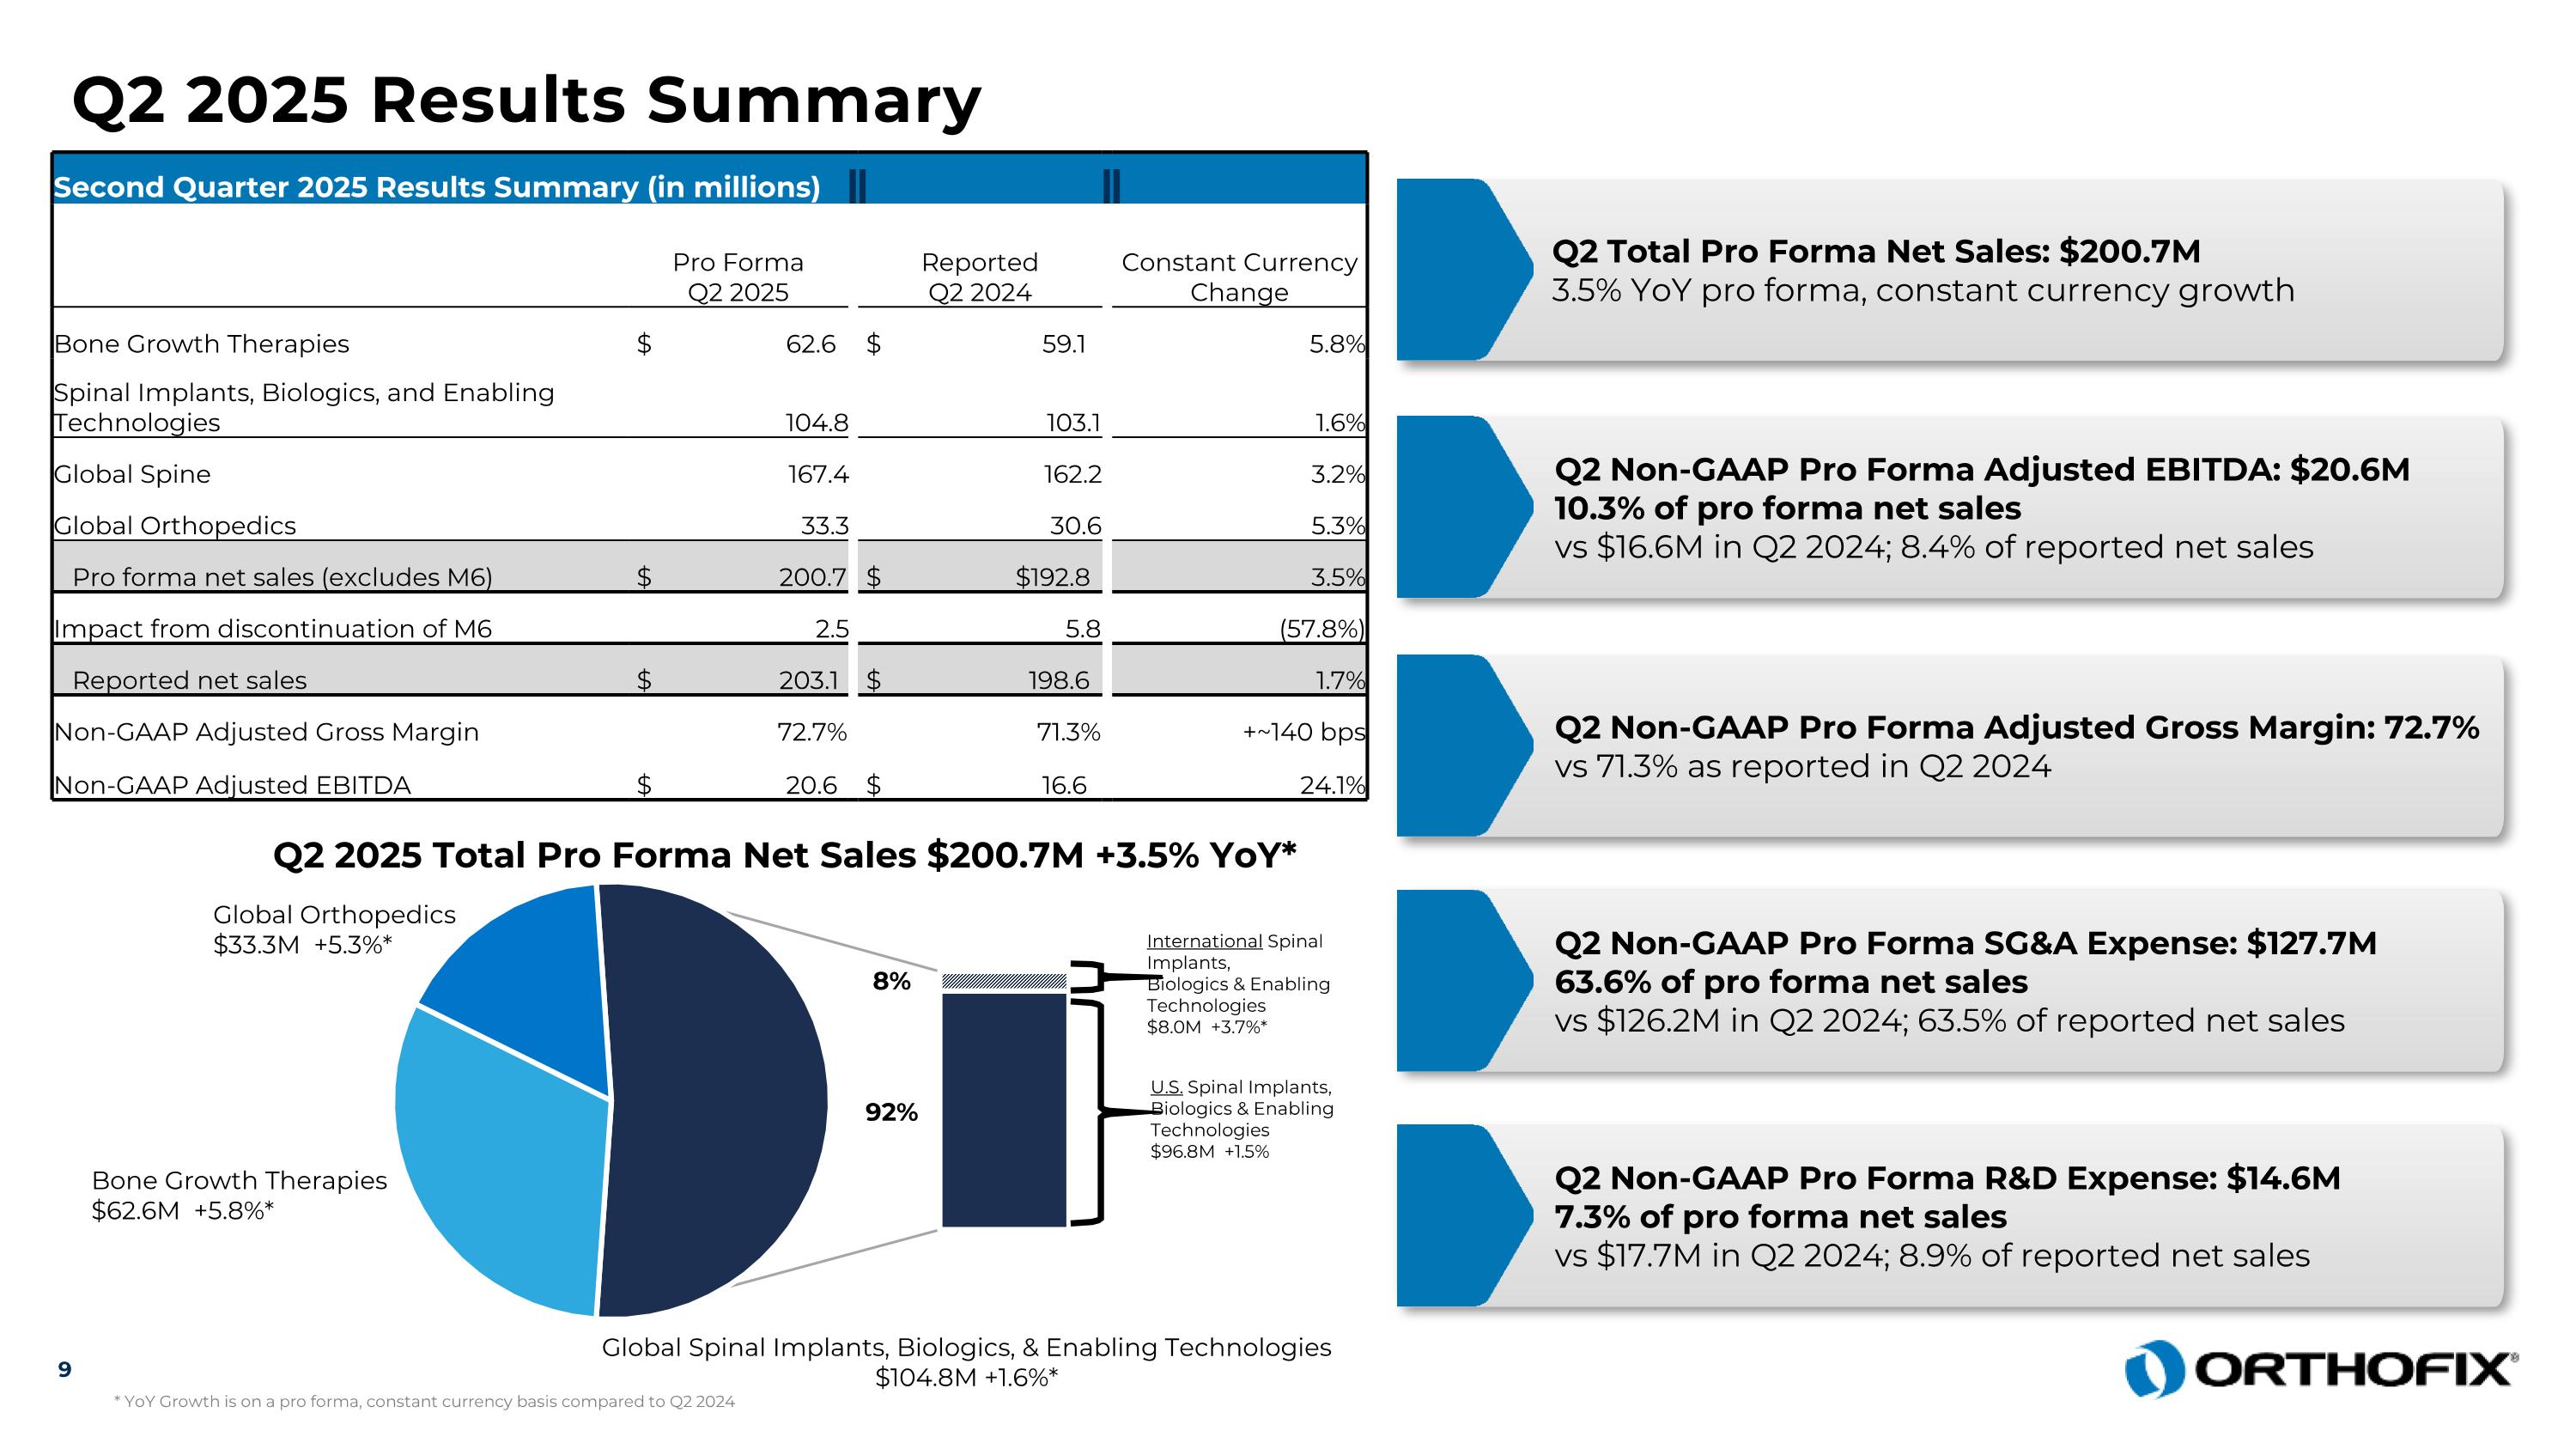
Q2 2025 Results Summary Second Quarter 2025 Results Summary (in millions)           Pro Forma Q2 2025   Reported Q2 2024   Constant Currency Change Bone Growth Therapies $ 62.6 $ 59.1 5.8% Spinal Implants, Biologics, and Enabling Technologies 104.8 103.1 1.6% Global Spine 167.4 162.2 3.2% Global Orthopedics 33.3 30.6 5.3% Pro forma net sales (excludes M6) $ 200.7 $ $192.8 3.5% Impact from discontinuation of M6 2.5 5.8 (57.8%) Reported net sales $ 203.1 $ 198.6 1.7% Non-GAAP Adjusted Gross Margin 72.7% 71.3% +~140 bps Non-GAAP Adjusted EBITDA $ 20.6   $ 16.6   24.1% Q2 Total Pro Forma Net Sales: $200.7M 3.5% YoY pro forma, constant currency growth Q2 Non-GAAP Pro Forma Adjusted EBITDA: $20.6M 10.3% of pro forma net sales vs $16.6M in Q2 2024; 8.4% of reported net sales Q2 Non-GAAP Pro Forma Adjusted Gross Margin: 72.7% vs 71.3% as reported in Q2 2024  Q2 Non-GAAP Pro Forma SG&A Expense: $127.7M 63.6% of pro forma net sales vs $126.2M in Q2 2024; 63.5% of reported net sales Q2 Non-GAAP Pro Forma R&D Expense: $14.6M 7.3% of pro forma net sales vs $17.7M in Q2 2024; 8.9% of reported net sales 9 Q2 2025 Total Pro Forma Net Sales $200.7M +3.5% YoY* Bone Growth Therapies $62.6M +5.8%* Global Orthopedics $33.3M +5.3%* Global Spinal Implants, Biologics, & Enabling Technologies $104.8M +1.6%* International Spinal Implants, Biologics & Enabling Technologies  $8.0M +3.7%* U.S. Spinal Implants, Biologics & Enabling Technologies  $96.8M +1.5% 92% 8% * YoY Growth is on a pro forma, constant currency basis compared to Q2 2024

Slide 10

Building Financial Resilience and Unlocking Strong, Consistent Free Cash Flow Strong Execution and Positive Free Cash Flow Momentum Driving Positive Free Cash Flow Expect to be free cash flow positive for full-year 20251 Drop-through to EBITDA from incremental revenue Working Capital improvements Efficient Working Capital Management Reduction in Inventory Days on Hand (DOH) and Instrument Efficiency Continued improvement in Days Sales Outstanding (DSO) 1 Excluding impact of restructuring charges related to discontinuation of M6® product lines

Slide 11

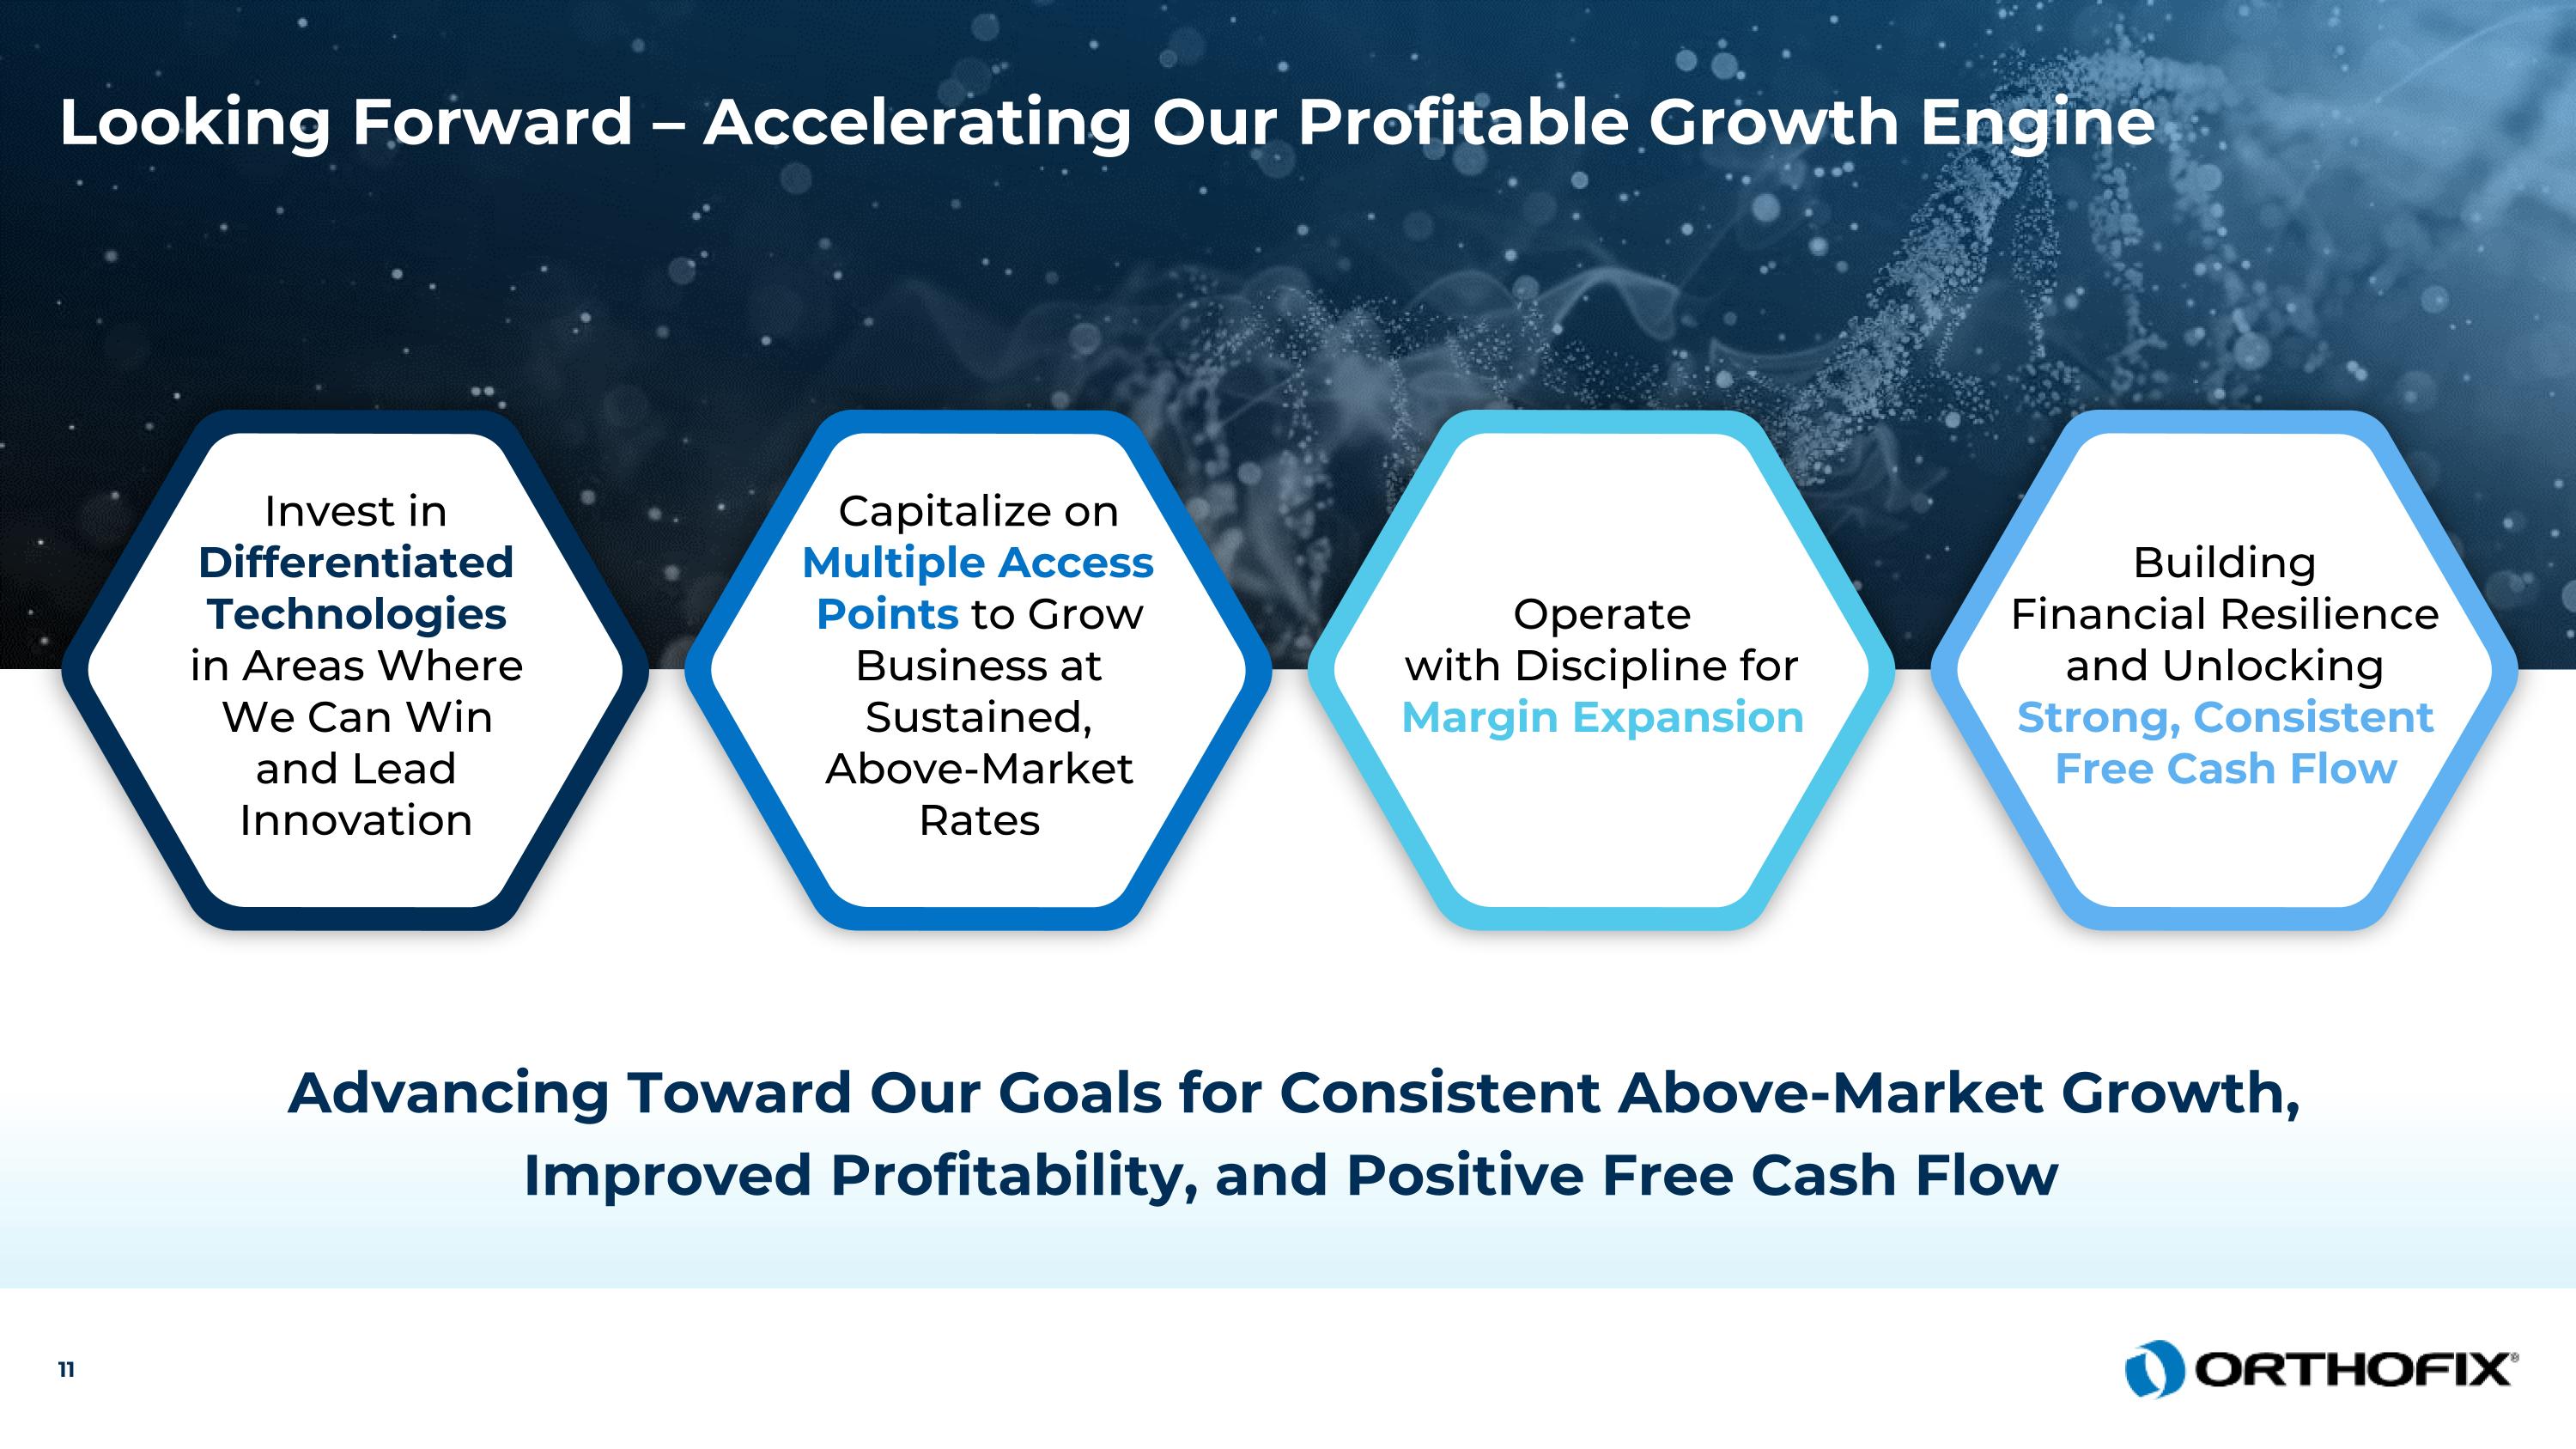
Looking Forward – Accelerating Our Profitable Growth Engine Advancing Toward Our Goals for Consistent Above-Market Growth, Improved Profitability, and Positive Free Cash Flow Invest in Differentiated Technologies in Areas Where We Can Win and Lead Innovation Capitalize on Multiple Access Points to Grow Business at Sustained, Above-Market Rates Operate with Discipline for Margin Expansion Building Financial Resilience and Unlocking Strong, Consistent Free Cash Flow


Slide 12

Full-Year 2025 Guidance1 $808M – $816M Pro Forma Net Sales $82M – $86M Pro Forma Adj. EBITDA Positive Free Cash Flow for 2025² 1 As of the Company’s Q2 2025 Earnings Call hosted on 8/5/2025. Inclusion of this information in this presentation is not a confirmation or an update of, and should not be construed or otherwise assumed to reflect any confirmation or update of, that guidance by Orthofix leadership as of any date other than 8/5/2025. Pro forma net sales range of $808 million to $816 million excludes sales from the discontinued M6® product lines and assumes a $5 million negative impact from U.S. funded non-governmental organization (NGO) business as compared to the full-year 2024. This guidance range is based on current foreign currency exchange rates and does not take into account any additional potential exchange rate changes that may occur this year. 2 Excluding impact of restructuring charges related to the discontinuation of the M6® product lines

Slide 13

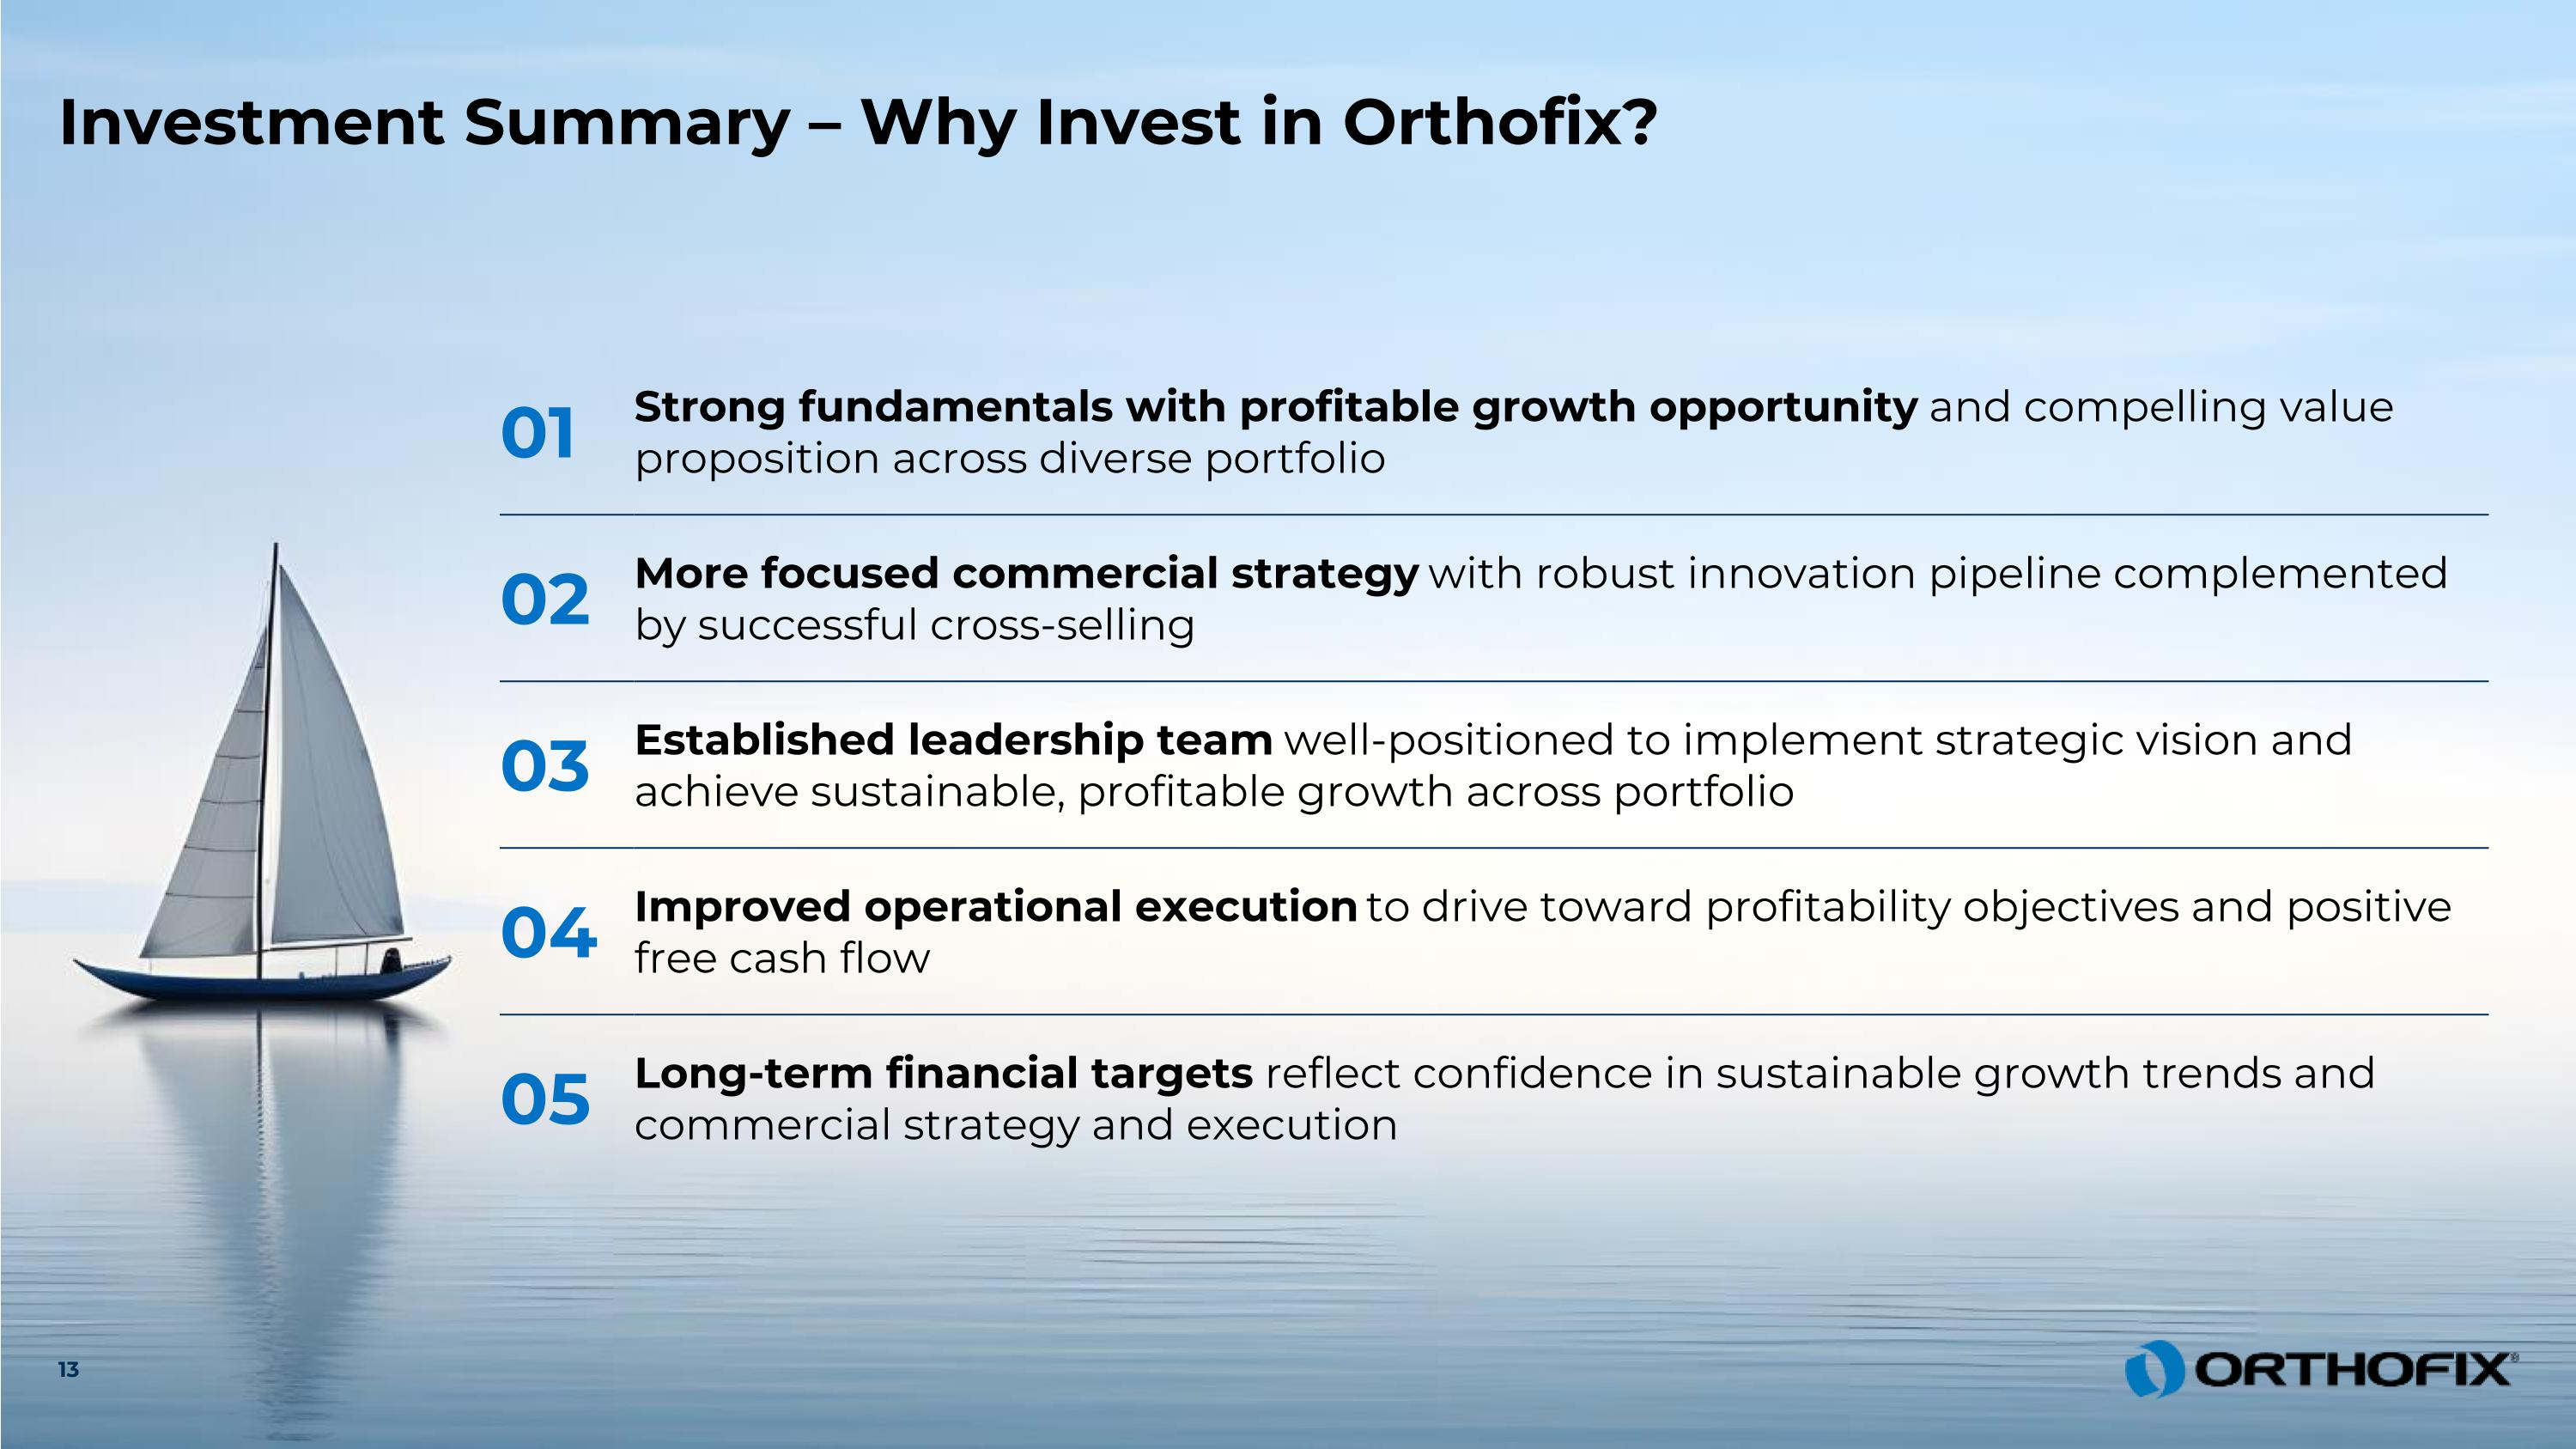
Investment Summary – Why Invest in Orthofix? 01 Strong fundamentals with profitable growth opportunity and compelling value proposition across diverse portfolio 02 More focused commercial strategy with robust innovation pipeline complemented by successful cross-selling 03 Established leadership team well-positioned to implement strategic vision and achieve sustainable, profitable growth across portfolio 04 Improved operational execution to drive toward profitability objectives and positive free cash flow 05 Long-term financial targets reflect confidence in sustainable growth trends and commercial strategy and execution


Slide 14

For additional information, please contact: Julie Dewey, IRC Chief IR & Communications Officer [email protected] 209-613-6945 www.Orthofix.com NASDAQ: OFIX

Slide 15

Financial and Non-GAAP Reconciliation Tables Appendix

Slide 16

Net Sales by Major Product Category by Reporting Segment     Three Months Ended June 30,   (Unaudited, U.S. Dollars, in millions)   2025     2024     Change     Constant Currency Change   Bone Growth Therapies   $ 62.6     $ 59.1       5.8 %     5.8 % Spinal Implants, Biologics and Enabling Technologies*     104.8       103.1       1.6 %     1.6 % Global Spine*     167.4       162.2       3.2 %     3.2 % Global Orthopedics     33.3       30.6       8.9 %     5.3 % Pro forma net sales*     200.7       192.8       4.1 %     3.5 % Impact from discontinuation of M6 product lines     2.5       5.8       (57.5 %)     (57.8 %) Reported net sales   $ 203.1     $ 198.6       2.3 %     1.7 % * Results above for each of Spinal Implants, Biologics, and Enabling Technologies; Global Spine; and pro forma net sales exclude the impact from discontinuation of the M6® product lines. Since pro forma net sales represent a non-GAAP measure, see the reconciliation above of the Company's pro forma net sales to its reported figures under U.S. GAAP. The Company's reported figures under U.S. GAAP represent each of the pro forma line items discussed above plus the impact from discontinuation of the M6® product lines.

Slide 17

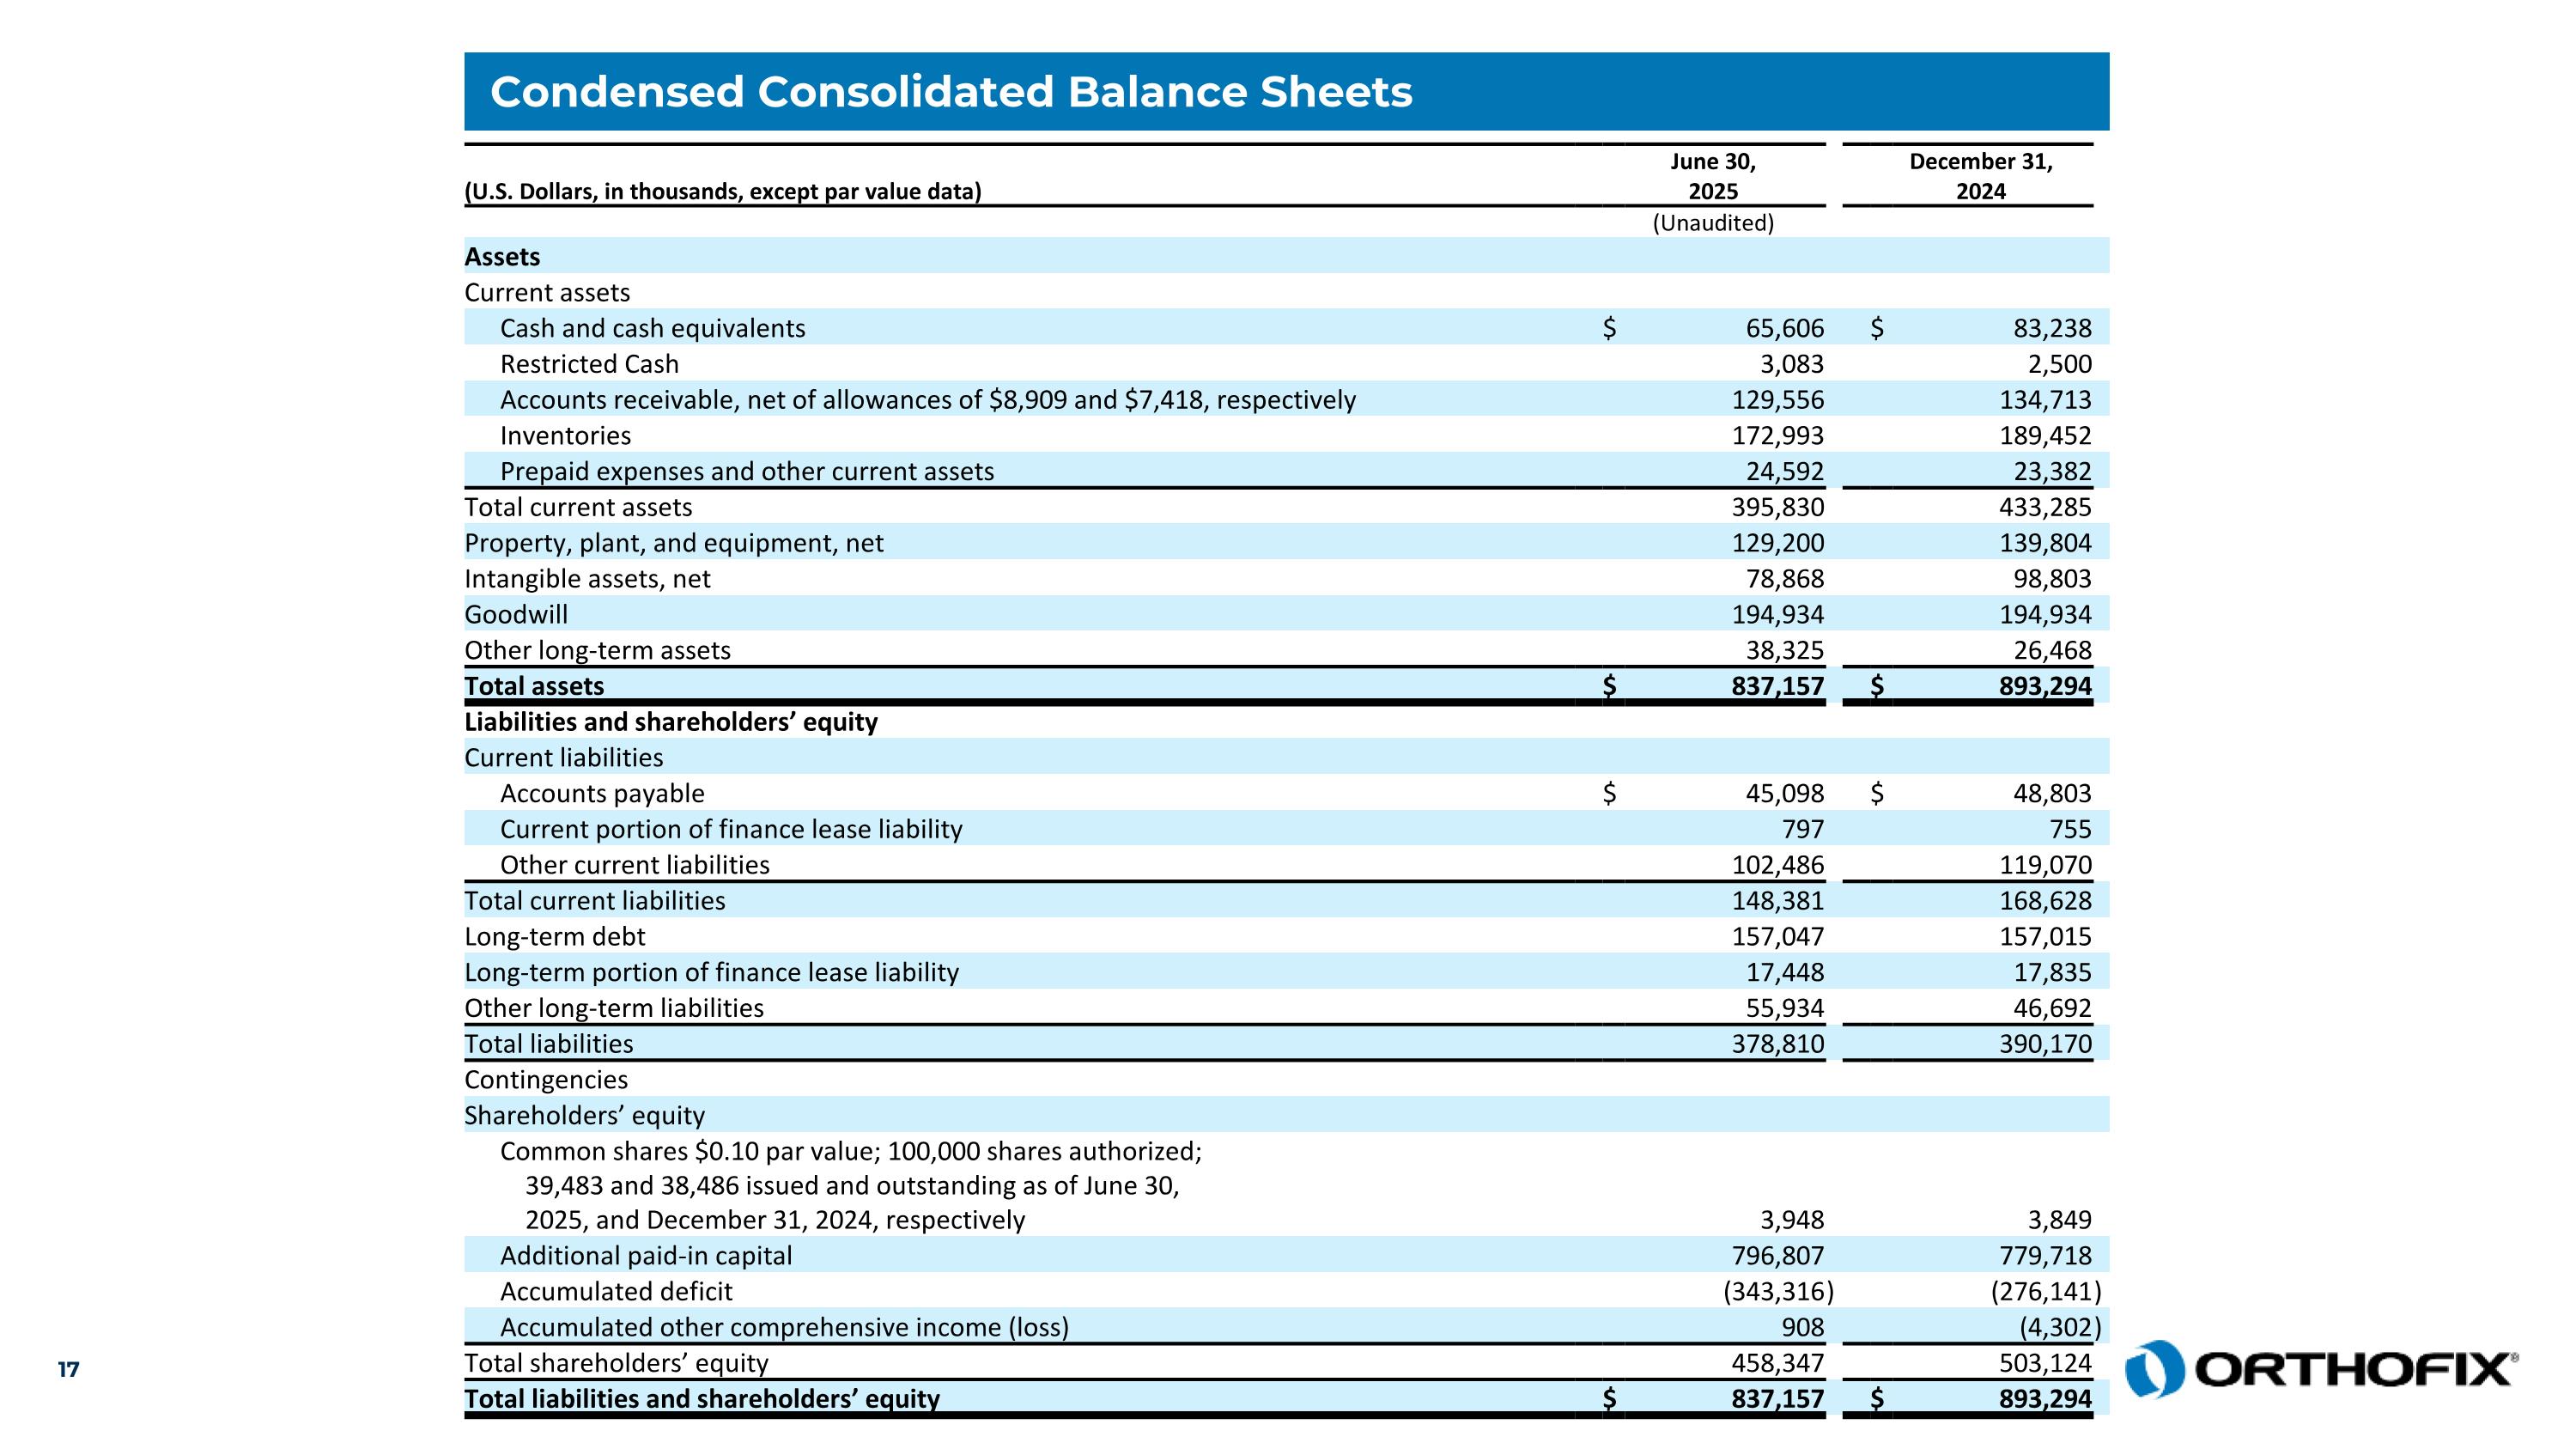
Condensed Consolidated Balance Sheets (U.S. Dollars, in thousands, except par value data)   June 30, 2025     December 31, 2024       (Unaudited)         Assets             Current assets             Cash and cash equivalents   $ 65,606     $ 83,238   Restricted Cash     3,083       2,500   Accounts receivable, net of allowances of $8,909 and $7,418, respectively     129,556       134,713   Inventories     172,993       189,452   Prepaid expenses and other current assets     24,592       23,382   Total current assets     395,830       433,285   Property, plant, and equipment, net     129,200       139,804   Intangible assets, net     78,868       98,803   Goodwill     194,934       194,934   Other long-term assets     38,325       26,468   Total assets   $ 837,157     $ 893,294   Liabilities and shareholders’ equity             Current liabilities             Accounts payable   $ 45,098     $ 48,803   Current portion of finance lease liability     797       755   Other current liabilities     102,486       119,070   Total current liabilities     148,381       168,628   Long-term debt     157,047       157,015   Long-term portion of finance lease liability     17,448       17,835   Other long-term liabilities     55,934       46,692   Total liabilities     378,810       390,170   Contingencies             Shareholders’ equity             Common shares $0.10 par value; 100,000 shares authorized; 39,483 and 38,486 issued and outstanding as of June 30, 2025, and December 31, 2024, respectively     3,948       3,849   Additional paid-in capital     796,807       779,718   Accumulated deficit     (343,316 )     (276,141 ) Accumulated other comprehensive income (loss)     908       (4,302 ) Total shareholders’ equity     458,347       503,124   Total liabilities and shareholders’ equity   $ 837,157     $ 893,294  

Slide 18

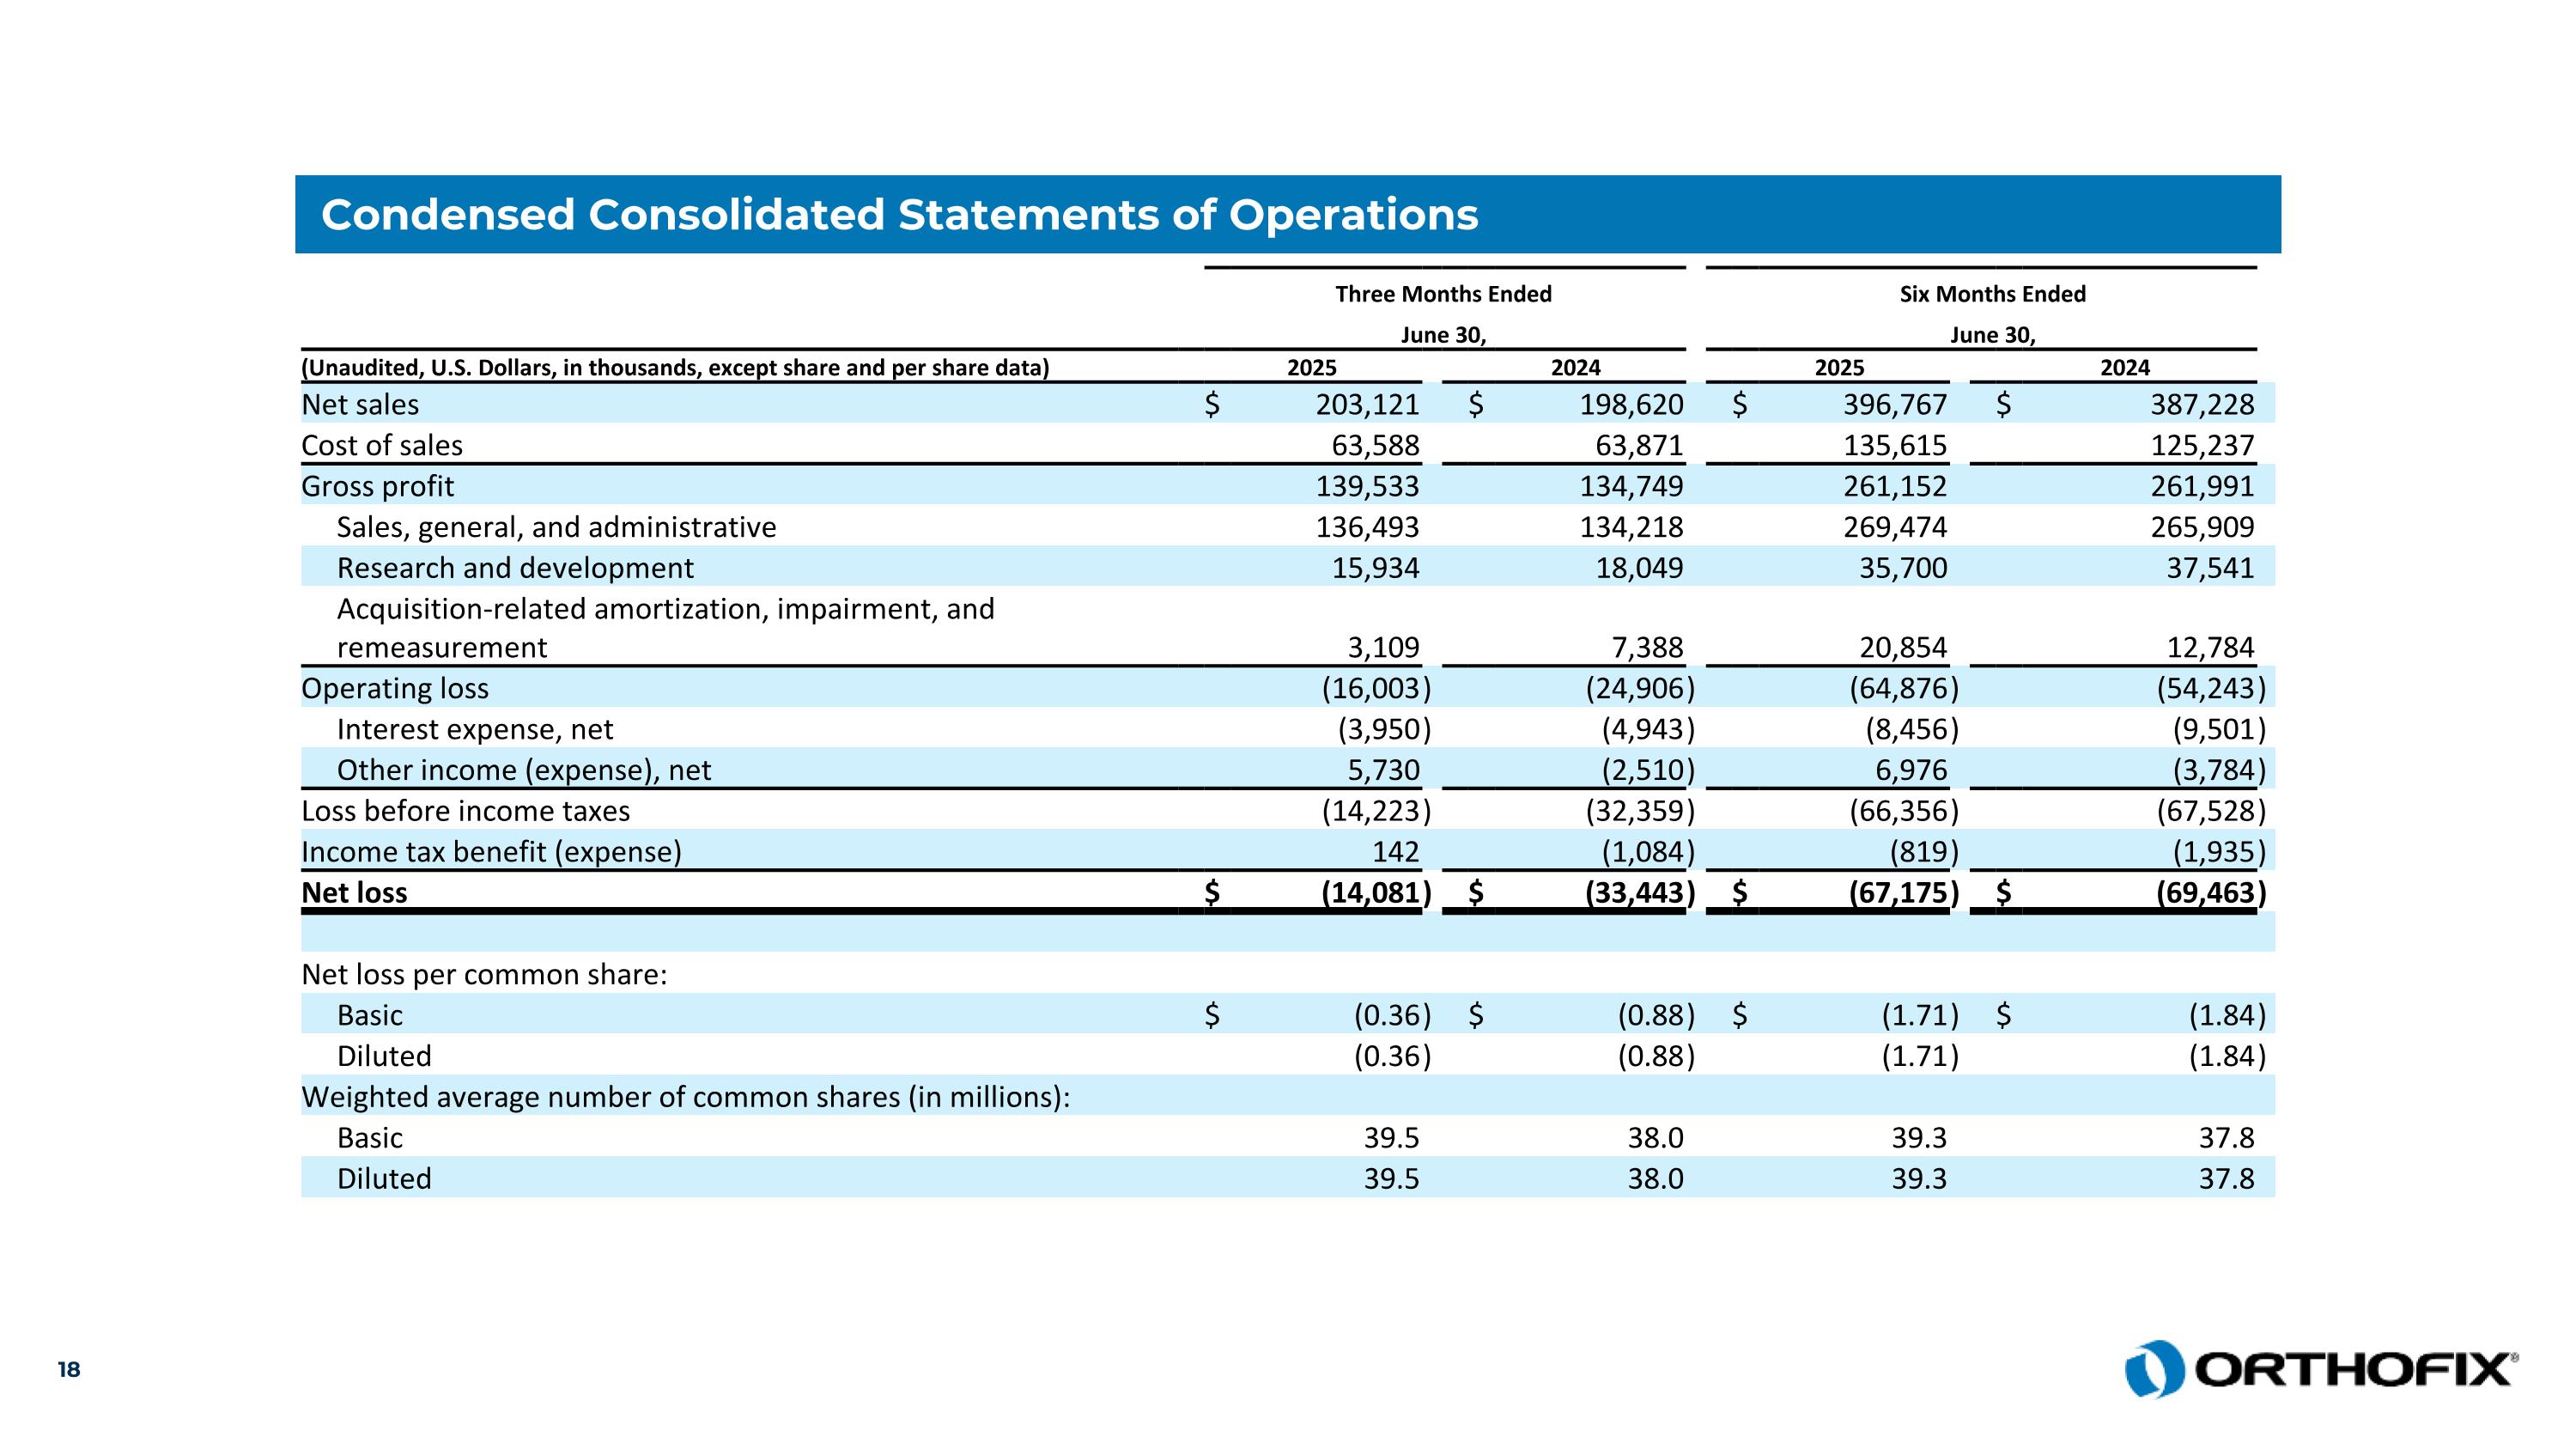
Condensed Consolidated Statements of Operations     Three Months Ended     Six Months Ended       June 30,     June 30,   (Unaudited, U.S. Dollars, in thousands, except share and per share data)   2025     2024     2025     2024   Net sales   $ 203,121     $ 198,620     $ 396,767     $ 387,228   Cost of sales     63,588       63,871       135,615       125,237   Gross profit     139,533       134,749       261,152       261,991   Sales, general, and administrative     136,493       134,218       269,474       265,909   Research and development     15,934       18,049       35,700       37,541   Acquisition-related amortization, impairment, and remeasurement     3,109       7,388       20,854       12,784   Operating loss     (16,003 )     (24,906 )     (64,876 )     (54,243 ) Interest expense, net     (3,950 )     (4,943 )     (8,456 )     (9,501 ) Other income (expense), net     5,730       (2,510 )     6,976       (3,784 ) Loss before income taxes     (14,223 )     (32,359 )     (66,356 )     (67,528 ) Income tax benefit (expense)     142       (1,084 )     (819 )     (1,935 ) Net loss   $ (14,081 )   $ (33,443 )   $ (67,175 )   $ (69,463 )                           Net loss per common share:                         Basic   $ (0.36 )   $ (0.88 )   $ (1.71 )   $ (1.84 ) Diluted     (0.36 )     (0.88 )     (1.71 )     (1.84 ) Weighted average number of common shares (in millions):                         Basic     39.5       38.0       39.3       37.8   Diluted     39.5       38.0       39.3       37.8  

Slide 19

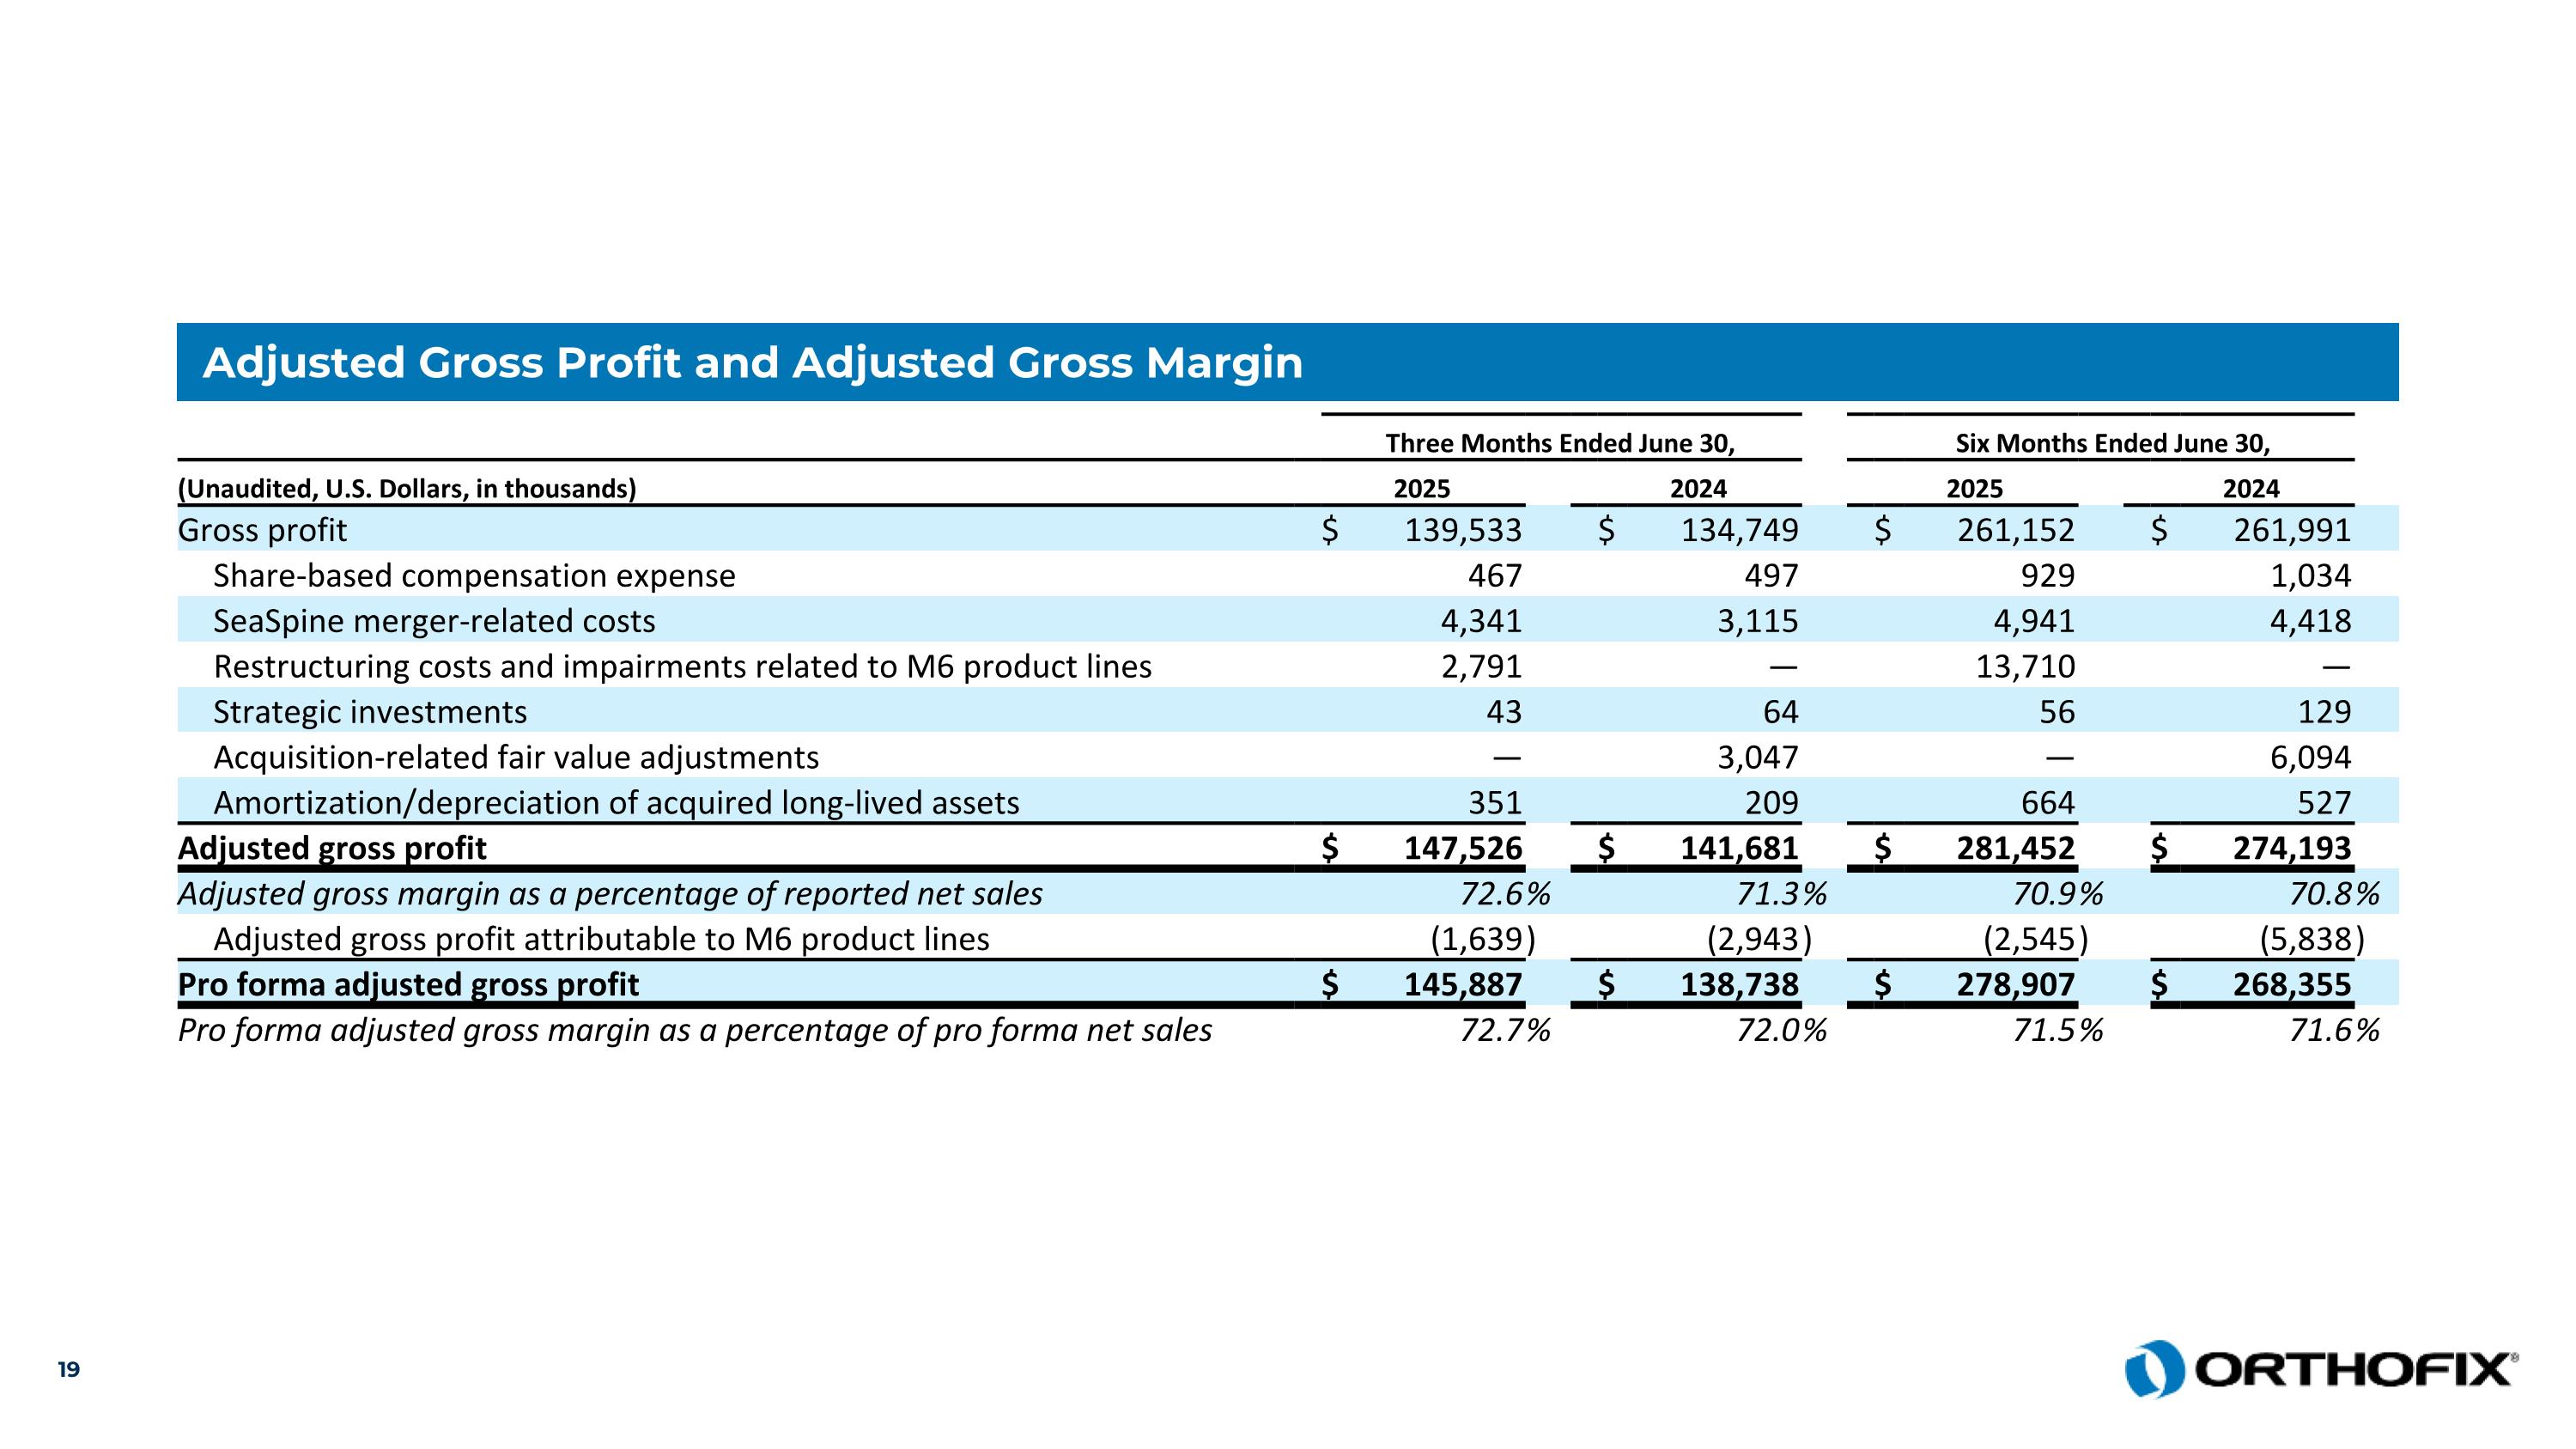
Adjusted Gross Profit and Adjusted Gross Margin     Three Months Ended June 30,     Six Months Ended June 30,   (Unaudited, U.S. Dollars, in thousands)   2025     2024     2025     2024   Gross profit   $ 139,533     $ 134,749     $ 261,152     $ 261,991   Share-based compensation expense     467       497       929       1,034   SeaSpine merger-related costs     4,341       3,115       4,941       4,418   Restructuring costs and impairments related to M6 product lines     2,791       —       13,710       —   Strategic investments     43       64       56       129   Acquisition-related fair value adjustments     —       3,047       —       6,094   Amortization/depreciation of acquired long-lived assets     351       209       664       527   Adjusted gross profit   $ 147,526     $ 141,681     $ 281,452     $ 274,193   Adjusted gross margin as a percentage of reported net sales     72.6 %     71.3 %     70.9 %     70.8 % Adjusted gross profit attributable to M6 product lines     (1,639 )     (2,943 )     (2,545 )     (5,838 ) Pro forma adjusted gross profit   $ 145,887     $ 138,738     $ 278,907     $ 268,355   Pro forma adjusted gross margin as a percentage of pro forma net sales     72.7 %     72.0 %     71.5 %     71.6 %

Slide 20

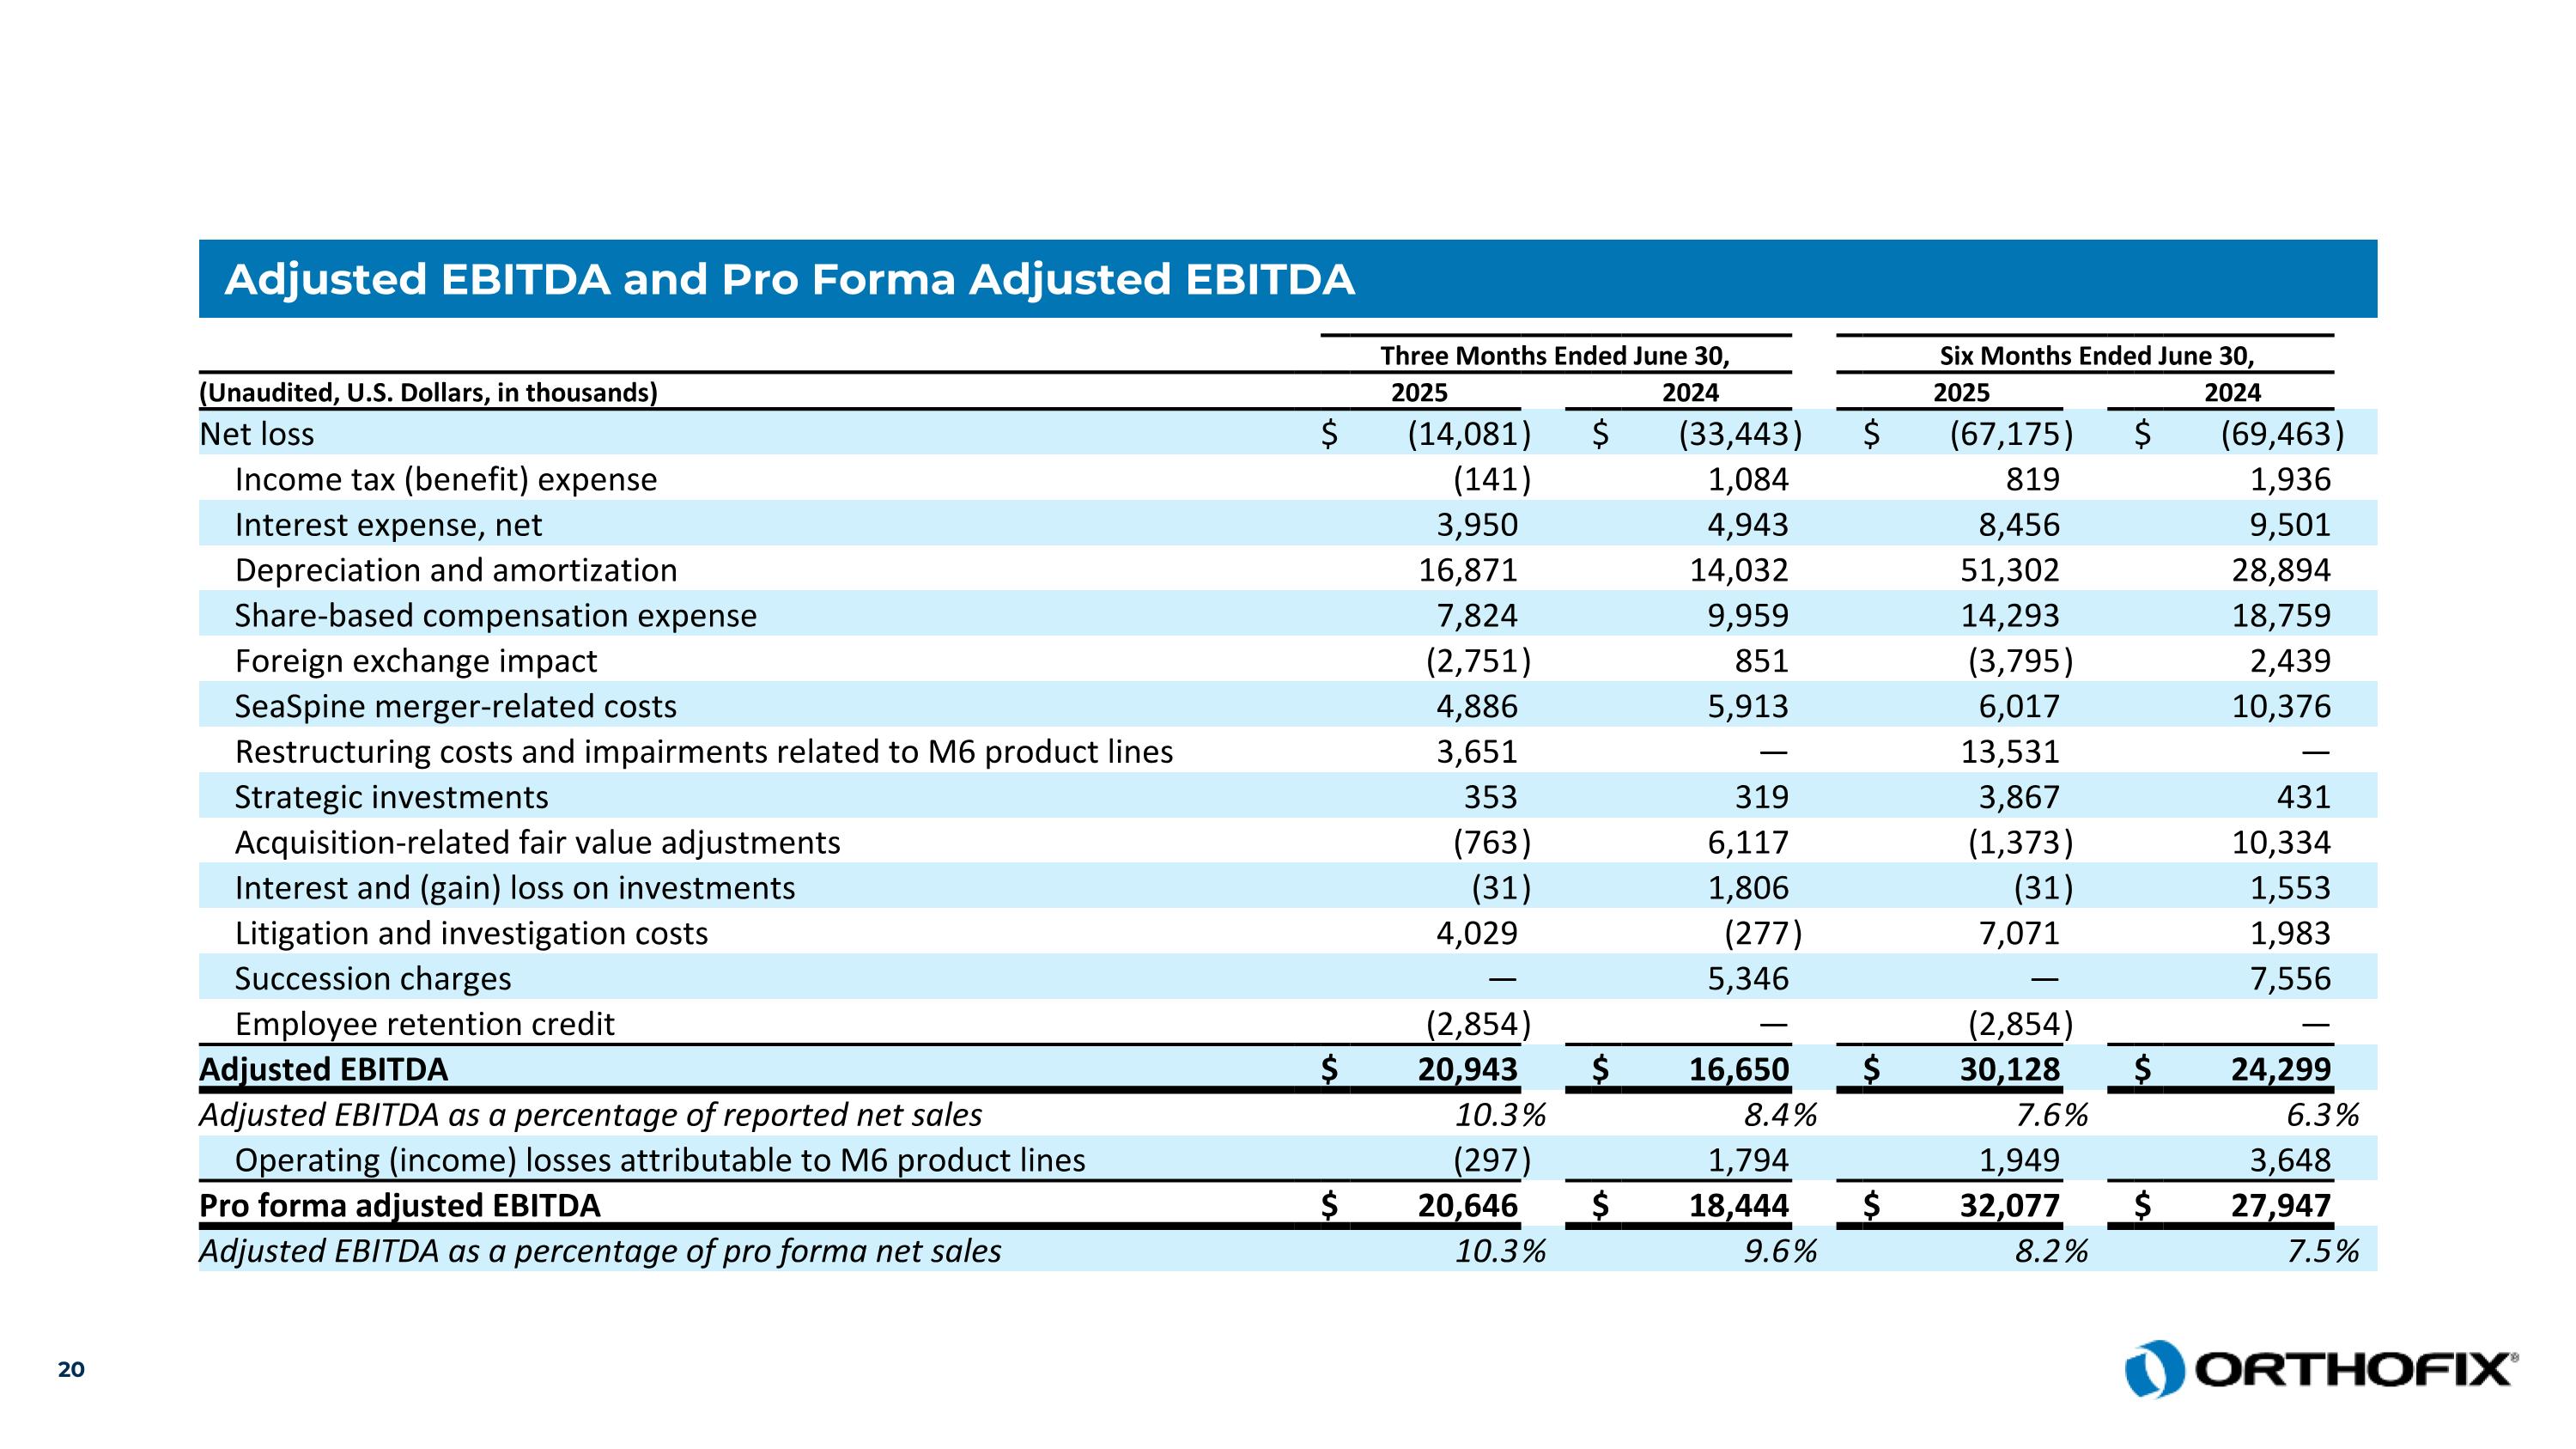
Adjusted EBITDA and Pro Forma Adjusted EBITDA     Three Months Ended June 30,     Six Months Ended June 30,   (Unaudited, U.S. Dollars, in thousands)   2025     2024     2025     2024   Net loss   $ (14,081 )   $ (33,443 )   $ (67,175 )   $ (69,463 ) Income tax (benefit) expense     (141 )     1,084       819       1,936   Interest expense, net     3,950       4,943       8,456       9,501   Depreciation and amortization     16,871       14,032       51,302       28,894   Share-based compensation expense     7,824       9,959       14,293       18,759   Foreign exchange impact     (2,751 )     851       (3,795 )     2,439   SeaSpine merger-related costs     4,886       5,913       6,017       10,376   Restructuring costs and impairments related to M6 product lines     3,651       —       13,531       —   Strategic investments     353       319       3,867       431   Acquisition-related fair value adjustments     (763 )     6,117       (1,373 )     10,334   Interest and (gain) loss on investments     (31 )     1,806       (31 )     1,553   Litigation and investigation costs     4,029       (277 )     7,071       1,983   Succession charges     —       5,346       —       7,556   Employee retention credit     (2,854 )     —       (2,854 )     —   Adjusted EBITDA   $ 20,943     $ 16,650     $ 30,128     $ 24,299   Adjusted EBITDA as a percentage of reported net sales     10.3 %     8.4 %     7.6 %     6.3 % Operating (income) losses attributable to M6 product lines     (297 )     1,794       1,949       3,648   Pro forma adjusted EBITDA   $ 20,646     $ 18,444     $ 32,077     $ 27,947   Adjusted EBITDA as a percentage of pro forma net sales     10.3 %     9.6 %     8.2 %     7.5 %

Slide 21

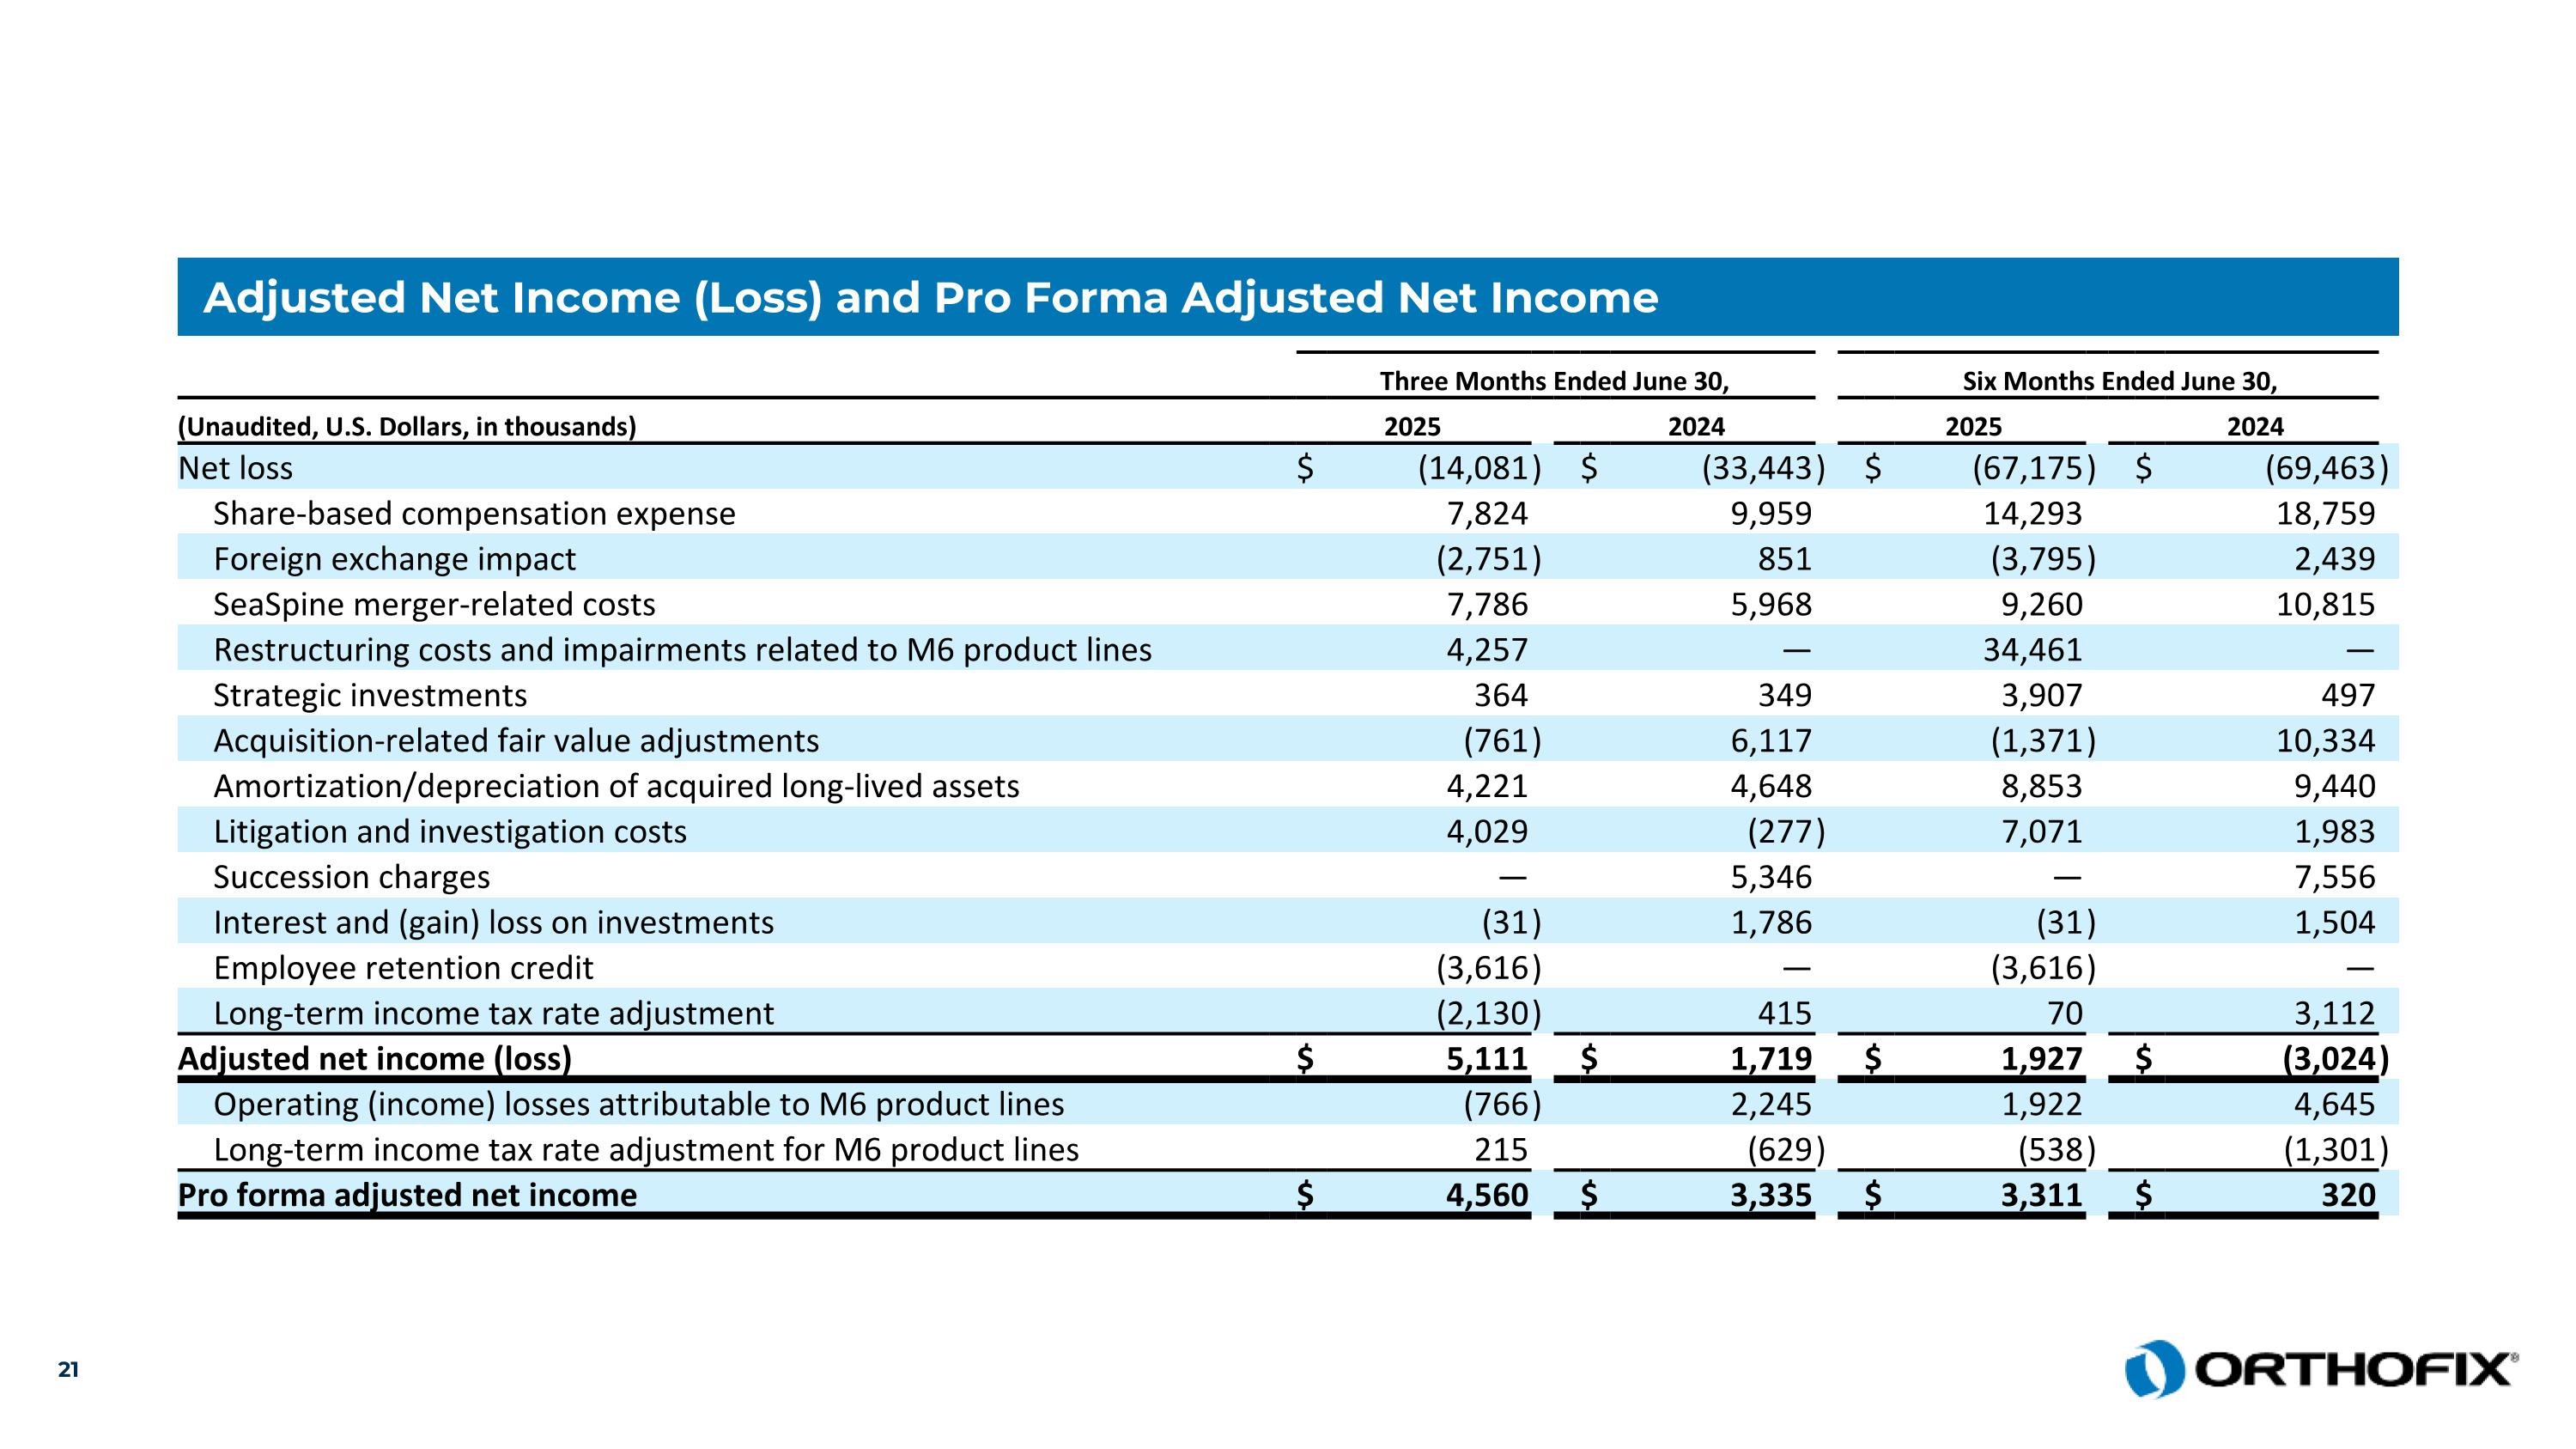
Adjusted Net Income (Loss) and Pro Forma Adjusted Net Income     Three Months Ended June 30,     Six Months Ended June 30,   (Unaudited, U.S. Dollars, in thousands)   2025     2024     2025     2024   Net loss   $ (14,081 )   $ (33,443 )   $ (67,175 )   $ (69,463 ) Share-based compensation expense     7,824       9,959       14,293       18,759   Foreign exchange impact     (2,751 )     851       (3,795 )     2,439   SeaSpine merger-related costs     7,786       5,968       9,260       10,815   Restructuring costs and impairments related to M6 product lines     4,257       —       34,461       —   Strategic investments     364       349       3,907       497   Acquisition-related fair value adjustments     (761 )     6,117       (1,371 )     10,334   Amortization/depreciation of acquired long-lived assets     4,221       4,648       8,853       9,440   Litigation and investigation costs     4,029       (277 )     7,071       1,983   Succession charges     —       5,346       —       7,556   Interest and (gain) loss on investments     (31 )     1,786       (31 )     1,504   Employee retention credit     (3,616 )     —       (3,616 )     —   Long-term income tax rate adjustment     (2,130 )     415       70       3,112   Adjusted net income (loss)   $ 5,111     $ 1,719     $ 1,927     $ (3,024 ) Operating (income) losses attributable to M6 product lines     (766 )     2,245       1,922       4,645   Long-term income tax rate adjustment for M6 product lines     215       (629 )     (538 )     (1,301 ) Pro forma adjusted net income   $ 4,560     $ 3,335     $ 3,311     $ 320  

Slide 22

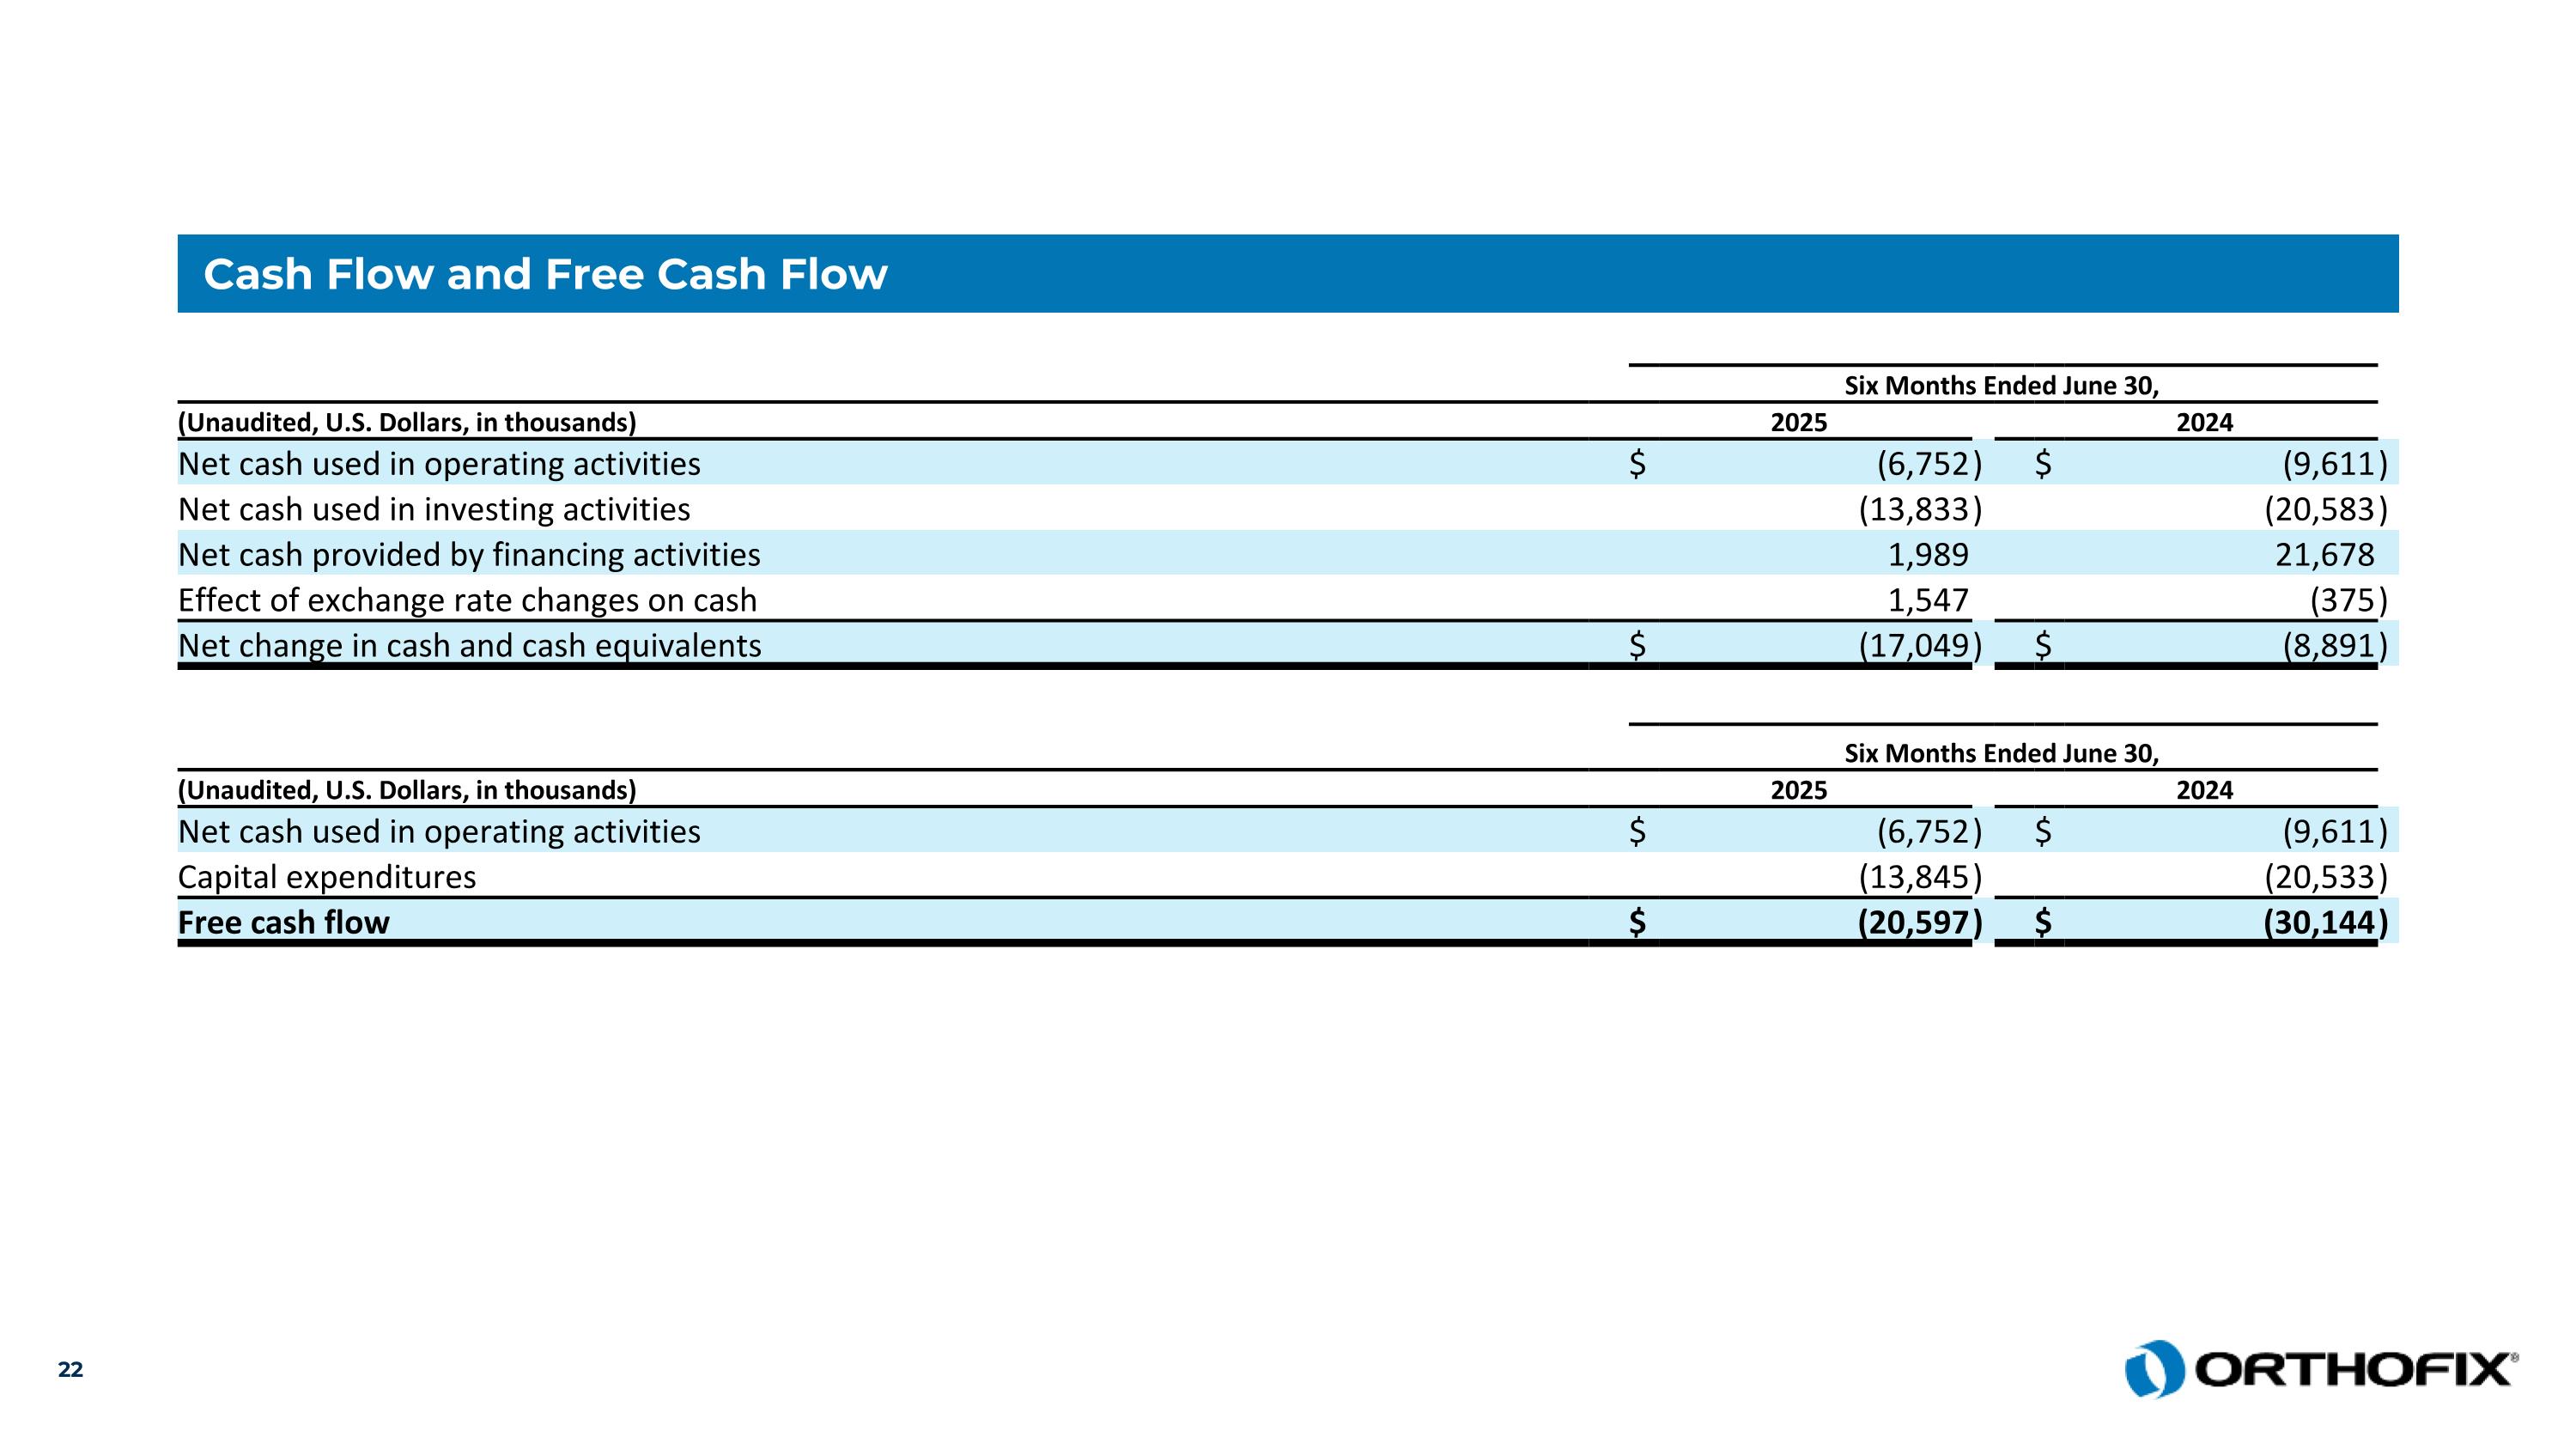
Cash Flow and Free Cash Flow     Six Months Ended June 30,   (Unaudited, U.S. Dollars, in thousands)   2025     2024   Net cash used in operating activities   $ (6,752 )   $ (9,611 ) Net cash used in investing activities     (13,833 )     (20,583 ) Net cash provided by financing activities     1,989       21,678   Effect of exchange rate changes on cash     1,547       (375 ) Net change in cash and cash equivalents   $ (17,049 )   $ (8,891 )     Six Months Ended June 30,   (Unaudited, U.S. Dollars, in thousands)   2025     2024   Net cash used in operating activities   $ (6,752 )   $ (9,611 ) Capital expenditures     (13,845 )     (20,533 ) Free cash flow   $ (20,597 )   $ (30,144 )

Slide 23

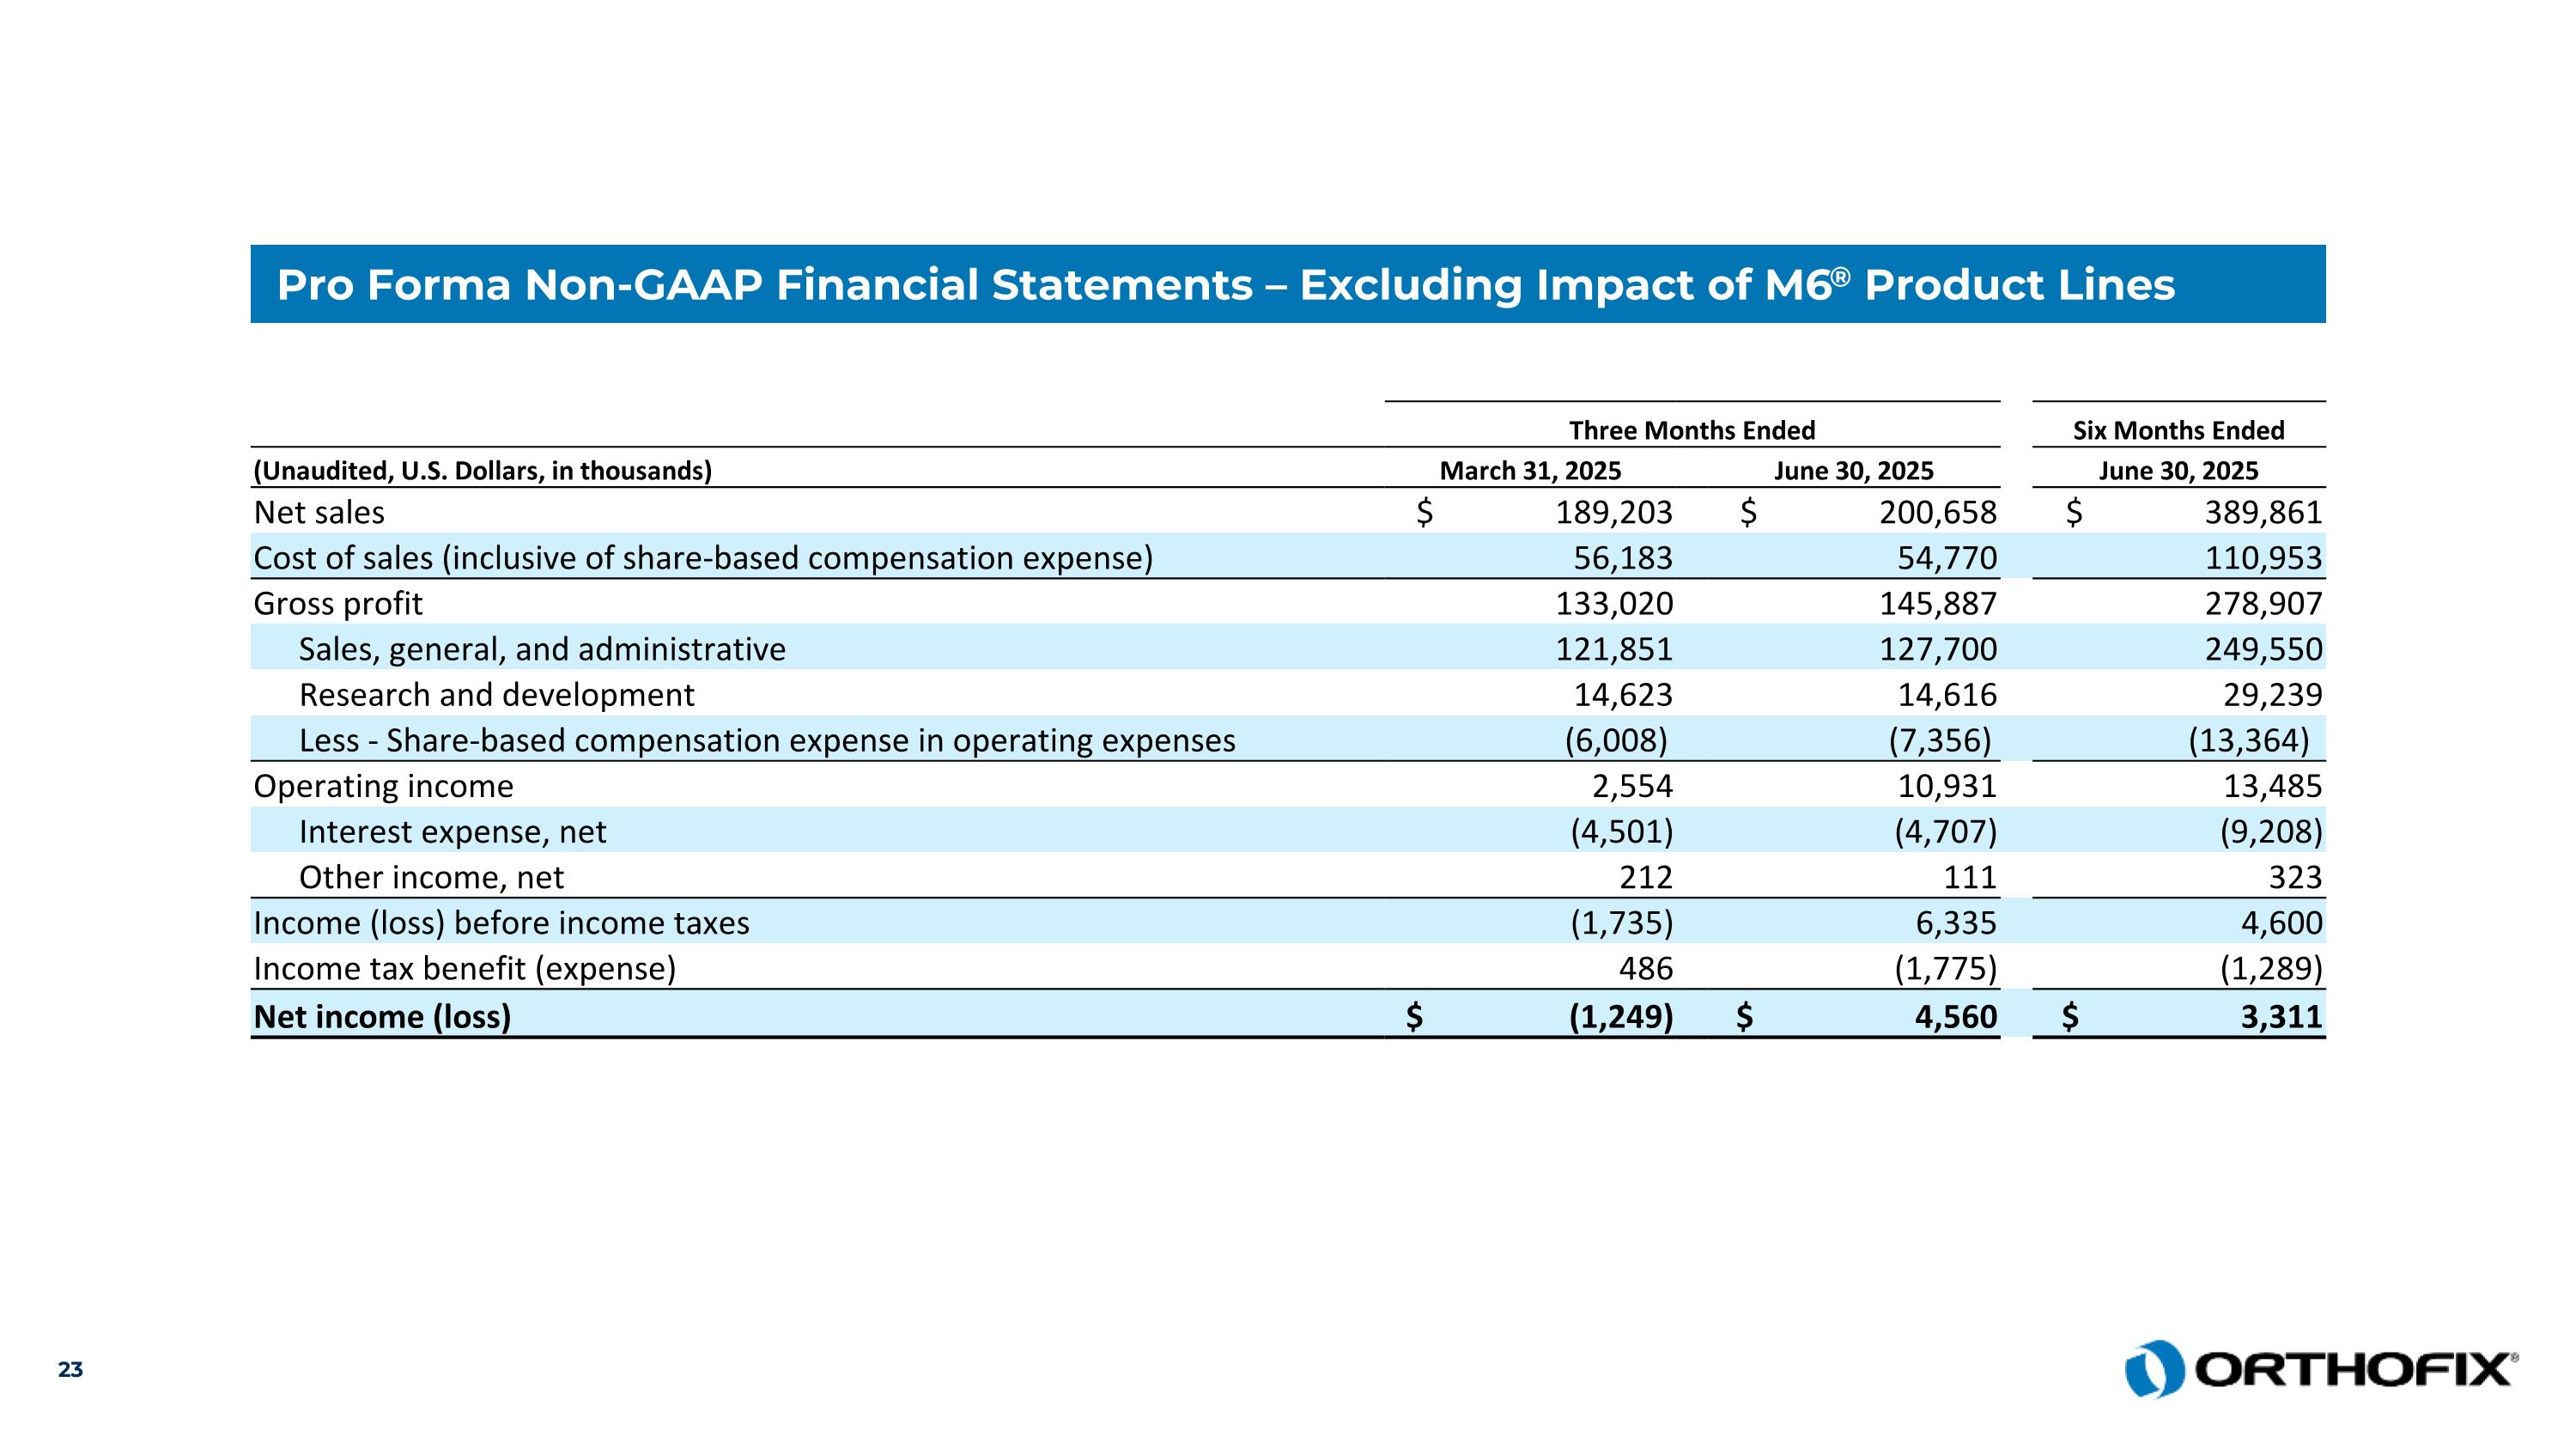
Pro Forma Non-GAAP Financial Statements – Excluding Impact of M6® Product Lines     Three Months Ended   Six Months Ended (Unaudited, U.S. Dollars, in thousands)   March 31, 2025   June 30, 2025   June 30, 2025 Net sales   $ 189,203   $ 200,658   $ 389,861 Cost of sales (inclusive of share-based compensation expense)   56,183   54,770   110,953 Gross profit   133,020   145,887   278,907 Sales, general, and administrative   121,851   127,700   249,550 Research and development   14,623   14,616   29,239 Less - Share-based compensation expense in operating expenses   (6,008)   (7,356)   (13,364) Operating income   2,554   10,931   13,485 Interest expense, net   (4,501)   (4,707)   (9,208) Other income, net   212   111   323 Income (loss) before income taxes   (1,735)   6,335   4,600 Income tax benefit (expense)   486   (1,775)   (1,289) Net income (loss)   $ (1,249)   $ 4,560   $ 3,311

Slide 24

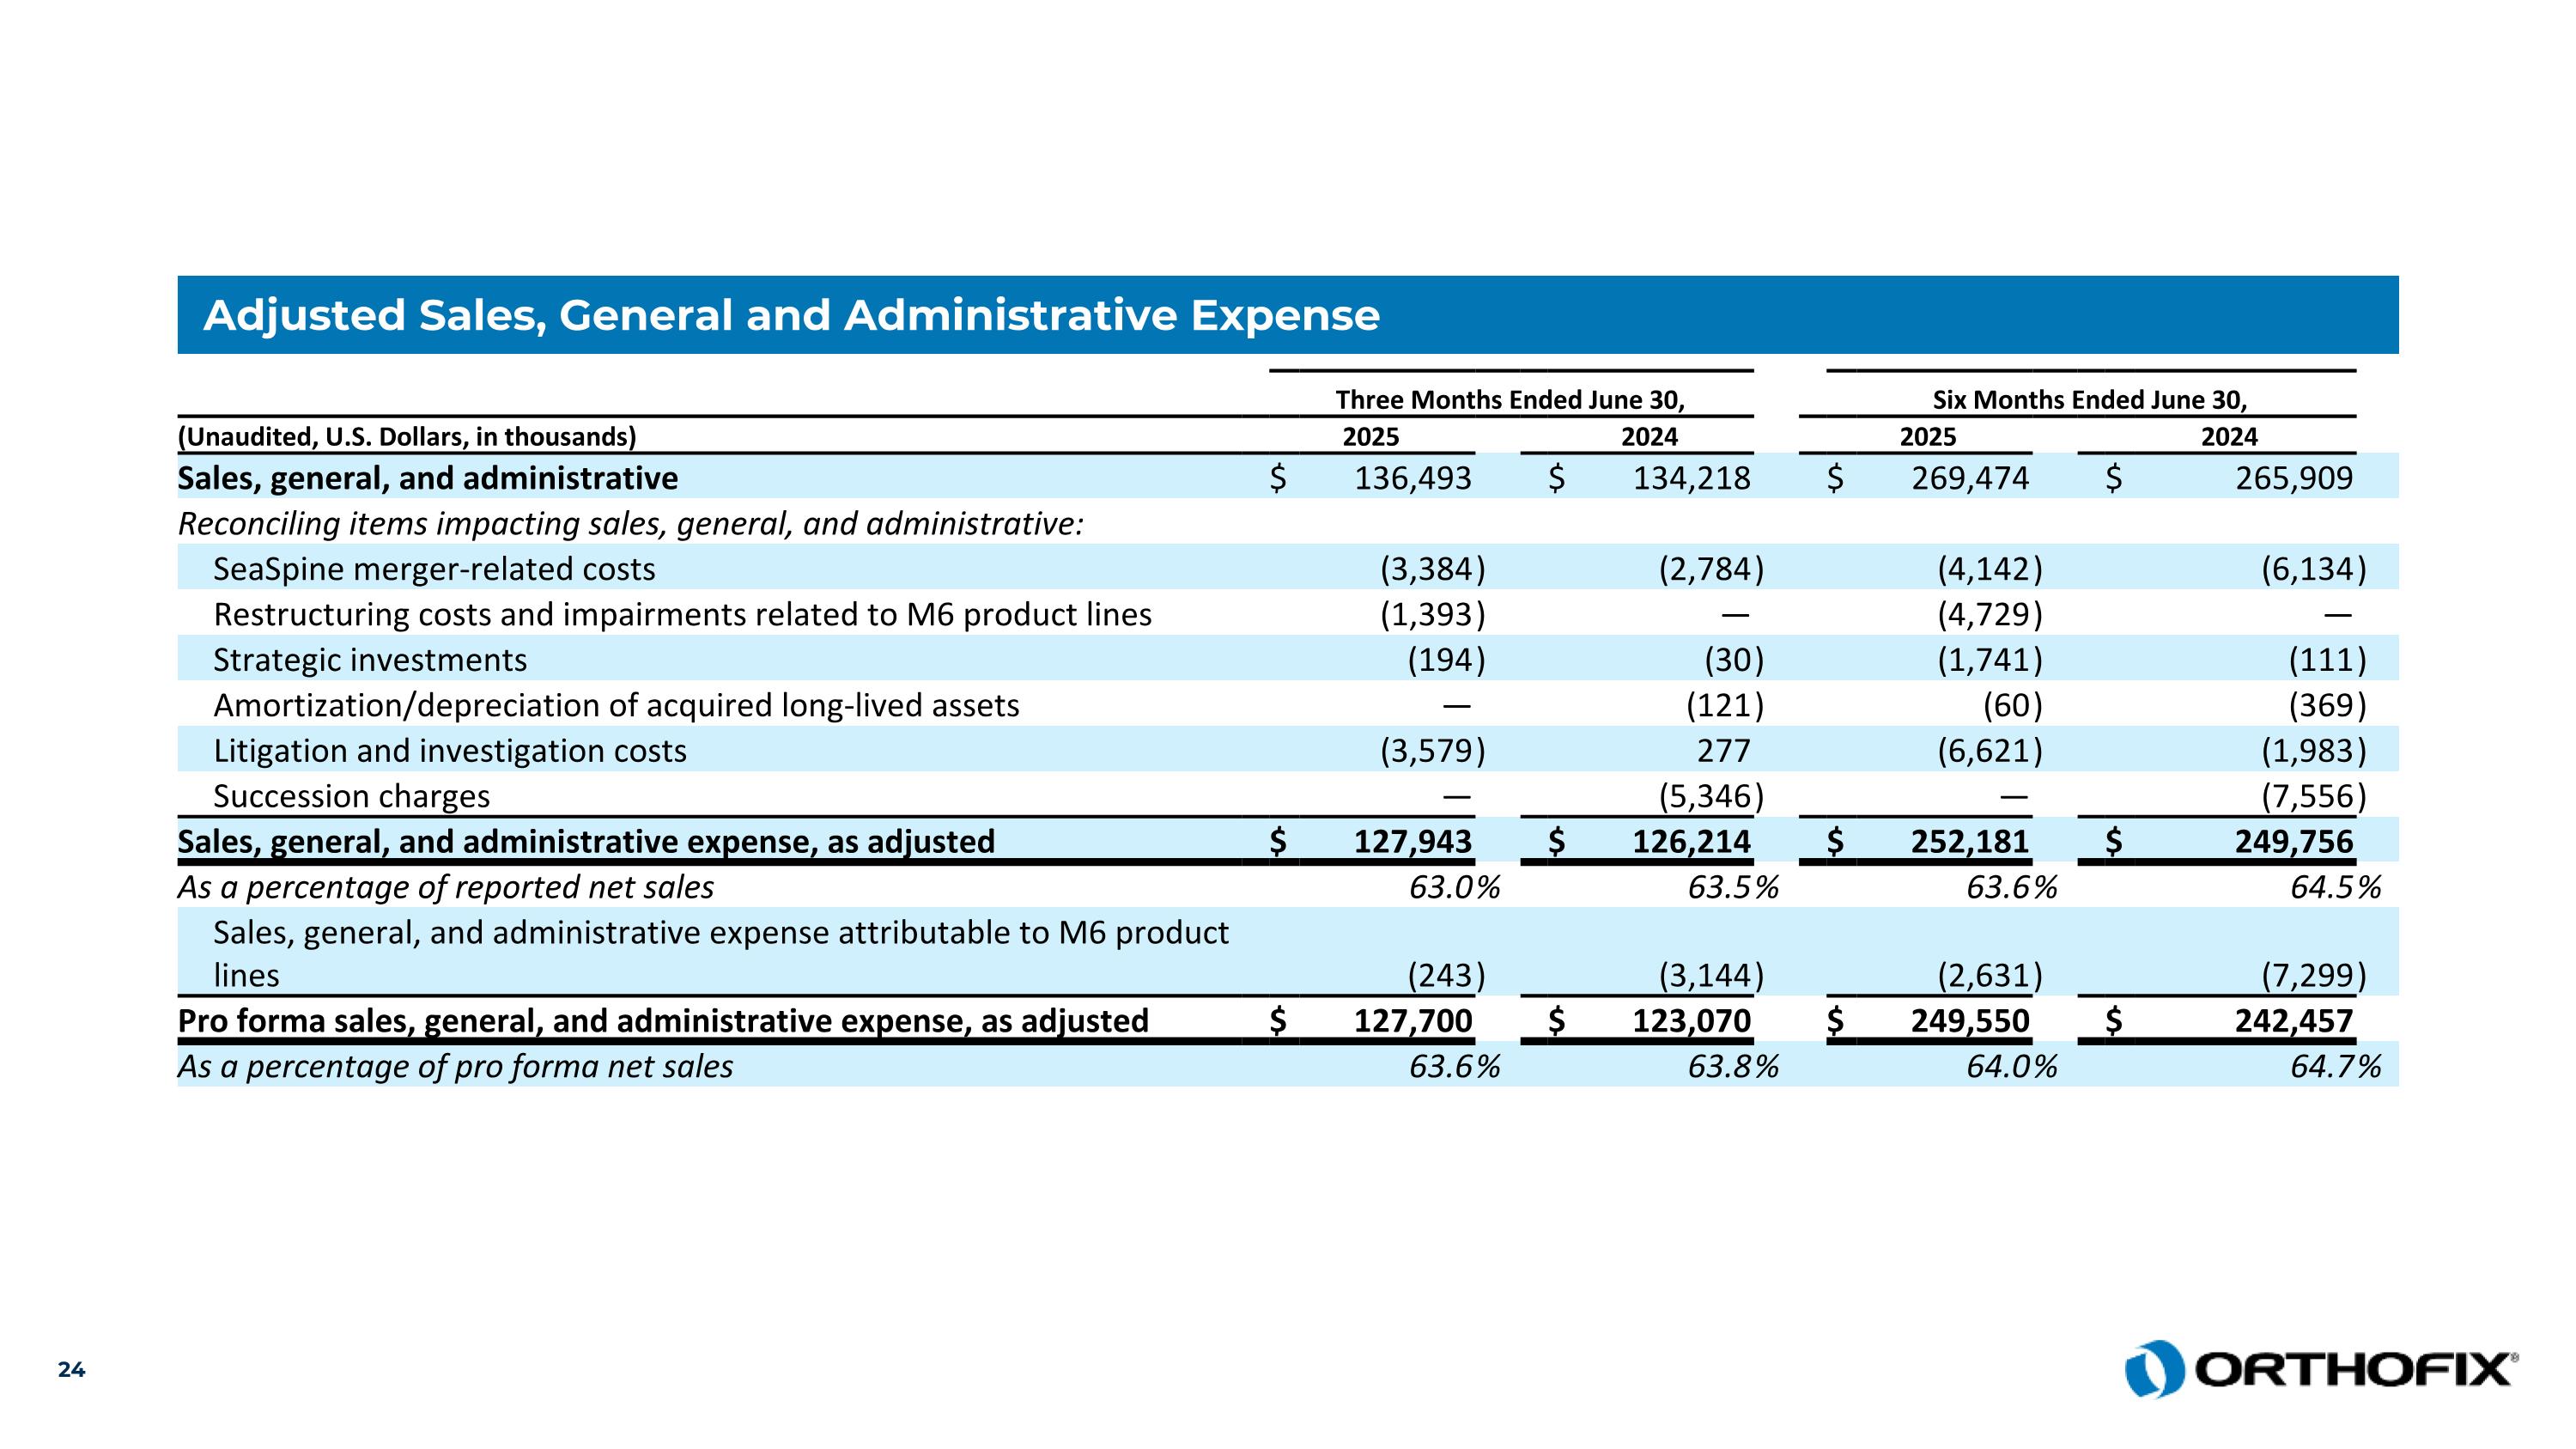
Adjusted Sales, General and Administrative Expense     Three Months Ended June 30,     Six Months Ended June 30,   (Unaudited, U.S. Dollars, in thousands)   2025     2024     2025     2024   Sales, general, and administrative   $ 136,493     $ 134,218     $ 269,474     $ 265,909   Reconciling items impacting sales, general, and administrative:                         SeaSpine merger-related costs     (3,384 )     (2,784 )     (4,142 )     (6,134 ) Restructuring costs and impairments related to M6 product lines     (1,393 )     —       (4,729 )     —   Strategic investments     (194 )     (30 )     (1,741 )     (111 ) Amortization/depreciation of acquired long-lived assets     —       (121 )     (60 )     (369 ) Litigation and investigation costs     (3,579 )     277       (6,621 )     (1,983 ) Succession charges     —       (5,346 )     —       (7,556 ) Sales, general, and administrative expense, as adjusted   $ 127,943     $ 126,214     $ 252,181     $ 249,756   As a percentage of reported net sales     63.0 %     63.5 %     63.6 %     64.5 % Sales, general, and administrative expense attributable to M6 product lines     (243 )     (3,144 )     (2,631 )     (7,299 ) Pro forma sales, general, and administrative expense, as adjusted   $ 127,700     $ 123,070     $ 249,550     $ 242,457   As a percentage of pro forma net sales     63.6 %     63.8 %     64.0 %     64.7 %

Slide 25

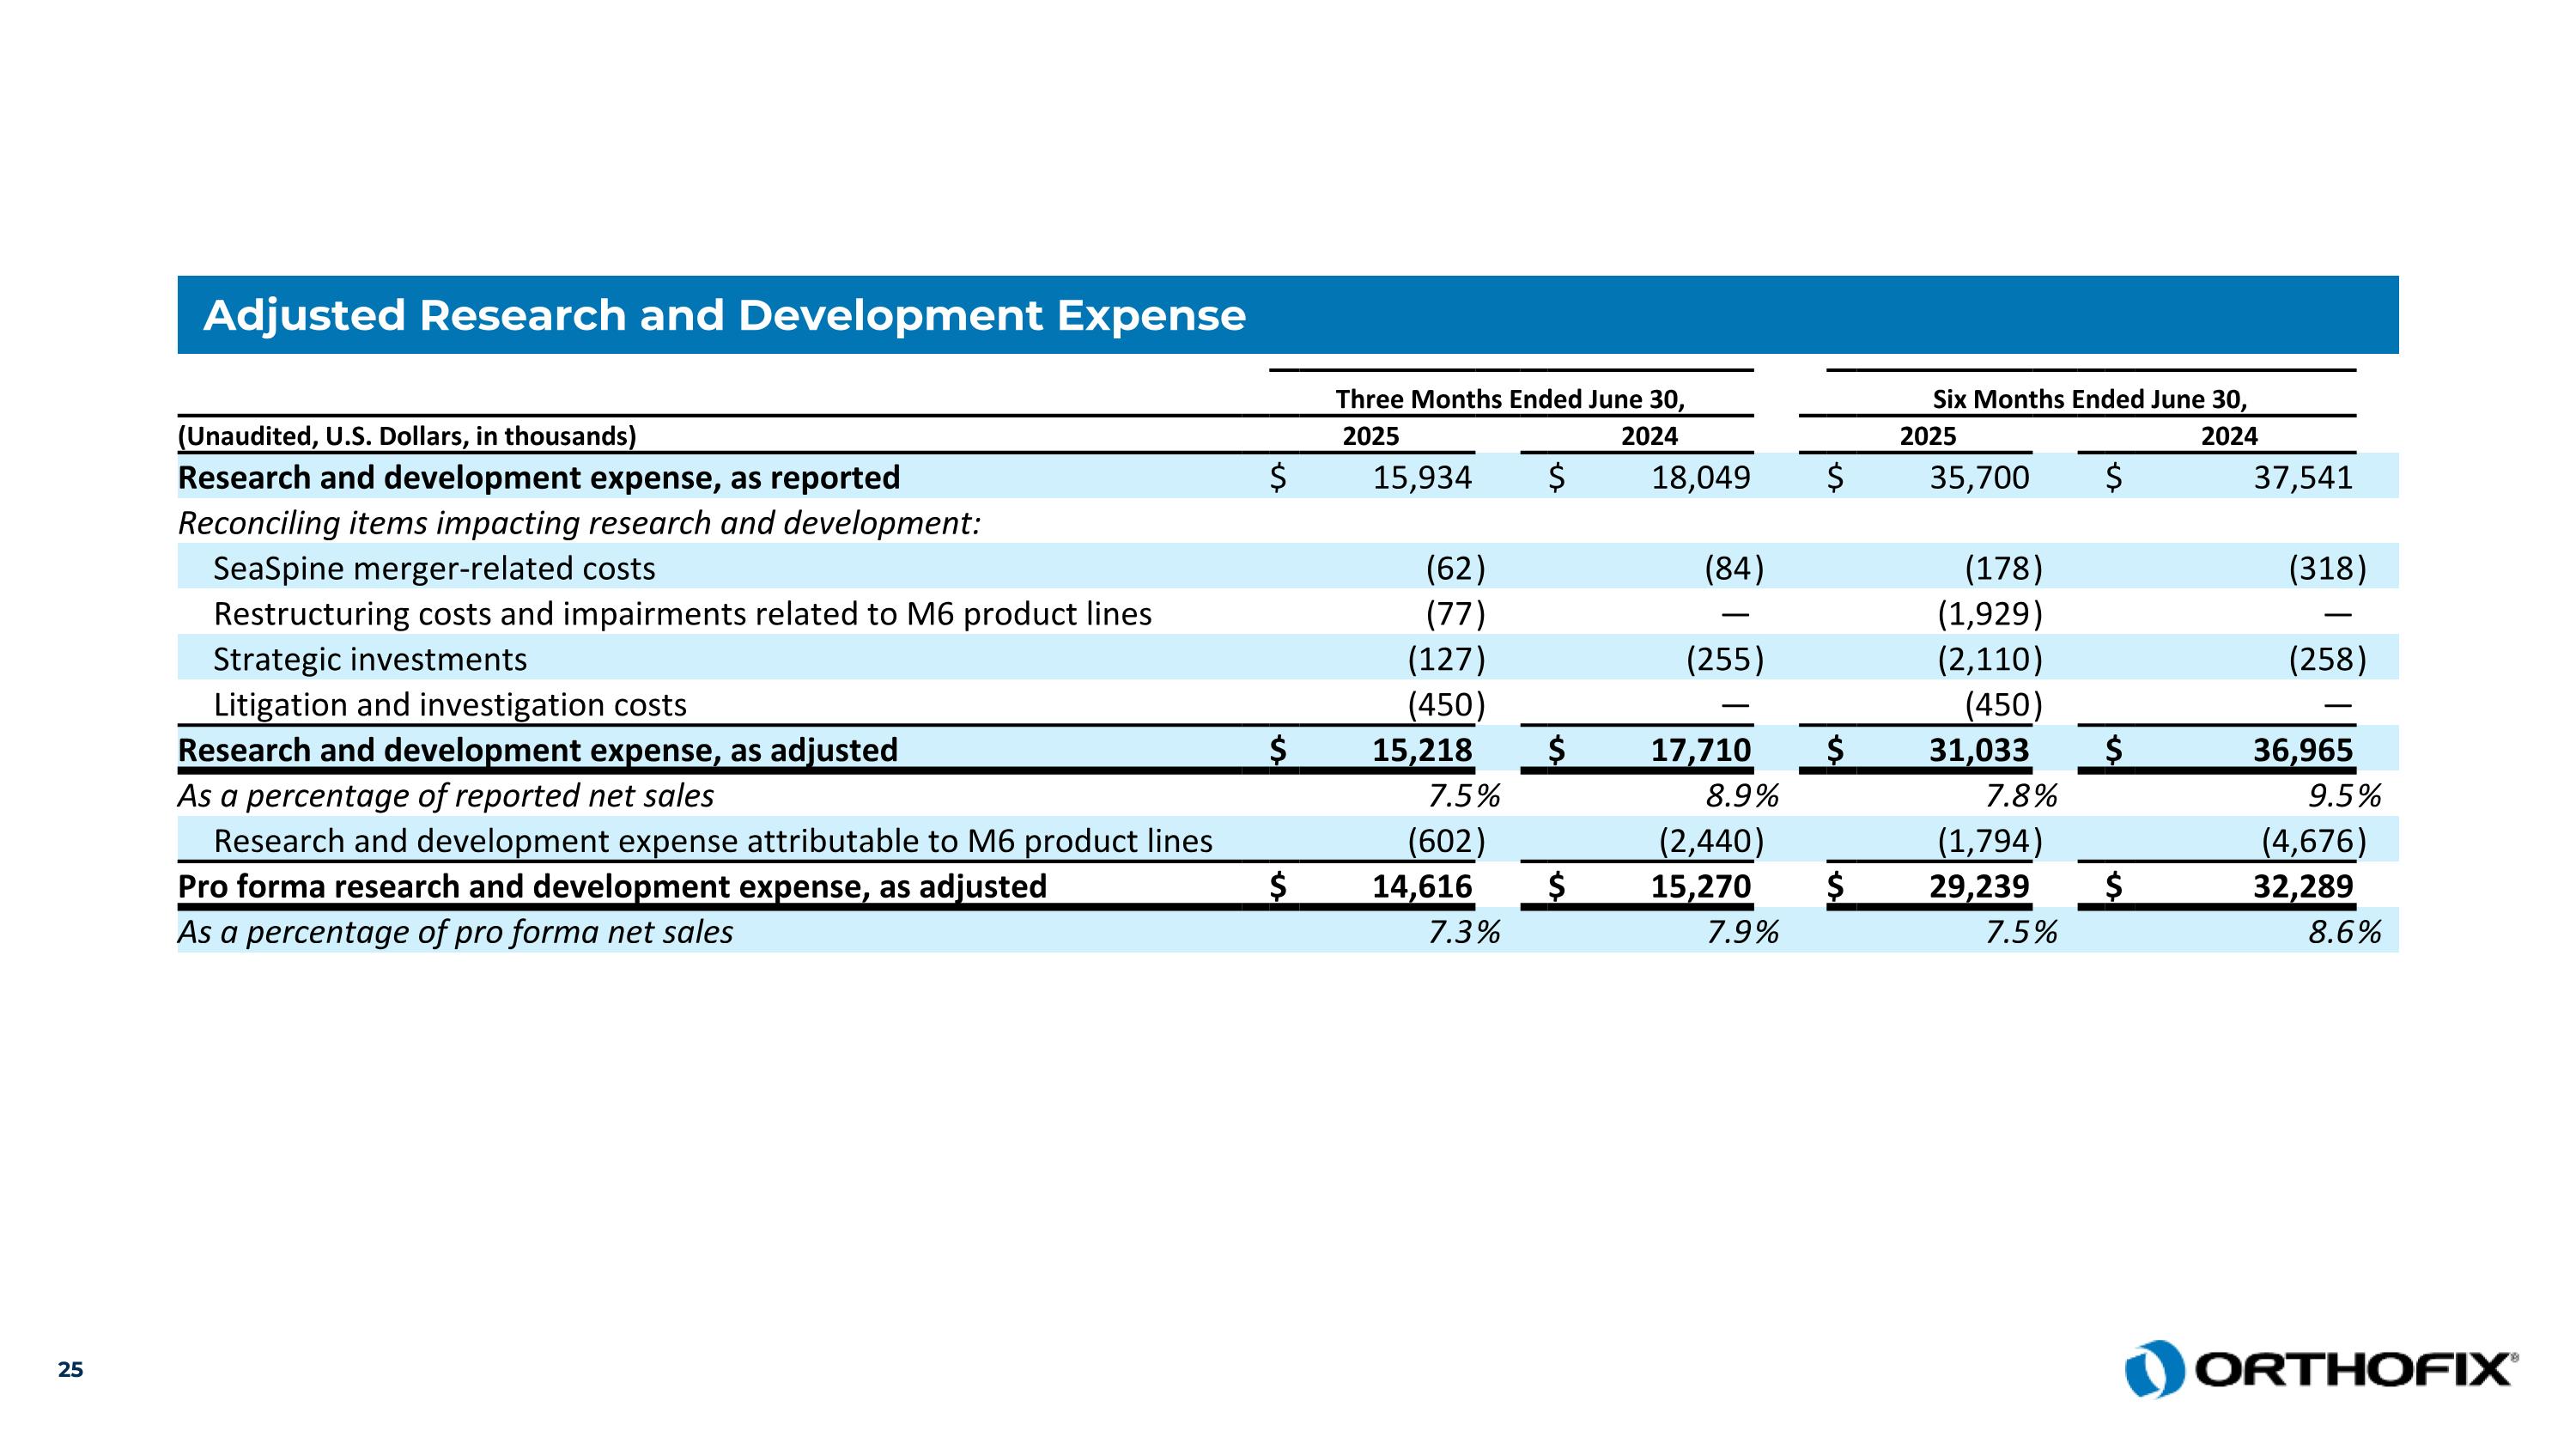
Adjusted Research and Development Expense     Three Months Ended June 30,     Six Months Ended June 30,   (Unaudited, U.S. Dollars, in thousands)   2025     2024     2025     2024   Research and development expense, as reported   $ 15,934     $ 18,049     $ 35,700     $ 37,541   Reconciling items impacting research and development:                         SeaSpine merger-related costs     (62 )     (84 )     (178 )     (318 ) Restructuring costs and impairments related to M6 product lines     (77 )     —       (1,929 )     —   Strategic investments     (127 )     (255 )     (2,110 )     (258 ) Litigation and investigation costs     (450 )     —       (450 )     —   Research and development expense, as adjusted   $ 15,218     $ 17,710     $ 31,033     $ 36,965   As a percentage of reported net sales     7.5 %     8.9 %     7.8 %     9.5 % Research and development expense attributable to M6 product lines     (602 )     (2,440 )     (1,794 )     (4,676 ) Pro forma research and development expense, as adjusted   $ 14,616     $ 15,270     $ 29,239     $ 32,289   As a percentage of pro forma net sales     7.3 %     7.9 %     7.5 %     8.6 %

Slide 26

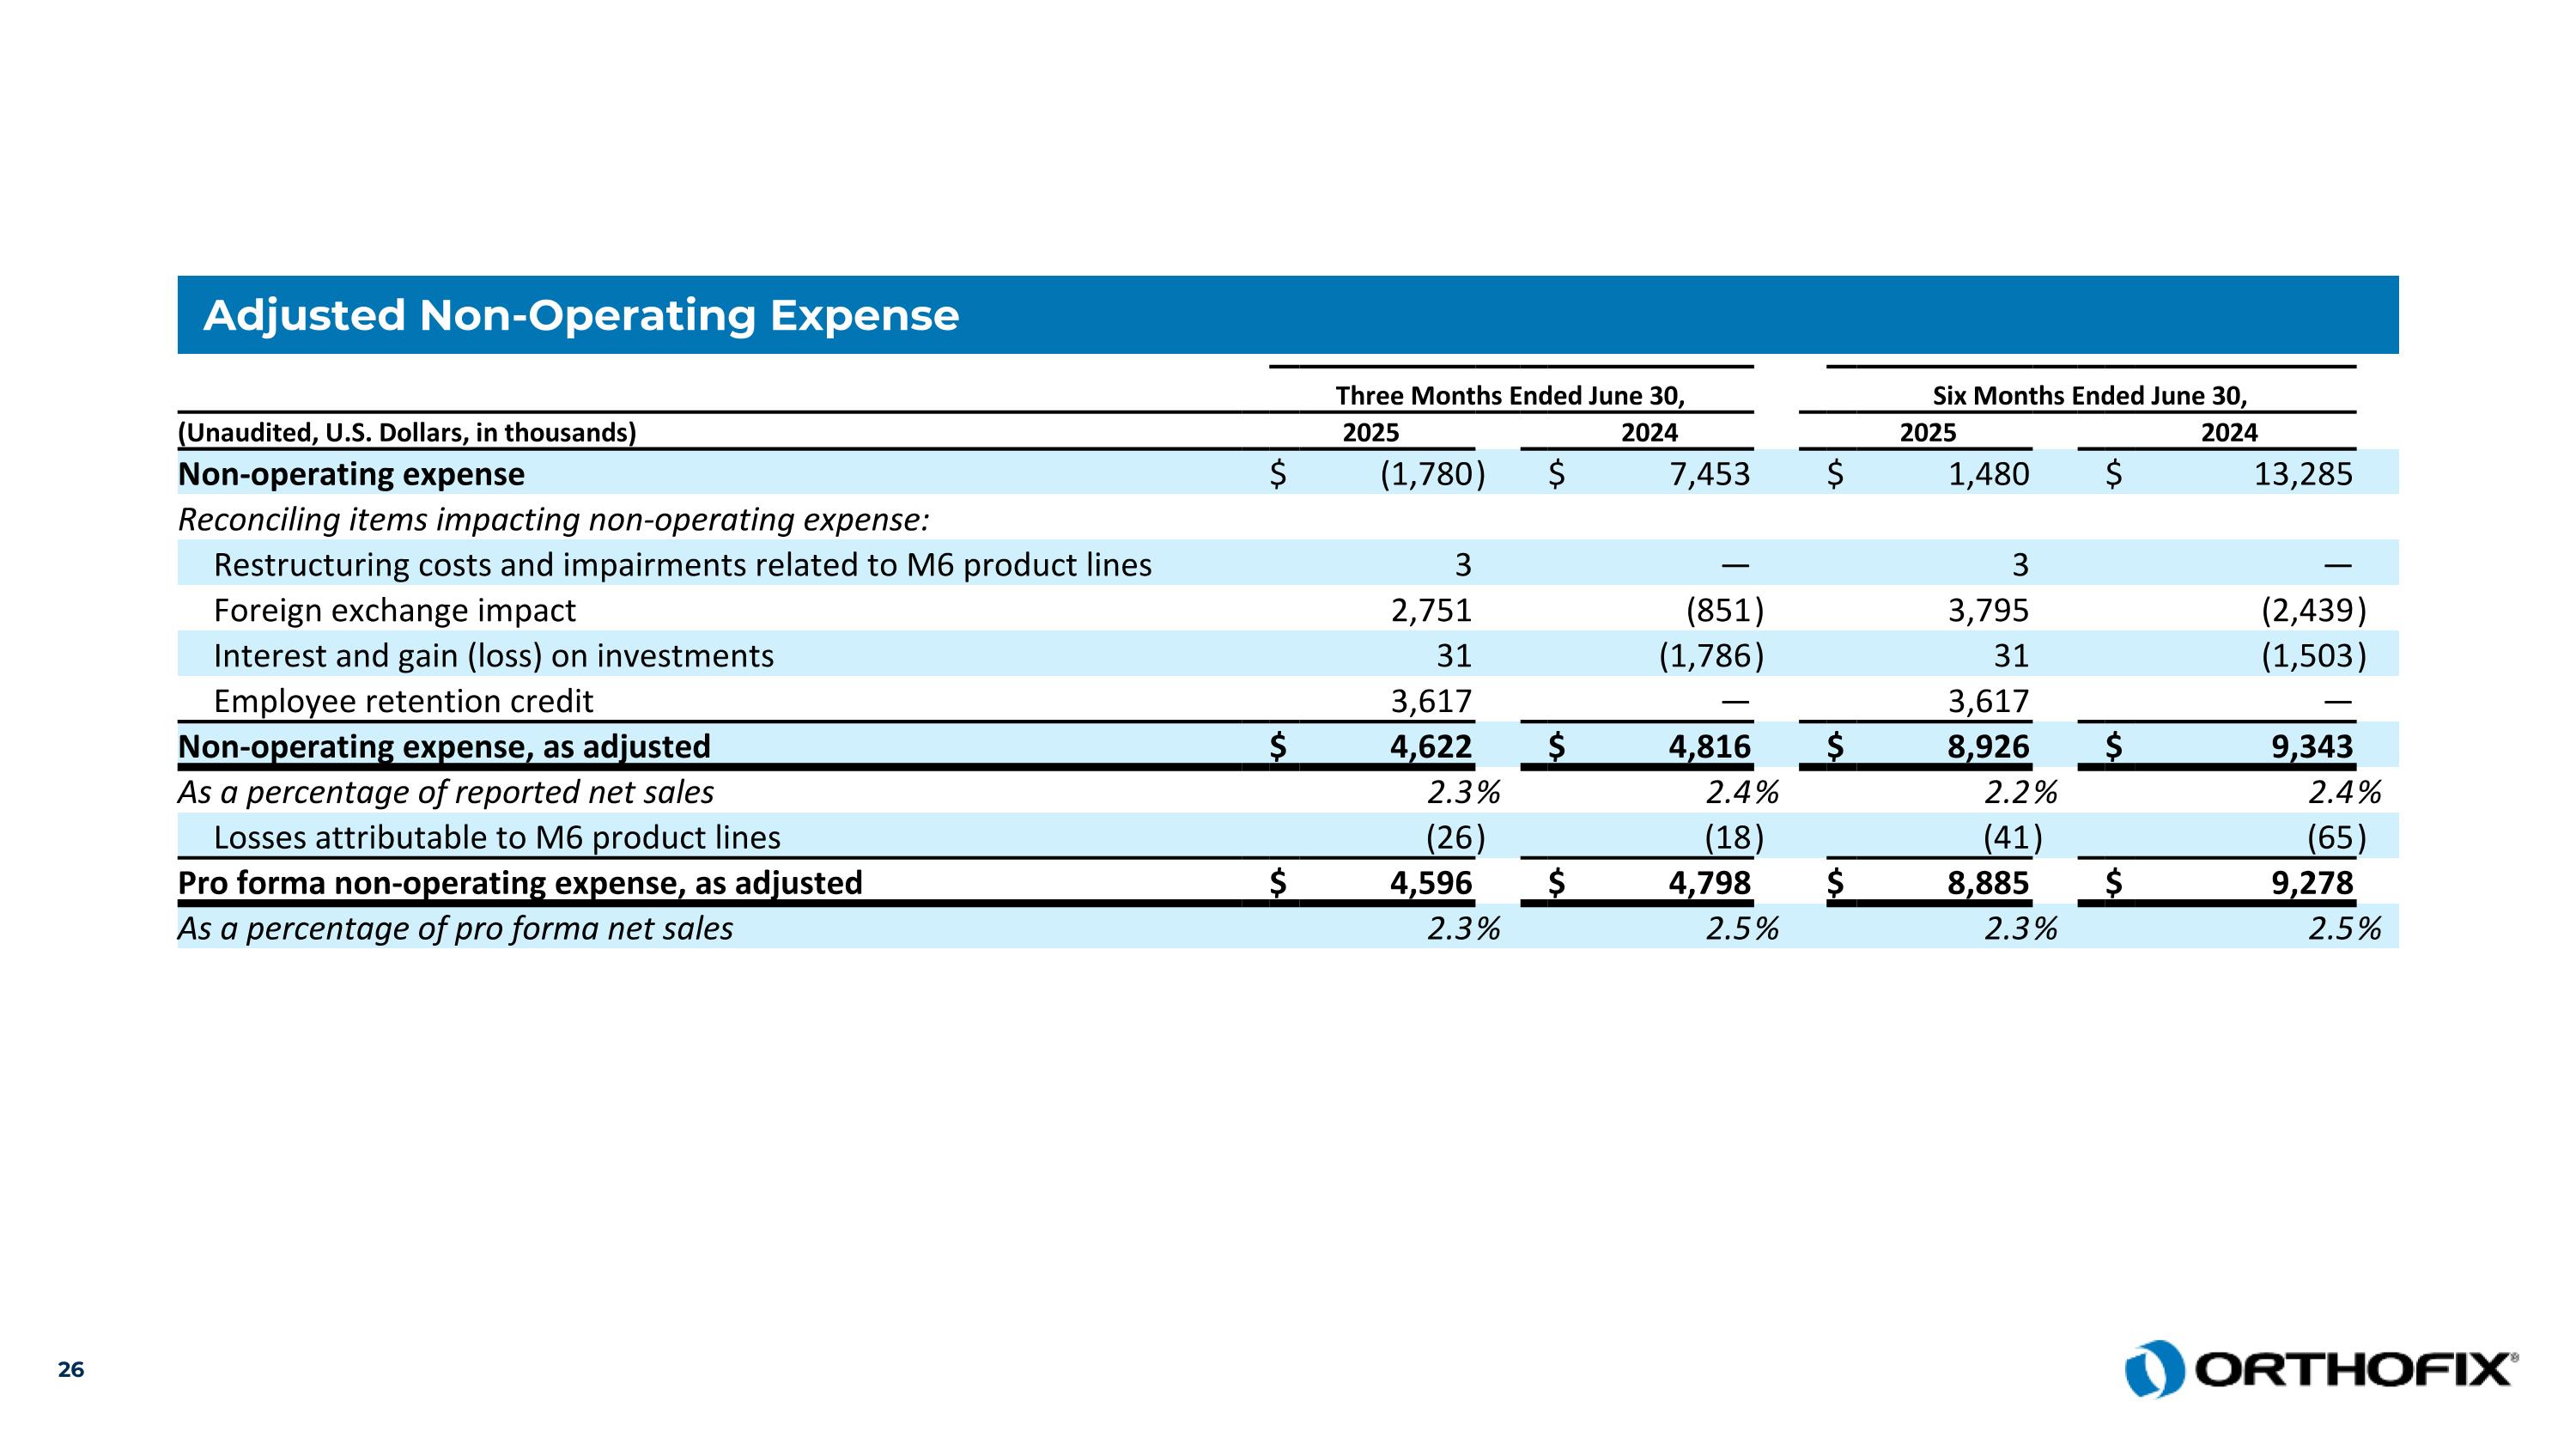
Adjusted Non-Operating Expense     Three Months Ended June 30,     Six Months Ended June 30,   (Unaudited, U.S. Dollars, in thousands)   2025     2024     2025     2024   Non-operating expense   $ (1,780 )   $ 7,453     $ 1,480     $ 13,285   Reconciling items impacting non-operating expense:                         Restructuring costs and impairments related to M6 product lines     3       —       3       —   Foreign exchange impact     2,751       (851 )     3,795       (2,439 ) Interest and gain (loss) on investments     31       (1,786 )     31       (1,503 ) Employee retention credit     3,617       —       3,617       —   Non-operating expense, as adjusted   $ 4,622     $ 4,816     $ 8,926     $ 9,343   As a percentage of reported net sales     2.3 %     2.4 %     2.2 %     2.4 % Losses attributable to M6 product lines     (26 )     (18 )     (41 )     (65 ) Pro forma non-operating expense, as adjusted   $ 4,596     $ 4,798     $ 8,885     $ 9,278   As a percentage of pro forma net sales     2.3 %     2.5 %     2.3 %     2.5 %

Slide 27

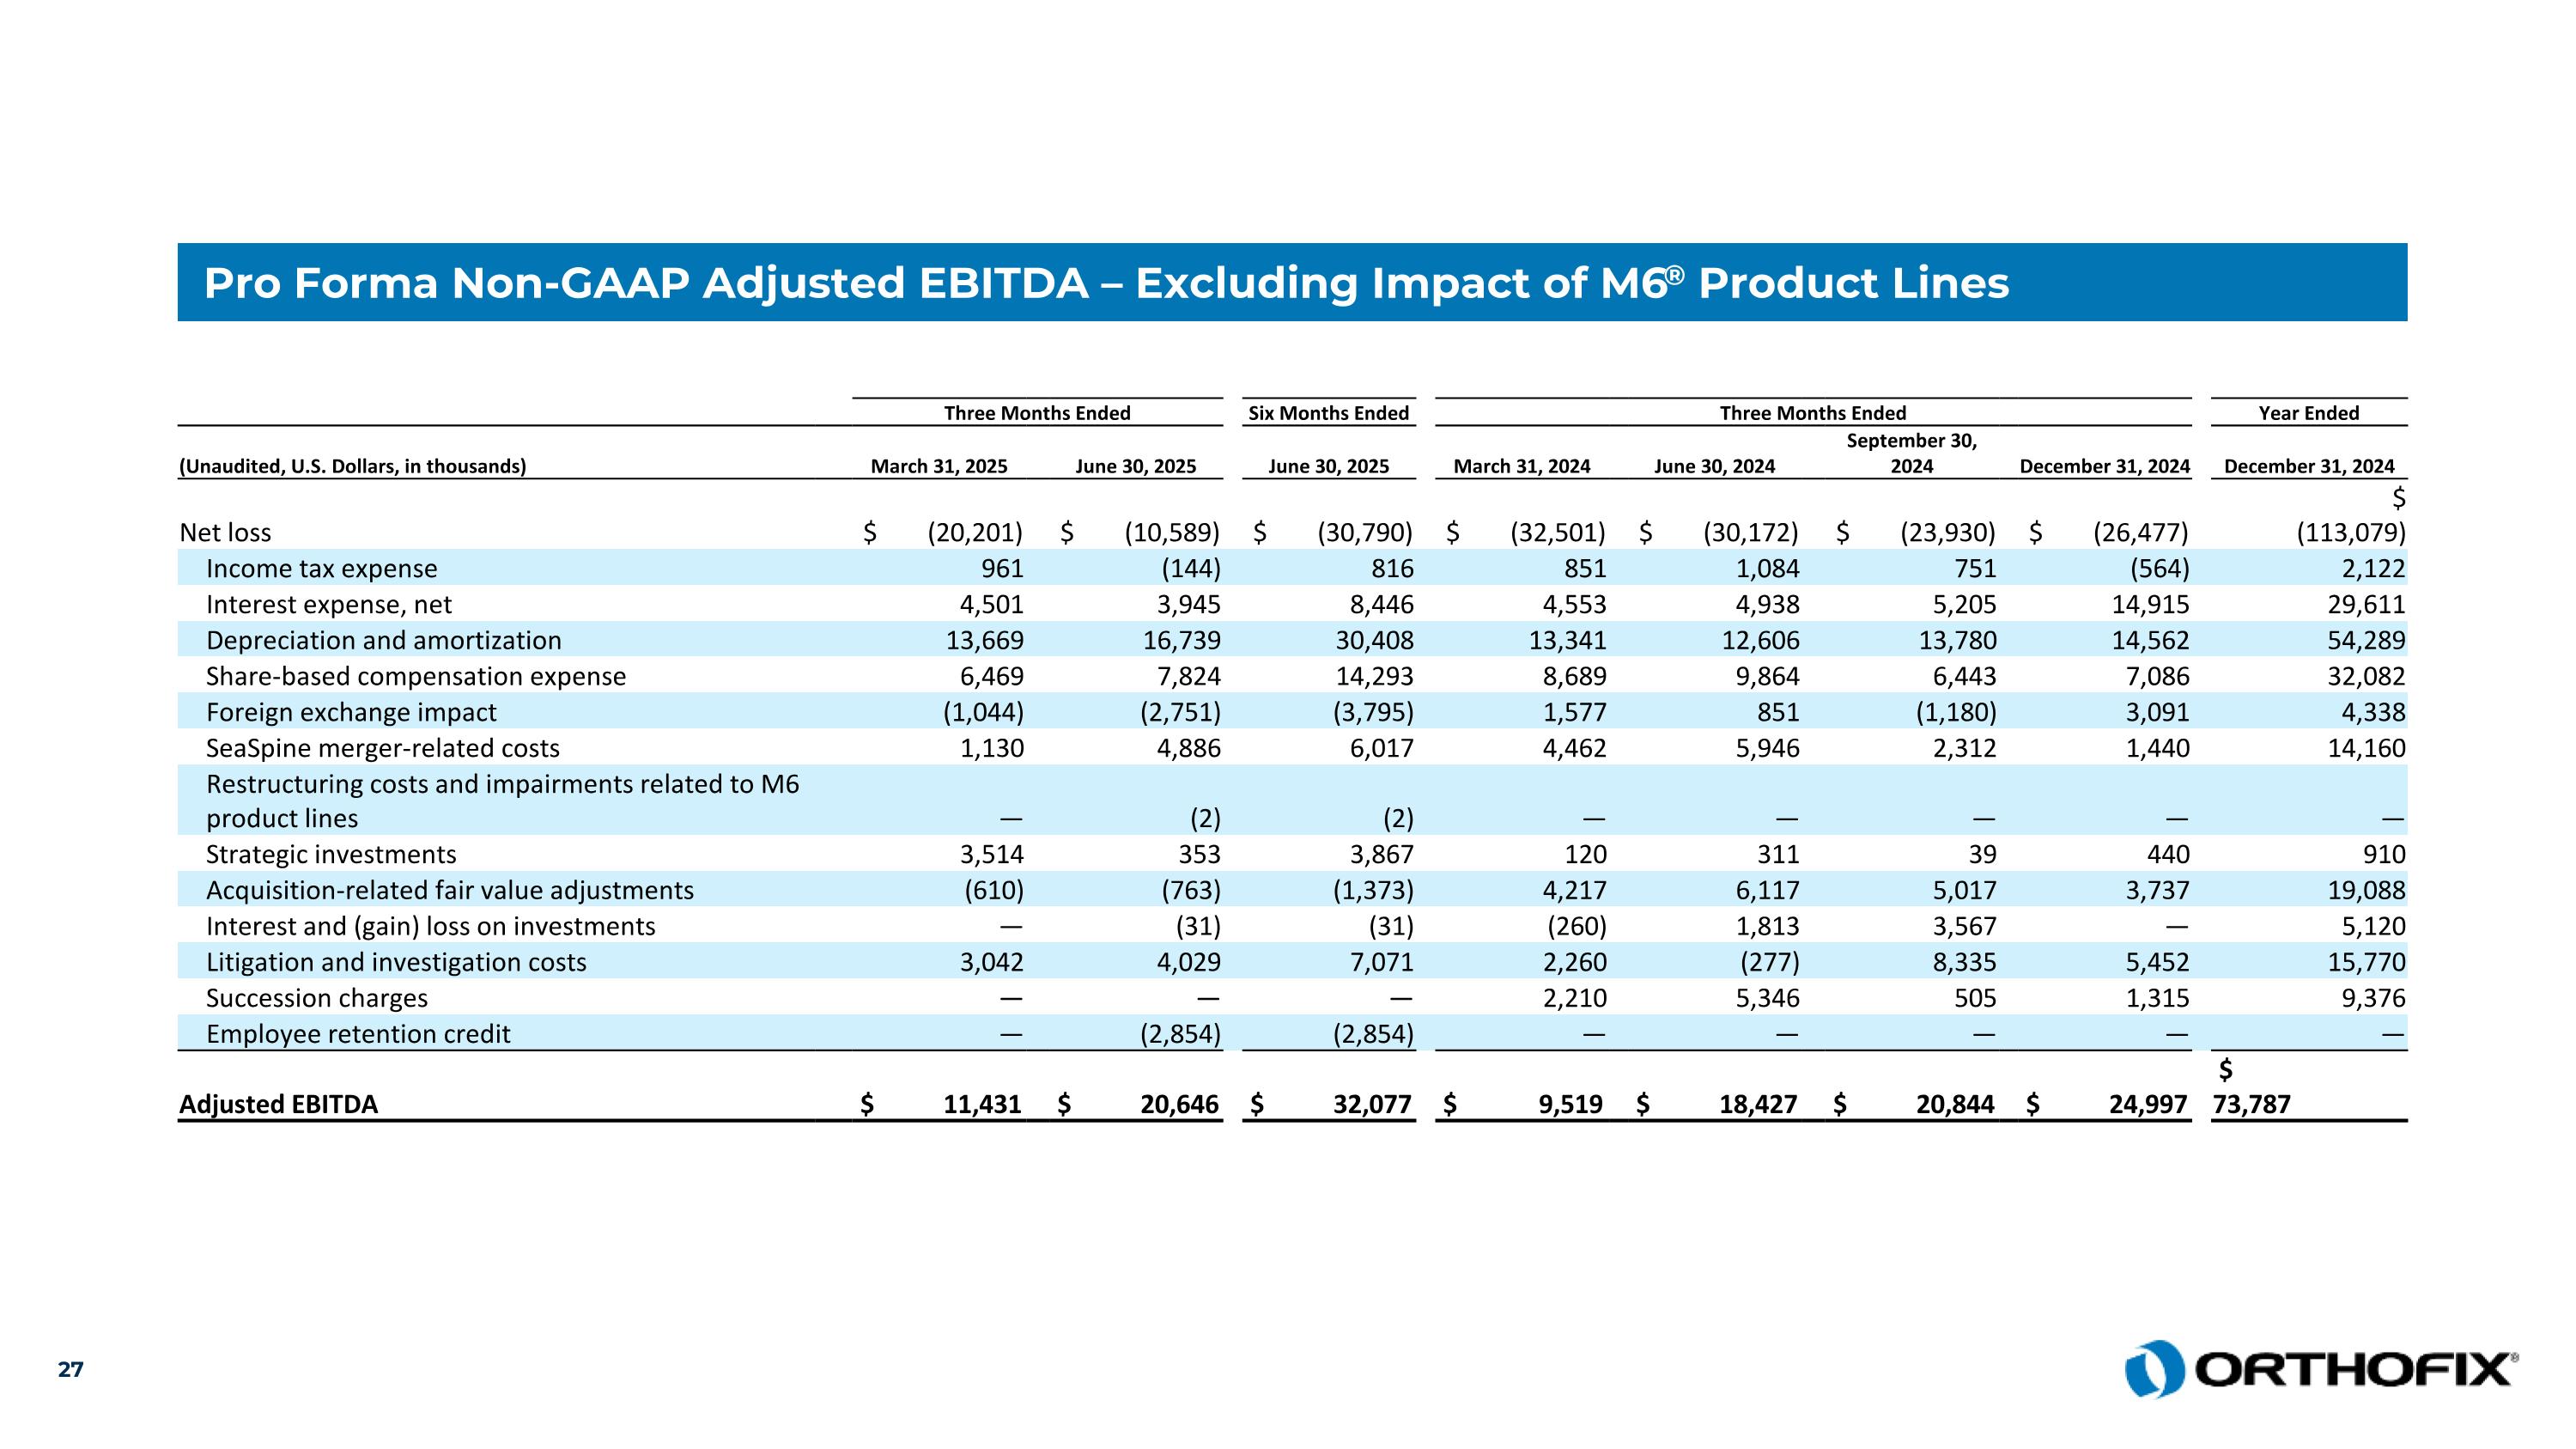
Pro Forma Non-GAAP Adjusted EBITDA – Excluding Impact of M6® Product Lines     Three Months Ended   Six Months Ended   Three Months Ended   Year Ended (Unaudited, U.S. Dollars, in thousands)   March 31, 2025   June 30, 2025   June 30, 2025   March 31, 2024   June 30, 2024   September 30, 2024   December 31, 2024   December 31, 2024 Net loss   $ (20,201)   $ (10,589)   $ (30,790)   $ (32,501)   $ (30,172)   $ (23,930)   $ (26,477)   $ (113,079) Income tax expense   961   (144)   816   851   1,084   751   (564)   2,122 Interest expense, net   4,501   3,945   8,446   4,553   4,938   5,205   14,915   29,611 Depreciation and amortization   13,669   16,739   30,408   13,341   12,606   13,780   14,562   54,289 Share-based compensation expense   6,469   7,824   14,293   8,689   9,864   6,443   7,086   32,082 Foreign exchange impact   (1,044)   (2,751)   (3,795)   1,577   851   (1,180)   3,091   4,338 SeaSpine merger-related costs   1,130   4,886   6,017   4,462   5,946   2,312   1,440   14,160 Restructuring costs and impairments related to M6 product lines   —   (2)   (2)   —   —   —   —   — Strategic investments   3,514   353   3,867   120   311   39   440   910 Acquisition-related fair value adjustments   (610)   (763)   (1,373)   4,217   6,117   5,017   3,737   19,088 Interest and (gain) loss on investments   —   (31)   (31)   (260)   1,813   3,567   —   5,120 Litigation and investigation costs   3,042   4,029   7,071   2,260   (277)   8,335   5,452   15,770 Succession charges   —   —   —   2,210   5,346   505   1,315   9,376 Employee retention credit   —   (2,854)   (2,854)   —   —   —   —   — Adjusted EBITDA   $ 11,431   $ 20,646   $ 32,077   $ 9,519   $ 18,427   $ 20,844   $ 24,997   $ 73,787

Slide 28

Pro Forma Non-GAAP Adjusted Net Loss and Adjusted Gross Margin – Excluding Impact of M6® Product Lines     Three Months Ended   Six Months Ended   Three Months Ended   Year Ended (Unaudited, U.S. Dollars, in thousands)   March 31, 2025   June 30, 2025   June 30, 2025   March 31, 2024   June 30, 2024   September 30, 2024   December 31, 2024   December 31, 2024 Net loss   $ (20,201)   $ (10,589)   $ (30,790)   $ (32,501)   $ (30,172)   $ (23,930)   $ (26,477)   $ (113,079) Share-based compensation expense   6,469   7,824   14,293   8,689   9,864   6,443   7,086   32,082 Foreign exchange impact   (1,044)   (2,751)   (3,795)   1,577   851   (1,180)   3,090   4,338 SeaSpine merger-related costs   1,474   7,786   9,260   4,831   6,016   2,315   4,396   17,558 Restructuring costs and impairments related to M6 product lines   20,324   604   20,928   —   —   —   —   — Strategic investments   3,543   364   3,907   126   371   69   470   1,036 Acquisition-related fair value adjustments   (610)   (761)   (1,371)   4,217   6,117   5,017   3,737   19,088 Amortization/depreciation of acquired long-lived assets   (15,693)   3,615   (12,078)   3,812   3,668   4,066   3,857   15,403 Litigation and investigation costs   3,042   4,029   7,071   2,260   (277)   8,335   5,452   15,770 Succession charges   —   —   —   2,210   5,346   505   1,315   9,376 Interest and (gain) loss on investments   —   (31)   (31)   (260)   1,764   3,567   —   5,070 Employee retention credit   —   (3,616)   (3,616)   —   —   —   —   — Long-term income tax rate adjustment   1,447   (1,915)   (467)   2,024   (213)   (918)   (1,225)   (332) Adjusted net loss   $ (1,249)   $ 4,560   $ 3,311   $ (3,015)   $ 3,335   $ 4,289   $ 1,701   $ 6,310     Three Months Ended   Six Months Ended   Three Months Ended   Year Ended (Unaudited, U.S. Dollars, in thousands)   March 31, 2025   June 30, 2025   June 30, 2025   March 31, 2024   June 30, 2024   September 30, 2024   December 31, 2024   December 31, 2024 Gross profit   $ 131,633   $ 140,683   $ 272,316   $ 124,360   $ 131,819   $ 132,862   $ 145,563   $ 534,604 Share-Based Compensation Expense   462   467   929   524   484   545   468   2,021 SeaSpine Merger-Related Costs   600   4,341   4,941   1,303   3,115   963   631   6,012 Restructuring costs and impairments related to M6 product lines   (1)   1   —   —   —   —   —   — Strategic investments   13   43   56   65   63   32   32   192 Acquisition-related fair value adjustments   —   —   —   3,047   3,047   3,047   3,047   12,188 Amortization/depreciation of acquired long-lived assets   313   351   664   318   209   313   313   1,153 Adjusted gross profit   $ 133,020   $ 145,887   $ 278,907   $ 129,617   $ 138,738   $ 137,762   $ 150,054   $ 556,170 Adjusted gross margin as a percentage of net sales   70.3%   72.7%   71.5%   71.2%   72.0%   72.0%   71.5%   71.7%