Exhibit 99.1

| Media Contacts: | Karissa Peer | Investor Contacts: | Jennifer Halchak |
|
(614) 314-8094
Kate Vossen (732) 675-8448 |
(201) 275-2711
Edward Barger (267) 614-4669 |
Organon reports results for the fourth quarter and full year ended December 31, 2021
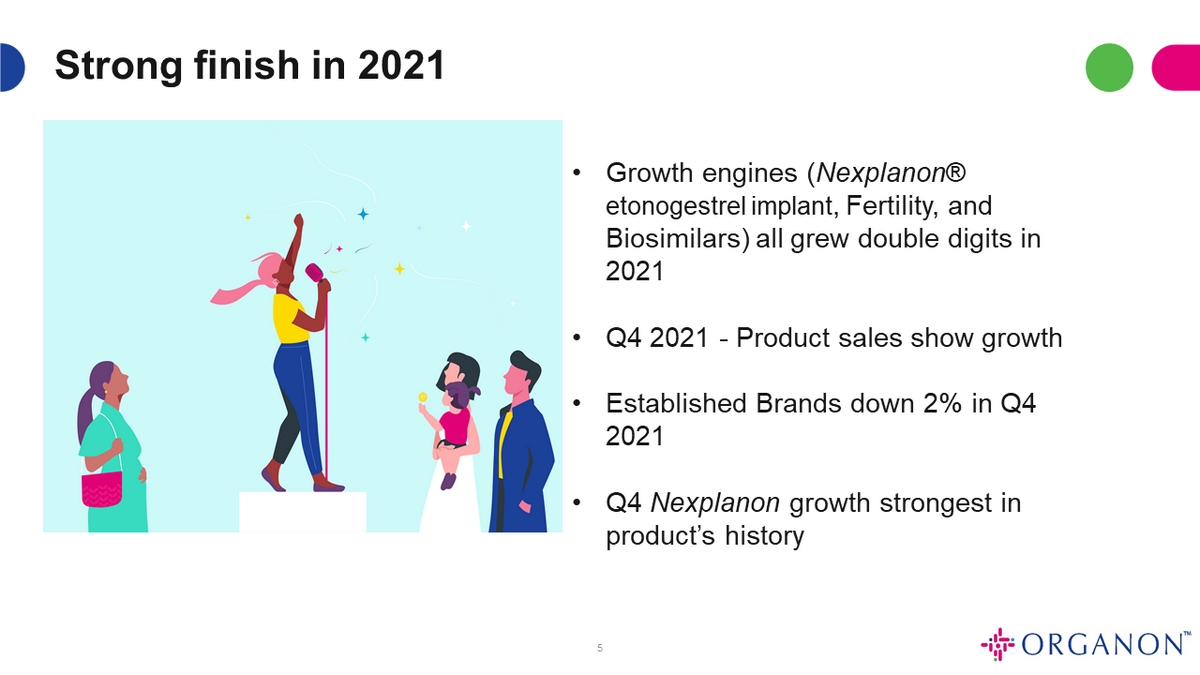
Nexplanon®(etonogestrel implant), fertility, biosimilars grew double digits for full year
| • | Full year 2021 revenue of $6.3 billion |
| • | Income from continuing operations before tax of $1.5 billion for full year 2021 |
| • | Full year Adjusted EBITDA of $2.4 billion |
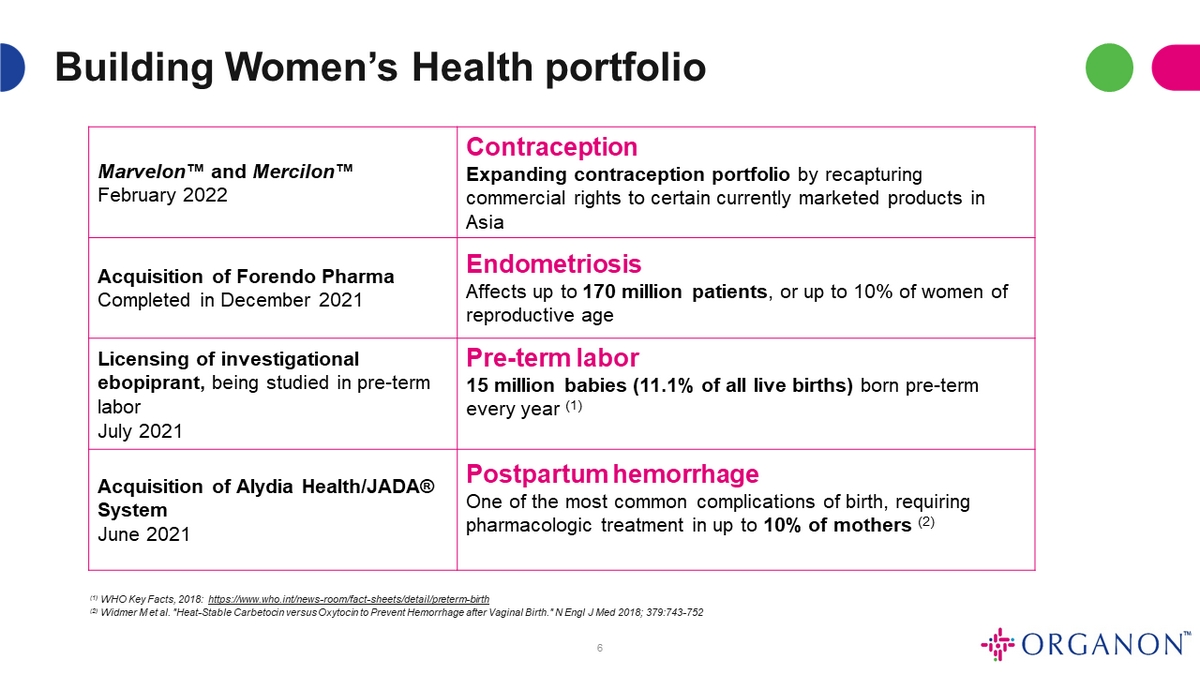
| • | Company executing on business development; four transactions since spin |
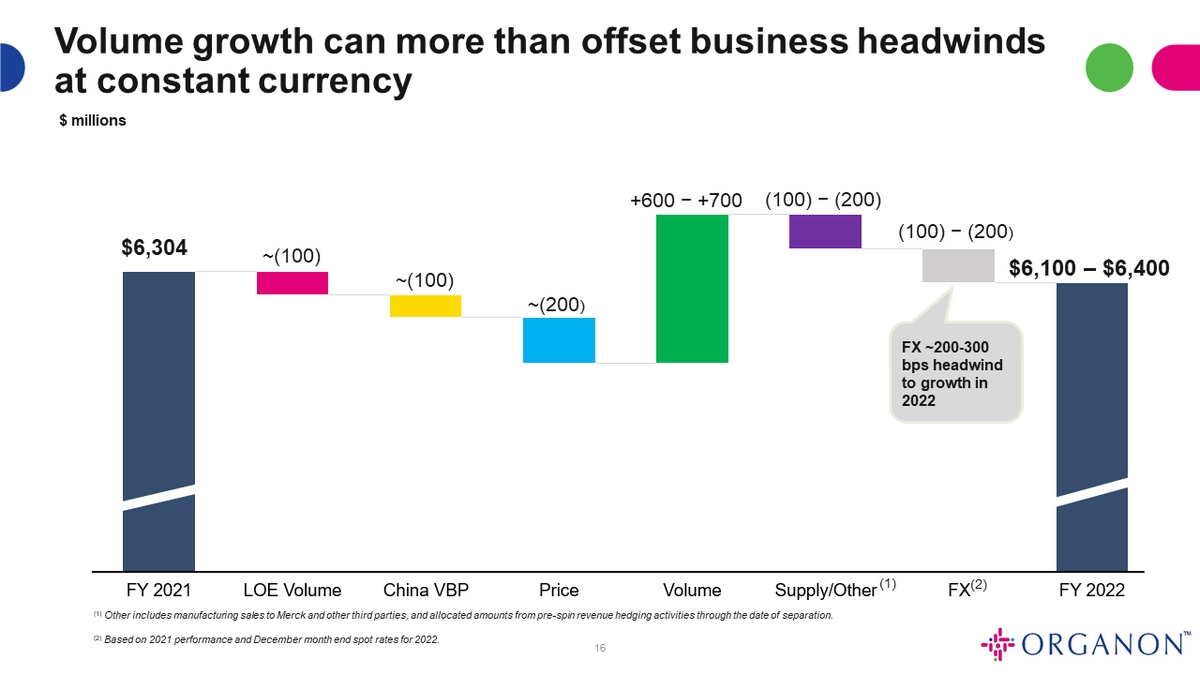
| • | Full year 2022 financial guidance provided; revenue range of $6.1 billion to $6.4 billion and Adjusted EBITDA margins in the range of 34%-36% |
Jersey City, N.J., February 17, 2022 – Organon (NYSE: OGN) today announced its results for the fourth quarter and full year ended December 31, 2021.
Organon also announced that its Board of Directors declared a quarterly dividend of $0.28 for each issued and outstanding share of the company's common stock. The dividend is payable on March 17, 2022 to stockholders of record at the close of business on February 28, 2022.
"In 2021 we delivered on our financial objectives across the board. Organon has taken significant steps to advance our vision to become a leader in women’s health through meaningful business development that addresses areas of significant unmet need for women and society," said Kevin Ali, Organon's CEO. "We continue to balance our growth objectives against our commitment to lower leverage, and in the fourth quarter we repaid $100 million of our term loans. Overall, we are well positioned as we head into 2022."
Fourth quarter 2021 revenue
| in $ millions | Q4 2021 | Q4 2020 | VPY | VPY ex-FX | ||||||||||||
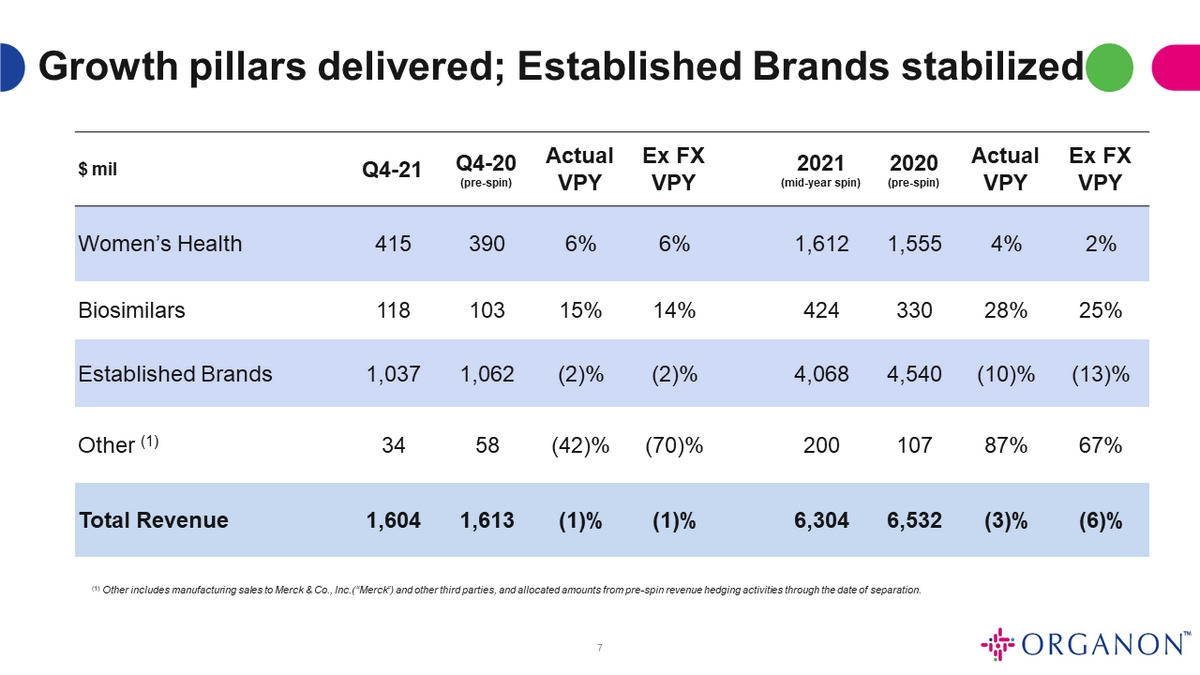
| Women’s Health | $ | 415 | $ | 390 | 6 | % | 6 | % | ||||||||
| Biosimilars | 118 | 103 | 15 | % | 14 | % | ||||||||||
| Established Brands | 1,037 | 1,062 | (2 | )% | (2 | )% | ||||||||||
| Other(1) | 34 | 58 | (42 | )% | (70 | )% | ||||||||||
| Revenue | $ | 1,604 | $ | 1,613 | (1 | )% | (1 | )% | ||||||||
(1) Other includes manufacturing sales to Merck & Co., Inc.(“Merck”) and other third parties, and allocated amounts from pre-spin revenue hedging activities through the date of separation.
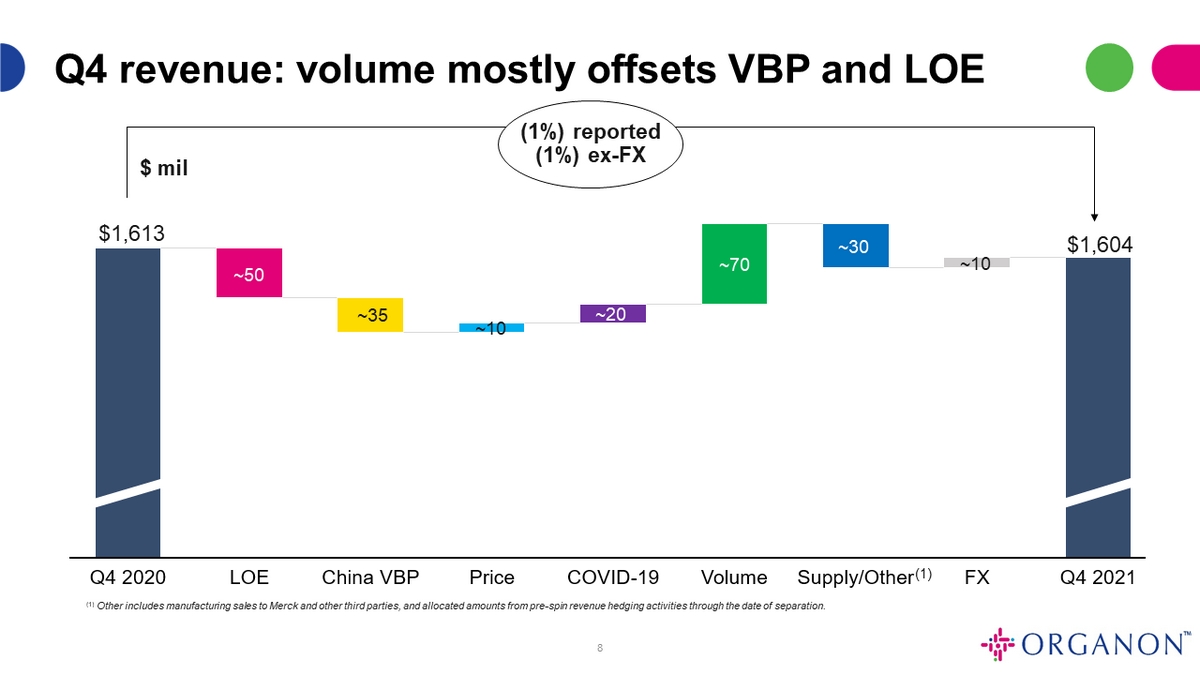
Total net revenue was $1,604 million for the fourth quarter of 2021, a decrease of 1%, both as-reported and excluding the impacts of foreign currency (ex-FX), compared with fourth quarter of 2020. Strong sales for Nexplanon, together with growth in biosimilars were offset by declines in Established Brands and supply sales to Merck and other third parties.
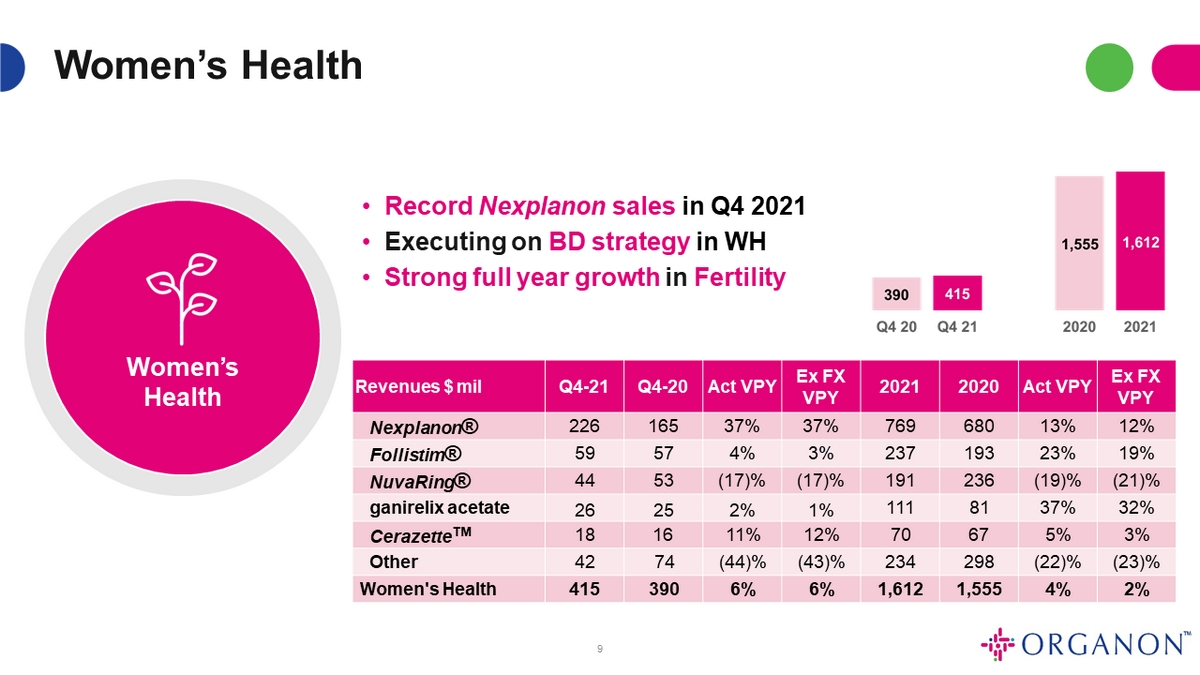
Women’s Health increased 6% both as-reported and ex-FX in the fourth quarter 2021 compared with the fourth quarter of 2020 driven primarily by Nexplanon, which increased 37% ex-FX in the fourth quarter 2021 compared with the fourth quarter of 2020. Nexplanon’s growth in the quarter was due to increased demand in the United States, as well as tenders won, which can be variable quarter to quarter. The increase in Women’s Health was partially offset by a decline in sales of Nuvaring® (etonogestrel/ethinyl estradiol vaginal ring) which continues to be impacted by generic competition.
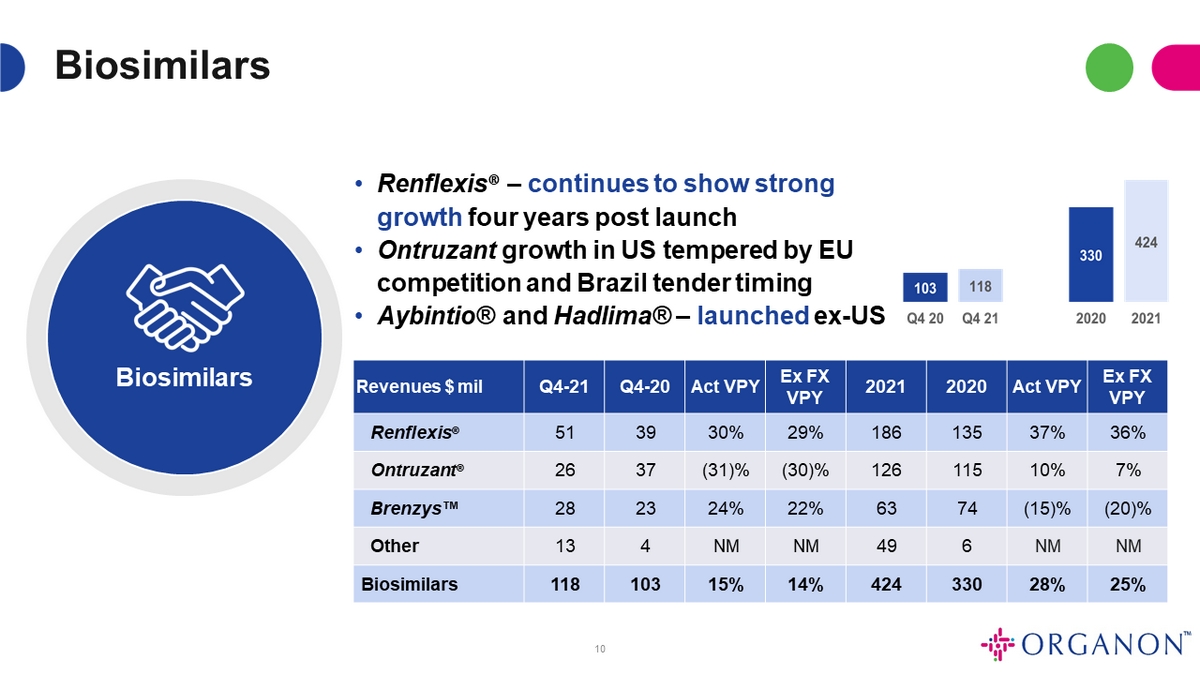
Biosimilars revenue grew 15% as-reported and 14% ex-FX in the fourth quarter 2021 compared with fourth quarter 2020, driven by continued growth in the United States for Renflexis® (infliximab-abda) and growth in Canada. The biosimilars portfolio also benefited from the continued uptake of Ontruzant® (trastuzumab-dttb) in the United States, partially offset by a decrease in the European Union, due to increasing competitive pressures, and Latin America, due to the timing of tenders in Brazil.
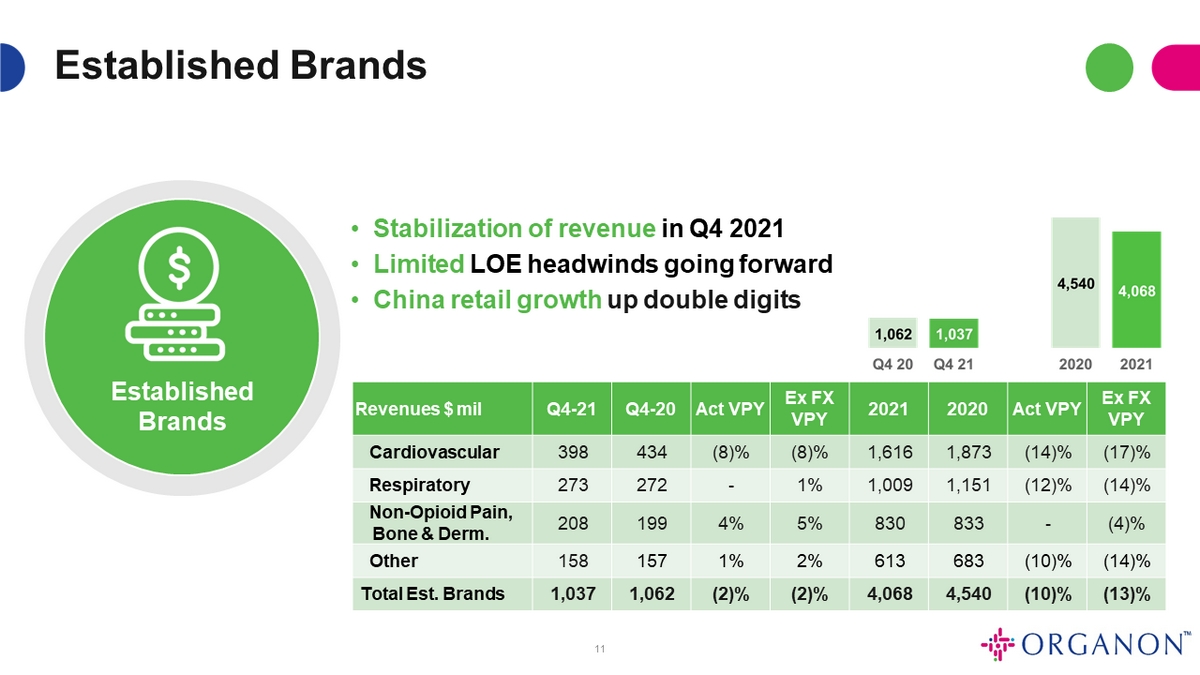
Established Brands represents a broad portfolio of well-known medicines, which are generally beyond market exclusivity, including leading brands in cardiovascular, respiratory, dermatology and non-opioid pain management, and for which generic competition varies by market. In 2021, declines related to loss of exclusivity (LOE) moderated, and in the fourth quarter the franchise was down 2% on both a nominal and constant currency basis. The decline in Established Brands during the fourth quarter of 2021 compared to the fourth quarter of 2020 was primarily due to a terminated agreement in Korea for Rosuzet™ (ezetimibe, rosuvastatin as calcium), loss of exclusivity for Zetia® (ezetimibe) in Japan in June 2020, the negative impact of Volume Based Procurement (VBP) in China, which was partially offset by growth in the retail channel and brands not impacted by VBP, as well as growth of Atozet™ (ezetimibe and atorvastatin calcium trihydrate) and certain products in the respiratory and non-opioid pain franchises.
Fourth quarter 2021 profitability
| in $ millions, except per share amounts | Q4 2021 | Q4 2020 | VPY | |||||||||
| Revenue | $ | 1,604 | $ | 1,613 | (1 | )% | ||||||
| Cost of sales | 599 | 586 | 2 | % | ||||||||
| Gross profit | 1,005 | 1,027 | (2 | )% | ||||||||
| Gross margin | 62.7 | % | 63.7 | % | ||||||||
| Non-GAAP adjusted gross profit(*) | 1,059 | 1,051 | 1 | % | ||||||||
| Non-GAAP adjusted gross margin | 66.0 | % | 65.2 | % | ||||||||
| Adjusted EBITDA(*) | 549 | 680 | (19 | )% | ||||||||
| Adjusted EBITDA margin | 34.2 | % | 42.2 | % | ||||||||
| Net Income, continuing operations | 202 | 376 | (46 | )% | ||||||||
| Non-GAAP adjusted net income, continuing operations(*) | 349 | 494 | (29 | )% | ||||||||
| Diluted Earnings per Share, continuing operations | 0.79 | 1.48 | (47 | )% | ||||||||
| Non-GAAP adjusted Diluted Earnings per Share, continuing operations(*) | 1.37 | 1.95 | (30 | )% | ||||||||
(*) See Tables 4,5 and 6 for reconciliations of GAAP to non-GAAP measures.
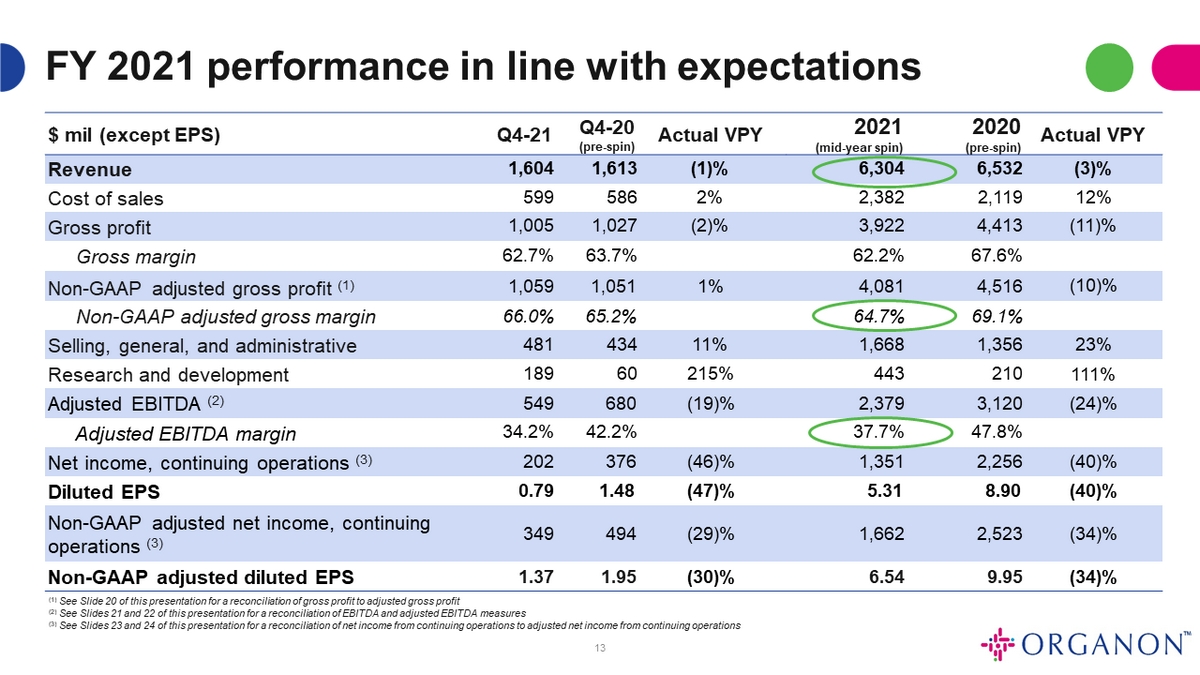
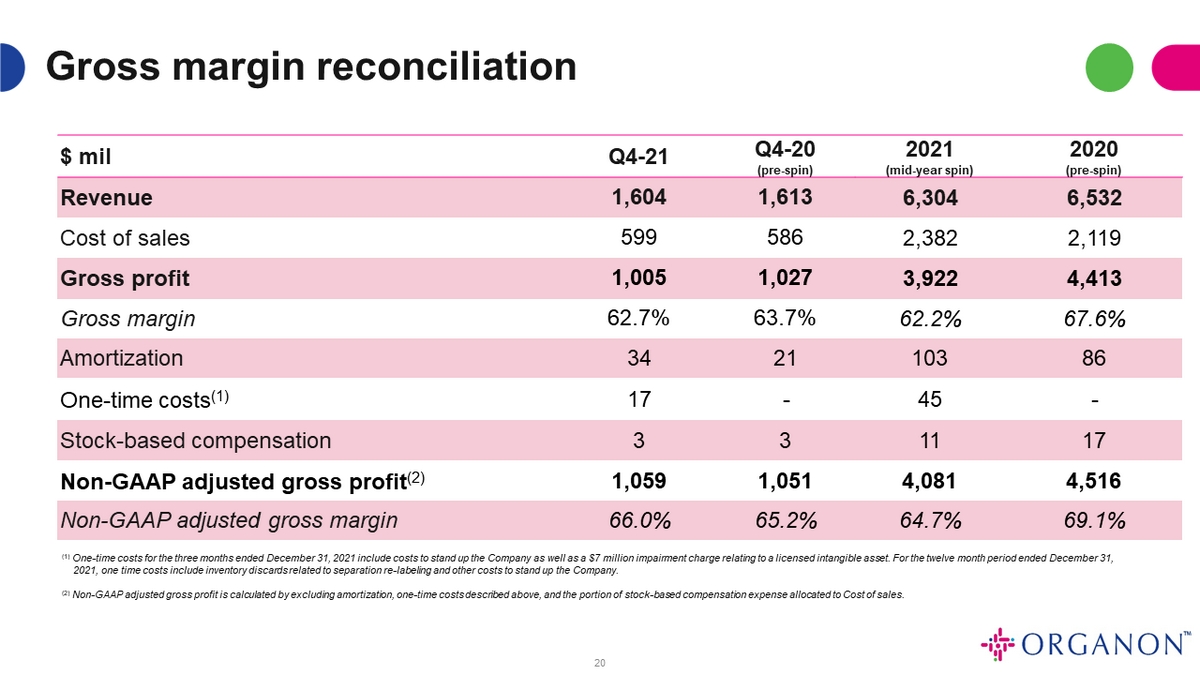
Gross margin was 62.7% as-reported and 66.0% on an adjusted basis in the fourth quarter of 2021 compared with 63.7% as-reported and 65.2% on an adjusted basis in the fourth quarter of 2020.
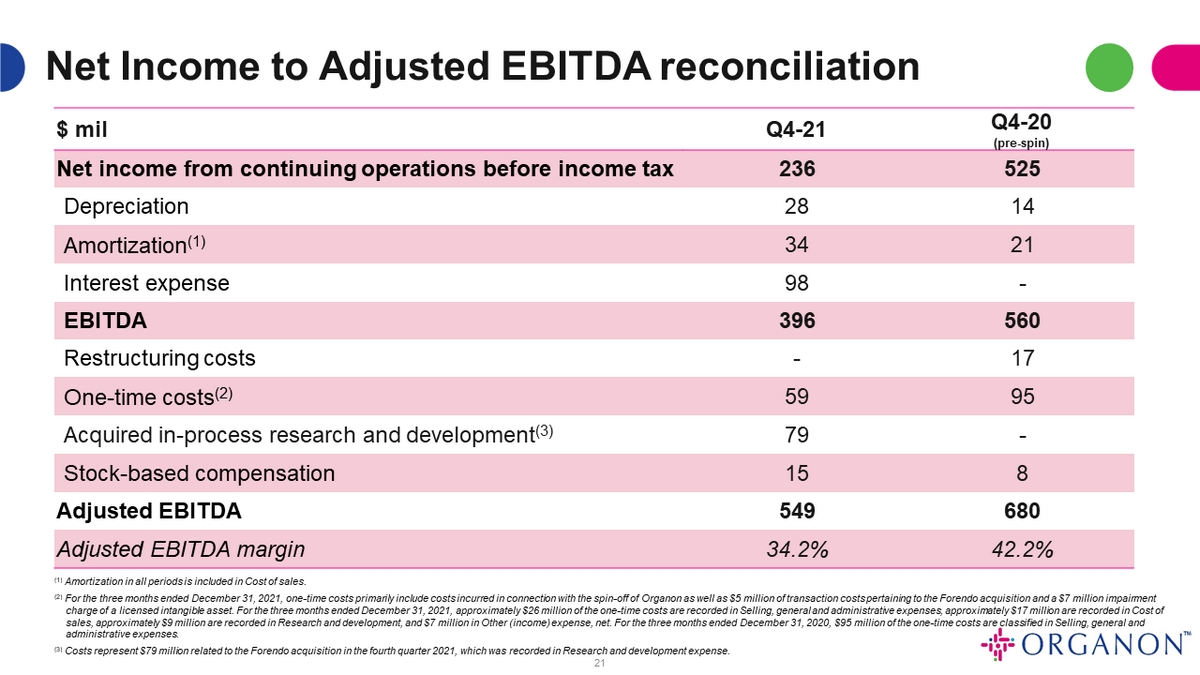
Adjusted EBITDA margin was 34.2% in the fourth quarter of 2021 compared with 42.2% in the fourth quarter of 2020. The decline reflects costs incurred to establish Organon as a stand-alone entity.
Net income from continuing operations for the fourth quarter of 2021 was $202 million, or $0.79 per diluted share, compared with $376 million, or $1.48 per diluted share, in the fourth quarter of 2020. Non-GAAP Adjusted net income from continuing operations was $349 million, or $1.37 per diluted share, compared with $494 million, or $1.95 per diluted share, in 2020.
2021 revenue
| in $ millions | FY 2021 | FY 2020 | VPY | VPY ex-FX | ||||||||||||
| Women’s Health | $ | 1,612 | $ | 1,555 | 4 | % | 2 | % | ||||||||
| Biosimilars | 424 | 330 | 28 | % | 25 | % | ||||||||||
| Established Brands | 4,068 | 4,540 | (10 | )% | (13 | )% | ||||||||||
| Other(1) | 200 | 107 | 87 | % | 67 | % | ||||||||||
| Revenue | $ | 6,304 | $ | 6,532 | (3 | )% | (6 | )% | ||||||||
(1) Other includes manufacturing sales to Merck and other third parties, and allocated amounts from pre-spin revenue hedging activities through the date of separation.
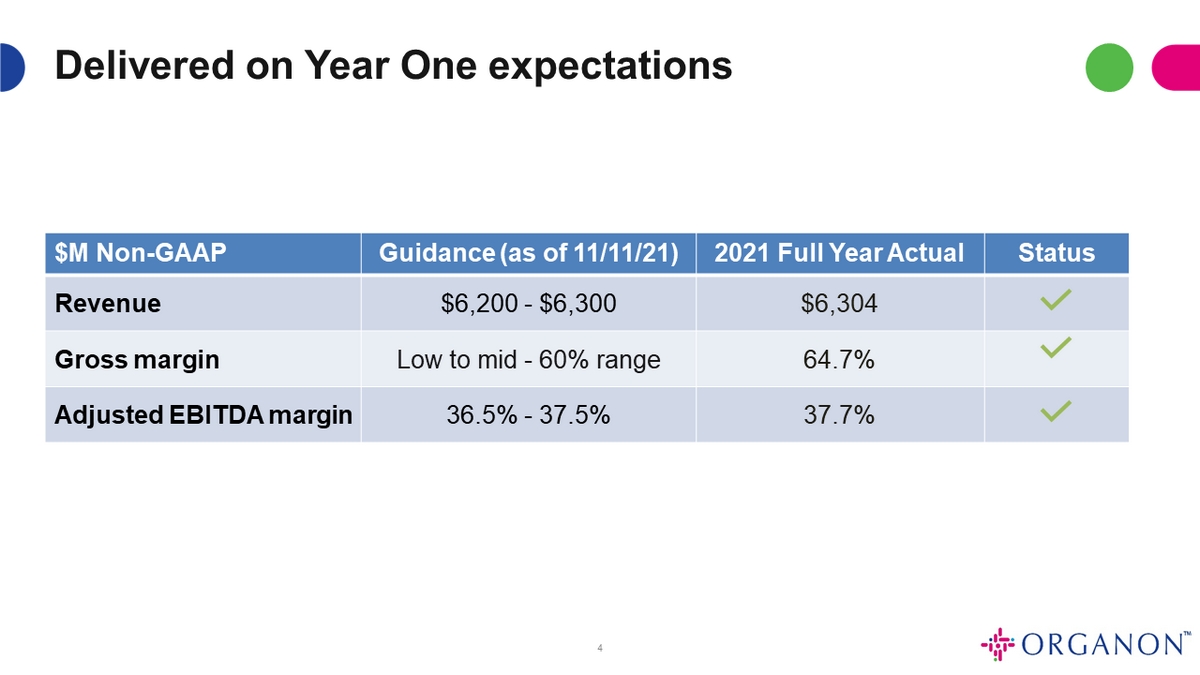
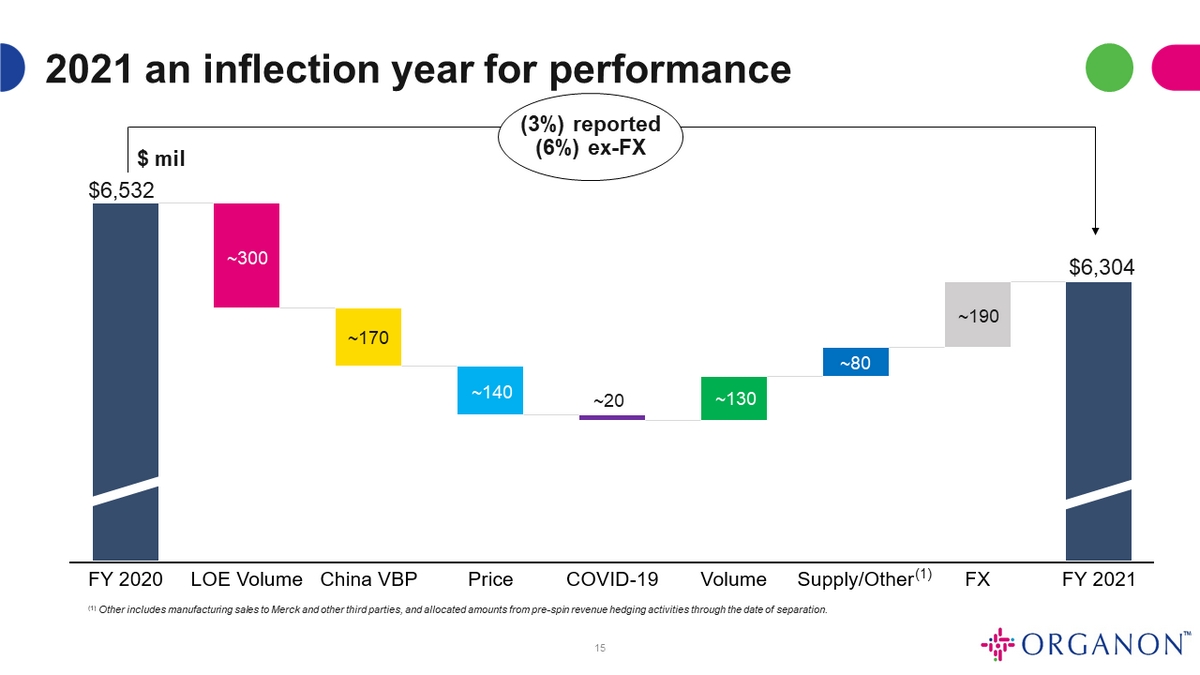
Total net revenue was $6,304 million for full year 2021, a decrease of 3% as-reported and 6% ex-FX, compared with 2020. The sales decline reflects decreases across certain markets within the Established Brands business, primarily due to ongoing competition after loss of exclusivity. The overall sales decline was offset by higher sales of Women's Health products, notably Nexplanon, Follistim AQ® (follitropin beta injection) and ganirelix acetate injection due to increasing demand, higher sales of biosimilars resulting from the continued uptake of Renflexis and Ontruzant in the United States, and the favorable impact of foreign exchange.
Women’s Health increased 4% as-reported and 2% ex-FX for full year 2021 compared with 2020, driven by Nexplanon which increased 12% ex-FX in 2021. This was partially offset by a 21% ex-FX decline in Nuvaring which continues to be impacted by generic competition, and by declining sales in the United States of the authorized generic of Nuvaring. Follistim AQ (marketed in most countries outside the United States as Puregon™), a fertility treatment, increased 19% ex-FX in 2021 compared with 2020, primarily due to volume growth, as well as recovery from the COVID-19 pandemic in the United States and China.
Biosimilars revenue grew 28% as-reported and 25% ex-FX for full year 2021 compared with 2020, driven by continued growth in the United States for Renflexis and growth in Canada. The biosimilars portfolio also benefited from the launch of Hadlima® (adalimumab-bwwd) and Aybintio® (bevacizumab) in certain ex-US markets during the year, and the continued uptake of Ontruzant in the United States, partially offset by revenue declines in the European Union due to increasing competitive pressures.
Revenue for Established Brands was down 10% as-reported and down 13% ex-FX for the full year 2021, primarily driven by the impact of the loss of exclusivity of Zetia in Japan in June 2020. Excluding the impact of the loss of exclusivity, Established Brands revenue was down 8% ex-FX. Additionally, during 2021, the Established Brands portfolio in China was subject to the negative impact of the third round of VBP, the largest so far for Organon. The associated decline was partially offset by growth in brands in the hospital channel not impacted by VBP, the partial recovery of the respiratory market as well as growth in the retail segment which accounts for approximately 50% of the total sales of Established Brands in China.
Full year 2021 profitability
| in $ millions, except per share amounts | 2021 | 2020 | VPY | |||||||||
| Revenue | $ | 6,304 | $ | 6,532 | (3 | )% | ||||||
| Cost of sales | 2,382 | 2,119 | 12 | % | ||||||||
| Gross profit | 3,922 | 4,413 | (11 | )% | ||||||||
| Gross margin | 62.2 | % | 67.6 | % | ||||||||
| Non-GAAP adjusted gross profit(*) | 4,081 | 4,516 | (10 | )% | ||||||||
| Non-GAAP adjusted gross margin | 64.7 | % | 69.1 | % | ||||||||
| Adjusted EBITDA(*) | 2,379 | 3,120 | (24 | )% | ||||||||
| Adjusted EBITDA margin | 37.7 | % | 47.8 | % | ||||||||
| Net Income, continuing operations | 1,351 | 2,256 | (40 | )% | ||||||||
| Non-GAAP adjusted net income, continuing operations(*) | 1,662 | 2,523 | (34 | )% | ||||||||
| Diluted Earnings per Share, continuing operations | 5.31 | 8.90 | (40 | )% | ||||||||
| Non-GAAP Adjusted Diluted Earnings per Share, continuing operations(*) | 6.54 | 9.95 | (34 | )% | ||||||||
(*) See Tables 4,5 and 6 for reconciliations of GAAP to non-GAAP measures.
Gross margin was 62.2% as-reported and 64.7% on an adjusted basis for full year 2021 compared with 67.6% as-reported and 69.1% on an adjusted basis in 2020. The year-over-year decrease reflects costs of establishing Organon as an independent company, including certain costs related to manufacturing agreements between the company and its former parent company, which have lower gross margin percentages compared to third party product sales and purchases.
Adjusted EBITDA margin was 37.7% for 2021 compared with 47.8% in 2020, which reflects costs incurred to establish Organon as a stand-alone entity.
Net income from continuing operations for 2021 was $1,351 million, or $5.31 per diluted share, compared with $2,256 million, or $8.90 per diluted share in 2020. Non-GAAP Adjusted net income from continuing operations was $1,662 million, or $6.54 per diluted share, compared with $2,523 million, or $9.95 per diluted share in 2020.
Capital allocation
Today, Organon’s Board of Directors declared a quarterly dividend of $0.28 for each issued and outstanding share of the company's common stock. The dividend is payable on March 17, 2022 to stockholders of record at the close of business on February 28, 2022.
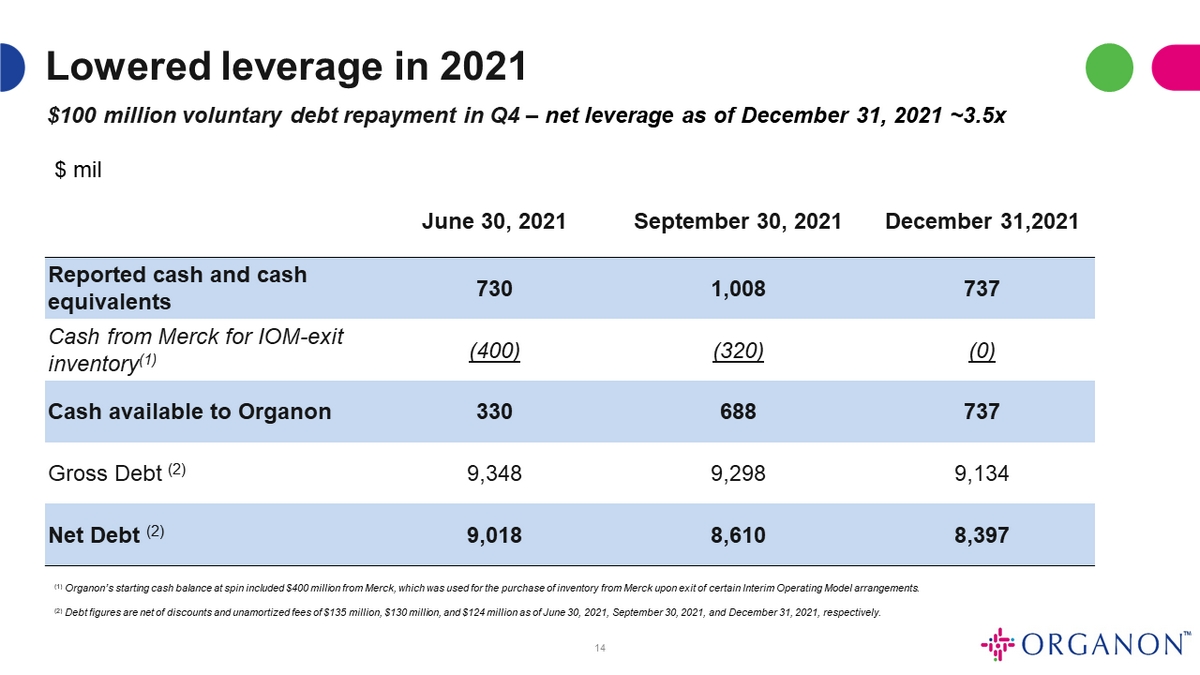
As of December 31, 2021, cash and cash equivalents were $737 million, and gross debt was $9,134 million, resulting in net debt of $8,397 million. Total debt as of December 31, 2021 reflects a discretionary fourth quarter prepayment of $100 million on the company’s term loans.
Full year guidance – all guidance provided on a Non-GAAP basis
Organon does not provide GAAP financial measures (other than revenue) on a forward-looking basis because the company is unable to predict with reasonable certainty and without unreasonable effort, items such as, the ultimate outcome of legal proceedings, unusual gains and losses, and acquisition-related expenses. These items are uncertain, depend on various factors, and could be material to Organon’s results computed in accordance with GAAP.
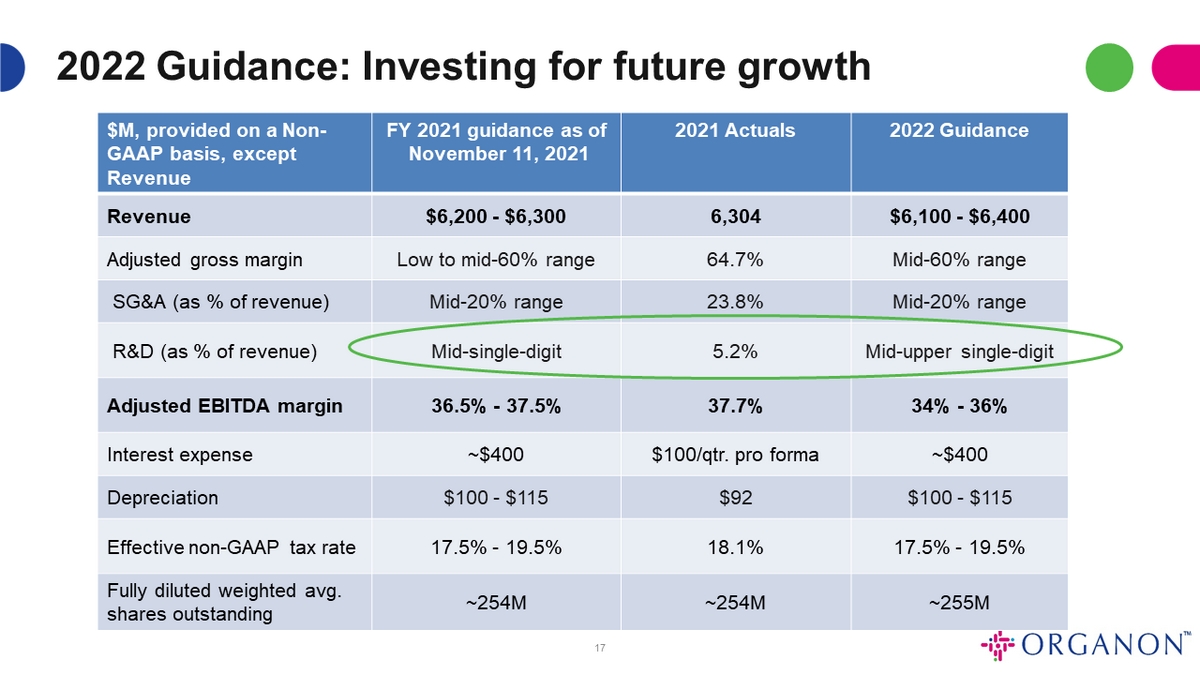
The company provided financial guidance for full year 2022, which is presented on a non-GAAP basis.
| Non-GAAP basis (except revenue) | Guidance | |
| Revenue | $6.1B - $6.4B | |
| Adjusted gross margin | Mid 60% | |
| SG&A as % of sales | Mid 20% | |
| R&D as % of sales | Mid to upper single digit | |
| Adjusted EBITDA margin | 34%-36% | |
| Interest expense | ~$400 million | |
| Depreciation | $100-$115 million | |
| Effective Non-GAAP tax rate | 17.5%-19.5% | |
| Fully diluted weighted avg. shares outstanding | ~255 million |
Webcast Information
Organon will host a conference call at 8:30 a.m. Eastern Time today to discuss its fourth quarter and full year 2021 financial results. To listen to the event and view the presentation slides via webcast, join from the Organon Investor Relations website at https://www.organon.com/investor-relations/. A replay of the webcast will be available approximately two hours after the conclusion of the live event on the company’s website. Institutional investors and analysts interested in participating in the call must register in advance using conference ID#2682555 and by clicking on this link: http://www.directeventreg.com/registration/event/2682555. Following registration, participants will receive a confirmation email containing details on how to join the conference call, including dial-in information and a unique passcode and registrant ID. Pre-registration will allow participants to bypass an operator and be placed directly into the call.
About Organon
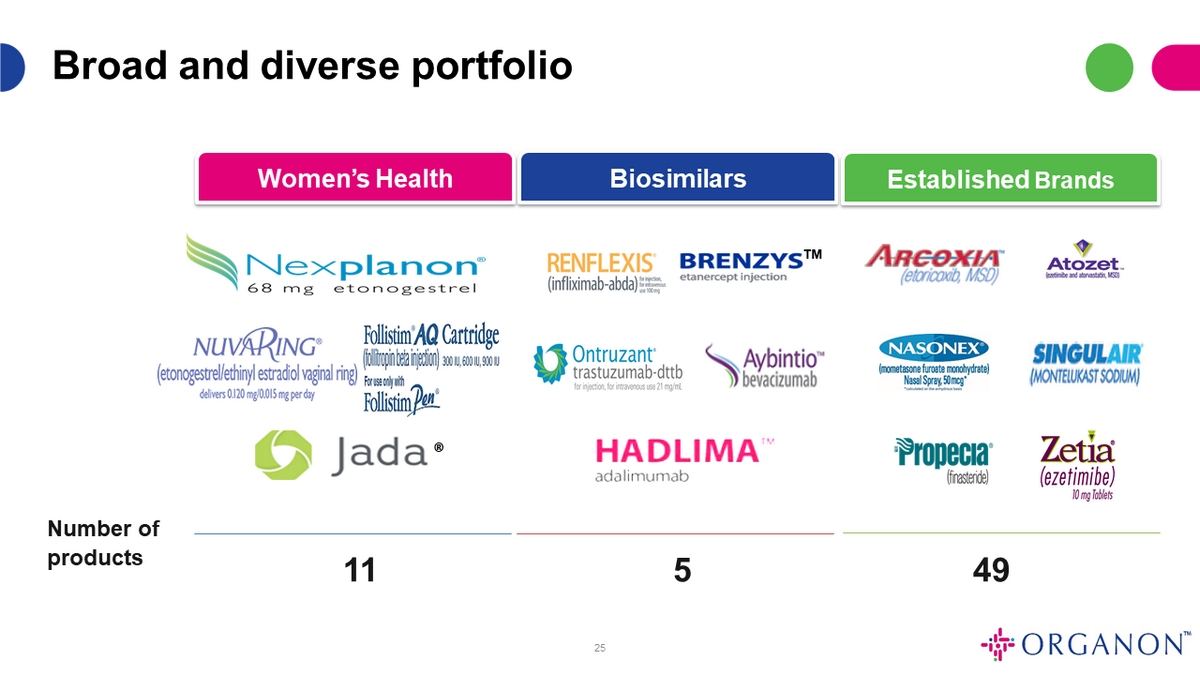
Organon is a global healthcare company formed through a spin-off from Merck, (NYSE: MRK) known as MSD outside of the United States and Canada, to focus on improving the health of women throughout their lives. Organon has a portfolio of more than 60 medicines and products across a range of therapeutic areas. Led by the women’s health portfolio coupled with an expanding biosimilars business and stable franchise of established medicines, Organon’s products produce strong cash flows that will support investments in innovation and future growth opportunities in women’s health. In addition, Organon is pursuing opportunities to collaborate with biopharmaceutical innovators looking to commercialize their products by leveraging its scale and presence in fast growing international markets.
Organon has a global footprint with significant scale and geographic reach, world-class commercial capabilities, and approximately 9,500 employees with headquarters located in Jersey City, New Jersey.
For more information, visit https://www.organon.com and connect with us on LinkedIn and Instagram.
Non-GAAP financial measures
Non-GAAP results, such as Adjusted EBITDA, Adjusted Net Income, and Adjusted Diluted EPS, are presented only as a supplement to the company’s financial statements based on GAAP. Non-GAAP financial information is provided to enhance understanding of the company’s financial performance, but none of these non-GAAP financial measures are recognized terms under GAAP, and non-GAAP measures should not be considered in isolation from, or as a substitute analysis for, the company’s results of operations as determined in accordance with GAAP. Definitions and reconciliations of non-GAAP measures to the most directly comparable GAAP measures are provided within the schedules attached to this release. The company uses non-GAAP measures in its operational and financial decision making, and believes that it is useful to exclude certain items in order to focus on what it regards to be a more meaningful representation of the underlying operating performance of the business. The company also believes that investors may find non-GAAP financial measures useful for the same reasons, although investors are cautioned that non-GAAP financial measures are not a substitute for GAAP disclosures. The non-GAAP financial measures are not presented in accordance with GAAP. Please refer to the appendix of this press release for reconciliations of non-GAAP financial measures contained herein to the most directly comparable GAAP measures. The company’s full-year 2022 guidance measures (other than revenue) are provided on a non-GAAP basis because the company is unable to reasonably predict certain items contained in the GAAP measures. Such items include, but are not limited to, acquisition related expenses, restructuring and related expenses, stock-based compensation and other items not reflective of the company's ongoing operations.
Forward-Looking Statements
Except for historical information herein, this news release includes “forward-looking statements” within the meaning of the safe harbor provisions of the U.S. Private Securities Litigation Reform Act of 1995, including, but not limited to, statements about management’s expectations about Organon’s future financial performance and prospects. Forward-looking statements may be identified by words such as “expects,” “intends,” “anticipates,” “plans,” “believes,” “seeks,” “estimates,” “will” or words of similar meaning. These statements are based upon the current beliefs and expectations of the company’s management and are subject to significant risks and uncertainties. If underlying assumptions prove inaccurate or risks or uncertainties materialize, actual results may differ materially from those set forth in the forward-looking statements.
Risks and uncertainties include, but are not limited to, an inability to execute on our business development strategy or realize the benefits of our planned acquisitions; general industry conditions and competition; general economic factors, including interest rate and currency exchange rate fluctuations; the impact of the ongoing COVID-19 pandemic and emergence of variant strains; the impact of pharmaceutical industry regulation and health care legislation in the United States and internationally; global trends toward health care cost containment; technological advances; new products and patents attained by competitors; challenges inherent in new product development, including obtaining regulatory approval; the company’s ability to accurately predict its future financial results and performance; the company’s ability to accurately predict future market conditions; manufacturing difficulties or delays; financial instability of international economies and sovereign risk; difficulties developing and sustaining relationships with commercial counterparties; dependence on the effectiveness of the company’s patents and other protections for innovative products; and the exposure to litigation, including patent litigation, and/or regulatory actions.
The company undertakes no obligation to publicly update any forward-looking statement, whether as a result of new information, future events or otherwise. Additional factors that could cause results to differ materially from those described in the forward-looking statements can be found in the company’s filings with the Securities and Exchange Commission (SEC), including its registration statement on Form 10 and subsequent periodic filings, available at the SEC’s Internet site (www.sec.gov).
TABLE 1
Organon & Co.
Condensed Consolidated Statement of Income
(Unaudited, $ in millions except share and per share amounts)
| Three Months Ended December 31, | Twelve Months Ended December 31, | |||||||||||||||
| 2021 | 2020 | 2021 | 2020 | |||||||||||||
| Revenues | $ | 1,604 | $ | 1,613 | $ | 6,304 | $ | 6,532 | ||||||||
| Costs, Expenses and Other | ||||||||||||||||
| Cost of sales | 599 | 586 | 2,382 | 2,119 | ||||||||||||
| Selling, general and administrative | 481 | 434 | 1,668 | 1,356 | ||||||||||||
| Research and development | 189 | 60 | 443 | 210 | ||||||||||||
| Restructuring costs | — | 17 | 3 | 60 | ||||||||||||
| Other (income) expense, net | 99 | (9 | ) | 279 | 35 | |||||||||||
| 1,368 | 1,088 | 4,775 | 3,780 | |||||||||||||
| Income From Continuing Operations Before Income Taxes | 236 | 525 | 1,529 | 2,752 | ||||||||||||
| Taxes on Income | 34 | 149 | 178 | 496 | ||||||||||||
| Net Income From Continuing Operations | 202 | 376 | 1,351 | 2,256 | ||||||||||||
| Loss From Discontinued Operations - Net of Tax | — | (8 | ) | — | (96 | ) | ||||||||||
| Net Income | $ | 202 | $ | 368 | 1,351 | 2,160 | ||||||||||
| Earnings (Loss) per Share Attributable to Organon & Co. Stockholders - Basic: | ||||||||||||||||
| Continuing operations | 0.80 | 1.48 | 5.33 | 8.90 | ||||||||||||
| Discontinued operations | — | (0.03 | ) | — | (0.38 | ) | ||||||||||
| Net Earnings per Share Attributable to Organon & Co. Stockholders | 0.80 | 1.45 | 5.33 | 8.52 | ||||||||||||
| Earnings (Loss) per Share Attributable to Organon & Co. Stockholders - Diluted: | ||||||||||||||||
| Continuing operations | 0.79 | 1.48 | $ | 5.31 | $ | 8.90 | ||||||||||
| Discontinued operations | — | (0.03 | ) | $ | — | $ | (0.38 | ) | ||||||||
| Net Earnings per Share Attributable to Organon & Co. Stockholders | 0.79 | 1.45 | $ | 5.31 | $ | 8.52 | ||||||||||
| Weighted Average Shares Outstanding: | ||||||||||||||||
| Basic | 253,549,167 | 253,516,000 | 253,537,941 | 253,516,000 | ||||||||||||
| Diluted | 254,550,738 | 253,516,000 | 254,192,700 | 253,516,000 | ||||||||||||
TABLE 2
Organon & Co.
Sales by top products
| Three Months Ended December 31, | Twelve Months Ended December 31, | |||||||||||||||||||||||||||||||||||||||||||||||
| 2021 | 2020 | 2021 | 2020 | |||||||||||||||||||||||||||||||||||||||||||||
| ($ in millions) | U.S. | Int’l | Total | U.S. | Int’l | Total | U.S. | Int’l | Total | U.S. | Int’l | Total | ||||||||||||||||||||||||||||||||||||
| Women’s Health | ||||||||||||||||||||||||||||||||||||||||||||||||
| Nexplanon/Implanon NXT | $ | 143 | $ | 83 | $ | 226 | $ | 114 | $ | 50 | $ | 165 | $ | 532 | $ | 237 | $ | 769 | $ | 488 | $ | 192 | $ | 680 | ||||||||||||||||||||||||
| Follistim AQ | 29 | 30 | 59 | 24 | 33 | 57 | 110 | 127 | 237 | 84 | 108 | 193 | ||||||||||||||||||||||||||||||||||||
| NuvaRing | 18 | 27 | 44 | 25 | 28 | 53 | 85 | 106 | 191 | 111 | 126 | 236 | ||||||||||||||||||||||||||||||||||||
| ganirelix acetate injection | 3 | 22 | 26 | 4 | 21 | 25 | 22 | 88 | 111 | 11 | 69 | 81 | ||||||||||||||||||||||||||||||||||||
| Cerazette | — | 18 | 18 | — | 16 | 16 | — | 70 | 70 | — | 67 | 67 | ||||||||||||||||||||||||||||||||||||
| Other Women's Health (1) | 14 | 29 | 42 | 45 | 30 | 74 | 96 | 139 | 234 | 165 | 133 | 298 | ||||||||||||||||||||||||||||||||||||
| Biosimilars | ||||||||||||||||||||||||||||||||||||||||||||||||
| Renflexis | 46 | 5 | 51 | 35 | 4 | 39 | 164 | 21 | 186 | 123 | 12 | 135 | ||||||||||||||||||||||||||||||||||||
| Ontruzant | 14 | 11 | 26 | 2 | 35 | 37 | 34 | 92 | 126 | 3 | 113 | 115 | ||||||||||||||||||||||||||||||||||||
| Brenzys | — | 28 | 28 | — | 23 | 23 | — | 63 | 63 | — | 74 | 74 | ||||||||||||||||||||||||||||||||||||
| Other Biosimilars (1) | — | 13 | 13 | — | 4 | 4 | — | 49 | 49 | — | 6 | 6 | ||||||||||||||||||||||||||||||||||||
| Established Brands | ||||||||||||||||||||||||||||||||||||||||||||||||
| Cardiovascular | ||||||||||||||||||||||||||||||||||||||||||||||||
| Zetia | 4 | 92 | 96 | 3 | 94 | 98 | 10 | 368 | 378 | (1 | ) | 483 | 482 | |||||||||||||||||||||||||||||||||||
| Vytorin | 3 | 34 | 37 | 3 | 40 | 43 | 11 | 153 | 164 | 12 | 170 | 182 | ||||||||||||||||||||||||||||||||||||
| Atozet | — | 110 | 110 | — | 105 | 105 | — | 458 | 458 | — | 453 | 453 | ||||||||||||||||||||||||||||||||||||
| Rosuzet | — | 19 | 19 | — | 36 | 36 | — | 68 | 68 | — | 130 | 130 | ||||||||||||||||||||||||||||||||||||
| Cozaar/Hyzaar | 3 | 90 | 93 | 4 | 90 | 94 | 12 | 345 | 357 | 21 | 365 | 386 | ||||||||||||||||||||||||||||||||||||
| Zocor | 1 | 15 | 16 | 1 | 18 | 19 | 4 | 61 | 65 | 3 | 75 | 77 | ||||||||||||||||||||||||||||||||||||
| Other Cardiovascular (1) | — | 27 | 27 | — | 39 | 39 | — | 126 | 126 | — | 162 | 162 | ||||||||||||||||||||||||||||||||||||
| Respiratory | ||||||||||||||||||||||||||||||||||||||||||||||||
| Singulair | 5 | 108 | 113 | 4 | 120 | 124 | 15 | 398 | 413 | 18 | 444 | 462 | ||||||||||||||||||||||||||||||||||||
| Nasonex | 2 | 61 | 62 | 3 | 55 | 57 | 4 | 201 | 206 | 12 | 206 | 218 | ||||||||||||||||||||||||||||||||||||
| Dulera | 34 | 10 | 44 | 33 | 8 | 41 | 154 | 36 | 190 | 188 | 34 | 222 | ||||||||||||||||||||||||||||||||||||
| Clarinex | 1 | 27 | 28 | 2 | 19 | 21 | 6 | 106 | 111 | 7 | 123 | 130 | ||||||||||||||||||||||||||||||||||||
| Asmanex | 14 | 2 | 16 | 17 | 2 | 20 | 57 | 7 | 63 | 76 | 8 | 83 | ||||||||||||||||||||||||||||||||||||
| Other Respiratory (1) | (1 | ) | 10 | 9 | 2 | 7 | 9 | — | 26 | 26 | 3 | 32 | 35 | |||||||||||||||||||||||||||||||||||
| Non-Opioid Pain, Bone and Dermatology | ||||||||||||||||||||||||||||||||||||||||||||||||
| Arcoxia | — | 60 | 60 | — | 54 | 54 | — | 244 | 244 | — | 258 | 258 | ||||||||||||||||||||||||||||||||||||
| Fosamax | 1 | 42 | 43 | 1 | 39 | 40 | 4 | 172 | 175 | 4 | 176 | 180 | ||||||||||||||||||||||||||||||||||||
| Diprospan | — | 33 | 33 | — | 32 | 32 | — | 125 | 125 | — | 118 | 118 | ||||||||||||||||||||||||||||||||||||
| Diprosone | — | 22 | 22 | — | 23 | 23 | 1 | 86 | 87 | 1 | 82 | 83 | ||||||||||||||||||||||||||||||||||||
| Other Non-Opioid Pain, Bone and Dermatology (1) | 4 | 46 | 50 | 5 | 46 | 50 | 15 | 183 | 199 | 9 | 186 | 195 | ||||||||||||||||||||||||||||||||||||
| Other | ||||||||||||||||||||||||||||||||||||||||||||||||
| Proscar | — | 25 | 26 | — | 22 | 22 | 1 | 116 | 117 | 2 | 174 | 176 | ||||||||||||||||||||||||||||||||||||
| Propecia | 4 | 31 | 36 | 2 | 36 | 39 | 9 | 127 | 136 | 10 | 119 | 129 | ||||||||||||||||||||||||||||||||||||
| Sinemet | — | 17 | 17 | — | 20 | 20 | — | 71 | 71 | (1 | ) | 78 | 77 | |||||||||||||||||||||||||||||||||||
| Remeron | 1 | 14 | 15 | 1 | 16 | 16 | 3 | 62 | 66 | 2 | 61 | 64 | ||||||||||||||||||||||||||||||||||||
| Other (1) | 7 | 58 | 65 | 9 | 50 | 60 | 37 | 185 | 223 | 53 | 185 | 238 | ||||||||||||||||||||||||||||||||||||
| Other (2) | (3 | ) | 38 | 34 | 1 | 57 | 58 | (3 | ) | 205 | 200 | 4 | 102 | 107 | ||||||||||||||||||||||||||||||||||
| Total Revenue | $ | 347 | $ | 1,257 | $ | 1,604 | $ | 340 | $ | 1,272 | $ | 1,613 | $ | 1,383 | $ | 4,921 | $ | 6,304 | $ | 1,408 | $ | 5,124 | $ | 6,532 | ||||||||||||||||||||||||
U.S. plus international may not equal total due to rounding.
| (1) | Includes sales of products not listed separately. Revenue from an arrangement for the sale of generic etonogestrel/ethinyl estradiol vaginal ring is included in Other Women's Health. |
| (2) | Other includes manufacturing sales to Merck and other third parties, and allocated amounts from pre-spin revenue hedging activities through the date of separation. |
TABLE 3
Organon & Co.
Sales by geographic area
(Unaudited, $ in millions)
| Three Months Ended December 31, | Twelve Months Ended December 31, | |||||||||||||||
| ($ in millions) | 2021 | 2020 | 2021 | 2020 | ||||||||||||
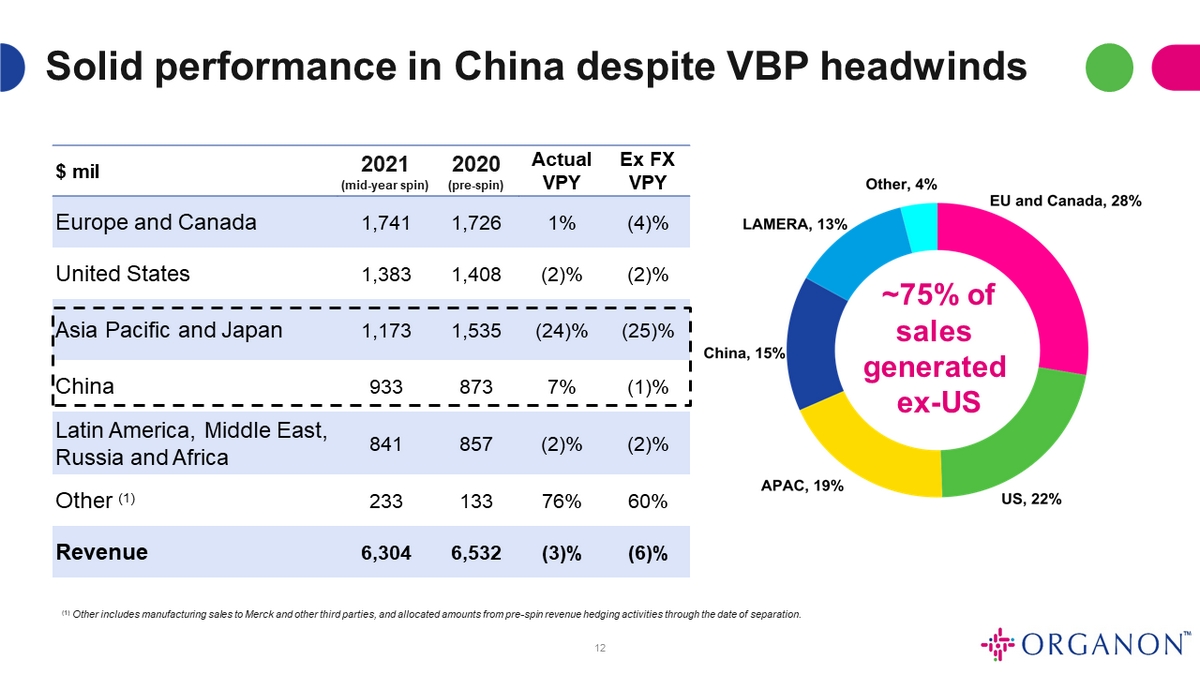
| Europe and Canada | $ | 427 | $ | 440 | $ | 1,741 | $ | 1,726 | ||||||||
| United States | 347 | 340 | 1,383 | 1,408 | ||||||||||||
| Asia Pacific and Japan | 299 | 345 | 1,173 | 1,535 | ||||||||||||
| China | 240 | 218 | 933 | 873 | ||||||||||||
| Latin America, Middle East, Russia and Africa | 246 | 208 | 841 | 857 | ||||||||||||
| Other(1) | 45 | 62 | 233 | 133 | ||||||||||||
| Revenue | $ | 1,604 | $ | 1,613 | $ | 6,304 | $ | 6,532 | ||||||||
(1) Other includes manufacturing sales to Merck and other third parties, and allocated amounts from pre-spin revenue hedging activities through the date of separation.
TABLE 4
Reconciliation of GAAP Gross Margin to Non-GAAP Adjusted Gross Profit and Adjusted Gross Margin
($ in millions)
| Three Months Ended December 31, | Twelve Months Ended December 31, | |||||||||||||||
| 2021 | 2020 | 2021 | 2020 | |||||||||||||
| Revenue | $ | 1,604 | $ | 1,613 | $ | 6,304 | $ | 6,532 | ||||||||
| Cost of sales | 599 | 586 | 2,382 | 2,119 | ||||||||||||
| Gross profit | 1,005 | 1,027 | 3,922 | 4,413 | ||||||||||||
| Gross margin | 62.7 | % | 63.7 | % | 62.2 | % | 67.6 | % | ||||||||
| Amortization | 34 | 21 | 103 | 86 | ||||||||||||
| One-time costs(1) | 17 | — | 45 | — | ||||||||||||
| Stock-based compensation | 3 | 3 | 11 | 17 | ||||||||||||
| Non-GAAP adjusted gross profit(2) | 1,059 | 1,051 | 4,081 | 4,516 | ||||||||||||
| Non-GAAP adjusted gross margin | 66.0 | % | 65.2 | % | 64.7 | % | 69.1 | % | ||||||||
(1) One-time costs for the three months ended December 31, 2021 include costs to stand up the Company as well as a $7 million impairment charge relating to a licensed intangible asset. For the twelve month period ended December 31, 2021, one time costs include inventory discards related to separation re-labeling and other costs to stand up the Company.
(2) Non-GAAP adjusted gross profit is calculated by excluding amortization, one-time costs described above, and the portion of stock-based compensation expense allocated to Cost of sales.
TABLE 5
Organon & Co.
Reconciliation of GAAP Net Income from Continuing Operations to Adjusted EBITDA
($ in millions)
| Three Months Ended December 31, | Twelve Months Ended December 31, | |||||||||||||||
| 2021 | 2020 | 2021 | 2020 | |||||||||||||
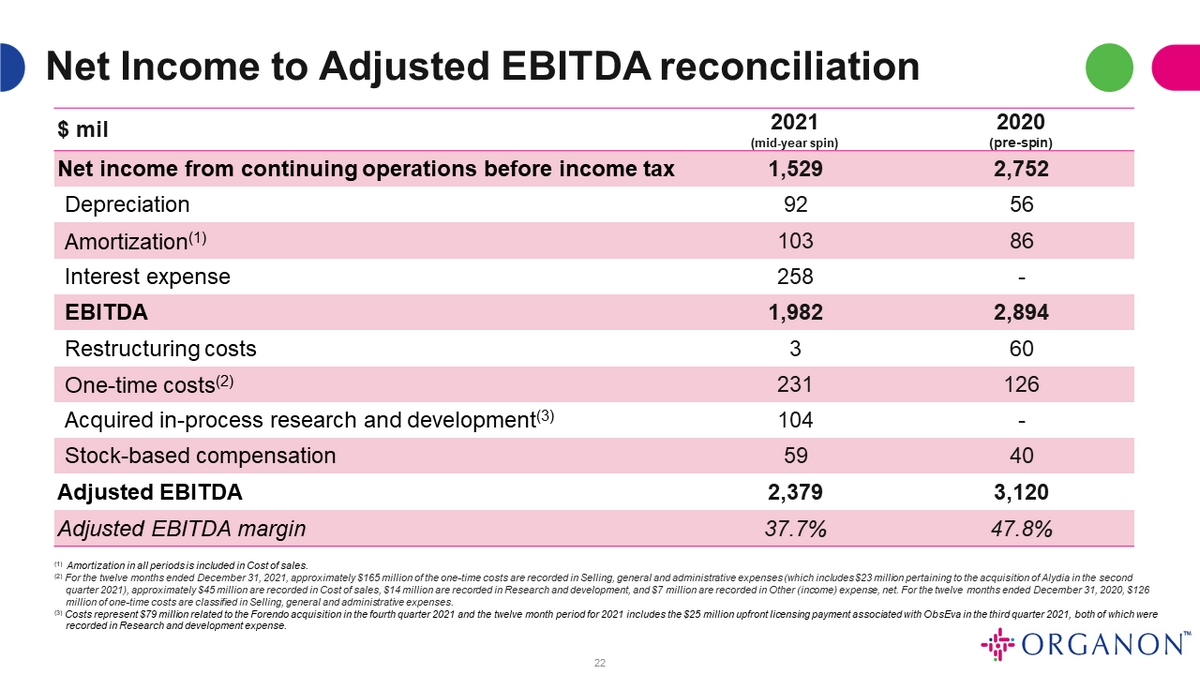
| Net income from continuing operations before income tax | $ | 236 | $ | 525 | $ | 1,529 | $ | 2,752 | ||||||||
| Depreciation | 28 | 14 | 92 | 56 | ||||||||||||
| Amortization(1) | 34 | 21 | 103 | 86 | ||||||||||||
| Interest expense | 98 | — | 258 | — | ||||||||||||
| EBITDA | 396 | 560 | 1,982 | 2,894 | ||||||||||||
| Restructuring costs | — | 17 | 3 | 60 | ||||||||||||
| One-time costs(2) | 59 | 95 | 231 | 126 | ||||||||||||
| Acquired in-process research and development(3) | 79 | — | 104 | — | ||||||||||||
| Stock-based compensation | 15 | 8 | 59 | 40 | ||||||||||||
| Adjusted EBITDA | $ | 549 | $ | 680 | $ | 2,379 | $ | 3,120 | ||||||||
| Adjusted EBITDA margin | 34.2 | % | 42.2 | % | 37.7 | % | 47.8 | % | ||||||||
(1) Amortization in all periods is included in Cost of sales.
(2) For the three months ended December 31, 2021, one-time costs primarily include costs incurred in connection with the spin-off of Organon as well as $5 million of transaction costs pertaining to the Forendo acquisition and a $7 million impairment charge of a licensed intangible asset. For the three months ended December 31, 2021, approximately $26 million of the one-time costs are recorded in Selling, general and administrative expenses, approximately $17 million are recorded in Cost of sales, approximately $9 million are recorded in Research and development, and $7 million in Other (income) expense, net. For the three months ended December 31, 2020, $95 million of the one-time costs are classified in Selling, general and administrative expenses.
For the twelve months ended December 31, 2021, approximately $165 million of the one-time costs are recorded in Selling, general and administrative expenses (which includes $23 million pertaining to the acquisition of Alydia in the second quarter 2021), approximately $45 million are recorded in Cost of sales, $14 million are recorded in Research and development, and $7million are recorded in Other (income) expense, net. For the twelve months ended December 31, 2020, $126 million of one-time costs are classified in Selling, general and administrative expenses.
(3) Costs represent $79 million related to the Forendo acquisition in the fourth quarter 2021 and the twelve month period for 2021 includes the $25 million upfront licensing payment associated with ObsEva in the third quarter 2021, both of which were recorded in Research and development expense.
TABLE 6
Organon & Co.
Reconciliation of GAAP Net Income to Non-GAAP Adjusted Net Income
($ in millions, except per share amounts)
| Three Months Ended December 31, | Twelve Months Ended December 31, | |||||||||||||||
| 2021 | 2020 | 2021 | 2020 | |||||||||||||
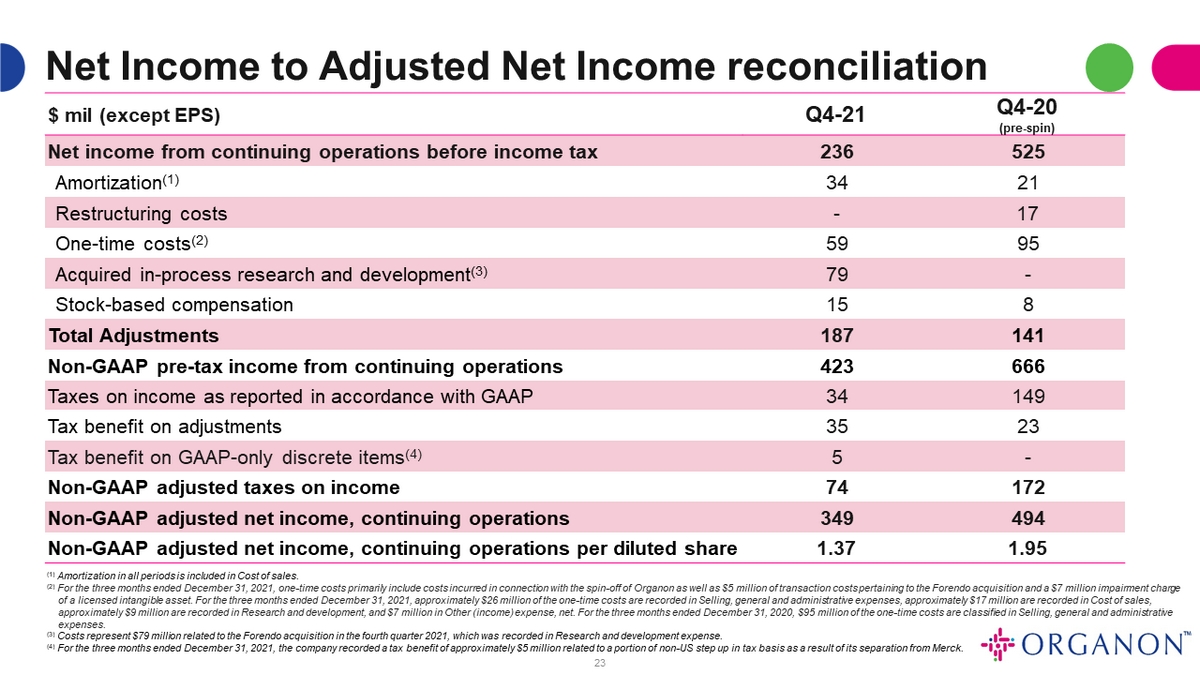
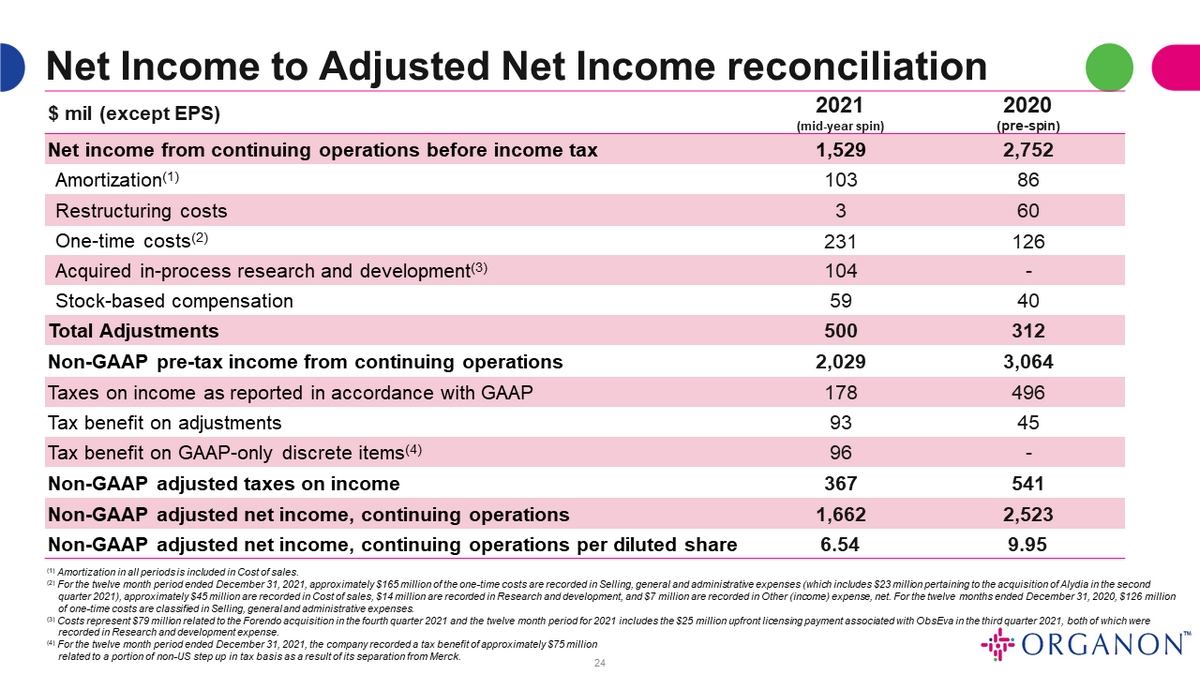
| Net income from continuing operations before income tax | $ | 236 | $ | 525 | $ | 1,529 | $ | 2,752 | ||||||||
| Adjustments: | ||||||||||||||||
| Amortization(1) | 34 | 21 | 103 | 86 | ||||||||||||
| Restructuring costs | — | 17 | 3 | 60 | ||||||||||||
| One-time costs(2) | 59 | 95 | 231 | 126 | ||||||||||||
| Acquired in-process research and development(3) | 79 | — | 104 | — | ||||||||||||
| Stock-based compensation | 15 | 8 | 59 | 40 | ||||||||||||
| Total Adjustments | 187 | 141 | 500 | 312 | ||||||||||||
| Non-GAAP pre-tax income from continuing operations | 423 | 666 | 2,029 | 3,064 | ||||||||||||
| Taxes on income as reported in accordance with GAAP | 34 | 149 | 178 | 496 | ||||||||||||
| Tax benefit on adjustments | 35 | 23 | 93 | 45 | ||||||||||||
| Tax benefit on GAAP-only discrete items(4) | 5 | — | 96 | — | ||||||||||||
| Non-GAAP adjusted taxes on income | 74 | 172 | 367 | 541 | ||||||||||||
| Non-GAAP adjusted net income, continuing operations | $ | 349 | $ | 494 | $ | 1,662 | $ | 2,523 | ||||||||
| Non-GAAP adjusted net income, continuing operations per diluted share | $ | 1.37 | $ | 1.95 | $ | 6.54 | $ | 9.95 | ||||||||
(1) Amortization in all periods is included in Cost of sales.
(2) For the three months ended December 31, 2021, one-time costs primarily include costs incurred in connection with the spin-off of Organon as well as $5 million of transaction costs pertaining to the Forendo acquisition and a $7 million impairment charge of a licensed intangible asset. For the three months ended December 31, 2021, approximately $26 million of the one-time costs are recorded in Selling, general and administrative expenses, approximately $17 million are recorded in Cost of sales, approximately $9 million are recorded in Research and development, and $7 million in Other (income) expense, net. For the three months ended December 31, 2020, $95 million of the one-time costs are classified in Selling, general and administrative expenses.
For the twelve months ended December 31, 2021, approximately $165 million of the one-time costs are recorded in Selling, general and administrative expenses (which includes $23 million pertaining to the acquisition of Alydia in the second quarter 2021), approximately $45 million are recorded in Cost of sales, $14 million are recorded in Research and development, and $7million are recorded in Other (income) expense, net. For the twelve months ended December 31, 2020, $126 million of one-time costs are classified in Selling, general and administrative expenses.
(3) Costs represent $79 million related to the Forendo acquisition in the fourth quarter 2021 and the twelve month period for 2021 includes the $25 million upfront licensing payment associated with ObsEva in the third quarter 2021, both of which were recorded in Research and development expense.
(4) For the three months and twelve months ended December 31, 2021, the company recorded a tax benefit of approximately $5 million and $75 million, respectively, related to a portion of non-US step up in tax basis as a result of its separation from Merck.