Document
false0001587732 0001587732 2020-04-27 2020-04-27


UNITED STATES
SECURITIES AND EXCHANGE COMMISSION
Washington, D.C. 20549

FORM 8-K

CURRENT REPORT
PURSUANT TO SECTION 13 OR 15(d) OF THE
SECURITIES EXCHANGE ACT OF 1934

(Date of report)
April 27, 2020
(Date of earliest event reported)
April 27, 2020

ONE Gas, Inc.
(Exact name of registrant as specified in its charter)

Oklahoma
 
001-36108
 
46-3561936
(State or other jurisdiction
 
(Commission
 
(IRS Employer
of incorporation)
 
File Number)
 
Identification No.)

15 East Fifth Street; Tulsa, OK
(Address of principal executive offices)

74103
(Zip code)

(918) 947-7000
(Registrant’s telephone number, including area code)

Not Applicable
(Former name or former address, if changed since last report)

Check the appropriate box below if the Form 8-K filing is intended to simultaneously satisfy the filing obligation of the registrant under any of the following provisions:

Written communication pursuant to Rule 425 under the Securities Act (17 CFR 230.425)

Soliciting material pursuant to Rule 14a-12 under the Exchange Act (17 CFR 240.14a-12)

Pre-commencement communications pursuant to Rule 14d-2(b) under the Exchange Act (17 CFR 240.14d-2(b))

Pre-commencement communications pursuant to Rule 13e-4(c) under the Exchange Act (17 CFR 240.13e-4(c))
Securities registered pursuant to Section 12(b) of the Act:
Title of each class
 
Trading Symbol
 
Name of exchange on which registered
Common Stock, par value $0.01 per share
 
OGS
 
New York Stock Exchange

Indicate by check mark whether the registrant is an emerging growth company as defined in Rule 405 of the Securities Act of 1933 (17 CFR §230.405) or Rule 12b-2 of the Securities Exchange Act of 1934 (17 CFR §240.12b-2).

Emerging growth company

If an emerging growth company, indicate by check mark if the registrant has elected not to use the extended transition period for complying with any new or revised financial accounting standards provided pursuant to Section 13(a) of the Exchange Act.

1


The information disclosed in Items 2.02 and 7.01, including Exhibits 99.1 and 99.2 hereto, is being furnished and shall not be deemed “filed” for purposes of Section 18 of the Securities Exchange Act of 1934, as amended (the Exchange Act), or otherwise subject to the liabilities under that section, nor shall it be deemed incorporated by reference in any filing under the Securities Act of 1933, as amended, or the Exchange Act except as expressly set forth by specific reference in such filing.


Item 2.02
 
Results of Operations and Financial Condition


On April 27, 2020, we announced our results of operations for the first quarter ended March 31, 2020. The news release is furnished as Exhibit 99.1 and incorporated by reference herein.


Item 7.01
 
Regulation FD Disclosure


On April 27, 2020, we announced our results of operations for the first quarter ended March 31, 2020, affirmed our 2020 financial guidance and our board of directors declared a cash dividend of 54 cents per share of common stock. The news release is furnished as Exhibit 99.1 and is incorporated by reference herein.


We also posted additional information in an investor presentation, attached hereto, as Exhibit 99.2. These materials are also available on our website, www.onegas.com.


The news release and the investor presentation are furnished as Exhibits 99.1 and 99.2 and incorporated by reference herein.


Item 8.01
 
Other Events


On April 27, 2020, our board of directors declared a cash dividend of 54 cents per share of common stock, payable June 1, 2020, to shareholders of record at the close of business May 13, 2020.


Item 9.01
 
Financial Statements and Exhibits


(d)
Exhibits


Exhibit
Number
 
Description


99.1


99.2


104
 
Cover Page Interactive Data File (embedded within the Inline XBRL document).


2


SIGNATURE

Pursuant to the requirements of the Exchange Act, the registrant has duly caused this report to be signed on its behalf by the undersigned, hereunto duly authorized.


ONE Gas, Inc.


Date:
April 27, 2020
By:
/s/ Caron A. Lawhorn


Caron A. Lawhorn
Senior Vice President and
Chief Financial Officer

3
Exhibit 99.1

logoletterheada99.jpg
April 27, 2020
 
Analyst Contact:
Brandon Lohse
918-947-7472
 
 
Media Contact:
Leah Harper
918-947-7123
ONE Gas Announces First Quarter 2020 Financial Results

Declares Second Quarter Dividend;
Affirms 2020 Financial Guidance

TULSA, Okla. - April 27, 2020 - ONE Gas, Inc. (NYSE: OGS) today announced its first quarter 2020 financial results, declared its quarterly dividend and affirmed its 2020 financial guidance.

ONE Gas is providing essential services during the COVID-19 pandemic. Following the guidance of the Centers for Disease Control and Prevention, Occupational Safety and Health Administration and third-party subject matter experts engaged by the company, a comprehensive set of policies, procedures and guidelines have been implemented to protect the safety of the company's employees, customers and communities as natural gas service continues to be provided to customers. ONE Gas continues to closely monitor developments related to the pandemic and will adjust its actions and operations as appropriate. Additional information regarding the impact of the pandemic to ONE Gas will be provided by management on the earnings conference call and in the investor presentation available on its website. Details for the conference call and webcast and a link to the investor presentation are provided later in this release. In addition, the company anticipates filing its Quarterly Report on Form 10-Q on April 28, 2020.
        
FIRST QUARTER 2020 KEY PERFORMANCE DRIVERS AND HIGHLIGHTS

First quarter 2020 net income was $91.7 million, or $1.72 per diluted share, compared with $93.7 million, or $1.76 per diluted share, in the first quarter 2019;
Actual heating degree days across the company's service areas were 4,714 in the first quarter 2020, 10% warmer than normal and 19% warmer than the same period last year;
Delivered natural gas sales volumes for the first quarter 2020 were 16% lower compared with the first quarter 2019, primarily as a result of the warmer weather;
The company ended the quarter with $474.7 million of commercial paper and $1.2 million in letters of credit outstanding, leaving $224.1 million available in its commercial paper program;
In February 2020, the company initiated an at-the-market equity program with an aggregate offering price up to $250 million. As of March 31, 2020, no shares have been issued or sold under the program;


-more-

 
ONE Gas Announces First Quarter 2020 Financial Results;
Declares Second Quarter Dividend; Affirms 2020 Financial Guidance
April 27, 2020
Page 2

In April 2020, the company entered into a $250 million, 364-day revolving credit agreement; and
The board of directors declared a quarterly dividend of $0.54 per share, or $2.16 per share on an annualized basis, payable on June 1, 2020, to shareholders of record at the close of business on May 13, 2020.

"In the midst of the COVID-19 pandemic, our focus remains on continuing to protect our workforce and customers while operating our systems safely during this difficult time," said Pierce H. Norton II, president and chief executive officer. "Our employees have displayed unwavering courage and resolve during these unprecedented times."

FIRST QUARTER 2020 FINANCIAL PERFORMANCE

ONE Gas reported operating income of $133.2 million in the first quarter 2020, compared with $127.6 million in the first quarter 2019.

Net margin, which is comprised of total revenues less cost of natural gas, increased by $6.2 million compared with first quarter 2019, which primarily reflects:

A $7.9 million increase from new rates primarily in Kansas and Texas;
A $2.5 million increase attributed to net residential customer growth; and
A $0.9 million increase in rider and surcharge recoveries due to a higher ad-valorem surcharge in Kansas; offset by
A $3.9 million decrease due to lower sales volumes, net of weather normalization, primarily in Kansas and Oklahoma from warmer weather in 2020 compared with the same period in 2019. For the first quarter 2020, heating degree days in Kansas and Oklahoma were 19% and 21% lower, respectively, compared with the same period in 2019; and
A $1.1 million decrease due to lower transportation volumes in Kansas.

First quarter 2020 operating costs were $121.4 million, compared with $124.5 million in the first quarter 2019, which primarily reflects:

A $2.0 million decrease in legal-related costs; and
A $1.6 million decrease in employee-related costs, which reflects a $4.3 million decrease in the expense associated with the change in the value of the liabilities for nonqualified employee benefit plans and a $1.2 million increase in labor costs; offset by
A $0.8 million increase in bad debt expense.

Depreciation and amortization expense for the first quarter 2020 was $47.5 million, compared with $43.8 million in the first quarter 2019, due primarily to an increase in depreciation expense from capital investments placed in service, higher depreciation rates in Kansas and an increase in amortization of the ad-valorem surcharge rider in Kansas.


-more-

 
ONE Gas Announces First Quarter 2020 Financial Results;
Declares Second Quarter Dividend; Affirms 2020 Financial Guidance
April 27, 2020
Page 3

For the first quarter 2020, other expense, net, increased $6.2 million compared with the same period last year, due primarily to a $6.7 million decrease in the value of investments associated with nonqualified employee benefit plans.

Income tax expense includes a credit for amortization of excess accumulated deferred income taxes (EDIT) of $6.9 million and $6.7 million for the quarters ended March 31, 2020, and 2019, respectively.

Capital expenditures and asset removal costs increased $29.0 million for the first quarter 2020 compared with the same period last year, due primarily to increased system integrity activities and extending service to new areas.

Key Statistics: More detailed information is listed in the tables located in the Appendix.

Actual heating degree days across the company’s service areas were 4,714 in the first quarter 2020, 10% warmer than normal and 19% warmer than the same period last year;
Actual heating degree days in the Oklahoma service area were 1,636 in the first quarter 2020, 8% warmer than normal and 21% warmer than the same period last year;
Actual heating degree days in the Kansas service area were 2,222 in the first quarter 2020, 10% warmer than normal and 19% warmer than the same period last year;
Actual heating degree days in the Texas service area were 856 in the first quarter 2020, 15% warmer than normal and 15% warmer than the same period last year;
Residential natural gas sales volumes were 55.2 billion cubic feet (Bcf) in the first quarter 2020, down 16% compared with the same period last year;
Total natural gas sales volumes were 72.6 Bcf in the first quarter 2020, down 16% compared with the same period last year;
Natural gas transportation volumes were 65.4 Bcf in the first quarter 2020, relatively unchanged compared with the same period last year; and
Total natural gas volumes delivered were 138.0 Bcf in the first quarter 2020, down 9% compared with the same period last year.

REGULATORY UPDATE

Oklahoma

In April 2020, the Public Utility Division of the Oklahoma Corporation Commission is expected to file an application to allow all utilities in Oklahoma to defer, as a regulatory asset, incremental expenses, including increased bad debt expenses and/or impacts to revenue that are outside the utility's control or a direct result of the utility's COVID-19 response, beginning March 13, 2020. Regulatory action on the proposed application is expected in the second quarter 2020.

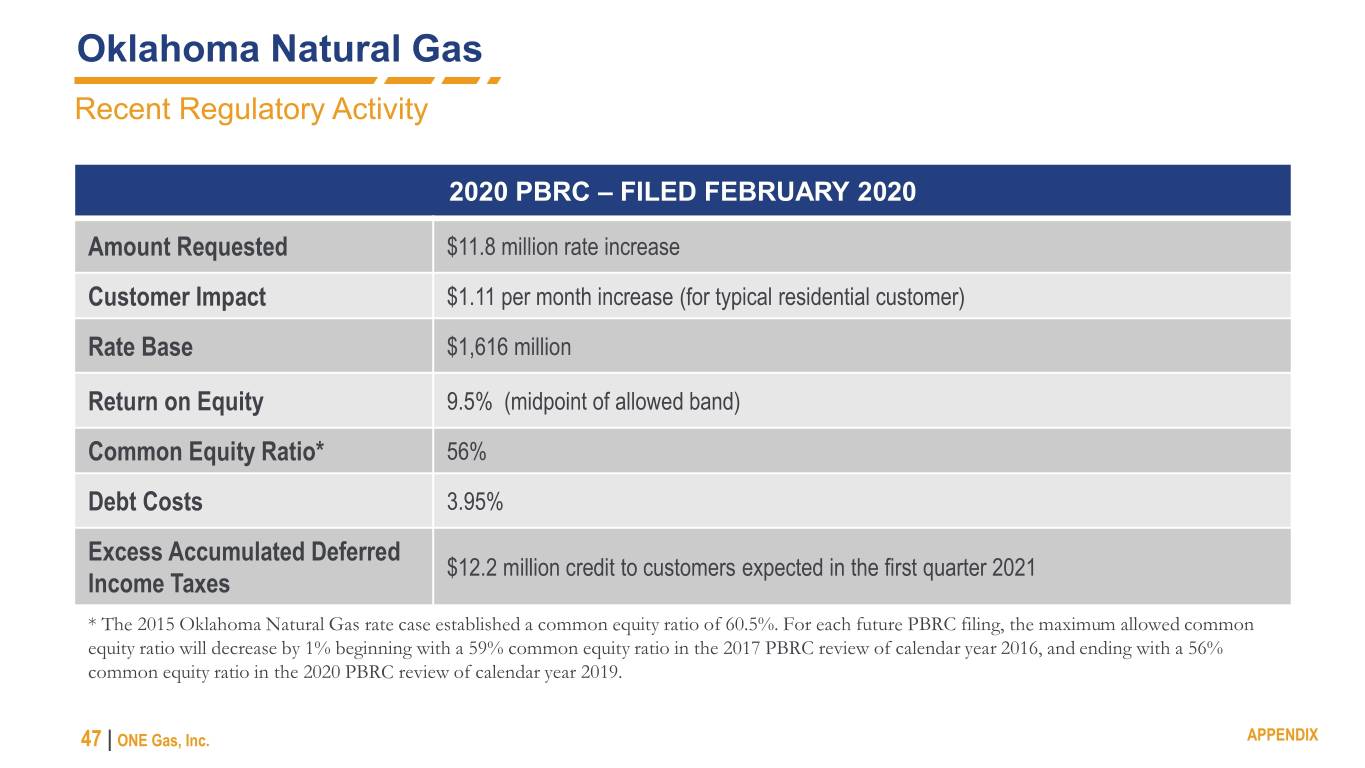
In February 2020, Oklahoma Natural Gas filed its fourth annual Performance-Based Rate Change (PBRC) application following the general rate case that was approved in January 2016. The filing includes a requested base rate increase of $11.8 million and a $12.2 million credit

-more-

 
ONE Gas Announces First Quarter 2020 Financial Results;
Declares Second Quarter Dividend; Affirms 2020 Financial Guidance
April 27, 2020
Page 4

associated with EDIT. If approved, new rates are expected to become effective in the third quarter of 2020, and EDIT is expected to be credited to customers in the first quarter 2021.

Kansas

In April 2020, Kansas Gas Service filed an application with the Kansas Corporation Commission for an Accounting Authority Order to accumulate and defer certain incremental costs incurred, including bad debt expenses and lost revenues, as well as associated carrying costs related to COVID-19 beginning March 1, 2020, for recovery in Kansas Gas Services' next rate case filing. Regulatory action on the proposed application is expected in the second quarter 2020.

Texas
    
In April 2020, the Railroad Commission of Texas issued an order authorizing utilities to use an accounting mechanism and a subsequent process through which Texas Gas Service may seek future recovery of incremental expenses resulting from the effects of COVID-19, including bad debt and associated credit and collections costs, and other reasonable and necessary incremental costs to address the impact of COVID-19, beginning March 13, 2020.

West Texas Service Area

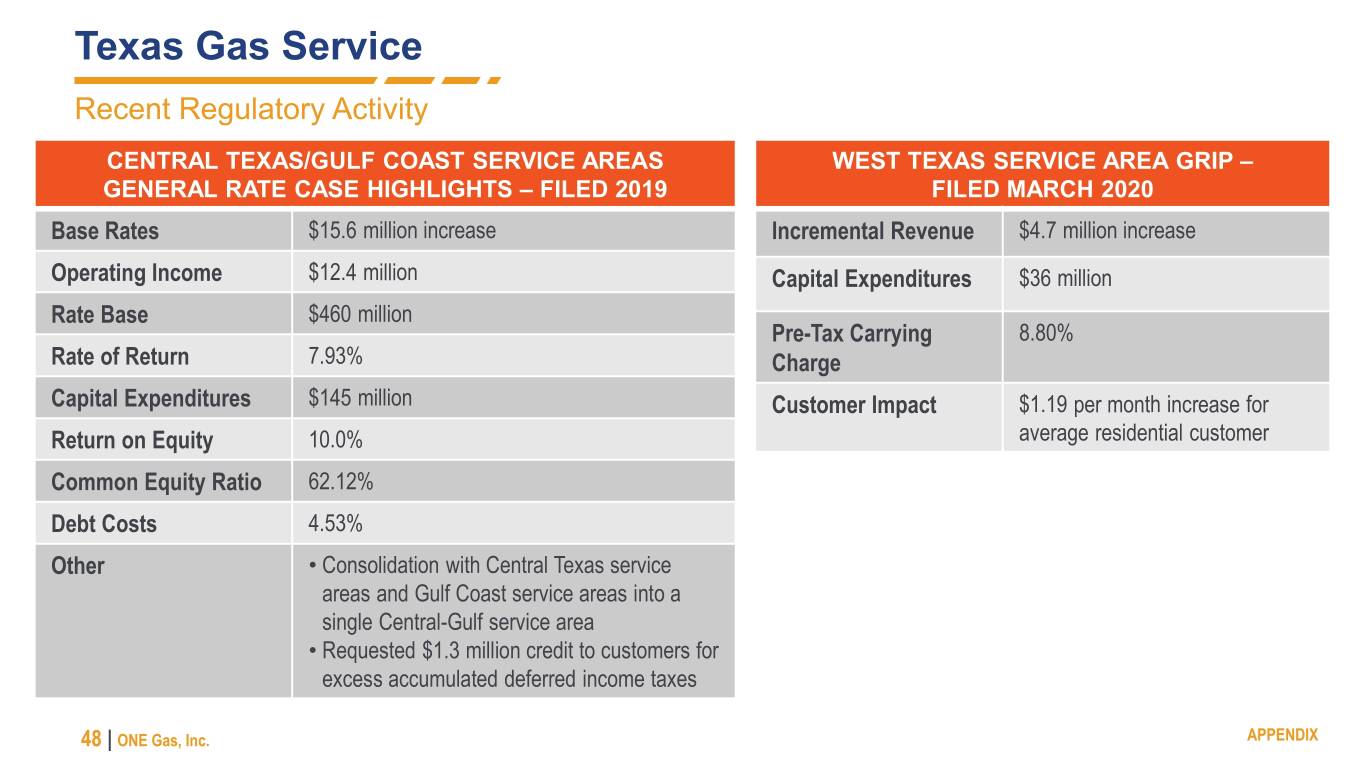
In March 2020, Texas Gas Service made Gas Reliability Infrastructure Program (GRIP) filings for all customers in the West Texas service area, requesting a $4.7 million increase to be effective in the third quarter 2020.

Central Texas Service Area

In 2019, Texas Gas Service filed a rate case for all customers in the Central Texas and Gulf Coast service areas, seeking a $15.6 million rate increase and a $1.3 million credit to customers associated with EDIT, and requesting to consolidate the two service areas into one. If approved, new rates are expected to become effective in the third quarter of 2020.

2020 FINANCIAL GUIDANCE

ONE Gas affirmed its 2020 financial guidance, with net income expected to be in the range of $186 million to $198 million, or $3.44 to $3.68 per diluted share.

Management expects a negative impact to earnings from lower revenues and net incremental expenses, including bad debt expenses, associated with the COVID-19 pandemic. This impact will be partially mitigated by regulatory assets established in accordance with the accounting orders that are expected to be received in all jurisdictions but could result in net income and diluted earnings per share below the midpoint of the guidance range.


-more-

 
ONE Gas Announces First Quarter 2020 Financial Results;
Declares Second Quarter Dividend; Affirms 2020 Financial Guidance
April 27, 2020
Page 5

EARNINGS CONFERENCE CALL AND WEBCAST

The ONE Gas executive management team will conduct a conference call on Tuesday, April 28, 2020, at 11 a.m. Eastern Daylight Time (10 a.m. Central Daylight Time). The call also will be carried live on the ONE Gas website.

To participate in the telephone conference call, dial 888-220-8451, pass code 1051355, or log on to www.onegas.com/investors and select Events and Presentations.

If you are unable to participate in the conference call or the webcast, a replay will be available on the ONE Gas website, www.onegas.com, for 30 days. A recording will be available by phone for seven days. The playback call may be accessed at 888-203-1112, pass code 1051355.

LINK TO INVESTOR PRESENTATION

An updated investor presentation can be found on the company's website, www.onegas.com/investors under Events and Presentations, or by following the link below.

https://www.onegas.com/files/doc_presentations/2020/04/04-2020-April-2020-Investor-Update.pdf 

NON-GAAP INFORMATION

ONE Gas has disclosed net margin in this news release, which is considered a non-GAAP financial metric used to measure the company's financial performance. Net margin is comprised of total revenues less cost of natural gas. Cost of natural gas includes commodity purchases, fuel, storage, transportation and other gas purchase costs recovered through our cost of natural gas regulatory mechanisms and does not include an allocation of general operating costs or depreciation and amortization. In addition, these regulatory mechanisms provide a method of recovering natural gas costs on an ongoing basis without a profit. Therefore, although our revenues will fluctuate with the cost of natural gas that we pass through to our customers, net margin is not affected by fluctuations in the cost of natural gas. Accordingly, we routinely use net margin in the analysis of our financial performance. We believe that net margin provides investors a more relevant and useful measure to analyze our financial performance as a 100% regulated natural gas utility than total revenues because the change in the cost of natural gas from period to period does not impact our operating income. A reconciliation of net margin to the most directly comparable GAAP measure is included as a table at the end of the earnings tables accompanying this release.

---------------------------------------------------------------------------------------------------------------------
ONE Gas, Inc. (NYSE: OGS) is a 100% regulated natural gas utility, and trades on the New York Stock Exchange under the symbol “OGS.” ONE Gas is included in the S&P MidCap 400 Index and is one of the largest natural gas utilities in the United States.

ONE Gas, headquartered in Tulsa, Oklahoma, provides natural gas distribution services to more than 2 million customers in Kansas, Oklahoma and Texas. Its divisions include Kansas Gas Service, the largest natural gas

-more-

 
ONE Gas Announces First Quarter 2020 Financial Results;
Declares Second Quarter Dividend; Affirms 2020 Financial Guidance
April 27, 2020
Page 6

distributor in Kansas; Oklahoma Natural Gas, the largest in Oklahoma; and Texas Gas Service, the third largest in Texas, in terms of customers.

For more information, visit the website at www.onegas.com.

Some of the statements contained and incorporated in this news release are forward-looking statements within the meaning of Section 27A of the Securities Act and Section 21E of the Exchange Act. The forward-looking statements relate to our anticipated financial performance, liquidity, management’s plans and objectives for our future operations, our business prospects, the outcome of regulatory and legal proceedings, market conditions and other matters. We make these forward-looking statements in reliance on the safe harbor protections provided under the Private Securities Litigation Reform Act of 1995. The following discussion is intended to identify important factors that could cause future outcomes to differ materially from those set forth in the forward-looking statements.

Forward-looking statements include the items identified in the preceding paragraph, the information concerning possible or assumed future results of our operations and other statements contained or incorporated in this news release identified by words such as "anticipate," "estimate," "expect," "project," "intend," "plan," "believe," "should," "goal," "forecast," "guidance," "could," "may," "continue," "might," "potential," "scheduled," "likely," and other words and terms of similar meaning.

One should not place undue reliance on forward-looking statements, which are applicable only as of the date of this news release.  Known and unknown risks, uncertainties and other factors may cause our actual results, performance or achievements to be materially different from any future results, performance or achievements expressed or implied by forward-looking statements. Those factors may affect our operations, markets, products, services and prices. In addition to any assumptions and other factors referred to specifically in connection with the forward-looking statements, factors that could cause our actual results to differ materially from those contemplated in any forward-looking statement include, among others, the following:

our ability to recover operating costs, income taxes and amounts equivalent to the cost of property, plant and equipment, regulatory assets and our allowed rate of return in our regulated rates;
our ability to manage our operations and maintenance costs;
changes in regulation of natural gas distribution services, particularly those in Oklahoma, Kansas and Texas;
the economic climate and, particularly, its effect on the natural gas requirements of our residential and commercial customers;
the length and severity of a pandemic or other health crisis, such as the recent outbreak of COVID-19, including its impacts to our operations, customers and employees, and the measures that international, federal, state and local governments, agencies, law enforcement and/or health authorities implement to address it, which may (as with COVID-19) precipitate or exacerbate one or more of the above-mentioned and/or other risks, and significantly disrupt or prevent us from operating our business in the ordinary course for an extended period;
competition from alternative forms of energy, including, but not limited to, electricity, solar power, wind power, geothermal energy and biofuels;
conservation and energy storage efforts of our customers;
variations in weather, including seasonal effects on demand, the occurrence of storms and disasters, and climate change;
indebtedness could make us more vulnerable to general adverse economic and industry conditions, limit our ability to borrow additional funds and/or place us at competitive disadvantage compared with competitors;
our ability to secure reliable, competitively priced and flexible natural gas transportation and supply, including decisions by natural gas producers to reduce production or shut-in producing natural gas wells and expiration of existing supply and transportation and storage arrangements that are not replaced with contracts with similar terms and pricing;
the mechanical integrity of facilities operated;
operational hazards and unforeseen operational interruptions;
adverse labor relations;
the effectiveness of our strategies to reduce earnings lag, margin protection strategies and risk mitigation strategies, which may be affected by risks beyond our control such as commodity price volatility and counterparty creditworthiness;
the availability of and access to, in general, funds to meet our debt obligations prior to or when they become due and to fund our operations and capital expenditures, either through (i) cash on hand, (ii) operating cash flow, or (iii) access to the capital markets;

-more-

 
ONE Gas Announces First Quarter 2020 Financial Results;
Declares Second Quarter Dividend; Affirms 2020 Financial Guidance
April 27, 2020
Page 7

changes in the financial markets during the periods covered by the forward-looking statements, particularly those affecting the availability of capital and our ability to refinance existing debt and fund investments and acquisitions;
actions of rating agencies, including the ratings of debt, general corporate ratings and changes in the rating agencies’ ratings criteria;
changes in inflation and interest rates;
our ability to recover the costs of natural gas purchased for our customers;
impact of potential impairment charges;
volatility and changes in markets for natural gas;
possible loss of local distribution company franchises or other adverse effects caused by the actions of municipalities;
payment and performance by counterparties and customers as contracted and when due;
changes in existing or the addition of new environmental, safety, tax and other laws to which we and our subsidiaries are subject;
the uncertainty of estimates, including accruals and costs of environmental remediation;
advances in technology, including technologies that increase efficiency or that improve electricity’s competitive position relative to natural gas;
population growth rates and changes in the demographic patterns of the markets we serve, and conditions in these areas’ housing markets;
acts of nature and the potential effects of threatened or actual terrorism and war;
cyber-attacks or breaches of technology systems that could disrupt our operations or result in the loss or exposure of confidential or sensitive customer, employee or company information;
the sufficiency of insurance coverage to cover losses;
the effects of our strategies to reduce tax payments;
the effects of litigation and regulatory investigations, proceedings, including our rate cases, or inquiries and the requirements of our regulators as a result of the Tax Cuts and Jobs Act of 2017;
changes in accounting standards;
changes in corporate governance standards;
discovery of material weaknesses in our internal controls;
our ability to comply with all covenants in our indentures, the ONE Gas Credit Agreement and the ONE Gas 364-day Credit Agreement, a violation of which, if not cured in a timely manner, could trigger a default of our obligations;
our ability to attract and retain talented employees, management and directors;
unexpected increases in the costs of providing health care benefits, along with pension and postretirement health care benefits, as well as declines in the discount rates on, declines in the market value of the debt and equity securities of, and increases in funding requirements for, our defined benefit plans;
the ability to successfully complete merger, acquisition or divestiture plans, regulatory or other limitations imposed as a result of a merger, acquisition or divestiture, and the success of the business following a merger, acquisition or divestiture; and
the costs associated with increased regulation and enhanced disclosure and corporate governance requirements pursuant to the Dodd-Frank Wall Street Reform and Consumer Protection Act of 2010.

These factors are not necessarily all of the important factors that could cause actual results to differ materially from those expressed in any of our forward-looking statements. Other factors could also have material adverse effects on our future results. These and other risks are described in greater detail in Part 1, Item 1A, Risk Factors, in our Annual Report. All forward-looking statements attributable to us or persons acting on our behalf are expressly qualified in their entirety by these factors. Other than as required under securities laws, we undertake no obligation to update publicly any forward-looking statement whether as a result of new information, subsequent events or change in circumstances, expectations or otherwise.


-more-

 
ONE Gas Announces First Quarter 2020 Financial Results;
Declares Second Quarter Dividend; Affirms 2020 Financial Guidance
April 27, 2020
Page 8

APPENDIX

ONE Gas, Inc.
CONSOLIDATED STATEMENTS OF INCOME


Three Months Ended
 
 
March 31,
(Unaudited)
 
2020
 
2019
 
 
(Thousands of dollars, except per share amounts)


Total revenues
 
$
528,168


$
661,000


Cost of natural gas
 
226,139


365,076


Operating expenses


Operations and maintenance
 
104,839


108,275

Depreciation and amortization
 
47,513


43,846

General taxes
 
16,473


16,184

Total operating expenses
 
168,825


168,305

Operating income
 
133,204


127,619

Other income (expense), net
 
(5,788
)

429

Interest expense, net
 
(15,693
)

(15,786
)
Income before income taxes
 
111,723


112,262

Income taxes
 
(20,046
)

(18,602
)
Net income
 
$
91,677


$
93,660


Earnings per share


Basic
 
$
1.73


$
1.77

Diluted
 
$
1.72


$
1.76


Average shares (thousands)


Basic
 
53,007


52,825

Diluted
 
53,268


53,206

Dividends declared per share of stock
 
$
0.54


$
0.50


-more-

 
ONE Gas Announces First Quarter 2020 Financial Results;
Declares Second Quarter Dividend; Affirms 2020 Financial Guidance
April 27, 2020
Page 9

APPENDIX

ONE Gas, Inc.
CONSOLIDATED BALANCE SHEETS


March 31,
 
December 31,
(Unaudited)
 
2020
 
2019
Assets
 
(Thousands of dollars)
Property, plant and equipment


Property, plant and equipment
 
$
6,536,625

 
$
6,433,119

Accumulated depreciation and amortization
 
1,901,738

 
1,867,893

Net property, plant and equipment
 
4,634,887

 
4,565,226

Current assets


Cash and cash equivalents
 
11,069

 
17,853

Accounts receivable, net
 
234,327

 
260,012

Materials and supplies
 
53,390

 
55,732

Natural gas in storage
 
48,032

 
104,259

Regulatory assets
 
39,808

 
47,440

Other current assets
 
21,041

 
20,906

Total current assets
 
407,667

 
506,202

Goodwill and other assets


Regulatory assets
 
380,686

 
391,036

Goodwill
 
157,953

 
157,953

Other assets
 
93,712

 
87,883

Total goodwill and other assets
 
632,351

 
636,872

Total assets
 
$
5,674,905

 
$
5,708,300


-more-

 
ONE Gas Announces First Quarter 2020 Financial Results;
Declares Second Quarter Dividend; Affirms 2020 Financial Guidance
April 27, 2020
Page 10

APPENDIX

ONE Gas, Inc.
CONSOLIDATED BALANCE SHEETS
(Continued)
 
 
March 31,
 
December 31,
(Unaudited)
 
2020
 
2019
Equity and Liabilities
 
(Thousands of dollars)
Equity and long-term debt


Common stock, $0.01 par value:
authorized 250,000,000 shares; issued and outstanding 52,860,808 shares at March 31, 2020;
    issued and outstanding 52,771,749 shares at December 31, 2019
 
$
529

 
$
528

Paid-in capital
 
1,729,587

 
1,733,092

Retained earnings
 
465,411

 
402,509

Accumulated other comprehensive loss
 
(6,515
)
 
(6,739
)
   Total equity
 
2,189,012

 
2,129,390

Long-term debt, excluding current maturities, and net of issuance costs of $10,823 and $10,936, respectively
 
1,286,193

 
1,286,064

Total equity and long-term debt
 
3,475,205

 
3,415,454

Current liabilities


Notes payable
 
474,695

 
516,500

Accounts payable
 
82,088

 
120,490

Accrued taxes other than income
 
46,774

 
47,956

Regulatory liabilities
 
33,649

 
45,201

Customer deposits
 
58,272

 
57,987

Other current liabilities
 
80,675

 
84,603

Total current liabilities
 
776,153

 
872,737

Deferred credits and other liabilities


Deferred income taxes
 
698,877

 
682,632

Regulatory liabilities
 
494,210

 
503,518

Employee benefit obligations
 
109,865

 
115,657

Other deferred credits
 
120,595

 
118,302

Total deferred credits and other liabilities
 
1,423,547

 
1,420,109

Commitments and contingencies


Total liabilities and equity
 
$
5,674,905

 
$
5,708,300


-more-

 
ONE Gas Announces First Quarter 2020 Financial Results;
Declares Second Quarter Dividend; Affirms 2020 Financial Guidance
April 27, 2020
Page 11

APPENDIX

ONE Gas, Inc.
CONSOLIDATED STATEMENTS OF CASH FLOWS
 
 
Three Months Ended
 
 
March 31,
(Unaudited)
 
2020
 
2019
 
 
(Thousands of dollars)
Operating activities


Net income
 
$
91,677

 
$
93,660

Adjustments to reconcile net income to net cash provided by operating activities:


Depreciation and amortization
 
47,513

 
43,846

Deferred income taxes
 
6,856

 
4,828

Share-based compensation expense
 
2,261

 
1,954

Provision for doubtful accounts
 
3,077

 
2,263

Changes in assets and liabilities:


Accounts receivable
 
22,608

 
(44,924
)
Materials and supplies
 
2,342

 
(2,562
)
Natural gas in storage
 
56,227

 
55,820

Asset removal costs
 
(9,888
)
 
(11,169
)
Accounts payable
 
(34,227
)
 
(53,172
)
Accrued taxes other than income
 
(1,182
)
 
4,263

Customer deposits
 
285

 
1,218

Regulatory assets and liabilities
 
4,932

 
29,090

Other assets and liabilities
 
(9,748
)
 
(2,824
)
Cash provided by operating activities
 
182,733

 
122,291

Investing activities


Capital expenditures
 
(113,517
)
 
(83,303
)
Other investing expenditures
 
(314
)
 
(3,351
)
Other investing receipts
 
650

 
311

Cash used in investing activities
 
(113,181
)
 
(86,343
)
Financing activities


Repayments on notes payable, net
 
(41,805
)
 
(4,000
)
Dividends paid
 
(28,543
)
 
(26,343
)
Tax withholdings related to net share settlements of stock compensation
 
(5,988
)
 
(7,300
)
Cash used in financing activities
 
(76,336
)
 
(37,643
)
Change in cash and cash equivalents
 
(6,784
)
 
(1,695
)
Cash and cash equivalents at beginning of period
 
17,853

 
21,323

Cash and cash equivalents at end of period
 
$
11,069

 
$
19,628


-more-

 
ONE Gas Announces First Quarter 2020 Financial Results;
Declares Second Quarter Dividend; Affirms 2020 Financial Guidance
April 27, 2020
Page 12

APPENDIX

ONE Gas, Inc.
INFORMATION AT A GLANCE
 
Three Months Ended
 
March 31,
(Unaudited)
2020
 
2019


Financial (in millions)


Net margin
$
302.1

 
$
295.9

Operating costs
$
121.4

 
$
124.5

Depreciation and amortization
$
47.5

 
$
43.8

Operating income
$
133.2

 
$
127.6

Capital expenditures and asset removal costs
$
123.4

 
$
94.4


Net margin on natural gas sales
$
260.7

 
$
253.5

Transportation revenues
$
34.2

 
$
35.0

Other revenues
$
7.2

 
$
7.4


Volumes (Bcf)


Natural gas sales


Residential
 
55.2


65.7

Commercial and industrial
 
16.3


19.3

Other
 
1.0


1.1

Total sales volumes delivered
 
72.6


86.1

Transportation
 
65.4


65.6

Total volumes delivered
 
138.0


151.7


Average number of customers (in thousands)


Residential
 
2,043


2,027

Commercial and industrial
 
163


162

Other
 
3


3

Transportation
 
12


12

Total customers
 
2,221


2,204


Heating Degree Days


Actual degree days
 
4,714


5,831

Normal degree days
 
5,246


5,309

Percent colder (warmer) than normal weather
 
(10.1
)%
 
 
9.8
 %


Statistics by State


Oklahoma


Average number of customers (in thousands)
 
895


889

Actual degree days
 
1,636


2,077

Normal degree days
 
1,775


1,775

Percent colder (warmer) than normal weather
 
(7.8
)%


17.0
 %


Kansas


Average number of customers (in thousands)
 
648


647

Actual degree days
 
2,222


2,751

Normal degree days
 
2,461


2,528

Percent colder (warmer) than normal weather
 
(9.7
)%


8.8
 %


Texas


Average number of customers (in thousands)
 
678


668

Actual degree days
 
856


1,003

Normal degree days
 
1,010


1,006

Percent colder (warmer) than normal weather
 
(15.2
)%


(0.3
)%
      

-more-

 
ONE Gas Announces First Quarter 2020 Financial Results;
Declares Second Quarter Dividend; Affirms 2020 Financial Guidance
April 27, 2020
Page 13

APPENDIX

RECONCILIATION OF NON-GAAP FINANCIAL MEASURE


Reconciliation of total revenues to net margin (non-GAAP)


Three Months Ended
 
 
March 31,
(Unaudited)
 
2020
 
2019
 
 
(Thousands of dollars)
Total revenues
 
$
528,168

 
$
661,000

Cost of natural gas
 
226,139

 
365,076

Net margin

$
302,029

 
$
295,924


###
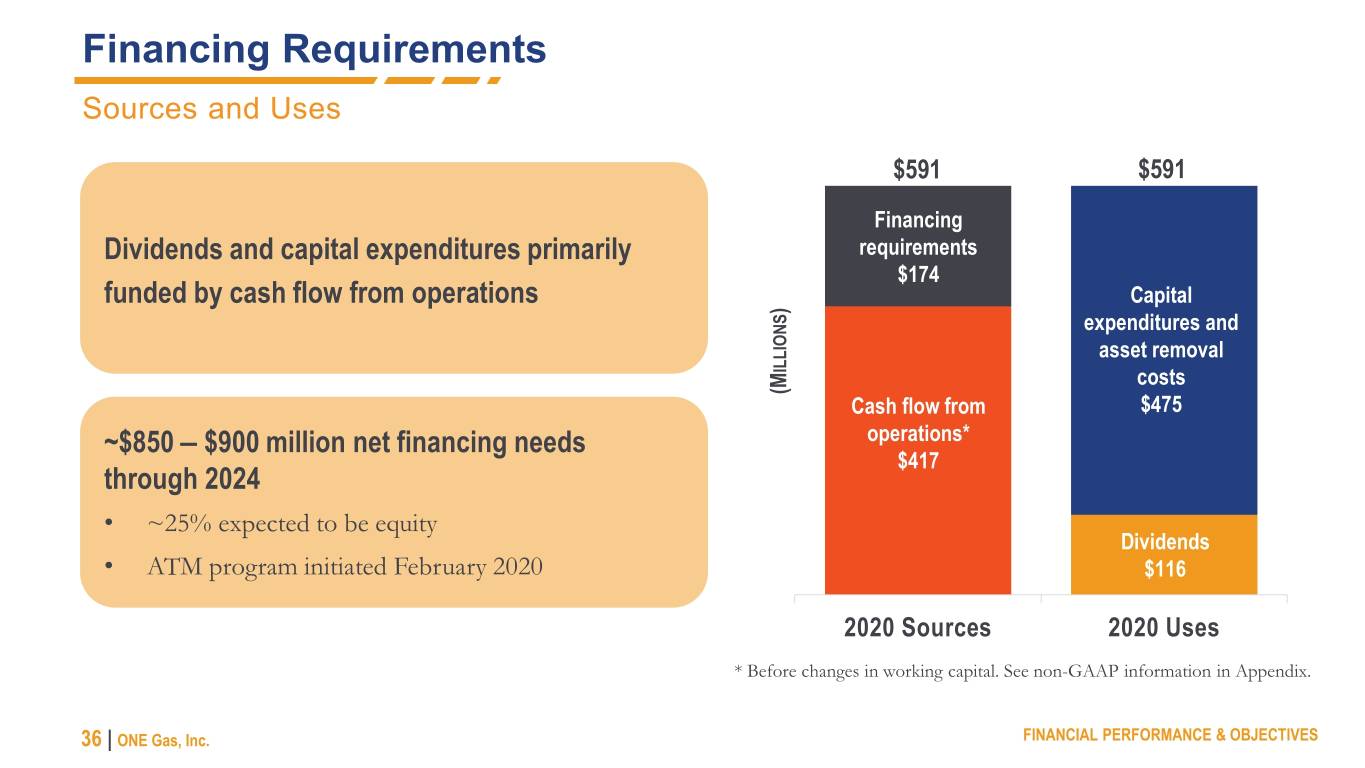
Exhibit 99.2 INVESTOR UPDATE April 27, 2020


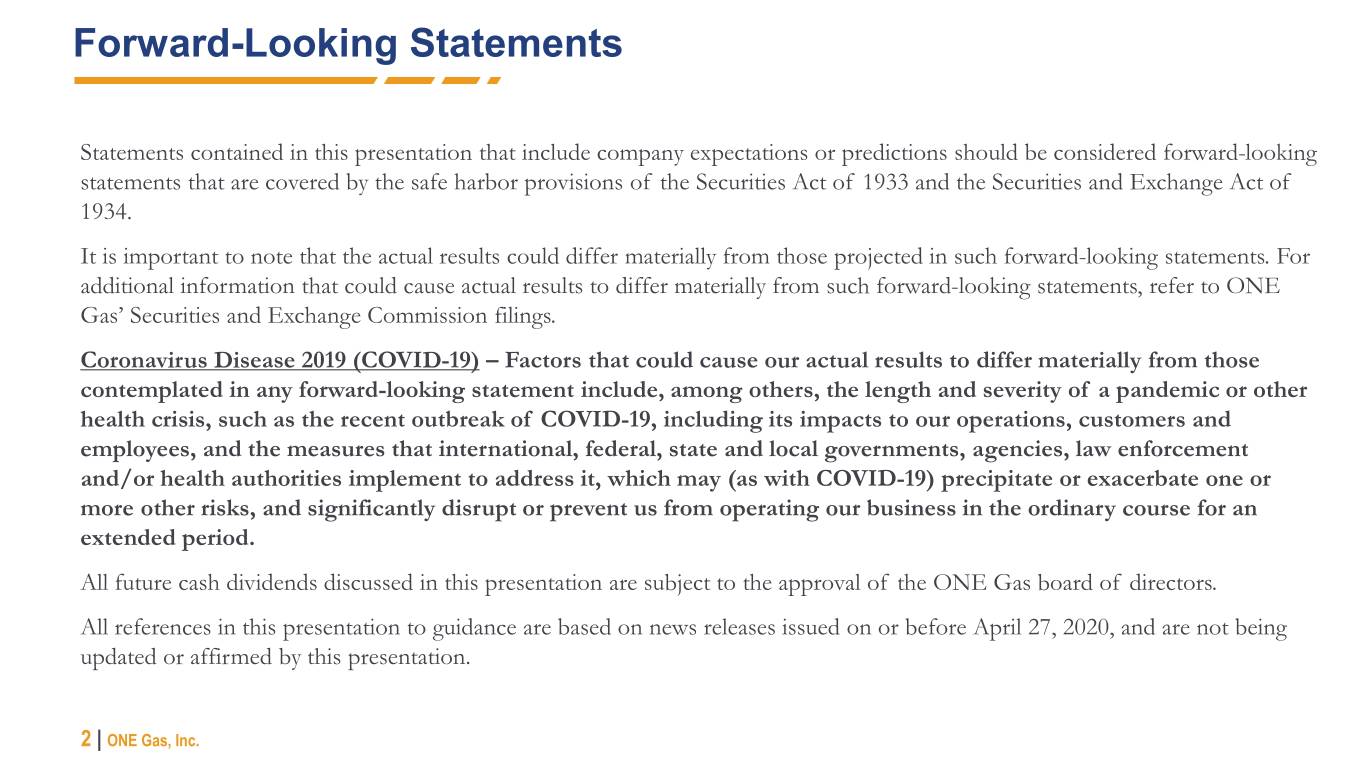
Forward-Looking Statements Statements contained in this presentation that include company expectations or predictions should be considered forward-looking statements that are covered by the safe harbor provisions of the Securities Act of 1933 and the Securities and Exchange Act of 1934. It is important to note that the actual results could differ materially from those projected in such forward-looking statements. For additional information that could cause actual results to differ materially from such forward-looking statements, refer to ONE Gas’ Securities and Exchange Commission filings. Coronavirus Disease 2019 (COVID-19) – Factors that could cause our actual results to differ materially from those contemplated in any forward-looking statement include, among others, the length and severity of a pandemic or other health crisis, such as the recent outbreak of COVID-19, including its impacts to our operations, customers and employees, and the measures that international, federal, state and local governments, agencies, law enforcement and/or health authorities implement to address it, which may (as with COVID-19) precipitate or exacerbate one or more other risks, and significantly disrupt or prevent us from operating our business in the ordinary course for an extended period. All future cash dividends discussed in this presentation are subject to the approval of the ONE Gas board of directors. All references in this presentation to guidance are based on news releases issued on or before April 27, 2020, and are not being updated or affirmed by this presentation. 2 | ONE Gas, Inc.


RESPONSE TO COVID-19


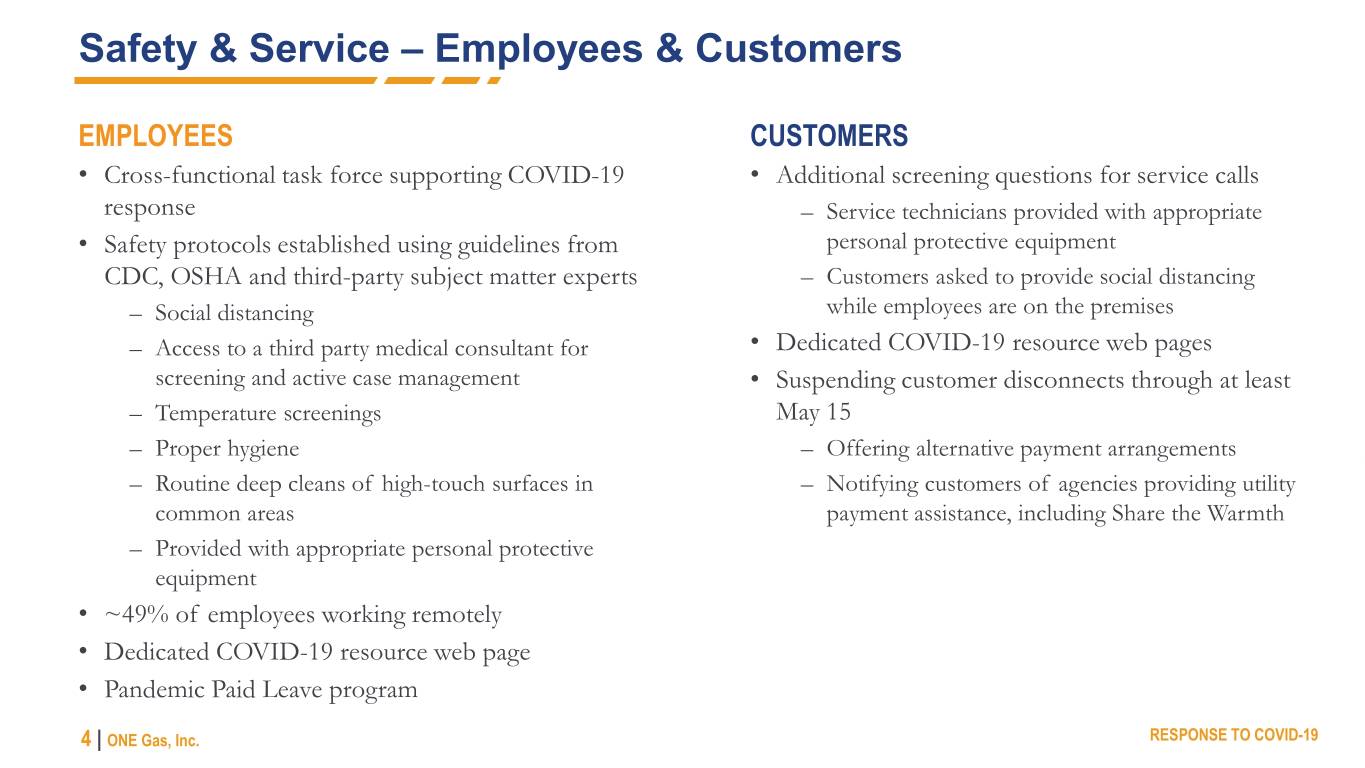
Safety & Service – Employees & Customers EMPLOYEES CUSTOMERS • Cross-functional task force supporting COVID-19 • Additional screening questions for service calls response – Service technicians provided with appropriate • Safety protocols established using guidelines from personal protective equipment CDC, OSHA and third-party subject matter experts – Customers asked to provide social distancing – Social distancing while employees are on the premises – Access to a third party medical consultant for • Dedicated COVID-19 resource web pages screening and active case management • Suspending customer disconnects through at least – Temperature screenings May 15 – Proper hygiene – Offering alternative payment arrangements – Routine deep cleans of high-touch surfaces in – Notifying customers of agencies providing utility common areas payment assistance, including Share the Warmth – Provided with appropriate personal protective equipment • ~49% of employees working remotely • Dedicated COVID-19 resource web page • Pandemic Paid Leave program 4 | ONE Gas, Inc. RESPONSE TO COVID-19


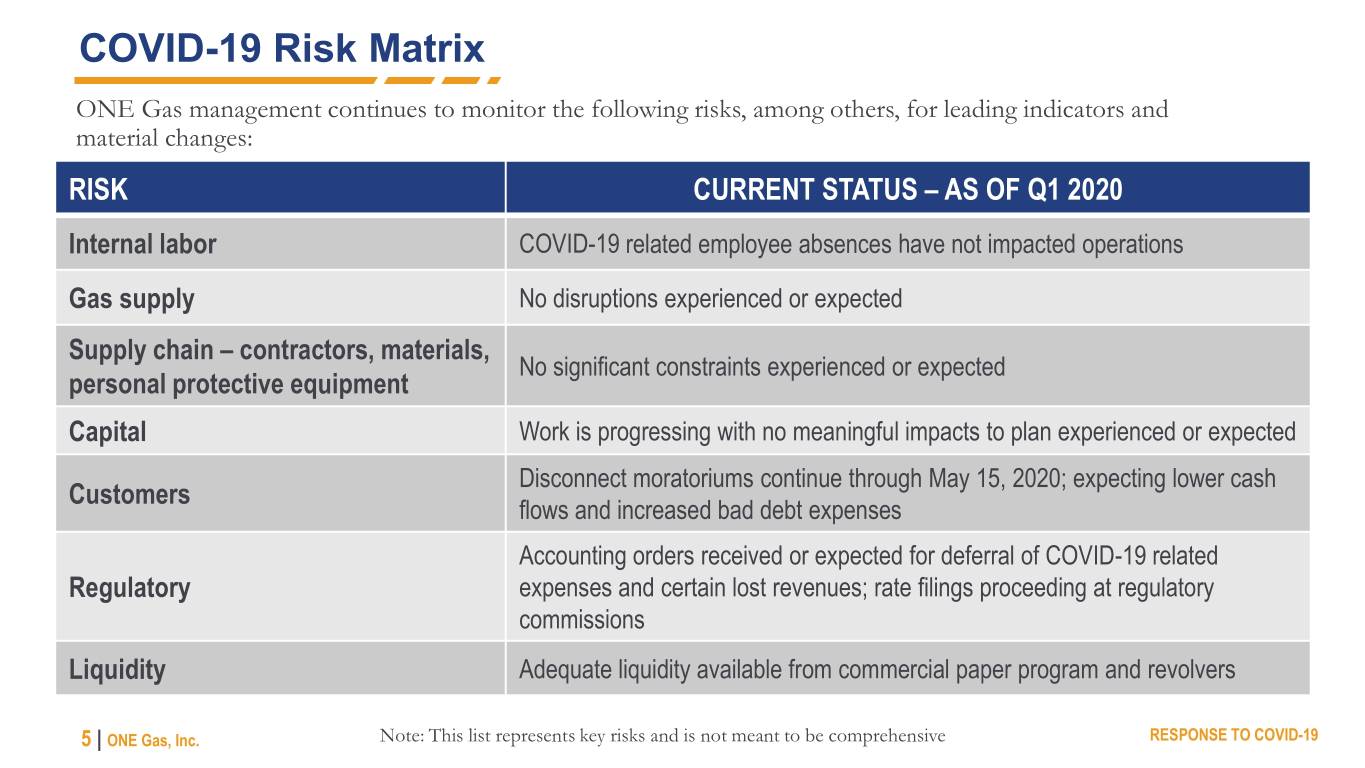
COVID-19 Risk Matrix ONE Gas management continues to monitor the following risks, among others, for leading indicators and material changes: RISK CURRENT STATUS – AS OF Q1 2020 Internal labor COVID-19 related employee absences have not impacted operations Gas supply No disruptions experienced or expected Supply chain – contractors, materials, No significant constraints experienced or expected personal protective equipment Capital Work is progressing with no meaningful impacts to plan experienced or expected Disconnect moratoriums continue through May 15, 2020; expecting lower cash Customers flows and increased bad debt expenses Accounting orders received or expected for deferral of COVID-19 related Regulatory expenses and certain lost revenues; rate filings proceeding at regulatory commissions Liquidity Adequate liquidity available from commercial paper program and revolvers 5 | ONE Gas, Inc. Note: This list represents key risks and is not meant to be comprehensive RESPONSE TO COVID-19


VALUE CREATION STRATEGY


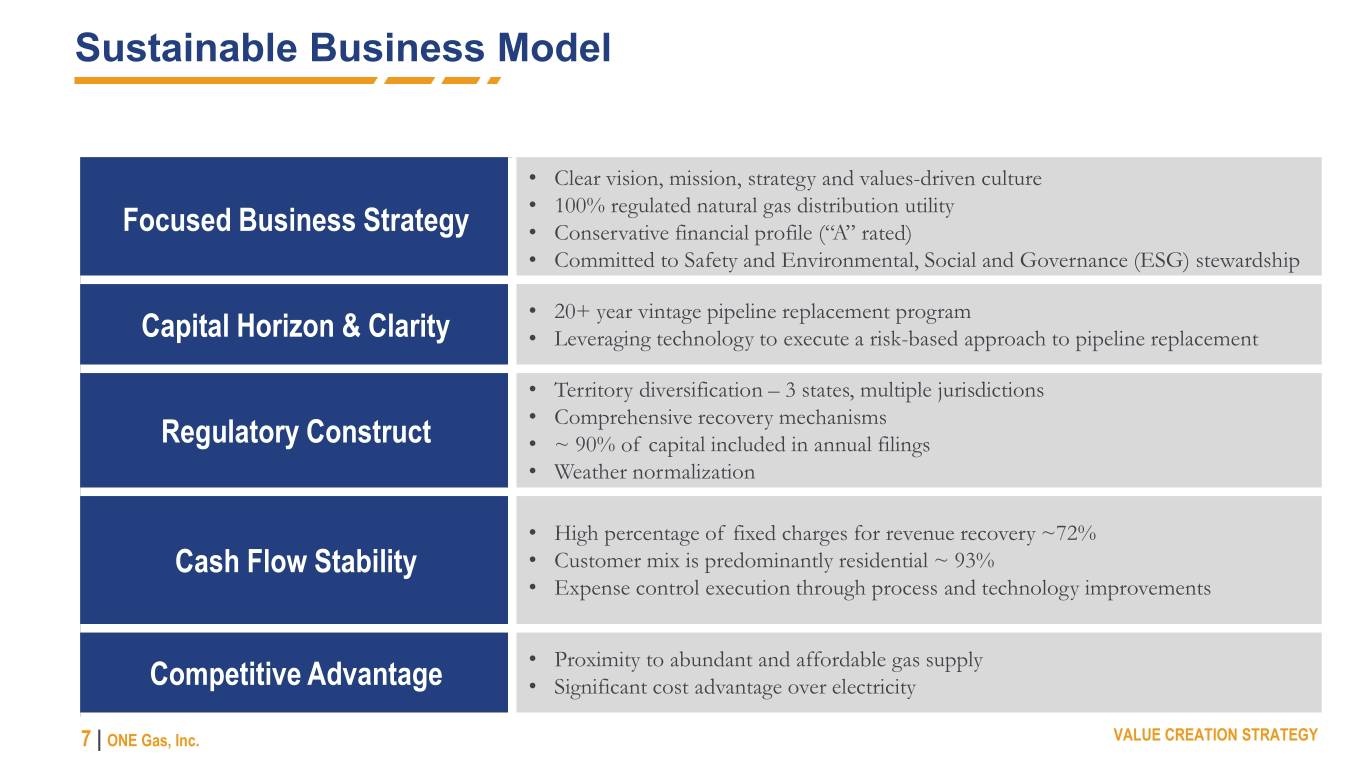
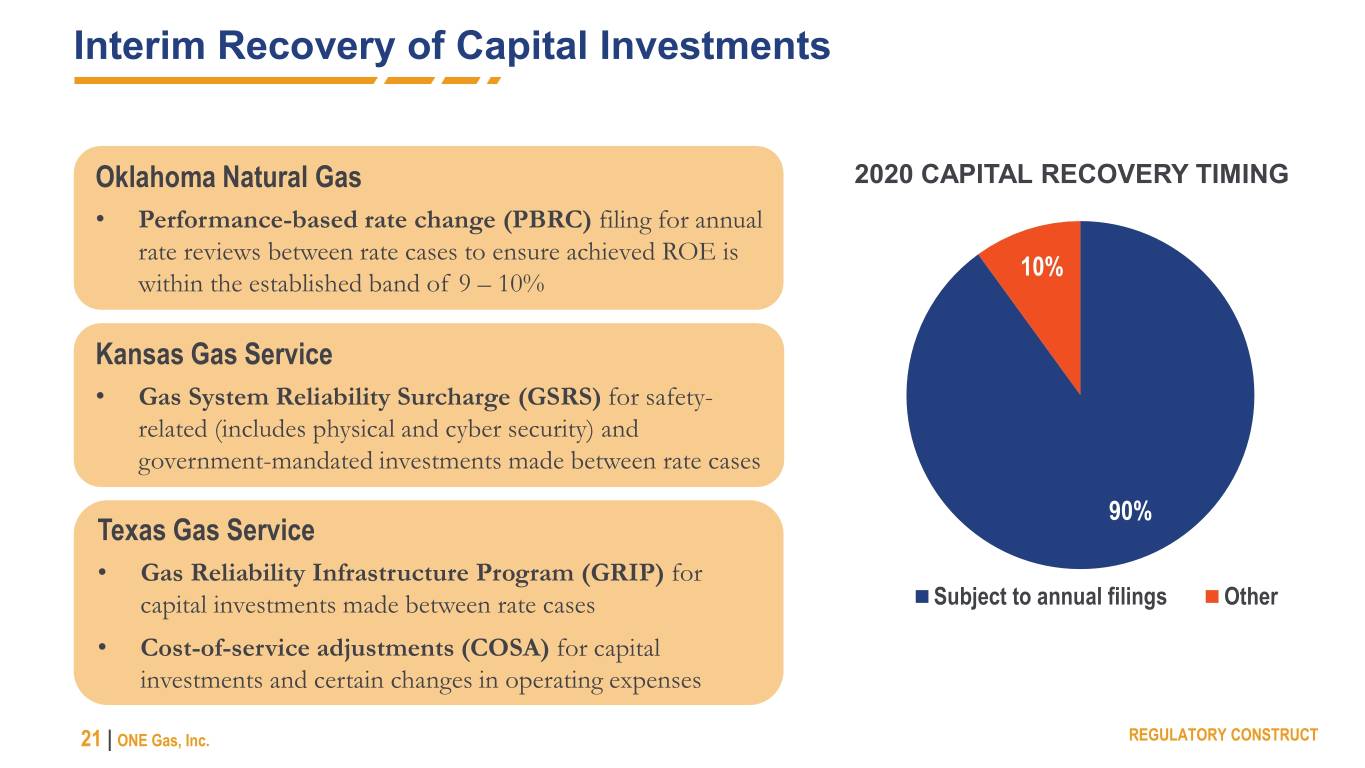
Sustainable Business Model • Clear vision, mission, strategy and values-driven culture • 100% regulated natural gas distribution utility Focused Business Strategy • Conservative financial profile (“A” rated) • Committed to Safety and Environmental, Social and Governance (ESG) stewardship • 20+ year vintage pipeline replacement program Capital Horizon & Clarity • Leveraging technology to execute a risk-based approach to pipeline replacement • Territory diversification – 3 states, multiple jurisdictions • Comprehensive recovery mechanisms Regulatory Construct • ~ 90% of capital included in annual filings • Weather normalization • High percentage of fixed charges for revenue recovery ~72% Cash Flow Stability • Customer mix is predominantly residential ~ 93% • Expense control execution through process and technology improvements • Proximity to abundant and affordable gas supply Competitive Advantage • Significant cost advantage over electricity 7 | ONE Gas, Inc. VALUE CREATION STRATEGY


FOCUSED BUSINESS STRATEGY


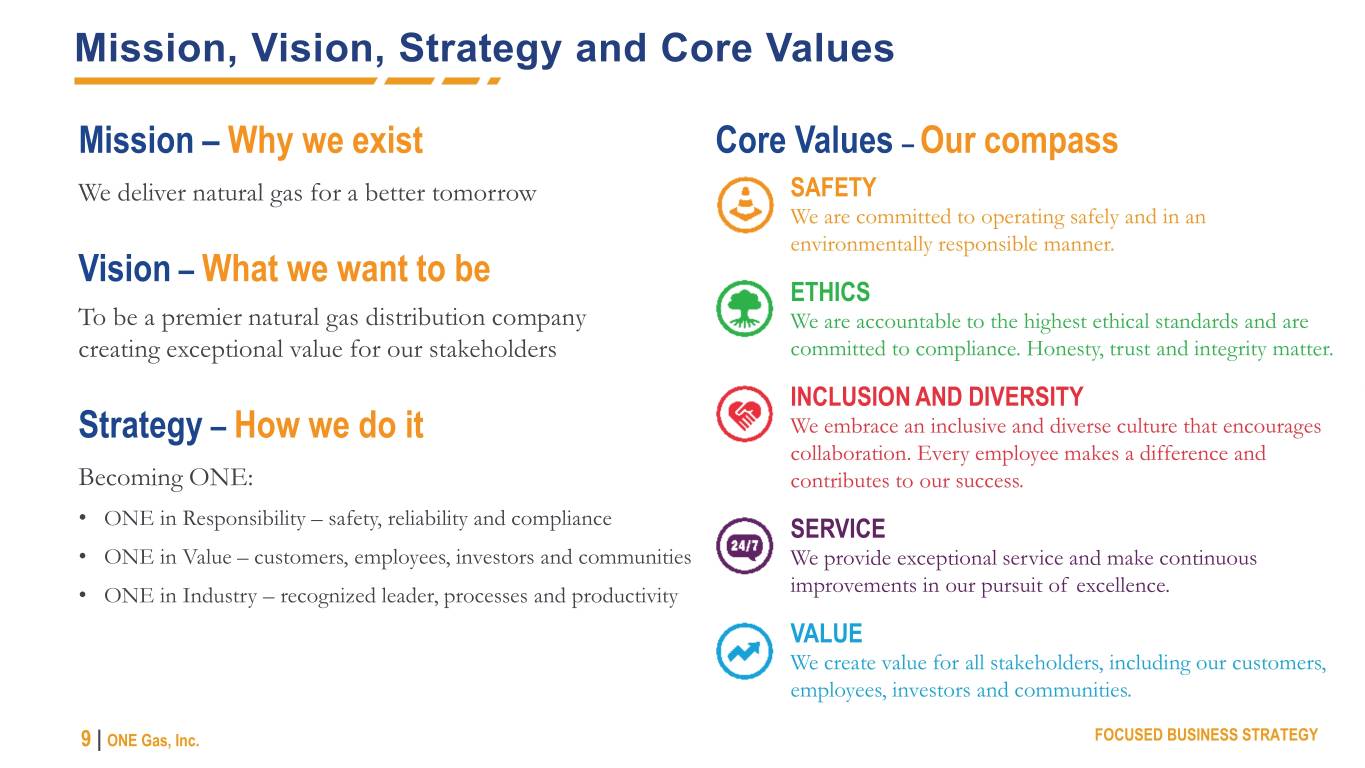
Mission, Vision, Strategy and Core Values Mission – Why we exist Core Values – Our compass We deliver natural gas for a better tomorrow SAFETY We are committed to operating safely and in an environmentally responsible manner. Vision – What we want to be ETHICS To be a premier natural gas distribution company We are accountable to the highest ethical standards and are creating exceptional value for our stakeholders committed to compliance. Honesty, trust and integrity matter. INCLUSION AND DIVERSITY Strategy – How we do it We embrace an inclusive and diverse culture that encourages collaboration. Every employee makes a difference and Becoming ONE: contributes to our success. • ONE in Responsibility – safety, reliability and compliance SERVICE • ONE in Value – customers, employees, investors and communities We provide exceptional service and make continuous • ONE in Industry – recognized leader, processes and productivity improvements in our pursuit of excellence. VALUE We create value for all stakeholders, including our customers, employees, investors and communities. 9 | ONE Gas, Inc. FOCUSED BUSINESS STRATEGY


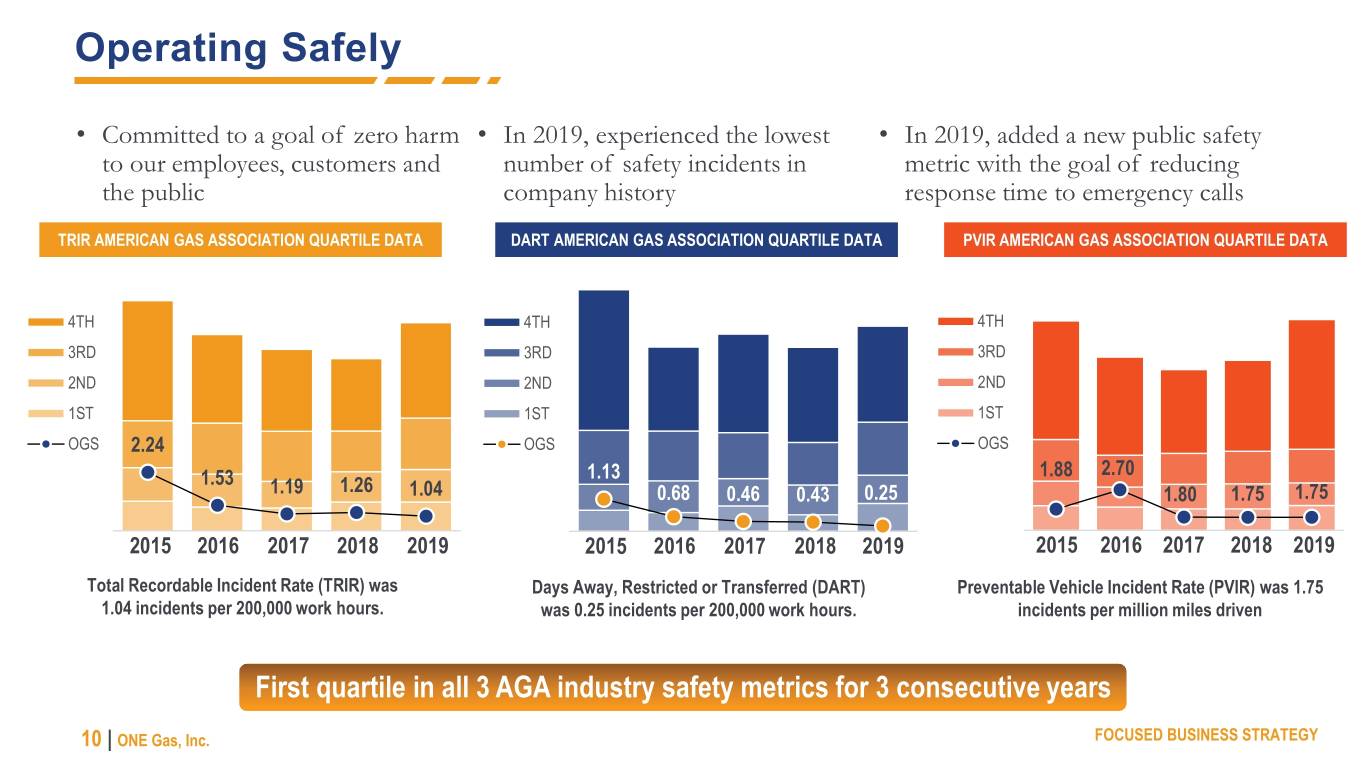
Operating Safely • Committed to a goal of zero harm • In 2019, experienced the lowest • In 2019, added a new public safety to our employees, customers and number of safety incidents in metric with the goal of reducing the public company history response time to emergency calls TRIR AMERICAN GAS ASSOCIATION QUARTILE DATA DART AMERICAN GAS ASSOCIATION QUARTILE DATA PVIR AMERICAN GAS ASSOCIATION QUARTILE DATA 4TH 4TH 4TH 3RD 3RD 3RD 2ND 2ND 2ND 1ST 1ST 1ST OGS 2.24 OGS OGS 1.53 1.13 1.88 2.70 1.19 1.26 1.04 0.68 0.46 0.43 0.25 1.80 1.75 1.75 2015 2016 2017 2018 2019 2015 2016 2017 2018 2019 2015 2016 2017 2018 2019 Total Recordable Incident Rate (TRIR) was Days Away, Restricted or Transferred (DART) Preventable Vehicle Incident Rate (PVIR) was 1.75 1.04 incidents per 200,000 work hours. was 0.25 incidents per 200,000 work hours. incidents per million miles driven First quartile in all 3 AGA industry safety metrics for 3 consecutive years 10 | ONE Gas, Inc. FOCUSED BUSINESS STRATEGY


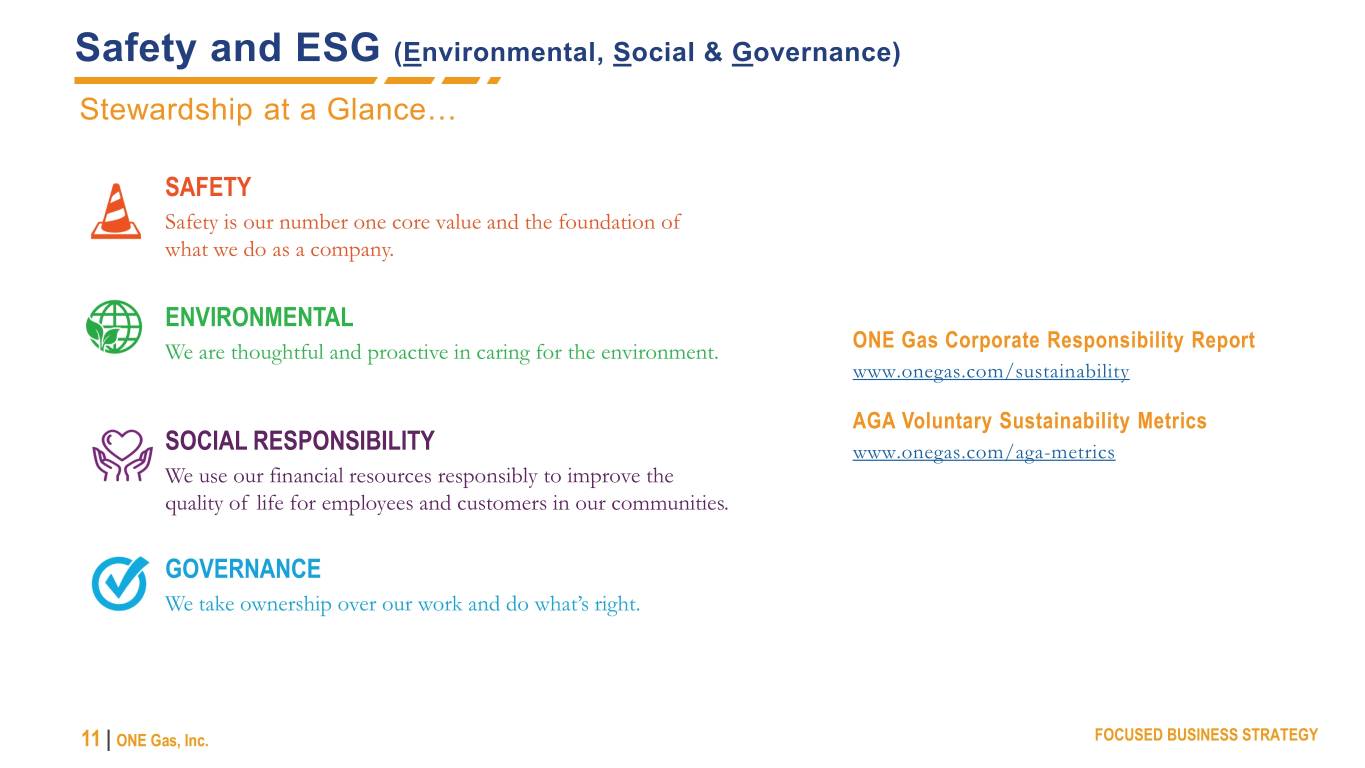
Safety and ESG (Environmental, Social & Governance) Stewardship at a Glance… SAFETY Safety is our number one core value and the foundation of what we do as a company. ENVIRONMENTAL We are thoughtful and proactive in caring for the environment. ONE Gas Corporate Responsibility Report www.onegas.com/sustainability AGA Voluntary Sustainability Metrics SOCIAL RESPONSIBILITY www.onegas.com/aga-metrics We use our financial resources responsibly to improve the quality of life for employees and customers in our communities. GOVERNANCE We take ownership over our work and do what’s right. 11 | ONE Gas, Inc. FOCUSED BUSINESS STRATEGY


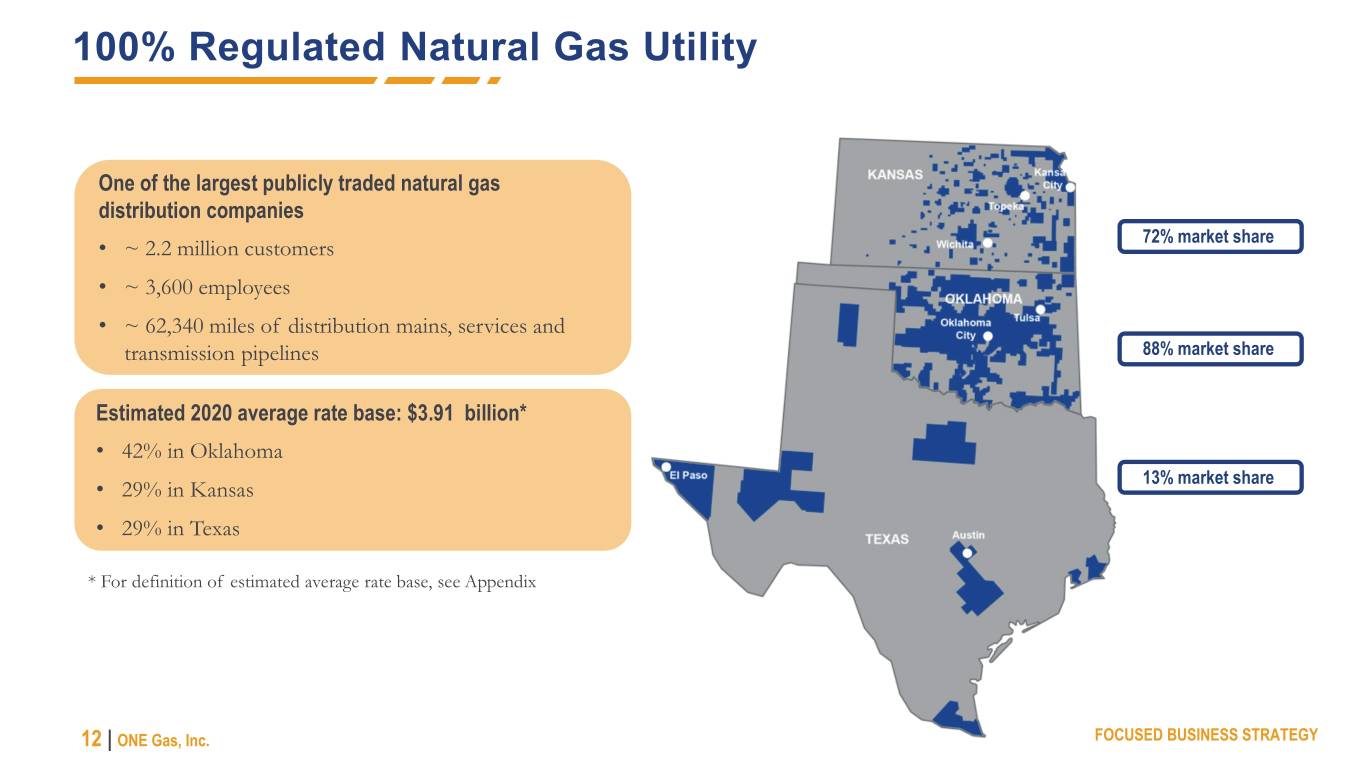
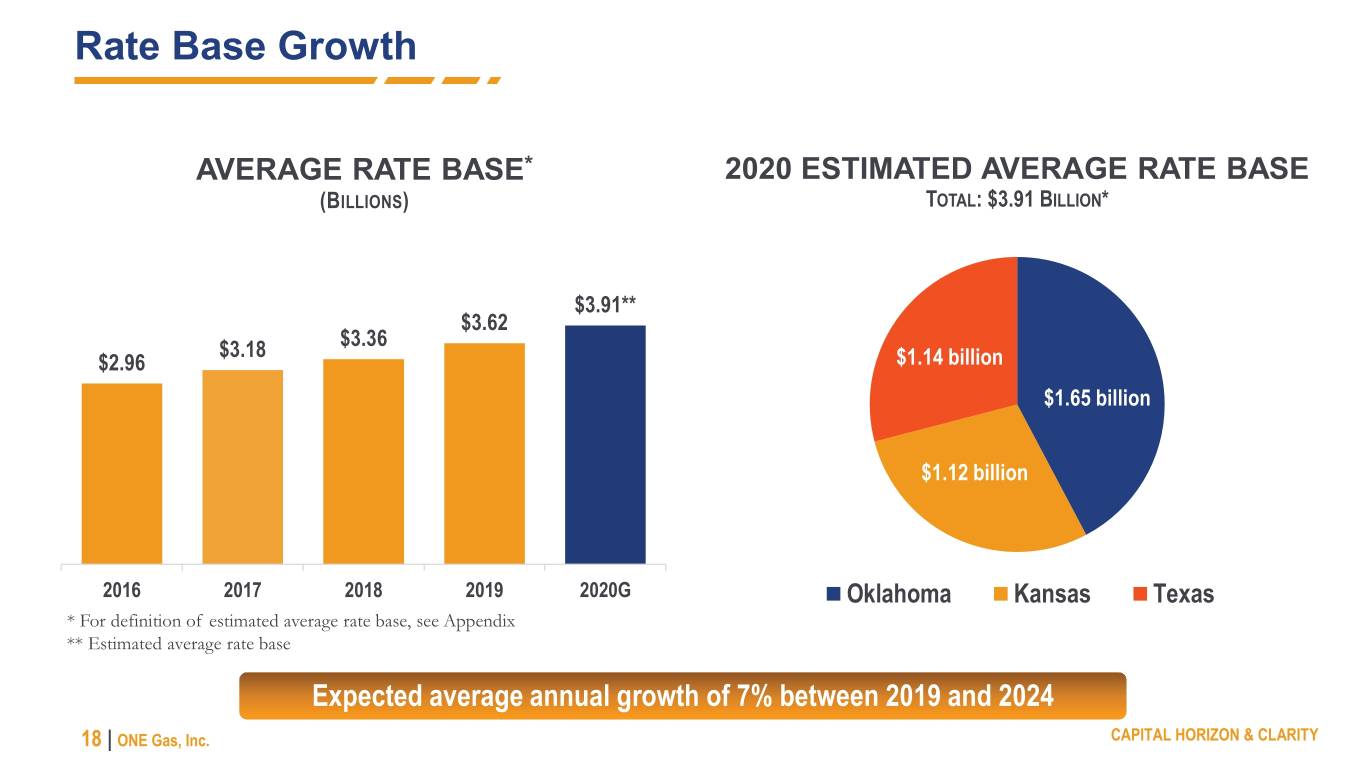
100% Regulated Natural Gas Utility One of the largest publicly traded natural gas distribution companies 72% market share • ~ 2.2 million customers • ~ 3,600 employees • ~ 62,340 miles of distribution mains, services and transmission pipelines 88% market share Estimated 2020 average rate base: $3.91 billion* • 42% in Oklahoma 13% market share • 29% in Kansas • 29% in Texas * For definition of estimated average rate base, see Appendix 12 | ONE Gas, Inc. FOCUSED BUSINESS STRATEGY


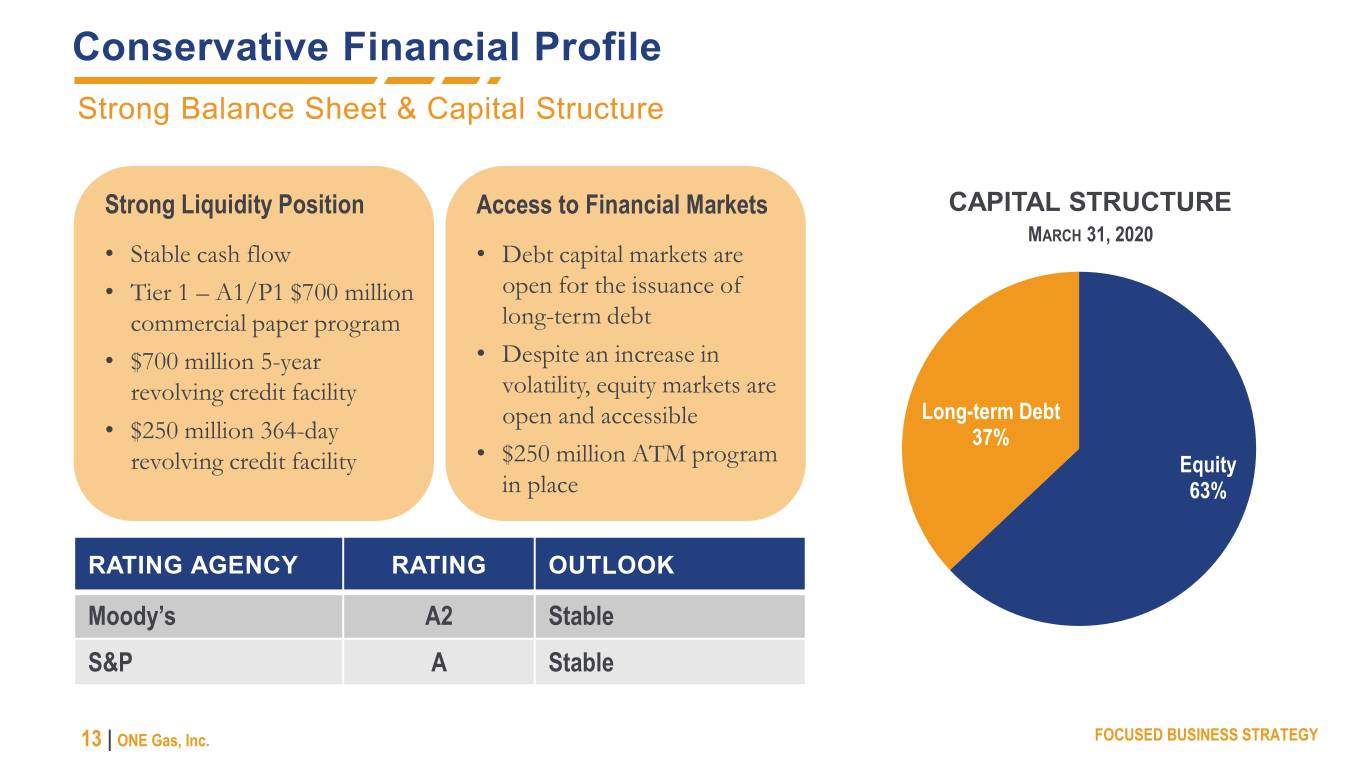
Conservative Financial Profile Strong Balance Sheet & Capital Structure Strong Liquidity Position Access to Financial Markets CAPITAL STRUCTURE MARCH 31, 2020 • Stable cash flow • Debt capital markets are • Tier 1 – A1/P1 $700 million open for the issuance of commercial paper program long-term debt • $700 million 5-year • Despite an increase in revolving credit facility volatility, equity markets are open and accessible Long-term Debt • $250 million 364-day 37% revolving credit facility • $250 million ATM program Equity in place 63% RATING AGENCY RATING OUTLOOK Moody’s A2 Stable S&P A Stable 13 | ONE Gas, Inc. FOCUSED BUSINESS STRATEGY


CAPITAL HORIZON & CLARITY


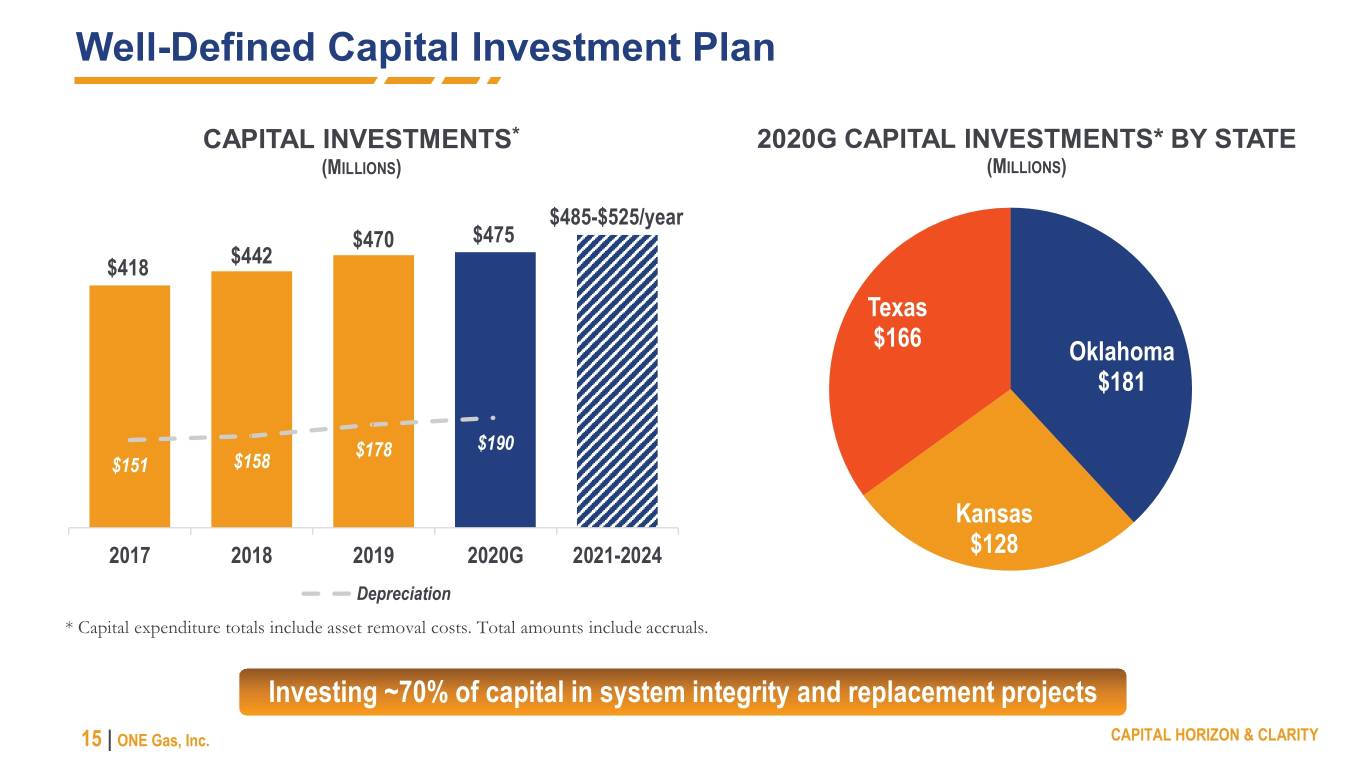
Well-Defined Capital Investment Plan CAPITAL INVESTMENTS* 2020G CAPITAL INVESTMENTS* BY STATE (MILLIONS) (MILLIONS) $485-$525/year $470 $475 $442 $418 Texas $166 Oklahoma $181 $178 $190 $151 $158 Kansas 2017 2018 2019 2020G 2021-2024 $128 Depreciation * Capital expenditure totals include asset removal costs. Total amounts include accruals. Investing ~70% of capital in system integrity and replacement projects 15 | ONE Gas, Inc. CAPITAL HORIZON & CLARITY


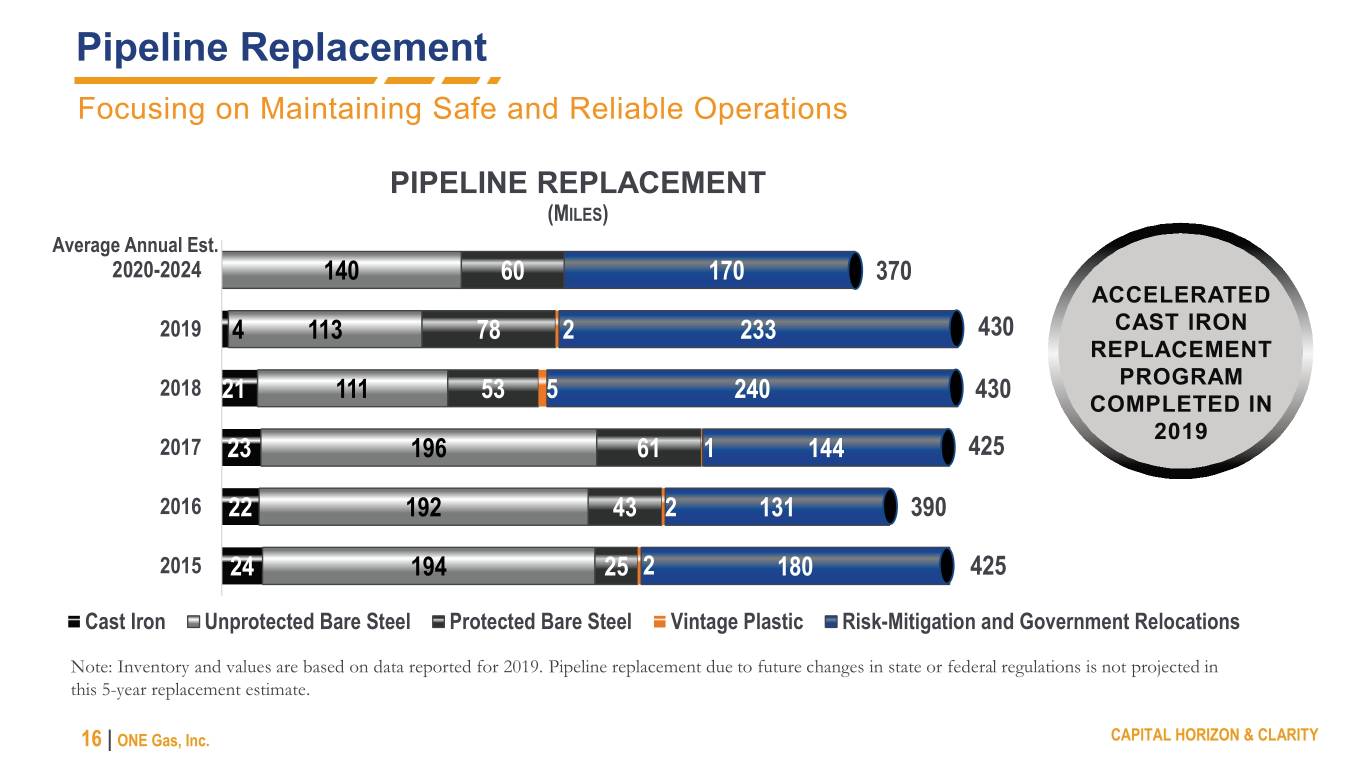
Pipeline Replacement Focusing on Maintaining Safe and Reliable Operations PIPELINE REPLACEMENT (MILES) Average Annual Est. 2020-2024 140 60 170 370 ACCELERATED 2019 4 113 78 2 233 430 CAST IRON REPLACEMENT 2018 21 111 53 5 240 430 PROGRAM COMPLETED IN 2019 2017 23 196 61 1 144 425 2016 22 192 43 2 131 390 2015 24 194 25 2 180 425 Cast Iron Unprotected Bare Steel Protected Bare Steel Vintage Plastic Risk-Mitigation and Government Relocations Note: Inventory and values are based on data reported for 2019. Pipeline replacement due to future changes in state or federal regulations is not projected in this 5-year replacement estimate. 16 | ONE Gas, Inc. CAPITAL HORIZON & CLARITY


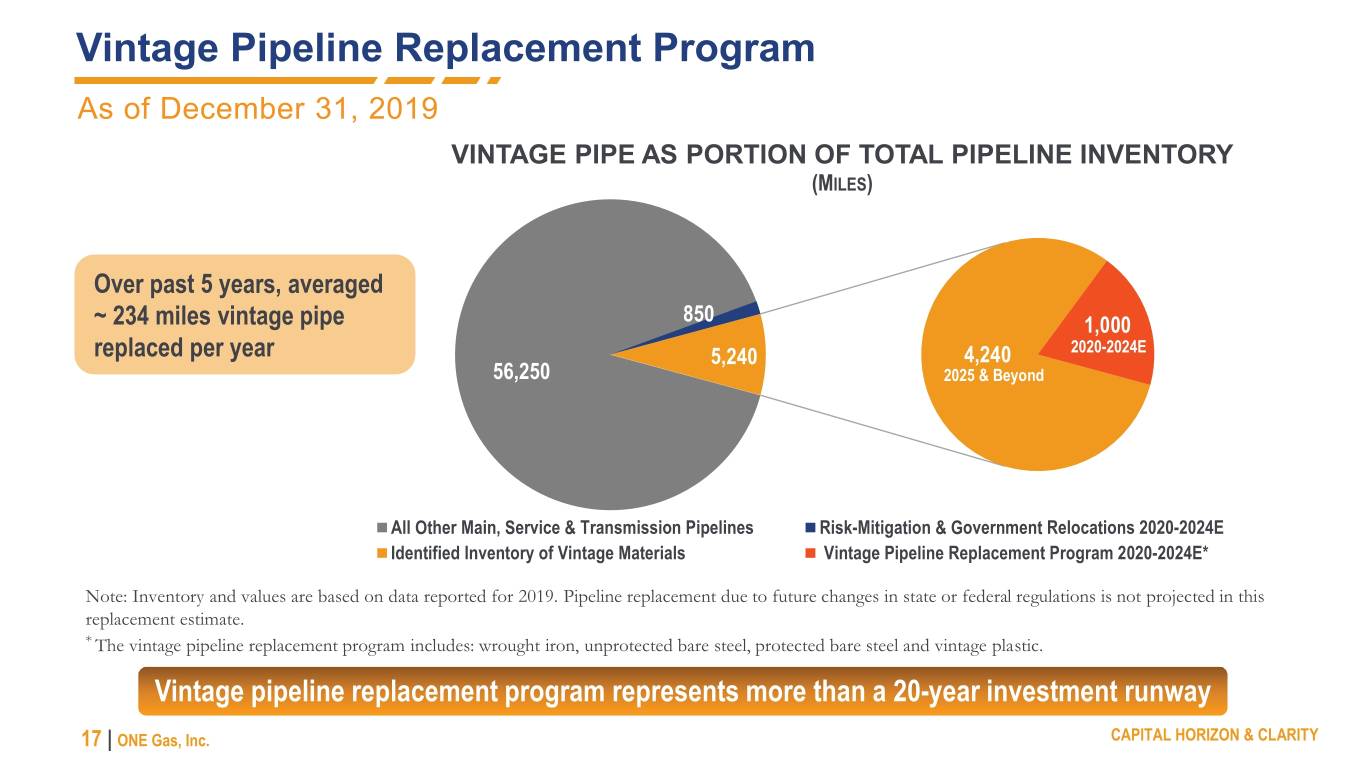
Vintage Pipeline Replacement Program As of December 31, 2019 VINTAGE PIPE AS PORTION OF TOTAL PIPELINE INVENTORY (MILES) Over past 5 years, averaged ~ 234 miles vintage pipe 850 1,000 replaced per year 5,240 4,240 2020-2024E 56,250 2025 & Beyond All Other Main, Service & Transmission Pipelines Risk-Mitigation & Government Relocations 2020-2024E Identified Inventory of Vintage Materials Vintage Pipeline Replacement Program 2020-2024E* Note: Inventory and values are based on data reported for 2019. Pipeline replacement due to future changes in state or federal regulations is not projected in this replacement estimate. * The vintage pipeline replacement program includes: wrought iron, unprotected bare steel, protected bare steel and vintage plastic. Vintage pipeline replacement program represents more than a 20-year investment runway 17 | ONE Gas, Inc. CAPITAL HORIZON & CLARITY


Rate Base Growth AVERAGE RATE BASE* 2020 ESTIMATED AVERAGE RATE BASE (BILLIONS) TOTAL: $3.91 BILLION* $3.91** $3.62 $3.18 $3.36 $2.96 $1.14 billion $1.65 billion $1.12 billion 2016 2017 2018 2019 2020G Oklahoma Kansas Texas * For definition of estimated average rate base, see Appendix ** Estimated average rate base Expected average annual growth of 7% between 2019 and 2024 18 | ONE Gas, Inc. CAPITAL HORIZON & CLARITY


REGULATORY CONSTRUCT


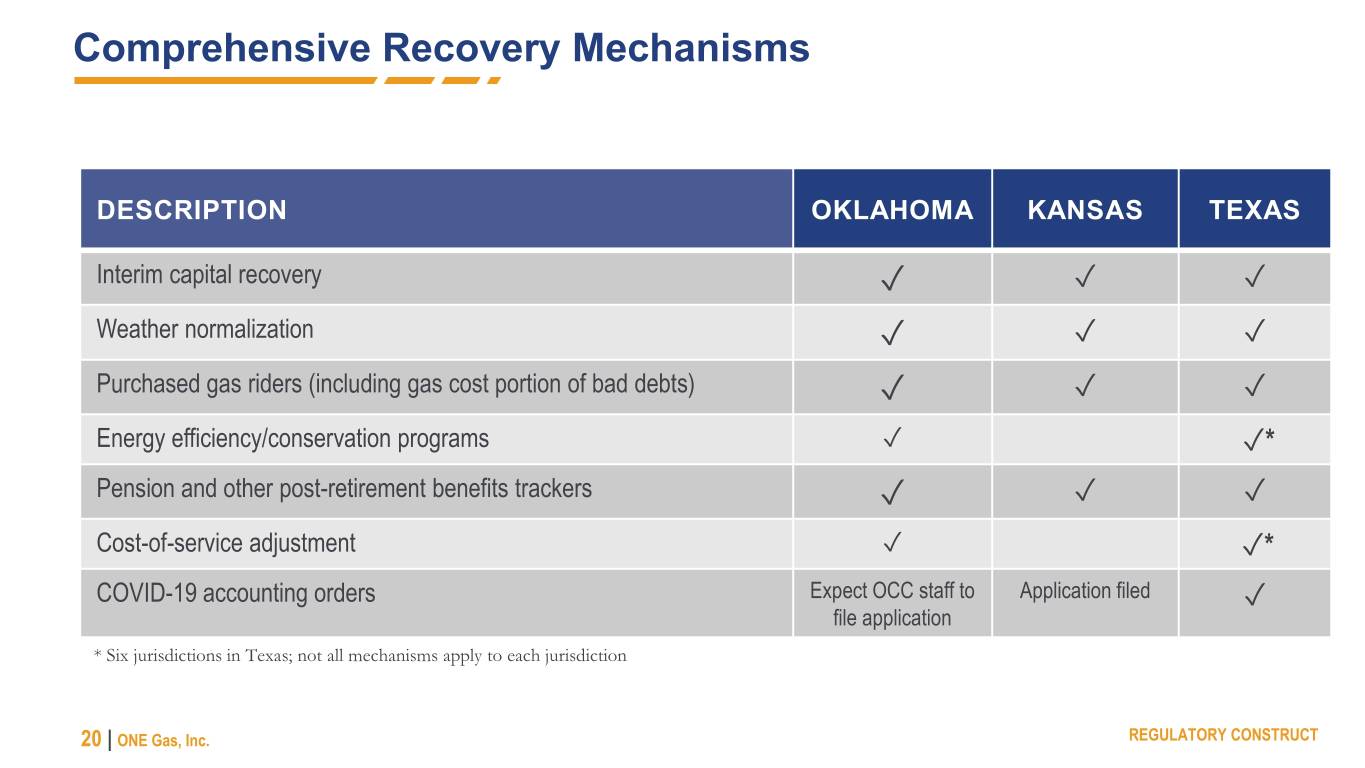
Comprehensive Recovery Mechanisms DESCRIPTION OKLAHOMA KANSAS TEXAS Interim capital recovery ✓ ✓ ✓ Weather normalization ✓ ✓ ✓ Purchased gas riders (including gas cost portion of bad debts) ✓ ✓ ✓ Energy efficiency/conservation programs ✓ ✓* Pension and other post-retirement benefits trackers ✓ ✓ ✓ Cost-of-service adjustment ✓ ✓* COVID-19 accounting orders Expect OCC staff to Application filed file application ✓ * Six jurisdictions in Texas; not all mechanisms apply to each jurisdiction 20 | ONE Gas, Inc. REGULATORY CONSTRUCT


Interim Recovery of Capital Investments Oklahoma Natural Gas 2020 CAPITAL RECOVERY TIMING • Performance-based rate change (PBRC) filing for annual rate reviews between rate cases to ensure achieved ROE is 10% within the established band of 9 – 10% Kansas Gas Service • Gas System Reliability Surcharge (GSRS) for safety- related (includes physical and cyber security) and government-mandated investments made between rate cases 90% Texas Gas Service • Gas Reliability Infrastructure Program (GRIP) for capital investments made between rate cases Subject to annual filings Other • Cost-of-service adjustments (COSA) for capital investments and certain changes in operating expenses 21 | ONE Gas, Inc. REGULATORY CONSTRUCT


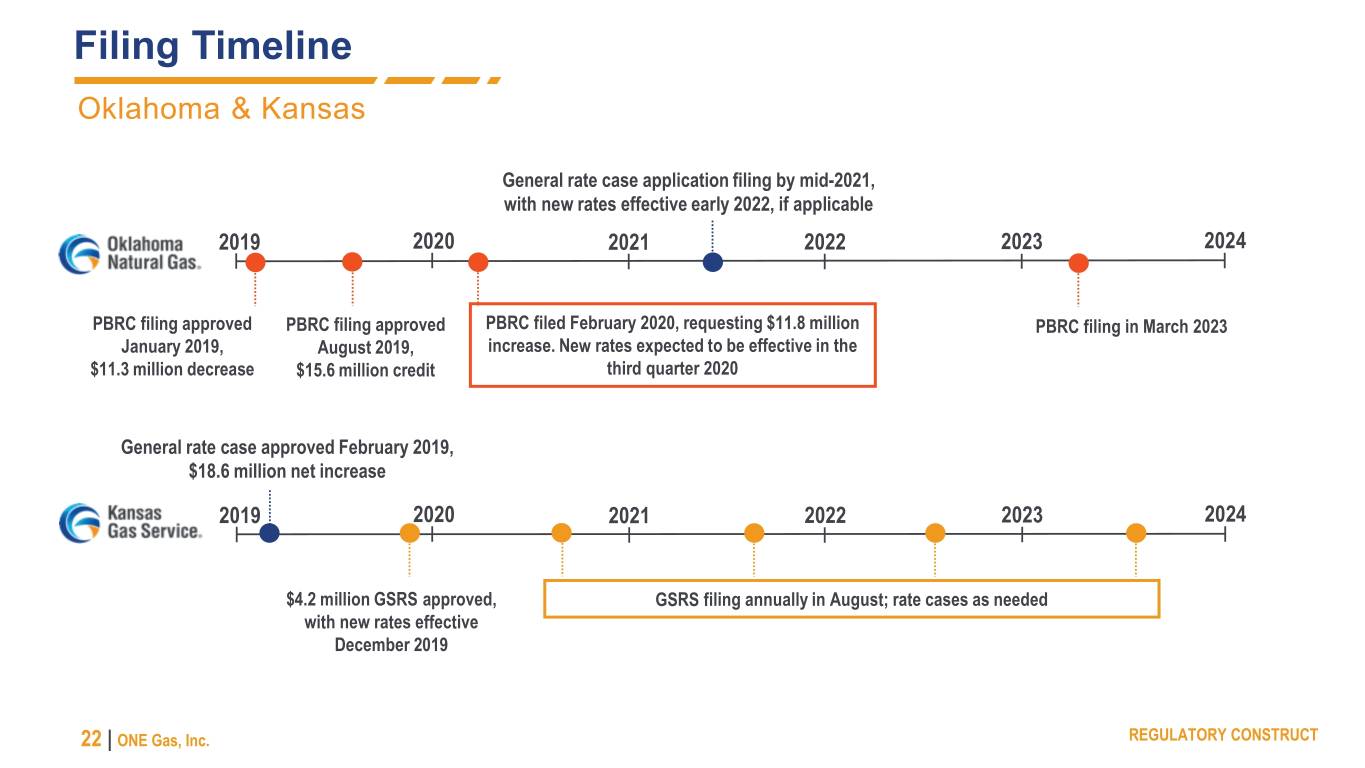
Filing Timeline Oklahoma & Kansas General rate case application filing by mid-2021, with new rates effective early 2022, if applicable 2019 2020 2021 2022 2023 2024 PBRC filing approved PBRC filing approved PBRC filed February 2020, requesting $11.8 million PBRC filing in March 2023 January 2019, August 2019, increase. New rates expected to be effective in the $11.3 million decrease $15.6 million credit third quarter 2020 General rate case approved February 2019, $18.6 million net increase 2019 2020 2021 2022 2023 2024 $4.2 million GSRS approved, GSRS filing annually in August; rate cases as needed with new rates effective December 2019 22 | ONE Gas, Inc. REGULATORY CONSTRUCT


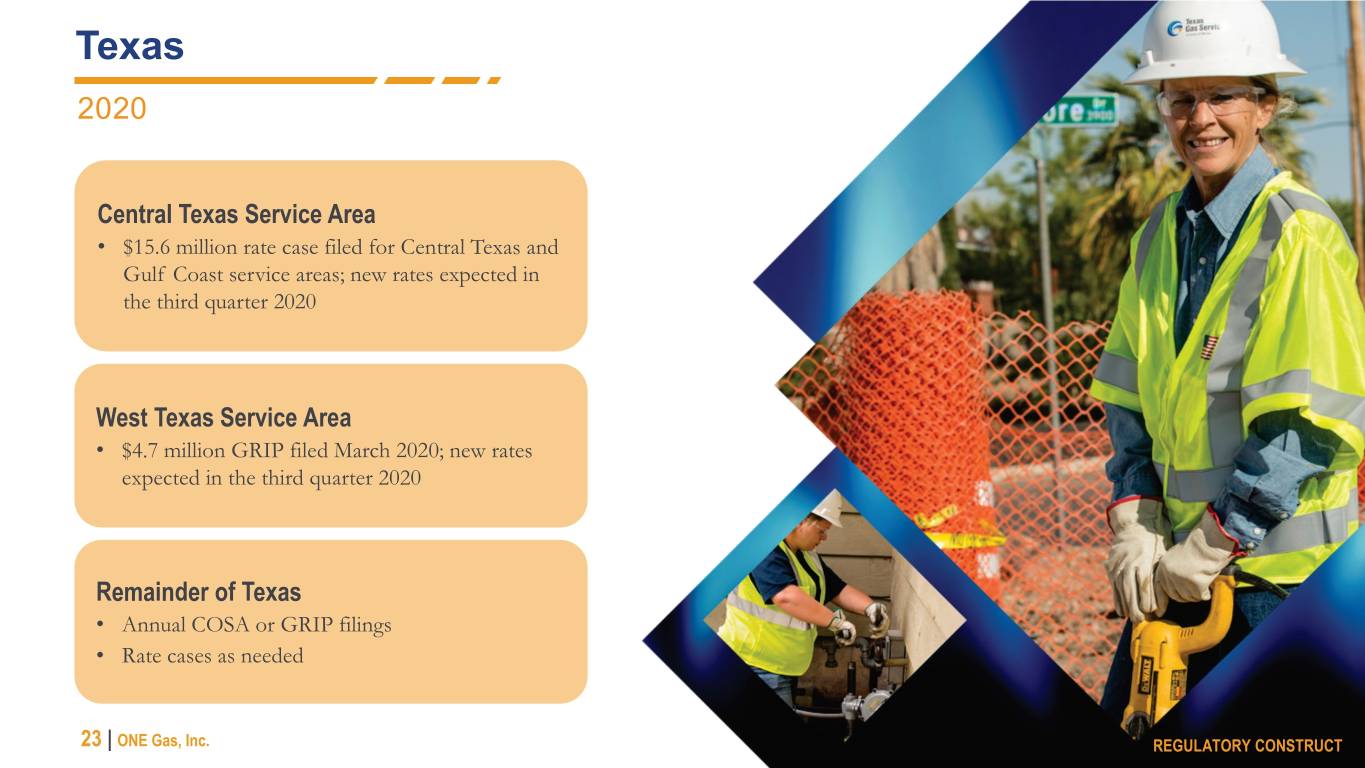
Texas 2020 Central Texas Service Area • $15.6 million rate case filed for Central Texas and Gulf Coast service areas; new rates expected in the third quarter 2020 West Texas Service Area • $4.7 million GRIP filed March 2020; new rates expected in the third quarter 2020 Remainder of Texas • Annual COSA or GRIP filings • Rate cases as needed REGULATORY CONSTRUCT 23 | ONE Gas, Inc. REGULATORY CONSTRUCT


CASH FLOW STABILITY


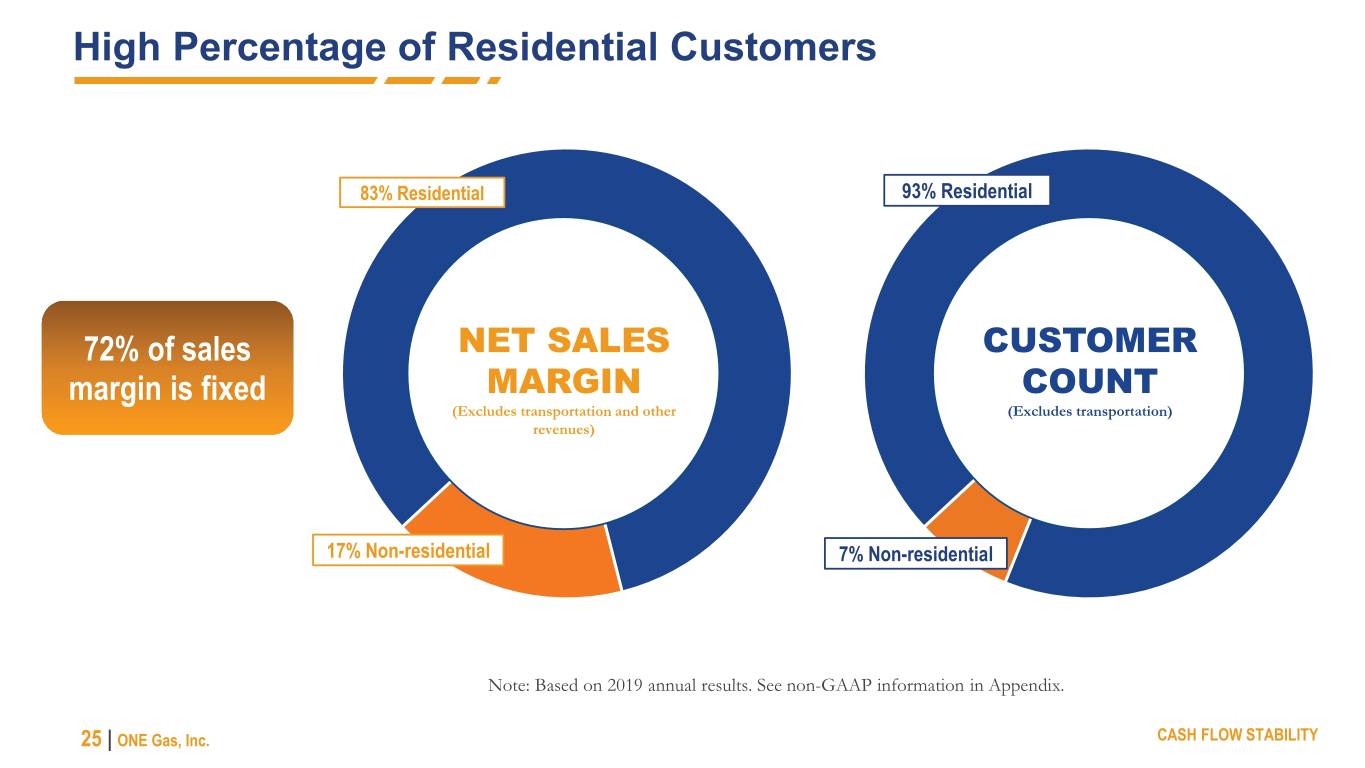
High Percentage of Residential Customers 83% Residential 93% Residential 72% of sales NET SALES CUSTOMER margin is fixed MARGIN COUNT (Excludes transportation and other (Excludes transportation) revenues) 17% Non-residential 7% Non-residential Note: Based on 2019 annual results. See non-GAAP information in Appendix. 25 | ONE Gas, Inc. CASH FLOW STABILITY


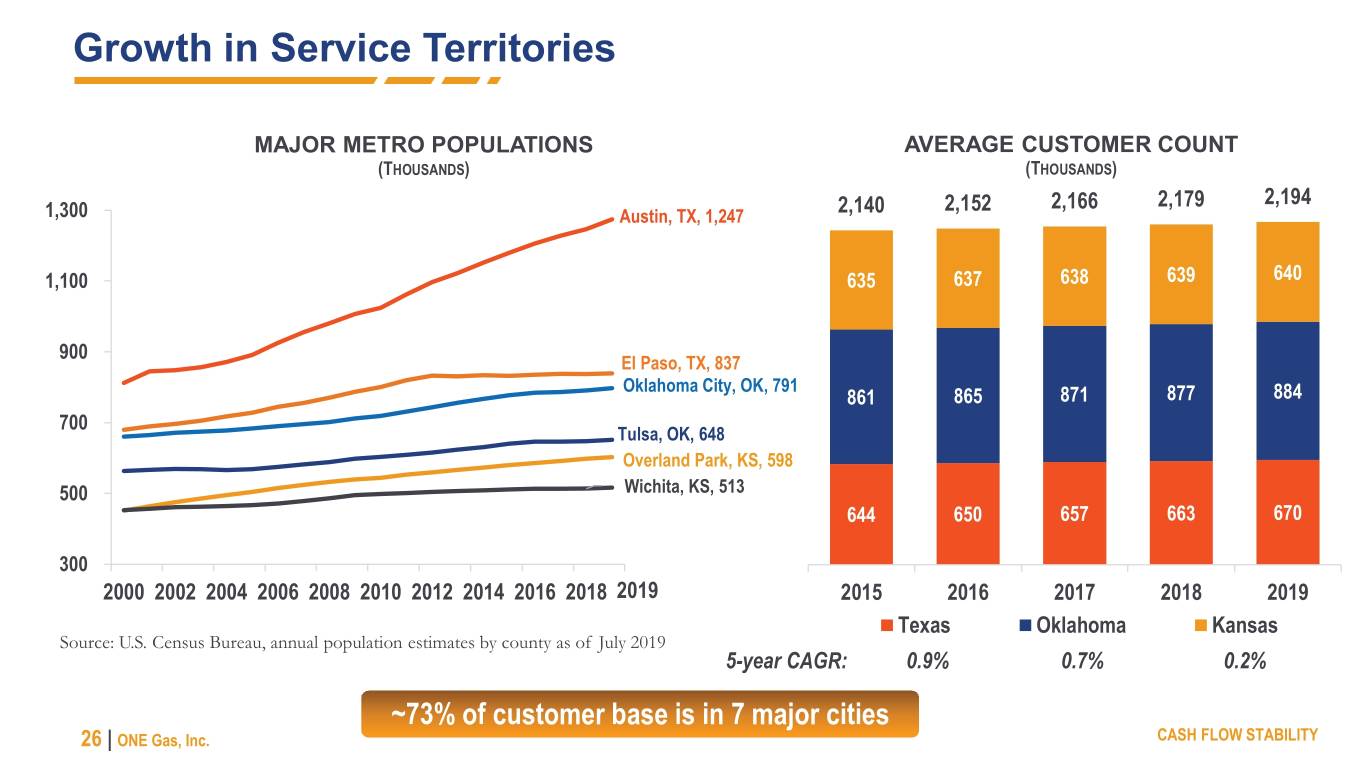
Growth in Service Territories MAJOR METRO POPULATIONS AVERAGE CUSTOMER COUNT (THOUSANDS) (THOUSANDS) 2,152 2,166 2,179 2,194 1,300 Austin, TX, 1,247 2,140 1,100 635 637 638 639 640 900 El Paso, TX, 837 Oklahoma City, OK, 791 861 865 871 877 884 700 Tulsa, OK, 648 Overland Park, KS, 598 500 Wichita, KS, 513 644 650 657 663 670 300 2000 2002 2004 2006 2008 2010 2012 2014 2016 2018 2019 2015 2016 2017 2018 2019 Texas Oklahoma Kansas Source: U.S. Census Bureau, annual population estimates by county as of July 2019 5-year CAGR: 0.9% 0.7% 0.2% ~73% of customer base is in 7 major cities 26 | ONE Gas, Inc. CASH FLOW STABILITY


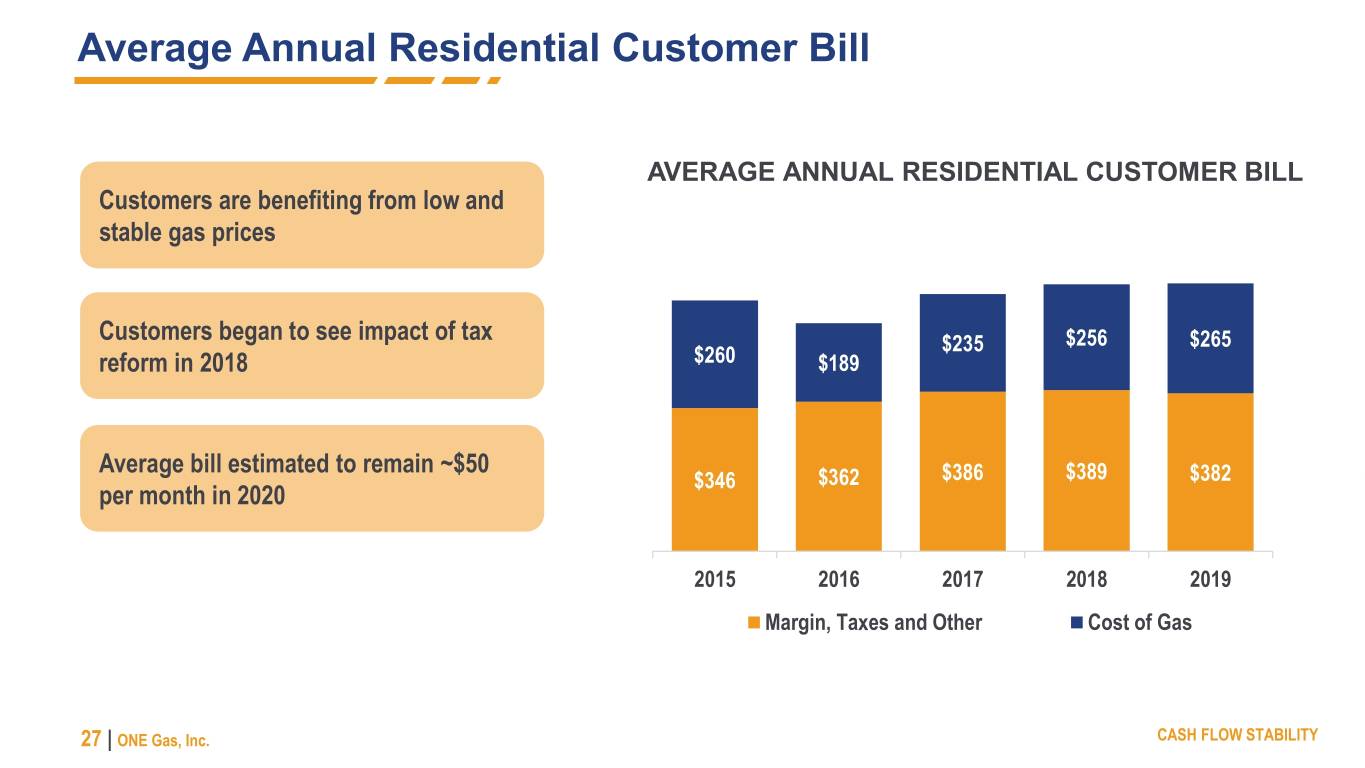
Average Annual Residential Customer Bill AVERAGE ANNUAL RESIDENTIAL CUSTOMER BILL Customers are benefiting from low and stable gas prices Customers began to see impact of tax $235 $256 $265 reform in 2018 $260 $189 Average bill estimated to remain ~$50 $346 $362 $386 $389 $382 per month in 2020 2015 2016 2017 2018 2019 Margin, Taxes and Other Cost of Gas 27 | ONE Gas, Inc. CASH FLOW STABILITY


COMPETITIVE ADVANTAGE


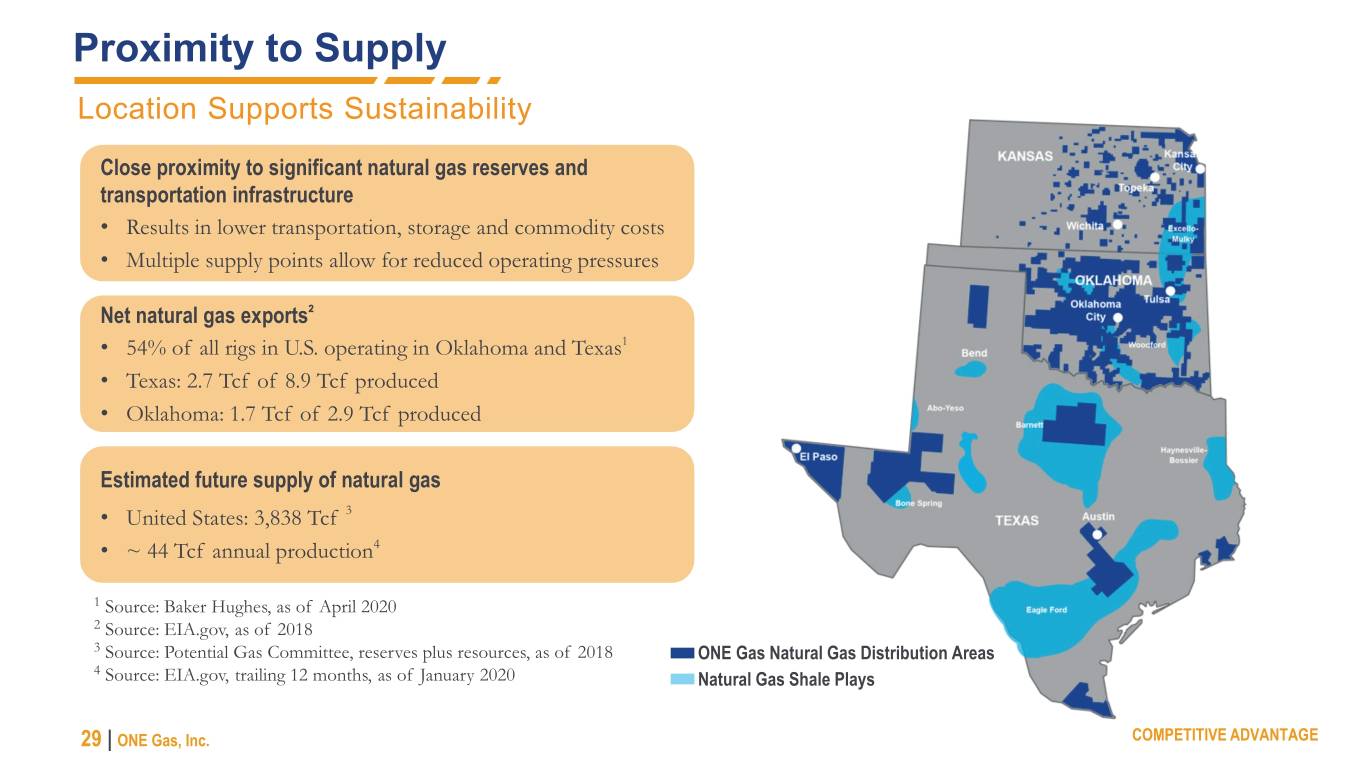
Proximity to Supply Location Supports Sustainability Close proximity to significant natural gas reserves and transportation infrastructure • Results in lower transportation, storage and commodity costs • Multiple supply points allow for reduced operating pressures Net natural gas exports² • 54% of all rigs in U.S. operating in Oklahoma and Texas1 • Texas: 2.7 Tcf of 8.9 Tcf produced • Oklahoma: 1.7 Tcf of 2.9 Tcf produced Estimated future supply of natural gas • United States: 3,838 Tcf 3 • ~ 44 Tcf annual production4 1 Source: Baker Hughes, as of April 2020 2 Source: EIA.gov, as of 2018 3 Source: Potential Gas Committee, reserves plus resources, as of 2018 ONE Gas Natural Gas Distribution Areas 4 Source: EIA.gov, trailing 12 months, as of January 2020 Natural Gas Shale Plays 29 | ONE Gas, Inc. COMPETITIVE ADVANTAGE


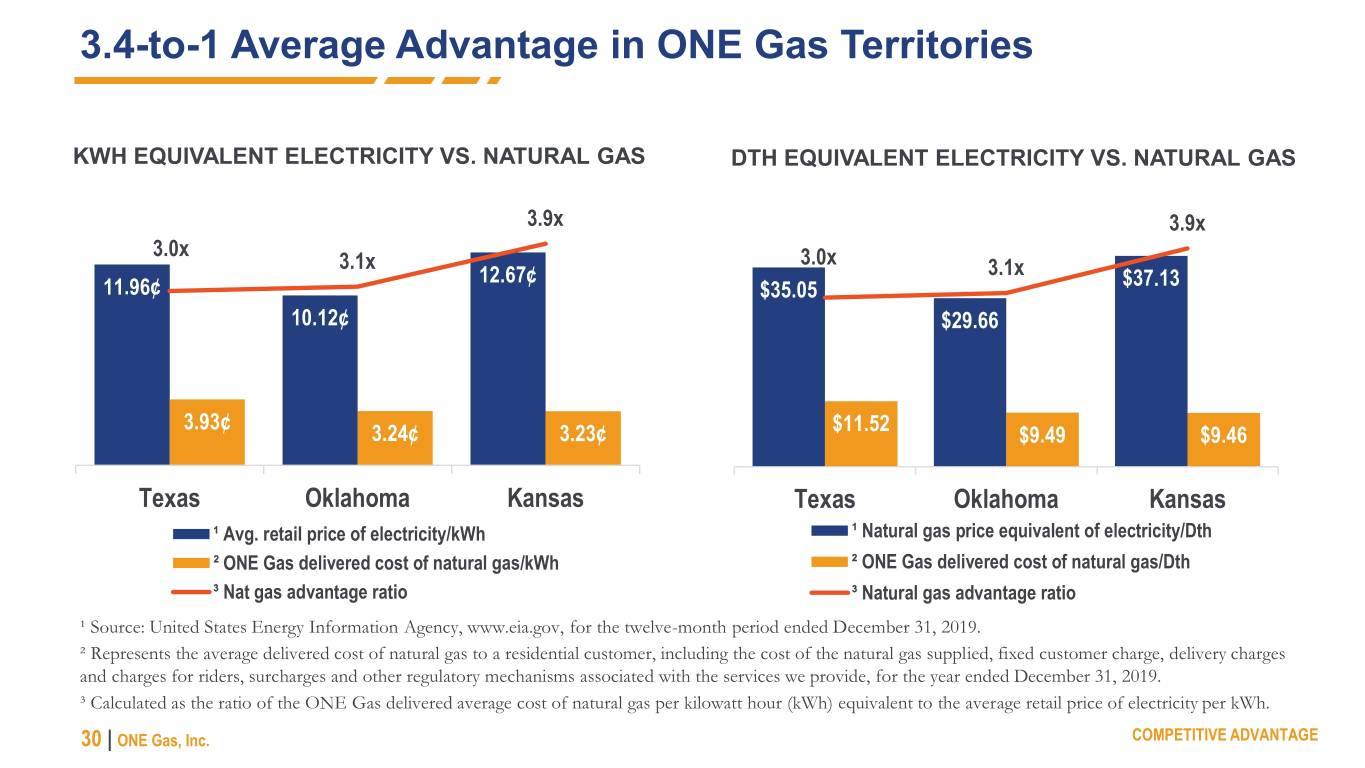
3.4-to-1 Average Advantage in ONE Gas Territories KWH EQUIVALENT ELECTRICITY VS. NATURAL GAS DTH EQUIVALENT ELECTRICITY VS. NATURAL GAS 3.9x 3.9x 3.0x 3.1x 3.0x 12.67¢ 3.1x $37.13 11.96¢ $35.05 10.12¢ $29.66 3.93¢ $11.52 3.24¢ 3.23¢ $9.49 $9.46 Texas Oklahoma Kansas Texas Oklahoma Kansas ¹ Avg. retail price of electricity/kWh ¹ Natural gas price equivalent of electricity/Dth ² ONE Gas delivered cost of natural gas/kWh ² ONE Gas delivered cost of natural gas/Dth ³ Nat gas advantage ratio ³ Natural gas advantage ratio ¹ Source: United States Energy Information Agency, www.eia.gov, for the twelve-month period ended December 31, 2019. ² Represents the average delivered cost of natural gas to a residential customer, including the cost of the natural gas supplied, fixed customer charge, delivery charges and charges for riders, surcharges and other regulatory mechanisms associated with the services we provide, for the year ended December 31, 2019. ³ Calculated as the ratio of the ONE Gas delivered average cost of natural gas per kilowatt hour (kWh) equivalent to the average retail price of electricity per kWh. 30 | ONE Gas, Inc. COMPETITIVE ADVANTAGE


FINANCIAL PERFORMANCE & OBJECTIVES


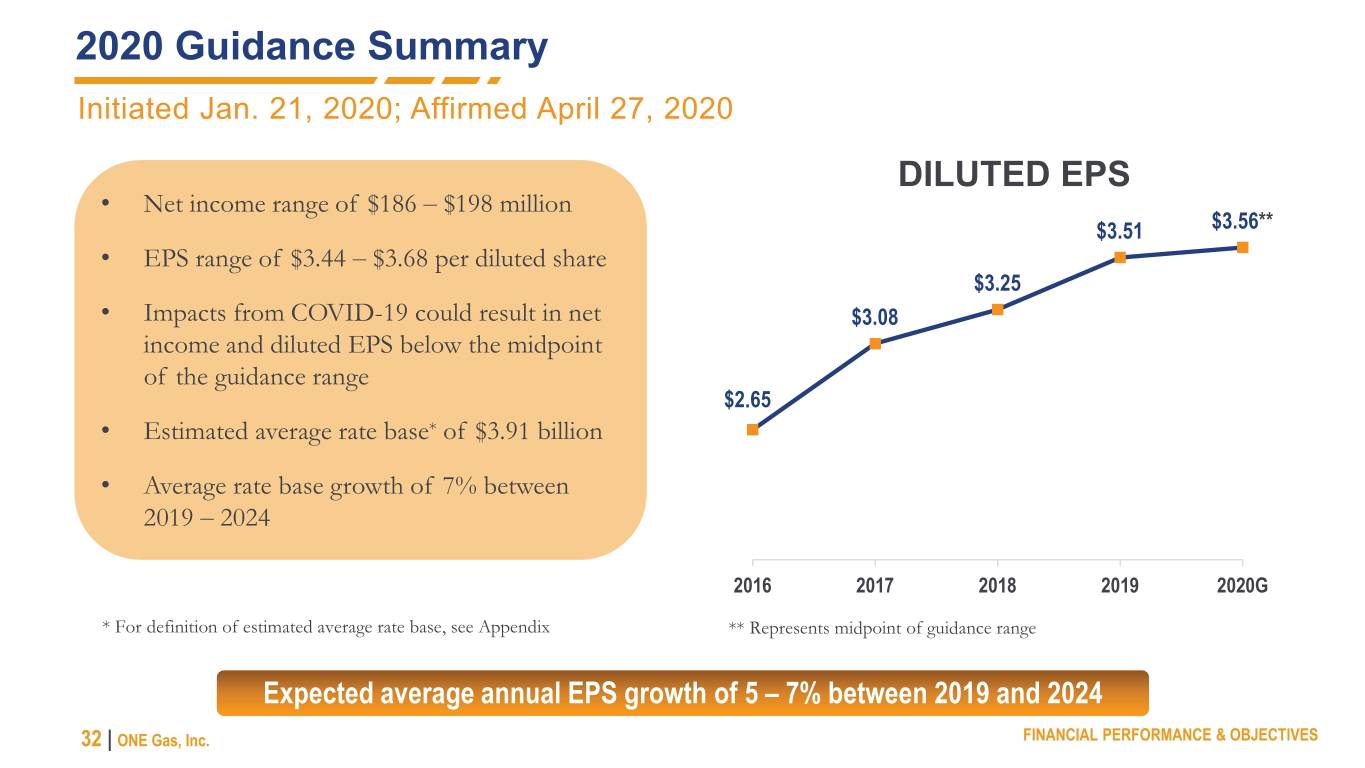
2020 Guidance Summary Initiated Jan. 21, 2020; Affirmed April 27, 2020 DILUTED EPS • Net income range of $186 ‒ $198 million $3.51 $3.56** • EPS range of $3.44 ‒ $3.68 per diluted share $3.25 • Impacts from COVID-19 could result in net $3.08 income and diluted EPS below the midpoint of the guidance range $2.65 • Estimated average rate base* of $3.91 billion • Average rate base growth of 7% between 2019 ‒ 2024 2016 2017 2018 2019 2020G * For definition of estimated average rate base, see Appendix ** Represents midpoint of guidance range Expected average annual EPS growth of 5 – 7% between 2019 and 2024 32 | ONE Gas, Inc. FINANCIAL PERFORMANCE & OBJECTIVES


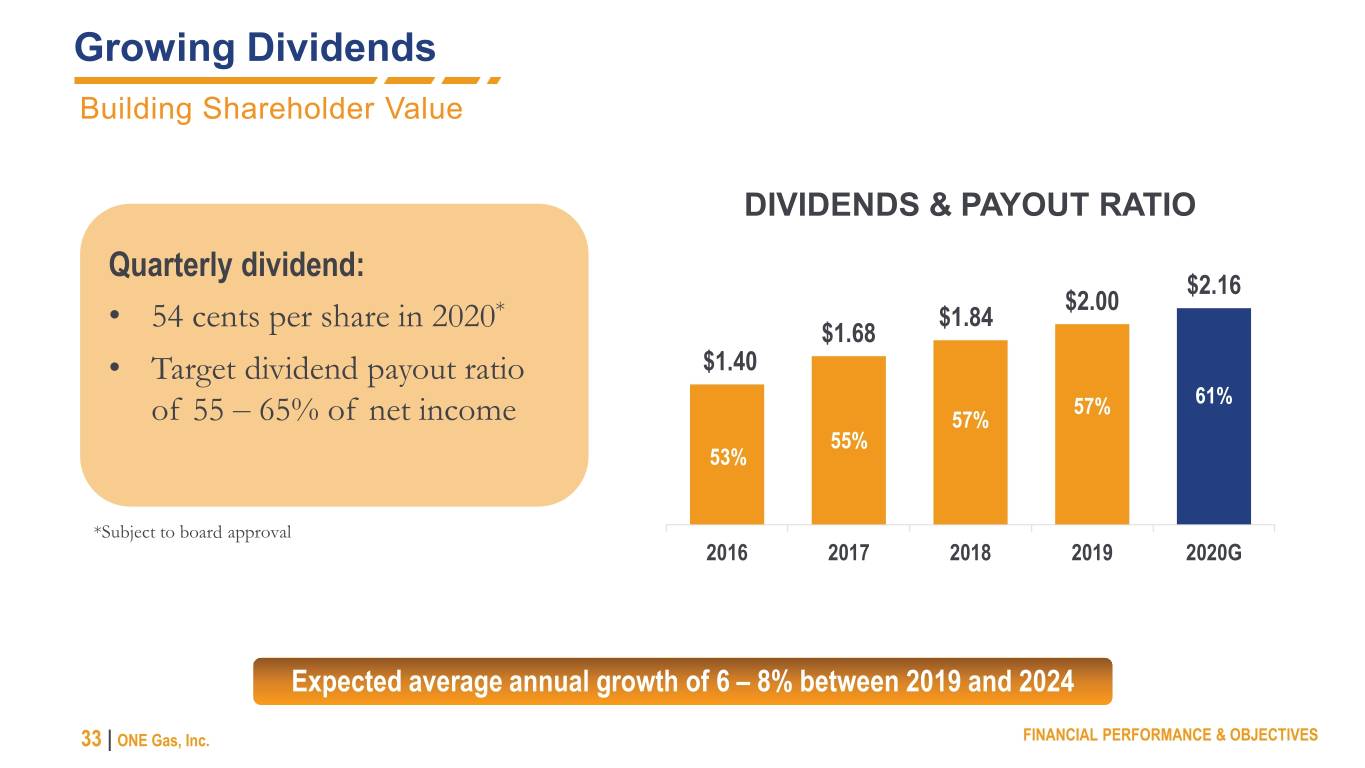
Growing Dividends Building Shareholder Value DIVIDENDS & PAYOUT RATIO Quarterly dividend: $2.16 $2.00 54 cents per share in 2020* $1.84 • $1.68 • Target dividend payout ratio $1.40 57% 61% of 55 ‒ 65% of net income 57% 55% 53% *Subject to board approval 2016 2017 2018 2019 2020G Expected average annual growth of 6 – 8% between 2019 and 2024 33 | ONE Gas, Inc. FINANCIAL PERFORMANCE & OBJECTIVES


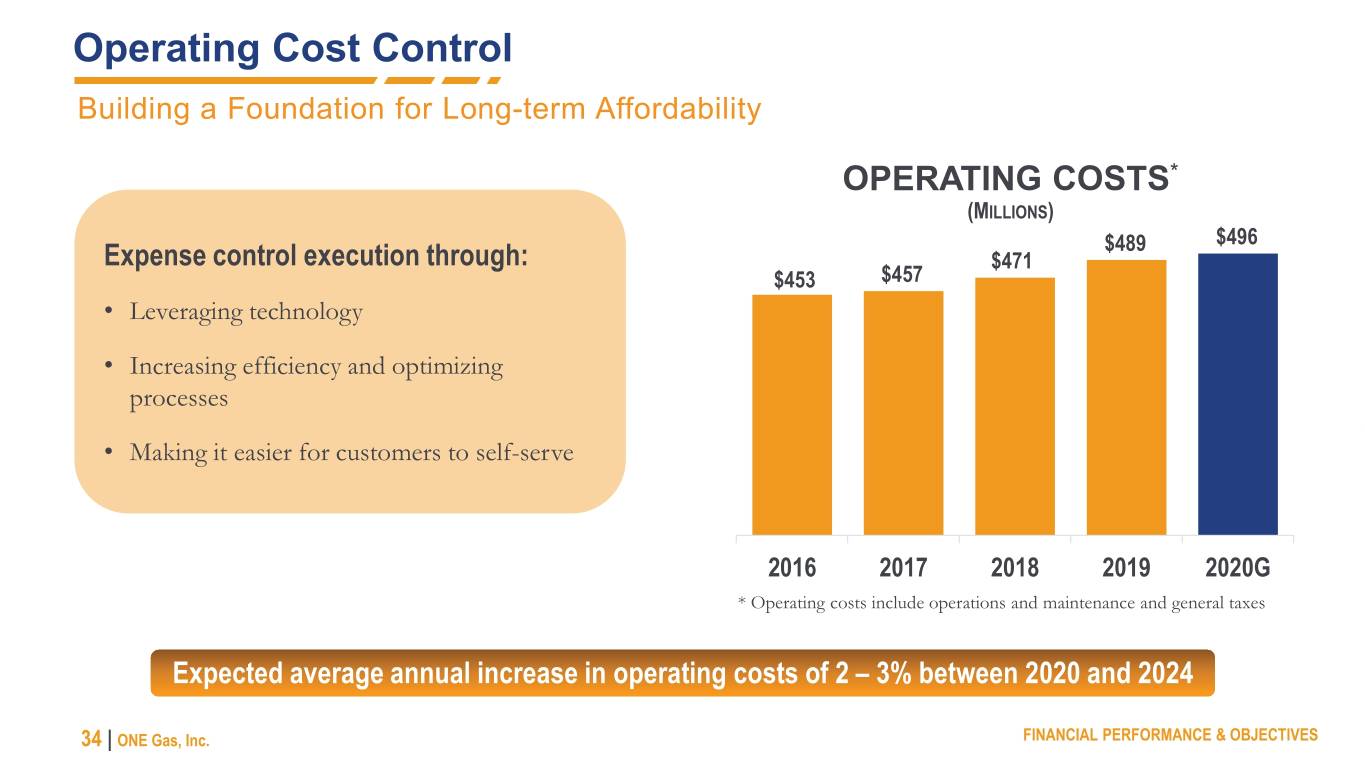
Operating Cost Control Building a Foundation for Long-term Affordability OPERATING COSTS* (MILLIONS) $489 $496 Expense control execution through: $471 $453 $457 • Leveraging technology • Increasing efficiency and optimizing processes • Making it easier for customers to self-serve 2016 2017 2018 2019 2020G * Operating costs include operations and maintenance and general taxes Expected average annual increase in operating costs of 2 – 3% between 2020 and 2024 34 | ONE Gas, Inc. FINANCIAL PERFORMANCE & OBJECTIVES


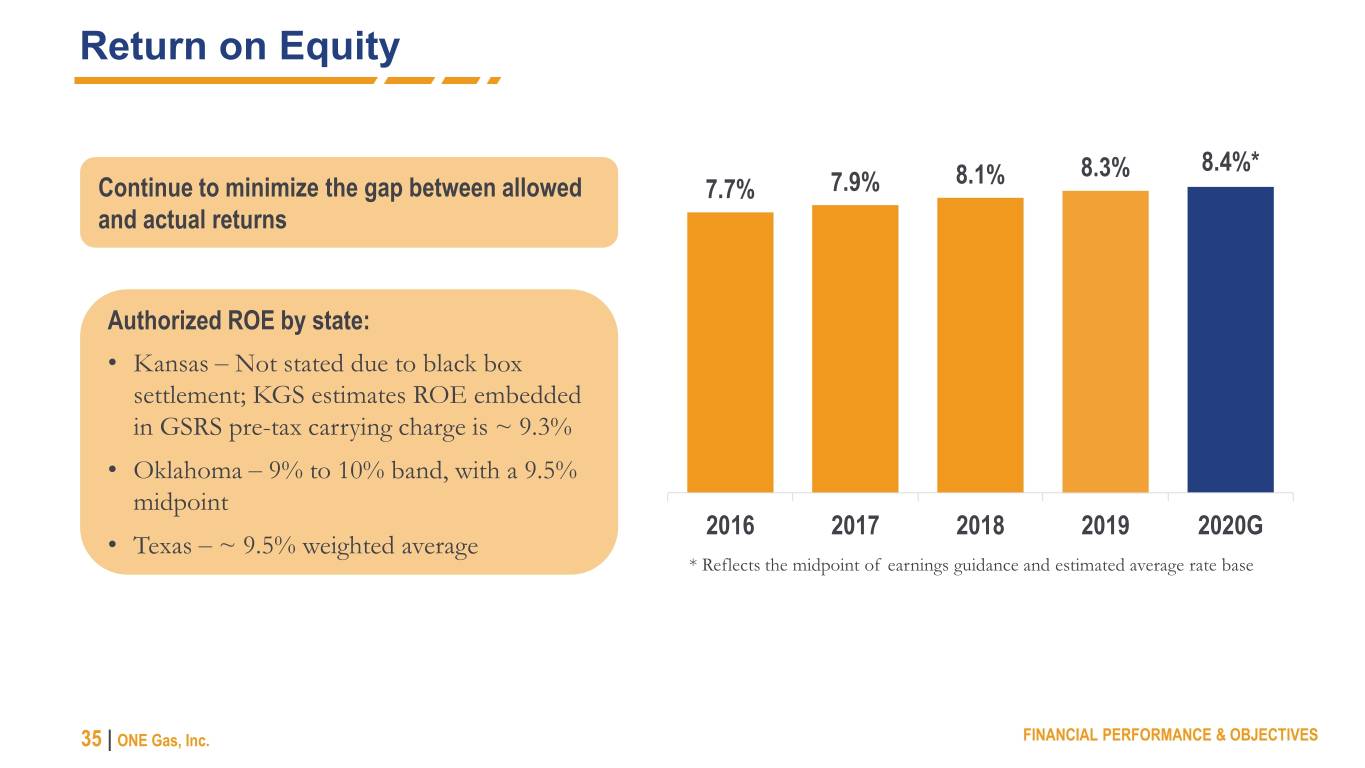
Return on Equity 8.1% 8.3% 8.4%* Continue to minimize the gap between allowed 7.7% 7.9% and actual returns Authorized ROE by state: • Kansas ‒ Not stated due to black box settlement; KGS estimates ROE embedded in GSRS pre-tax carrying charge is ~ 9.3% • Oklahoma ‒ 9% to 10% band, with a 9.5% midpoint 2016 2017 2018 2019 2020G • Texas ‒ ~ 9.5% weighted average * Reflects the midpoint of earnings guidance and estimated average rate base 35 | ONE Gas, Inc. FINANCIAL PERFORMANCE & OBJECTIVES


Financing Requirements Sources and Uses $591 $591 Financing Dividends and capital expenditures primarily requirements $174 funded by cash flow from operations Capital ) expenditures and asset removal ILLIONS costs (M Cash flow from $475 ~$850 ‒ $900 million net financing needs operations* $417 through 2024 • ~25% expected to be equity Dividends • ATM program initiated February 2020 $116 2020 Sources 2020 Uses * Before changes in working capital. See non-GAAP information in Appendix. 36 | ONE Gas, Inc. FINANCIAL PERFORMANCE & OBJECTIVES


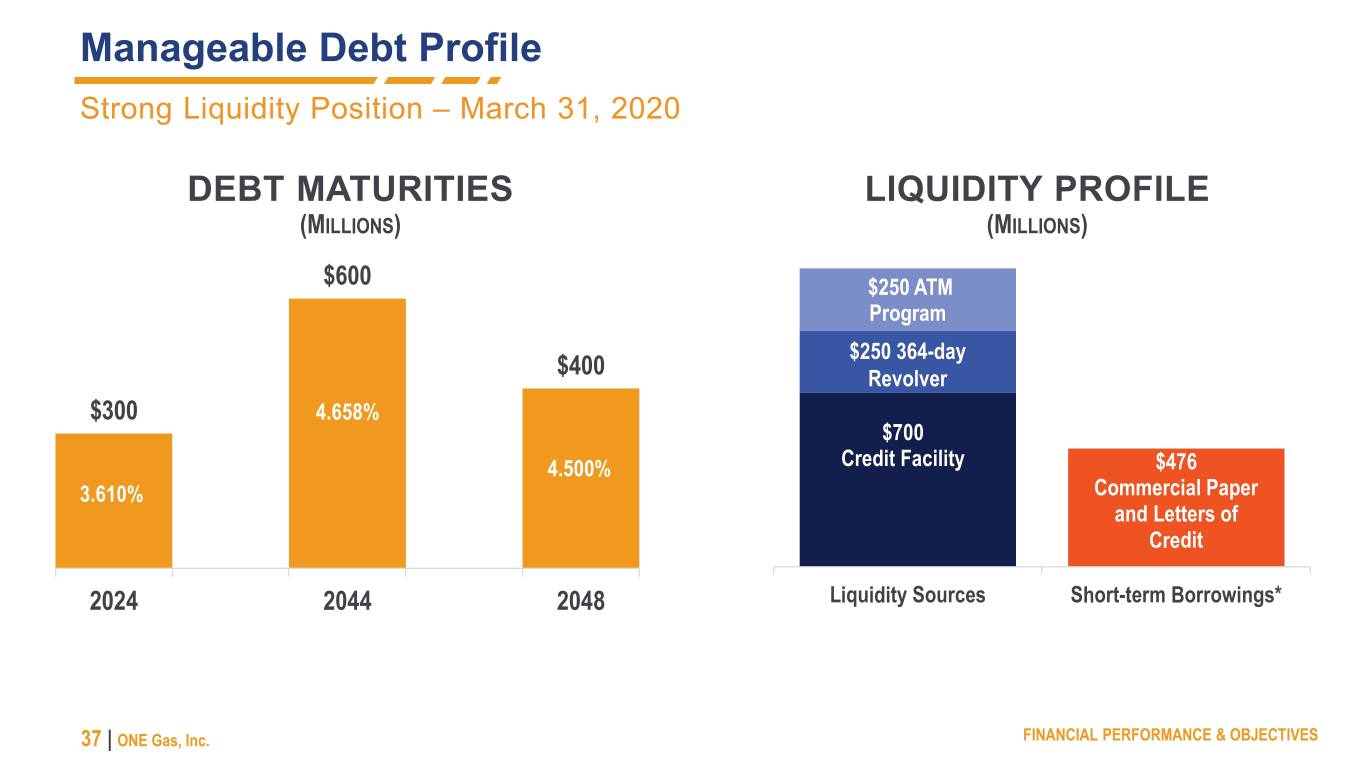
Manageable Debt Profile Strong Liquidity Position – March 31, 2020 DEBT MATURITIES LIQUIDITY PROFILE (MILLIONS) (MILLIONS) $600 $250 ATM Program $250 364-day $400 Revolver $300 4.658% $700 4.500% Credit Facility $476 3.610% Commercial Paper and Letters of Credit 2024 2044 2048 Liquidity Sources Short-term Borrowings* 37 | ONE Gas, Inc. FINANCIAL PERFORMANCE & OBJECTIVES


KEY TAKEAWAYS


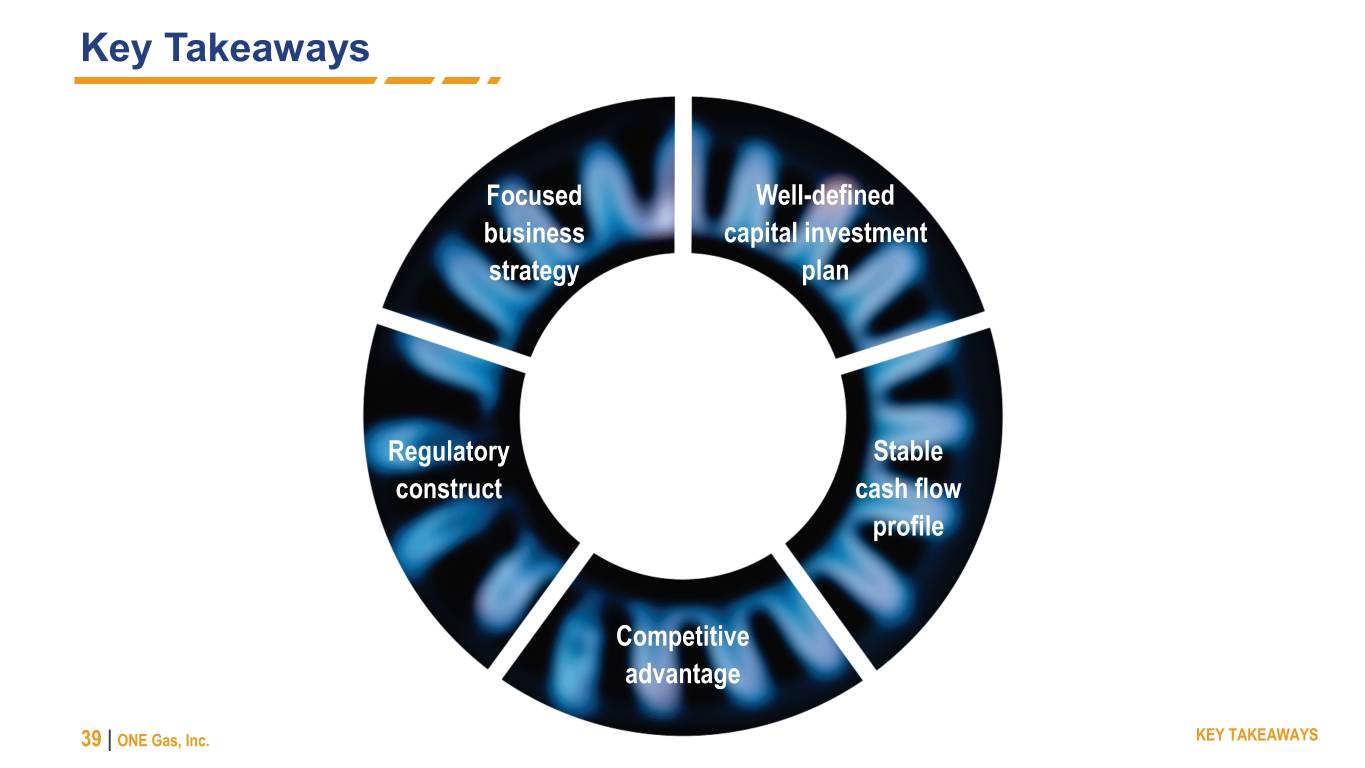
Key Takeaways Focused Well-defined business capital investment strategy plan Regulatory Stable construct cash flow profile Competitive advantage 39 | ONE Gas, Inc. KEY TAKEAWAYS


APPENDIX


Corporate Structure INCORPORATED ENTITY 100% regulated natural gas distribution No levered holding company; all debt issued at OGS Division capital structures match Corporate capital structure 41 | ONE Gas, Inc. APPENDIX


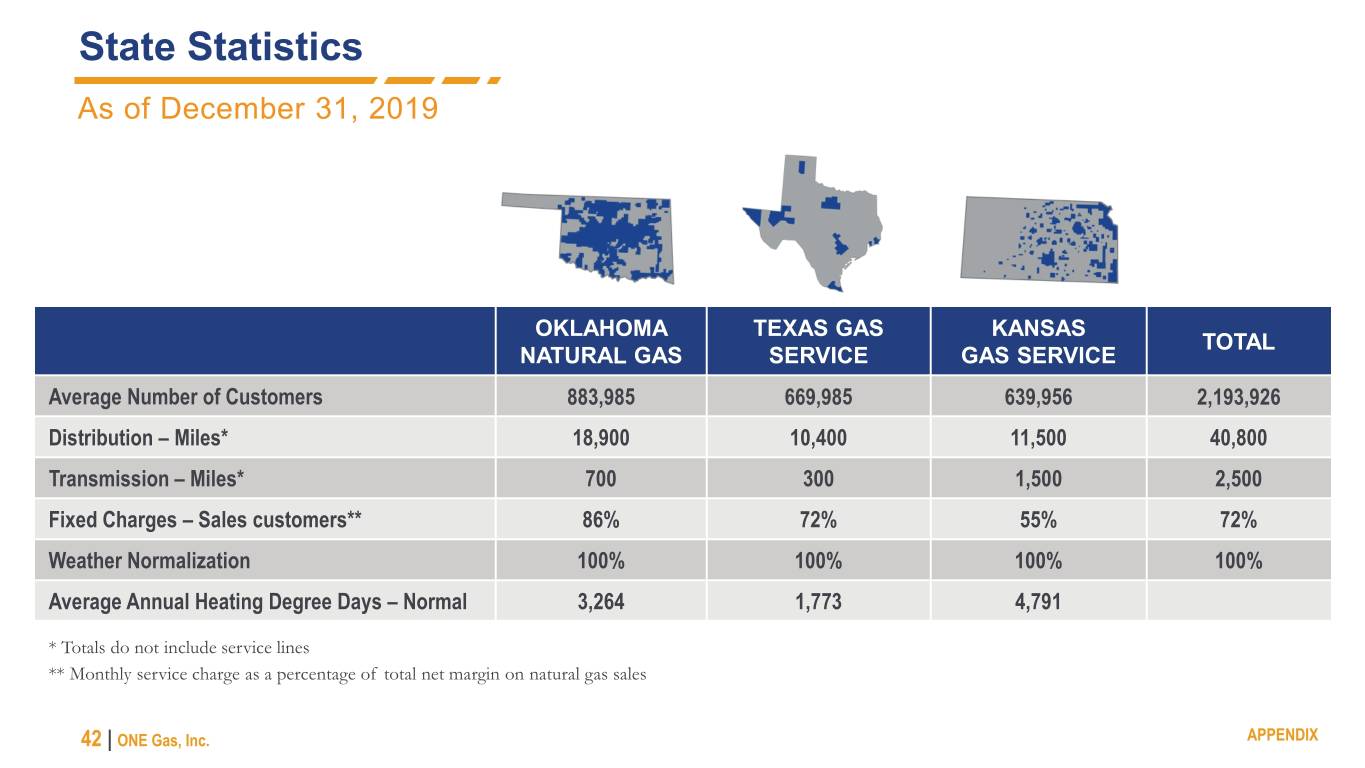
State Statistics As of December 31, 2019 OKLAHOMA TEXAS GAS KANSAS TOTAL NATURAL GAS SERVICE GAS SERVICE Average Number of Customers 883,985 669,985 639,956 2,193,926 Distribution – Miles* 18,900 10,400 11,500 40,800 Transmission – Miles* 700 300 1,500 2,500 Fixed Charges – Sales customers** 86% 72% 55% 72% Weather Normalization 100% 100% 100% 100% Average Annual Heating Degree Days – Normal 3,264 1,773 4,791 * Totals do not include service lines ** Monthly service charge as a percentage of total net margin on natural gas sales 42 | ONE Gas, Inc. APPENDIX


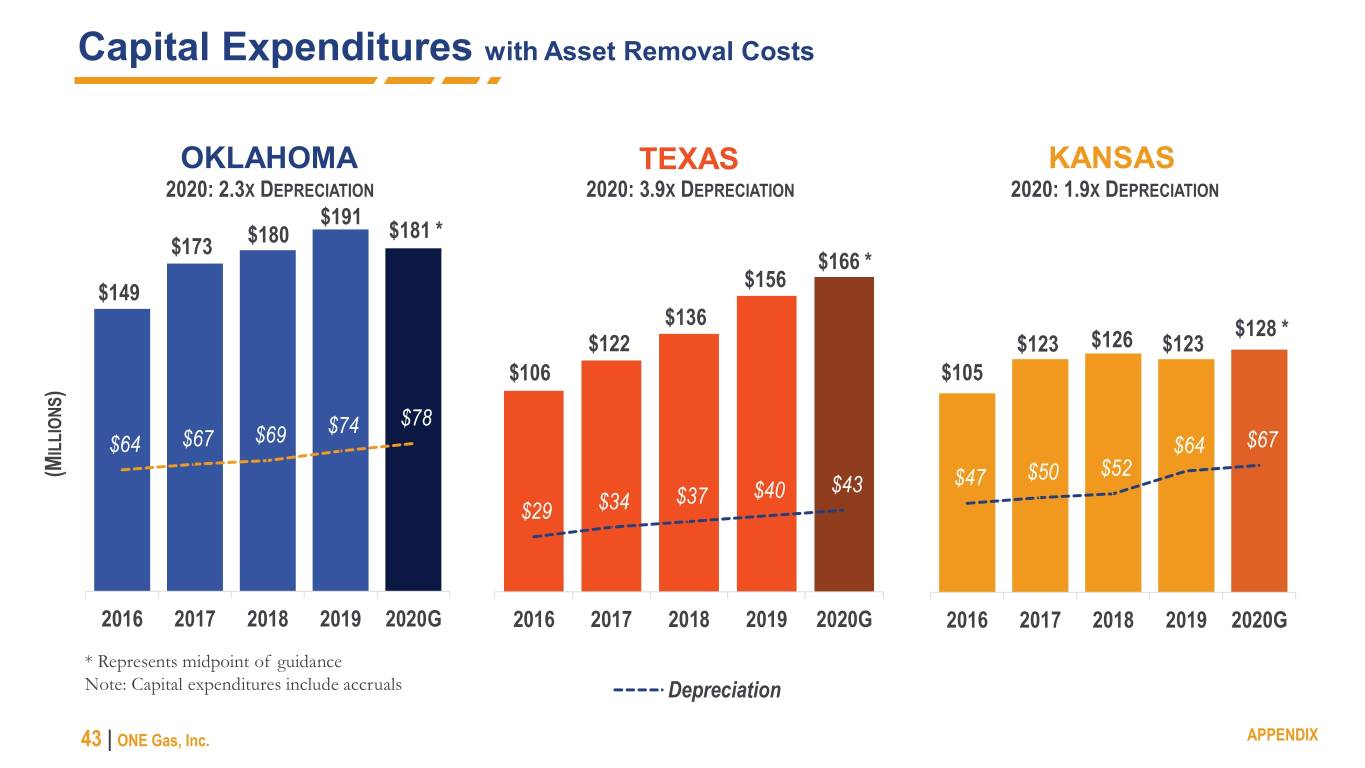
Capital Expenditures with Asset Removal Costs OKLAHOMA TEXAS KANSAS 2020: 2.3X DEPRECIATION 2020: 3.9X DEPRECIATION 2020: 1.9X DEPRECIATION $191 $180 $181 * $173 $166 * $156 $149 $136 $128 * $122 $123 $126 $123 $106 $105 ) $74 $78 $67 $69 $67 ILLIONS $64 $64 (M $47 $50 $52 $37 $40 $43 $29 $34 2016 2017 2018 2019 2020G 2016 2017 2018 2019 2020G 2016 2017 2018 2019 2020G * Represents midpoint of guidance Note: Capital expenditures include accruals Depreciation 43 | ONE Gas, Inc. APPENDIX


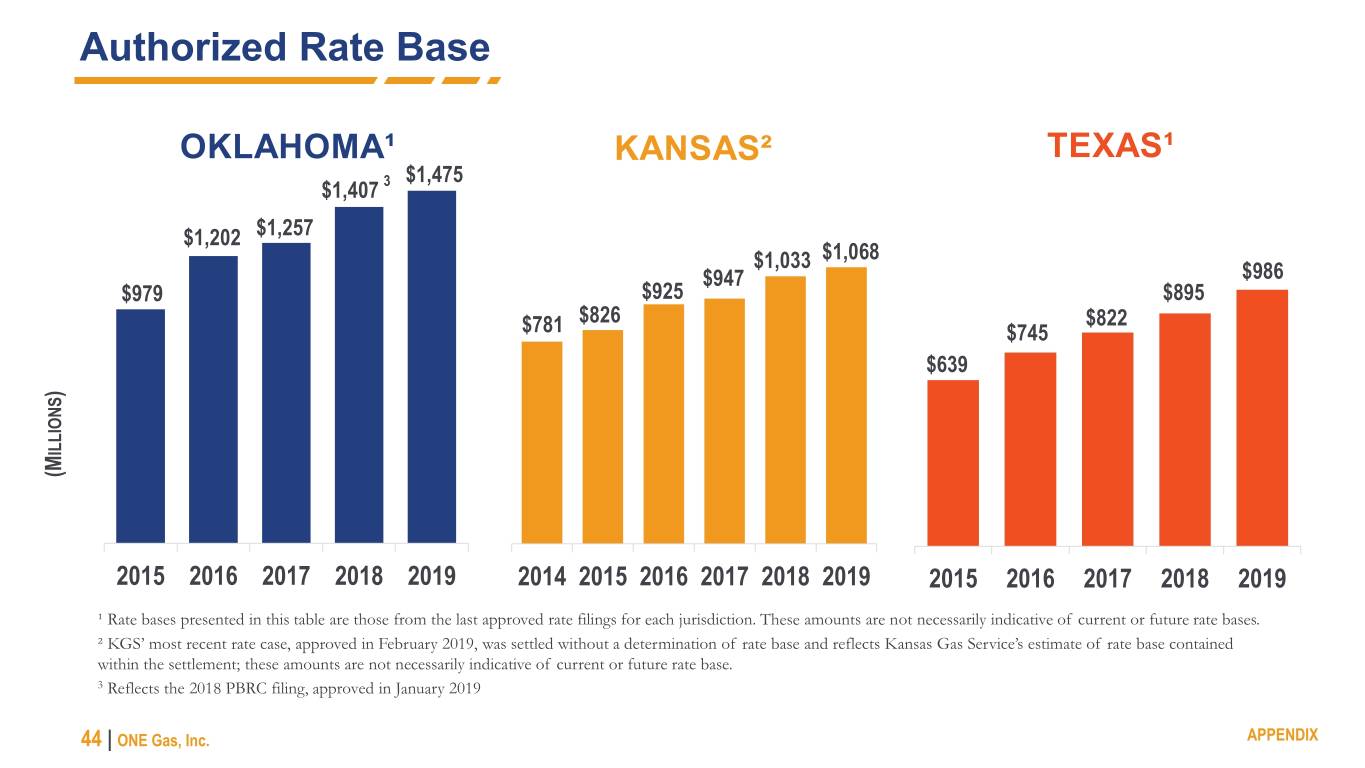
Authorized Rate Base OKLAHOMA¹ KANSAS² TEXAS¹ $1,475 $1,407 3 $1,202 $1,257 $1,033 $1,068 $947 $986 $979 $925 $895 $826 $822 $781 $745 $639 ) ILLIONS (M 2015 2016 2017 2018 2019 2014 2015 2016 2017 2018 2019 2015 2016 2017 2018 2019 ¹ Rate bases presented in this table are those from the last approved rate filings for each jurisdiction. These amounts are not necessarily indicative of current or future rate bases. ² KGS’ most recent rate case, approved in February 2019, was settled without a determination of rate base and reflects Kansas Gas Service’s estimate of rate base contained within the settlement; these amounts are not necessarily indicative of current or future rate base. 3 Reflects the 2018 PBRC filing, approved in January 2019 44 | ONE Gas, Inc. APPENDIX


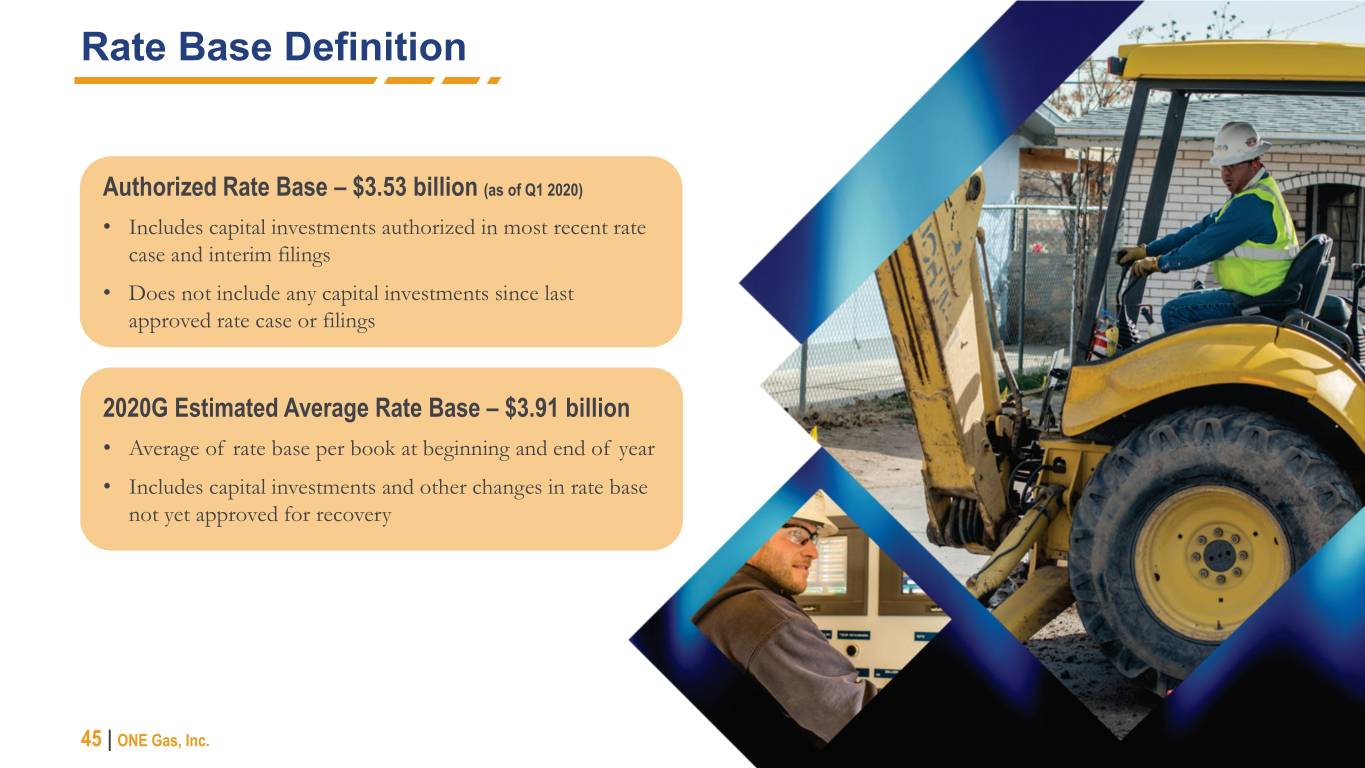
Rate Base Definition Authorized Rate Base – $3.53 billion (as of Q1 2020) • Includes capital investments authorized in most recent rate case and interim filings • Does not include any capital investments since last approved rate case or filings 2020G Estimated Average Rate Base – $3.91 billion • Average of rate base per book at beginning and end of year • Includes capital investments and other changes in rate base not yet approved for recovery 45 | ONE Gas, Inc. APPENDIX


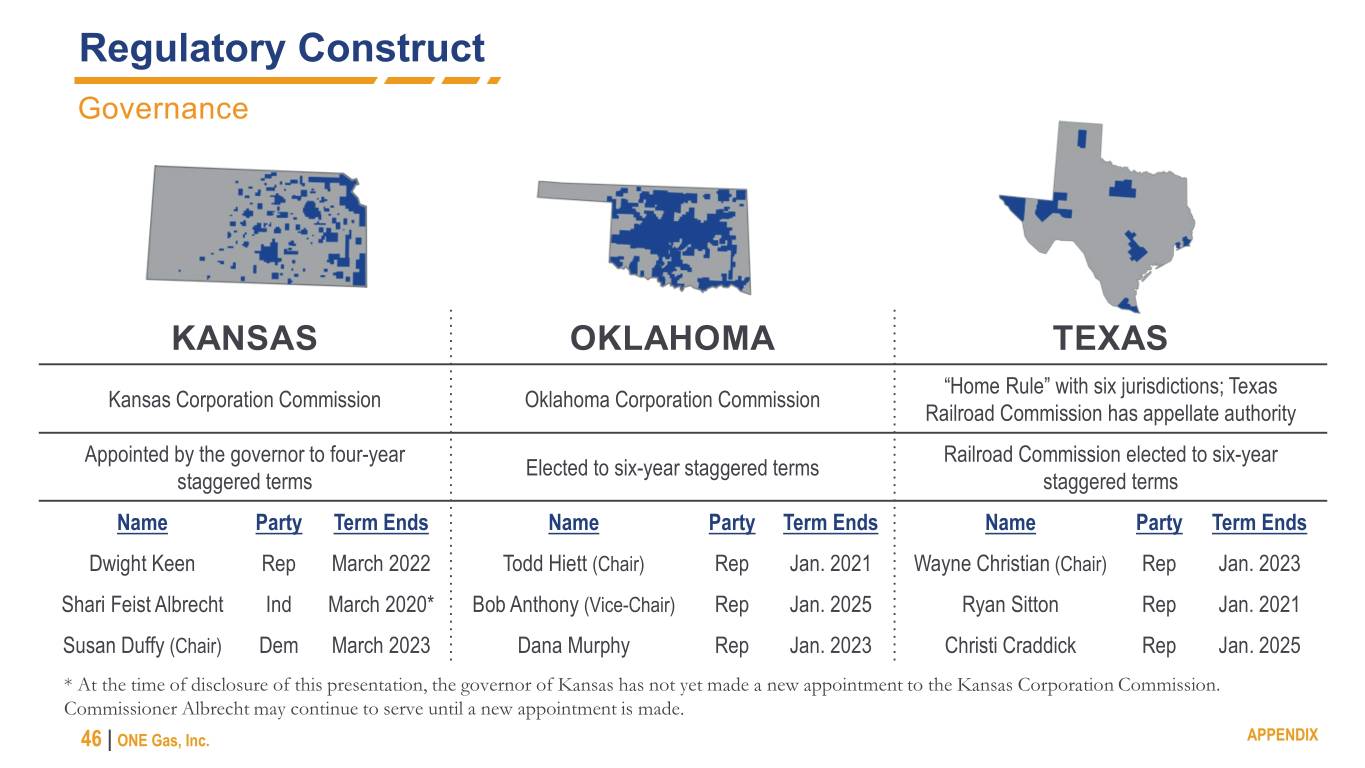
Regulatory Construct Governance KANSAS OKLAHOMA TEXAS “Home Rule” with six jurisdictions; Texas Kansas Corporation Commission Oklahoma Corporation Commission Railroad Commission has appellate authority Appointed by the governor to four-year Railroad Commission elected to six-year Elected to six-year staggered terms staggered terms staggered terms Name Party Term Ends Name Party Term Ends Name Party Term Ends Dwight Keen Rep March 2022 Todd Hiett (Chair) Rep Jan. 2021 Wayne Christian (Chair) Rep Jan. 2023 Shari Feist Albrecht Ind March 2020* Bob Anthony (Vice-Chair) Rep Jan. 2025 Ryan Sitton Rep Jan. 2021 Susan Duffy (Chair) Dem March 2023 Dana Murphy Rep Jan. 2023 Christi Craddick Rep Jan. 2025 * At the time of disclosure of this presentation, the governor of Kansas has not yet made a new appointment to the Kansas Corporation Commission. Commissioner Albrecht may continue to serve until a new appointment is made. 46 | ONE Gas, Inc. APPENDIX


Oklahoma Natural Gas Recent Regulatory Activity 2020 PBRC – FILED FEBRUARY 2020 Amount Requested $11.8 million rate increase Customer Impact $1.11 per month increase (for typical residential customer) Rate Base $1,616 million Return on Equity 9.5% (midpoint of allowed band) Common Equity Ratio* 56% Debt Costs 3.95% Excess Accumulated Deferred $12.2 million credit to customers expected in the first quarter 2021 Income Taxes * The 2015 Oklahoma Natural Gas rate case established a common equity ratio of 60.5%. For each future PBRC filing, the maximum allowed common equity ratio will decrease by 1% beginning with a 59% common equity ratio in the 2017 PBRC review of calendar year 2016, and ending with a 56% common equity ratio in the 2020 PBRC review of calendar year 2019. 47 | ONE Gas, Inc. APPENDIX


Texas Gas Service Recent Regulatory Activity CENTRAL TEXAS/GULF COAST SERVICE AREAS WEST TEXAS SERVICE AREA GRIP – GENERAL RATE CASE HIGHLIGHTS – FILED 2019 FILED MARCH 2020 Base Rates $15.6 million increase Incremental Revenue $4.7 million increase Operating Income $12.4 million Capital Expenditures $36 million Rate Base $460 million Pre-Tax Carrying 8.80% Rate of Return 7.93% Charge Capital Expenditures $145 million Customer Impact $1.19 per month increase for Return on Equity 10.0% average residential customer Common Equity Ratio 62.12% Debt Costs 4.53% Other • Consolidation with Central Texas service areas and Gulf Coast service areas into a single Central-Gulf service area • Requested $1.3 million credit to customers for excess accumulated deferred income taxes 48 | ONE Gas, Inc. APPENDIX


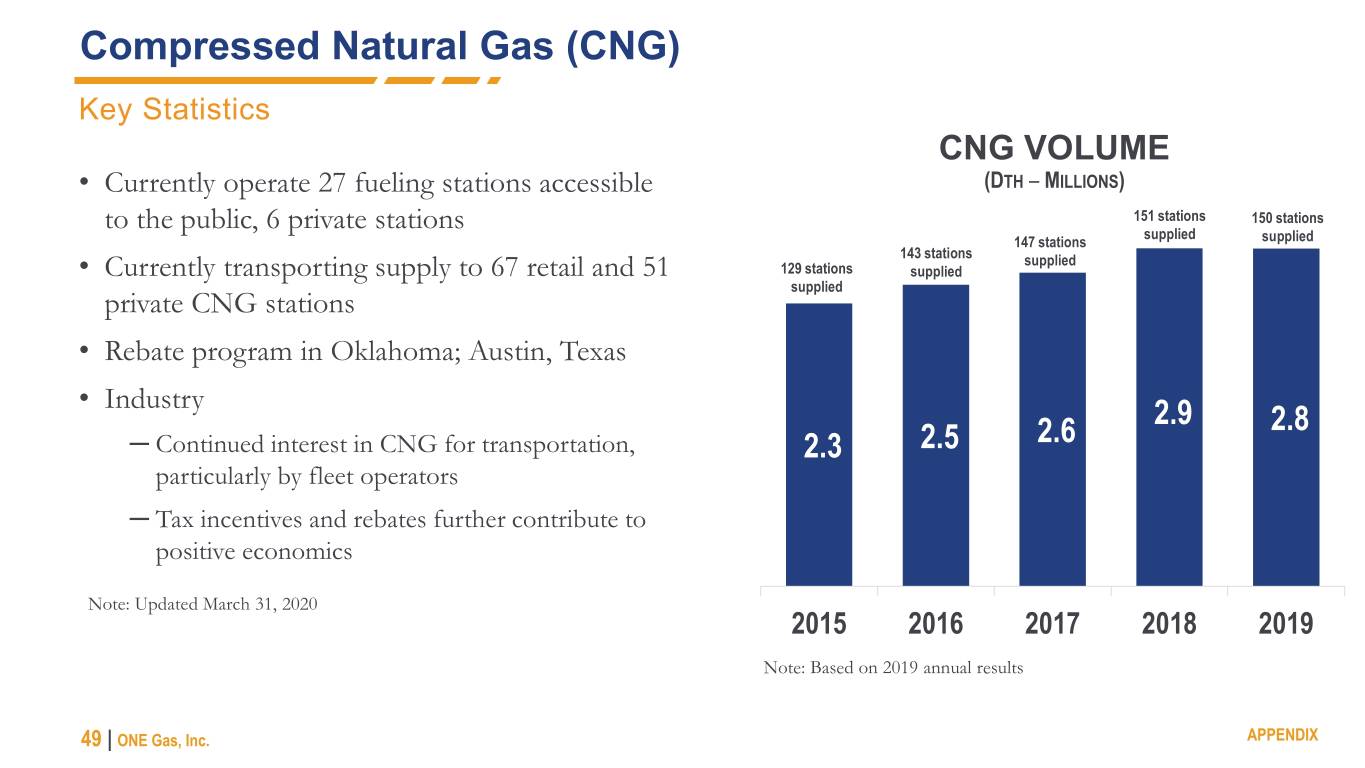
Compressed Natural Gas (CNG) Key Statistics CNG VOLUME • Currently operate 27 fueling stations accessible (DTH – MILLIONS) 151 stations 150 stations to the public, 6 private stations supplied 147 stations supplied 143 stations supplied • Currently transporting supply to 67 retail and 51 129 stations supplied supplied private CNG stations • Rebate program in Oklahoma; Austin, Texas • Industry 2.9 2.8 ─ Continued interest in CNG for transportation, 2.3 2.5 2.6 particularly by fleet operators ─ Tax incentives and rebates further contribute to positive economics Note: Updated March 31, 2020 2015 2016 2017 2018 2019 Note: Based on 2019 annual results 49 | ONE Gas, Inc. APPENDIX


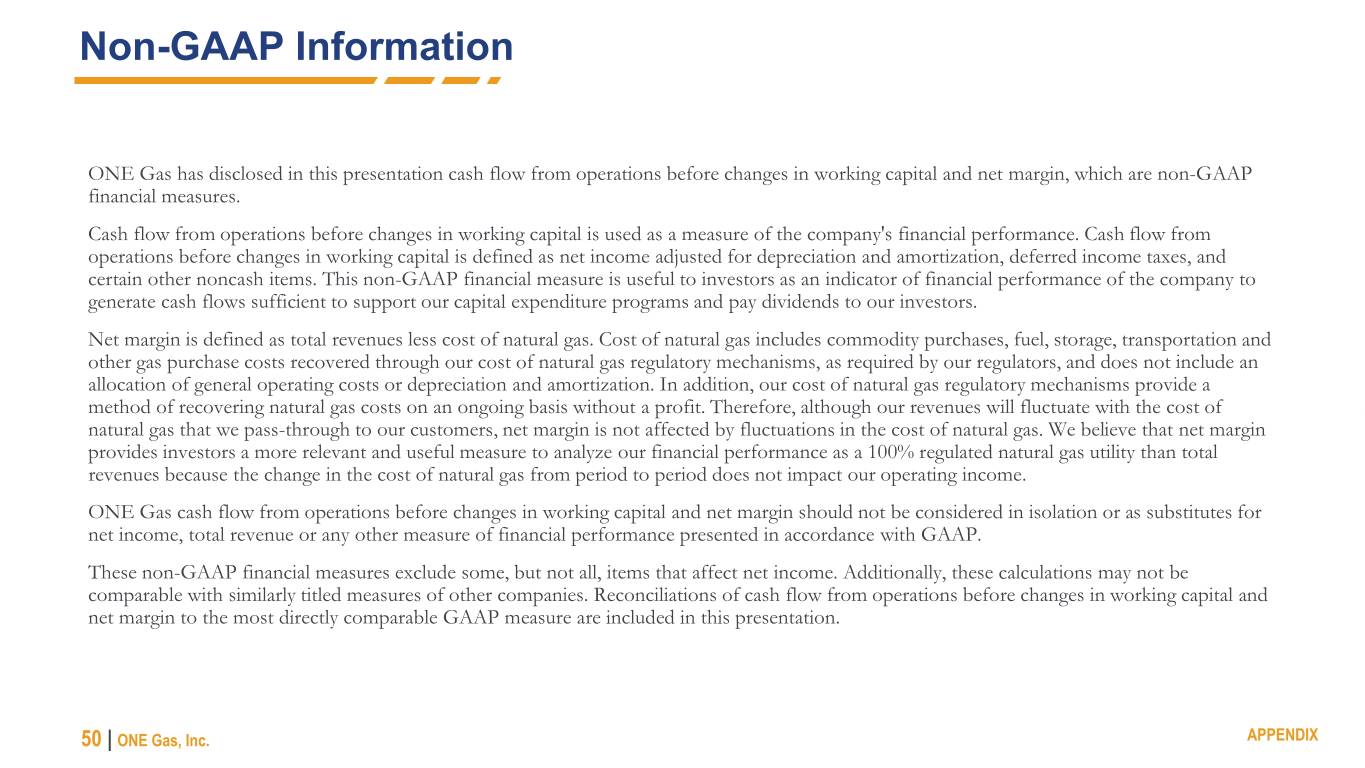
Non-GAAP Information ONE Gas has disclosed in this presentation cash flow from operations before changes in working capital and net margin, which are non-GAAP financial measures. Cash flow from operations before changes in working capital is used as a measure of the company's financial performance. Cash flow from operations before changes in working capital is defined as net income adjusted for depreciation and amortization, deferred income taxes, and certain other noncash items. This non-GAAP financial measure is useful to investors as an indicator of financial performance of the company to generate cash flows sufficient to support our capital expenditure programs and pay dividends to our investors. Net margin is defined as total revenues less cost of natural gas. Cost of natural gas includes commodity purchases, fuel, storage, transportation and other gas purchase costs recovered through our cost of natural gas regulatory mechanisms, as required by our regulators, and does not include an allocation of general operating costs or depreciation and amortization. In addition, our cost of natural gas regulatory mechanisms provide a method of recovering natural gas costs on an ongoing basis without a profit. Therefore, although our revenues will fluctuate with the cost of natural gas that we pass-through to our customers, net margin is not affected by fluctuations in the cost of natural gas. We believe that net margin provides investors a more relevant and useful measure to analyze our financial performance as a 100% regulated natural gas utility than total revenues because the change in the cost of natural gas from period to period does not impact our operating income. ONE Gas cash flow from operations before changes in working capital and net margin should not be considered in isolation or as substitutes for net income, total revenue or any other measure of financial performance presented in accordance with GAAP. These non-GAAP financial measures exclude some, but not all, items that affect net income. Additionally, these calculations may not be comparable with similarly titled measures of other companies. Reconciliations of cash flow from operations before changes in working capital and net margin to the most directly comparable GAAP measure are included in this presentation. 50 | ONE Gas, Inc. APPENDIX


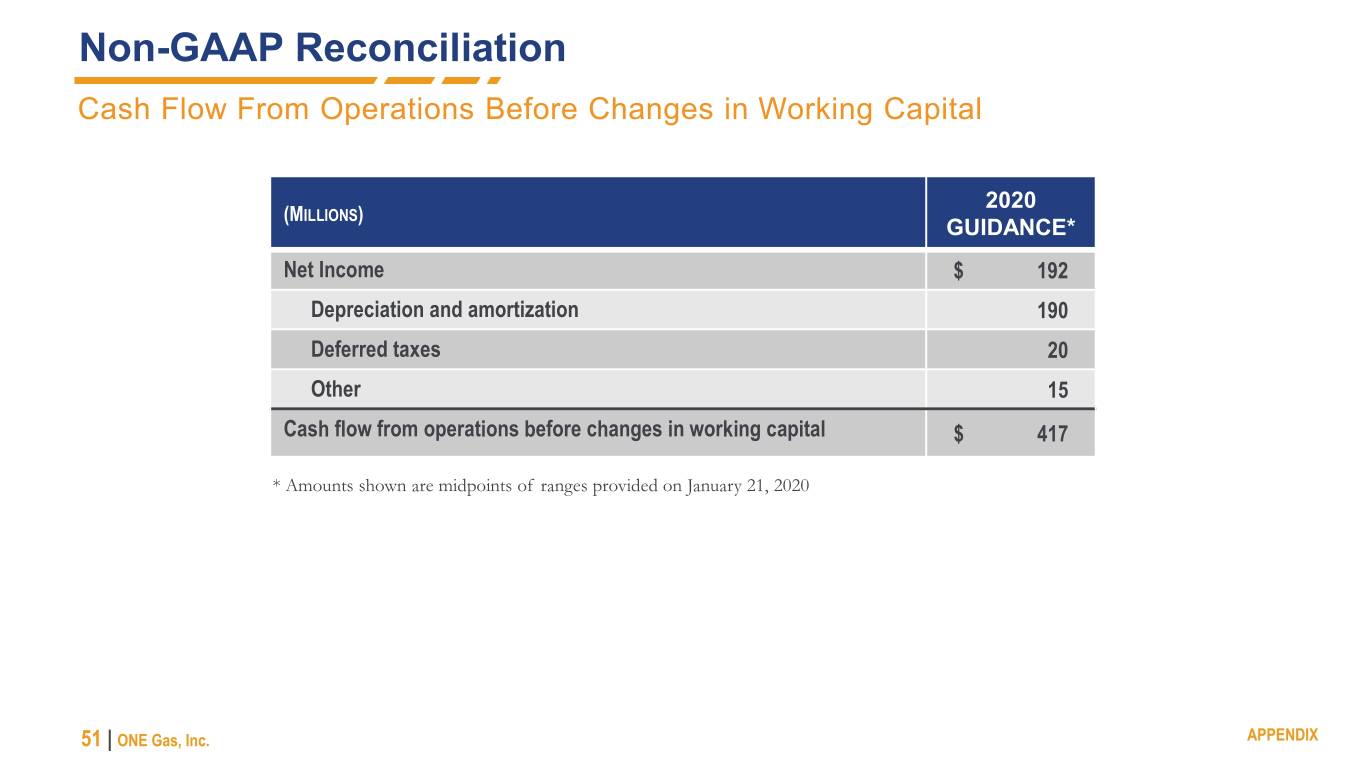
Non-GAAP Reconciliation Cash Flow From Operations Before Changes in Working Capital 2020 (MILLIONS) GUIDANCE* Net Income $ 192 Depreciation and amortization 190 Deferred taxes 20 Other 15 Cash flow from operations before changes in working capital $ 417 * Amounts shown are midpoints of ranges provided on January 21, 2020 51 | ONE Gas, Inc. APPENDIX


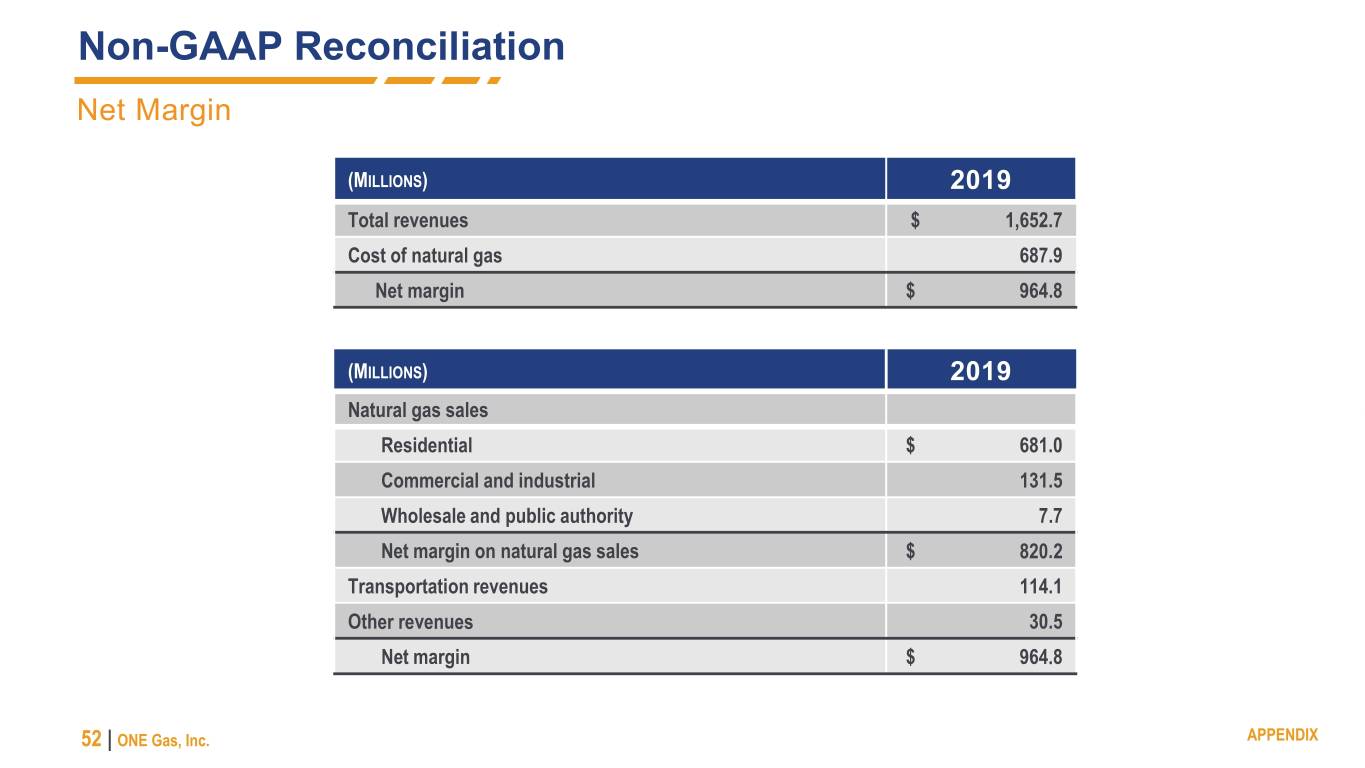
Non-GAAP Reconciliation Net Margin (MILLIONS) 2019 Total revenues $ 1,652.7 Cost of natural gas 687.9 Net margin $ 964.8 (MILLIONS) 2019 Natural gas sales Residential $ 681.0 Commercial and industrial 131.5 Wholesale and public authority 7.7 Net margin on natural gas sales $ 820.2 Transportation revenues 114.1 Other revenues 30.5 Net margin $ 964.8 52 | ONE Gas, Inc. APPENDIX