Exhibit
99.1

Omnicom Group Reports Third Quarter and Year-to-Date
2020 Results
NEW YORK, October 27, 2020 - Omnicom
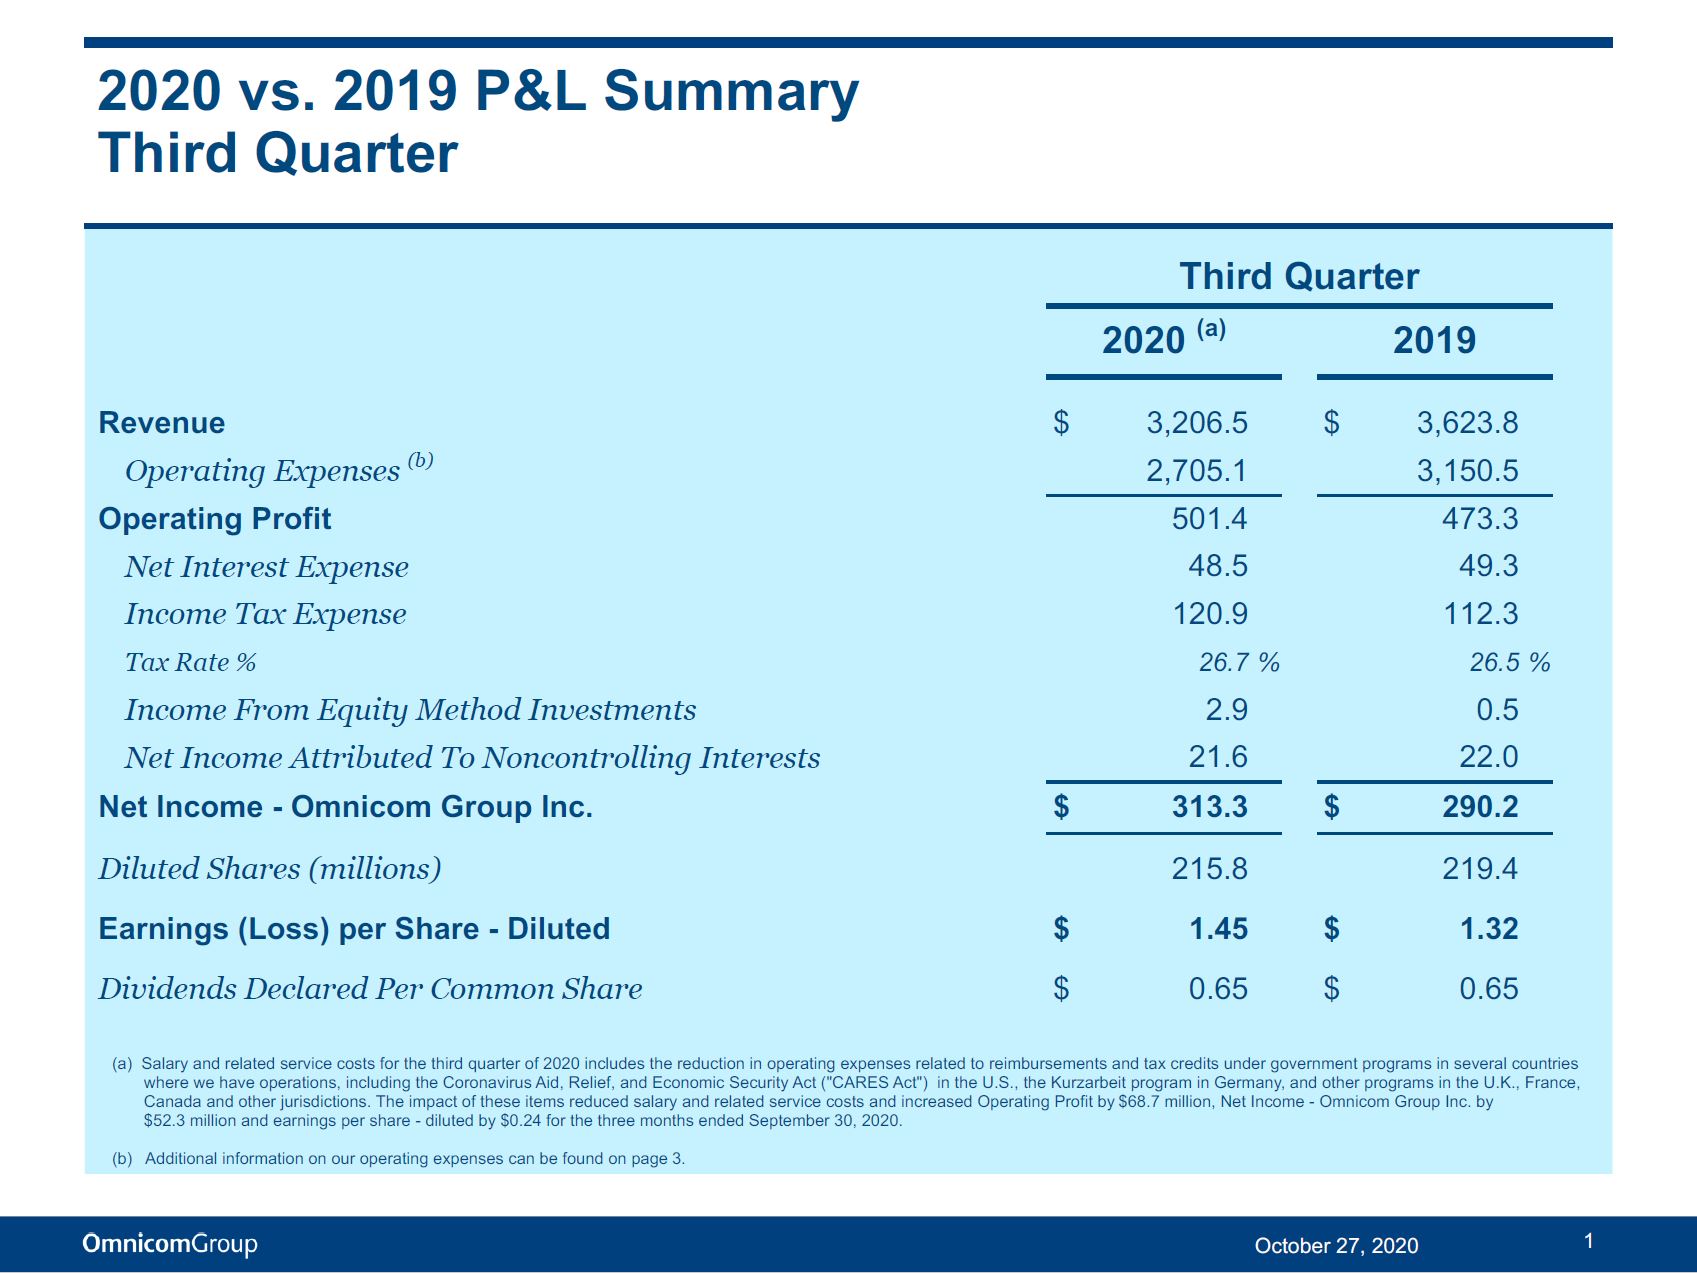
Group Inc. (NYSE: OMC) today announced net income - Omnicom Group Inc. for the third quarter of 2020 of $313.3 million compared
to net income - Omnicom Group Inc. of $290.2 million in the third quarter of 2019. Diluted net income per share for the third quarter
of 2020 was $1.45 per share compared to diluted net income per share of $1.32 for the third quarter of 2019.
Net income
- Omnicom Group Inc. and diluted net income per share - Omnicom Group Inc. in the third quarter of 2020 included a net after-tax
increase of $52.3 million and $0.24 per share, respectively, related to reimbursements and tax credits under government programs
in several countries where we have operations, as discussed further below.
Primarily due to the negative effects on our
revenue arising from the coronavirus disease 2019 ("COVID-19") pandemic, Omnicom’s worldwide revenue in the third
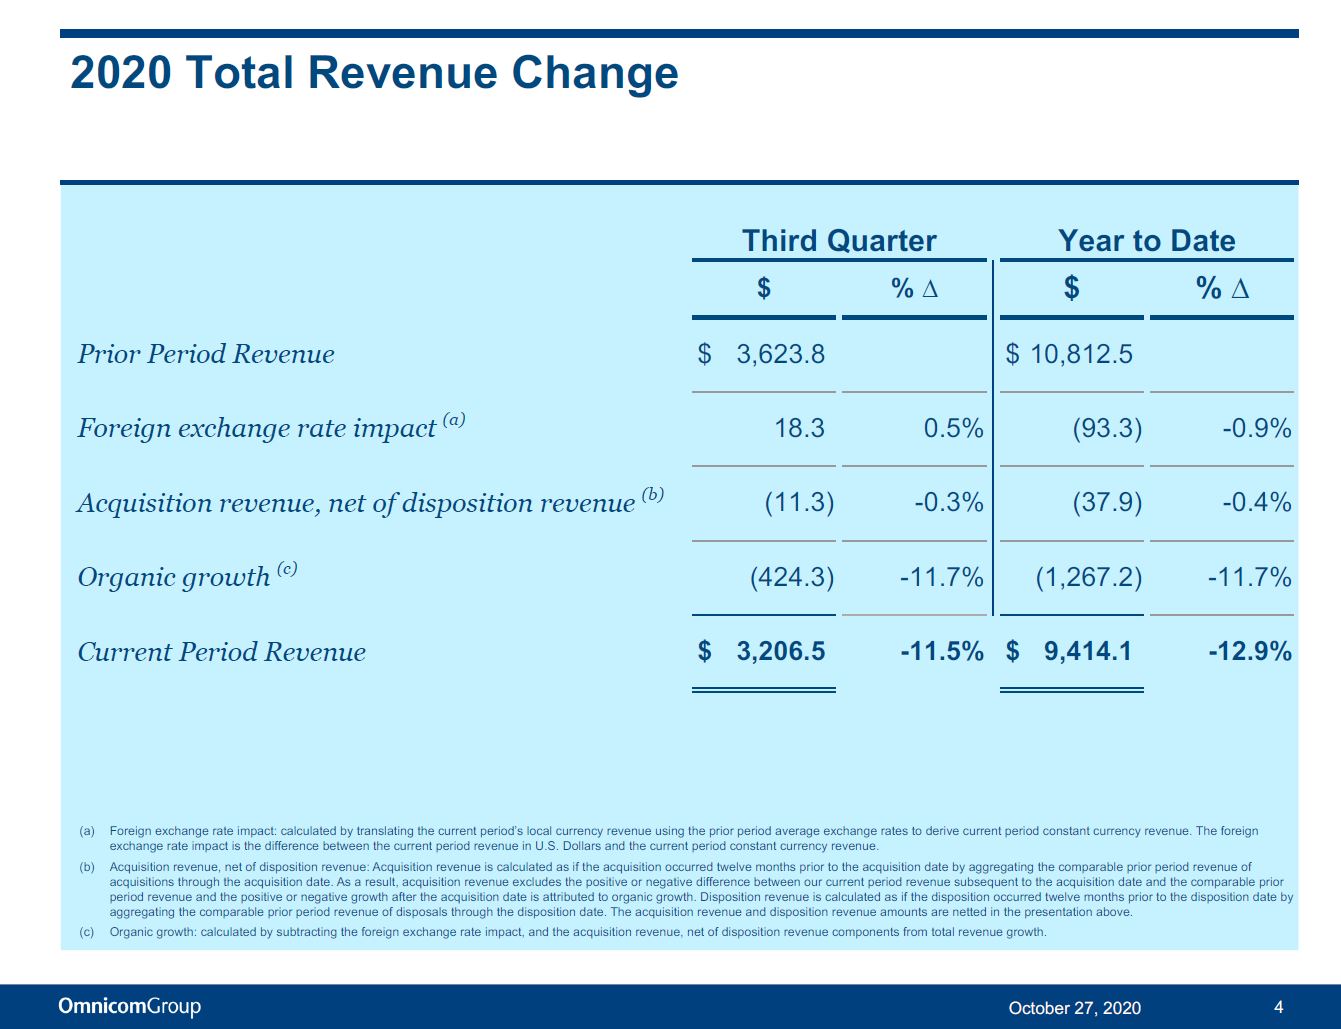
quarter of 2020 decreased 11.5% to $3,206.5 million from $3,623.8 million in the third quarter of 2019. The components of the change
in revenue included an increase in revenue from the positive impact of foreign currency translation of 0.5%, a decrease in acquisition
revenue, net of disposition revenue of 0.3% and a decrease in revenue from negative organic growth of 11.7% when compared to the
third quarter of 2019.
Organic growth in the third quarter of 2020
as compared to the third quarter of 2019 in our five fundamental disciplines was as follows: Advertising decreased 11.7%, CRM Consumer
Experience decreased 19.3%, CRM Execution & Support decreased 19.4%, Public Relations decreased 3.4% and Healthcare increased
3.8%.
Across our regional markets, organic growth
in the third quarter of 2020 as compared to the third quarter of 2019 was as follows: the United States decreased 11.4%, Other
North America decreased 7.6%, the United Kingdom decreased 12.5%, the Euro Markets & Other Europe decreased 9.6%, Asia Pacific
decreased 12.8%, Latin America decreased 22.3% and the Middle East & Africa decreased 21.4%.

Omnicom Group Inc.
Operating profit increased $28.1 million, or
5.9%, to $501.4 million compared to $473.3 million during the third quarter of 2019. Our operating margin for the third quarter
of 2020 increased to 15.6% versus 13.1% for the third quarter of 2019.
Salary and related service costs for the third
quarter of 2020 includes the reduction in operating expenses related to reimbursements and tax credits under government programs
in several countries where we have operations, including the Coronavirus Aid, Relief, and Economic Security Act ("CARES Act")
in the U.S., the Kurzarbeit program in Germany, and other programs in the U.K., France, Canada and other jurisdictions. The impact
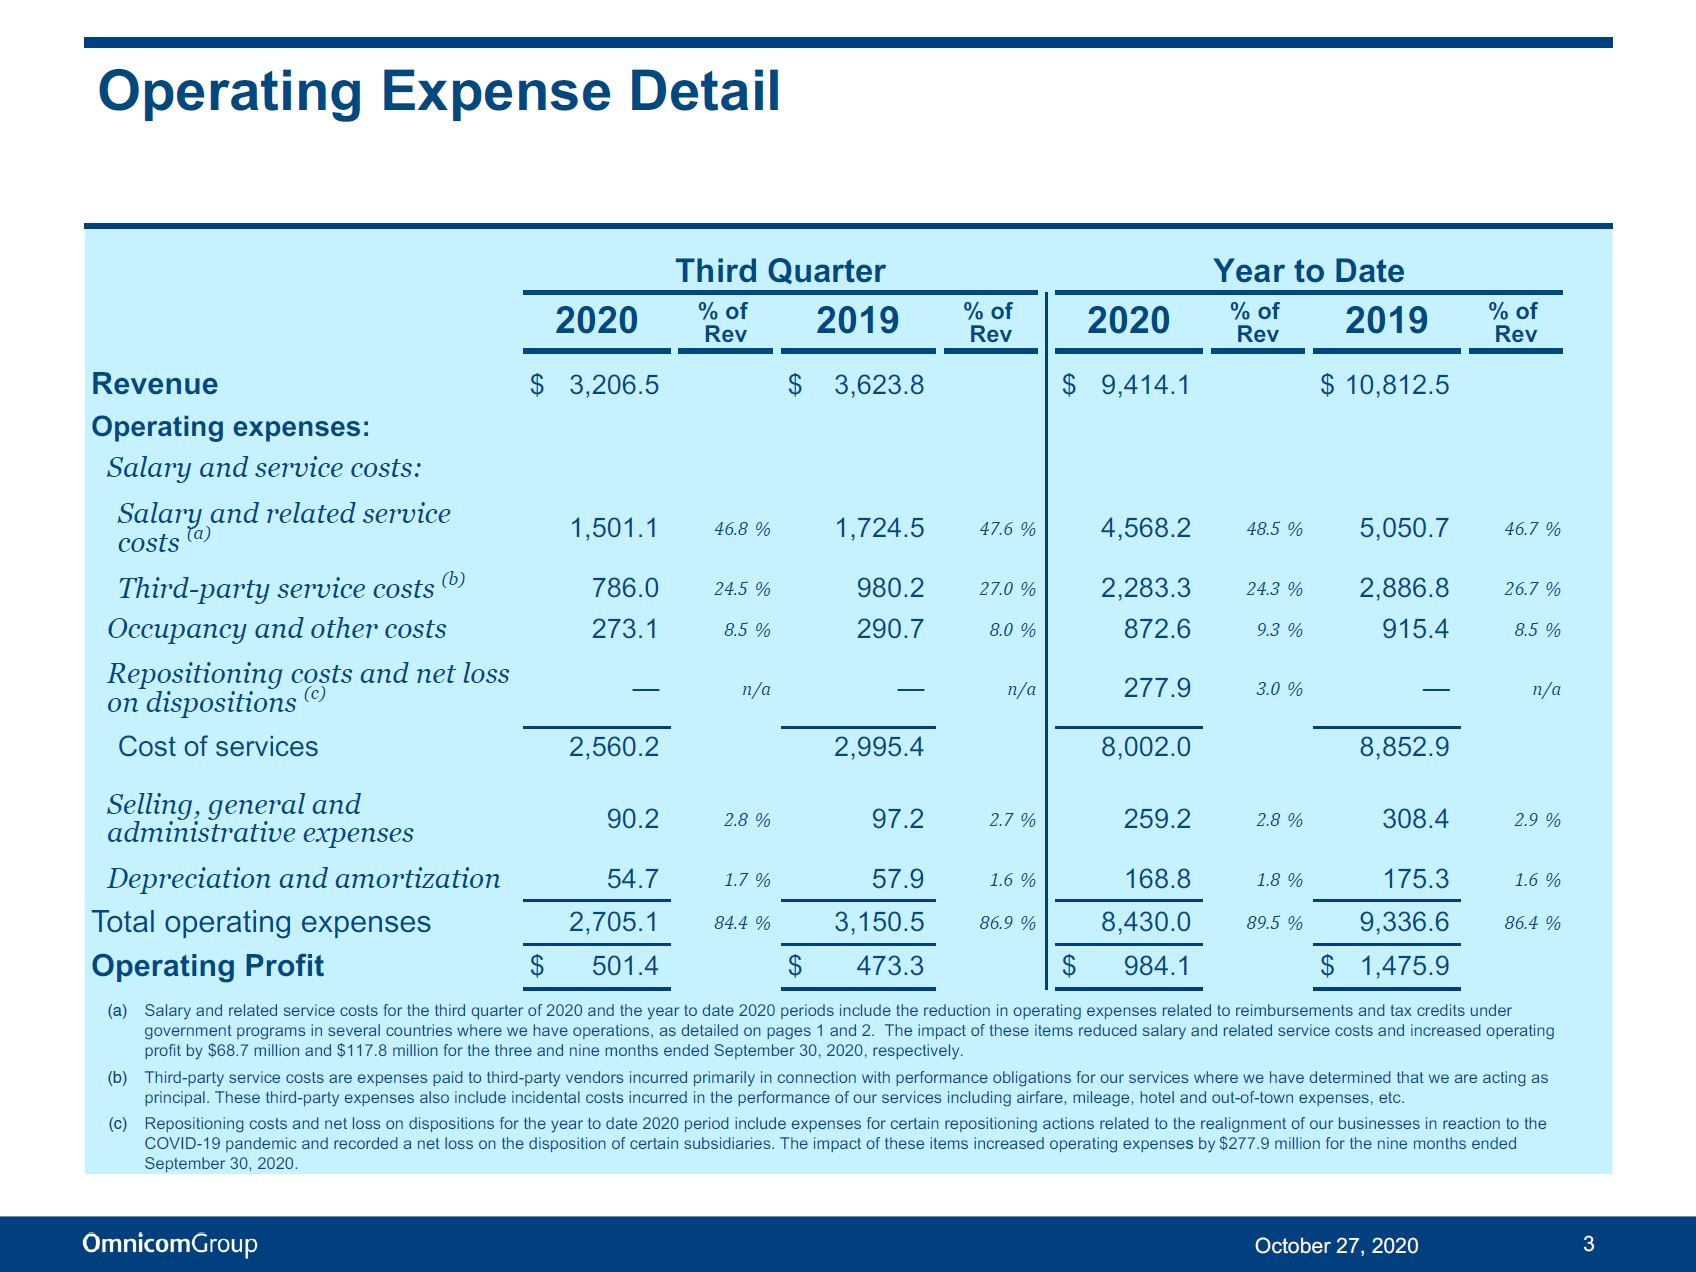
of these items reduced salary and related service costs and increased operating profit by $68.7 million in the third quarter of
2020.
For the third quarter of 2020, our effective
income tax rate increased period-over-period to 26.7% from 26.5%.
Year-to-Date
Net income - Omnicom Group Inc. for the nine
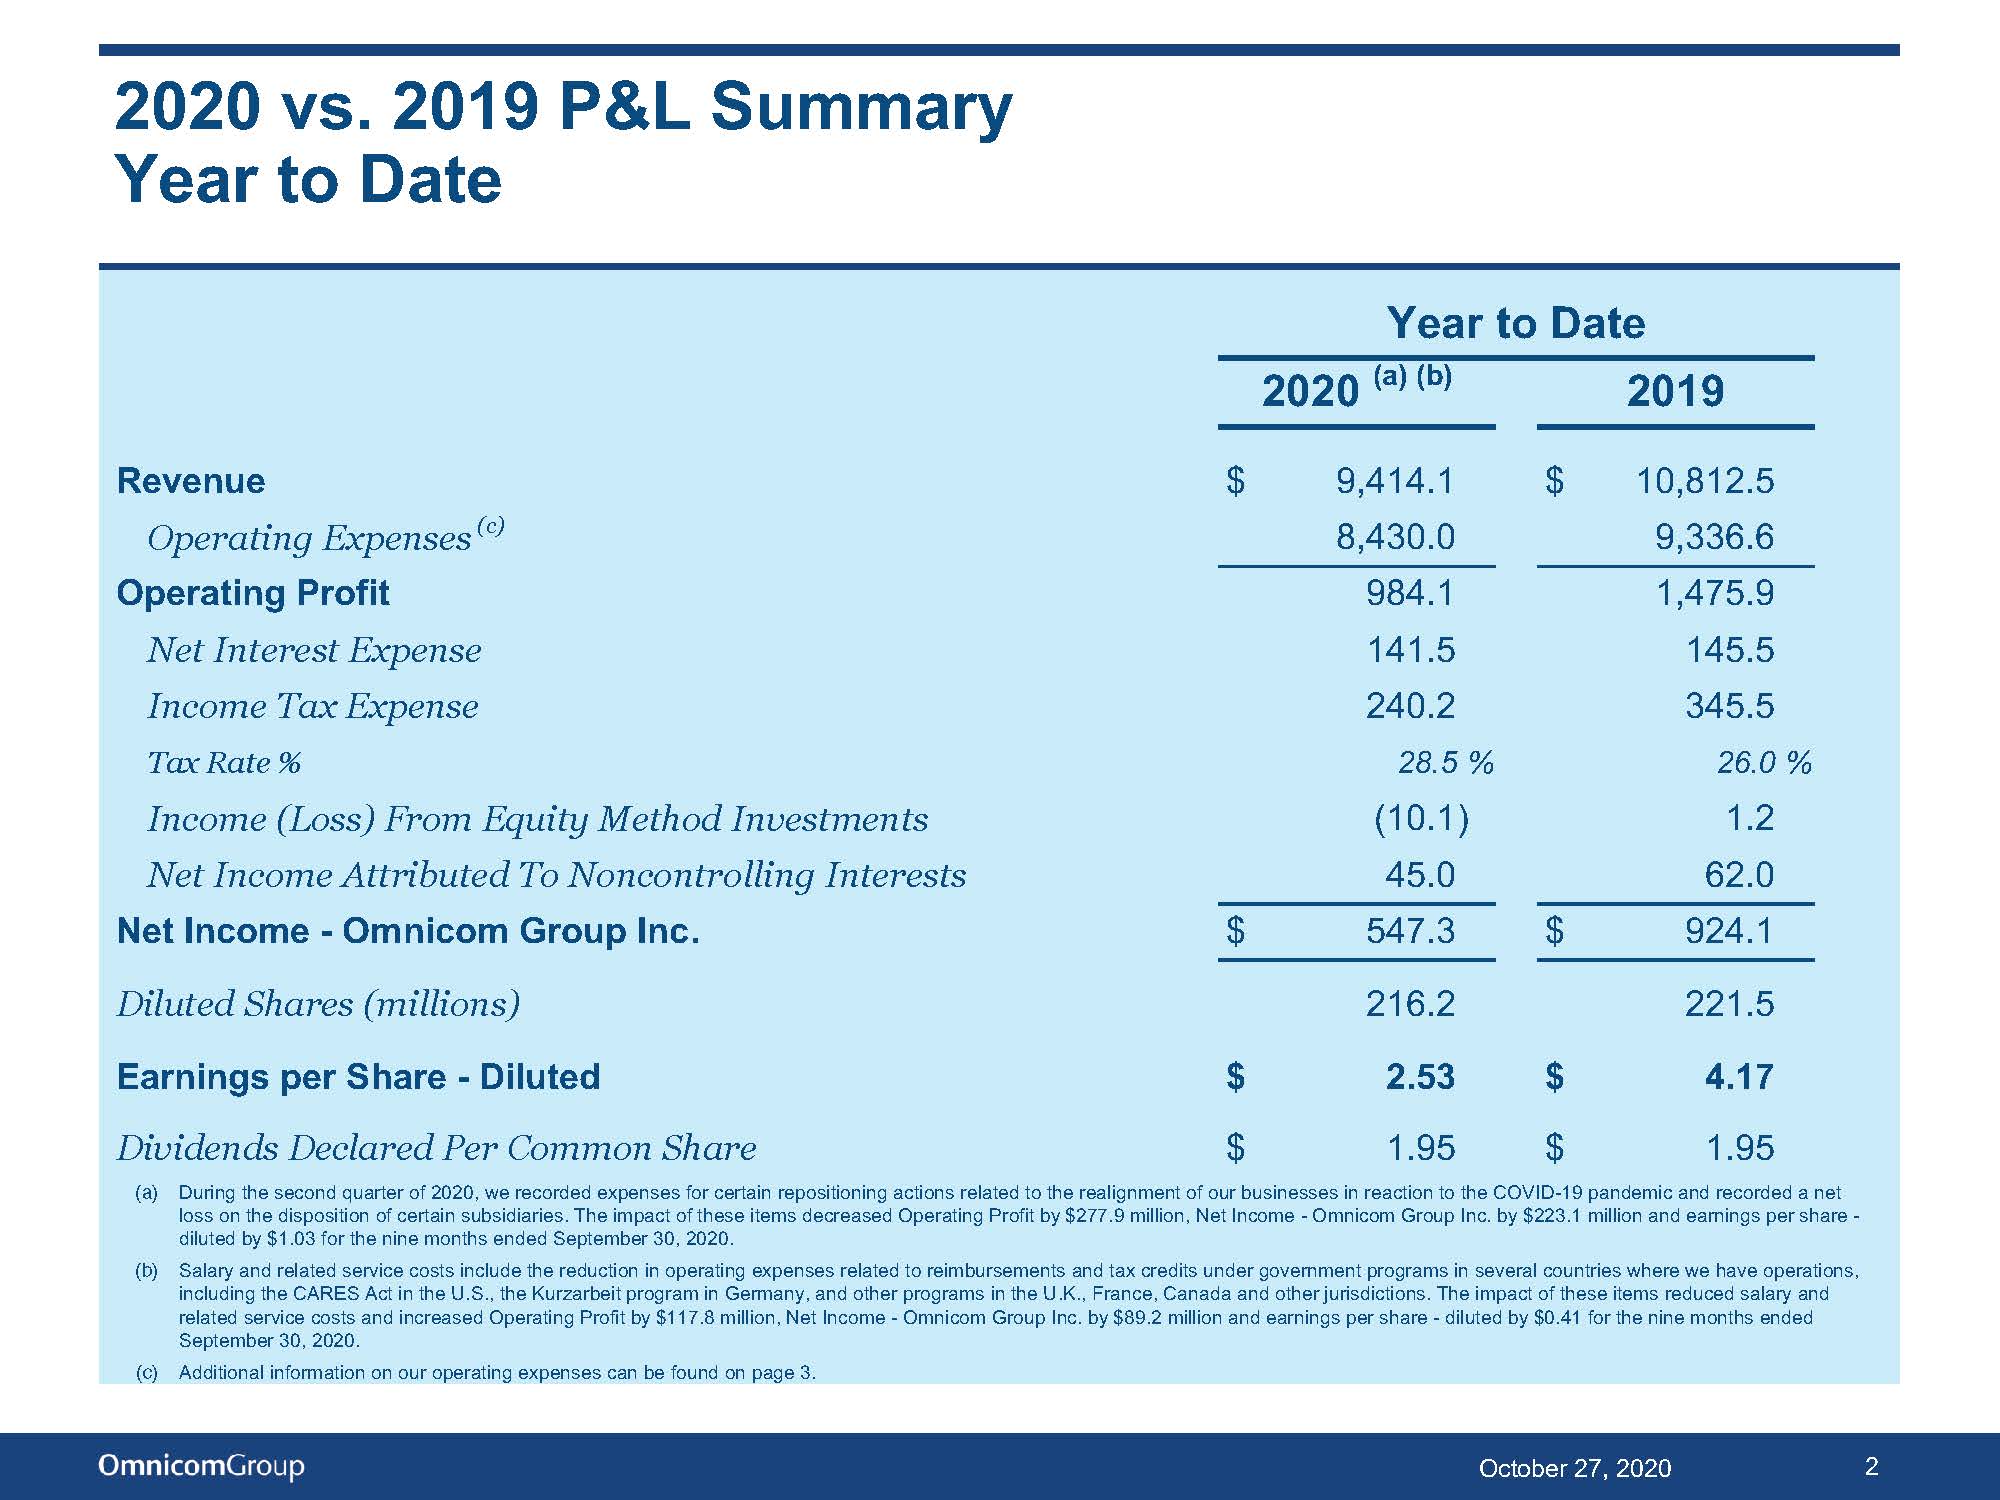
months ended September 30, 2020 decreased $376.8 million to $547.3 million compared to $924.1 million in the same period in
2019. Diluted net income per share - Omnicom Group Inc. for the nine months ended September 30, 2020 decreased $1.64 to $2.53
per share compared to $4.17 per share for the nine months ended September 30, 2019.
Net income - Omnicom Group Inc. and diluted
net income per share - Omnicom Group Inc. for the nine months ended September 30, 2020 included a net after-tax decrease of
$133.9 million and $0.62 per share, respectively, as a result of repositioning costs and a net loss on dispositions during the
second quarter of 2020 as well as the credit related to reimbursements and tax credits under government programs in several countries
where we have operations, as discussed further below.
Primarily due to the negative effects on
our revenue arising from the COVID-19 pandemic in the second and third quarters of 2020, worldwide revenue for the nine
months ended September 30, 2020 decreased 12.9% to $9,414.1 million from $10,812.5 million in the same period of 2019.
The components of the change in revenue included a decrease in revenue from the negative impact of foreign currency
translation of 0.9%, a decrease in acquisition revenue, net of disposition revenue of 0.4% and a decrease in revenue from
negative organic growth of 11.7% when compared to the same period of 2019.
Omnicom Group Inc.
Organic growth for the nine months ended September 30,
2020 compared to the same period in 2019 in our five fundamental disciplines was as follows: Advertising decreased 13.2%, CRM Consumer
Experience decreased 15.8%, CRM Execution & Support decreased 15.6%, Public Relations decreased 5.8% and Healthcare increased
5.3%.
Across our regional markets, organic growth
for the nine months ended September 30, 2020 as compared to the same period of 2019 was as follows: the United States decreased
10.3%, Other North America decreased 12.7%, the United Kingdom decreased 11.1%, the Euro Markets & Other Europe decreased 14.4%,
Asia Pacific decreased 10.2%, Latin America decreased 17.5% and the Middle East & Africa decreased 29.7%.
Operating profit decreased $491.8 million,
or 33.3%, to $984.1 million from $1,475.9 million for the nine months ended September 30, 2019. Our operating margin for the
nine months ended September 30, 2020 decreased to 10.5% versus 13.6% for the same period of 2019.
Operating profit for the nine months ended
September 30, 2020 includes a net decrease aggregating $160.1 million due to repositioning costs recorded during the second
quarter of 2020, comprised of incremental severance charges, right-of-use asset impairments and other real estate costs of $252.8
million, and a net loss on the disposition of certain subsidiaries and other charges of $25.1 million, partially offset by reimbursements
and tax credits under government programs in several countries where we have operations, including the CARES Act in the U.S., the
Kurzarbeit program in Germany, and other programs in the U.K., France, Canada and other jurisdictions, which reduced salary and
related service costs by $117.8 million.
Our effective tax rate for the nine months
ended September 30, 2020 increased period-over-period to 28.5% from 26.0%. The non-deductibility in certain jurisdictions
of a portion of the repositioning costs and net loss on dispositions recorded in the second quarter of 2020 had the effect of
increasing our effective tax rate for the nine months ended September 30, 2020 from 26.6% to 28.5%. In addition, in the same
period of 2019, income tax expense was reduced by $10.8 million, primarily from the net favorable settlements of uncertain tax
positions in certain jurisdictions. As a result, our effective rate for the nine months ended September 30, 2020 would have
approximated the rate in the same period in 2019 after considering these items.
Omnicom Group Inc.
COVID-19 Business
Update
The COVID-19 pandemic has significantly impacted
the global economy, our business and the results of operations. Public health efforts to mitigate the impact of the pandemic include
government actions such as travel restrictions, limitations on public gatherings, shelter in place orders and mandatory closures.
These actions have negatively impacted many of our clients' businesses and in turn clients have reduced or plan to reduce their
demand for our services. As a result, we experienced a reduction in our revenue beginning
late in the first quarter of 2020, as compared to the same period in 2019. The reduction in our revenue continued during the second
and third quarters of 2020 and is expected to continue for the remainder of the year. Such reductions in revenue could adversely
impact our ongoing results of operations and financial position and the effects could be material.
While we expect the pandemic to affect substantially
all of our clients, certain industry sectors have been affected more immediately and more significantly than others, including
travel, lodging and entertainment, energy and oil and gas, non-essential retail and automotive. Clients in these industries have
already acted to cut costs, including postponing or reducing marketing communication expenditures. While certain industries such
as healthcare and pharmaceuticals, technology and telecommunications, financial services and consumer products have fared relatively
well to date, conditions are volatile and economic uncertainty cuts across all clients, industries and geographies. Overall, while
we have a diversified portfolio of service offerings, clients and geographies, demand for our services can be expected to decline
as marketers reduce expenditures in the short term due to the uncertain impact of the pandemic on the global economy. During the
second quarter of 2020, we realigned our agencies' cost structures, which included severance actions and furloughs to reduce the
workforce, right-of-use asset impairments and other real estate costs, a net loss on the disposition of certain subsidiaries and
other charges. These actions were taken to tailor their services and capabilities to changes in client demand.
As we previously reported, during the first
half of 2020, we took numerous proactive steps to strengthen our liquidity and financial position that we expect will help mitigate
the potential impacts of COVID-19, including:
| • | The amendment and extension of our $2.5 billion credit facility to
February 2025, |
| • | The suspension of our share repurchase program, |
Omnicom Group Inc.
| • | The issuance in February of $600 million 10-year 2.45% Senior Notes,
which were used to finance the early redemption of the remaining $600 million of 4.45% Senior Notes that were due in August 2020,
|
| • | The issuance in early April of an additional $600 million 10-year
4.20% Senior Notes, and |
| • | The completion in early April, of a $400 million 364-day revolving
credit facility, which is in addition to our existing $2.5 billion revolving credit facility that expires in February 2025. |
We have no long-term debt maturing until May
2022.
Definitions -
Components of Revenue Change
We use certain terms in describing the components
of the change in revenue above.
Foreign exchange rate impact: calculated by
translating the current period’s local currency revenue using the prior period average exchange rates to derive current period
constant currency revenue. The foreign exchange rate impact is the difference between the current period revenue in U.S. Dollars
and the current period constant currency revenue.
Acquisition revenue, net of disposition revenue:
Acquisition revenue is calculated as if the acquisition occurred twelve months prior to the acquisition date by aggregating the
comparable prior period revenue of acquisitions through the acquisition date. As a result, acquisition revenue excludes the positive
or negative difference between our current period revenue subsequent to the acquisition date and the comparable prior period revenue
and the positive or negative growth after the acquisition date is attributed to organic growth. Disposition revenue is calculated
as if the disposition occurred twelve months prior to the disposition date by aggregating the comparable prior period revenue of
disposals through the disposition date. The acquisition revenue and disposition revenue amounts are netted in the description above.
Organic growth: calculated by subtracting the
foreign exchange rate impact component and the acquisition revenue, net of disposition revenue component from total revenue growth.
Forward-looking Statements
Omnicom Group Inc.
Certain statements in this press release related
to the potential impact of the COVID-19 outbreak constitute forward-looking statements, including statements within the meaning
of the Private Securities Litigation Reform Act of 1995. These statements may discuss goals, intentions and expectations as to
future plans, trends, events, results of operations or financial condition, or otherwise, based on current beliefs of the Company’s
management as well as assumptions made by, and information currently available to, the Company’s management. Forward-looking
statements may be accompanied by words such as “aim,” “anticipate,” “believe,” “plan,”
“could,” “should,” “would,” “estimate,” “expect,” “forecast,”
“future,” “guidance,” “intend,” “may,” “will,” “possible,”
“potential,” “predict,” “project” or similar words, phrases or expressions.
Forward-looking statements are subject to various
risks and uncertainties, many of which are outside the Company’s control. Therefore, you should not place undue reliance
on such statements. You should carefully consider this and the other risks and uncertainties that may affect the Company’s
business, including those described in Item 1A, “Risk Factors” and Item 7, “Management’s Discussion and
Analysis of Financial Condition and Results of Operations” in our Annual Report on Form 10-K for the year ended December 31,
2019 and other documents filed from time to time with the Securities and Exchange Commission. Except as required under applicable
law, the Company does not assume any obligation to update these forward-looking statements.
Conference Call
Omnicom will host a conference call to review
the third quarter financial results on Tuesday, October 27, 2020 at 8:15 a.m. EDT. Participants can listen to the conference
call by dialing (844) 291-5490 (domestic) or (409) 207-6993 (international), along with access code 5158965. The call will also
be simulcast and archived on our website at: http://investor.omnicomgroup.com/investor-relations/news-events-and-filings.
About Omnicom Group Inc.
Omnicom Group Inc. (NYSE: OMC) (www.omnicomgroup.com)
is a leading global marketing and corporate communications company. Omnicom’s branded networks and numerous specialty firms
provide advertising, strategic media planning and buying, digital and interactive marketing, direct and promotional
Omnicom Group Inc.
marketing, public relations and other specialty
communications services to over 5,000 clients in more than 70 countries. Follow us on Twitter
for the latest news.
Contacts
Omnicom Group Inc.
Consolidated Statements of Income
Three Months Ended September 30
(Unaudited)
(Dollars in Millions, Except Per Share Data)
| |
2020 (a) |
|
2019 |
| |
|
|
|
| Revenue |
$ |
3,206.5 |
|
|
$ |
3,623.8 |
|
| Operating Expenses: |
|
|
|
| Salary and service costs |
2,287.1 |
|
|
2,704.7 |
|
| Occupancy and other costs |
273.1 |
|
|
290.7 |
|
| Costs of services |
2,560.2 |
|
|
2,995.4 |
|
| Selling, general and administrative expenses |
90.2 |
|
|
97.2 |
|
| Depreciation and amortization |
54.7 |
|
|
57.9 |
|
| |
2,705.1 |
|
|
3,150.5 |
|
| Operating Profit |
501.4 |
|
|
473.3 |
|
| Interest Expense |
54.4 |
|
|
62.8 |
|
| Interest Income |
5.9 |
|
|
13.5 |
|
| Income Before Income Taxes |
452.9 |
|
|
424.0 |
|
| Income Tax Expense |
120.9 |
|
|
112.3 |
|
| Income From Equity Method Investments |
2.9 |
|
|
0.5 |
|
| Net Income |
334.9 |
|
|
312.2 |
|
| Net Income Attributed To Noncontrolling Interests |
21.6 |
|
|
22.0 |
|
| Net Income - Omnicom Group Inc. |
$ |
313.3 |
|
|
$ |
290.2 |
|
| |
|
|
|
| Net Income Per Share - Omnicom Group Inc. |
|
|
|
| Basic |
$ |
1.45 |
|
|
$ |
1.33 |
|
| Diluted |
$ |
1.45 |
|
|
$ |
1.32 |
|
| |
|
|
|
| Weighted average shares (in millions) |
|
|
|
| Basic |
215.4 |
|
|
218.2 |
|
| Diluted |
215.8 |
|
|
219.4 |
|
| |
|
|
|
| Dividends Declared Per Common Share |
$ |
0.65 |
|
|
$ |
0.65 |
|
| (a) | Salary and related service costs for the third quarter of 2020 includes the reduction in operating
expenses related to reimbursements and tax credits under government programs in several countries where we have operations, including
the Coronavirus Aid, Relief, and Economic Security Act ("CARES Act") in the U.S., the Kurzarbeit program in Germany,
and other programs in the U.K., France, Canada and other jurisdictions. The impact of these items reduced salary and related service
costs and increased Operating Profit by $68.7 million, Net Income - Omnicom Group Inc. by $52.3 million and diluted net income
per share - Omnicom Group Inc. by $0.24 for the three months ended September 30, 2020. |
Omnicom Group Inc.
Consolidated Statements of Income
Nine Months Ended September 30
(Unaudited)
(Dollars in Millions, Except Per Share Data)
| |
2020 (a) (b) |
|
2019 |
| |
|
|
|
| Revenue |
$ |
9,414.1 |
|
|
$ |
10,812.5 |
|
| Operating Expenses: |
|
|
|
| Salary and service costs |
6,851.5 |
|
|
7,937.5 |
|
| Occupancy and other costs |
872.6 |
|
|
915.4 |
|
| Repositioning costs and net loss on dispositions |
277.9 |
|
|
— |
|
| Costs of services |
8,002.0 |
|
|
8,852.9 |
|
| Selling, general and administrative expenses |
259.2 |
|
|
308.4 |
|
| Depreciation and amortization |
168.8 |
|
|
175.3 |
|
| |
8,430.0 |
|
|
9,336.6 |
|
| Operating Profit |
984.1 |
|
|
1,475.9 |
|
| Interest Expense |
166.6 |
|
|
192.4 |
|
| Interest Income |
25.1 |
|
|
46.9 |
|
| Income Before Income Taxes |
842.6 |
|
|
1,330.4 |
|
| Income Tax Expense |
240.2 |
|
|
345.5 |
|
| Income (Loss) From Equity Method Investments |
(10.1) |
|
|
1.2 |
|
| Net Income |
592.3 |
|
|
986.1 |
|
| Net Income Attributed To Noncontrolling Interests |
45.0 |
|
|
62.0 |
|
| Net Income - Omnicom Group Inc. |
$ |
547.3 |
|
|
$ |
924.1 |
|
| |
|
|
|
| Net Income Per Share - Omnicom Group Inc. |
|
|
|
| Basic |
$ |
2.54 |
|
|
$ |
4.19 |
|
| Diluted |
$ |
2.53 |
|
|
$ |
4.17 |
|
| |
|
|
|
| Weighted average shares (in millions) |
|
|
|
| Basic |
215.6 |
|
|
220.3 |
|
| Diluted |
216.2 |
|
|
221.5 |
|
| |
|
|
|
| Dividends Declared Per Common Share |
$ |
1.95 |
|
|
$ |
1.95 |
|
| (a) | During the second quarter of 2020, we recorded expenses for certain repositioning actions related
to the realignment of our businesses in reaction to the COVID-19 pandemic and recorded a net loss on the disposition of certain
subsidiaries. The impact of these items decreased Operating Profit by $277.9 million, Net Income - Omnicom Group Inc. by $223.1
million and diluted net income per share - Omnicom Group Inc. by $1.03 for the nine months ended September 30, 2020. |
| (b) | Salary and related service costs include the reduction in operating expenses related to reimbursements
and tax credits under government programs in several countries where we have operations, including the Coronavirus Aid, Relief,
and Economic Security Act ("CARES Act") in the U.S., the Kurzarbeit program in Germany, and other programs in the U.K.,
France, Canada and other jurisdictions. The impact of these items reduced salary and related service costs and increased Operating
Profit by $117.8 million, Net Income - Omnicom Group Inc. by $89.2 million and diluted net income per share - Omnicom Group Inc.
by $0.41 for the nine months ended September 30, 2020. |
Omnicom Group Inc.
Detail of Operating Expenses
Three Months Ended September 30
(Unaudited)
| |
2020 |
|
2019 |
| |
|
|
|
| Operating Expenses: |
|
|
|
| Salary and service costs |
|
|
|
| Salary and related service costs |
$ |
1,501.1 |
|
|
$ |
1,724.5 |
|
| Third-party service costs |
786.0 |
|
|
980.2 |
|
| Occupancy and other costs |
273.1 |
|
|
290.7 |
|
| Costs of services |
2,560.2 |
|
|
2,995.4 |
|
| Selling, general and administrative expenses |
90.2 |
|
|
97.2 |
|
| Depreciation and amortization |
54.7 |
|
|
57.9 |
|
| Total Operating Expenses |
$ |
2,705.1 |
|
|
$ |
3,150.5 |
|
Omnicom Group Inc.
Detail of Operating Expenses
Nine Months Ended September 30
(Unaudited)
| |
2020 |
|
2019 |
| |
|
|
|
| Operating Expenses: |
|
|
|
| Salary and service costs |
|
|
|
| Salary and related service costs |
$ |
4,568.2 |
|
|
$ |
5,050.7 |
|
| Third-party service costs |
2,283.3 |
|
|
2,886.8 |
|
| Occupancy and other costs |
872.6 |
|
|
915.4 |
|
| Repositioning costs and net loss on dispositions |
277.9 |
|
|
— |
|
| Costs of services |
8,002.0 |
|
|
8,852.9 |
|
| Selling, general and administrative expenses |
259.2 |
|
|
308.4 |
|
| Depreciation and amortization |
168.8 |
|
|
175.3 |
|
| Total Operating Expenses |
$ |
8,430.0 |
|
|
$ |
9,336.6 |
|
Omnicom Group Inc.
Impact of Repositioning Actions, Net Loss on Dispositions and
Government Wage Programs
Three and Nine Months Ended September 30, 2020
(Unaudited)
(Dollars in Millions)
| |
Three Months ended September 30, 2020 |
|
Nine Months ended September 30, 2020 |
| |
Gov't Wage Programs |
|
Total |
|
Severance Actions |
Real Estate Actions |
Other |
|
Total |
| |
|
|
|
|
|
|
|
|
|
| Operating Expenses (a) (b): |
|
|
|
|
|
|
|
|
|
| Salary and service costs |
|
|
|
|
|
|
|
|
|
| Salary and related service costs |
$ |
(68.7) |
|
|
$ |
(68.7) |
|
|
$ |
— |
|
$ |
— |
|
$ |
(117.8) |
|
|
$ |
(117.8) |
|
| Third-party costs |
— |
|
|
— |
|
|
— |
|
— |
|
— |
|
|
— |
|
| Occupancy and other costs |
— |
|
|
— |
|
|
— |
|
— |
|
— |
|
|
— |
|
| Repositioning costs and net loss on dispositions |
— |
|
|
— |
|
|
150.0 |
|
102.8 |
|
25.1 |
|
|
277.9 |
|
| Costs of services |
(68.7) |
|
|
(68.7) |
|
|
150.0 |
|
102.8 |
|
(92.7) |
|
|
160.1 |
|
| Selling, general and administrative expenses |
— |
|
|
— |
|
|
— |
|
— |
|
— |
|
|
— |
|
| Depreciation and amortization |
— |
|
|
— |
|
|
— |
|
— |
|
— |
|
|
— |
|
| Operating Expenses |
$ |
(68.7) |
|
|
$ |
(68.7) |
|
|
$ |
150.0 |
|
$ |
102.8 |
|
$ |
(92.7) |
|
|
$ |
160.1 |
|
| |
|
|
|
|
|
|
|
|
|
| (a) | The above table identifies the pre-tax impact of certain repositioning actions related to the realignment of our businesses
in reaction to the COVID-19 pandemic and recorded a net loss on the disposition of certain subsidiaries of $277.9 million. |
| (b) | Additionally, salary and related service costs for the third quarter of 2020 and the year to date 2020 periods include the
reduction in operating expenses related to reimbursements and tax credits under government programs in several countries where
we have operations. The impact of these items reduced salary and related service costs and increased operating profit by $68.7
million and $117.8 million for the three and nine months ended September 30, 2020, respectively. |
Exhibit 99.2

Third Quarter 2020 Results October 27, 2020 Investor Presentation
2020 vs. 2019 P&L Summary Third Quarter 1 October 27, 2020 Third Quarter 2020 (a) 2019 Revenue $ 3,206.5 $ 3,623.8 Operating Expenses (b) 2,705.1 3,150.5 Operating Profit 501.4 473.3 Net Interest Expense 48.5 49.3 Income Tax Expense 120.9 112.3 Tax Rate % 26.7 % 26.5 % Income From Equity Method Investments 2 .9 0 .5 Net Income Attributed To Noncontrolling Interests 21.6 22.0 Net Income - Omnicom Group Inc. $ 313.3 $ 290.2 Diluted Shares (millions) 215.8 219.4 Earnings (Loss) per Share - Diluted $ 1.45 $ 1.32 Dividends Declared Per Common Share $ 0.65 $ 0.65 (a) Salary and related service costs for the third quarter of 2020 includes the reduction in operating expenses related to reimbursements and tax credits under government programs in several countries where we have operations, including the Coronavirus Aid, Relief, and Economic Security Act ("CARES Act") in the U . S . , the Kurzarbeit program in Germany, and other programs in the U . K . , France, Canada and other jurisdictions . The impact of these items reduced salary and related service costs and increased Operating Profit by $ 68 . 7 million, Net Income - Omnicom Group Inc . by $ 52 . 3 million and earnings per share - diluted by $ 0 . 24 for the three months ended September 30 , 2020 . (b) Additional information on our operating expenses can be found on page 3.
2020 vs. 2019 P&L Summary Year to Date Year to Date 2020 (a) (b) 2019 Revenue $ 9,414.1 $ 10,812.5 Operating Expenses (c) 8,430.0 9,336.6 Operating Profit 984.1 1,475.9 Net Interest Expense 141.5 145.5 Income Tax Expense 240.2 345.5 Tax Rate % 28.5 % 26.0 % Income (Loss) From Equity Method Investments (10.1) 1 .2 Net Income Attributed To Noncontrolling Interests 45.0 62.0 Net Income - Omnicom Group Inc. $ 547.3 $ 924.1 Diluted Shares (millions) 216.2 221.5 Earnings per Share - Diluted $ 2.53 $ 4.17 Dividends Declared Per Common Share $ 1.95 $ 1.95 2 October 27, 2020 (a) During the second quarter of 2020, we recorded expenses for certain repositioning actions related to the realignment of our businesses in reaction to the COVID - 19 pandemic and recorded a net loss on the disposition of certain subsidiaries. The impact of these items decreased Operating Profit by $277.9 million, Net Inc ome - Omnicom Group Inc. by $223.1 million and earnings per share - diluted by $1.03 for the nine months ended September 30, 2020. (b) Salary and related service costs include the reduction in operating expenses related to reimbursements and tax credits under government programs in several countries where we have operations, including the CARES Act in the U.S., the Kurzarbeit program in Germany, and other programs in the U.K., France, Canada and other jurisdictions. The impact of these items reduced salary and related service costs and increased Operating Profit by $117.8 million, Net Income - Omnicom Group Inc. by $89.2 million and earnings per share - diluted by $0.41 for the nine months ended September 30, 2020. (c) Additional information on our operating expenses can be found on page 3.
Operating Expense Detail 3 October 27, 2020 Third Quarter Year to Date Revenue Operating expenses: Salary and service costs: Salary and related service costs (a) Third - party service costs (b) Occupancy and other costs Repositioning costs and net loss on dispositions (c) Cost of services Selling, general and administrative expenses Depreciation and amortization Total operating expenses Operating Profit 2020 % of 2019 % of Rev Rev 2020 % of 2019 % of Rev Rev $ 3 , 206 .5 $ 3 , 623 .8 $ 9 , 414 .1 $ 10,812.5 1 , 501 .1 46.8 % 1 , 724 .5 47.6 % 4 , 568 .2 48.5 % 5 , 050 .7 46.7 % 786 .0 24.5 % 980 .2 27.0 % 2 , 283 .3 24.3 % 2 , 886 .8 26.7 % 273 .1 8.5 % 290 .7 8.0 % 872 .6 9.3 % 915 .4 8.5 % — n /a — n /a 277 .9 3.0 % — n /a 2 , 560 .2 2 , 995 .4 8 , 002 .0 8 , 852 .9 90 .2 2.8 % 97 .2 2.7 % 259 .2 2.8 % 308 .4 2.9 % 54 .7 1.7 % 57 .9 1.6 % 168 .8 1.8 % 175 .3 1.6 % 2 , 705 .1 84.4 % 3 , 150 .5 86.9 % 8 , 430 .0 89.5 % 9 , 336 .6 86.4 % $ 501 .4 $ 473 .3 $ 984 .1 $ 1 , 475 .9 (a) Salary and related service costs for the third quarter of 2020 and the year to date 2020 periods include the reduction in operating expenses related to reimbursements and tax credits under government programs in several countries where we have operations, as detailed on pages 1 and 2. The impact of these items reduced salary and related service costs and increased operating profit by $68.7 million and $117.8 million for the three and nine months ended September 30, 2020, respectively. (b) Third - party service costs are expenses paid to third - party vendors incurred primarily in connection with performance obligations for our services where we have determined that we are acting as principal. These third - party expenses also include incidental costs incurred in the performance of our services including airfar e, mileage, hotel and out - of - town expenses, etc. (c) Repositioning costs and net loss on dispositions for the year to date 2020 period include expenses for certain repositioning actions related to the realignment of our businesses in reaction to the COVID - 19 pandemic and recorded a net loss on the disposition of certain subsidiaries. The impact of these items increased operating expenses by $277.9 million for the nine months ended September 30, 2020.
2020 Total Revenue Change Third Quarter Year to Date $ % ∆ $ % ∆ Prior Period Revenue $ 3,623.8 $ 10,812.5 Foreign exchange rate impact (a) 18 .3 0.5% ( 93 . 3 ) - 0 .9% Acquisition revenue, net of disposition revenue (b) ( 11 . 3 ) - 0.3% ( 37 . 9 ) - 0 .4% Organic growth (c) ( 424 . 3 ) - 11.7% ( 1 , 267 . 2 ) - 11 .7% Current Period Revenue $ 3,206.5 - 11.5% $ 9,414.1 - 12 .9% (a) Foreign exchange rate impact: calculated by translating the current period’s local currency revenue using the prior period av era ge exchange rates to derive current period constant currency revenue. The foreign exchange rate impact is the difference between the current period revenue in U.S. Dollars and the current period constant cur ren cy revenue. (b) Acquisition revenue, net of disposition revenue: Acquisition revenue is calculated as if the acquisition occurred twelve mont hs prior to the acquisition date by aggregating the comparable prior period revenue of acquisitions through the acquisition date. As a result, acquisition revenue excludes the positive or negative difference between our current period revenue subsequent to the acquisition date and the comparable prior period revenue and the positive or negative growth after the acquisition date is attributed to organic growth. Disposition revenue is calculated as if the disposition occurred twelve months prior to the disposition date by aggregating the comparable prior period revenue of disposals through the disposition date. The acquisition revenue and dispos iti on revenue amounts are netted in the presentation above. (c) Organic growth: calculated by subtracting the foreign exchange rate impact, and the acquisition revenue, net of disposition r eve nue components from total revenue growth. 4 October 27, 2020
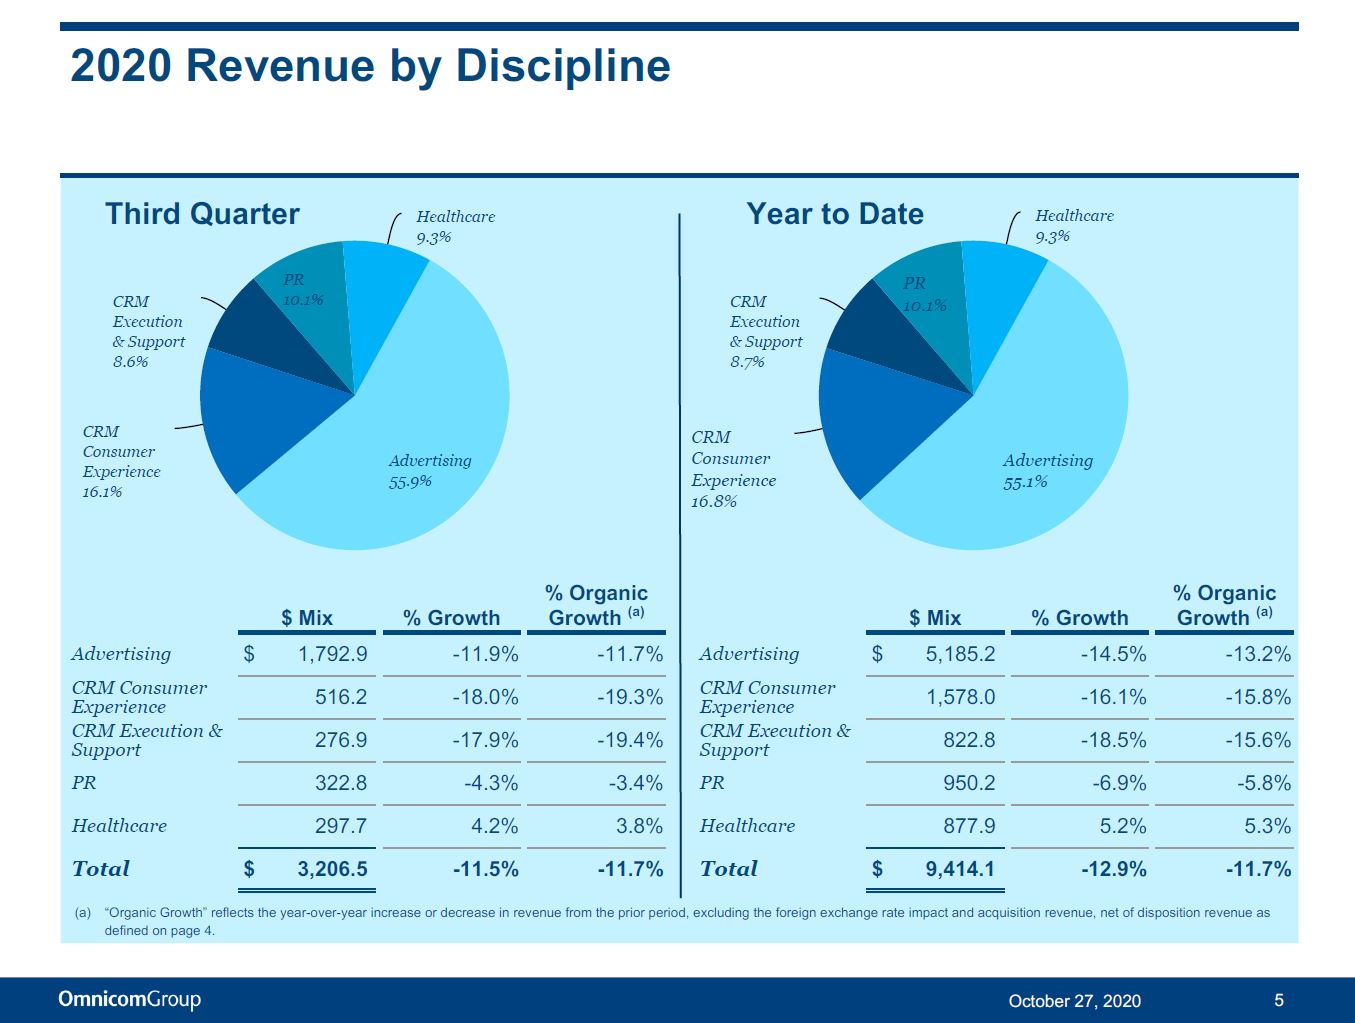
Ad vertising 55.9% CRM Consumer Experience 16.1% CRM Execution & Support 8 . 6 % PR 10.1% Healthcare 9.3% 2020 Revenue by Discipline Ad vertising 55.1% CRM Consumer Experience 16.8% CRM Execution & Support 8 . 7 % PR 10.1% Healthcare 9.3% Third Quarter Year to Date 516 .2 - 18 .0% - 19 .3% CRM Consumer Experience CRM Execution & Support PR Healthcar e 276.9 - 17.9% - 19.4% 322.8 - 4.3% - 3.4% 297.7 4.2% 3.8% % Organic $ Mix % Growth Growth (a) $ Mix % Growth Advertising $ 1,792.9 - 11.9% - 11 .7% Advertising $ 5,185.2 - 14.5% - 13.2% 1 , 578 .0 - 16 .1% - 15 .8% CRM Consumer Experience CRM Execution & Support PR Healthcar e 822.8 - 18.5% - 15.6% 950.2 - 6.9% - 5.8% 877.9 5.2% 5.3% T ot a l $ 3 , 206 .5 - 11 .5% - 11 .7% T ot a l $ 9 , 414 .1 - 12 .9% - 11 .7% (a) “Organic Growth” reflects the year - over - year increase or decrease in revenue from the prior period, excluding the foreign ex change rate impact and acquisition revenue, net of disposition revenue as defined on page 4. 5 October 27, 2020
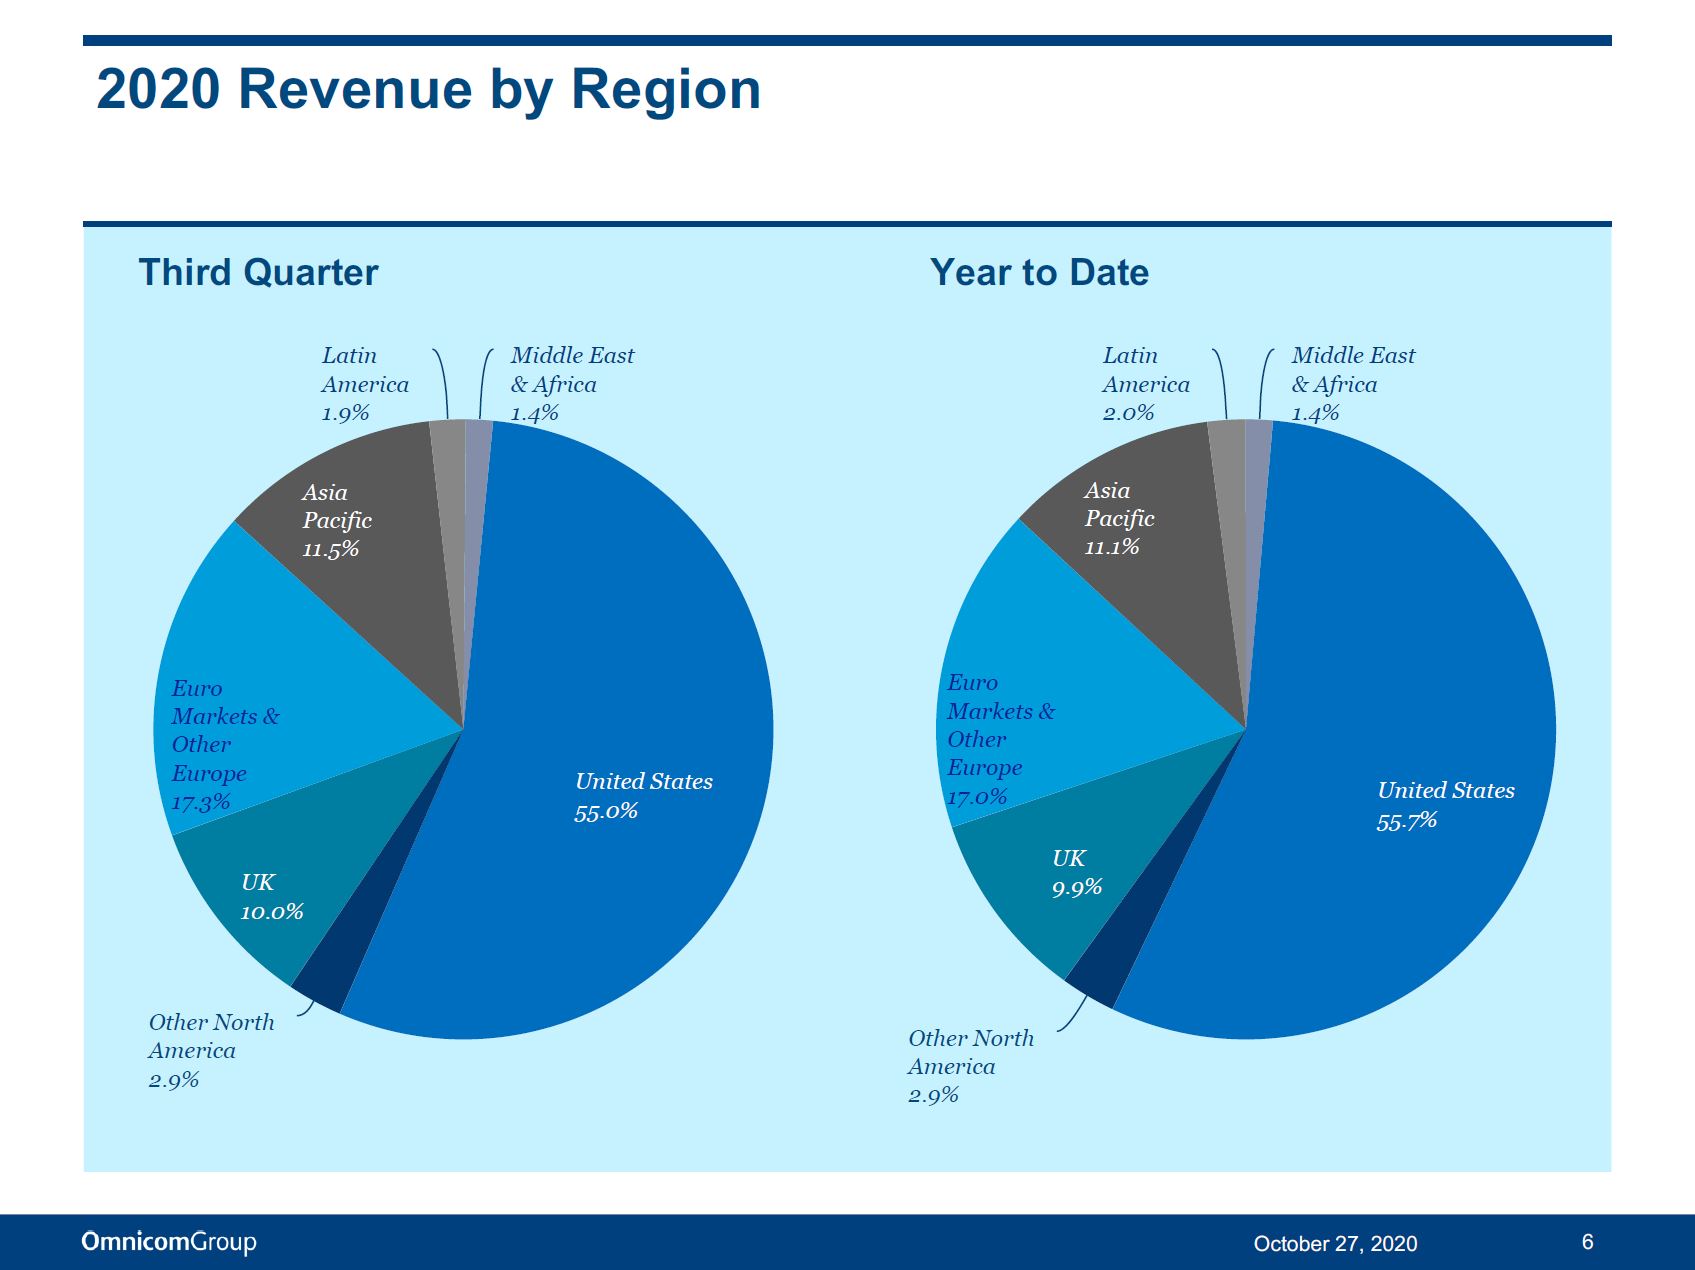
UK 9.9% Euro Markets & Other Europe 17.0% Asia Pacific 11.1% Latin America 2.0% Middle East & Africa 1.4% United States 55.7% Other North America 2.9% Third Quarter UK 10.0% 6 October 27, 2020 Euro Markets & Other Europe 17.3% Asia Pacific 11.5% Latin America 1.9% Middle East & Africa 1.4% United States 55.0% Other North America 2.9% 2020 Revenue by Region Year to Date
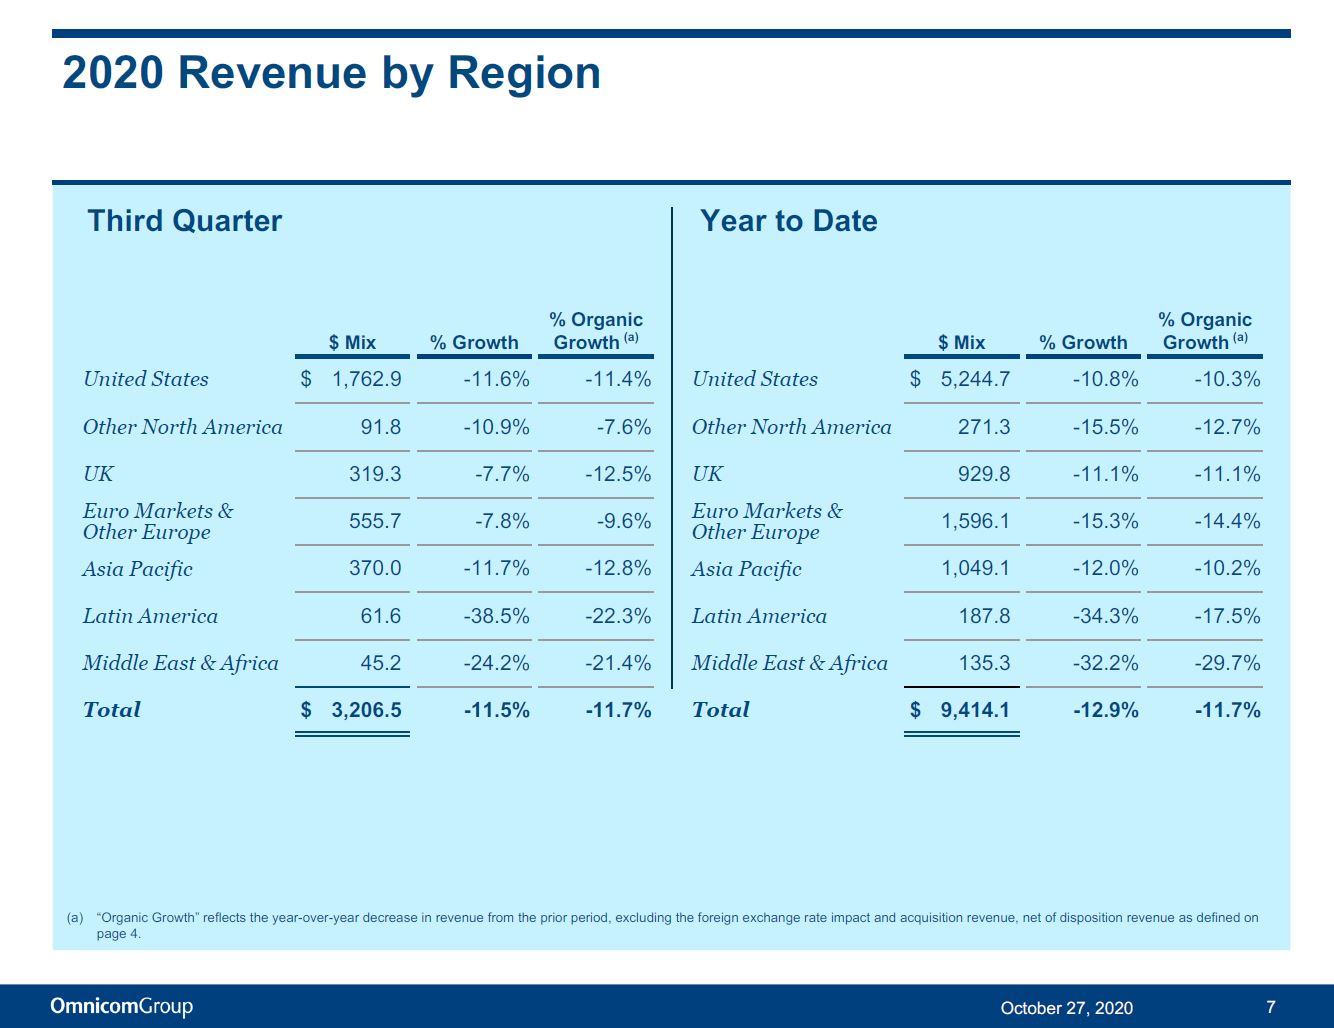
2020 Revenue by Region Third Quarter Year to Date $ Mix % Growth % Organic Growth (a) $ Mix % Growth % Organic Growth (a) United States $ 1 , 762 .9 - 11 .6% - 11 .4% United States $ 5 , 244 .7 - 10 .8% - 10 .3% Other North America 91 .8 - 10 .9% - 7 .6% Other North America 271 .3 - 15 .5% - 12 .7% UK 319 .3 - 7 .7% - 12 .5% UK 929 .8 - 11 .1% - 11 .1% Euro Markets & Other Europe 555 .7 - 7 .8% - 9 .6% Euro Markets & Other Europe 1 , 596 .1 - 15 .3% - 14 .4% Asia Pacific 370 .0 - 11 .7% - 12 .8% Asia Pacific 1 , 049 .1 - 12 .0% - 10 .2% Latin America 61 .6 - 38 .5% - 22 .3% Latin America 187 .8 - 34 .3% - 17 .5% Middle East & Africa 45 .2 - 24 .2% - 21 .4% Middle East & Africa 135 .3 - 32 .2% - 29 .7% Total $ 3 , 206 .5 - 11 .5% - 11 .7% Total $ 9 , 414 .1 - 12 .9% - 11 .7% 7 October 27, 2020 (a) “Organic Growth” reflects the year - over - year decrease in revenue from the prior period, excluding the foreign exchange rate impact and acquisition revenue, net of disposition revenue as defined on page 4.
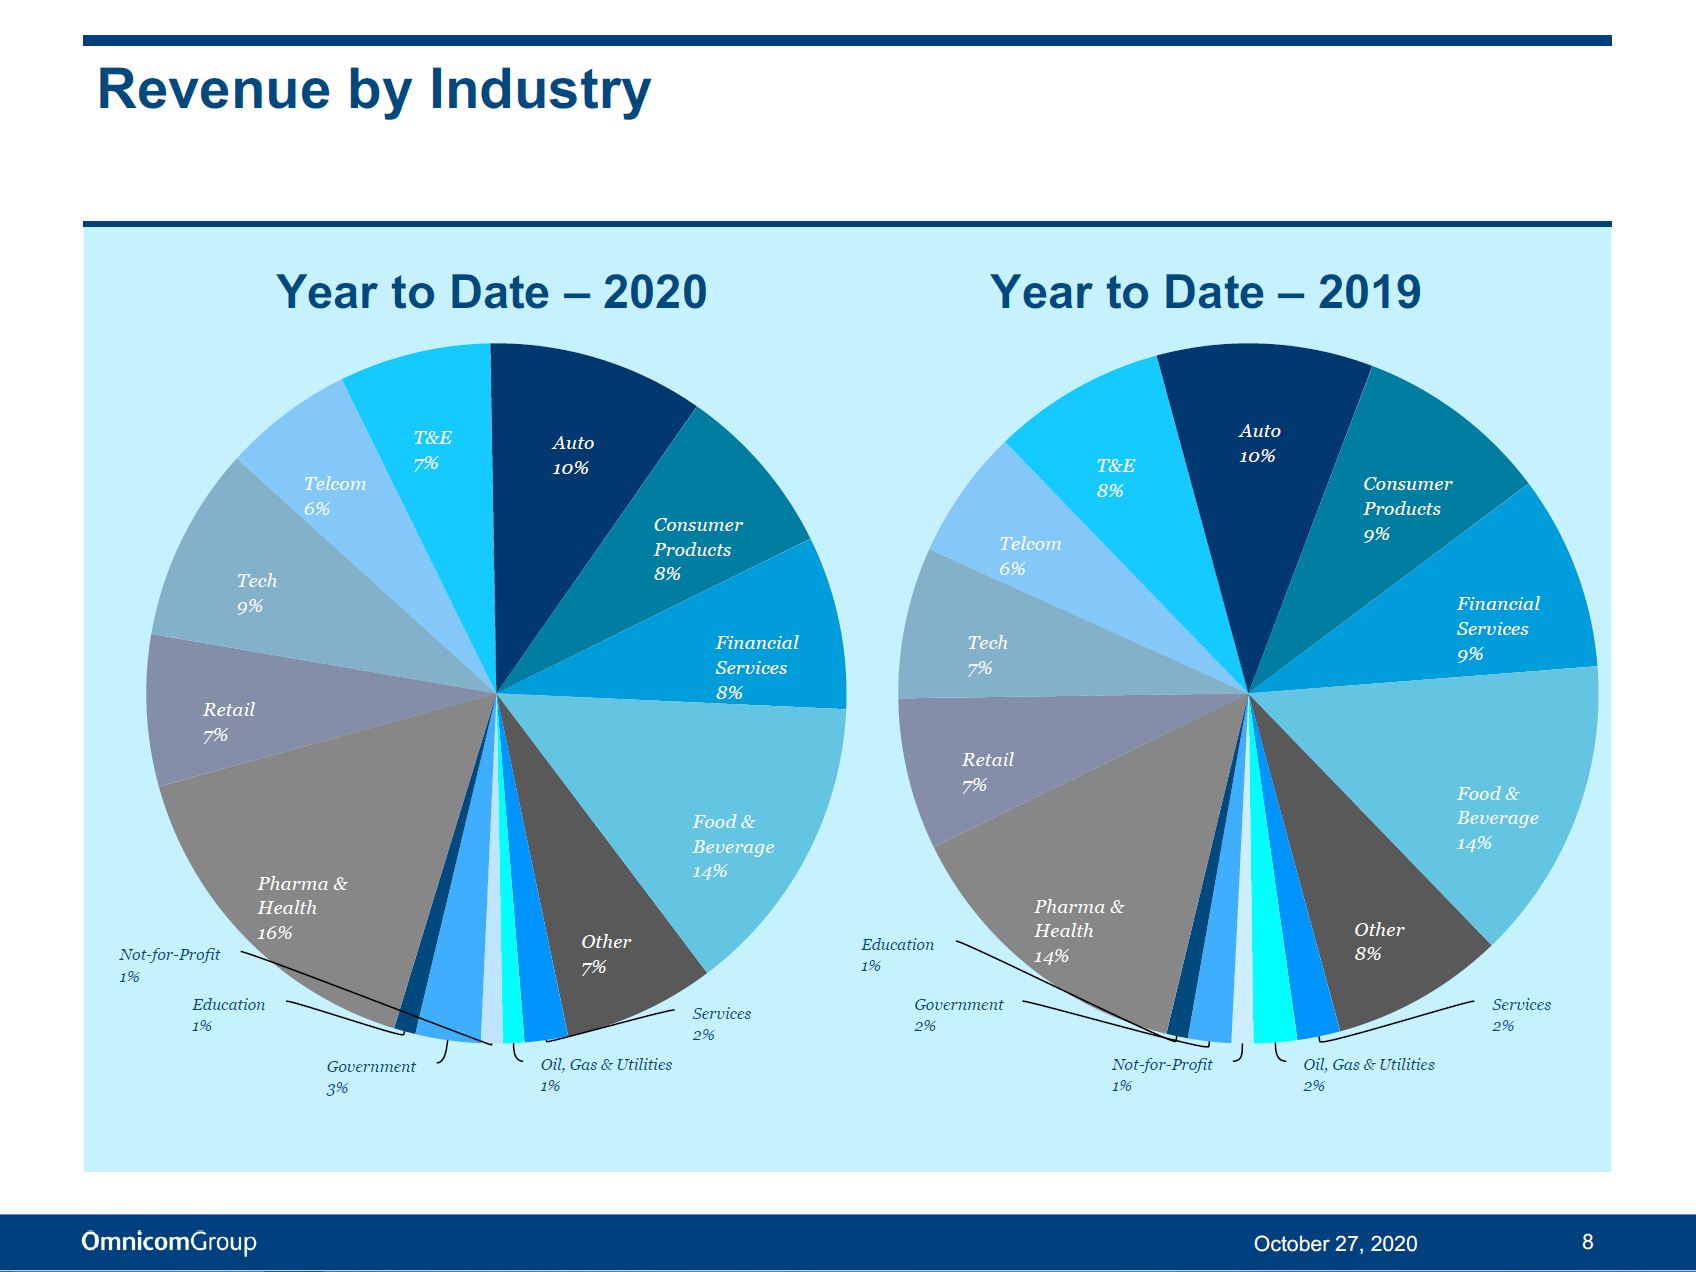
Ot her 7% Se rvices 2% Oil, Gas & Utilities 1% Government 3% Not - for - Profit 1% Education 1% Pharma & Health 16% Re tail 7% Tech 9% Te lcom 6% T&E 7% Au to 10% Co nsumer Products 8% Fi nancial Services 8% Food & Be verage 14% Revenue by Industry Year to Date – 2020 Ot her 8% 8 October 27, 2020 Se rvices 2% Oil, Gas & Utilities 2% Not - for - Profit 1% Government 2% Education 1% Pharma & Health 14% Re tail 7% Tech 7% Te lcom 6% T&E 8% Au to 10% Co nsumer Products 9% Fi nancial Services 9% Food & Be verage 14% Year to Date – 2019
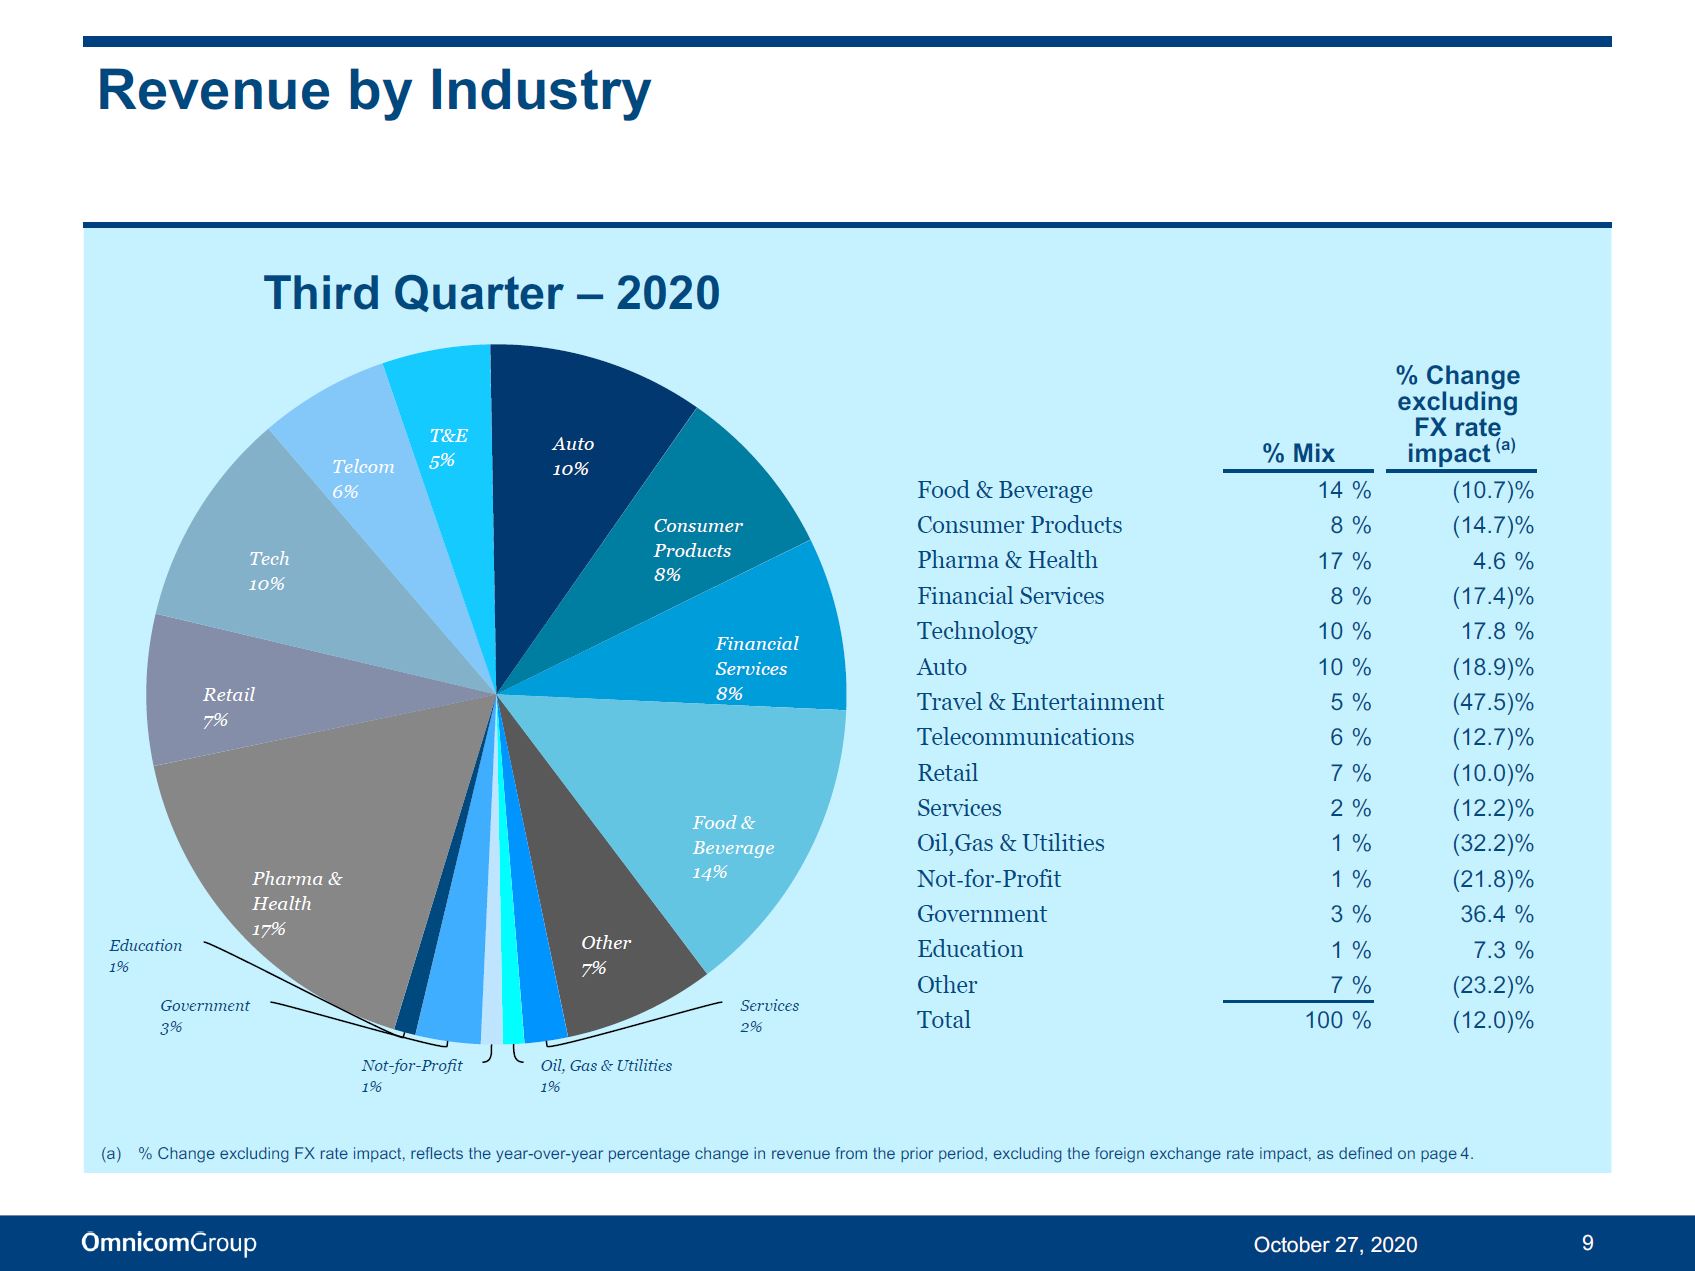
Ot her 7% 9 October 27, 2020 Se rvices 2% Oil, Gas & Utilities 1% Not - for - Profit 1% Government 3% Education 1% Pharma & Health 17% Re tail 7% Tech 10% Te lcom 6% T&E 5% Au to 10% Co nsumer Products 8% Fi nancial Services 8% Food & Be verage 14% Revenue by Industry Third Quarter – 2020 % Mix % Change excluding FX rate impact (a) Food & Beverage 14 % ( 10.7 )% Consumer Products 8 % ( 14.7 )% Pharma & Health 17 % 4.6 % Financial Services 8 % ( 17.4 )% Technology 10 % 17.8 % Auto 10 % ( 18.9 )% Travel & Entertainment 5 % ( 47.5 )% Telecommunications 6 % ( 12.7 )% Retail 7 % ( 10.0 )% Services 2 % ( 12.2 )% Oil,Gas & Utilities 1 % ( 32.2 )% Not - for - Profit 1 % ( 21.8 )% Government 3 % 36.4 % Education 1 % 7.3 % Other 7 % ( 23.2 )% Total 100 % ( 12.0 )% (a) % Change excluding FX rate impact, reflects the year - over - year percentage change in revenue from the prior period, excluding the foreign exchange rate impact, as defined on page 4.
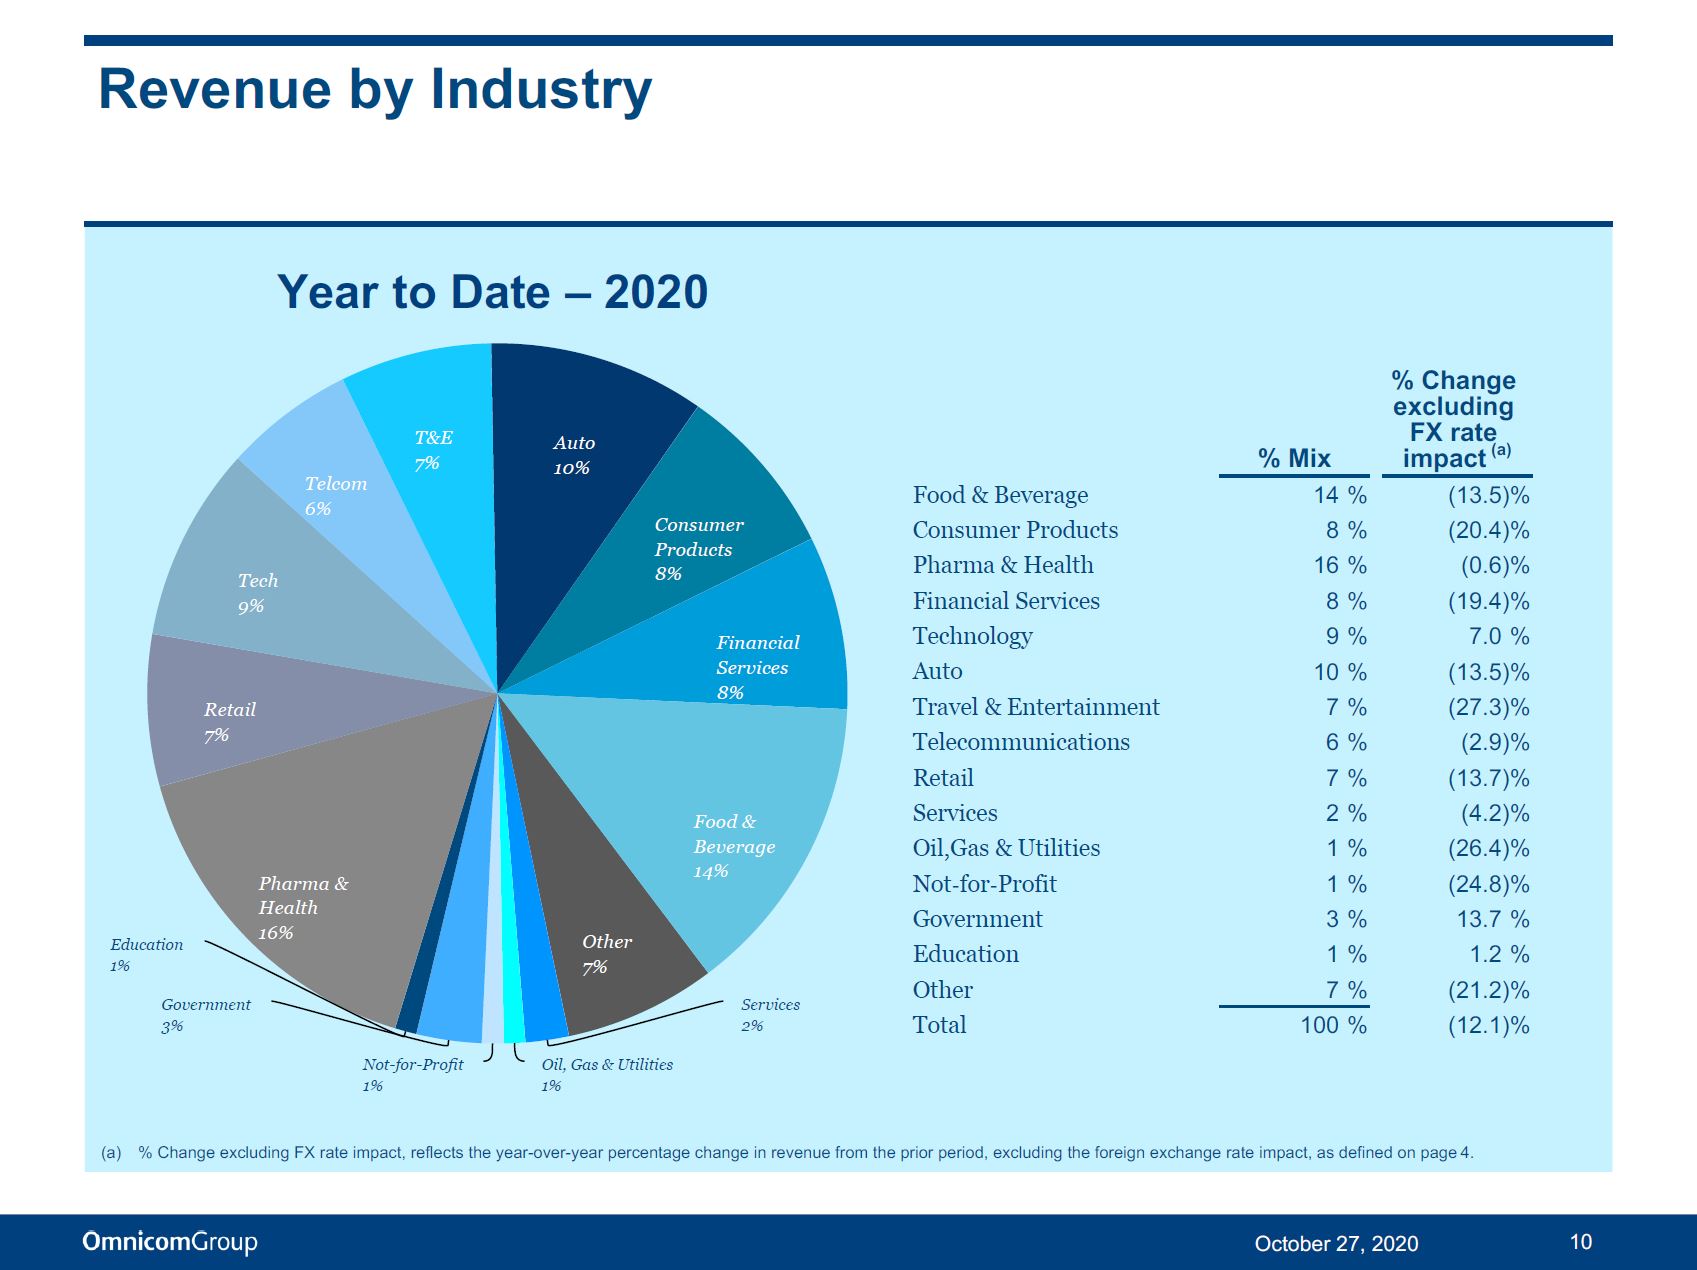
Revenue by Industry Year to Date – 2020 Ot her 7% 10 October 27, 2020 Se rvices 2% Oil, Gas & Utilities 1% Not - for - Profit 1% Government 3% Education 1% Pharma & Health 16% Re tail 7% Tech 9% Te lcom 6% T&E 7% Au to 10% Co nsumer Products 8% Fi nancial Services 8% Food & Be verage 14% % Mix % Change excluding FX rate impact (a) Food & Beverage 14 % ( 13.5 )% Consumer Products 8 % ( 20.4 )% Pharma & Health 16 % ( 0.6 )% Financial Services 8 % ( 19.4 )% Technology 9 % 7.0 % Auto 10 % ( 13.5 )% Travel & Entertainment 7 % ( 27.3 )% Telecommunications 6 % ( 2.9 )% Retail 7 % ( 13.7 )% Services 2 % ( 4.2 )% Oil,Gas & Utilities 1 % ( 26.4 )% Not - for - Profit 1 % ( 24.8 )% Government 3 % 13.7 % Education 1 % 1.2 % Other 7 % ( 21.2 )% Total 100 % ( 12.1 )% (a) % Change excluding FX rate impact, reflects the year - over - year percentage change in revenue from the prior period, excluding the foreign exchange rate impact, as defined on page 4.
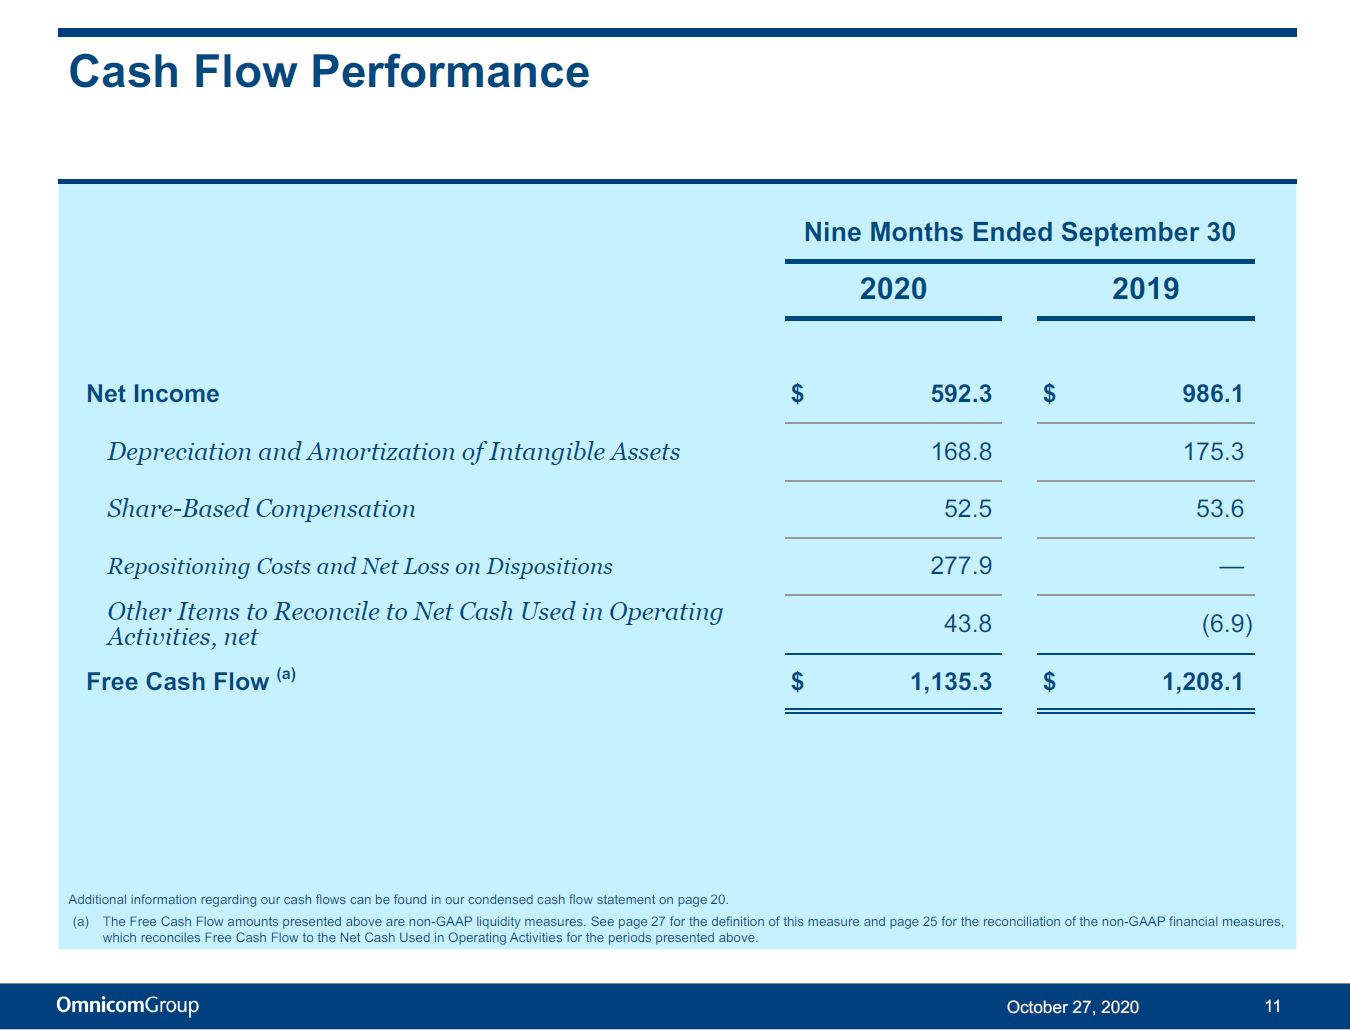
Cash Flow Performance Nine Months Ended September 30 2020 2019 Activities, net Net Income $ 592 .3 $ 986 .1 Depreciation and Amortization of Intangible Assets 168 .8 175 .3 Share - Based Compensation 52 .5 53 .6 Repositioning Costs and Net Loss on Dispositions 277 .9 — Other Items to Reconcile to Net Cash Used in Operating 43 .8 ( 6 . 9 ) Free Cash Flow (a) $ 1 , 135 .3 $ 1 , 208 .1 11 October 27, 2020 Additional information regarding our cash flows can be found in our condensed cash flow statement on page 20. (a) The Free Cash Flow amounts presented above are non - GAAP liquidity measures. See page 27 for the definition of this measure a nd page 25 for the reconciliation of the non - GAAP financial measures, which reconciles Free Cash Flow to the Net Cash Used in Operating Activities for the periods presented above.
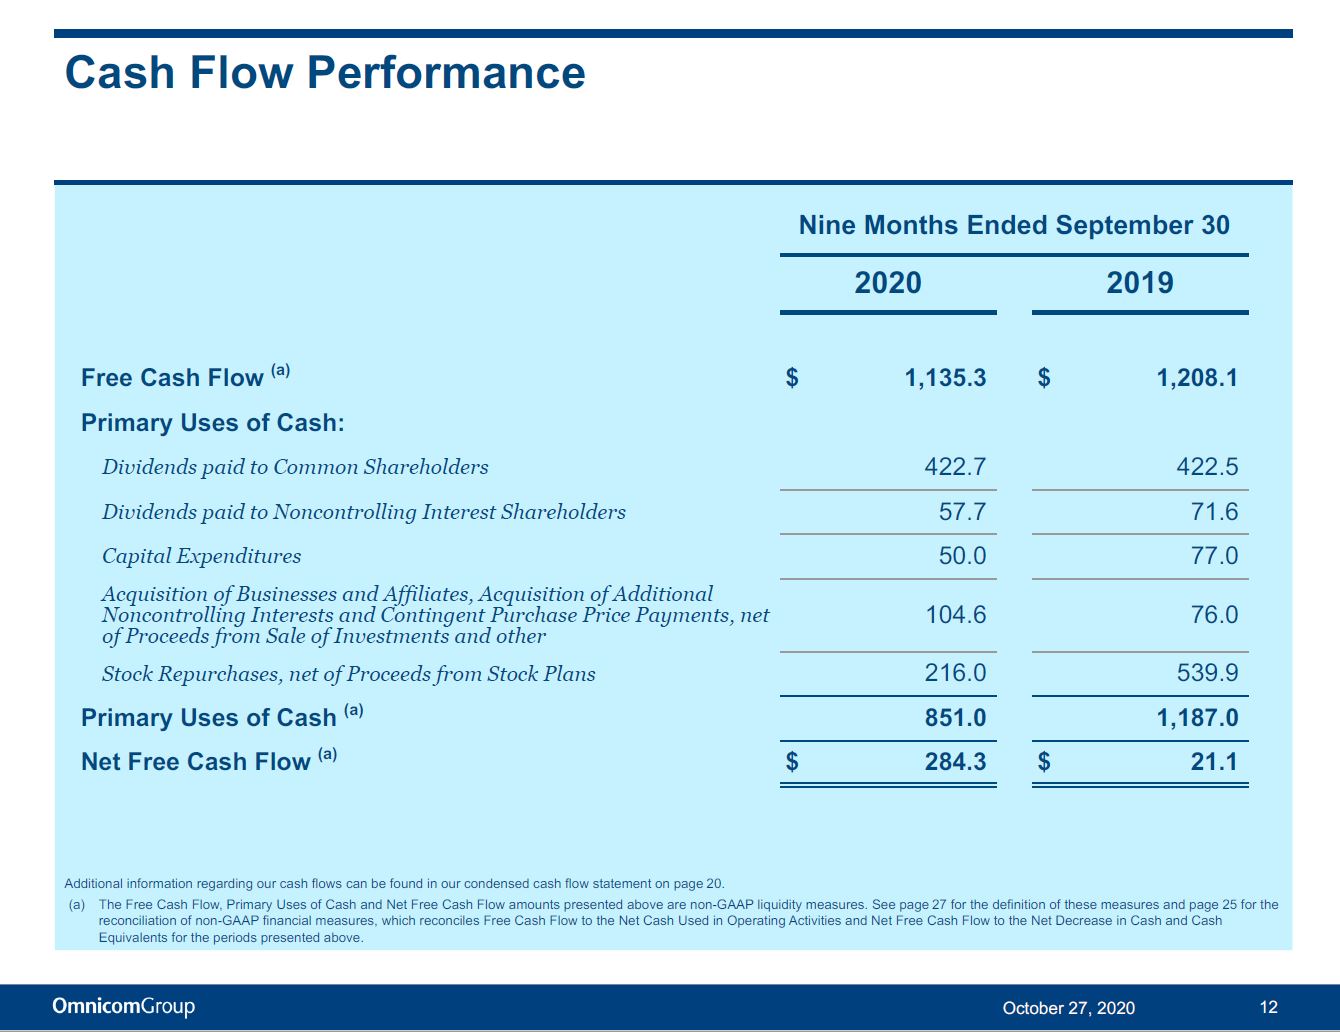
Cash Flow Performance Nine Months Ended September 30 202 0 2019 Free Cash Flow (a) $ 1 , 135 .3 $ 1 , 208 .1 Primary Uses of Cash: Dividends paid to Common Shareholders 422 .7 422 .5 Dividends paid to Noncontrolling Interest Shareholders 57 .7 71 .6 Capital Expenditures 50 .0 77 .0 Acquisition of Businesses and Affiliates, Acquisition of Additional Noncontrolling Interests and Contingent Purchase Price Payments, net of Proceeds from Sale of Investments and other 104 .6 76 .0 Stock Repurchases, net of Proceeds from Stock Plans 216 .0 539 .9 Primary Uses of Cash (a) 851 .0 1 , 187 .0 Net Free Cash Flow (a) $ 284 .3 $ 21 .1 12 October 27, 2020 Additional information regarding our cash flows can be found in our condensed cash flow statement on page 20. (a) The Free Cash Flow, Primary Uses of Cash and Net Free Cash Flow amounts presented above are non - GAAP liquidity measures. See page 27 for the definit ion of these measures and page 25 for the reconciliation of non - GAAP financial measures, which reconciles Free Cash Flow to the Net Cash Used in Operating Activities and Net Free Cash Flow to the Net Decrease in Cash and Cash Equivalents for the periods presented above.
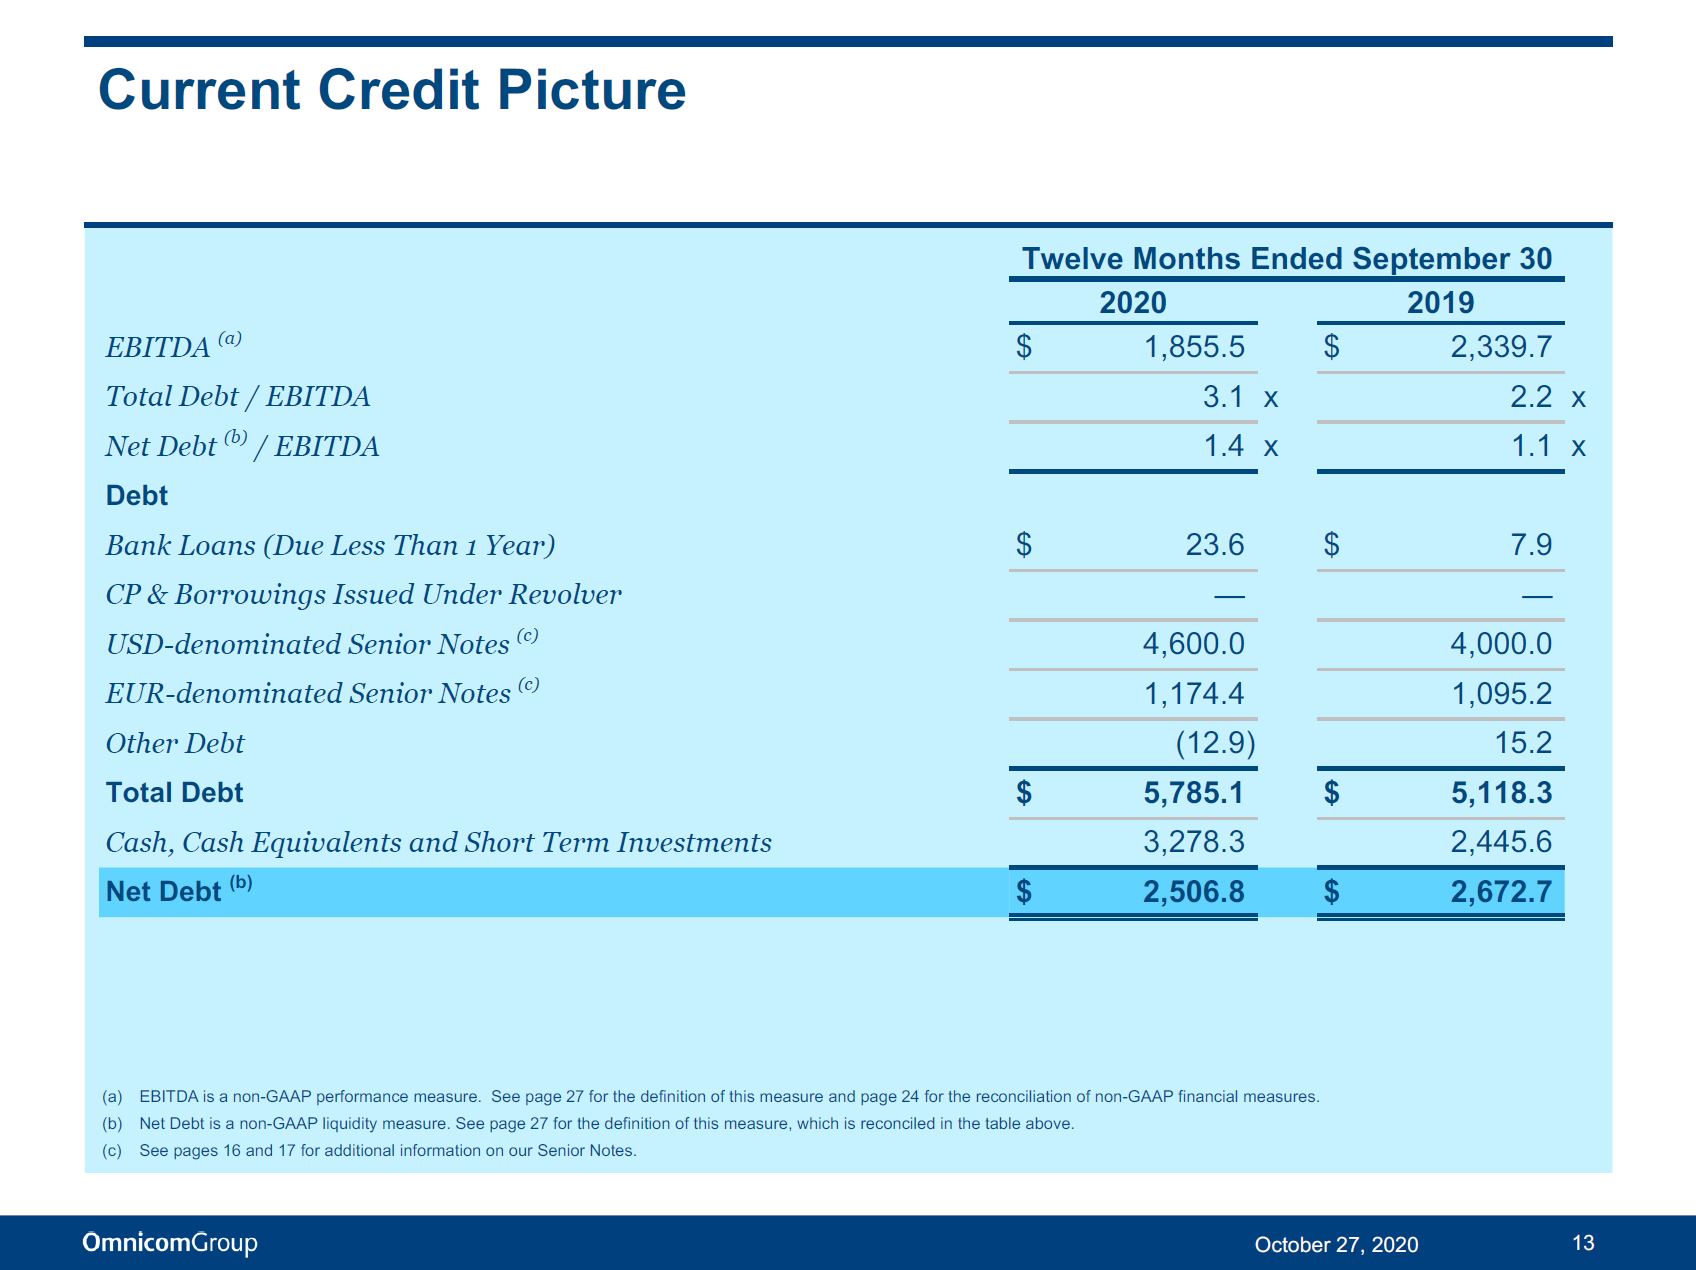
Current Credit Picture 13 October 27, 2020 Twelve Months Ended September 30 2020 2019 EBITDA (a) $ 1,855.5 $ 2 , 339 .7 Total Debt / EBITDA 3 .1 x 2 .2 x Net Debt (b) / EBITDA 1 .4 x 1 .1 x Debt Bank Loans (Due Less Than 1 Year) $ 23.6 $ 7 .9 CP & Borrowings Issued Under Revolver — — USD - denominated Senior Notes (c) 4 , 600 .0 4 , 000 .0 EUR - denominated Senior Notes (c) 1 , 174 .4 1 , 095 .2 Other Debt ( 12 . 9 ) 15 .2 Total Debt $ 5,785.1 $ 5 , 118 .3 Cash, Cash Equivalents and Short Term Investments 3 , 278 .3 2 , 445 .6 Net Debt (b) $ 2,506.8 $ 2 , 672 .7 (a) EBITDA is a non - GAAP performance measure. See page 27 for the definition of this measure and page 24 for the reconciliation of non - GAAP fina ncial measures. (b) Net Debt is a non - GAAP liquidity measure. See page 27 for the definition of this measure, which is reconciled in the table above. (c) See pages 16 and 17 for additional information on our Senior Notes.
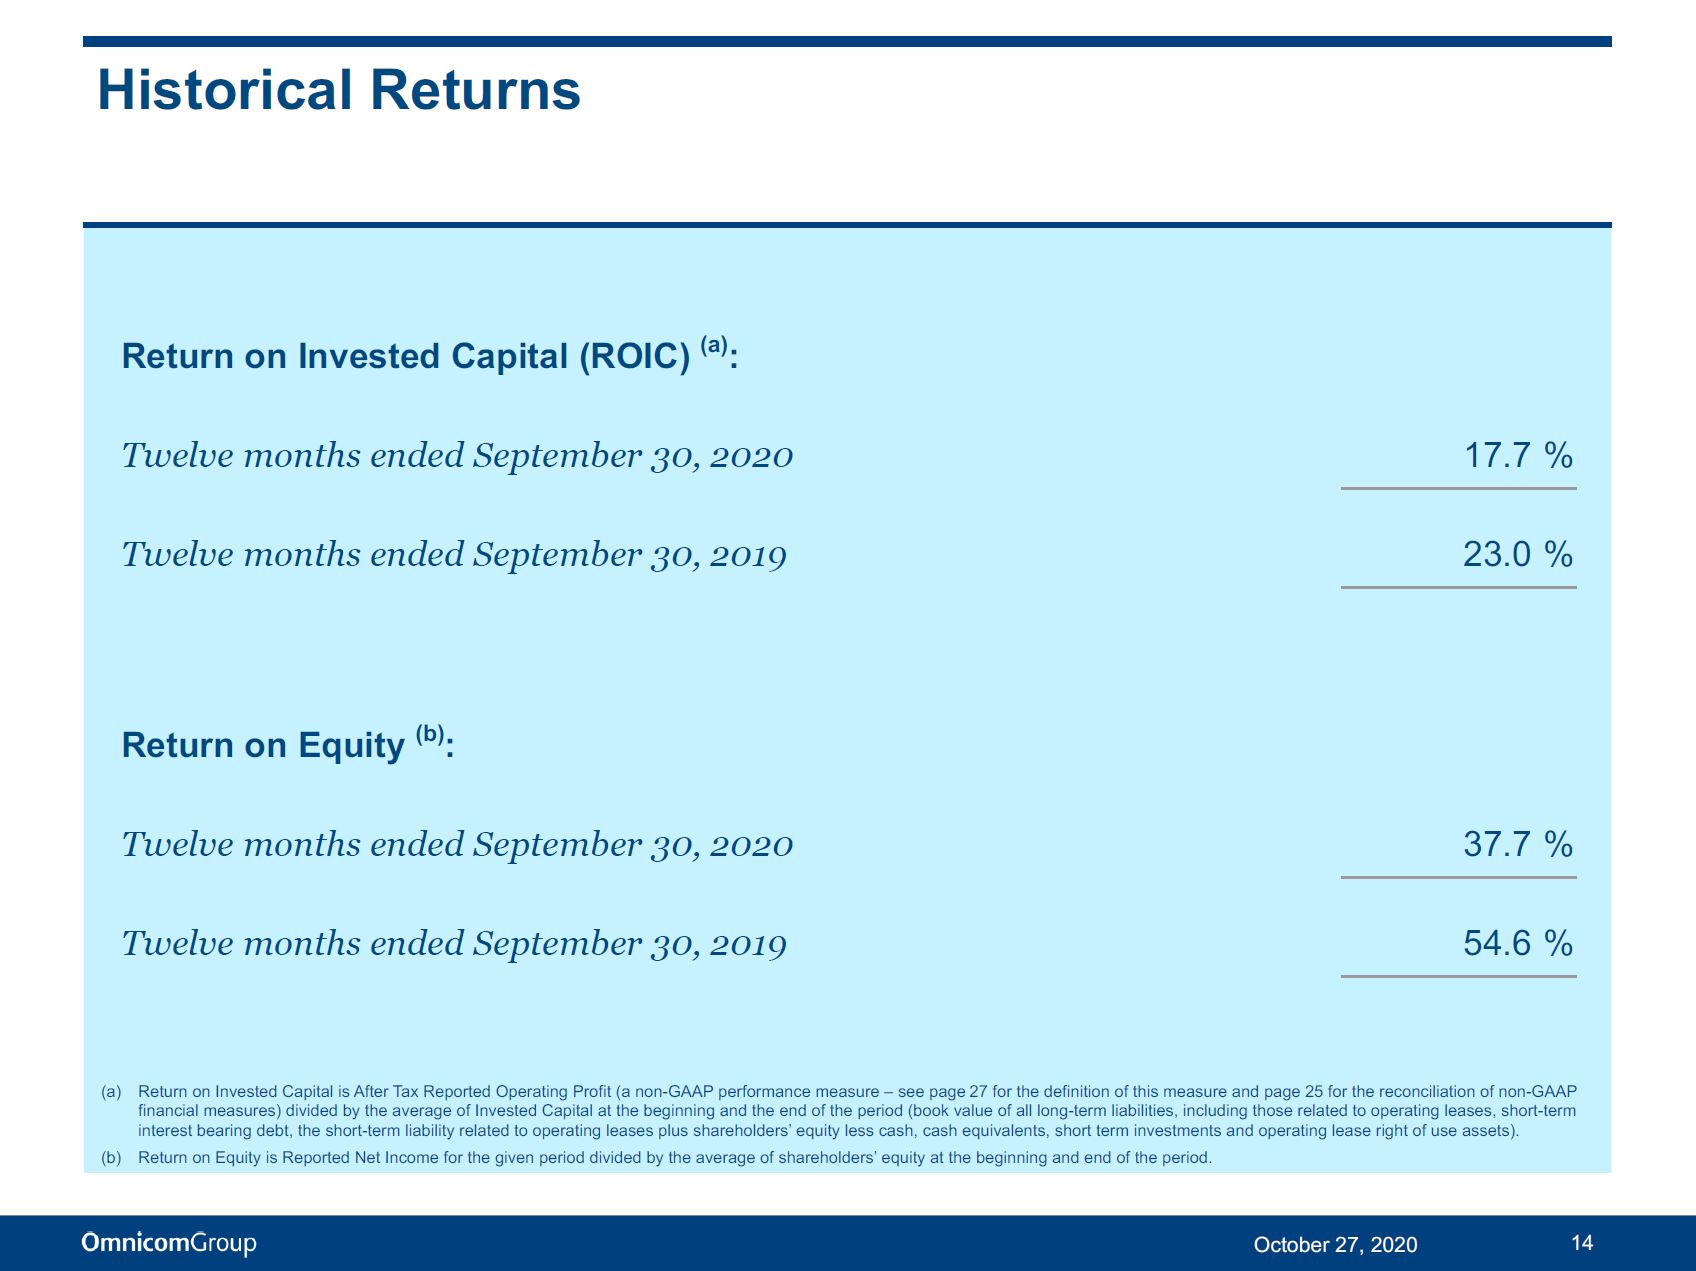
Historical Returns Return on Invested Capital (ROIC) (a) : Twelve months ended September 30, 2020 17.7 % Twelve months ended September 30, 2019 23.0 % Return on Equity (b) : Twelve months ended September 30, 2020 37.7 % Twelve months ended September 30, 2019 54.6 % (a) Return on Invested Capital is After Tax Reported Operating Profit (a non - GAAP performance measure – see page 27 for the definition of this measure and page 25 for the reconciliation of non - GAAP financial measures) divided by the average of Invested Capital at the beginning and the end of the period (book value of all long - term liabilities, including those related to operating leases, short - term interest bearing debt, the short - term liability related to operating leases plus shareholders’ equity less cash, cash equivalents, short term investments and operating lease right of use assets) . (b) Return on Equity is Reported Net Income for the given period divided by the average of shareholders’ equity at the beginning and end of the period . 14 October 27, 2020
Supplemental Financial Information 15 October 27, 2020

Omnicom Debt Structure 16 October 27, 2020 Short - term Debt $24 2030 Senior Notes $600 2030 Senior Notes $600 2026 Senior Notes $1,400 2024 Senior Notes $750 2022 Senior Notes $1,250 2027 Euro Senior Notes $587 2031 Euro Senior Notes $587 The above chart sets forth Omnicom’s debt outstanding at September 30, 2020. The amounts reflected above for the 2022, 2024, 202 6 and 2030 Senior Notes and the 2027 and 2031 Euro Senior Notes represent the principal amount of these notes at maturity on May 1, 2022, November 1, 2024, April 15, 2026, April 15 and Augu st 15, 2030, July 8, 2027 and July 8, 2031, respectively.
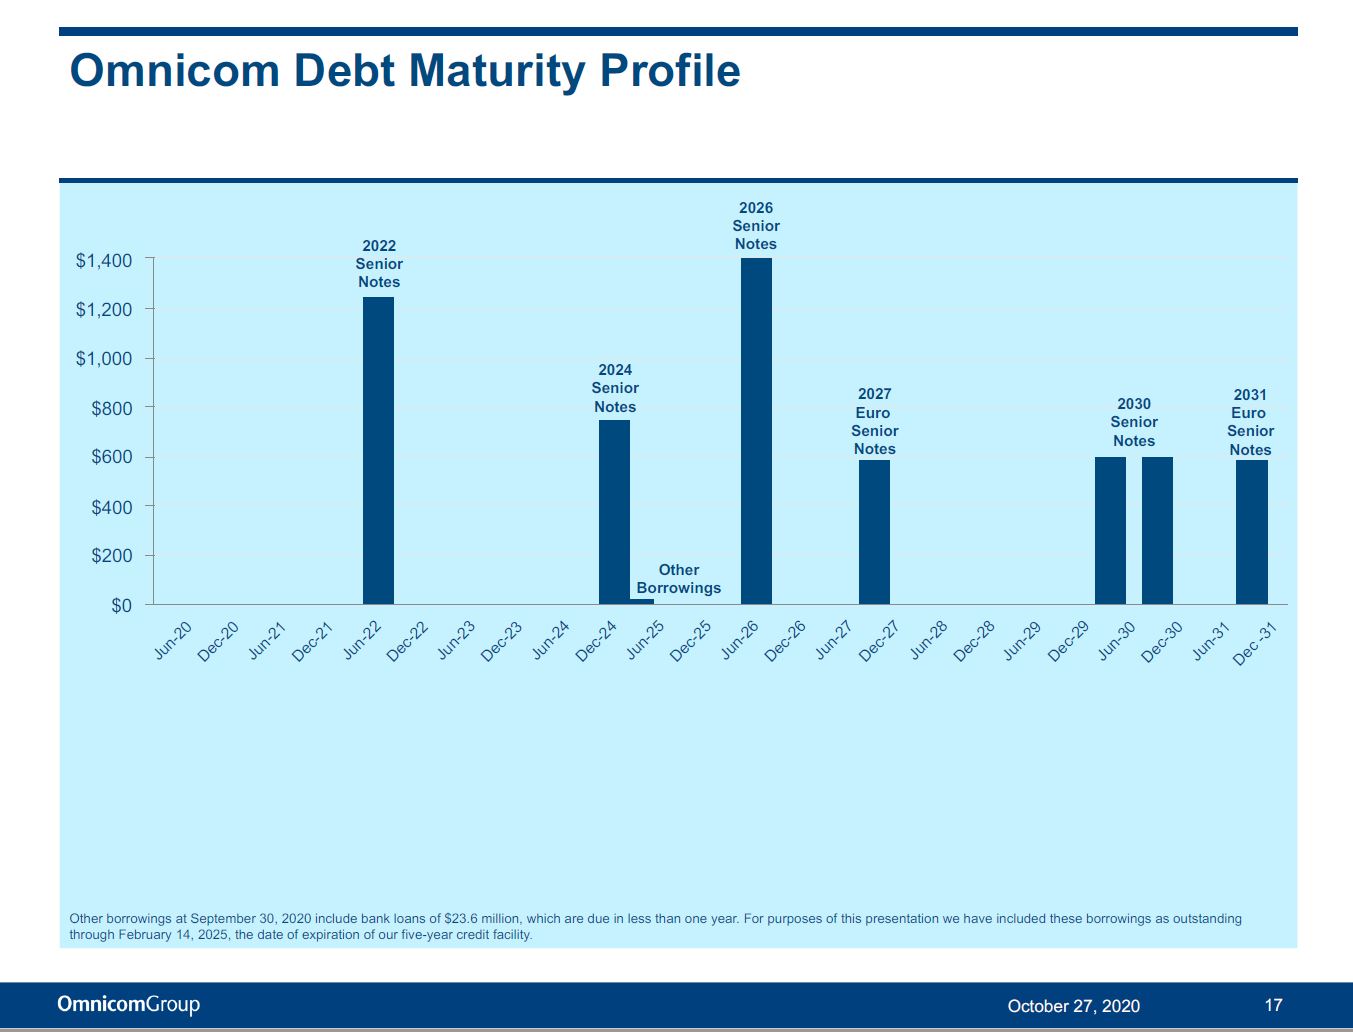
Omnicom Debt Maturity Profile 17 October 27, 2020 $1 ,400 $1 ,200 $1 ,000 $800 $600 $400 $200 $0 202 2 2026 S e nior Notes Other borrowings at September 30, 2020 include bank loans of $23.6 million, which are due in less than one year. For purposes of this presentation we have included these borrowings as outstanding through February 14, 2025, the date of expiration of our five - year credit facility . Senior Notes 2024 S e nior Notes 2027 2030 2031 Euro S e nior Notes S e nior Notes Euro S e nior Notes Other B o rr owings
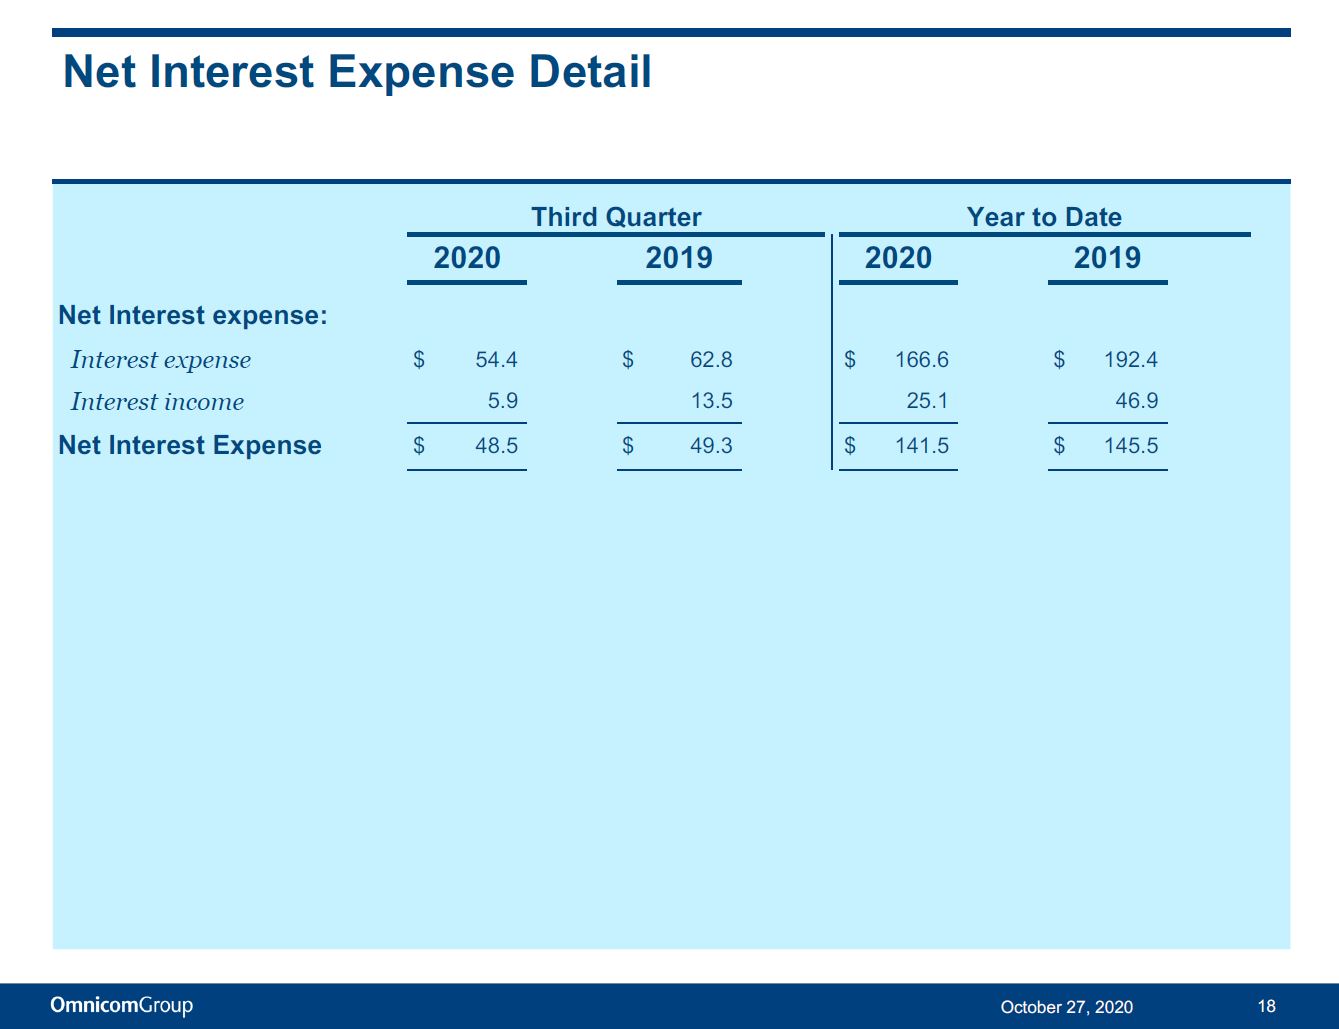
Net Interest Expense Detail Third Quarter Year to Date 2020 2019 2020 2019 Net Interest expense: Interest expense $ 54 .4 $ 62 .8 $ 166 .6 $ 192 .4 Interest income 5 .9 13 .5 25 .1 46 .9 Net Interest Expense $ 48 .5 $ 49 .3 $ 141 .5 $ 145 .5 18 October 27, 2020
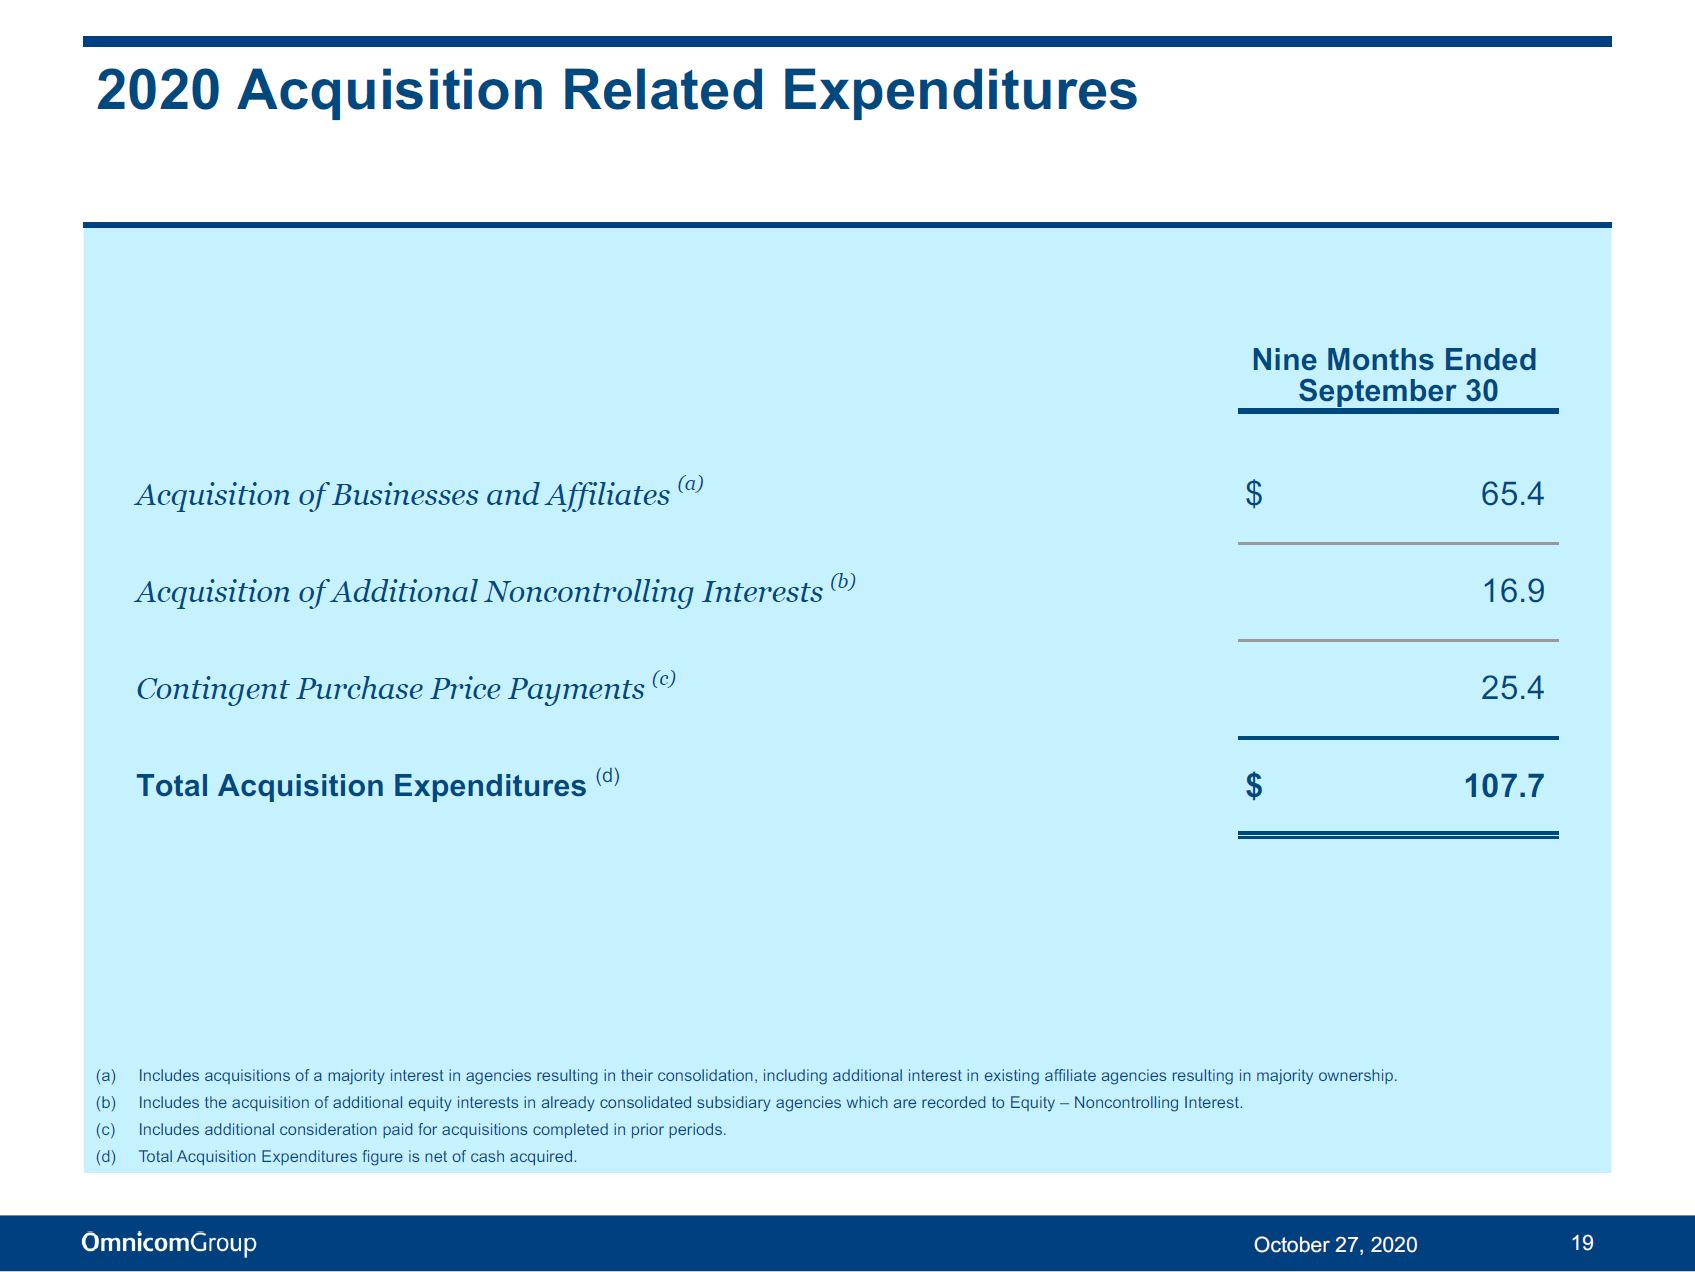
2020 Acquisition Related Expenditures Nine Months Ended September 30 Acquisition of Businesses and Affiliates (a) $ 65 .4 Acquisition of Additional Noncontrolling Interests (b) 16 .9 Contingent Purchase Price Payments (c) 25 .4 Total Acquisition Expenditures (d) $ 107 .7 19 October 27, 2020 (a) Includes acquisitions of a majority interest in agencies resulting in their consolidation, including additional interest in existing affiliate agencies resulting in majority ownership. (b) Includes the acquisition of additional equity interests in already consolidated subsidiary agencies which are recorded to Equity – Noncontrolling Interest. (c) Includes additional consideration paid for acquisitions completed in prior periods. (d) Total Acquisition Expenditures figure is net of cash acquired.
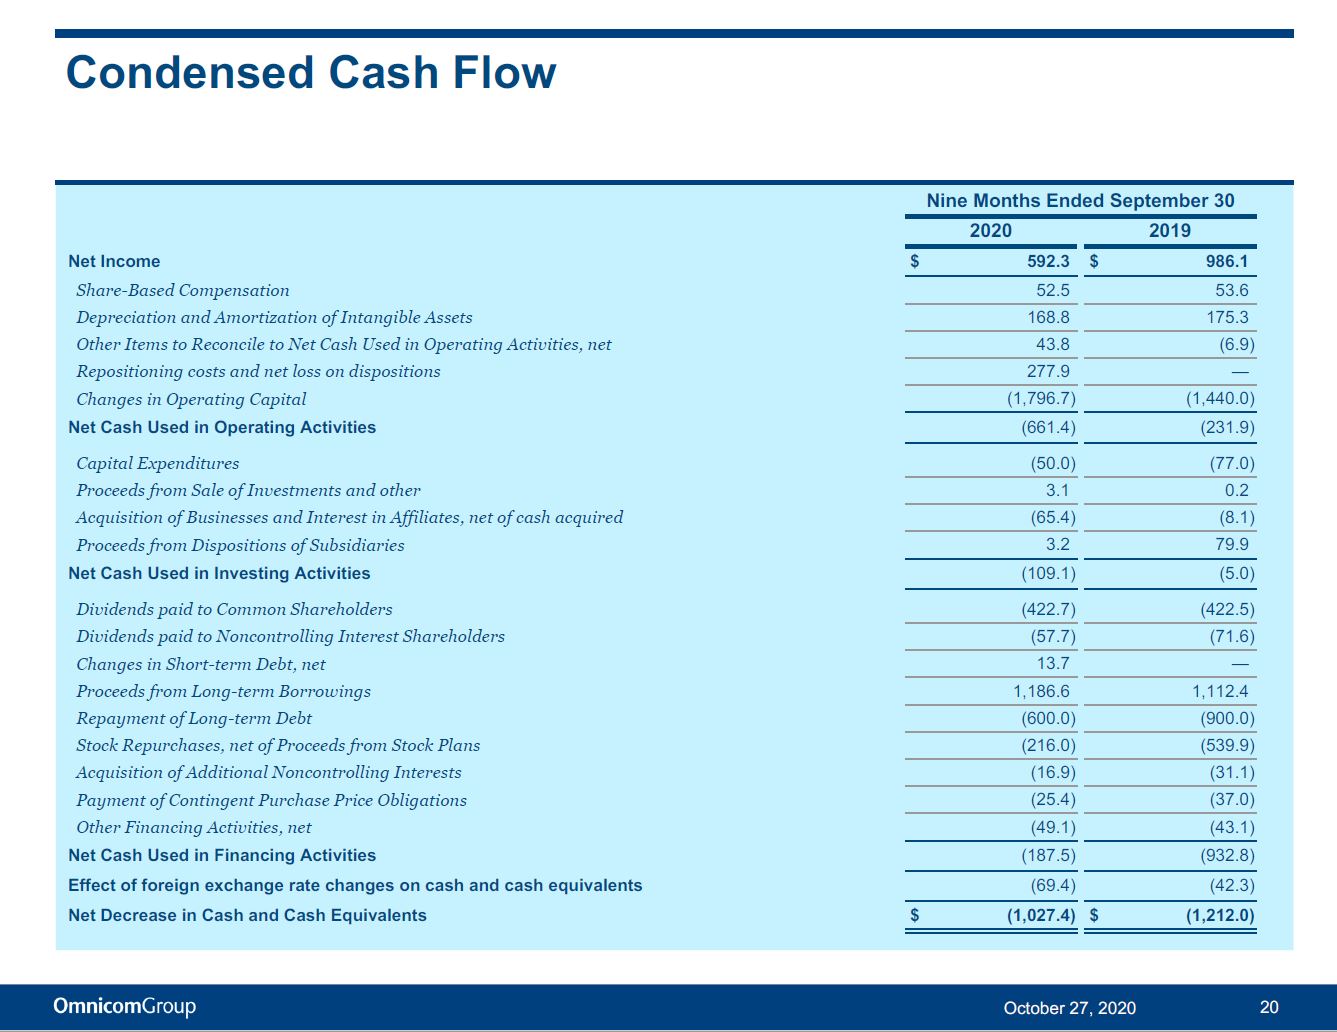
Condensed Cash Flow 20 October 27, 2020 Nine Months Ended September 30 2020 2019 Net Income $ 592.3 $ 986.1 Share - Based Compensation 52 .5 53 .6 Depreciation and Amortization of Intangible Assets 168 .8 175 .3 Other Items to Reconcile to Net Cash Used in Operating Activities, net 43 .8 ( 6 . 9 ) Repositioning costs and net loss on dispositions 277 .9 — Changes in Operating Capital (1,796.7) ( 1 , 440 . 0 ) Net Cash Used in Operating Activities (661.4) ( 231 . 9 ) Capital Expenditures ( 50 . 0 ) ( 77 . 0 ) Proceeds from Sale of Investments and other 3 .1 0 .2 Acquisition of Businesses and Interest in Affiliates, net of cash acquired ( 65 . 4 ) ( 8 . 1 ) Proceeds from Dispositions of Subsidiaries 3 .2 79 .9 Net Cash Used in Investing Activities (109.1) ( 5 . 0 ) Dividends paid to Common Shareholders (422.7) ( 422 . 5 ) Dividends paid to Noncontrolling Interest Shareholders ( 57 . 7 ) ( 71 . 6 ) Changes in Short - term Debt, net 13 .7 — Proceeds from Long - term Borrowings 1,186.6 1,112.4 Repayment of Long - term Debt (600.0) ( 900 . 0 ) Stock Repurchases, net of Proceeds from Stock Plans (216.0) ( 539 . 9 ) Acquisition of Additional Noncontrolling Interests ( 16 . 9 ) ( 31 . 1 ) Payment of Contingent Purchase Price Obligations ( 25 . 4 ) ( 37 . 0 ) Other Financing Activities, net ( 49 . 1 ) ( 43 . 1 ) Net Cash Used in Financing Activities (187.5) ( 932 . 8 ) Effect of foreign exchange rate changes on cash and cash equivalents ( 69 . 4 ) ( 42 . 3 ) Net Decrease in Cash and Cash Equivalents $ (1,027.4) $ ( 1 , 212 . 0 )
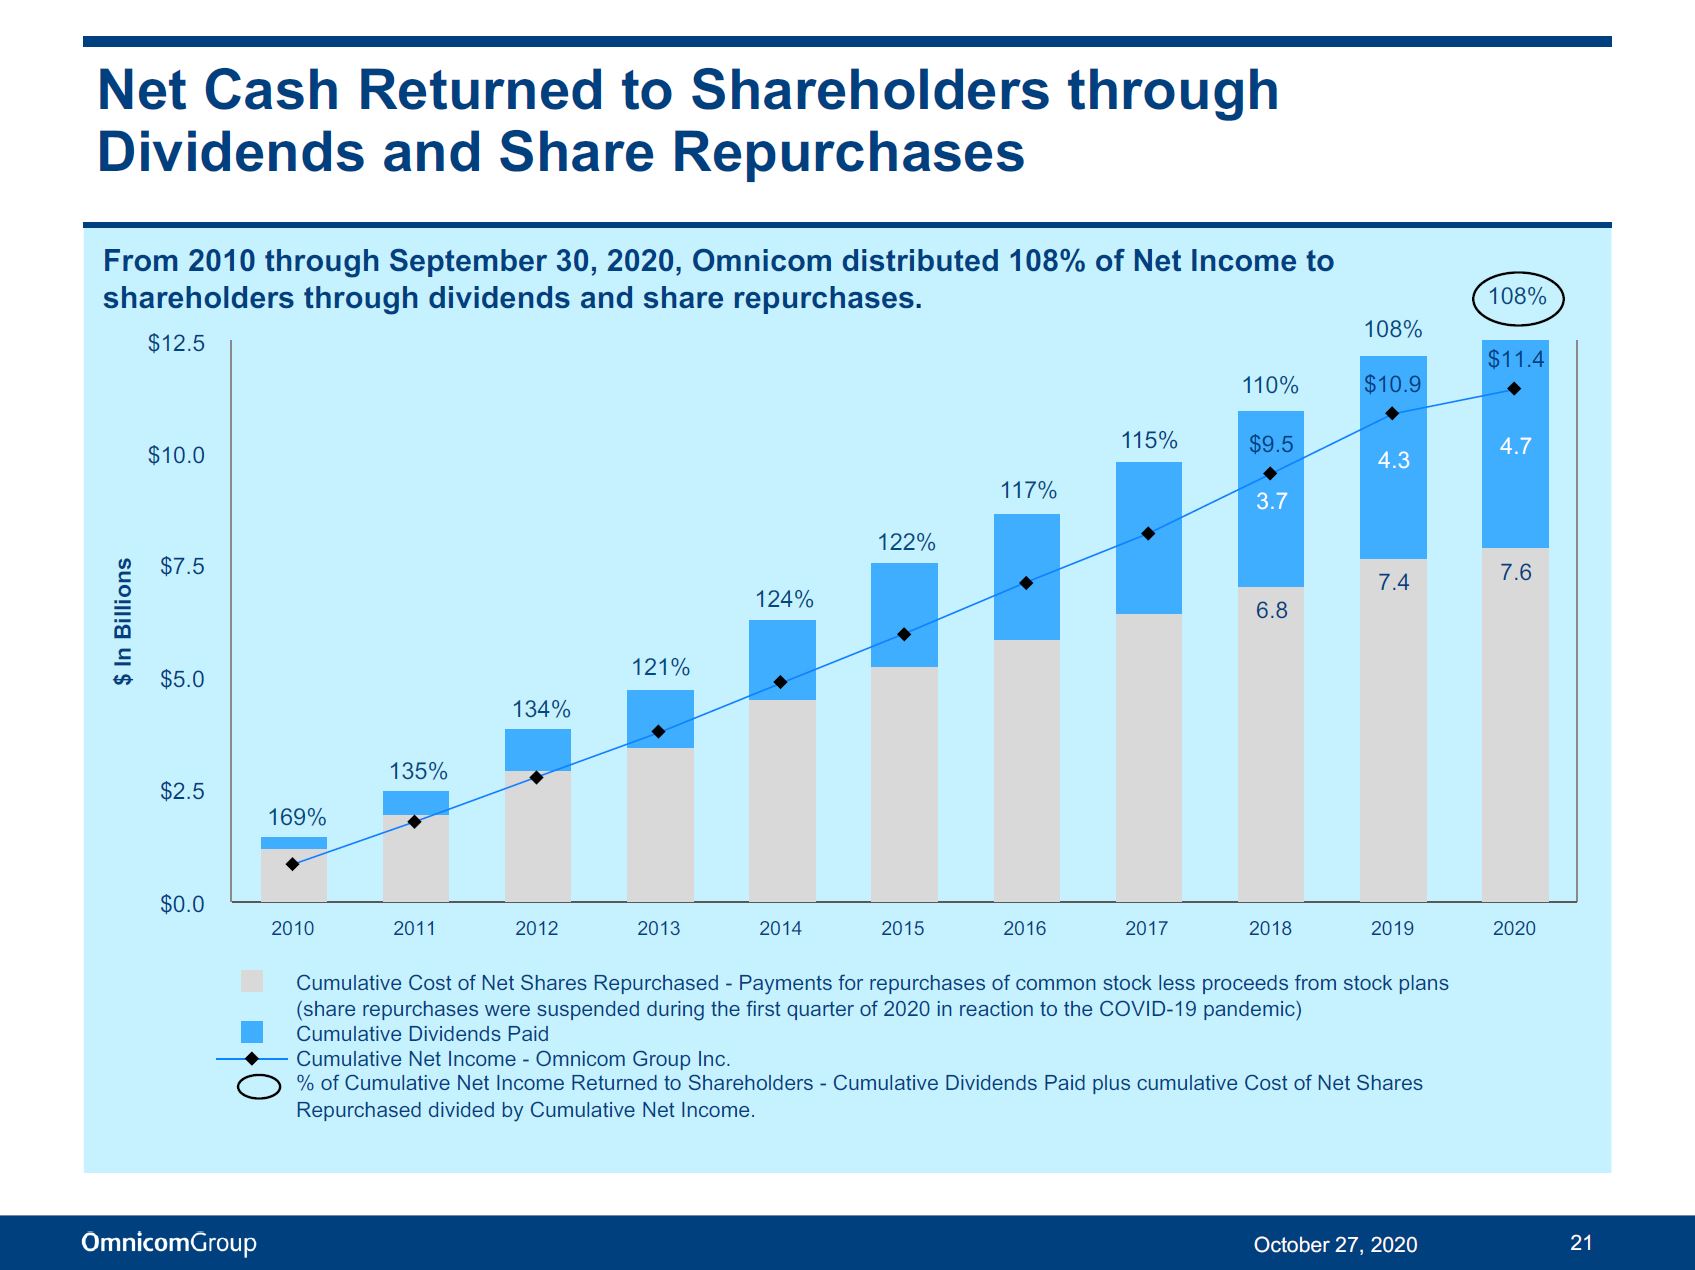
$ In Billions 6. 8 7. 4 7. 6 4. 3 4. 7 $9.5 3.7 $10.9 $11.4 2010 2011 2012 2013 2014 2015 2016 2017 2018 2019 Cumulative Cost of Net Shares Repurchased - Payments for repurchases of common stock less proceeds from stock plans (share repurchases were suspended during the first quarter of 2020 in reaction to the COVID - 19 pandemic) Cumulative Dividends Paid Cumulative Net Income - Omnicom Group Inc. % of Cumulative Net Income Returned to Shareholders - Cumulative Dividends Paid plus cumulative Cost of Net Shares Repurchased divided by Cumulative Net Income. 2020 $5 .0 $7 .5 $10.0 $12.5 Net Cash Returned to Shareholders through Dividends and Share Repurchases From 2010 through September 30, 2020, Omnicom distributed 108% of Net Income to shareholders through dividends and share repurchases . $2.5 169 % $0.0 21 October 27, 2020 121 % 124 % 122 % 1 17 % 1 15 % 1 10 % 108 % 134 % 135% 108 %
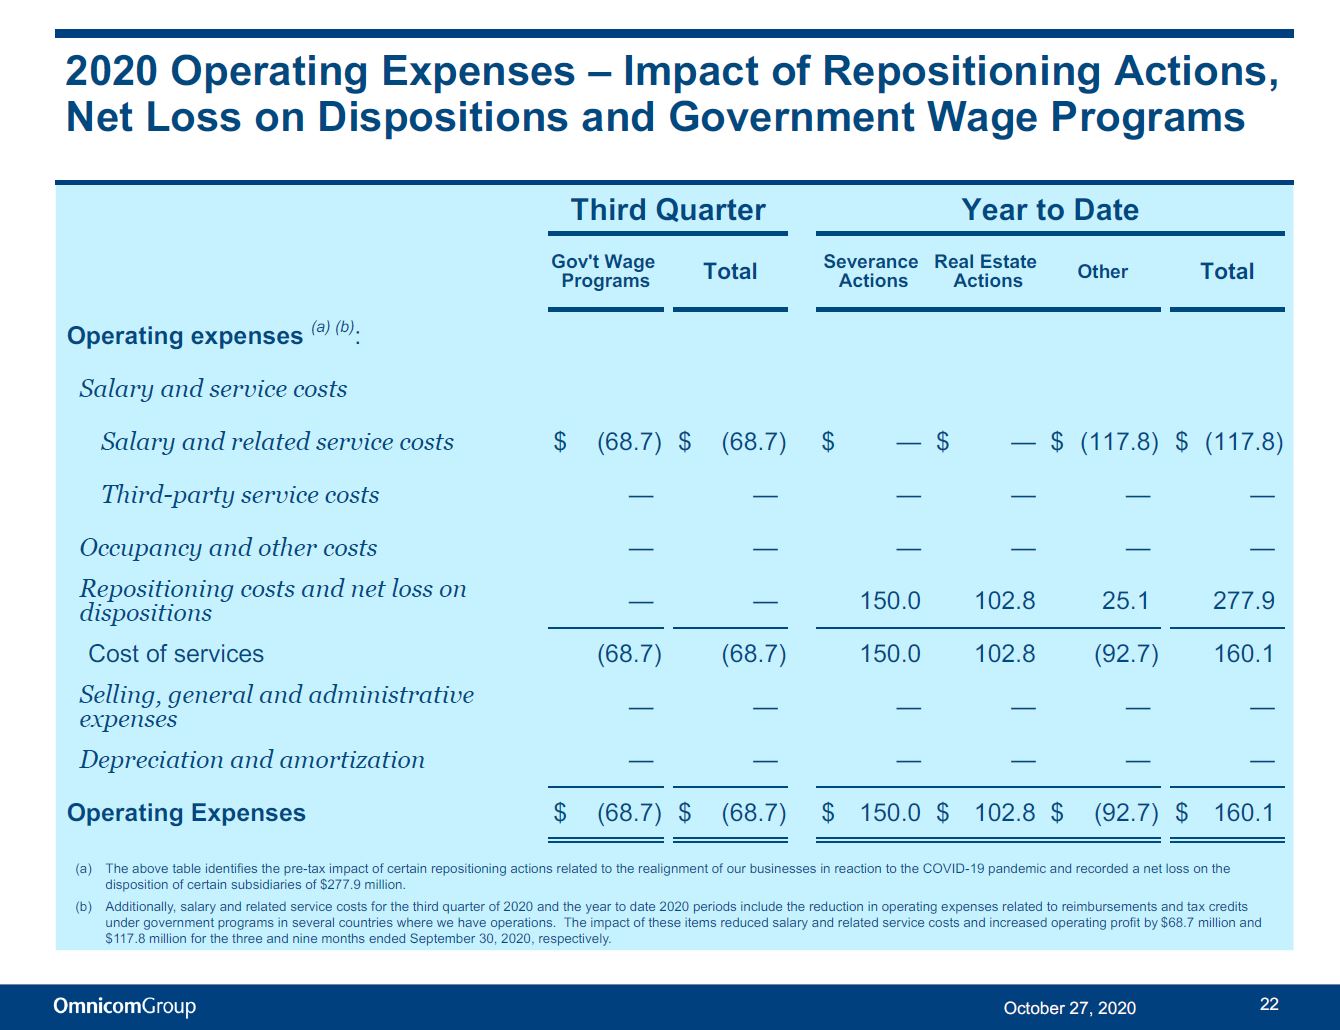
2020 Operating Expenses – Impact of Repositioning Actions, Net Loss on Dispositions and Government Wage Programs Third Quarter Year to Date Gov't Wage Programs Tot a l Severance Real Estate Actions Actions O t he r Tot a l Operating expenses (a) (b) : Salary and service costs Salary and related service costs $ ( 68 . 7 ) $ ( 68 . 7 ) $ — $ — $ (117.8) $ (117.8) Third - party service costs Occupancy and other costs Repositioning costs and net loss on dispositions Cost of services Selling, general and administrative expenses Depreciation and amortization Operating Expenses — — — — — — — — — — — — — — 150.0 102.8 25.1 277.9 ( 68 . 7 ) ( 68 . 7 ) 150 .0 102 .8 ( 92 . 7 ) 160 .1 — — — — — — — — — — — — $ ( 68 . 7 ) $ ( 68 . 7 ) $ 150 .0 $ 102 .8 $ ( 92 . 7 ) $ 160 .1 22 October 27, 2020 (a) The above table identifies the pre - tax impact of certain repositioning actions related to the realignment of our businesses in reaction to the COVID - 19 pandemic and recorded a net loss on the disposition of certain subsidiaries of $277.9 million. (b) Additionally, salary and related service costs for the third quarter of 2020 and the year to date 2020 periods include the reduction in operating expenses related to reimbursements and tax credits under government programs in several countries where we have operations. The impact of these items reduced salary and related service costs and increased operating profit by $68.7 million and $117.8 million for the three and nine months ended September 30, 2020, respectively.
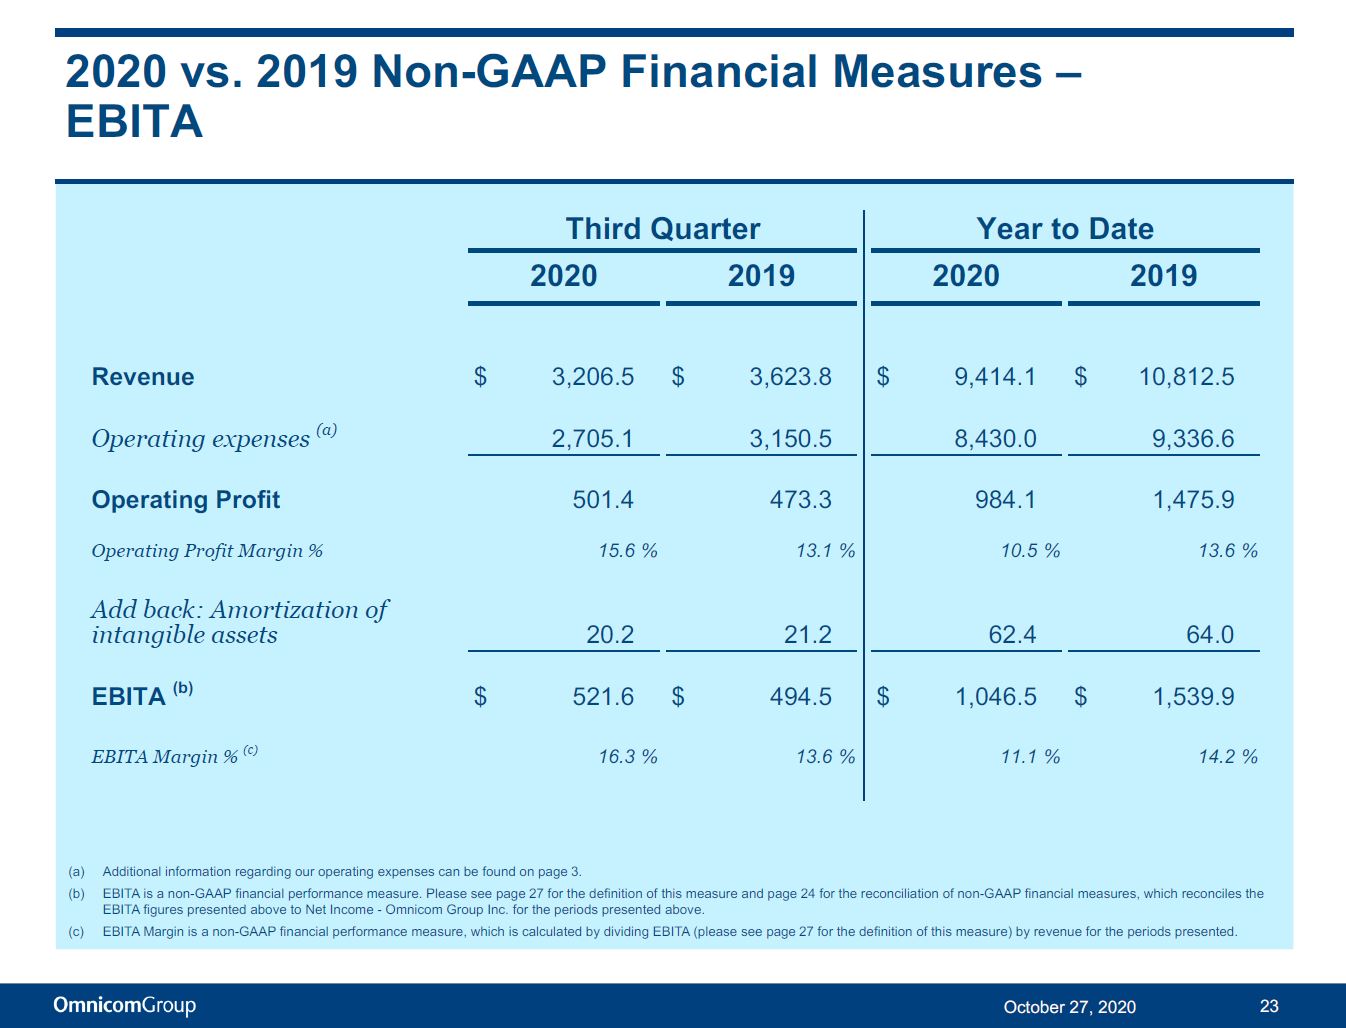
2020 vs. 2019 Non - GAAP Financial Measures – EBITA (a) Additional information regarding our operating expenses can be found on page 3. (b) EBITA is a non - GAAP financial performance measure. Please see page 27 for the definition of this measure and page 24 for the reconciliation of non - GAAP financial measures, which reconciles the EBITA figures presented above to Net Income - Omnicom Group Inc. for the periods presented above. (c) EBITA Margin is a non - GAAP financial performance measure, which is calculated by dividing EBITA (please see page 27 for the definition of this measure) by revenue for the periods presented. Third Quarter Year to Date 202 0 2019 2020 2019 Revenue $ 3,206.5 $ 3,623.8 $ 9,414.1 $ 10,812.5 Operating expenses (a) 2,705.1 3,150.5 8,430.0 9,336.6 Operating Profit 501.4 473.3 984.1 1,475.9 Operating Profit Margin % 15.6 % 13.1 % 10.5 % 13.6 % Add back: Amortization of intangible assets 20.2 21.2 62.4 64.0 EBITA (b) $ 521.6 $ 494.5 $ 1,046.5 $ 1,539.9 EBITA Margin % (c) 16.3 % 13.6 % 11.1 % 14.2 % 23 October 27, 2020
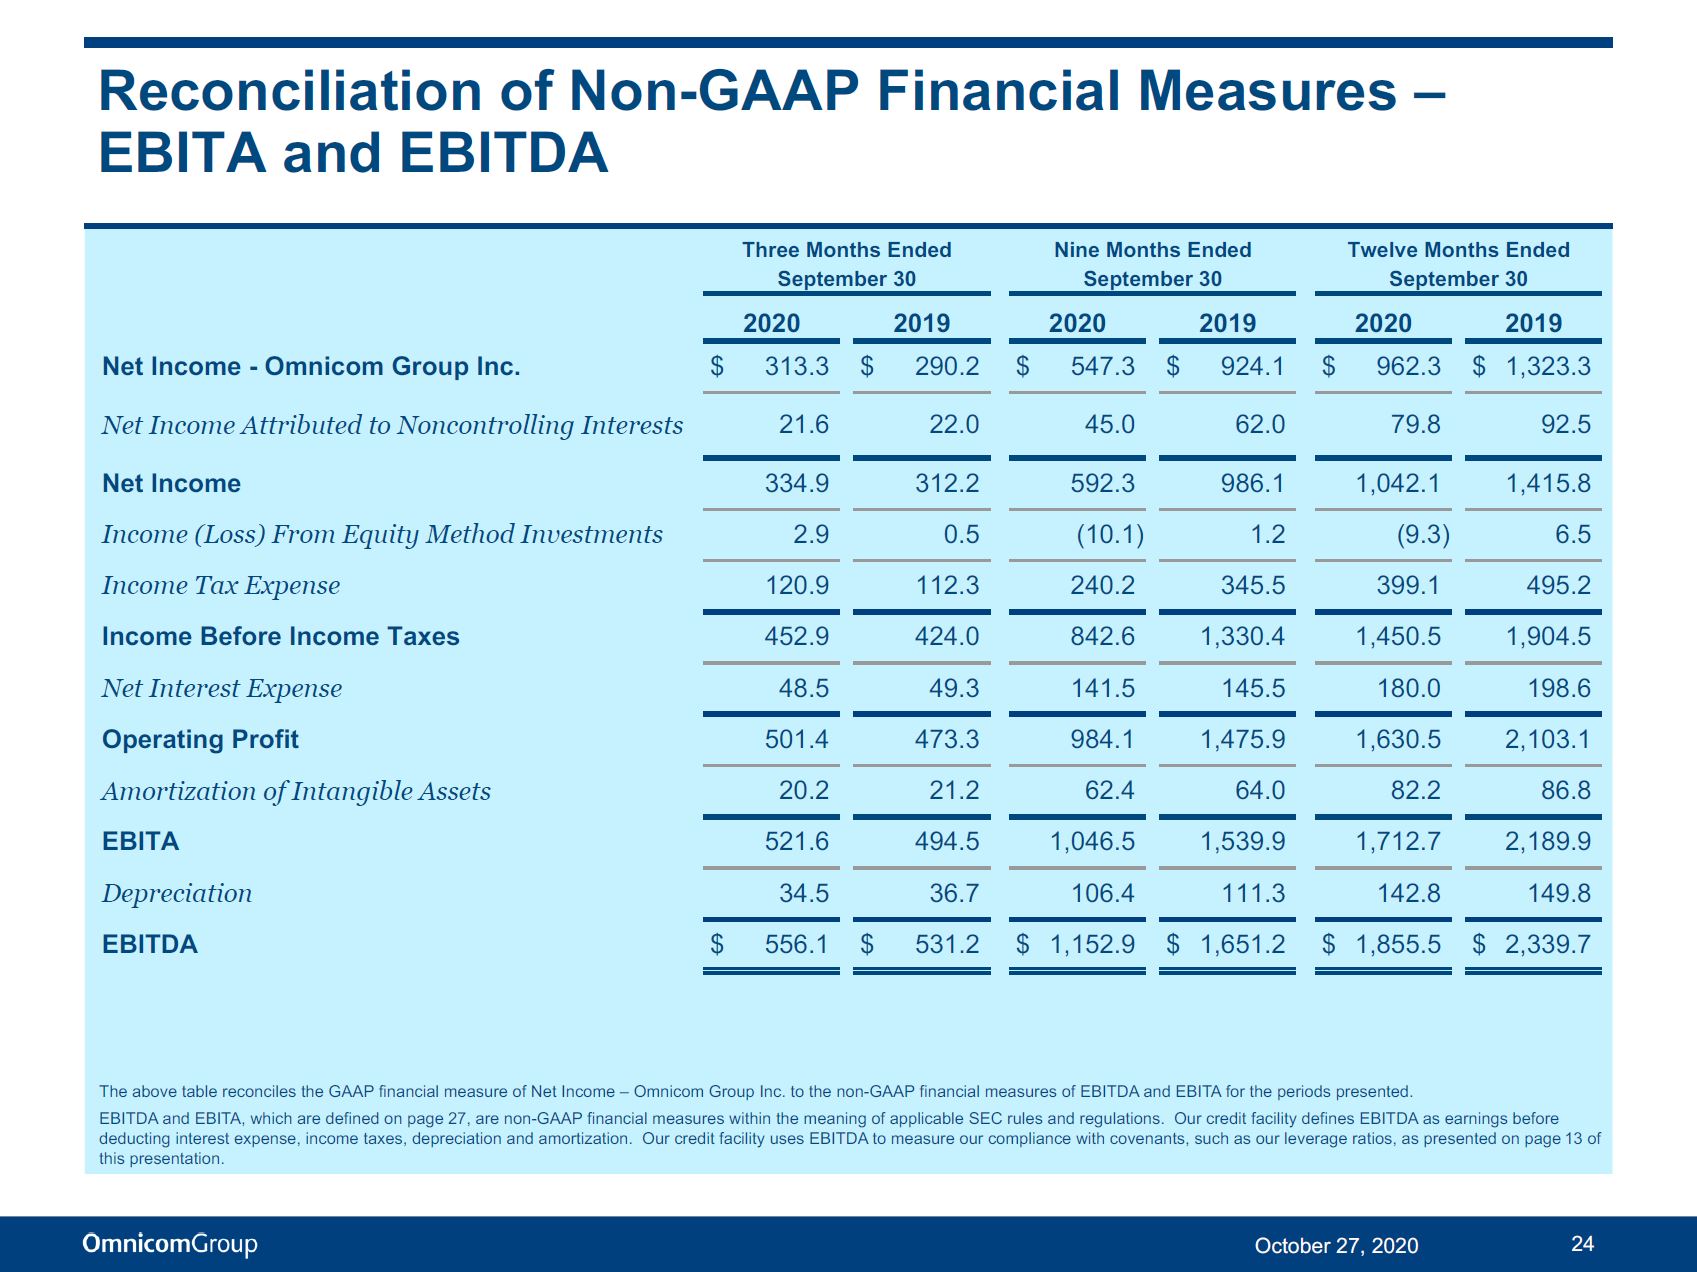
Reconciliation of Non - GAAP Financial Measures – EBITA and EBITDA Three Months Ended September 30 Nine Months Ended September 30 Twelve Months Ended September 30 2020 2019 2020 2019 2020 2019 Net Income - Omnicom Group Inc. $ 313 .3 $ 290 .2 $ 547.3 $ 924 .1 $ 962.3 $ 1,323.3 Net Income Attributed to Noncontrolling Interests 21 .6 22 .0 45 .0 62 .0 79 .8 92 .5 Net Income 334 .9 312 .2 592 .3 986 .1 1,042.1 1 , 415 .8 Income (Loss) From Equity Method Investments 2 .9 0 .5 ( 10 . 1 ) 1 .2 ( 9 . 3 ) 6 .5 Income Tax Expense 120 .9 112 .3 240 .2 345 .5 399 .1 495 .2 Income Before Income Taxes 452 .9 424 .0 842 .6 1 , 330 .4 1,450.5 1 , 904 .5 Net Interest Expense 48 .5 49 .3 141 .5 145 .5 180 .0 198 .6 Operating Profit 501 .4 473 .3 984 .1 1 , 475 .9 1,630.5 2 , 103 .1 Amortization of Intangible Assets 20 .2 21 .2 62 .4 64 .0 82 .2 86 .8 EBITA 521 .6 494 .5 1,046.5 1 , 539 .9 1,712.7 2 , 189 .9 Depreciation 34 .5 36 .7 106 .4 111 .3 142 .8 149 .8 EBITDA $ 556 .1 $ 531 .2 $ 1,152.9 $ 1,651.2 $ 1,855.5 $ 2,339.7 24 October 27, 2020 The above table reconciles the GAAP financial measure of Net Income – Omnicom Group Inc. to the non - GAAP financial measures of EBITDA and EBITA for the periods presented. EBITDA and EBITA, which are defined on page 27, are non - GAAP financial measures within the meaning of applicable SEC rules and regulations. Our credit facility defines EBITDA as earnings before deducting interest expense, income taxes, depreciation and amortization. Our credit facility uses EBITDA to measure our compliance with covenants, such as our leverage ratios, as presented on page 13 of this presentation.
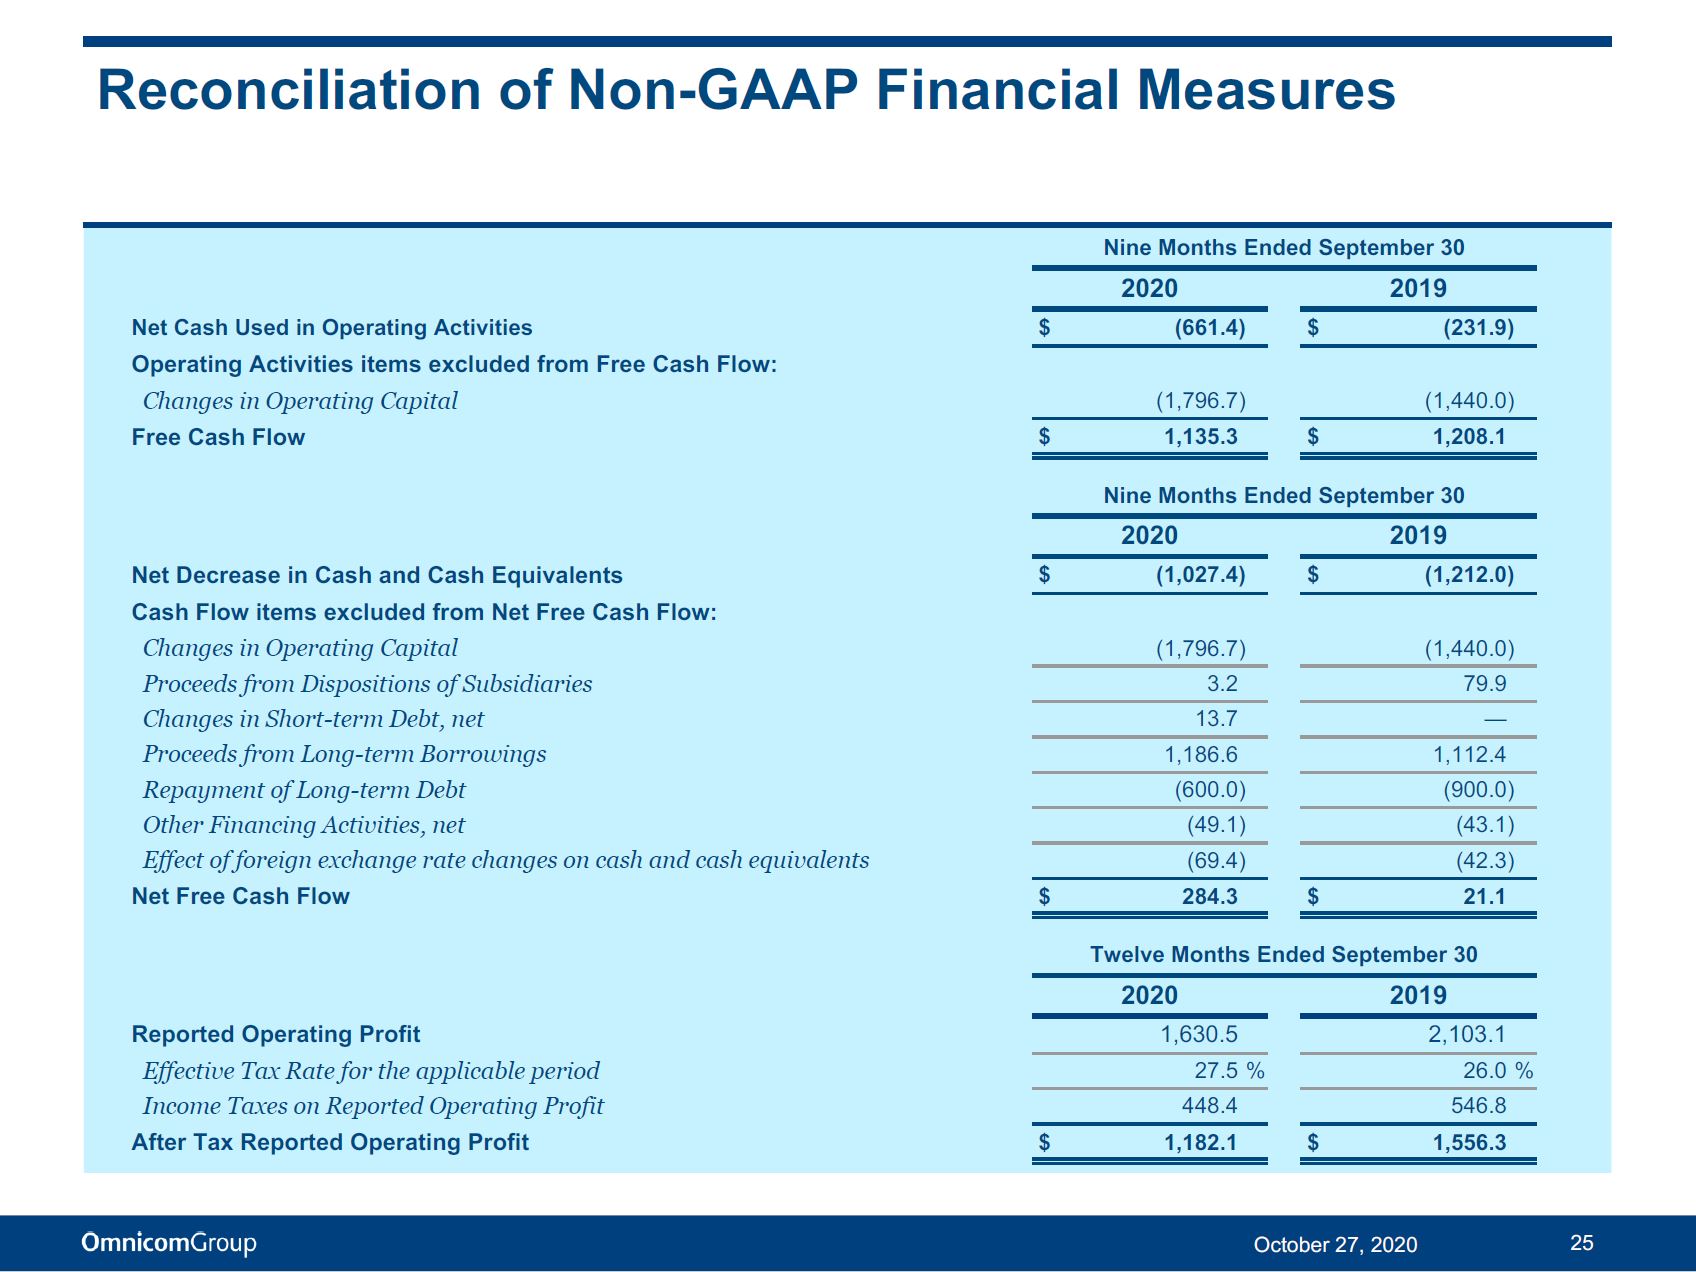
Reconciliation of Non - GAAP Financial Measures Nine Months Ended September 30 2020 2019 Net Cash Used in Operating Activities $ (661.4) $ (231.9) Operating Activities items excluded from Free Cash Flow: Changes in Operating Capital (1,796.7) (1,440.0) Free Cash Flow $ 1,135.3 $ 1,208.1 Nine Months Ended September 30 2020 2019 Net Decrease in Cash and Cash Equivalents $ (1,027.4) $ (1,212.0) Cash Flow items excluded from Net Free Cash Flow: Changes in Operating Capital (1,796.7) (1,440.0) Proceeds from Dispositions of Subsidiaries 3. 2 79. 9 Changes in Short - term Debt, net 13. 7 — Proceeds from Long - term Borrowings 1,186.6 1,112.4 Repayment of Long - term Debt (600.0) (900.0) Other Financing Activities, net (49.1) (43.1) Effect of foreign exchange rate changes on cash and cash equivalents (69.4) (42.3) Net Free Cash Flow $ 284.3 $ 21.1 Twelve Months Ended September 30 2020 2019 Reported Operating Profit 1,630.5 2,103.1 Effective Tax Rate for the applicable period 27.5 % 26.0 % Income Taxes on Reported Operating Profit 448.4 546.8 After Tax Reported Operating Profit $ 1,182.1 $ 1,556.3 25 October 27, 2020

Third Quarter Acquisition 26 October 27, 2020 Credera acquired a majority stake in London - based DMW Group. DMW is a leading independent technology consultancy, specializing in the design, delivery, and implementation of data and digital transformation programs. Its people - first and outcome - focused approach drives success for their global and domestic brand clients, as well as for local government agencies. The acquisition of DMW will enable Credera to expand its consulting and digital transformation capabilities into Europe. With offices in London, Leeds, and Manchester, United Kingdom, DMW will operate as part of Credera within the Omnicom Precision Marketing Group.
Disclosure 27 October 27, 2020 The preceding materials have been prepared for use in the October 27, 2020 conference call on Omnicom’s results of operations fo r the three and nine months ended September 30, 2020. The call will be archived on the Internet at http://investor.omnicomgroup.com/investor - relations/news - events - and - filings / . Forward - Looking Statements Certain statements in this presentation constitute forward - looking statements, including statements within the meaning of the Pr ivate Securities Litigation Reform Act of 1995. In addition, from time to time, Omnicom Group Inc. ("Omnicom" or the "Company") or its representatives have made, or may make, forward - looking statements, orally or in writin g. These statements may discuss goals, intentions and expectations as to future plans, trends, events, results of operations or financial condition, or otherwise, based on current beliefs of the Company’s managem ent as well as assumptions made by, and information currently available to, the Company’s management. Forward - looking statements may be accompanied by words such as “aim,” “anticipate,” “believe,” “plan,” “could,” “sho uld,” “would,” “estimate,” “expect,” “forecast,” “future,” “guidance,” “intend,” “may,” “will,” “possible,” “potential,” “predict,” “project” or similar words, phrases or expressions. These forward - looking statements are sub ject to various risks and uncertainties, many of which are outside the Company’s control. Therefore, you should not place undue reliance on such statements. Factors that could cause actual results to differ materially from those in the forward - looking statements include: international, national or local economic conditions that could adversely affect the Company or its clients, including those caused by the outbreak of coronavirus dise ase 2019 (“COVID - 19”); losses on media purchases and production costs incurred on behalf of clients; reductions in client spending, a slowdown in client payments and a deterioration in the credit markets; the ability to attract new clients and retain existing clients in the manner anticipated; changes in client advertising, marketing and corporate communications requirements; failure to manage potential conflicts of interest between or among clients; unanticipated changes relating to competitive factors in the advertising, marketing and corporate communications industries; the ability to hire and retain key personnel; currency exchange rate fluctuations; reliance on information technology systems; changes in le gis lation or governmental regulations affecting the Company or its clients; risks associated with assumptions the Company makes in connection with its cri tical accounting estimates and legal proceedings; and the Company’s international operations, which are subject to the risks of currency repatriation restrictions, social or political conditions and regulatory environment. The foregoing lis t o f factors is not exhaustive. You should carefully consider the foregoing factors and the other risks and uncertainties that may affect the Company’s business, including those described in Ite m 1A, “Risk Factors” in Omnicom’s most recent Annual Report on Form 10 - K and other documents filed from time to time with the Securities and Exchange Commission. Except as required under applicable law, the Company does not assume any obligation to update these forward - looking statements. Non - GAAP Financial Measures We present financial measures determined in accordance with generally accepted accounting principles in the United States (“GAAP”) and adjustments to the GAAP presentation (“Non - GAAP”), which we believe are meaningful for understanding our performance. Non - GAAP financial measures should not be considered in isolation from, or as a substitute for, financial information presented in compliance with GAAP. Non - GAAP financial measures as reported by us may not be comparable to similarly titled amounts reported by other companies. We provide a reconciliation of non - GAAP measures to the comparable GAAP measures on pages 23 to 25. The Non - GAAP measures used in this presentation include the following: Free Cash Flow, defined as net income plus depreciation, amortization, share based compensation expense plus/(less) other items to reconcile to net cash used in operating activities. We believe Free Cash Flow is a useful measure of liquidity to evaluate our ability to generate excess cash from our operations. Primary Uses of Cash, defined as dividends to common shareholders, dividends paid to non - controlling interest shareholders, capital expenditures, cash paid on acquisitions, payments for additional interest in cont rolled subsidiaries and stock repurchases, net of the proceeds from our stock plans, and excludes changes in operating capital and o the r investing and financing activities, including commercial paper issuances and redemptions used to fund working capital changes. We believe this liquidity measure is useful in identifying the significant uses of our cash. Net Free Cash Flow, defined as Free Cash Flow less the Primary Uses of Cash. Net Free Cash Flow is one of the metrics used by us to assess our sources and uses of cash and was derived from our consolidated statements of cash flows. We believe that this liquidity measure is meaningful for understanding our primary sources and primary uses of that cash flow. EBITDA, defined as operating profit before interest, taxes, depreciation and amortization of intangible assets. We believe EBITDA is a meaningful operating performance measure because the financial covenants in our credit facilities are based on EBITDA. EBITA, defined as operating profit before interest, taxes and amortization of intangible assets and EBITA margin, defined as EBITA divided by revenue. We use EBITA and EBITA margin as additional operating performance measures, which excludes the non - cash amortization expense of intangible assets (primarily consisting of amortizatio n arising from acquisitions). Accordingly, we believe it is a useful measure for investors to evaluate the performance of our business. Net Debt, defined as total debt less cash, cash equivalents and short - term investments. We believe net debt, together with the comparable GAAP measures, reflects one of the liquidity metrics used by us to assess our cash management. After Tax Reported Operating Profit, defined as reported operating profit less income taxes calculated using the effective tax rate for th e applicable period. Management uses after tax operating profit as a measure of after tax operating performance as it excludes the after tax effects of financing and investing activities on results of operations. Other Information All dollar amounts are in millions except for per share figures on page s 1 and 2 a nd the net cash returned to shareholders figures on page 21. The information contained in this document has not been audited, although some data has been derived from Omnicom’s historical financial statements, including its audited financial statements. In addition, industry, operational and other non - financial data contained in this document have been derived from sources that we believe to be reliable, but we have not independently verified such information, and we do not, nor does any other person, assume respon sib ility for the accuracy or completeness of that information. Certain amounts in prior periods have been reclassified to conform to our current presentation. The inclusion of information in this presentation does not mean that such information is material o r t hat disclosure of such information is required.