opfi-20220809
0001818502FALSE00018185022022-08-092022-08-090001818502us-gaap:CommonClassAMember2022-08-092022-08-090001818502us-gaap:WarrantMember2022-08-092022-08-09

UNITED STATES
SECURITIES AND EXCHANGE COMMISSION
Washington, D.C. 20549
FORM 8-K
CURRENT REPORT
PURSUANT TO SECTION 13 OR 15(d)
OF THE SECURITIES EXCHANGE ACT OF 1934
Date of Report (Date of earliest event reported): August 9, 2022
OppFi Inc.
(Exact name of registrant as specified in its charter)
Delaware001-3955085-1648122
(State or Other Jurisdiction
of Incorporation)
(Commission
File Number)
(IRS Employer
Identification No.)
130 E. Randolph Street, Suite 3400
Chicago, Illinois 60601
(Address of principal executive offices, including zip code)
Registrant’s telephone number, including area code: (312) 212-8079
Not Applicable
(Former name or former address, if changed since last report)
Check the appropriate box below if the Form 8-K filing is intended to simultaneously satisfy the filing obligation of the registrant under any of the following provisions:
Written communications pursuant to Rule 425 under the Securities Act (17 CFR 230.425)
Soliciting material pursuant to Rule 14a-12 under the Exchange Act (17 CFR 240.14a-12)
Pre-commencement communications pursuant to Rule 14d-2(b) under the Exchange Act (17 CFR 240.14d- 2(b))
Pre-commencement communications pursuant to Rule 13e-4(c) under the Exchange Act (17 CFR 240.13e- 4(c))

Securities registered pursuant to Section 12(b) of the Act:
Title of each classTrading
Symbol(s)
Name of each exchange
on which registered
Class A common stock, $0.0001 par
value per share
OPFIThe New York Stock Exchange
Warrants, each whole warrant exercisable for one share of Class A common stock, each at an exercise price of $11.50 per shareOPFI WSThe New York Stock Exchange


Indicate by check mark whether the registrant is an emerging growth company as defined in Rule 405 of the Securities Act of 1933 (§230.405) or Rule 12b-2 of the Securities Exchange Act of 1934 (§240.12b-2).
Emerging growth company
If an emerging growth company, indicate by check mark if the registrant has elected not to use the extended transition period for complying with any new or revised financial accounting standards provided pursuant to Section 13(a) of the Exchange Act.


Item 2.02 Results of Operations and Financial Condition.
The information contained in Item 7.01 of this Current Report on Form 8-K is incorporated by reference in this Item 2.02.

Item 7.01 Regulation FD Disclosure.

On August 9, 2022, OppFi Inc. (the “Company”) issued a press release and held a webcast and conference call announcing its financial results for the second quarter ended June 30, 2022. Additionally, the Company provided an earnings presentation to accompany the press release. Copies of the press release, the transcript of the conference call and the earnings presentation are furnished as Exhibits 99.1, 99.2 and 99.3, respectively, to this Current Report on Form 8-K and are incorporated herein by reference.

This information and the information contained in Exhibits 99.1, 99.2 and 99.3 is furnished and shall not be deemed “filed” for purposes of Section 18 of the Securities Exchange Act of 1934, as amended (the “Exchange Act”), or incorporated by reference in any filing under the Securities Act of 1933, as amended, or the Exchange Act, except as may be expressly set forth by specific reference in any such filing, regardless of any general incorporation language in the filing.

Item 9.01 Financial Statements and Exhibits.
(d) Exhibits

Exhibit Index

Exhibit NumberDescription
99.1
99.2
99.3
104Cover Page Interactive Data File (the cover page tags are embedded within the Inline XBRL document).


SIGNATURES
Pursuant to the requirements of the Securities Exchange Act of 1934, the registrant has duly caused this report to be signed on its behalf by the undersigned thereunto duly authorized.

Date: August 10, 2022OppFi Inc.
By:/s/ Pamela D. Johnson
Pamela D. Johnson
Chief Financial Officer

NEWS RELEASE OppFi Reports Second Quarter 2022 Financial Results 8/9/2022 Revenue increased 38% year over year to $107.9 million for the second quarter of 2022 Net Originations increased 57% year over year to $226.2 million for the second quarter of 2022 Ending Receivables increased 54% year over year to $401.5 million for the second quarter of 2022 Net income of $9.5 million for the second quarter of 2022 Adjusted Net Income of $6.8 million for the second quarter of 2022 Basic and Diluted EPS of $0.26 and $0.10, respectively, for the second quarter of 2022 Adjusted EPS of $0.08 for the second quarter of 2022 CHICAGO--(BUSINESS WIRE)-- OppFi Inc. (NYSE: OPFI) (“OppFi” or the “Company”), a leading �nancial technology platform that powers banks to help the everyday consumer gain access to credit, today reported �nancial results for the second quarter ended June 30, 2022. “We are pleased with our �nancial and operational performance for the second quarter, relative to our expectations,” said Todd Schwartz, Chief Executive O�cer and Executive Chairman of OppFi. “We are encouraged by continued strong consumer demand that drove 57% growth in originations, e�ciencies that yielded a 16% decrease in marketing cost per new funded loan, and further progress scaling our operating expenses.” 1

 
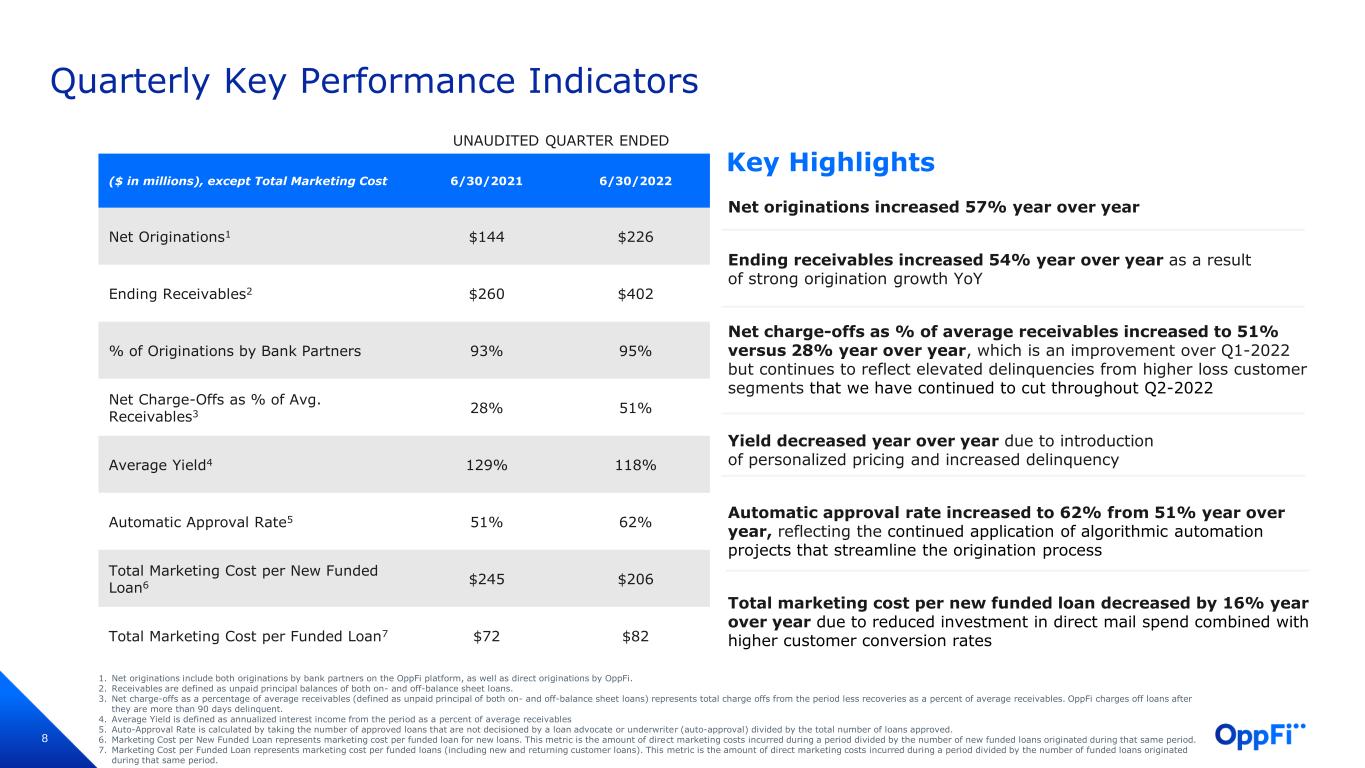
“We are diligently monitoring the macroeconomic environment and the impact of in�ation on our customers and have adjusted, and are prepared to continue to adjust, credit models accordingly,” concluded Schwartz. "We have con�dence in our ability to navigate this current environment and believe the enhancements we are making today will position us for a strong 2023.” Financial Summary The following tables present a summary of OppFi’s results for the three months ended June 30, 2022 and 2021. (in thousands, except share and per share data) Unaudited   Three Months Ended June 30,   Change     2022   2021   % Total revenue   $ 107,875  $ 78,376  37.6% Net income   $ 9,497  $ 17,987  (47.2)% Adjusted net income   $ 6,819  $ 17,823  (61.7)% Adjusted EBITDA   $ 20,009  $ 32,282  (38.0)% Basic EPS(a)   $ 0.26  $ —  —% Diluted EPS(a)   $ 0.10  $ —  —% Adjusted EPS(a)   $ 0.08  $ —  —% (in thousands, except share and per share data) Unaudited   Six Months Ended June 30,   Change     2022   2021   % Total revenue   $ 208,585  $ 162,633  28.3% Net income   $ 9,200  $ 42,371  (78.3)% Adjusted net income   $ 7,377  $ 37,077  (80.1)% Adjusted EBITDA   $ 31,194  $ 64,639  (51.7)% Basic EPS(a)   $ 0.33  $ —  —% Diluted EPS(a)   $ 0.10  $ —  —% Adjusted EPS(a)   $ 0.09  $ —  —% a.For the periods prior to July 20, 2021, earnings per share was not calculated, as net income prior to the Business Combination was attributable entirely to OppFi-LLC. Second Quarter Key Performance Metrics The following tables represent key quarterly metrics. (in thousands, except marketing cost per loan information) Unaudited   As of and for the Three Months Ended,     June 30, 2022   March 31, 2022   June 30, 2021 Total Net Originations(a)   $ 226,201    $ 162,756    $ 144,039  Ending Receivables(b)   $ 401,549    $ 338,458    $ 260,377  % of Originations by Bank Partners     95%     95%     93% N Ch O� % f A R i bl ( ) 51% 56% 28% 2

 
Net Charge-O�s as % of Average Receivables(c)     51%     56%     28% Auto-Approval Rate(d)     62%     61%     51% Marketing Cost per Funded Loan(e)   $ 82    $ 76    $ 72  Marketing Cost per New Funded Loan(f)   $ 206    $ 221    $ 245  a.Total net originations include both originations by bank partners on the OppFi platform, as well as direct originations by OppFi. b.Receivables are de�ned as unpaid principal balances of both on- and o�-balance sheet loans. c. Annualized net charge-o�s as a percentage of average receivables (de�ned as unpaid principal of both on- and o�-balance sheet loans) represents total charge o�s from the period less recoveries as a percent of average receivables. Finance receivables are charged o� at the earlier of the time when accounts reach 90 days past due on a recency basis, when OppFi receives noti�cation of a customer bankruptcy or is otherwise deemed uncollectible. d.Auto-Approval Rate is calculated by taking the number of approved loans that are not decisioned by a loan advocate or underwriter (auto-approval) divided by the total number of loans approved. e.Marketing Cost per Funded Loan represents marketing cost per funded loan for new and re�nanced loans. This metric is the amount of direct marketing costs incurred during a period divided by the number of loans originated during that same period. f. Marketing Cost per New Funded Loan represents marketing cost for new loans. This metric is the amount of direct marketing costs incurred during a period divided by the number of new loans originated during that same period. Share Repurchase Program Update During the second quarter, OppFi repurchased 333,318 shares of class A common stock for $1.1 million at an average price of $3.31 per share. During the �rst half of 2022, the Company repurchased 615,652 shares of class A common stock at an average price of $3.48 per share for a total of $2.1 million. Full Year 2022 Guidance Update OppFi rea�rms its previously issued full-year 2022 �nancial guidance of total revenue growth of 20% to 25% year over year and operating expenses as a percentage of total revenue of 43% to 47%, excluding interest expense, add backs, and one-time items. Given limited visibility considering the current macroeconomic environment, the Company now expects to report break-even results on an adjusted basis or a modest adjusted net loss for the full- year, due to persistent high in�ation that caused signi�cant credit deterioration in the latter half of the second quarter and early third quarter. OppFi withdraws its previously issued guidance for metrics other than total revenue growth and operating expenses as a percentage of total revenue. Conference Call Management will host a conference call today at 4:30 p.m. ET to discuss OppFi’s �nancial results and outlook. The webcast of the conference call will be made available on the Investor Relations page of the Company's website. The conference call can also be accessed with the following dial-in information: Domestic: (888) 567-1602 International: (404) 267-0373 An archived version of the webcast will be available on OppFi's website. 3

 
About OppFi OppFi (NYSE: OPFI) is a leading �nancial technology platform that powers banks to help the everyday consumer gain access to credit. Through its unwavering commitment to customer service, the Company supports consumers, who are turned away by mainstream options, to build better �nancial health. In 2021, OppFi was recognized by the Deloitte North America Technology Fast 500 for the fourth consecutive year. OppFi maintains a 4.7/5.0 star rating on Trustpilot with more than 3,400 reviews and an A+ rating from the Better Business Bureau (BBB), making the Company one of the top consumer-rated �nancial platforms online. For more information, please visit opp�.com. Forward-Looking Statements This press release includes "forward-looking statements" within the meaning of the "safe harbor" provisions of the Private Securities Litigation Reform Act of 1995, Section 27A of the Securities Act of 1933, as amended, and Section 21E of the Securities Exchange Act of 1934, as amended. OppFi’s actual results may di�er from its expectations, estimates and projections and consequently, you should not rely on these forward-looking statements as predictions of future events. Words such as "expect," "estimate," "project," "budget," "forecast," "anticipate," "intend," "plan," "may," "will," "could," "should," "believes," "predicts," "potential," “possible,” "continue," and similar expressions may identify forward-looking statements, but the absence of these words does not mean that a statement is not forward-looking. These forward-looking statements include, without limitation, OppFi’s expectations with respect to its full year 2022 guidance, the future performance of OppFi’s platform and expectations for OppFi’s growth. These forward-looking statements are based on OppFi’s current expectations and assumptions about future events and are based on currently available information as to the outcome and timing of future events. These forward-looking statements involve signi�cant risks and uncertainties that could cause the actual results to di�er materially from the expected results. Most of these factors are outside OppFi’s control and are di�cult to predict. Factors that may cause such di�erences include, but are not limited to: the impact of in�ation on OppFi’s business; the impact of COVID-19 on OppFi’s business; the impact of stimulus or other government programs; whether OppFi will be successful in obtaining declaratory relief against the Commissioner of the Department of Financial Protection and Innovation for the State of California; whether OppFi will be subject to AB 539; whether OppFi’s bank partners will continue to lend in California and whether OppFi’s �nancing sources will continue to �nance the purchase of participation rights in loans originated by OppFi’s bank partners in California; the risk that the business combination disrupts current plans and operations; the ability to recognize the anticipated bene�ts of the business combination, which may be a�ected by, among other things, competition, the ability of OppFi to grow and manage growth pro�tably and retain its key employees; risks related to new products; concentration risk; costs related to the business combination; changes in applicable laws or regulations; the possibility that OppFi may be adversely a�ected by other economic, business, and/or competitive factors; risks related to management transitions; and other risks and uncertainties indicated from time to time in OppFi’s �lings 4
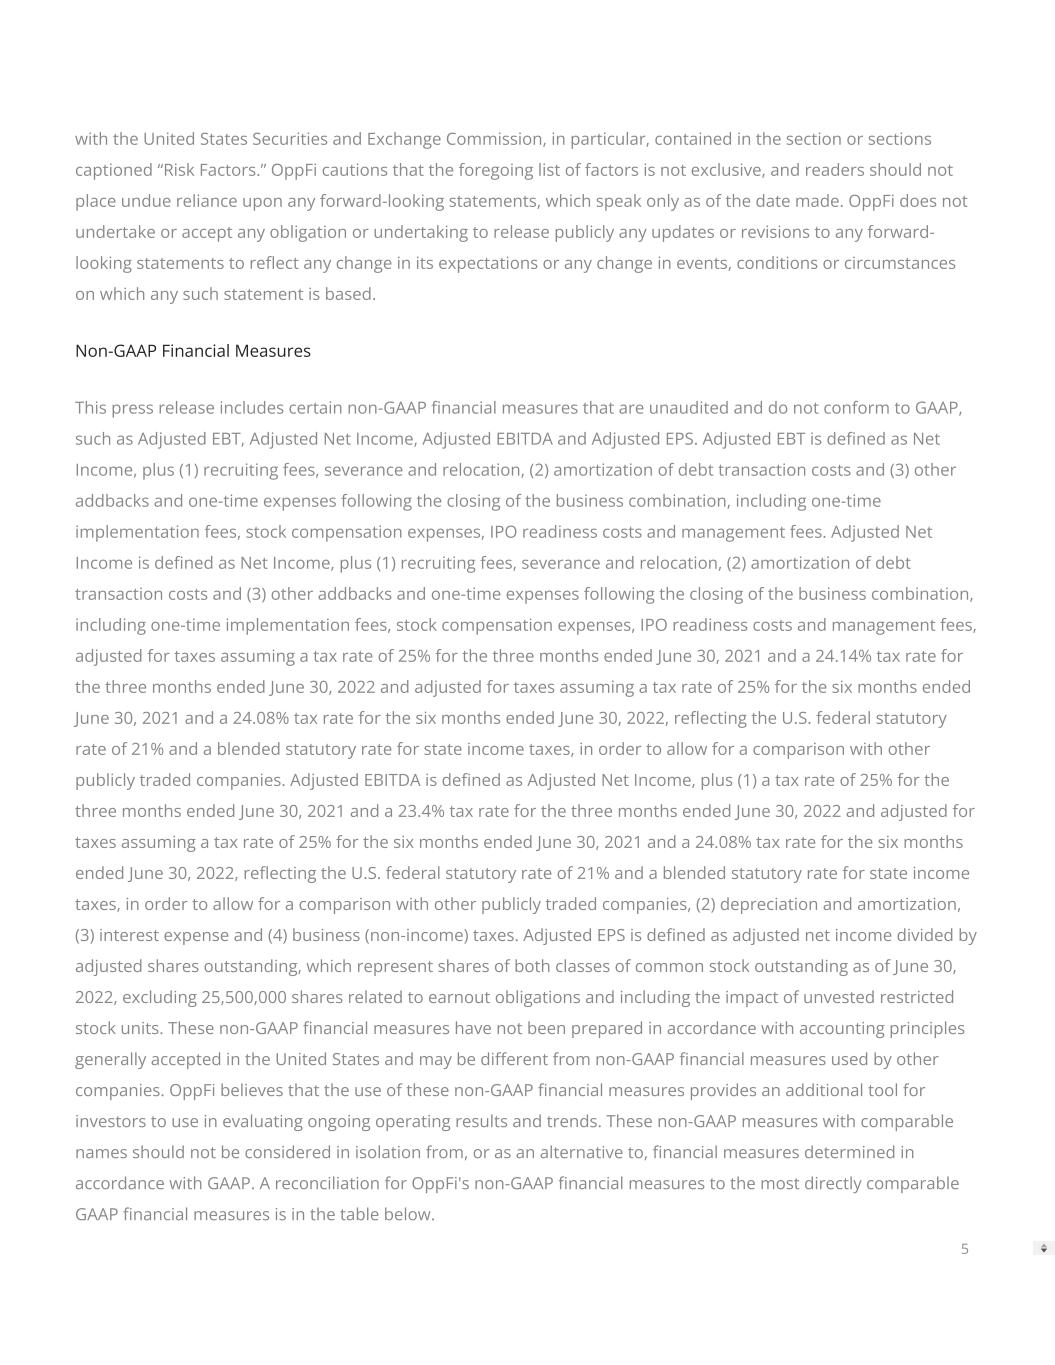

 
with the United States Securities and Exchange Commission, in particular, contained in the section or sections captioned “Risk Factors.” OppFi cautions that the foregoing list of factors is not exclusive, and readers should not place undue reliance upon any forward-looking statements, which speak only as of the date made. OppFi does not undertake or accept any obligation or undertaking to release publicly any updates or revisions to any forward- looking statements to re�ect any change in its expectations or any change in events, conditions or circumstances on which any such statement is based. Non-GAAP Financial Measures This press release includes certain non-GAAP �nancial measures that are unaudited and do not conform to GAAP, such as Adjusted EBT, Adjusted Net Income, Adjusted EBITDA and Adjusted EPS. Adjusted EBT is de�ned as Net Income, plus (1) recruiting fees, severance and relocation, (2) amortization of debt transaction costs and (3) other addbacks and one-time expenses following the closing of the business combination, including one-time implementation fees, stock compensation expenses, IPO readiness costs and management fees. Adjusted Net Income is de�ned as Net Income, plus (1) recruiting fees, severance and relocation, (2) amortization of debt transaction costs and (3) other addbacks and one-time expenses following the closing of the business combination, including one-time implementation fees, stock compensation expenses, IPO readiness costs and management fees, adjusted for taxes assuming a tax rate of 25% for the three months ended June 30, 2021 and a 24.14% tax rate for the three months ended June 30, 2022 and adjusted for taxes assuming a tax rate of 25% for the six months ended June 30, 2021 and a 24.08% tax rate for the six months ended June 30, 2022, re�ecting the U.S. federal statutory rate of 21% and a blended statutory rate for state income taxes, in order to allow for a comparison with other publicly traded companies. Adjusted EBITDA is de�ned as Adjusted Net Income, plus (1) a tax rate of 25% for the three months ended June 30, 2021 and a 23.4% tax rate for the three months ended June 30, 2022 and adjusted for taxes assuming a tax rate of 25% for the six months ended June 30, 2021 and a 24.08% tax rate for the six months ended June 30, 2022, re�ecting the U.S. federal statutory rate of 21% and a blended statutory rate for state income taxes, in order to allow for a comparison with other publicly traded companies, (2) depreciation and amortization, (3) interest expense and (4) business (non-income) taxes. Adjusted EPS is de�ned as adjusted net income divided by adjusted shares outstanding, which represent shares of both classes of common stock outstanding as of June 30, 2022, excluding 25,500,000 shares related to earnout obligations and including the impact of unvested restricted stock units. These non-GAAP �nancial measures have not been prepared in accordance with accounting principles generally accepted in the United States and may be di�erent from non-GAAP �nancial measures used by other companies. OppFi believes that the use of these non-GAAP �nancial measures provides an additional tool for investors to use in evaluating ongoing operating results and trends. These non-GAAP measures with comparable names should not be considered in isolation from, or as an alternative to, �nancial measures determined in accordance with GAAP. A reconciliation for OppFi's non-GAAP �nancial measures to the most directly comparable GAAP �nancial measures is in the table below. 5
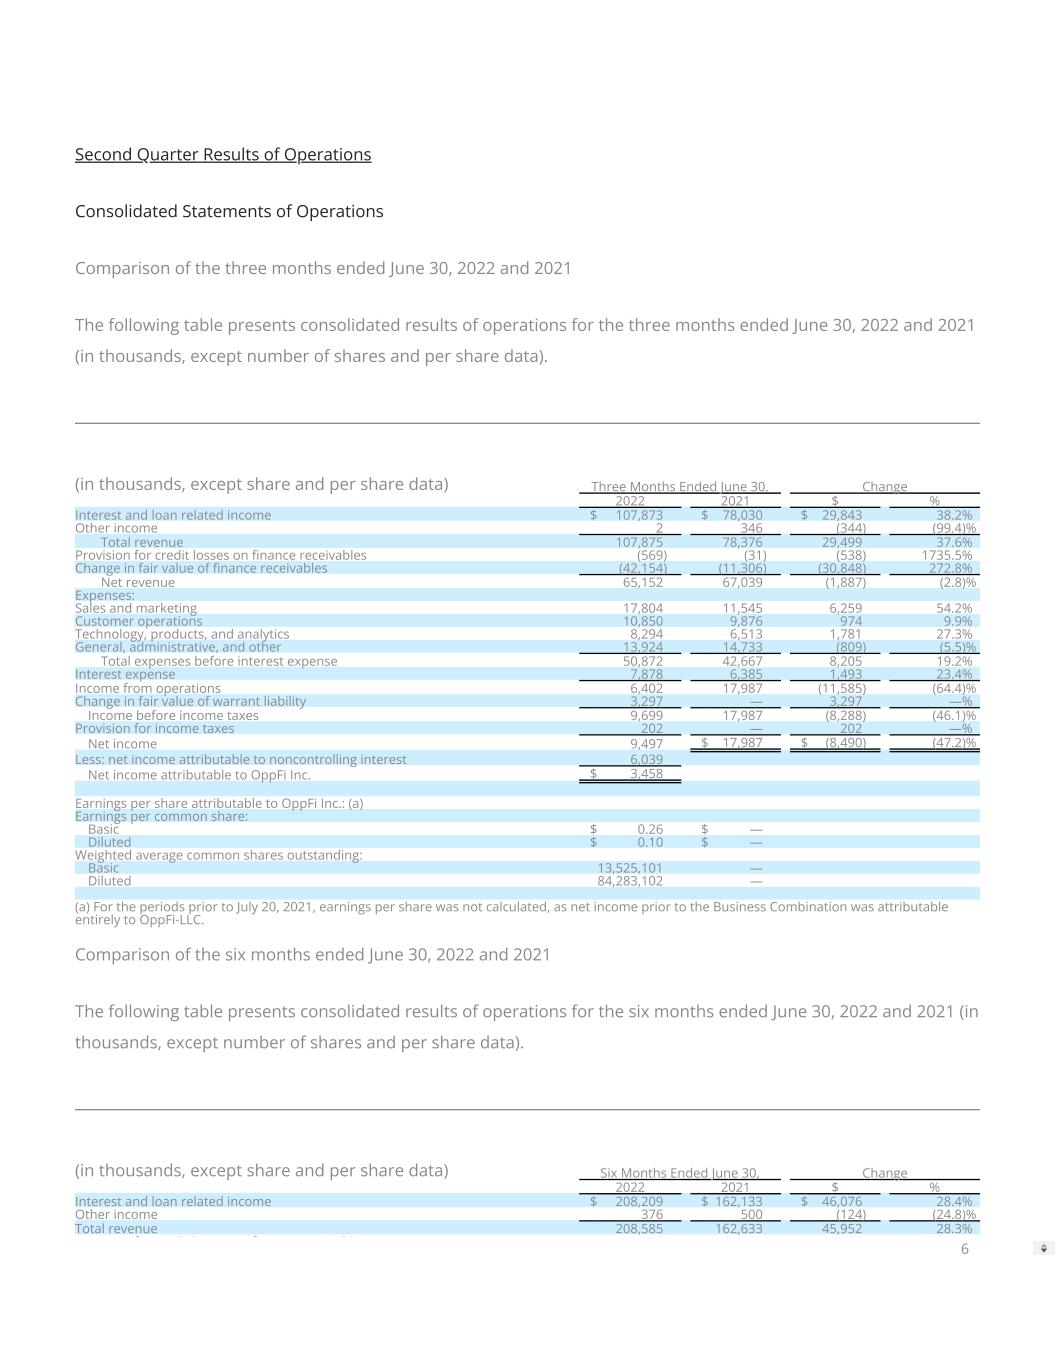

 
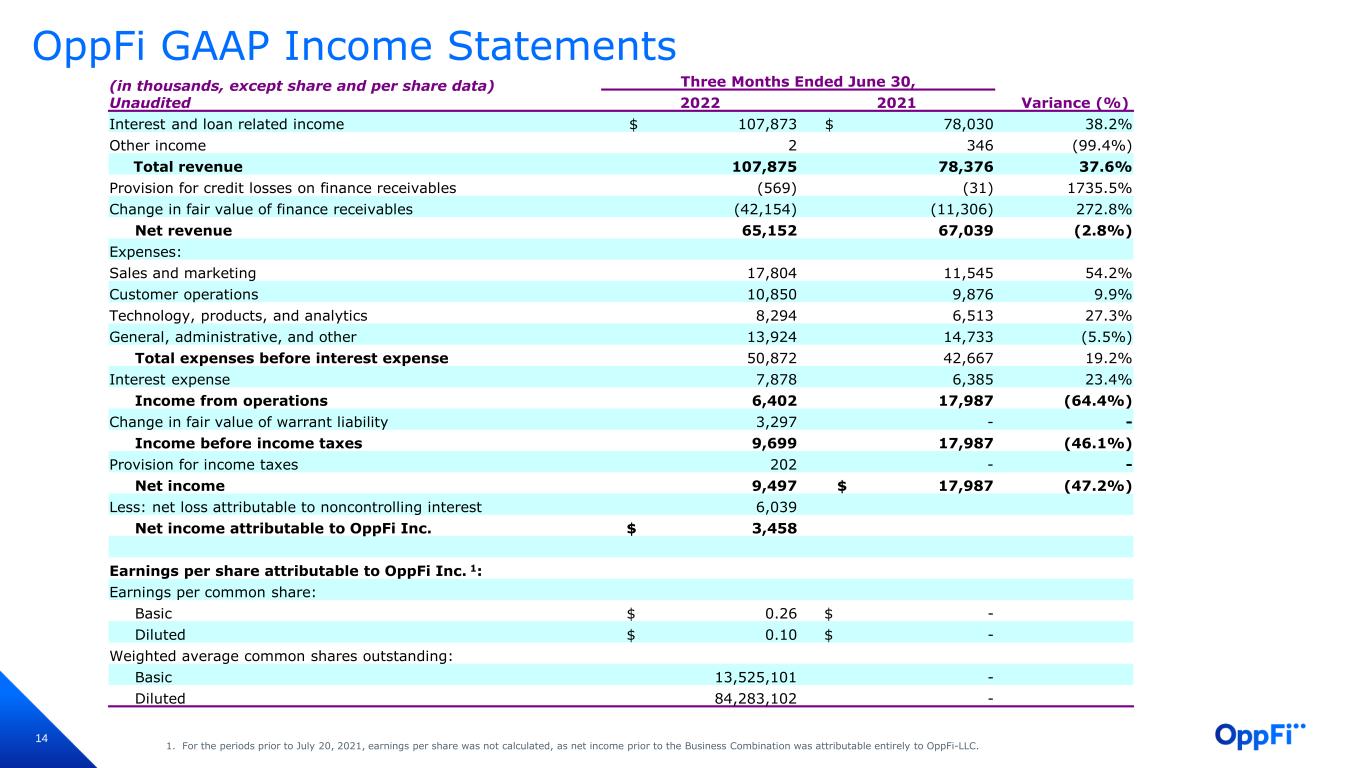
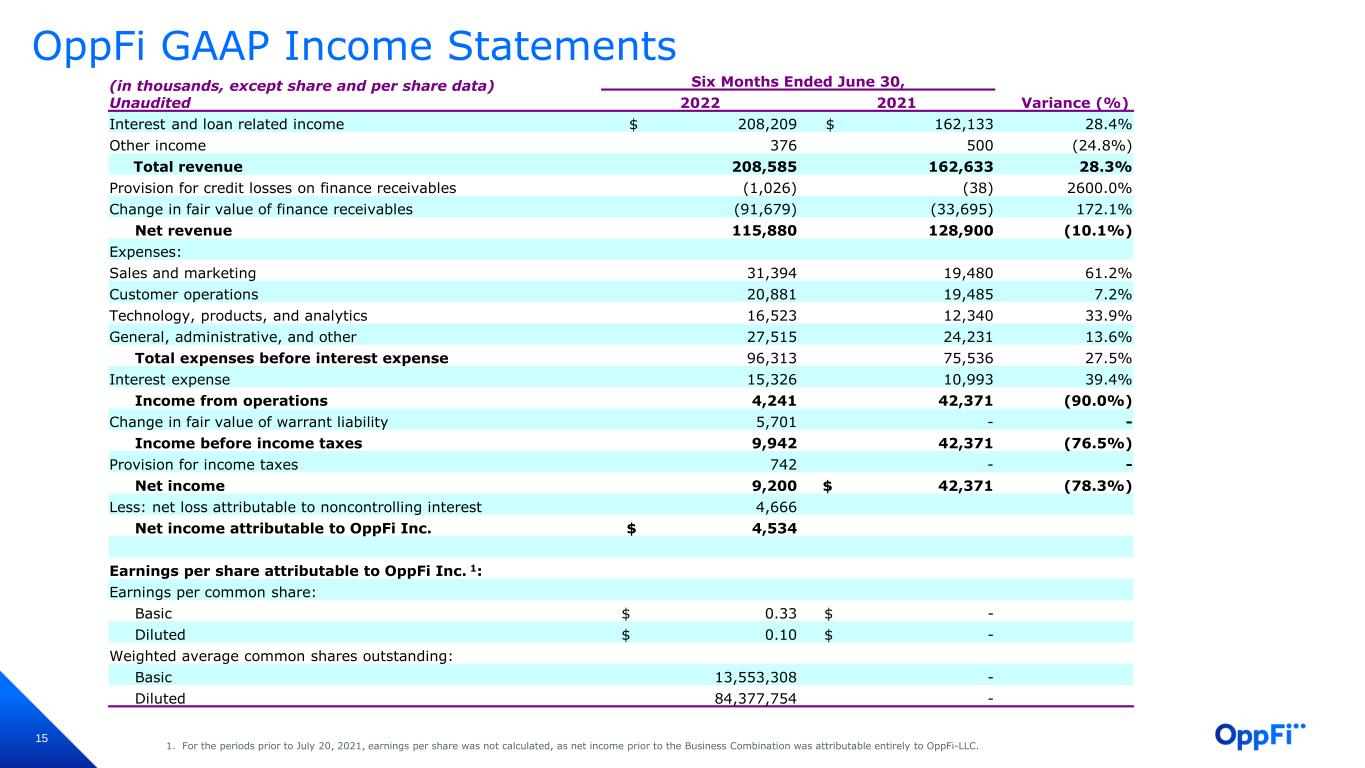
Second Quarter Results of Operations Consolidated Statements of Operations Comparison of the three months ended June 30, 2022 and 2021 The following table presents consolidated results of operations for the three months ended June 30, 2022 and 2021 (in thousands, except number of shares and per share data). (in thousands, except share and per share data)   Three Months Ended June 30,   Change     2022   2021   $   % Interest and loan related income   $ 107,873    $ 78,030    $ 29,843    38.2% Other income     2      346      (344)   (99.4)% Total revenue     107,875      78,376      29,499    37.6% Provision for credit losses on �nance receivables     (569)     (31)     (538)   1735.5% Change in fair value of �nance receivables     (42,154)     (11,306)     (30,848)   272.8% Net revenue     65,152      67,039      (1,887)   (2.8)% Expenses:                 Sales and marketing     17,804      11,545      6,259    54.2% Customer operations     10,850      9,876      974    9.9% Technology, products, and analytics     8,294      6,513      1,781    27.3% General, administrative, and other     13,924      14,733      (809)   (5.5)% Total expenses before interest expense     50,872      42,667      8,205    19.2% Interest expense     7,878      6,385      1,493    23.4% Income from operations     6,402      17,987      (11,585)   (64.4)% Change in fair value of warrant liability     3,297      —      3,297    —% Income before income taxes     9,699      17,987      (8,288)   (46.1)% Provision for income taxes     202      —      202    —% Net income     9,497    $ 17,987    $ (8,490)   (47.2)% Less: net income attributable to noncontrolling interest     6,039              Net income attributable to OppFi Inc.   $ 3,458                                Earnings per share attributable to OppFi Inc.: (a)                 Earnings per common share:                 Basic   $ 0.26    $ —          Diluted   $ 0.10    $ —          Weighted average common shares outstanding:                 Basic    13,525,101      —          Diluted    84,283,102      —                            (a) For the periods prior to July 20, 2021, earnings per share was not calculated, as net income prior to the Business Combination was attributable entirely to OppFi-LLC. Comparison of the six months ended June 30, 2022 and 2021 The following table presents consolidated results of operations for the six months ended June 30, 2022 and 2021 (in thousands, except number of shares and per share data). (in thousands, except share and per share data)   Six Months Ended June 30,   Change     2022   2021   $   % Interest and loan related income   $ 208,209    $ 162,133    $ 46,076    28.4% Other income     376      500      (124)   (24.8)% Total revenue     208,585      162,633      45,952    28.3% P i i f di l � i bl (1 026) (38) (988) 2600 0% 6
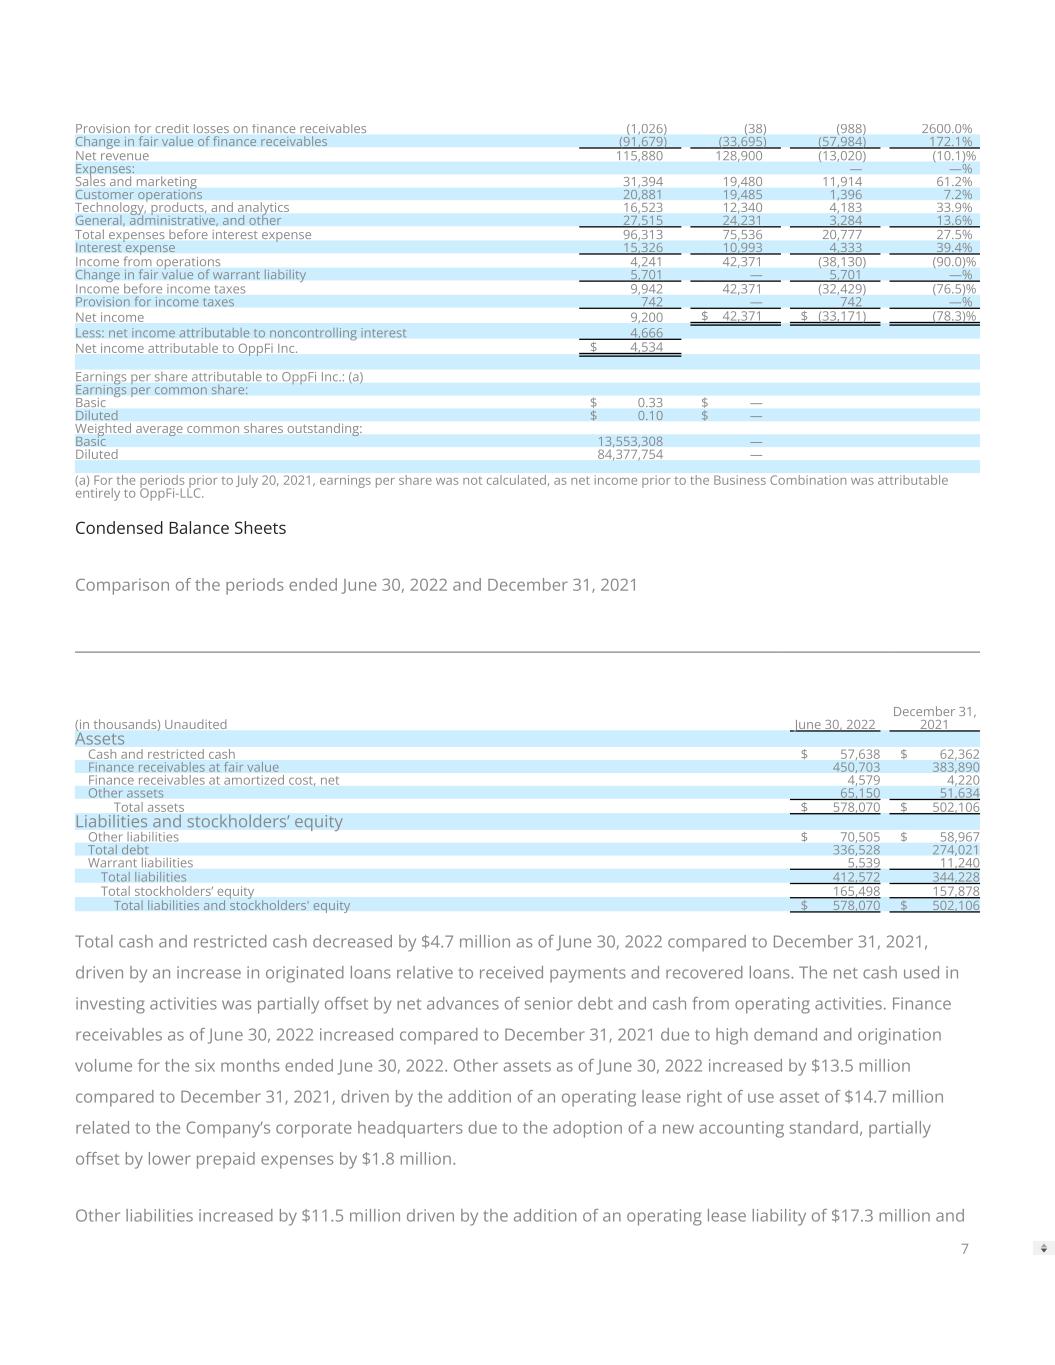

 
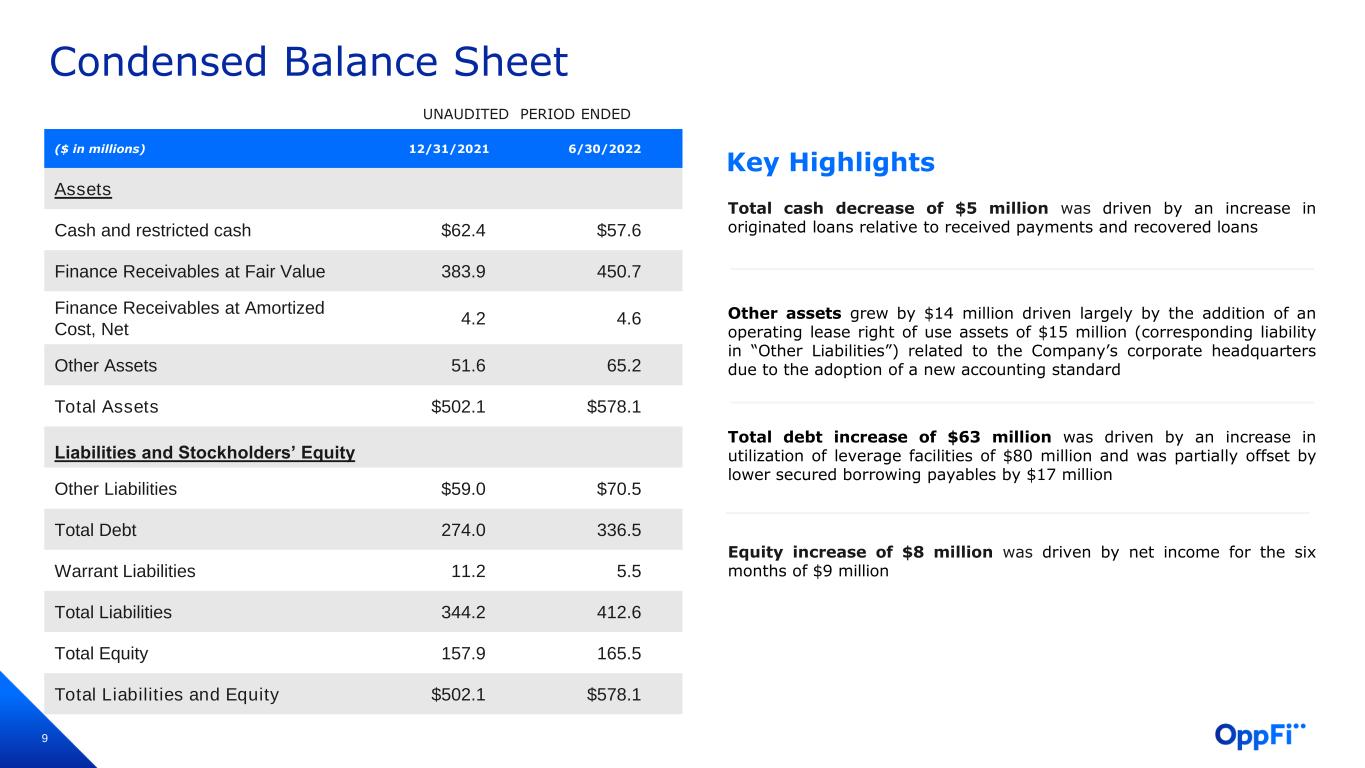
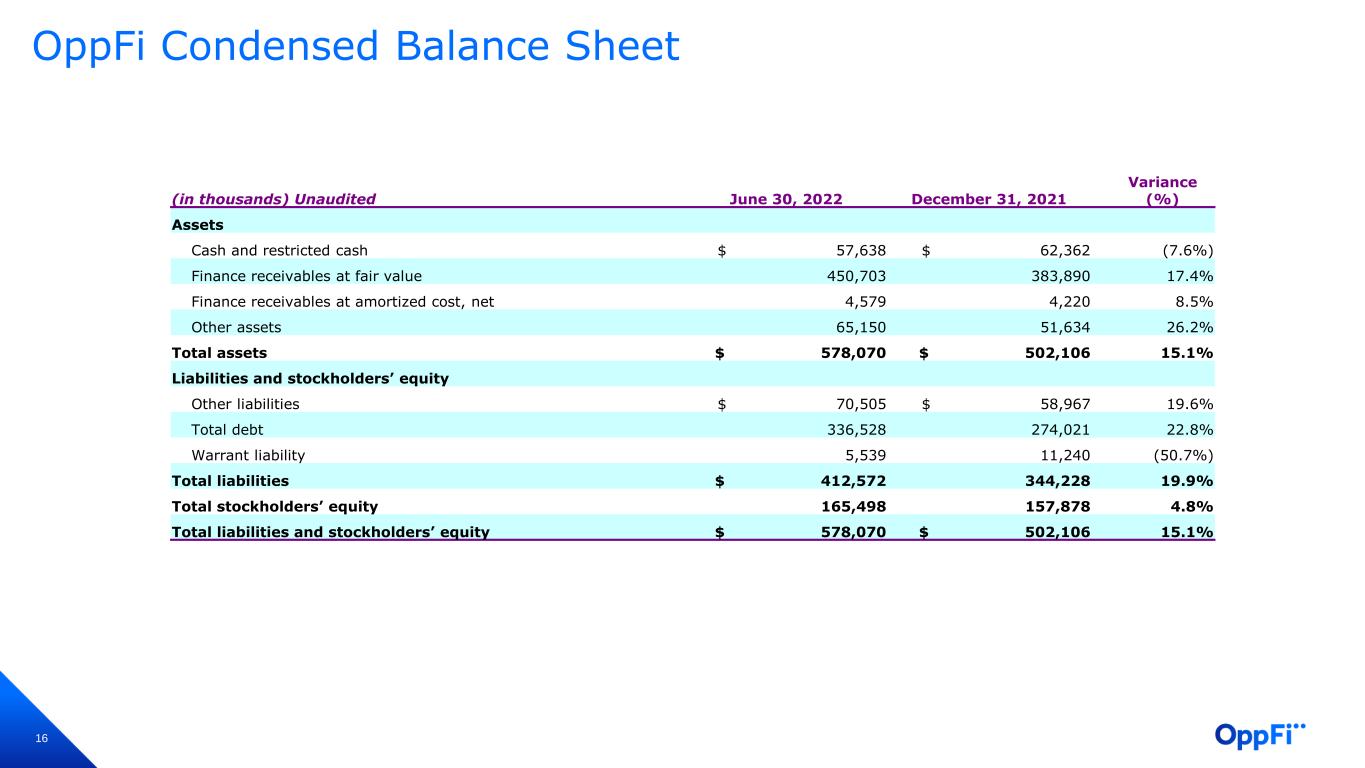
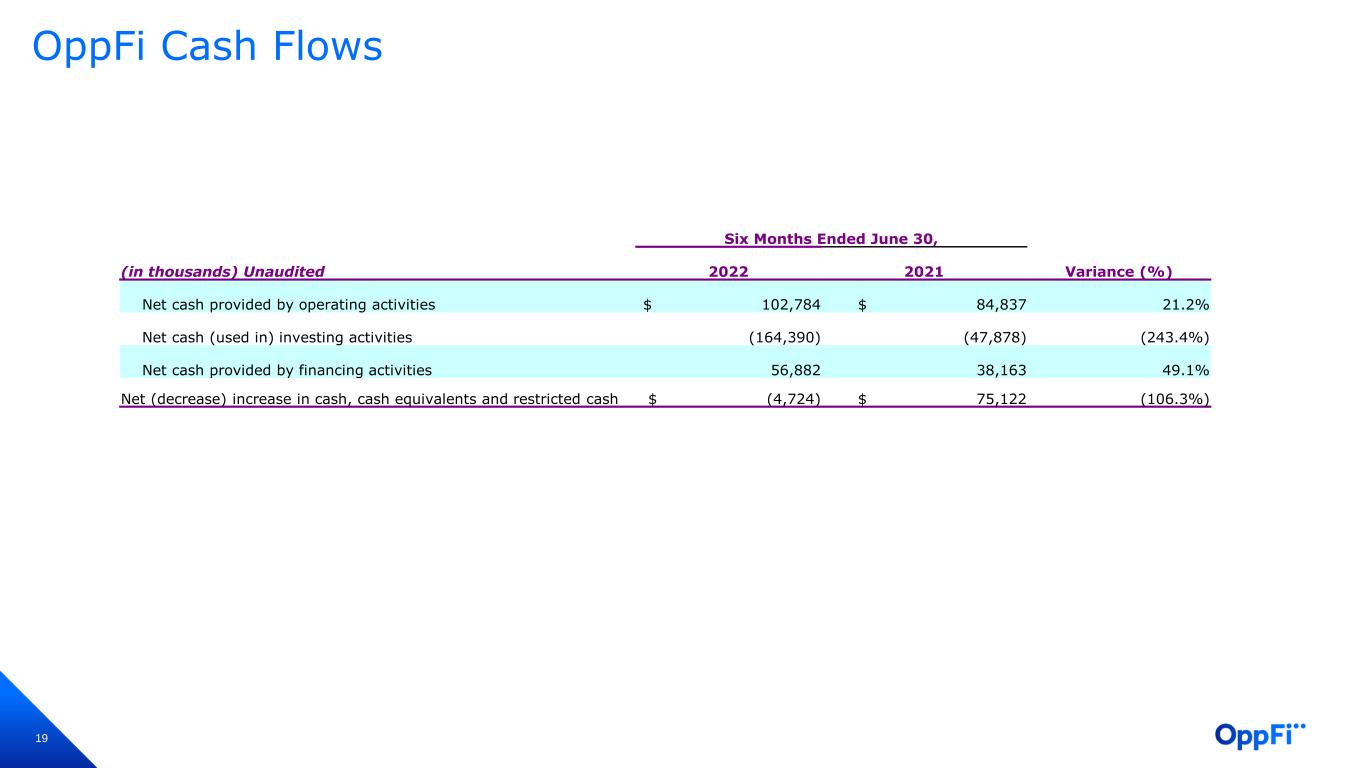
Provision for credit losses on �nance receivables     (1,026)     (38)     (988)   2600.0% Change in fair value of �nance receivables     (91,679)     (33,695)     (57,984)   172.1% Net revenue     115,880      128,900      (13,020)   (10.1)% Expenses:             —    —% Sales and marketing     31,394      19,480      11,914    61.2% Customer operations     20,881      19,485      1,396    7.2% Technology, products, and analytics     16,523      12,340      4,183    33.9% General, administrative, and other     27,515      24,231      3,284    13.6% Total expenses before interest expense     96,313      75,536      20,777    27.5% Interest expense     15,326      10,993      4,333    39.4% Income from operations     4,241      42,371      (38,130)   (90.0)% Change in fair value of warrant liability     5,701      —      5,701    —% Income before income taxes     9,942      42,371      (32,429)   (76.5)% Provision for income taxes     742      —      742    —% Net income     9,200    $ 42,371    $ (33,171)   (78.3)% Less: net income attributable to noncontrolling interest     4,666              Net income attributable to OppFi Inc.   $ 4,534                                Earnings per share attributable to OppFi Inc.: (a)                 Earnings per common share:                 Basic   $ 0.33    $ —          Diluted   $ 0.10    $ —          Weighted average common shares outstanding:                 Basic    13,553,308      —          Diluted    84,377,754      —                            (a) For the periods prior to July 20, 2021, earnings per share was not calculated, as net income prior to the Business Combination was attributable entirely to OppFi-LLC. Condensed Balance Sheets Comparison of the periods ended June 30, 2022 and December 31, 2021 (in thousands) Unaudited   June 30, 2022   December 31, 2021 Assets         Cash and restricted cash   $ 57,638  $ 62,362 Finance receivables at fair value     450,703    383,890 Finance receivables at amortized cost, net     4,579    4,220 Other assets     65,150    51,634 Total assets   $ 578,070  $ 502,106 Liabilities and stockholders’ equity         Other liabilities   $ 70,505  $ 58,967 Total debt     336,528    274,021 Warrant liabilities     5,539    11,240 Total liabilities     412,572    344,228 Total stockholders’ equity     165,498    157,878 Total liabilities and stockholders' equity   $ 578,070  $ 502,106 Total cash and restricted cash decreased by $4.7 million as of June 30, 2022 compared to December 31, 2021, driven by an increase in originated loans relative to received payments and recovered loans. The net cash used in investing activities was partially o�set by net advances of senior debt and cash from operating activities. Finance receivables as of June 30, 2022 increased compared to December 31, 2021 due to high demand and origination volume for the six months ended June 30, 2022. Other assets as of June 30, 2022 increased by $13.5 million compared to December 31, 2021, driven by the addition of an operating lease right of use asset of $14.7 million related to the Company’s corporate headquarters due to the adoption of a new accounting standard, partially o�set by lower prepaid expenses by $1.8 million. Other liabilities increased by $11.5 million driven by the addition of an operating lease liability of $17.3 million and 7
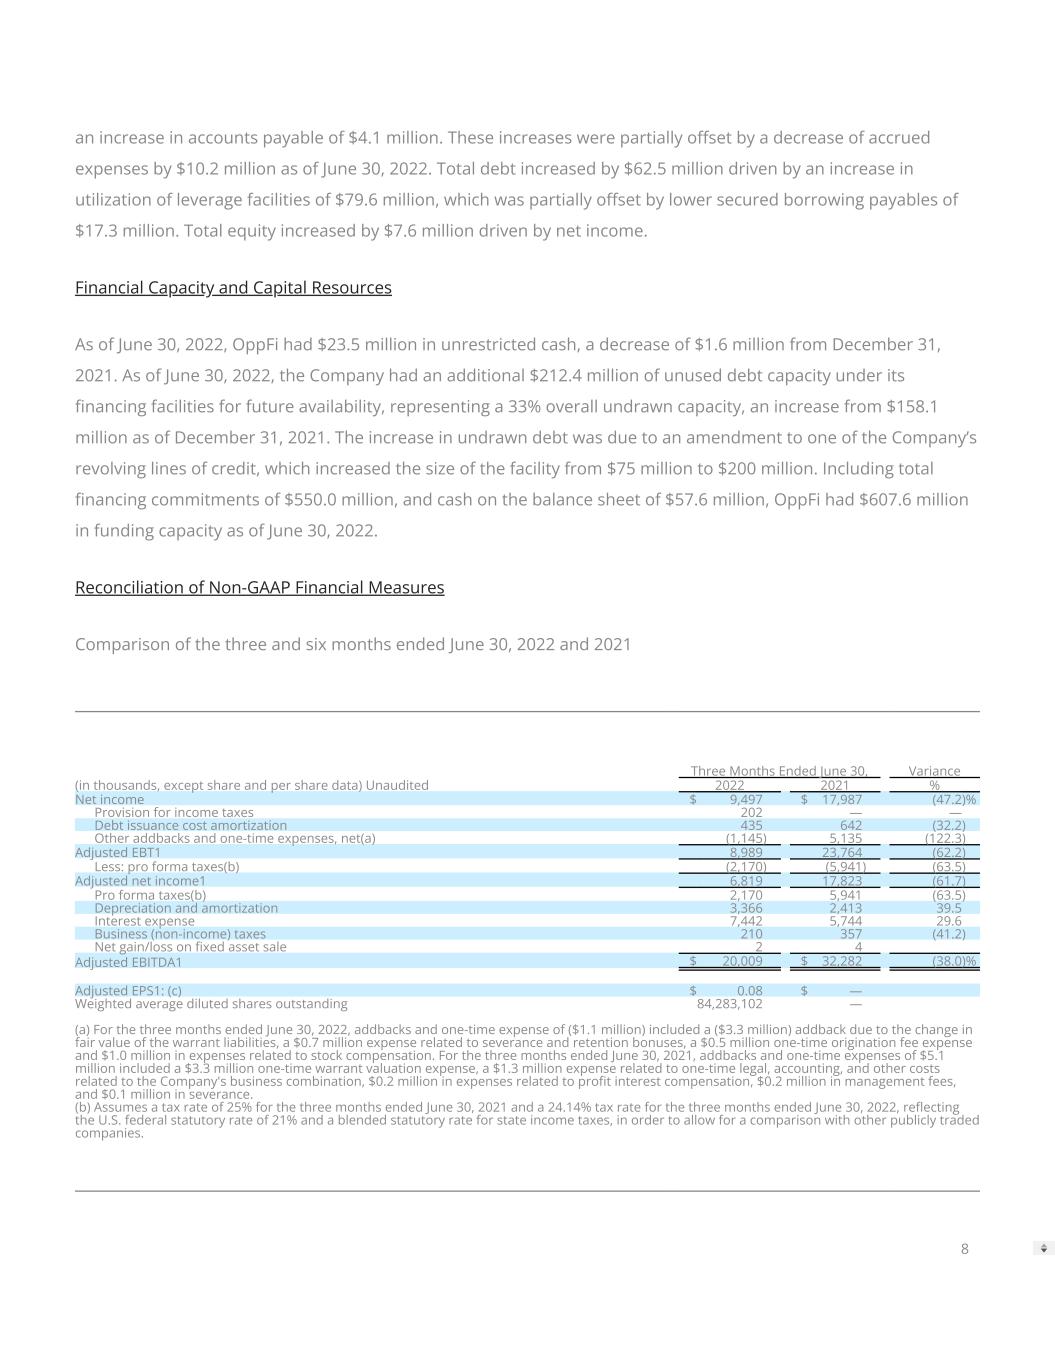

 
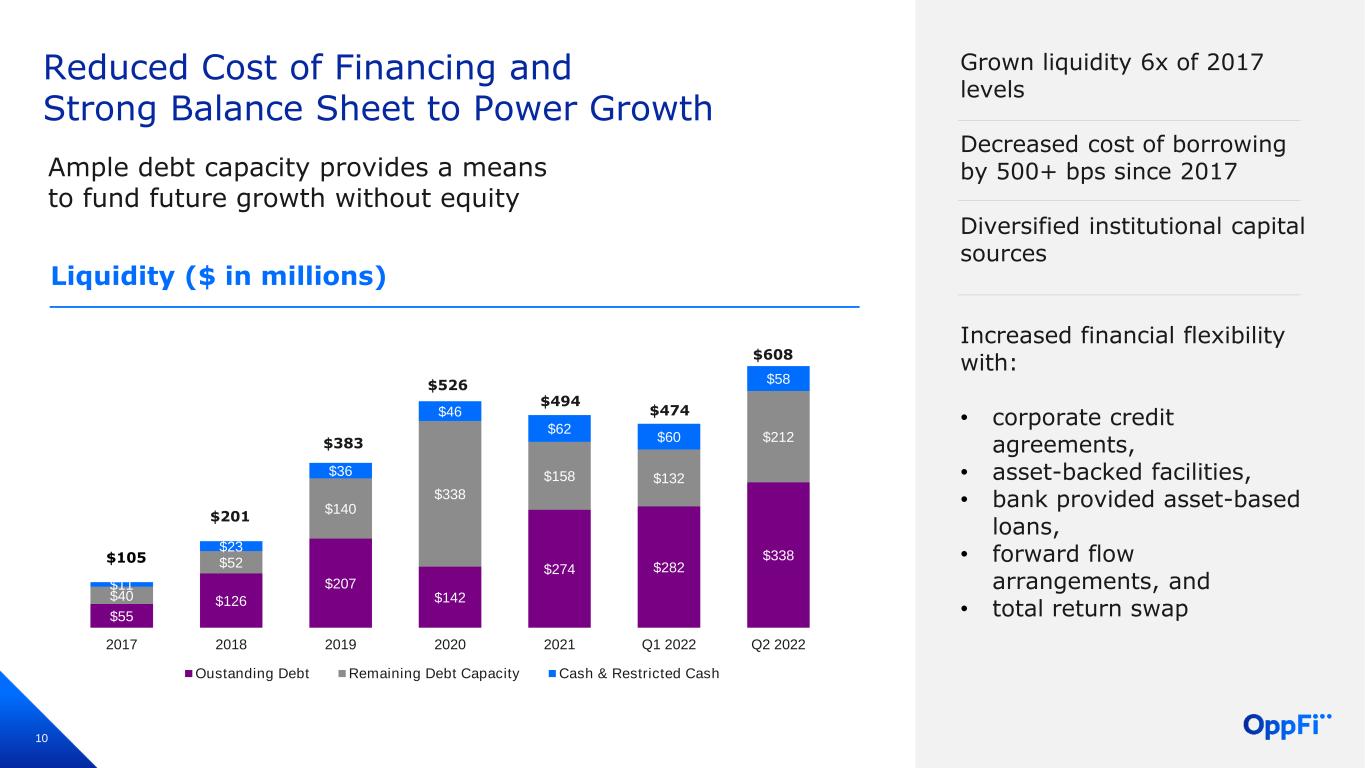
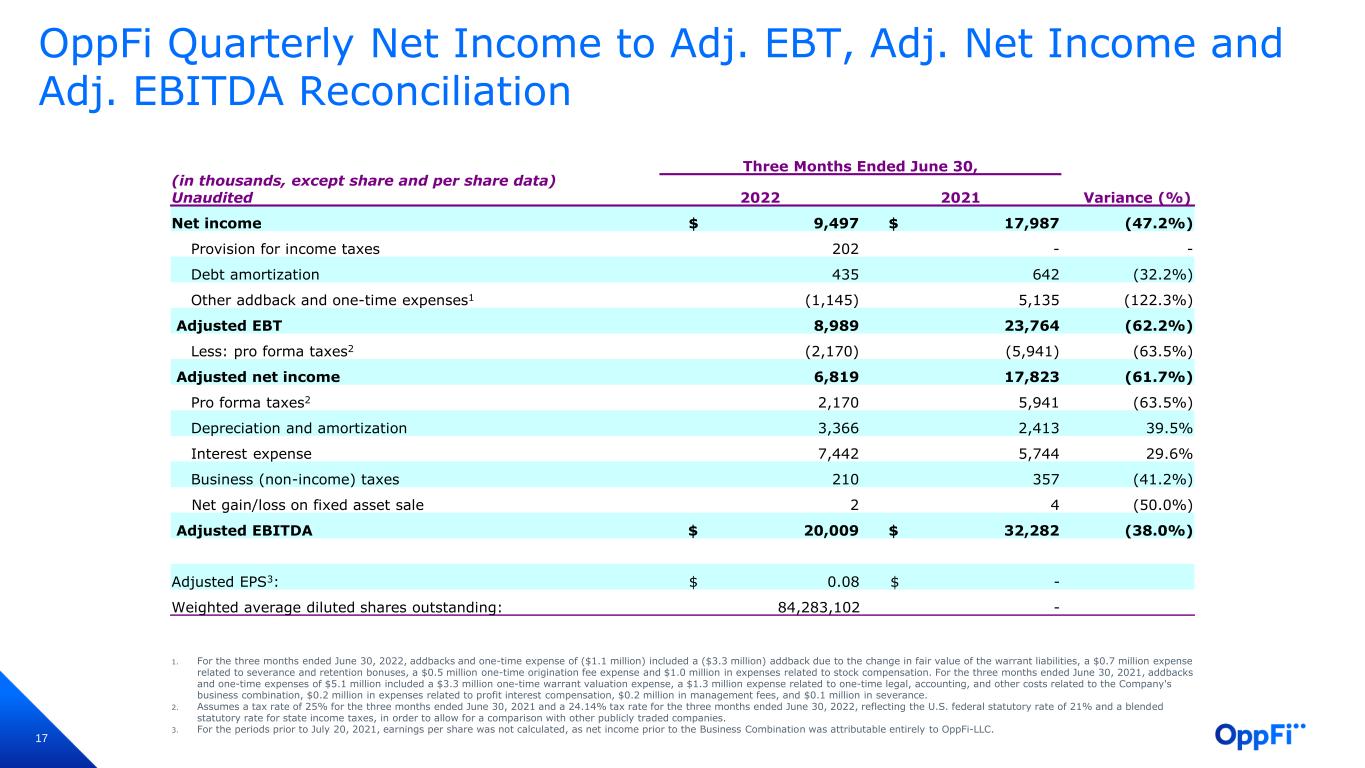
an increase in accounts payable of $4.1 million. These increases were partially o�set by a decrease of accrued expenses by $10.2 million as of June 30, 2022. Total debt increased by $62.5 million driven by an increase in utilization of leverage facilities of $79.6 million, which was partially o�set by lower secured borrowing payables of $17.3 million. Total equity increased by $7.6 million driven by net income. Financial Capacity and Capital Resources As of June 30, 2022, OppFi had $23.5 million in unrestricted cash, a decrease of $1.6 million from December 31, 2021. As of June 30, 2022, the Company had an additional $212.4 million of unused debt capacity under its �nancing facilities for future availability, representing a 33% overall undrawn capacity, an increase from $158.1 million as of December 31, 2021. The increase in undrawn debt was due to an amendment to one of the Company’s revolving lines of credit, which increased the size of the facility from $75 million to $200 million. Including total �nancing commitments of $550.0 million, and cash on the balance sheet of $57.6 million, OppFi had $607.6 million in funding capacity as of June 30, 2022. Reconciliation of Non-GAAP Financial Measures Comparison of the three and six months ended June 30, 2022 and 2021     Three Months Ended June 30,   Variance (in thousands, except share and per share data) Unaudited   2022   2021   % Net income   $ 9,497    $ 17,987    (47.2)% Provision for income taxes     202      —    —  Debt issuance cost amortization     435      642    (32.2) Other addbacks and one-time expenses, net(a)     (1,145)     5,135    (122.3) Adjusted EBT1     8,989      23,764    (62.2) Less: pro forma taxes(b)     (2,170)     (5,941)   (63.5) Adjusted net income1     6,819      17,823    (61.7) Pro forma taxes(b)     2,170      5,941    (63.5) Depreciation and amortization     3,366      2,413    39.5  Interest expense     7,442      5,744    29.6  Business (non-income) taxes     210      357    (41.2) Net gain/loss on �xed asset sale     2      4      Adjusted EBITDA1   $ 20,009    $ 32,282    (38.0)%               Adjusted EPS1: (c)   $ 0.08    $ —      Weighted average diluted shares outstanding    84,283,102      —                    (a) For the three months ended June 30, 2022, addbacks and one-time expense of ($1.1 million) included a ($3.3 million) addback due to the change in fair value of the warrant liabilities, a $0.7 million expense related to severance and retention bonuses, a $0.5 million one-time origination fee expense and $1.0 million in expenses related to stock compensation. For the three months ended June 30, 2021, addbacks and one-time expenses of $5.1 million included a $3.3 million one-time warrant valuation expense, a $1.3 million expense related to one-time legal, accounting, and other costs related to the Company's business combination, $0.2 million in expenses related to pro�t interest compensation, $0.2 million in management fees, and $0.1 million in severance. (b) Assumes a tax rate of 25% for the three months ended June 30, 2021 and a 24.14% tax rate for the three months ended June 30, 2022, re�ecting the U.S. federal statutory rate of 21% and a blended statutory rate for state income taxes, in order to allow for a comparison with other publicly traded companies. 8
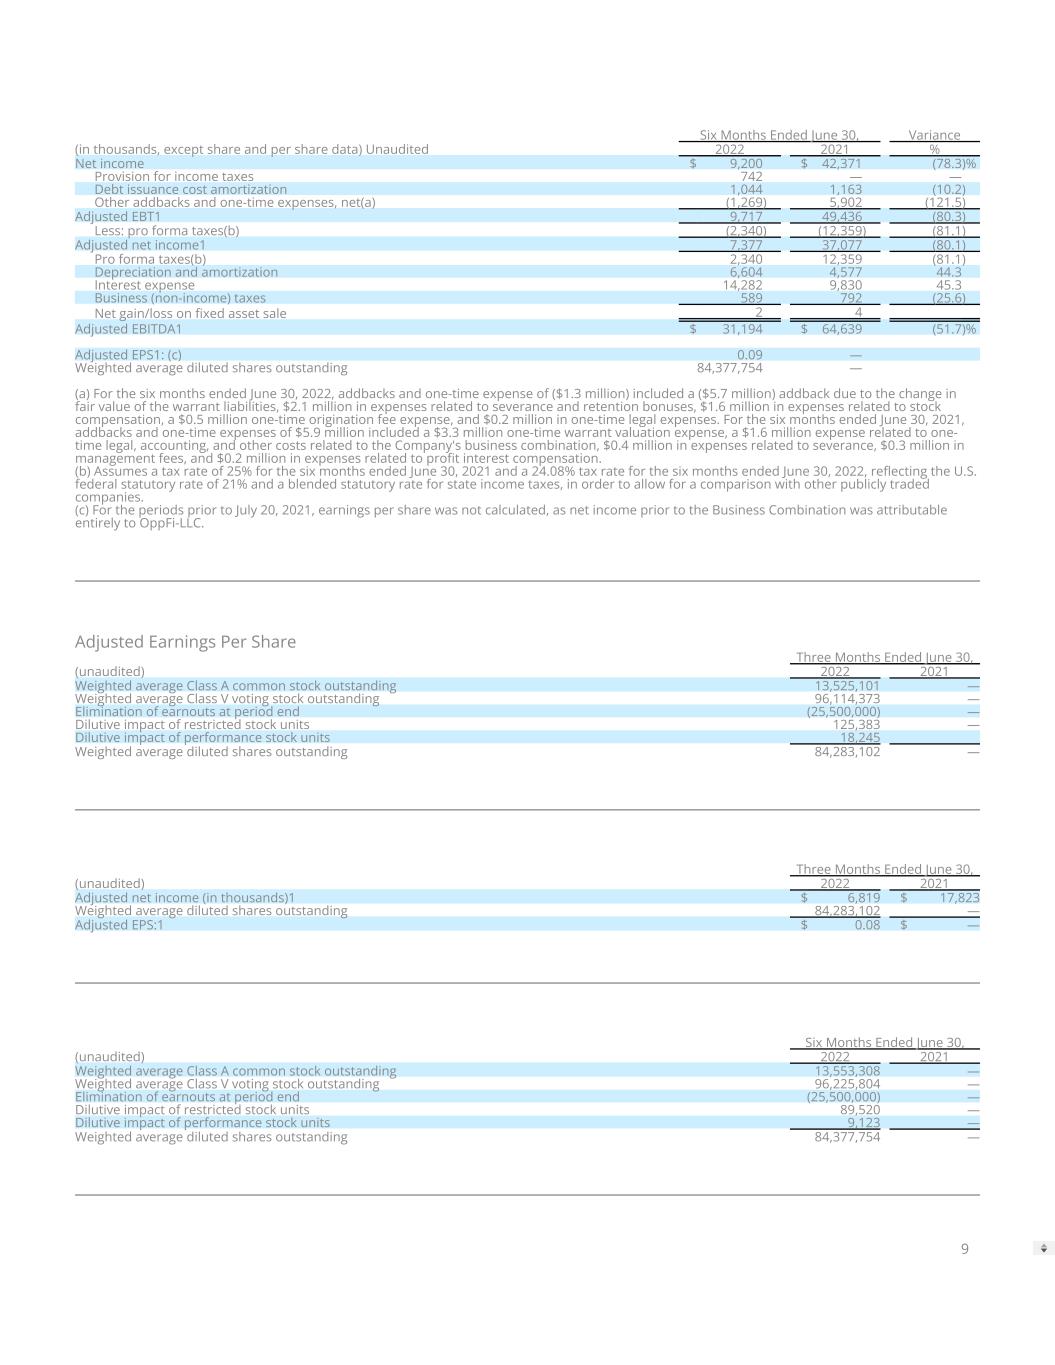

 
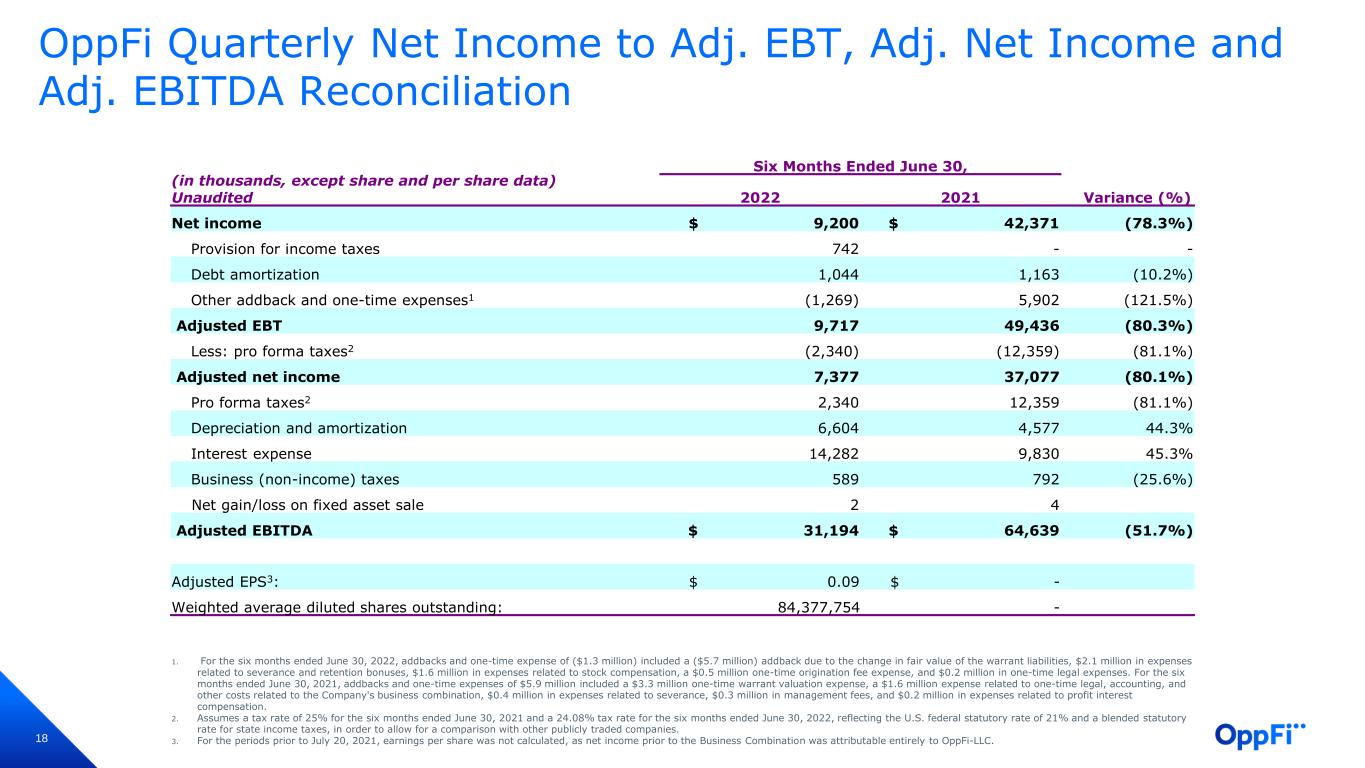
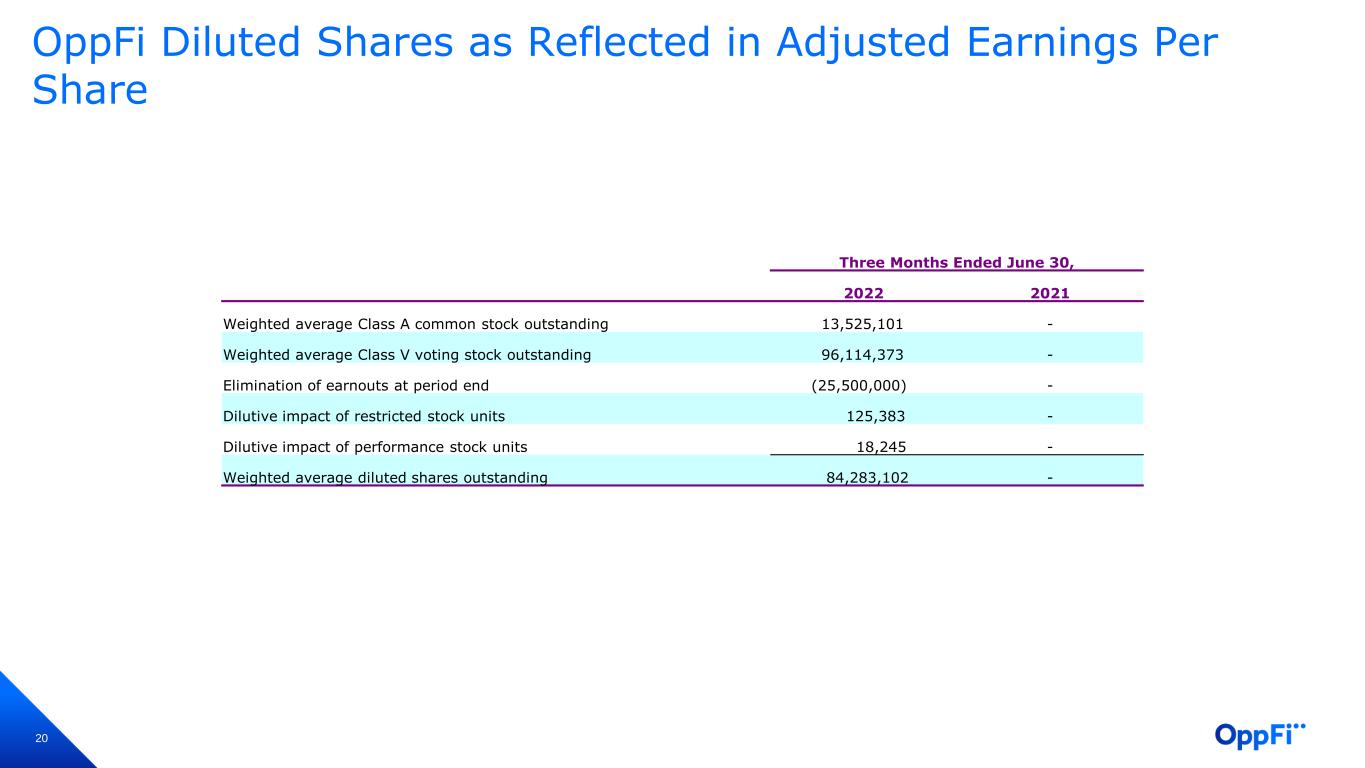
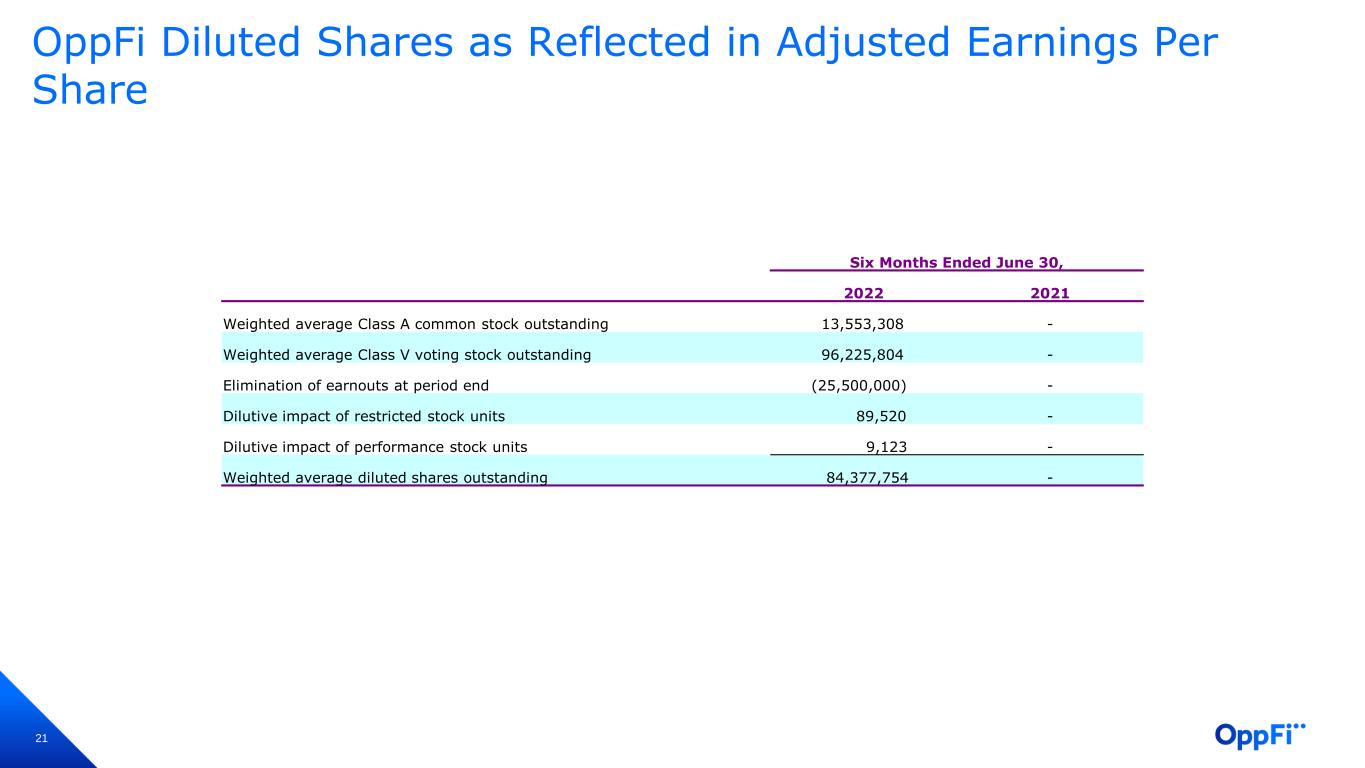
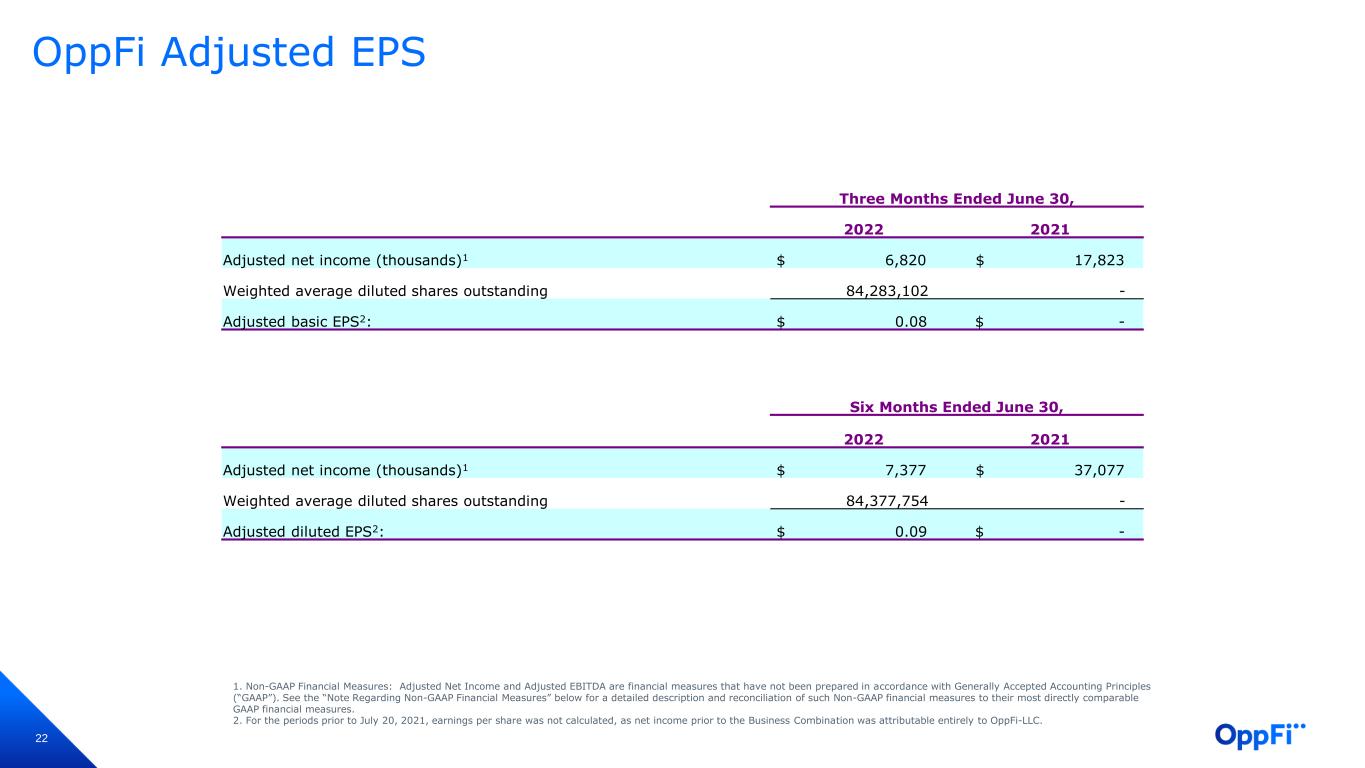
    Six Months Ended June 30,   Variance (in thousands, except share and per share data) Unaudited   2022   2021   % Net income   $ 9,200    $ 42,371    (78.3)% Provision for income taxes     742      —    —  Debt issuance cost amortization     1,044      1,163    (10.2) Other addbacks and one-time expenses, net(a)     (1,269)     5,902    (121.5) Adjusted EBT1     9,717      49,436    (80.3) Less: pro forma taxes(b)     (2,340)     (12,359)   (81.1) Adjusted net income1     7,377      37,077    (80.1) Pro forma taxes(b)     2,340      12,359    (81.1) Depreciation and amortization     6,604      4,577    44.3  Interest expense     14,282      9,830    45.3  Business (non-income) taxes     589      792    (25.6) Net gain/loss on �xed asset sale     2      4      Adjusted EBITDA1   $ 31,194    $ 64,639    (51.7)%               Adjusted EPS1: (c)     0.09      —      Weighted average diluted shares outstanding   84,377,754    —        (a) For the six months ended June 30, 2022, addbacks and one-time expense of ($1.3 million) included a ($5.7 million) addback due to the change in fair value of the warrant liabilities, $2.1 million in expenses related to severance and retention bonuses, $1.6 million in expenses related to stock compensation, a $0.5 million one-time origination fee expense, and $0.2 million in one-time legal expenses. For the six months ended June 30, 2021, addbacks and one-time expenses of $5.9 million included a $3.3 million one-time warrant valuation expense, a $1.6 million expense related to one- time legal, accounting, and other costs related to the Company's business combination, $0.4 million in expenses related to severance, $0.3 million in management fees, and $0.2 million in expenses related to pro�t interest compensation. (b) Assumes a tax rate of 25% for the six months ended June 30, 2021 and a 24.08% tax rate for the six months ended June 30, 2022, re�ecting the U.S. federal statutory rate of 21% and a blended statutory rate for state income taxes, in order to allow for a comparison with other publicly traded companies. (c) For the periods prior to July 20, 2021, earnings per share was not calculated, as net income prior to the Business Combination was attributable entirely to OppFi-LLC. Adjusted Earnings Per Share   Three Months Ended June 30, (unaudited) 2022   2021 Weighted average Class A common stock outstanding 13,525,101  — Weighted average Class V voting stock outstanding 96,114,373  — Elimination of earnouts at period end (25,500,000)  — Dilutive impact of restricted stock units 125,383  — Dilutive impact of performance stock units 18,245    Weighted average diluted shares outstanding 84,283,102  —   Three Months Ended June 30, (unaudited) 2022   2021 Adjusted net income (in thousands)1 $ 6,819  $ 17,823 Weighted average diluted shares outstanding   84,283,102    — Adjusted EPS:1 $ 0.08  $ —   Six Months Ended June 30, (unaudited) 2022   2021 Weighted average Class A common stock outstanding 13,553,308  — Weighted average Class V voting stock outstanding 96,225,804  — Elimination of earnouts at period end (25,500,000)  — Dilutive impact of restricted stock units 89,520  — Dilutive impact of performance stock units 9,123  — Weighted average diluted shares outstanding 84,377,754  — 9
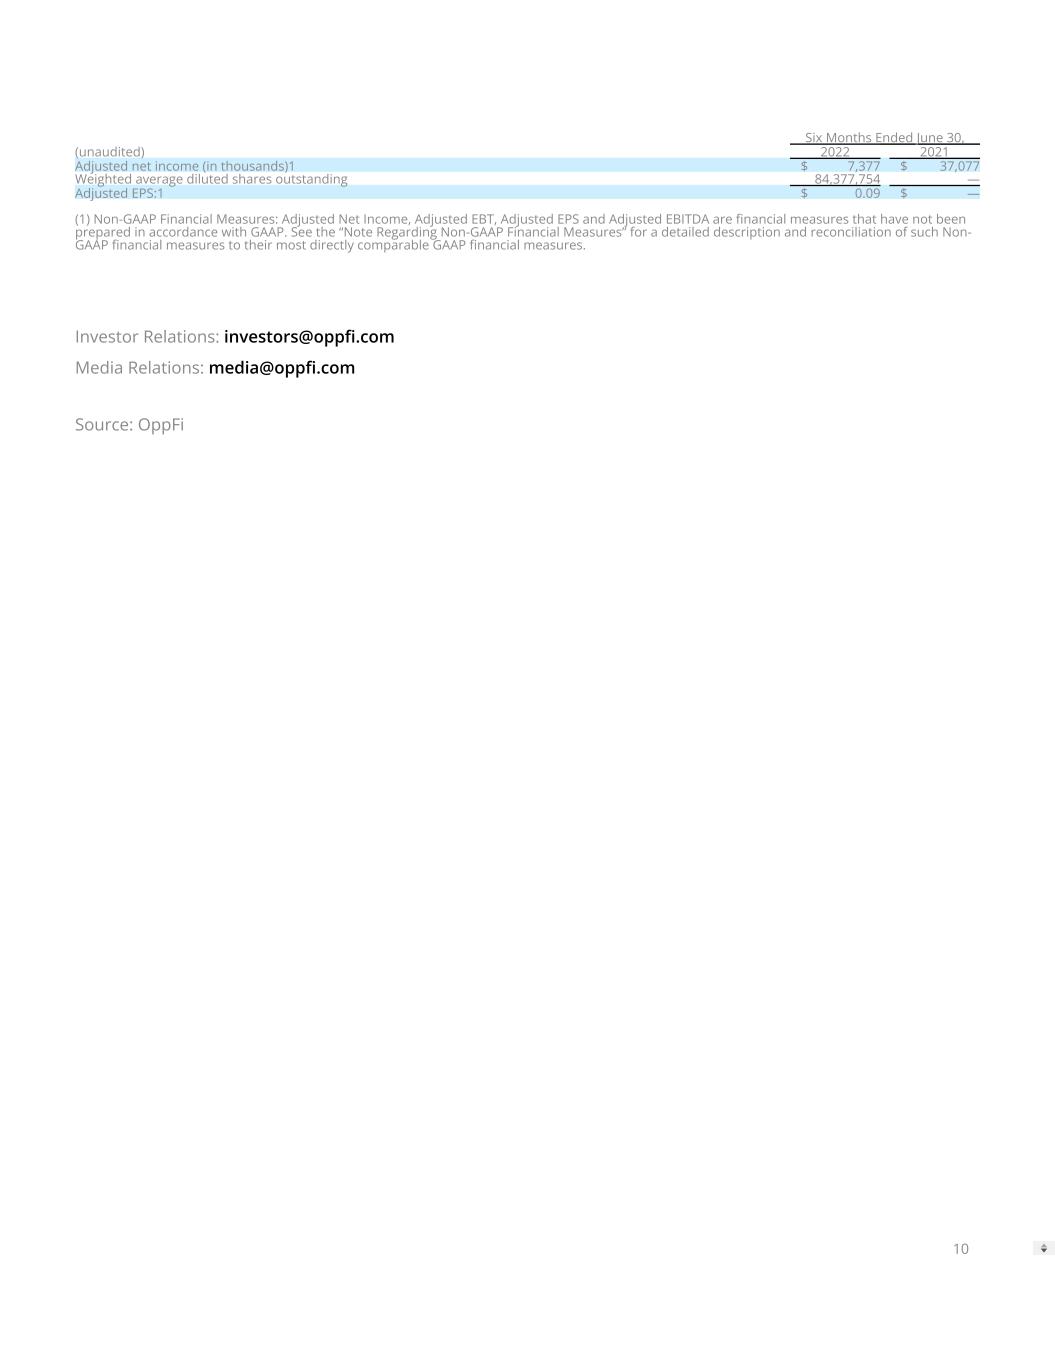

 
  Six Months Ended June 30, (unaudited) 2022   2021 Adjusted net income (in thousands)1 $ 7,377  $ 37,077 Weighted average diluted shares outstanding   84,377,754    — Adjusted EPS:1 $ 0.09  $ —   (1) Non-GAAP Financial Measures: Adjusted Net Income, Adjusted EBT, Adjusted EPS and Adjusted EBITDA are �nancial measures that have not been prepared in accordance with GAAP. See the “Note Regarding Non-GAAP Financial Measures” for a detailed description and reconciliation of such Non- GAAP �nancial measures to their most directly comparable GAAP �nancial measures.   Investor Relations: investors@opp�.com Media Relations: media@opp�.com Source: OppFi 10
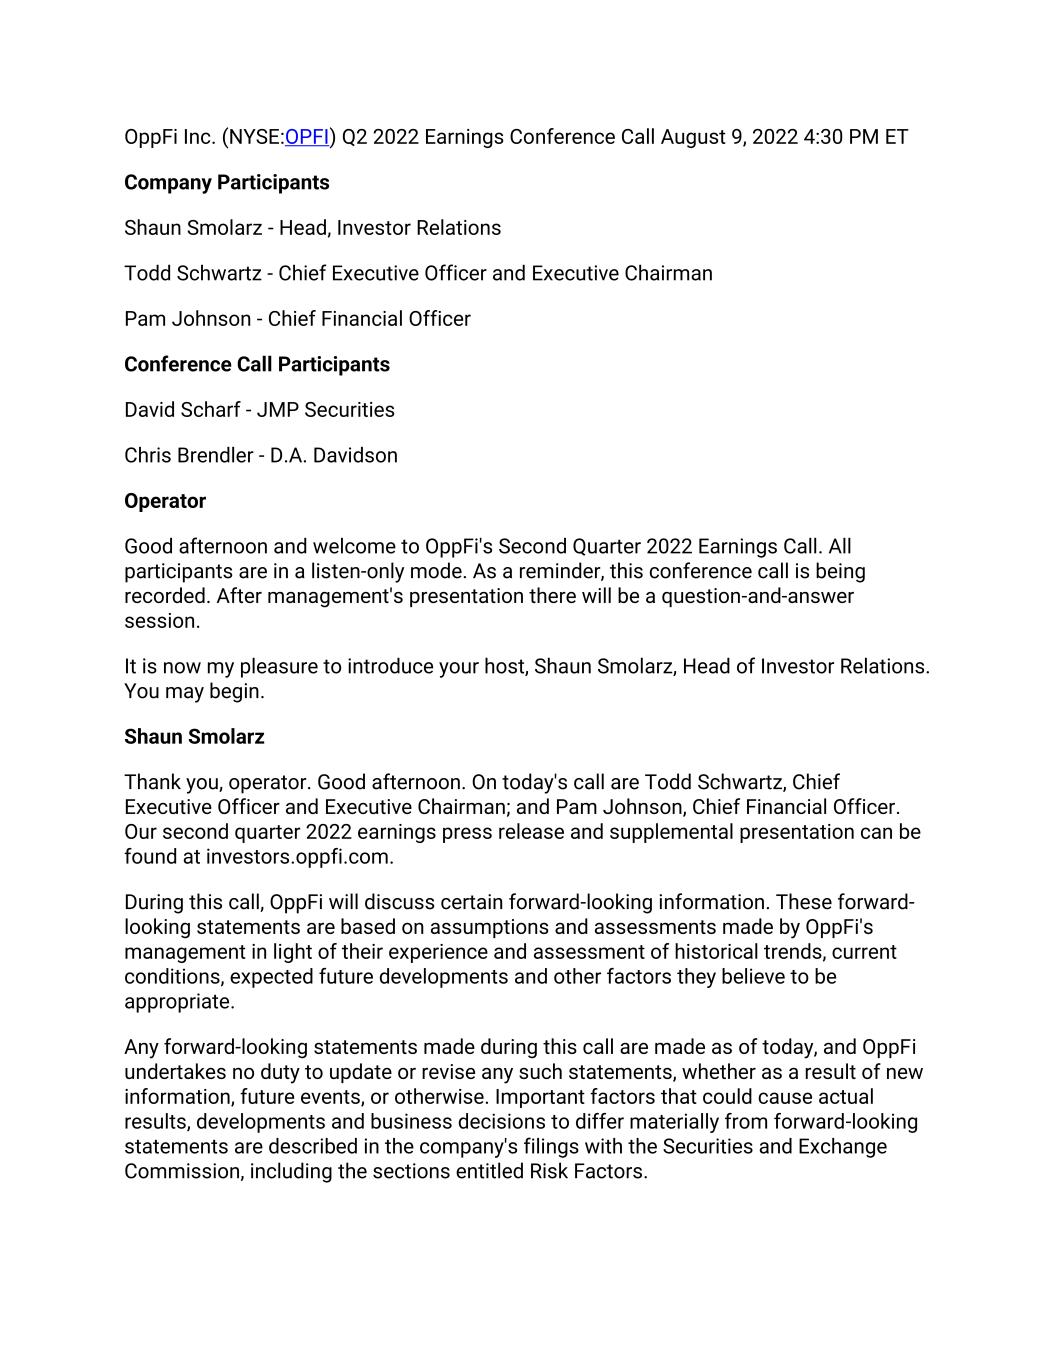

 
OppFi Inc. (NYSE:OPFI) Q2 2022 Earnings Conference Call August 9, 2022 4:30 PM ET Company Participants Shaun Smolarz - Head, Investor Relations Todd Schwartz - Chief Executive Officer and Executive Chairman Pam Johnson - Chief Financial Officer Conference Call Participants David Scharf - JMP Securities Chris Brendler - D.A. Davidson Operator Good afternoon and welcome to OppFi's Second Quarter 2022 Earnings Call. All participants are in a listen-only mode. As a reminder, this conference call is being recorded. After management's presentation there will be a question-and-answer session. It is now my pleasure to introduce your host, Shaun Smolarz, Head of Investor Relations. You may begin. Shaun Smolarz Thank you, operator. Good afternoon. On today's call are Todd Schwartz, Chief Executive Officer and Executive Chairman; and Pam Johnson, Chief Financial Officer. Our second quarter 2022 earnings press release and supplemental presentation can be found at investors.oppfi.com. During this call, OppFi will discuss certain forward-looking information. These forward- looking statements are based on assumptions and assessments made by OppFi's management in light of their experience and assessment of historical trends, current conditions, expected future developments and other factors they believe to be appropriate. Any forward-looking statements made during this call are made as of today, and OppFi undertakes no duty to update or revise any such statements, whether as a result of new information, future events, or otherwise. Important factors that could cause actual results, developments and business decisions to differ materially from forward-looking statements are described in the company's filings with the Securities and Exchange Commission, including the sections entitled Risk Factors.


In today's remarks by management, the company will discuss non-GAAP financial metrics. A reconciliation of these non-GAAP financial measures to the most comparable GAAP measures can be found in the earnings press release issued earlier this morning. This call is being webcast live and will be available for replay on our website. I would now like to turn the call over to Todd. Todd Schwartz Thanks, Shaun, and good afternoon, everyone. I’d like to cover three topics today, including the key financial and operational highlights from our solid second quarter, our view on the macroeconomic environment and its impact on our customers, and provide a quick update on strategic initiatives underway that are designed to position us for success in 2023 and beyond. We are pleased with our financial and operational performance for the second quarter relative to our expectations. Continued strong customer demand led to a 57% year-over- year increase in originations. Marketing cost per funded loan dropped by 16% year-over- year to $206. The auto approval rate increased by 12 percentage points year-over-year to 62%. We reduced our operating expenses, excluding interest expense, add backs and one-time items as a percentage of total revenue by 3 percentage points as a direct result of initiatives we launched in the first half of the year. We also upsized one of our credit facilities, resulting in over 600 million of current funding capacity. And maintain a customer NPS score above 80 points. With regards to the macroeconomic environment, it is clear to us that the 40-year high inflation is having a negative impact on our customers. Our average customer is employed, college educated, earns middle household income and has minimal savings. The increased price of everyday necessities like gasoline, groceries, and home utilities has crunched these customers and their ability to service debt despite the strong labor market. We originally expected that inflation would be transitory in-line with previous economists' predictions. However, as we can see now, inflation has persisted well beyond our expectation. In early May, we started to see the effects of inflation on credit performance, both in new loans, as well as older vintage refinance loans that were originated during last year's growth base. In response, credit models were swiftly adjusted in May and again in July to target higher performing customers as inflation began accelerating. These measures represent the most significant credit adjustments in our company's history. As a result, the credit profile of new loans being funded through our platform has improved greatly


since implementing these changes. We are encouraged to see continued strong demand for our product amongst these higher quality borrowers. Going forward, we will continue to diligently monitor macroeconomic changes and their impact on our customers and take action accordingly. Even with these credit tightening measures, our profitability in the second half of this year will be impacted by the delinquencies and charge-offs of loans originated with the previous credit model in the first half of this year. As a reminder, loans that charge-off in a given quarter are generally originated in the prior two quarters. We now believe these loans from previous credit model will charge- off at higher rates than initially expected, resulting in breakeven on an adjusted basis or a modest adjusted net loss for the full-year. Despite our disappointment about the second half, we are confident that the lower risk receivables base we anticipate at the end of 2022 will perform very well in 2023. In addition to the credit measures I've described, we're taking additional measures in marketing and operations that we expect will further position us for success in 2023 and beyond. Shifting to our marketing efficiency initiatives, we believe there are significant opportunities to continue lowering our cost per newly funded loan. We are optimizing our partnered channels by removing higher cost, lower quality partners, and expanding higher quality ones. We have also taken steps to improve efficiency in direct mail and have seen significant reductions in cost per funded loan in this channel in Q2. Within operations, we have implemented a number of enhancements to reduce delinquency and promote payments by redesigning our customer portal with more capabilities and payment options. In addition, during the second half of this year, we are initiating new partnership models to provide financial health resources to our customers, as well as testing new programs to help customers make affordable payments, avoid charge-offs and minimize adverse credit score impacts. Before I close my prepared remarks, I wanted to also highlight as previously disclosed that my family and I purchased $1.9 million of class A common stock at an average price of [$3.13] [ph] during the most recent open trading window. We are prepared to continue supporting OppFi shares when we see that the share price is disconnected from long-term fundamentals. While we are facing credit headwinds and the effects of the macroeconomic environment, we view these challenges as temporary speed bump that we are able to navigate. We are confident that the actions we are taking will improve our performance in 2023 and make the company stronger than ever. With that, I'll turn the call over to Pam to review our second quarter results and updated guidance.


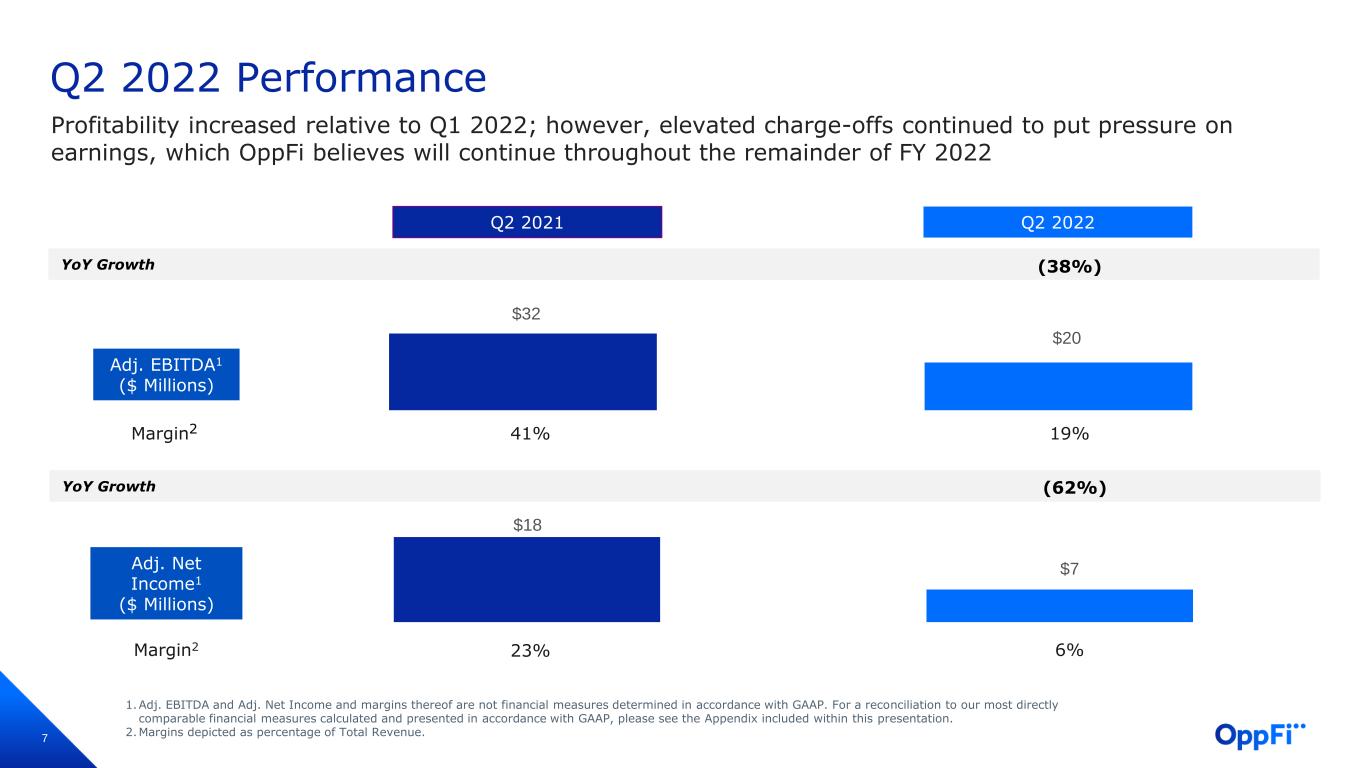
Pam Johnson Thanks, Todd, and good afternoon, everyone. Turning now to our second quarter results. Total revenue increased 38% year-over-year to $108 million. We achieved a 57% year-over-year increase in originations to $226 million, while lowering our marketing costs per new funded loan by [15%] [ph] or $39 to $206 compared to the prior year period. Origination growth was driven by increased demand resulting in higher application volume and an increase in the funded rate defined as funded loans over qualified apps. Our more efficient marketing results reflect continued strategic growth in lower cost marketing channels such as email referrals and search engine optimization, as well as lower and more efficient spending on direct mail and higher customer conversion rates. Total net originations of new loans as a percentage of total loans increased to 56%, up over 14 percentage points from the second quarter of last year. In addition, our investments in automation resulted in the auto approval rate increasing 12 percentage points year-over-year to 62%. The annualized net charge-off rate as a percentage of average receivables was 51% for the second quarter of 2022 versus 56% for the first quarter of 2022 and 28% for the prior year quarter. The year-over-year increase reflects credit trends worse than pre- pandemic levels. Turning to expenses, operating expenses for the second quarter, excluding interest expense, as well as add backs and one-time items increased 30% to 49 million or 45% of total revenue from $38 million or 48% of total revenue in the prior year period. These expenses increased due primarily to higher marketing cost fund originations, more investments in technology, and greater professional fees. While the amount of expenses increased, expenses declined as a percentage of our total revenue as a result of lower marketing costs per new funded loan, as well as operational cost efficiency initiatives implemented earlier this year. Adjusted EBITDA totaled $20 million for the quarter, down from $32 million versus the prior year quarter as higher revenues were more than offset by elevated charge-offs and increased operating expenses. As expected, our adjusted EBITDA mark compressed to 19%, compared to 41% in the year ago period. Interest expense for the second quarter totaled $8 million or 7% of total revenue, compared to $6 million or 8% of total revenue in the year ago period. We generated adjusted net income of $7 million for the second quarter, compared to $18 million for the comparable period last year. As of June 30, 2022, OppFi had 84.3 million weighted average diluted shares outstanding, excluding 25.5 million earn out shares. Adjusted earnings for the second quarter were $0.08 per share. Our balance sheet remains healthy with cash, cash


equivalents, and restricted cash of $58 million, total debt of $337 million, gross receivables of $402 million and equity of $166 million. We have ample liquidity available to support our future growth plans with $608 million in total funding capacity. In June, we announced that we more than doubled one of our credit facilities with Atalaya to $200 million from $75 million. We utilized part of this upsize into refinance debt tied to one of our other credit facilities. During the second quarter, we repurchased approximately 330,000 shares of Class A Common Stock for $1.1 million at an average of $3.31 per share. During the first half of 2022, we repurchased approximately 616,000 shares at an average $3.48 per share for a total of $2.1 million. Turning to our full-year outlook, given limited visibility and uncertainty considering the current macroeconomic environment, we are reiterating total revenue guidance of 20% to 25% growth year-over-year, maintaining guidance for operating expenses as a percentage of total revenue of 43% to 47%, excluding interest expense, add backs and one-time items, and the revising adjusted net income expectations downward. We now expect to breakeven on an adjusted basis or reported modest adjusted net loss for the full-year, due to persistent high inflation that caused significant credit deterioration in the latter half of the second quarter and early third quarter. We anticipate the net charge-off rate to increase in the third and fourth quarters as older vintage loans are charged-off during those periods. While we anticipate having a more specific update for our full-year expectation when we report third quarter results, for now we are withdrawing our previously issued guidance for metrics, other than the total revenue growth and operating expenses the percentage of total revenue. Notwithstanding this revised outlook for 2022, we remain very optimistic about 2023. We expect to exit 2022 with a healthy portfolio, given the significantly tightened credit model and run-off of the higher risk loans from the first half of this year. With that, we would now like to turn the call over to the operator for Q&A. Operator? Question-and-Answer Session Thank you. [Operator Instructions] And our first question comes from David Scharf from JMP Securities. Please go ahead, David. Q - David Scharf Great. Thank you. Hi, Todd and Pam. Thanks for taking my questions. Hey, not surprisingly, wanted to follow-up on the commentary regarding the credit outlook and macro trends? And first off, I'm wondering, Todd, this kind of the tail end of a reporting season in which we've heard a pretty broad spectrum of commentary from a lot of different subprime lenders about the impacts of inflation and other factors. Some have


been, sort of pretty benign, others less so. Your commentary is probably among the most pronounced and definitive. At this point, are you confident that it's strictly inflationary pressures or do you think there are potentially other factors that are impacting consumer payment patterns? Todd Schwartz Yes. Thanks, David. That's a good question. I think if you look at last year, we had thought that we've gotten through most of the – I had mentioned that on the first quarter call, some of the originations we had made in the holiday season that were a little higher risk with different channel partners. As those flow through the buckets, we have a forecast and we [indiscernible] that forecast significantly at the beginning of the year, but when you have an existing book of business that's on your books, deteriorate in a very quick period of time, right, like it all happened pretty much around the May timeframe in a three-week period where we saw significant deterioration quickly, it then subsided and has stayed pretty stable, but we're being very conservative in our forecast. We've tightened significantly and obviously that's going to sacrifice profitability this year, but we're not playing for a quarter or two quarters. We're playing to build the best business we can over the long-term. So, anything we're doing now that may have shortsighted impact on the adjusted net income is going to help us in 2023 by having higher quality receivables, and we're also – Pam and I talked about it, our acquisition cost and growth is there. So, we have the growth and the acquisition cost. And so, the new loans have not been necessarily the issue. Those have been coming down in-line with the plan and continuing to get better as the months have gone on. We've really seen a quick rise and I think in May is really when the consumer started feeling it the hardest. That's when inflation might have peaked at 9.1% and we definitely were in a recession at that point. And we've done some interviews with our customers and surveys and it's just at the end of the day prioritization of payments on our customers. They got to pay for food, groceries, housing, and kids and stuff like that. And so, I think customers were stretched, but we feel really good that we're making all the right moves and that things are starting to get better. Right now we're seeing a lot of improvement and we're feeling good and cautiously optimistic as I guess where we're at. And some of the things David that we're going to see in the economy like states are starting to issue direct stimulus payments to customers, that's encouraging. That's obvious a lot of the states that we arrange loans on behalf of our bank partners are eligible for those. And we really feel good about some of the redesigns of the payment portals that we have about giving customers more options for working out payments.


So, we're seeing a lot of positive things there and I feel really positive. It's just we had a little headwind there in the second quarter. So, ultimately though every other metric in the business is performing better than expected. David Scharf Got it, got it. And I appreciate the color. And then maybe just in a follow-up also related to credit. I'm not sure if this is an operational or a technology focused question, but we've obviously always looked at an increasing auto approval rate as always being a positive. And I'm wondering, as you think about some of the visibility challenges and tightening of underwriting, is it ever increasing auto approval rate something you kind of always want to see when credit might be? [Multiple Speakers] Todd Schwartz Yes. That's a good question. I mean, so really though, David, the underwriting process is the exact same for auto-approvals than it is for someone who calls in. The people that just means our technology is getting better. So, we're taking out bottlenecks in the underwriting process and making the technology better for the consumer so they can go through the application process and get credit decision without having to talk to someone. It does not mean we're loosening standards or changing our standards, just to be clear, when it comes to auto-approvals. David Scharf Got it. No, no, appreciate the clarification. Okay. Thank you. Operator Thank you. And we'll take our next question from Chris Brendler from D.A. Davidson. Please go ahead, Chris. Chris Brendler Hi, thanks. Good afternoon. Not surprisingly, I want to follow-up on the credit question as well. Just like as you went to the months, sort of starting in May, June, July into August, did it get worse? And is there any, sort of – can you stratify what's – where the issues might be from underwriting perspective? Is it just that lower end or is it certain income levels like what is giving you the comfort that some of the changes you've made are going to have an improvement here since we're still, kind of in the middle of this inflation picture? Todd Schwartz Yes. I mean, back to what I was saying with David. So, as you can tell, like after the first quarter earnings call, I was really bullish. I liked what I was seeing on the credit side. We


had a good second quarter. Our gross charges as a percentage came down quarter- over-quarter by 5% or 6% and we beat acquisition costs, we beat origination. So, all positive. Starting in May, we saw a pretty quick decline in our existing book, which would definitely lead to reduce profitability. And we made a significant tightening in the first week of May based on those early indicator signs, right. So, the year has kind of gone. It's been pretty volatile, but I think that the customers really started feeling inflationary pressure in May and even into June. And then in July, we made another significant – we actually made some tightening to our refinance population, which is pretty conservative to do considering those customers are definitely the lowest delinquency set of customers and the pay rates are much higher, but we just wanted to be conservative and make sure that this was not going to be something that we had to deal with in the second half of the year, and be conservative and kind of wait and see and be cautiously optimistic, but I think we're making all the right steps, as far as dealing with the spike in delinquency. I think what was surprising for – on our end was the speed, right, at which the deterioration kind of happened, so the [past due rate climbed] [ph] so significantly quickly, and we did everything we can, but on the new loan side, we feel really good. I mean, that's something we can control because there's not existing principle already on our books. So, when we evaluate new customers, we feel really good about the weighted average risk score is down 1.5 points or even higher, 1.6 points from last year, which is like a totally – is a huge significant shift and quality of new loans, kind of being added to the book right now. Some of the highest quality – our percentages of the lowest segments has increased significantly in dollars and percentage. And so, we feel really good about what we're originating now. I think the existing book and some of the pressures of the inflation and the environment, I think started to push the payment rates down a little and that's what we saw, but like I said, we've seen some stabilization here. We see things getting better and we're cautiously optimistic about getting some of this back in the second half. Chris Brendler Okay. I appreciate that. So, it doesn't sound like that the problems are still like from a macro perspective. I would have thought it like inflation would be a little bit issued first and then it would, sort of crescendo from there as it persisted, but it sounds like there was more of an immediate impact in May and then didn't necessarily get worse in July and August. If that's correct? And then also – I was going to say, [indiscernible] credit facility upsize was in June, so just maybe positioning the comments around the credit picture around that transaction was a really positive sign. Obviously, the lender there got comfortable with the trend through June, maybe just any update there on the timeline? Todd Schwartz


Yes, I mean, the thing is, we have great financing partners that we have had relationships with now for pretty much the existence of the business. And those relationships we've performed historically for them, we've been great partners. We were out ahead of this and we started tightening in November, originally started tightening in November of last year, tightening again in January, tightening again in May pretty significantly. So, I think our partners trust us and we have great relationships with them and so they believe in what we're doing. And that's been a real help for us as we continue to grow and expand and, kind of go through some of this volatility. Chris Brendler Okay. And then just the first part of the question, like the buckets where we're seeing this, like is there any sort of insight? And how have you tightened this as a matter of moving up among credit scores? And then one more if I could? The originations are actually much stronger than expected this quarter. So, is it really strong? Is it the demand? I would think is really high and competitive conditions have improved. So you can tighten and [indiscernible] your top line numbers? Todd Schwartz Yes. That is absolutely – so not only that, our acquisition cost has come down. We're achieving ahead of plan on that almost $40-plus year-over-year. I think there's even maybe potentially some room for improvement there through the rest of the demand continues to be some of the strongest demand we've seen, but you got to be careful, right? And so, we've opted to slow down that growth. We could be growing a lot faster, but we're still putting guidance in the 20% to 25% range and double down on quality here. So, what's happening is, we're seeing customers that the average credit score increased about 40 points over the 2020, 2021 pandemic. That's because people were not accessing credit. They weren't inquiring for credit. We saw, kind of, our addressable market strength. We're now seeing, kind of the reversal of some of that where we're starting to see high quality customers, kind of come back into our space and qualify for our products. So, like I said, we're originating the highest percentage and dollar amount of lower segment customers that we have probably since, kind of their early days of the business when we, kind of started to grow. So, feel really good about that. And I think everything we're doing on the recovery side, on the payment side to continue to support our customers that need to make partial payments or work with them through this tough time we're doing. And we're seeing great results, especially with some of the self-service stuff that we've implemented and done some big technology releases.


Another thing that we're doing that we've – some of the other lenders, I’ve seen have started using bank data. We've been using the bank data in our underwriting for the better part of seven or eight years now. So, we have incredible historical data. And so, we've completely kind of revamped the credit model to really, really focused on payment to income or issues. I think ability to pay in this environment is vital for to look at, especially when the customers are kind of dealing with a large, I think it's $9,000 to $10,000 of additional expenses per year. And so, there is some wage growth and we remain optimistic because unemployment remains low. And so that is the thing that gives us a lot of doing good about some of this, is that there is low unemployment and our credit model and the enhancements that we've made over the year appear to be working very favorably. Chris Brendler Okay, great. Thanks Todd. Operator [Operator Instructions] Okay. And there appear to be no further questions at this time. I'd like to turn the floor back over to Todd Schwartz for closing remarks. Todd Schwartz Okay. Thank you. Well, listen, thanks everyone for joining us today. We're confident in the changes we are making to set us up for return to profitability in 2023. We look forward to speaking with you again during our third quarter earnings conference call in November. Thank you. Operator Thank you. Ladies and gentlemen, this does conclude today's teleconference. We thank you for your participation. You may disconnect your lines at this time and have a great day.


Q2 2022 Earnings Presentation August 9, 2022 A Leading FinTech Platform for the Everyday Consumer


1 Disclaimer This presentation (the “Presentation”) of OppFi Inc. (“OppFi” or the “Company”) is for information purposes only. Certain information contained herein has been derived from sources prepared by third parties. While such information is believed to be reliable for the purposes used herein, the Company makes no representation or warranty with respect to the accuracy of such information. Trademarks and trade names referred to in this Presentation are the property of their respective owners. The information contained herein does not purport to be all-inclusive. This Presentation does not constitute investment, tax, or legal advice. No representation or warranty, express or implied, is or will be given by the Company or any of its respective affiliates, directors, officers, employees or advisers or any other person as to the accuracy or completeness of the information in this Presentation, and no responsibility or liability whatsoever is accepted for the accuracy or sufficiency thereof or for any errors, omissions or misstatements, negligent or otherwise, relating thereto. The information contained in this Presentation is preliminary in nature and is subject to change, and any such changes may be material. The Company disclaims any duty to update the information contained in this Presentation, which information is given only as of the date of this Presentation unless otherwise stated herein. Forward-Looking Statements This Presentation includes "forward-looking statements'' within the meaning of the "safe harbor" provisions of the Private Securities Litigation Reform Act of 1995, Section 27A of the Securities Act of 1933, as amended, and Section 21E of the Securities Exchange Act of 1934, as amended. OppFi's actual results may differ from its expectations, estimates and projections and consequently, you should not rely on these forward-looking statements as predictions of future events. Words such as "expect," "estimate," "project," "budget," "forecast," "anticipate," "intend," "plan," "may," "will," "could," "should," "believes," "predicts," "potential," “possible,” "continue," and similar expressions may identify forward-looking statements, but the absence of these words does not mean that a statement is not forward-looking. These forward-looking statements include, without limitation, OppFi’s expectations for its full year 2022 guidance, OppFi's expectations with respect to the future performance of OppFi’s platform, OppFi’s expectations for its growth, and including growth of loan automation, and profitability and OppFi's new products and their performance. These forward-looking statements are based on OppFi’s current expectations and assumptions about future events and are based on currently available information as to the outcome and timing of future events. These forward-looking statements involve significant risks and uncertainties that could cause the actual results to differ materially from the expected results. Most of these factors are outside OppFi's control and are difficult to predict. Factors that may cause such differences include, but are not limited to: the impact of inflation on OppFi’s business; the impact of COVID-19 on OppFi's business; the impact of stimulus or other government programs; whether OppFi will be successful in obtaining declaratory relief against the Commissioner of the Department of Financial Protection and Innovation for the State of California; whether OppFi will be subject to AB 539; whether OppFi’s bank partners will continue to lend in California and whether OppFi’s financing sources will continue to finance the purchase of participation rights in loans originated by OppFi’s bank partners in California; the risk that the business combination disrupts current plans and operations; the ability to recognize the anticipated benefits of the business combination, which may be affected by, among other things, competition, the ability of OppFi to grow and manage growth profitably and retain its key employees; risks related to new products; concentration risk; costs related to the business combination; changes in applicable laws or regulations; the possibility that OppFi may be adversely affected by other economic, business, and/or competitive factors; risks related to management transitions; and other risks and uncertainties indicated from time to time in OppFi’s filings with the United States Securities and Exchange Commission, in particular, contained in the section or sections captioned “Risk Factors.” OppFi cautions that the foregoing list of factors is not exclusive, and readers should not place undue reliance upon any forward-looking statements, which speak only as of the date made. OppFi does not undertake or accept any obligation or undertaking to release publicly any updates or revisions to any forward-looking statements to reflect any change in its expectations or any change in events, conditions or circumstances on which any such statement is based. Non-GAAP Financial Measures Certain financial information and data contained this Presentation is unaudited and does not conform to Regulation S-X. Accordingly, such information and data may not be included in, may be adjusted in or may be presented differently in, any periodic filing, information or proxy statement, or prospectus or registration statement to be filed by OppFi with the SEC. Some of the financial information and data contained in this Presentation, such) Adjusted EBT, Adjusted Net Income (and margin thereof), Adjusted EBITDA (and margin thereof) and Adjusted EPS. Adjusted EBT is defined as Net Income, plus (1) recruiting fees, severance and relocation, (2) amortization of debt transaction costs and (3) other addbacks and one-time expenses following the closing of the business combination, including one-time implementation fees, stock compensation expenses, IPO readiness costs and management fees. Adjusted Net Income is defined as Net Income plus (1) recruiting fees, severance and relocation, (2) amortization of debt transaction costs and (3) other addbacks and one-time expenses following the closing of the business combination, including one-time implementation fees, stock compensation expenses, IPO readiness costs and management fees, adjusted for taxes assuming a tax rate of 25% for the three months ended June 30, 2021 and a 24.14% tax rate for the three months ended June 30, 2022 and adjusted for taxes assuming a tax rate of 25% for the six months ended June 30, 2021 and a 24.08% tax rate for the six months ended June 30, 2022, reflecting the U.S. federal statutory rate of 21% and a blended statutory rate for state income taxes, in order to allow for a comparison with other publicly traded companies. Adjusted EBITDA is defined as Adjusted Net Income plus (1) a tax rate of 25% for the three months ended June 30, 2021 and a 23.4% tax rate for the three months ended June 30, 2022 and adjusted for taxes assuming a tax rate of 25% for the six months ended June 30, 2021 and a 24.08% tax rate for the six months ended June 30, 2022, reflecting the U.S. federal statutory rate of 21% and a blended statutory rate for state income taxes, in order to allow for a comparison with other publicly traded companies, (2) depreciation and amortization, (3) interest expense and (4) business (non-income) taxes. Adjusted EPS is defined as adjusted net income divided by adjusted shares outstanding, which represent shares of both classes of common stock outstanding as of December 31, 2021, excluding 25,500,000 shares related to earnout obligations and including the impact of unvested restricted stock units. These financial measures have not been prepared in accordance with accounting principles generally accepted in the United States and may be different from non-GAAP financial measures used by other companies. OppFi believes that the use of these non-GAAP financial measures provides an additional tool for investors to use in evaluating ongoing operating results and trends. These non-GAAP measures with comparable names should not be considered in isolation from, or as an alternative to, financial measures determined in accordance with GAAP. These non-GAAP measures of financial results are not GAAP measures of our financial results or liquidity and should not be considered as an alternative to net income (loss) as a measure of financial results, cash flows from operating activities as a measure of liquidity, or any other performance measure derived in accordance with GAAP. OppFi believes these non-GAAP measures of financial results provide useful information to management and investors regarding certain financial and business trends relating to OppFi’s financial condition and results of operations. OppFi’s management uses these non-GAAP measures for trend analyses and for budgeting and planning purposes. OppFi believes that the use of these non-GAAP financial measures provides an additional tool for investors to use in evaluating projected operating results and trends in and in comparing OppFi’s financial measures with other similar companies, many of which present similar non-GAAP financial measures to investors. Management does not consider these non-GAAP measures in isolation or as an alternative to financial measures determined in accordance with GAAP. The principal limitation of these non-GAAP financial measures is that they exclude significant expenses and income that are required by GAAP to be recorded in the Company’s financial statements. In addition, they are subject to inherent limitations as they reflect the exercise of judgments by management about which expense and income are excluded or included in determining these non-GAAP financial measures. In order to compensate for these limitations, management presents non-GAAP financial measures in connection with GAAP results. You should review the OppFi’s audited financial statements, which have been filed with the SEC. A reconciliation for OppFi's non-GAAP financial measures to the most directly comparable GAAP financial measures can be found in the Appendix. No Offer or Solicitation This presentation does not constitute an offer to sell, or the solicitation of an offer to buy, any securities, nor shall there be any sale of securities in any states or jurisdictions in which such offer, solicitation or sale would be unlawful. No offer of securities shall be made except by means of a prospectus meeting the requirements of Section 10 of the Securities Act. Website This Presentation contains reproductions and references to the Company’s website and mobile content. The contents of the website and mobile content are not incorporated into this Presentation. Any references to URLs for the websites are intended to be inactive textual references only.


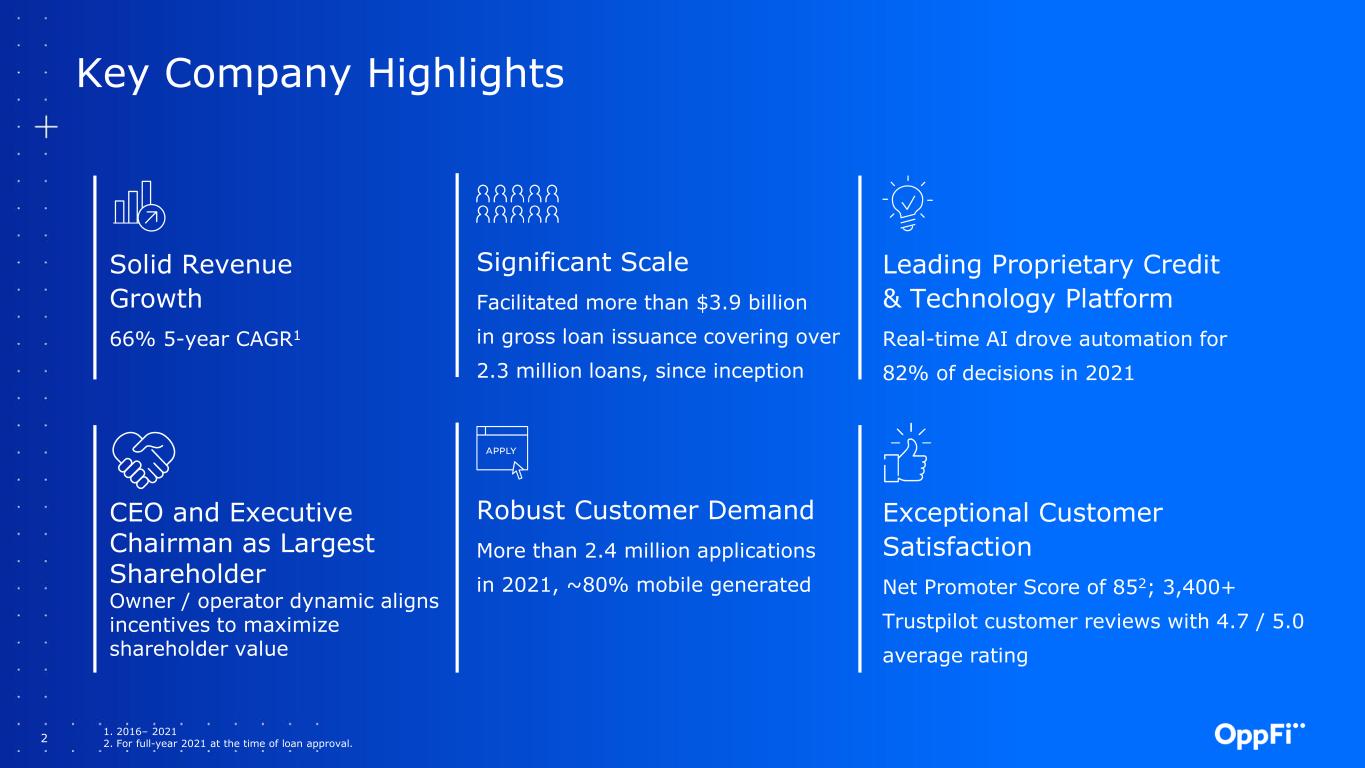
2 Key Company Highlights 1. 2016– 2021 2. For full-year 2021 at the time of loan approval. Solid Revenue Growth 66% 5-year CAGR1 Significant Scale Facilitated more than $3.9 billion in gross loan issuance covering over 2.3 million loans, since inception Leading Proprietary Credit & Technology Platform Real-time AI drove automation for 82% of decisions in 2021 CEO and Executive Chairman as Largest Shareholder Owner / operator dynamic aligns incentives to maximize shareholder value Robust Customer Demand More than 2.4 million applications in 2021, ~80% mobile generated Exceptional Customer Satisfaction Net Promoter Score of 852; 3,400+ Trustpilot customer reviews with 4.7 / 5.0 average rating


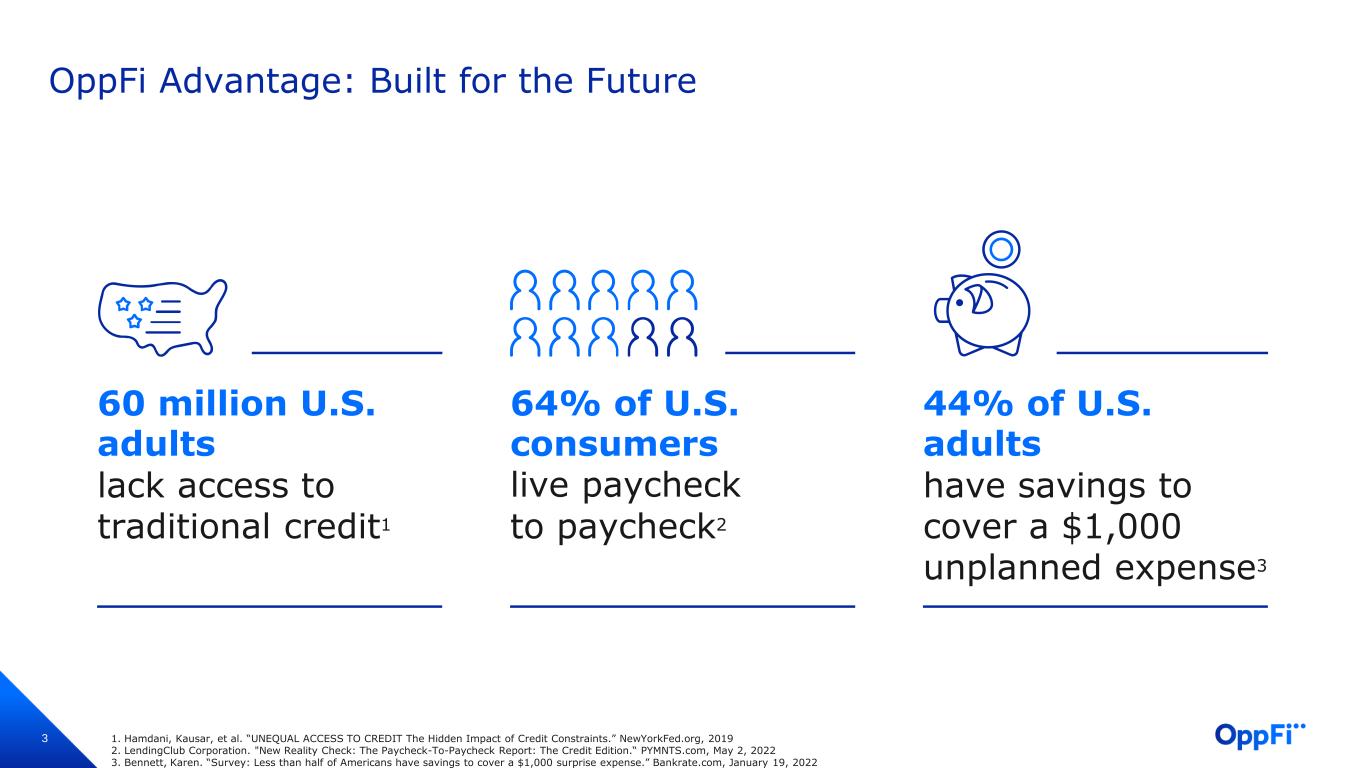
3 OppFi Advantage: Built for the Future 60 million U.S. adults lack access to traditional credit1 64% of U.S. consumers live paycheck to paycheck2 44% of U.S. adults have savings to cover a $1,000 unplanned expense3 1. Hamdani, Kausar, et al. “UNEQUAL ACCESS TO CREDIT The Hidden Impact of Credit Constraints.” NewYorkFed.org, 2019 2. LendingClub Corporation. "New Reality Check: The Paycheck-To-Paycheck Report: The Credit Edition.“ PYMNTS.com, May 2, 2022 3. Bennett, Karen. “Survey: Less than half of Americans have savings to cover a $1,000 surprise expense.” Bankrate.com, January 19, 2022


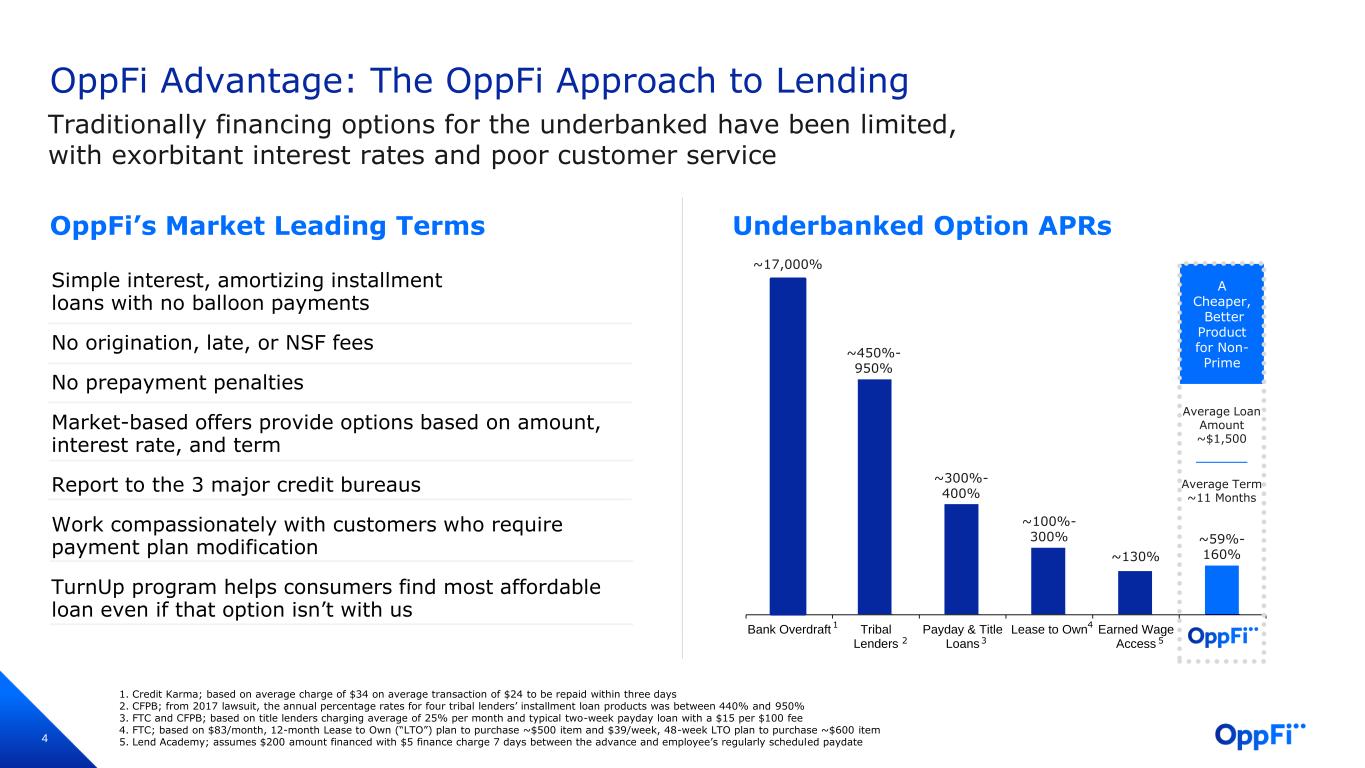
4 4 A Cheaper, Better Product for Non- Prime Traditionally financing options for the underbanked have been limited, with exorbitant interest rates and poor customer service OppFi Advantage: The OppFi Approach to Lending OppFi’s Market Leading Terms Underbanked Option APRs Simple interest, amortizing installment loans with no balloon payments No origination, late, or NSF fees No prepayment penalties Market-based offers provide options based on amount, interest rate, and term Report to the 3 major credit bureaus Work compassionately with customers who require payment plan modification TurnUp program helps consumers find most affordable loan even if that option isn’t with us 1. Credit Karma; based on average charge of $34 on average transaction of $24 to be repaid within three days 2. CFPB; from 2017 lawsuit, the annual percentage rates for four tribal lenders’ installment loan products was between 440% and 950% 3. FTC and CFPB; based on title lenders charging average of 25% per month and typical two-week payday loan with a $15 per $100 fee 4. FTC; based on $83/month, 12-month Lease to Own (“LTO”) plan to purchase ~$500 item and $39/week, 48-week LTO plan to purchase ~$600 item 5. Lend Academy; assumes $200 amount financed with $5 finance charge 7 days between the advance and employee’s regularly scheduled paydate ~17,000% ~450% - 950% ~300% - 400% ~100% - 300% ~130% 59% - 160% 0% 200% 400% 600% 800% 1000% 1200% Bank Overdraft Tribal Lenders Payday & Title Loans Lease to Own Earned Wage Access 532 41 Average Loan Amount ~$1,500 Average Term ~11 Months ~17, ~450%- 950% ~300%- 400% ~100%- 300% ~59%- 160%~


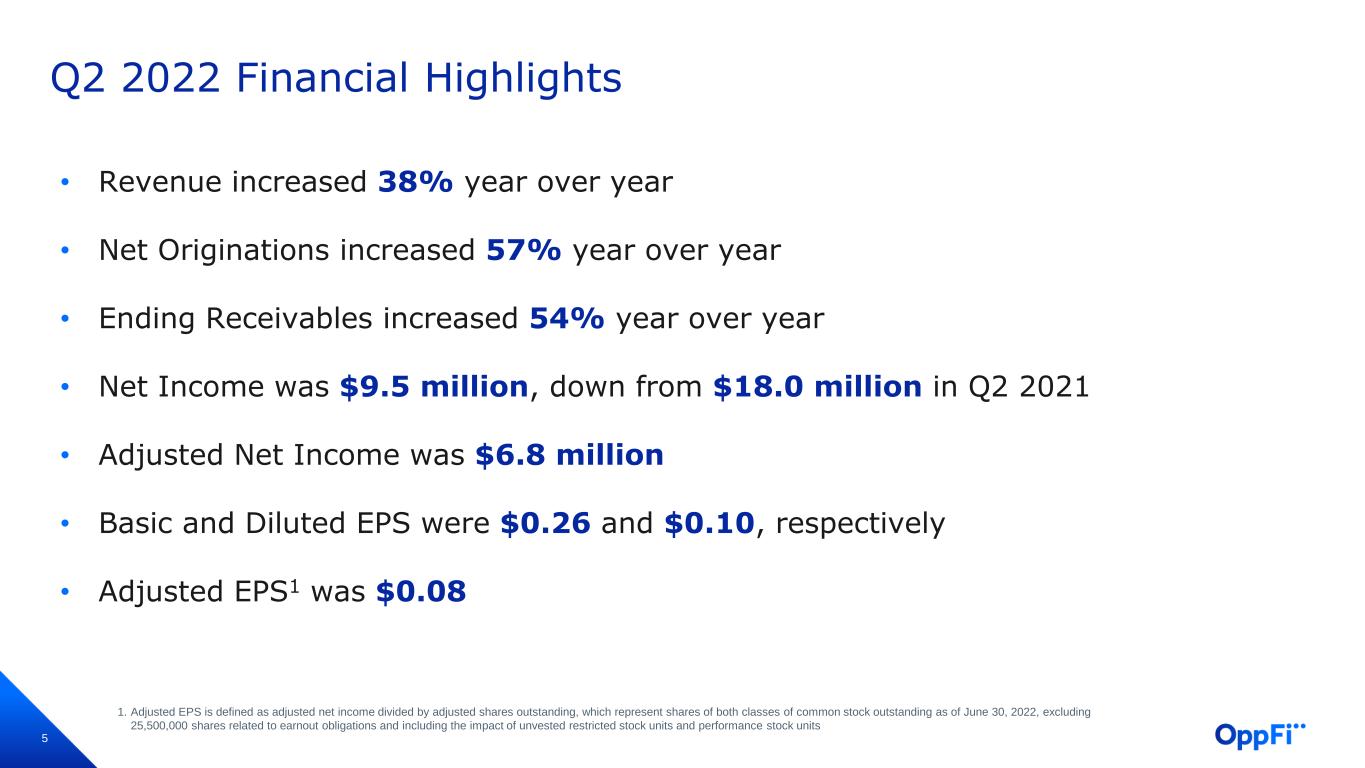
5 Q2 2022 Financial Highlights • Revenue increased 38% year over year • Net Originations increased 57% year over year • Ending Receivables increased 54% year over year • Net Income was $9.5 million, down from $18.0 million in Q2 2021 • Adjusted Net Income was $6.8 million • Basic and Diluted EPS were $0.26 and $0.10, respectively • Adjusted EPS1 was $0.08 1. Adjusted EPS is defined as adjusted net income divided by adjusted shares outstanding, which represent shares of both classes of common stock outstanding as of June 30, 2022, excluding 25,500,000 shares related to earnout obligations and including the impact of unvested restricted stock units and performance stock units


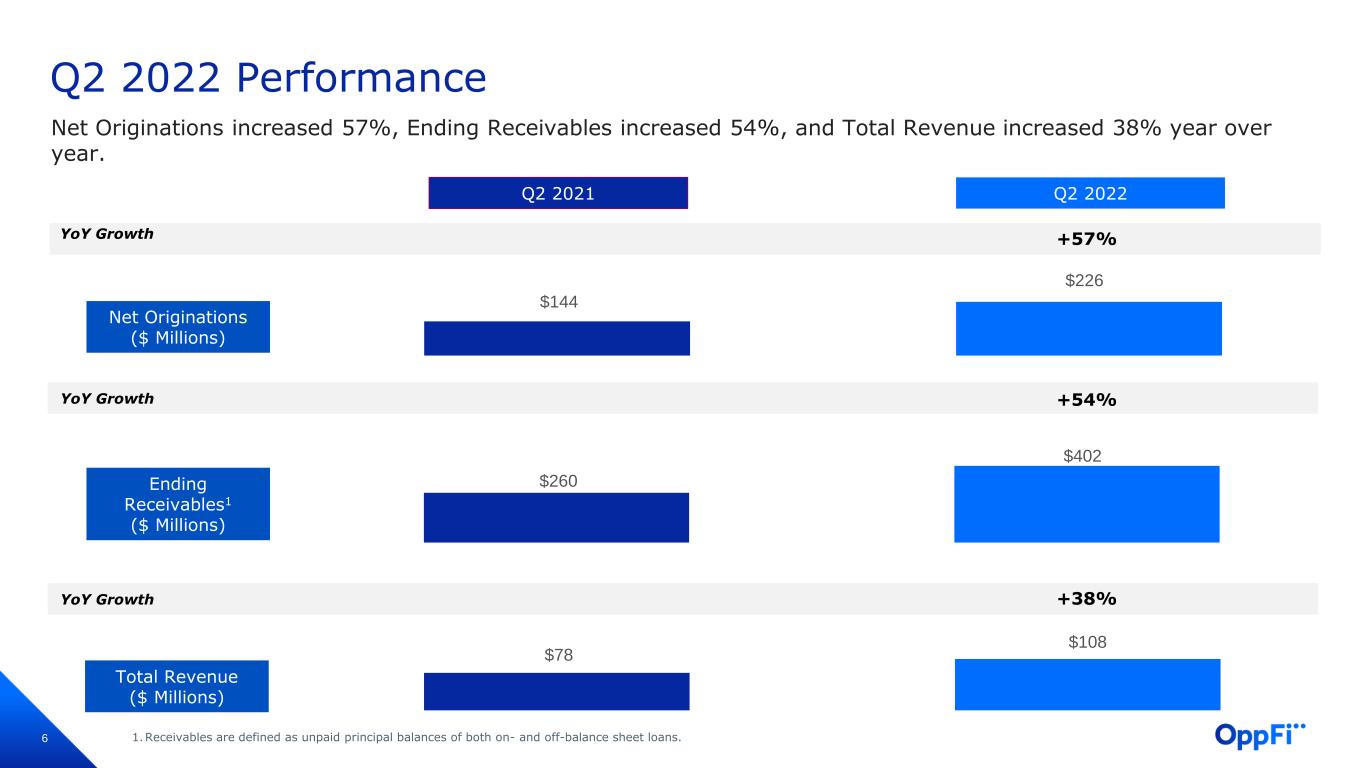
6 Q2 2021 Net Originations ($ Millions) Ending Receivables1 ($ Millions) Total Revenue ($ Millions) 1.Receivables are defined as unpaid principal balances of both on- and off-balance sheet loans. YoY Growth +57% Q2 2022 YoY Growth +54% YoY Growth +38% Q2 2022 Performance Net Originations increased 57%, Ending Receivables increased 54%, and Total Revenue increased 38% year over year. $144 $226 $260 $402 $78 $108


7 Adj. EBITDA1 ($ Millions) Adj. Net Income1 ($ Millions) 19%41%Margin2 Margin2 1.Adj. EBITDA and Adj. Net Income and margins thereof are not financial measures determined in accordance with GAAP. For a reconciliation to our most directly comparable financial measures calculated and presented in accordance with GAAP, please see the Appendix included within this presentation. 2.Margins depicted as percentage of Total Revenue. 6%23% YoY Growth (38%) YoY Growth (62%) Q2 2022 Performance Profitability increased relative to Q1 2022; however, elevated charge-offs continued to put pressure on earnings, which OppFi believes will continue throughout the remainder of FY 2022 Q2 2021 Q2 2022 $32 $20 $18 $7


8 Net originations increased 57% year over year Ending receivables increased 54% year over year as a result of strong origination growth YoY Net charge-offs as % of average receivables increased to 51% versus 28% year over year, which is an improvement over Q1-2022 but continues to reflect elevated delinquencies from higher loss customer segments that we have continued to cut throughout Q2-2022 Yield decreased year over year due to introduction of personalized pricing and increased delinquency Automatic approval rate increased to 62% from 51% year over year, reflecting the continued application of algorithmic automation projects that streamline the origination process Total marketing cost per new funded loan decreased by 16% year over year due to reduced investment in direct mail spend combined with higher customer conversion rates Quarterly Key Performance Indicators UNAUDITED QUARTER ENDED ($ in millions), except Total Marketing Cost 6/30/2021 6/30/2022 Net Originations1 $144 $226 Ending Receivables2 $260 $402 % of Originations by Bank Partners 93% 95% Net Charge-Offs as % of Avg. Receivables3 28% 51% Average Yield4 129% 118% Automatic Approval Rate5 51% 62% Total Marketing Cost per New Funded Loan6 $245 $206 Total Marketing Cost per Funded Loan7 $72 $82 1. Net originations include both originations by bank partners on the OppFi platform, as well as direct originations by OppFi. 2. Receivables are defined as unpaid principal balances of both on- and off-balance sheet loans. 3. Net charge-offs as a percentage of average receivables (defined as unpaid principal of both on- and off-balance sheet loans) represents total charge offs from the period less recoveries as a percent of average receivables. OppFi charges off loans after they are more than 90 days delinquent. 4. Average Yield is defined as annualized interest income from the period as a percent of average receivables 5. Auto-Approval Rate is calculated by taking the number of approved loans that are not decisioned by a loan advocate or underwriter (auto-approval) divided by the total number of loans approved. 6. Marketing Cost per New Funded Loan represents marketing cost per funded loan for new loans. This metric is the amount of direct marketing costs incurred during a period divided by the number of new funded loans originated during that same period. 7. Marketing Cost per Funded Loan represents marketing cost per funded loans (including new and returning customer loans). This metric is the amount of direct marketing costs incurred during a period divided by the number of funded loans originated during that same period. Key Highlights


9 Condensed Balance Sheet UNAUDITED PERIOD ENDED ($ in millions) 12/31/2021 6/30/2022 Assets Cash and restricted cash $62.4 $57.6 Finance Receivables at Fair Value 383.9 450.7 Finance Receivables at Amortized Cost, Net 4.2 4.6 Other Assets 51.6 65.2 Total Assets $502.1 $578.1 Liabilities and Stockholders’ Equity Other Liabilities $59.0 $70.5 Total Debt 274.0 336.5 Warrant Liabilities 11.2 5.5 Total Liabilities 344.2 412.6 Total Equity 157.9 165.5 Total Liabilities and Equity $502.1 $578.1 Total cash decrease of $5 million was driven by an increase in originated loans relative to received payments and recovered loans Other assets grew by $14 million driven largely by the addition of an operating lease right of use assets of $15 million (corresponding liability in “Other Liabilities”) related to the Company’s corporate headquarters due to the adoption of a new accounting standard Total debt increase of $63 million was driven by an increase in utilization of leverage facilities of $80 million and was partially offset by lower secured borrowing payables by $17 million Equity increase of $8 million was driven by net income for the six months of $9 million Key Highlights


10 Grown liquidity 6x of 2017 levels Decreased cost of borrowing by 500+ bps since 2017 Diversified institutional capital sources Increased financial flexibility with: • corporate credit agreements, • asset-backed facilities, • bank provided asset-based loans, • forward flow arrangements, and • total return swap Ample debt capacity provides a means to fund future growth without equity Liquidity ($ in millions) $55 $126 $207 $142 $274 $282 $338 $40 $52 $140 $338 $158 $132 $212 $11 $23 $36 $46 $62 $60 $58 2017 2018 2019 2020 2021 Q1 2022 Q2 2022 Oustanding Debt Remaining Debt Capacity Cash & Restricted Cash $105 $201 $383 $526 $494 $474 $608 Reduced Cost of Financing and Strong Balance Sheet to Power Growth


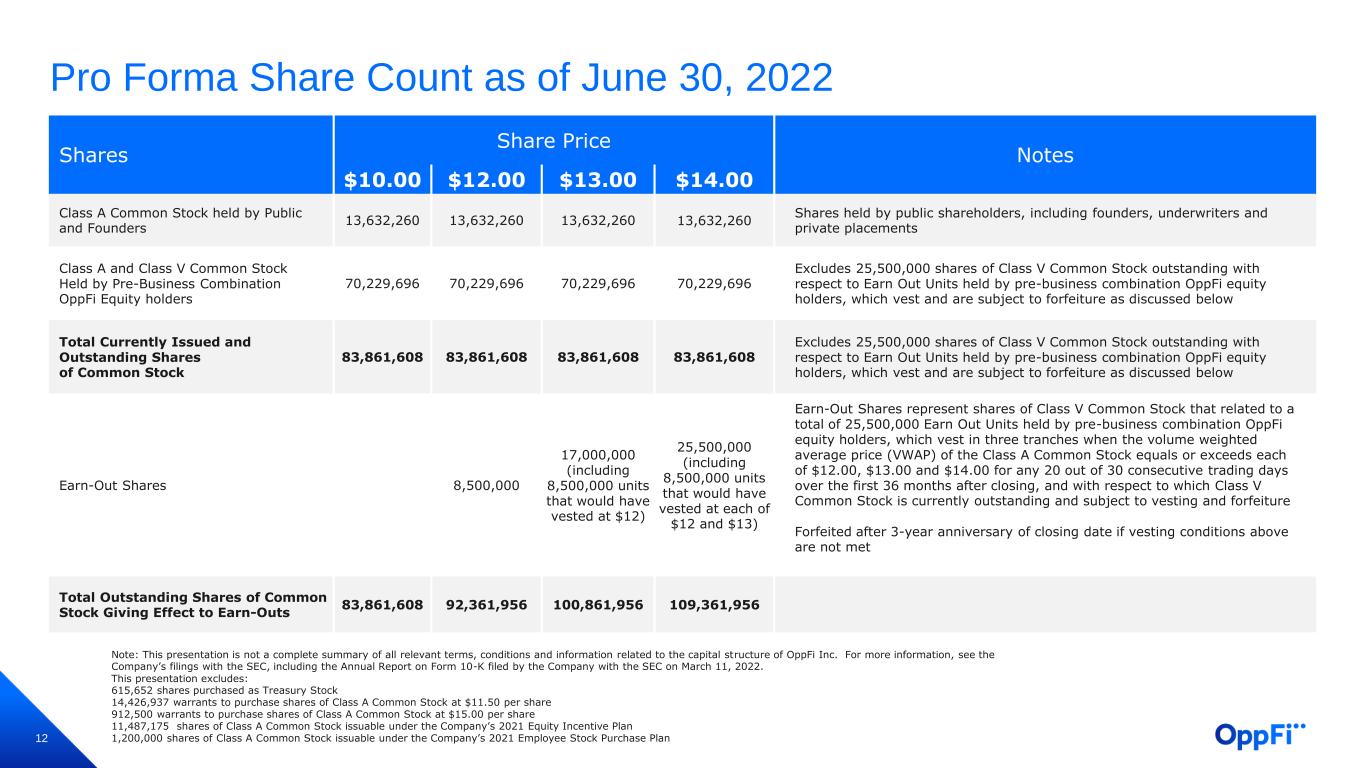
11 Appendix


12 Pro Forma Share Count as of June 30, 2022 Shares Share Price Notes $10.00 $12.00 $13.00 $14.00 Class A Common Stock held by Public and Founders 13,632,260 13,632,260 13,632,260 13,632,260 Shares held by public shareholders, including founders, underwriters and private placements Class A and Class V Common Stock Held by Pre-Business Combination OppFi Equity holders 70,229,696 70,229,696 70,229,696 70,229,696 Excludes 25,500,000 shares of Class V Common Stock outstanding with respect to Earn Out Units held by pre-business combination OppFi equity holders, which vest and are subject to forfeiture as discussed below Total Currently Issued and Outstanding Shares of Common Stock 83,861,608 83,861,608 83,861,608 83,861,608 Excludes 25,500,000 shares of Class V Common Stock outstanding with respect to Earn Out Units held by pre-business combination OppFi equity holders, which vest and are subject to forfeiture as discussed below Earn-Out Shares 8,500,000 17,000,000 (including 8,500,000 units that would have vested at $12) 25,500,000 (including 8,500,000 units that would have vested at each of $12 and $13) Earn-Out Shares represent shares of Class V Common Stock that related to a total of 25,500,000 Earn Out Units held by pre-business combination OppFi equity holders, which vest in three tranches when the volume weighted average price (VWAP) of the Class A Common Stock equals or exceeds each of $12.00, $13.00 and $14.00 for any 20 out of 30 consecutive trading days over the first 36 months after closing, and with respect to which Class V Common Stock is currently outstanding and subject to vesting and forfeiture Forfeited after 3-year anniversary of closing date if vesting conditions above are not met Total Outstanding Shares of Common Stock Giving Effect to Earn-Outs 83,861,608 92,361,956 100,861,956 109,361,956 Note: This presentation is not a complete summary of all relevant terms, conditions and information related to the capital structure of OppFi Inc. For more information, see the Company’s filings with the SEC, including the Annual Report on Form 10-K filed by the Company with the SEC on March 11, 2022. This presentation excludes: 615,652 shares purchased as Treasury Stock 14,426,937 warrants to purchase shares of Class A Common Stock at $11.50 per share 912,500 warrants to purchase shares of Class A Common Stock at $15.00 per share 11,487,175 shares of Class A Common Stock issuable under the Company’s 2021 Equity Incentive Plan 1,200,000 shares of Class A Common Stock issuable under the Company’s 2021 Employee Stock Purchase Plan


13 Fair Value Valuation 1. Stated as a percentage of loan receivable. 2. Represents rate applied to on-balance unpaid principal receivables, inclusive of adjustment for accrued interest. Key Highlights • Default rate increased by 100bps due to recent elevated loss rates • Prepayment rate decreased by 495bps • Discount rate increased 330bps primarily due to increases in the risk-free rate and equity risk premium UNAUDITED PERIOD ENDED ($ in thousands) 6/30/2022 3/31/2022 Outstanding Principal $394,709 $332,517 Accrued Interest $12,917 $10,674 Interest Rate 149.9% 147.7% Discount Rate 24.9% 21.6% Servicing Cost1 (5.0)% (5.0)% Remaining Life 0.637 years 0.617 years Default Rate1 19.5% 18.5% Accrued Interest1 3.3% 3.2% Prepayment Rate1 16.4% 21.3% Premium to Principal2 10.9% 11.3%


14 OppFi GAAP Income Statements 1. For the periods prior to July 20, 2021, earnings per share was not calculated, as net income prior to the Business Combination was attributable entirely to OppFi-LLC. (in thousands, except share and per share data) Unaudited Three Months Ended June 30, 2022 2021 Variance (%) Interest and loan related income $ 107,873 $ 78,030 38.2% Other income 2 346 (99.4%) Total revenue 107,875 78,376 37.6% Provision for credit losses on finance receivables (569) (31) 1735.5% Change in fair value of finance receivables (42,154) (11,306) 272.8% Net revenue 65,152 67,039 (2.8%) Expenses: Sales and marketing 17,804 11,545 54.2% Customer operations 10,850 9,876 9.9% Technology, products, and analytics 8,294 6,513 27.3% General, administrative, and other 13,924 14,733 (5.5%) Total expenses before interest expense 50,872 42,667 19.2% Interest expense 7,878 6,385 23.4% Income from operations 6,402 17,987 (64.4%) Change in fair value of warrant liability 3,297 - - Income before income taxes 9,699 17,987 (46.1%) Provision for income taxes 202 - - Net income 9,497 $ 17,987 (47.2%) Less: net loss attributable to noncontrolling interest 6,039 Net income attributable to OppFi Inc. $ 3,458 Earnings per share attributable to OppFi Inc. 1: Earnings per common share: Basic $ 0.26 $ - Diluted $ 0.10 $ - Weighted average common shares outstanding: Basic 13,525,101 - Diluted 84,283,102 -


15 OppFi GAAP Income Statements 1. For the periods prior to July 20, 2021, earnings per share was not calculated, as net income prior to the Business Combination was attributable entirely to OppFi-LLC. (in thousands, except share and per share data) Unaudited Six Months Ended June 30, 2022 2021 Variance (%) Interest and loan related income $ 208,209 $ 162,133 28.4% Other income 376 500 (24.8%) Total revenue 208,585 162,633 28.3% Provision for credit losses on finance receivables (1,026) (38) 2600.0% Change in fair value of finance receivables (91,679) (33,695) 172.1% Net revenue 115,880 128,900 (10.1%) Expenses: Sales and marketing 31,394 19,480 61.2% Customer operations 20,881 19,485 7.2% Technology, products, and analytics 16,523 12,340 33.9% General, administrative, and other 27,515 24,231 13.6% Total expenses before interest expense 96,313 75,536 27.5% Interest expense 15,326 10,993 39.4% Income from operations 4,241 42,371 (90.0%) Change in fair value of warrant liability 5,701 - - Income before income taxes 9,942 42,371 (76.5%) Provision for income taxes 742 - - Net income 9,200 $ 42,371 (78.3%) Less: net loss attributable to noncontrolling interest 4,666 Net income attributable to OppFi Inc. $ 4,534 Earnings per share attributable to OppFi Inc. 1: Earnings per common share: Basic $ 0.33 $ - Diluted $ 0.10 $ - Weighted average common shares outstanding: Basic 13,553,308 - Diluted 84,377,754 -


16 OppFi Condensed Balance Sheet (in thousands) Unaudited June 30, 2022 December 31, 2021 Variance (%) Assets Cash and restricted cash $ 57,638 $ 62,362 (7.6%) Finance receivables at fair value 450,703 383,890 17.4% Finance receivables at amortized cost, net 4,579 4,220 8.5% Other assets 65,150 51,634 26.2% Total assets $ 578,070 $ 502,106 15.1% Liabilities and stockholders’ equity Other liabilities $ 70,505 $ 58,967 19.6% Total debt 336,528 274,021 22.8% Warrant liability 5,539 11,240 (50.7%) Total liabilities $ 412,572 344,228 19.9% Total stockholders’ equity 165,498 157,878 4.8% Total liabilities and stockholders’ equity $ 578,070 $ 502,106 15.1%


17 OppFi Quarterly Net Income to Adj. EBT, Adj. Net Income and Adj. EBITDA Reconciliation (in thousands, except share and per share data) Unaudited Three Months Ended June 30, 2022 2021 Variance (%) Net income $ 9,497 $ 17,987 (47.2%) Provision for income taxes 202 - - Debt amortization 435 642 (32.2%) Other addback and one-time expenses1 (1,145) 5,135 (122.3%) Adjusted EBT 8,989 23,764 (62.2%) Less: pro forma taxes2 (2,170) (5,941) (63.5%) Adjusted net income 6,819 17,823 (61.7%) Pro forma taxes2 2,170 5,941 (63.5%) Depreciation and amortization 3,366 2,413 39.5% Interest expense 7,442 5,744 29.6% Business (non-income) taxes 210 357 (41.2%) Net gain/loss on fixed asset sale 2 4 (50.0%) Adjusted EBITDA $ 20,009 $ 32,282 (38.0%) Adjusted EPS3: $ 0.08 $ - Weighted average diluted shares outstanding: 84,283,102 - 1. For the three months ended June 30, 2022, addbacks and one-time expense of ($1.1 million) included a ($3.3 million) addback due to the change in fair value of the warrant liabilities, a $0.7 million expense related to severance and retention bonuses, a $0.5 million one-time origination fee expense and $1.0 million in expenses related to stock compensation. For the three months ended June 30, 2021, addbacks and one-time expenses of $5.1 million included a $3.3 million one-time warrant valuation expense, a $1.3 million expense related to one-time legal, accounting, and other costs related to the Company's business combination, $0.2 million in expenses related to profit interest compensation, $0.2 million in management fees, and $0.1 million in severance. 2. Assumes a tax rate of 25% for the three months ended June 30, 2021 and a 24.14% tax rate for the three months ended June 30, 2022, reflecting the U.S. federal statutory rate of 21% and a blended statutory rate for state income taxes, in order to allow for a comparison with other publicly traded companies. 3. For the periods prior to July 20, 2021, earnings per share was not calculated, as net income prior to the Business Combination was attributable entirely to OppFi-LLC.


18 OppFi Quarterly Net Income to Adj. EBT, Adj. Net Income and Adj. EBITDA Reconciliation (in thousands, except share and per share data) Unaudited Six Months Ended June 30, 2022 2021 Variance (%) Net income $ 9,200 $ 42,371 (78.3%) Provision for income taxes 742 - - Debt amortization 1,044 1,163 (10.2%) Other addback and one-time expenses1 (1,269) 5,902 (121.5%) Adjusted EBT 9,717 49,436 (80.3%) Less: pro forma taxes2 (2,340) (12,359) (81.1%) Adjusted net income 7,377 37,077 (80.1%) Pro forma taxes2 2,340 12,359 (81.1%) Depreciation and amortization 6,604 4,577 44.3% Interest expense 14,282 9,830 45.3% Business (non-income) taxes 589 792 (25.6%) Net gain/loss on fixed asset sale 2 4 Adjusted EBITDA $ 31,194 $ 64,639 (51.7%) Adjusted EPS3: $ 0.09 $ - Weighted average diluted shares outstanding: 84,377,754 - 1. For the six months ended June 30, 2022, addbacks and one-time expense of ($1.3 million) included a ($5.7 million) addback due to the change in fair value of the warrant liabilities, $2.1 million in expenses related to severance and retention bonuses, $1.6 million in expenses related to stock compensation, a $0.5 million one-time origination fee expense, and $0.2 million in one-time legal expenses. For the six months ended June 30, 2021, addbacks and one-time expenses of $5.9 million included a $3.3 million one-time warrant valuation expense, a $1.6 million expense related to one-time legal, accounting, and other costs related to the Company's business combination, $0.4 million in expenses related to severance, $0.3 million in management fees, and $0.2 million in expenses related to profit interest compensation. 2. Assumes a tax rate of 25% for the six months ended June 30, 2021 and a 24.08% tax rate for the six months ended June 30, 2022, reflecting the U.S. federal statutory rate of 21% and a blended statutory rate for state income taxes, in order to allow for a comparison with other publicly traded companies. 3. For the periods prior to July 20, 2021, earnings per share was not calculated, as net income prior to the Business Combination was attributable entirely to OppFi-LLC.


19 OppFi Cash Flows Six Months Ended June 30, (in thousands) Unaudited 2022 2021 Variance (%) Net cash provided by operating activities $ 102,784 $ 84,837 21.2% Net cash (used in) investing activities (164,390) (47,878) (243.4%) Net cash provided by financing activities 56,882 38,163 49.1% Net (decrease) increase in cash, cash equivalents and restricted cash $ (4,724) $ 75,122 (106.3%)


20 OppFi Diluted Shares as Reflected in Adjusted Earnings Per Share Three Months Ended June 30, 2022 2021 Weighted average Class A common stock outstanding 13,525,101 - Weighted average Class V voting stock outstanding 96,114,373 - Elimination of earnouts at period end (25,500,000) - Dilutive impact of restricted stock units 125,383 - Dilutive impact of performance stock units 18,245 - Weighted average diluted shares outstanding 84,283,102 -


21 OppFi Diluted Shares as Reflected in Adjusted Earnings Per Share Six Months Ended June 30, 2022 2021 Weighted average Class A common stock outstanding 13,553,308 - Weighted average Class V voting stock outstanding 96,225,804 - Elimination of earnouts at period end (25,500,000) - Dilutive impact of restricted stock units 89,520 - Dilutive impact of performance stock units 9,123 - Weighted average diluted shares outstanding 84,377,754 -


22 OppFi Adjusted EPS Three Months Ended June 30, 2022 2021 Adjusted net income (thousands)1 $ 6,820 $ 17,823 Weighted average diluted shares outstanding 84,283,102 - Adjusted basic EPS2: $ 0.08 $ - Six Months Ended June 30, 2022 2021 Adjusted net income (thousands)1 $ 7,377 $ 37,077 Weighted average diluted shares outstanding 84,377,754 - Adjusted diluted EPS2: $ 0.09 $ - 1. Non-GAAP Financial Measures: Adjusted Net Income and Adjusted EBITDA are financial measures that have not been prepared in accordance with Generally Accepted Accounting Principles (“GAAP”). See the “Note Regarding Non-GAAP Financial Measures” below for a detailed description and reconciliation of such Non-GAAP financial measures to their most directly comparable GAAP financial measures. 2. For the periods prior to July 20, 2021, earnings per share was not calculated, as net income prior to the Business Combination was attributable entirely to OppFi-LLC.