UNITED STATES
SECURITIES AND EXCHANGE COMMISSION
Washington, D.C. 20549
FORM
CURRENT REPORT
PURSUANT TO SECTION 13 OR 15(d)
OF THE SECURITIES EXCHANGE ACT OF 1934
DATE OF REPORT (DATE OF EARLIEST EVENT REPORTED):
(Exact Name of Registrant as Specified in its Charter)
| (State or Other Jurisdiction of Incorporation) |
(Commission File Number) |
(IRS Employer Identification No.) |
(Address of Principal Executive Office) (Zip Code)
Registrant’s telephone number, including area code:
Not Applicable
(Former name or former address, if changed since last report)
Check the appropriate box below if the Form 8-K filing is intended to simultaneously satisfy the filing obligation of the registrant under any of the following provisions:
| Written communications pursuant to Rule 425 under the Securities Act (17 CFR 230.425) |
| Soliciting material pursuant to Rule 14a-12 under the Exchange Act (17 CFR 240.14a-12) |
| Pre-commencement communications pursuant to Rule 14d-2(b) under the Exchange Act (17 CFR 240.14d-2(b)) |
| Pre-commencement communications pursuant to Rule 13e-4(c) under the Exchange Act (17 CFR 240.13e-4(c)) |
Securities registered pursuant to Section 12(b) of the Act:
| Title of Each Class |
Trading Symbol |
Name of Each Exchange on Which Registered | ||
Indicate by check mark whether the registrant is an emerging growth company as defined in Rule 405 of the Securities Act of 1933 (§230-405) or Rule 12b-2 of the Securities Exchange Act of 1934 (§240.12b-2).
Emerging growth company
If an emerging growth company, indicate by check mark if the registrant has elected not to use the extended transition period for complying with any new or revised financial accounting standards provided pursuant to Section 13(a) of the Exchange Act.
Item 2.02 Results of Operations and Financial Condition.
The information contained in Item 7.01 of this Current Report on Form 8-K is incorporated by reference in this Item 2.02.
Item 7.01 Regulation FD Disclosure.
On August 10, 2021, OppFi Inc. (the “Company”) issued a press release announcing the financial results of its subsidiary Opportunity Financial, LLC for the second quarter ended June 30, 2021 and provided an investor presentation to accompany the press release. Copies of the press release and presentation are furnished as Exhibits 99.1 and 99.2, respectively, to this Current Report on Form 8-K and are incorporated herein by reference.
This information and the information contained in Exhibits 99.1 and 99.2 is furnished and shall not be deemed “filed” for purposes of Section 18 of the Securities Exchange Act of 1934, as amended (the “Exchange Act”), or incorporated by reference in any filing under the Securities Act of 1933, as amended, or the Exchange Act, except as may be expressly set forth by specific reference in any such filing, regardless of any general incorporation language in the filing.
Item 9.01 Financial Statements and Exhibits.
(d) Exhibits
Exhibit Index
| Exhibit |
Description | |
| 99.1 | Press Release from OppFi Inc., dated August 10, 2021, entitled “OppFi Reports Second Quarter 2021 Financial Results.” | |
| 99.2 | OppFi Inc. Presentation dated August 10, 2021. | |
| 104 | Cover Page Interactive Data File (the cover page tags are embedded within the Inline XBRL document). | |
SIGNATURES
Pursuant to the requirements of the Securities Exchange Act of 1934, the registrant has duly caused this report to be signed on its behalf by the undersigned hereunto duly authorized.
| Date: August 10, 2021 | OPPFI INC. | |||
| /s/ Shiven Shah | ||||
| Shiven Shah | ||||
| Chief Financial Officer | ||||
Exhibit 99.1
OppFi Reports Second Quarter 2021 Financial Results
Net Originations for the second quarter of 2021 up 84% year over year, 44% sequentially and 20% vs. the second quarter of 2019
Ending Receivables for the second quarter of 2021 up 19% year over year and 29% vs. the second quarter of 2019
Revenue up 28% and Adjusted Revenue up 6% for the second quarter of 2021 vs. the second quarter of 2020
Net Income of $18.0 million for the second quarter of 2021, $42.4 million for the first six months of 2021
Adjusted Net Income of $17.9 million for the second quarter of 2021, $37.2 million for the first six months of 2021
CHICAGO, August 10, 2021— OppFi Inc. (NYSE: OPFI) (“OppFi” and “the Company”), a leading financial technology platform that powers banks to help the everyday consumer gain access to credit, today reported financial results for Opportunity Financial, LLC for the second quarter ended June 30, 2021, achieved prior to the completion of the business combination with FG New America Acquisition Corp. on July 20, 2021.
“We are pleased with our results for the second quarter. Originations rebounded significantly in the second quarter as the economy started to recover from the COVID-19 pandemic, resulting in originations growth of 84% and receivables growth of 19% year over year. In addition, our profitability remained strong during the quarter driven by continued strength in the credit quality of our portfolio and our operating efficiency, including our auto approval rate increasing from 41% in the first quarter to 51% in the second quarter. While we expect receivable growth of near 50% from the second quarter’s ending balance through year end 2021, that growth is still below what we would consider normalized levels. We believe the return of normalized demand is a matter of ‘when’ not ‘if’, but the timing remains uncertain given the surge in COVID’s Delta variant coupled with the extension of various government stimulus programs,” stated Jared Kaplan, Chief Executive Officer of OppFi.
“We’ve made progress on our growth strategies which include a combination of reaccelerating volumes for our traditional installment business coupled with significant progress on our new products. We’ve recently signed agreements for SalaryTap with two highly regarded financial wellness platforms, Brightside and Best Money Moves. In addition, we officially launched our OppFi Card last week to select customers, which is the first graduation product that we offer to OppLoans customers,” continued Kaplan.
As we evolve our organization from a mono-line lending platform to the premier digital financial services destination for the everyday consumer, we recently brought on Neville Crawley as President to help us achieve this vision. He brings more than two decades of extensive leadership in financial services, product and technology. He most recently served as CEO of Kiva, a leading global fintech platform, where the company more than doubled assets and revenue. Neville is an exceptional talent who we believe will help us build out additional credit access, savings and investment products,” concluded Kaplan.
Second Quarter Financial Summary
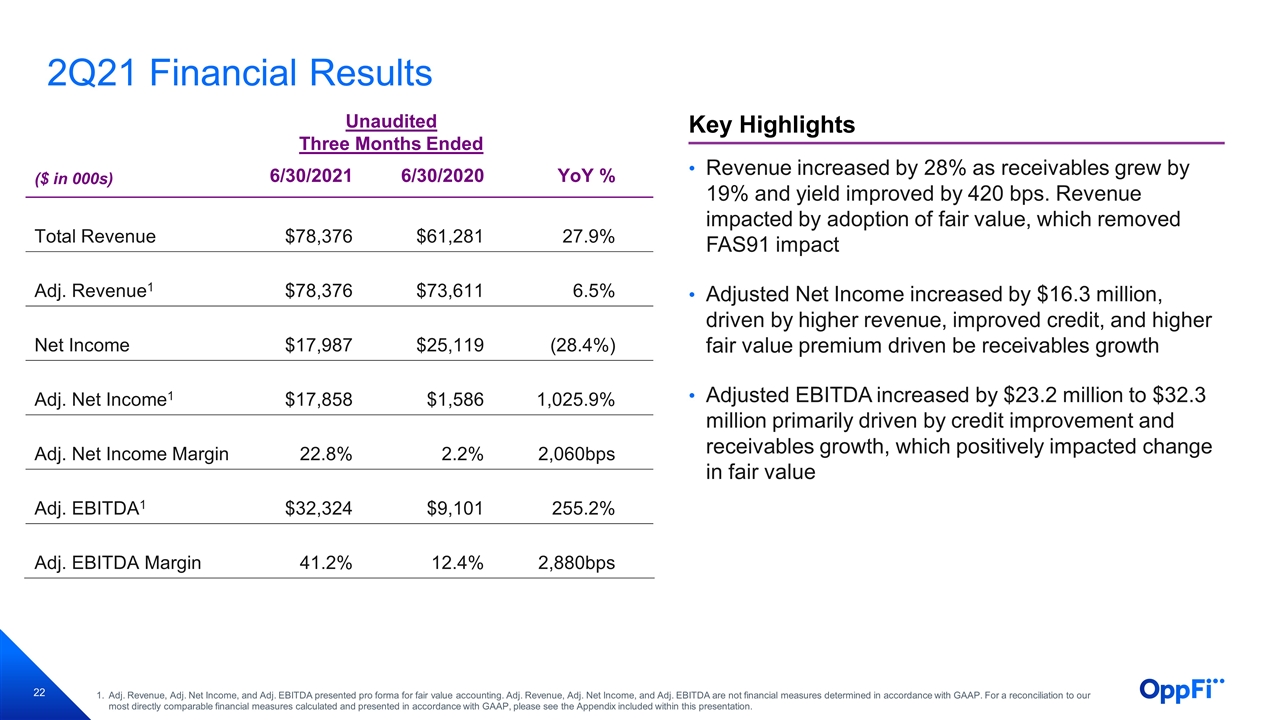
The following table presents a summary of OppFi’s results for the three and sixth months ended June 30, 2021 over the prior year.
| (In Thousands) Unaudited |
Three Months Ended June 30, | Variance | ||||||||||
| 2021 | 2020 | % | ||||||||||
| Total Revenue |
$ | 78,376 | $ | 61,281 | 27.9 | % | ||||||
| Adjusted Revenue1 |
$ | 78,376 | $ | 73,611 | 6.5 | % | ||||||
| Net Income |
$ | 17,987 | $ | 25,119 | (28.4 | %) | ||||||
| Adjusted Net Income1 |
$ | 17,858 | $ | 1,586 | 1,025.9 | % | ||||||
| Adjusted EBITDA1 |
$ | 32,324 | $ | 9,101 | 255.2 | % | ||||||
| (In Thousands) Unaudited |
Six Months Ended June 30, | Variance | ||||||||||
| 2021 | 2020 | % | ||||||||||
| Total Revenue |
$ | 162,633 | $ | 135,934 | 19.6 | % | ||||||
| Adjusted Revenue1 |
$ | 162,633 | $ | 162,580 | 0.0 | % | ||||||
| Net Income |
$ | 42,371 | $ | 42,016 | 0.8 | % | ||||||
| Adjusted Net Income1 |
$ | 37,147 | $ | 14,597 | 154.5 | % | ||||||
| Adjusted EBITDA1 |
$ | 64,728 | $ | 34,045 | 90.1 | % | ||||||
Second Quarter Key Performance Metrics
The following table represents key second quarter metrics over the prior quarter and prior year.
| (In Thousands) Unaudited |
As of and for the Three Months Ended | |||||||||||
| June 30, 2021 | March 31, 2021 | June 30, 2020 | ||||||||||
| Total Net Originations(a) |
$ | 143,983 | $ | 99,809 | $ | 78,098 | ||||||
| Ending Receivables(b) |
$ | 260,377 | $ | 245,293 | $ | 218,767 | ||||||
| % of Originations by Bank Partners |
93 | % | 76 | % | 62 | % | ||||||
| Net Charge-Offs as % of Average Receivables(c) |
28 | % | 30 | % | 40 | % | ||||||
| Auto-Approval Rate(d) |
51 | % | 41 | % | 19 | % | ||||||
| Marketing Cost per Funded Loan(e) |
$ | 72 | $ | 56 | $ | 91 | ||||||
| Marketing Cost per New Funded Loan(e) |
$ | 245 | $ | 266 | $ | 454 | ||||||
| a. | Total net originations include both originations by bank partners on the OppFi platform, as well as direct originations by OppFi. |
| b. | Receivables are defined as unpaid principal balances of both on- and off-balance sheet loans. |
| c. | Annualized net charge-offs as a percentage of average receivables (defined as unpaid principal of both on- and off-balance sheet loans) represents total charge offs from the period less recoveries as a percent of average receivables. OppFi charges off loans after they are more than 90 days delinquent. |
| d. | Auto-Approval Rate is calculated by taking the number of approved loans that are not decisioned by a loan advocate or underwriter (auto-approval) divided by the total number of loans approved. |
| e. | Marketing Cost per Funded Loan represents marketing cost per funded loan for new and refinanced loans. This metric is the amount of direct marketing costs incurred during a period divided by the number of loans originated during that same period. |
Financial Capacity and Capital Resources
As of June 30, 2021, the Company had $121 million in total cash and an additional $223 million of unused debt capacity under its financing facilities for future availability, representing a 52% overall undrawn capacity. Including total financing commitments and cash on the balance sheet, the Company had more than $500 million in funding capacity as of June 30, 2021.
Recent Developments
OppFi and FG New America Acquisition Corp., a special purpose acquisition corporation (“SPAC”), completed their previously announced business combination on July 20, 2021.
OppFi is pleased to welcome Neville Crawley in the newly created role of President. Crawley will help formulate OppFi’s technology and go-to-market strategies, and work to expand the Company’s products and services. Crawley will additionally oversee OppFi’s social impact commitments. Prior to joining OppFi, Crawley served as CEO of the global fintech platform, Kiva, from 2017 to 2021. Kiva had funded more than $1.5 billion in loans to some of the world’s most financially excluded populations. Previously, Crawley served as CEO of Quid, an artificial intelligence company, as Senior Vice President of strategy and corporate development at GLG, the world’s largest expert network, and as a strategy and M&A consultant to fintech companies at McKinsey & Company.
Last week, the Company officially launched the OppFi Credit Card to select OppLoans customers who have repaid their loans in full. OppFi Card is issued by First Electronic Bank, Member FDIC and features Mastercard as the exclusive card network. Upon approval, cardholders are instantly able to access their OppFi Card from the OppFi mobile app and directly add their card to their mobile wallets. This allows cardholders to access their card information immediately and begin making purchases online, in-app, and at the point of sale. Cardholders also receive a physical card that supports all payment types. The Company expects a deliberate roll out through year end before ramping originations in 2022.
Full Year 2021 Outlook
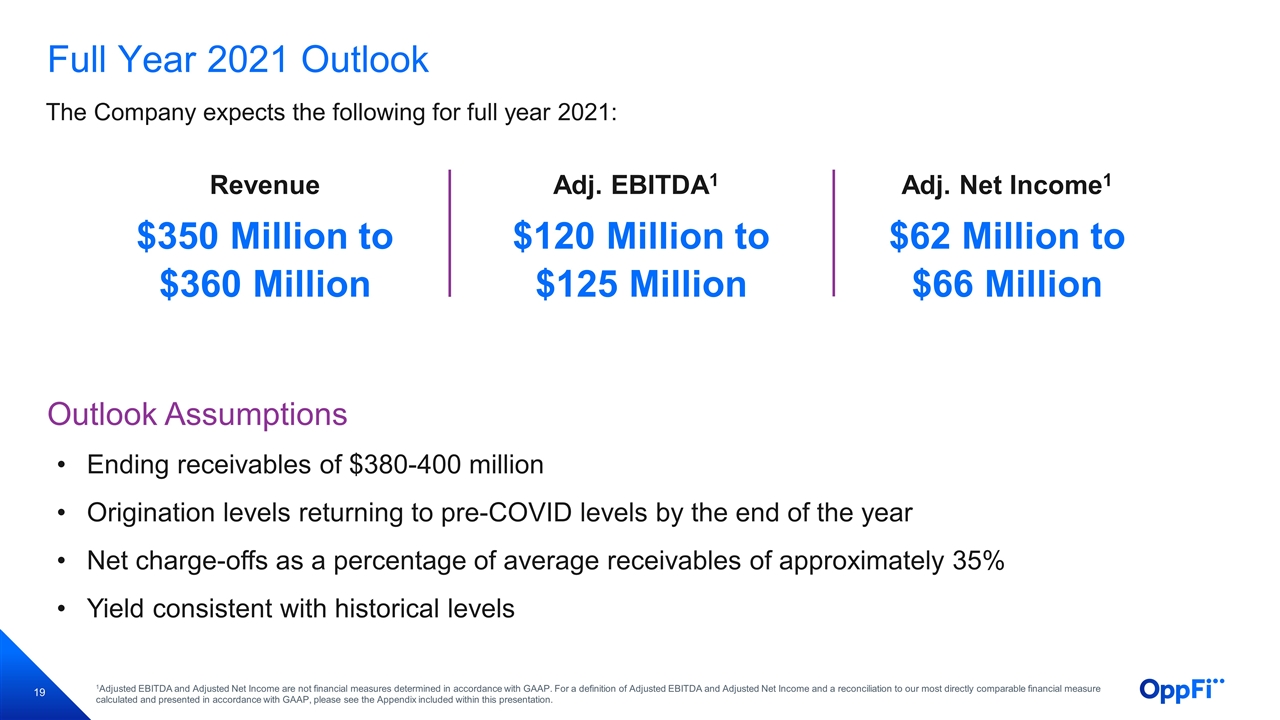
The Company expects the following for Full Year 2021:
| • | Revenue between $350 and $360 million |
| • | Adjusted EBITDA between $120 million and $125 million2 |
| • | Adjusted Net Income between $62 million and $66 million2 |
OppFi’s expectations for its full year 2021 Revenue, Adjusted EBITDA and Adjusted Net Income were prepared based on various material assumptions, including the following:
| • | Ending receivables3 of approximately $380-400 million, which would approach 50% growth over second quarter ending levels |
| • | Origination levels returning to pre-COVID levels by end of the year |
| • | Net charge-offs as a percentage of average receivables3 of approximately 35% |
| • | Yield consistent with historical levels |
As mentioned previously, the Company’s original outlook for 2021 did not contemplate any 2021 government stimulus. The Company’s current expectations reflect reduced consumer demand due to the current surge in the COVID Delta variant as well as the expected continuation of government stimulus programs that began in the second half of July. The Company views these programs as temporary and not affecting the long-term growth trajectory of its business. Similar to its financial performance in 2020 and the first half of 2021, the Company believes that any timing delays in demand should have a subsequent positive offset in credit quality and profitability. The Company sees potential upside to its guidance should the realized impact of these exogenous factors be less pronounced than it currently assumed.
Second Quarter Results of Operations
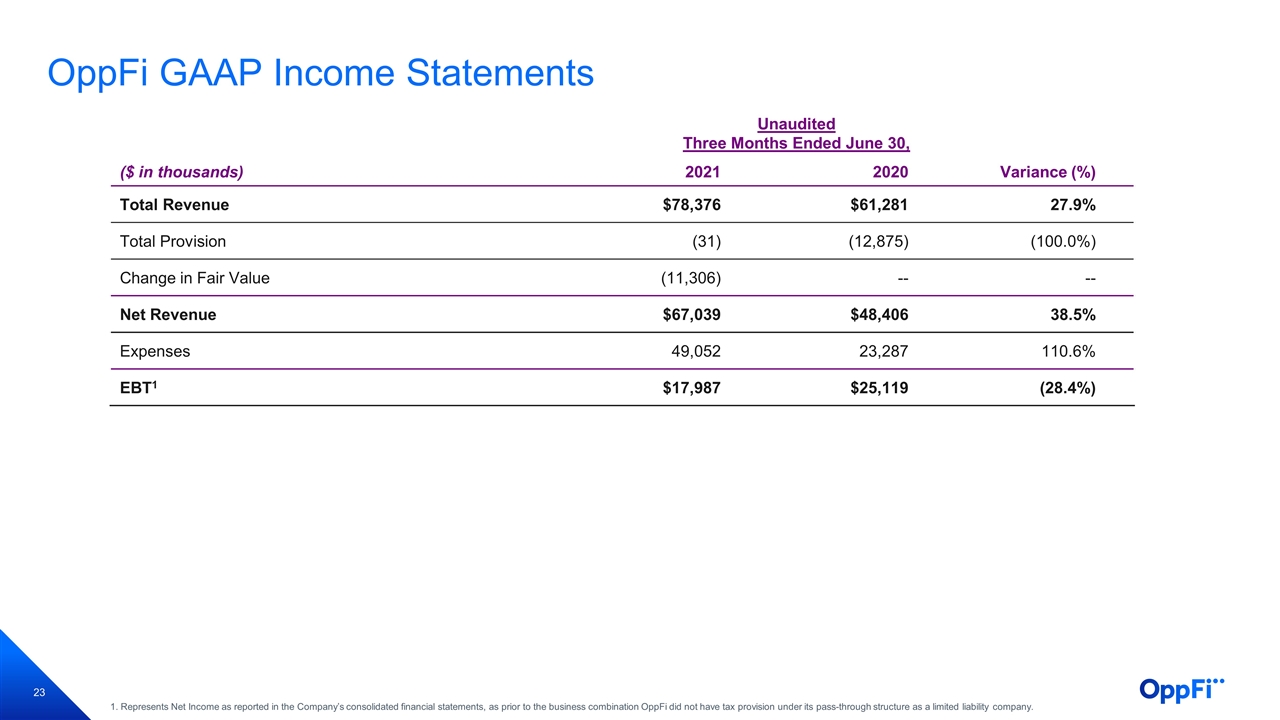
The following table presents OppFi’s consolidated results of operations for the three and six months ended June 30, 2021 and June 30, 2020.
On January 1, 2021, OppFi transitioned to the fair value (“FV”) accounting method for its receivables from the incurred credit loss application method. The below tables represent income statements that compare year over year performance both as previously reported in the Company’s 2020 audited financial statements, as well as on a pro forma basis for the application of the FV methodology.
GAAP Income Statements
| (In Thousands) Unaudited |
Three Months Ended June 30, | Variance | ||||||||||
| 2021 | 2020 | % | ||||||||||
| Total Revenue |
$ | 78,376 | $ | 61,281 | 27.9 | % | ||||||
|
|
|
|
|
|
|
|||||||
| Total Provision |
(31 | ) | (12,875 | ) | (100.0 | %) | ||||||
| Change in Fair Value |
(11,306 | ) | — | — | ||||||||
|
|
|
|
|
|
|
|||||||
| Net Revenue |
$ | 67,039 | $ | 48,406 | 38.5 | % | ||||||
|
|
|
|
|
|
|
|||||||
| Expenses |
49,052 | 23,287 | 110.6 | % | ||||||||
|
|
|
|
|
|
|
|||||||
| EBT(a) |
$ | 17,987 | $ | 25,119 | (28.4 | %) | ||||||
|
|
|
|
|
|
|
|||||||
| (a) | Represents Net Income as reported in the Company’s consolidated financial statements, as prior to the business combination OppFi did not have tax provision under its pass-through structure as a limited liability company. |
| (In Thousands) Unaudited |
Six Months Ended June 30, | Variance | ||||||||||
| 2021 | 2020 | % | ||||||||||
| Total Revenue |
$ | 162,633 | $ | 135,934 | 19.6 | % | ||||||
|
|
|
|
|
|
|
|||||||
| Total Provision |
(38 | ) | (44,875 | ) | (100.0 | %) | ||||||
| Change in Fair Value |
(33,695 | ) | — | — | ||||||||
|
|
|
|
|
|
|
|||||||
| Net Revenue |
$ | 128,900 | $ | 91,059 | 41.6 | % | ||||||
|
|
|
|
|
|
|
|||||||
| Expenses |
86,529 | 49,043 | 76.4 | % | ||||||||
|
|
|
|
|
|
|
|||||||
| EBT(a) |
$ | 42,371 | $ | 42,016 | 0.8 | % | ||||||
|
|
|
|
|
|
|
|||||||
| (a) | Represents Net Income as reported in the Company’s consolidated financial statements, as prior to the business combination OppFi did not have tax provision under its pass-through structure as a limited liability company. |
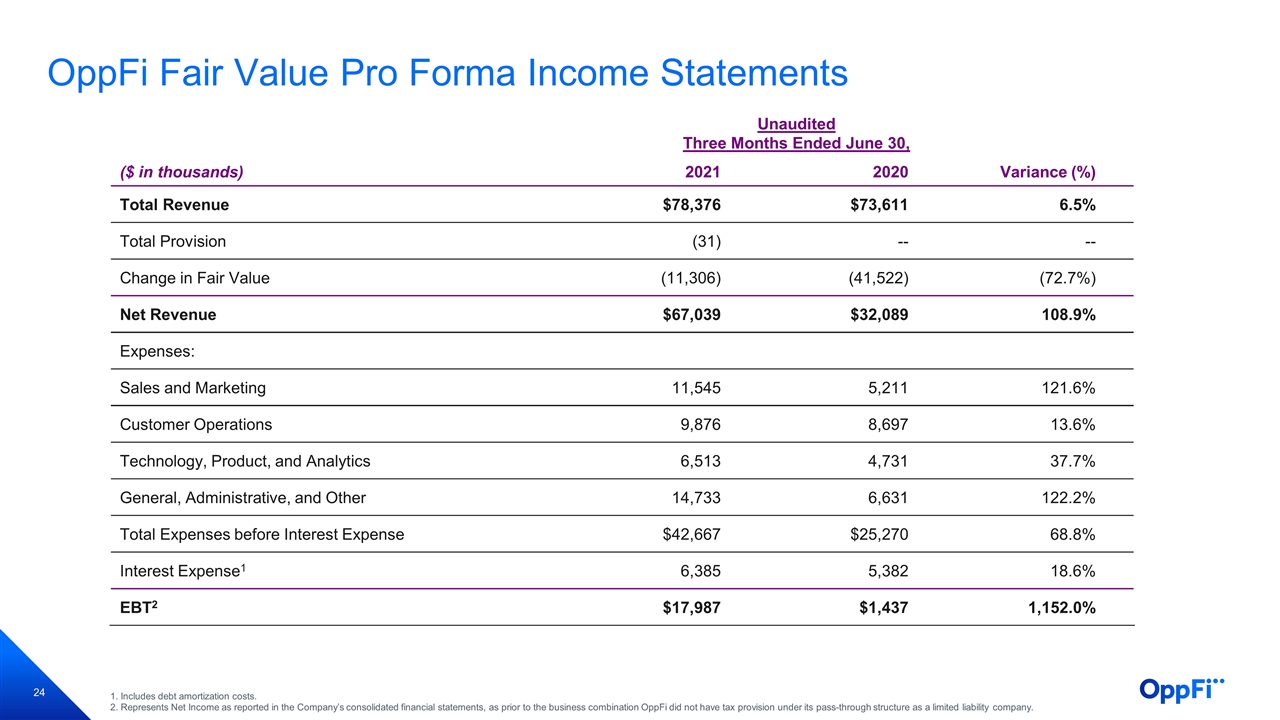
Fair Value Pro Forma Income Statements
| (In Thousands) Unaudited |
Three Months Ended June 30, | Variance | ||||||||||
| 2021 | 2020 | % | ||||||||||
| Total Revenue |
$ | 78,376 | $ | 73,611 | 6.5 | % | ||||||
| Total Provision |
(31 | ) | — | — | ||||||||
| Change in fair value of finance receivables |
(11,306 | ) | (41,522 | ) | (72.7 | %) | ||||||
|
|
|
|
|
|
|
|||||||
| Net Revenue |
$ | 67,039 | $ | 32,089 | 108.9 | % | ||||||
|
|
|
|
|
|
|
|||||||
| Expenses: |
||||||||||||
| Sales and Marketing |
11,545 | 5,211 | 121.6 | % | ||||||||
| Customer Operations |
9,876 | 8,697 | 13.6 | % | ||||||||
| Technology, Product, and Analytics |
6,513 | 4,731 | 37.7 | % | ||||||||
| General, Administrative, and Other |
14,733 | 6,631 | 122.2 | % | ||||||||
|
|
|
|
|
|
|
|||||||
| Total Expenses before Interest Expense |
$ | 42,667 | 25,270 | 68.8 | % | |||||||
|
|
|
|
|
|
|
|||||||
| Interest Expense (a) |
6,385 | 5,382 | 18.6 | % | ||||||||
| EBT (b) |
$ | 17,987 | $ | 1,437 | 1,152.0 | % | ||||||
|
|
|
|
|
|
|
|||||||
| (a) | Includes debt amortization costs. |
| (b) | Represents Net Income as reported in the Company’s consolidated financial statements, as prior to the business combination OppFi did not have tax provision under its pass-through structure as a limited liability company. |
| (In Thousands) Unaudited |
Six Months Ended June 30, | Variance | ||||||||||
| 2021 | 2020 | % | ||||||||||
| Total Revenue |
$ | 162,633 | $ | 162,580 | 0.0 | % | ||||||
| Total Provision |
(38 | ) | — | — | ||||||||
| Change in fair value of finance receivables |
(33,695 | ) | (75,590 | ) | (55.4 | %) | ||||||
|
|
|
|
|
|
|
|||||||
| Net Revenue |
$ | 128,900 | $ | 86,990 | 48.2 | % | ||||||
|
|
|
|
|
|
|
|||||||
| Expenses: |
||||||||||||
| Sales and Marketing |
19,480 | 15,845 | 22.9 | % | ||||||||
| Customer Operations |
19,485 | 18,615 | 4.7 | % | ||||||||
| Technology, Product, and Analytics |
12,340 | 9,174 | 34.5 | % | ||||||||
| General, Administrative, and Other |
24,231 | 13,220 | 83.3 | % | ||||||||
|
|
|
|
|
|
|
|||||||
| Total Expenses before Interest Expense |
$ | 75,536 | 56,854 | 32.9 | % | |||||||
|
|
|
|
|
|
|
|||||||
| Interest Expense (a) |
10,993 | 11,928 | (7.8 | %) | ||||||||
| EBT (b) |
$ | 42,371 | $ | 18,208 | 132.7 | % | ||||||
|
|
|
|
|
|
|
|||||||
| (a) | Includes debt amortization costs. |
| (b) | Represents Net Income as reported in the Company’s consolidated financial statements, as prior to the business combination OppFi did not have tax provision under its pass-through structure as a limited liability company. |
Condensed Balance Sheets
Comparison June 30, 2021 and December 31, 2020
The following table presents OppFi’s condensed balance sheet for June 30, 2021 and December 31, 2020:
| (In Thousands) Unaudited |
June 30, 2021 | December 31, 2020 | ||||||
| Assets |
||||||||
| Cash and restricted cash |
$ | 120,779 | $ | 45,657 | ||||
| Finance receivables at fair value |
296,381 | — | ||||||
| Finance receivables at amortized cost, net |
132 | 222,243 | ||||||
| Other assets |
19,943 | 17,943 | ||||||
|
|
|
|
|
|||||
| Total assets |
$ | 437,235 | $ | 285,843 | ||||
|
|
|
|
|
|||||
| Liabilities and members’ equity |
||||||||
| Current liabilities |
$ | 29,249 | $ | 28,406 | ||||
| Total debt |
230,647 | 158,105 | ||||||
|
|
|
|
|
|||||
| Total liabilities |
$ | 259,896 | $ | 186,511 | ||||
|
|
|
|
|
|||||
| Total members’ equity |
177,339 | 99,332 | ||||||
| Total liabilities and members’ equity |
$ | 437,235 | $ | 285,843 | ||||
|
|
|
|
|
|||||
Total cash increased by $75.1 million as of June 30, 2021, driven by free cash flow from operations as well as increased borrowings under the Company’s refinanced corporate credit facility and higher utilization of senior debt. Finance receivables in 2021 increased as a result of the election of the fair value option in 2021.
Total debt increased by $72.5 million driven by an increase in utilization of leverage facilities of $46.6 million and a $26.0 million net impact of the March 2021 corporate credit facility refinancing. Total equity increased by $78.0 million driven by net income for the first six months of $42.4 million and impact of adoption of the fair value method of accounting of $69.4 million, partially offset by distributions related to the 2020 tax year of $34.0 million.
Conference Call
Management will host a webcast and conference call today, August 10, 2021 at 5:30 pm ET to discuss the Company’s financial results for the second quarter ended June 30, 2021. The conference call will be made available in the Investor Relations page of the Company’s website. To listen to a live broadcast, go to the site at least 15 minutes prior to the scheduled start time in order to register.
The conference call can also be accessed by the following dial-in information:
| • | Conference ID: 13721842 |
| • | Domestic: 1-877-705-6003 |
| • | International: 1-201-493-6725 |
A replay of the call will also be available on the Company’s website approximately two hours after the live call through August 24, 2021. To access the replay, dial 1-844-512-2921 (Domestic) or 1-412-317-6671 (International). The replay pin number is 13721842.
About OppFi
OppFi (NYSE: OPFI) is a leading financial technology platform that powers banks to offer accessible products and a top-rated experience to everyday consumers. OppFi’s platform facilitates the installment loan products, OppLoans and SalaryTap, and the credit card product, OppFi Card. The company has been an Inc. 5000 company for five straight years, a two-time Deloitte’s Technology Fast 500™, and the seventh fastest-growing company in Chicagoland in 2021 by Crain’s Chicago Business. The company was also listed on the Forbes America 2021 list of America’s Best Startup Employers and Built In’s 2021 Best Places to Work in Chicago. OppFi maintains an A+ rating from the Better Business Bureau (BBB) and maintains a 4.8/5 star rating with more than 14,000 online customer reviews, making it one of the top customer-rated financial platforms online. For more information, please visit oppfi.com.
Contacts:
Investor Relations: [email protected]
Media Relations: [email protected]
Forward-Looking Statements
This press release includes “forward-looking statements’’ within the meaning of the “safe harbor” provisions of the Private Securities Litigation Reform Act of 1995 , Section 27A of the Securities Act of 1933, as amended, and Section 21E of the Securities Exchange Act of 1934, as amended. OppFi’s actual results may differ from its expectations, estimates and projections and consequently, you should not rely on these forward-looking statements as predictions of future events. Words such as “expect,” “estimate,” “project,” “budget,” “forecast,” “anticipate,” “intend,” “plan,” “may,” “will,” “could,” “should,” “believes,” “predicts,” “potential,” “possible,” “continue,” and similar expressions may identify forward-looking statements, but the absence of these words does not mean that a statement is not forward-looking. These forward-looking statements include, without limitation, OppFi’s expectations for its full year 2021 revenue, Adjusted EBITDA and Adjusted Net Income, OppFi’s expectations with respect to the future performance of OppFi’s platform, OppFi’s expectations for its growth and profitability and OppFi’s new products and their performance. These forward-looking statements are based on OppFi’s current expectations and assumptions about future events and are based on currently available information as to the outcome and timing of future events. These forward-looking statements involve significant risks and uncertainties that could cause the actual results to differ materially from the expected results. Most of these factors are outside OppFi’s control and are difficult to predict. Factors that may cause such differences include, but are not limited to: the impact of COVID-19 on OppFi’s business; the impact of stimulus or other government programs; the risk that the business combination disrupts current plans and operations; the ability to recognize the anticipated benefits of the business combination, which may be affected by, among other things, competition, the ability of OppFi to grow and manage growth profitably and retain its key employees; costs related to the business combination; changes in applicable laws or regulations; the possibility that OppFi may be adversely affected by other economic, business, and/or competitive factors; and other risks and uncertainties indicated from time to time in OppFi’s filings with the United States Securities and Exchange Commission, in particular, contained in the section or sections captioned “Risk Factors.” OppFi cautions that the foregoing list of factors is not exclusive, and readers should not place undue reliance upon any forward-looking statements, which speak only as of the date made. OppFi does not undertake or accept any obligation or undertaking to release publicly any updates or revisions to any forward-looking statements to reflect any change in its expectations or any change in events, conditions or circumstances on which any such statement is based.
Non-GAAP Financial Measures
This press release includes certain non-GAAP financial measures that are unaudited and do not conform to GAAP, including Adjusted Revenue, Adjusted Net Income and Adjusted EBITDA. Adjusted Revenue is defined as Total Revenue adjusted to include amortization of loan origination costs. Adjusted Net Income is defined as current earnings before tax for audited annual financials and unaudited for quarterly financials, pro forma for fair value accounting for finance receivables adoption, plus (1) recruiting fees, severance and relocation, (2) amortization of debt transaction costs and (3) other addbacks and one-time expenses following the closing of the business combination, including one-time implementation fees, stock compensation expenses, IPO readiness costs and management fees; and assumes a tax rate of 25%. Adjusted EBITDA is defined as Adjusted Net Income, pro forma for fair value accounting for finance receivables adoption, plus (1) taxes at an assumed 25% tax rate for change in tax status upon completion of the business combination, (2) depreciation and amortization, (3) interest expense and (4) business (non-income) taxes. The pro forma fair value accounting adjustments are due to OppFi’s transition from an incurred credit loss application to a fair value application acceptable under US
GAAP. Historically, under the incurred credit loss application, OppFi has reserved for life losses due to the short duration of receivables. These financial measures are not prepared in accordance with accounting principles generally accepted in the United States and may be different from non-GAAP financial measures used by other companies. OppFi believes that the use of these non-GAAP financial measures provides an additional tool for investors to use in evaluating ongoing operating results and trends. These non-GAAP measures with comparable names should not be considered in isolation from, or as an alternative to, financial measures determined in accordance with GAAP. A reconciliation for OppFi’s non-GAAP financial measures to the most directly comparable GAAP financial measures is in the table below.
The Non-GAAP financial measures of Adjusted EBITDA and Adjusted Net Income for the full year 2021 are provided in this press release only on a non-GAAP basis because a reconciliation to the most comparable GAAP financial measures, Net Revenue and GAAP Net Income, is not available without unreasonable effort. OppFi believes that such items and, accordingly, the other items of the reconciliation, would require an unreasonable effort to predict with reasonable certainty the amount or timing of non-GAAP adjustments used to calculate these Non-GAAP financial measures. OppFi believes that any such forecast would result in a broad range of projected values that would not be meaningful to investors.
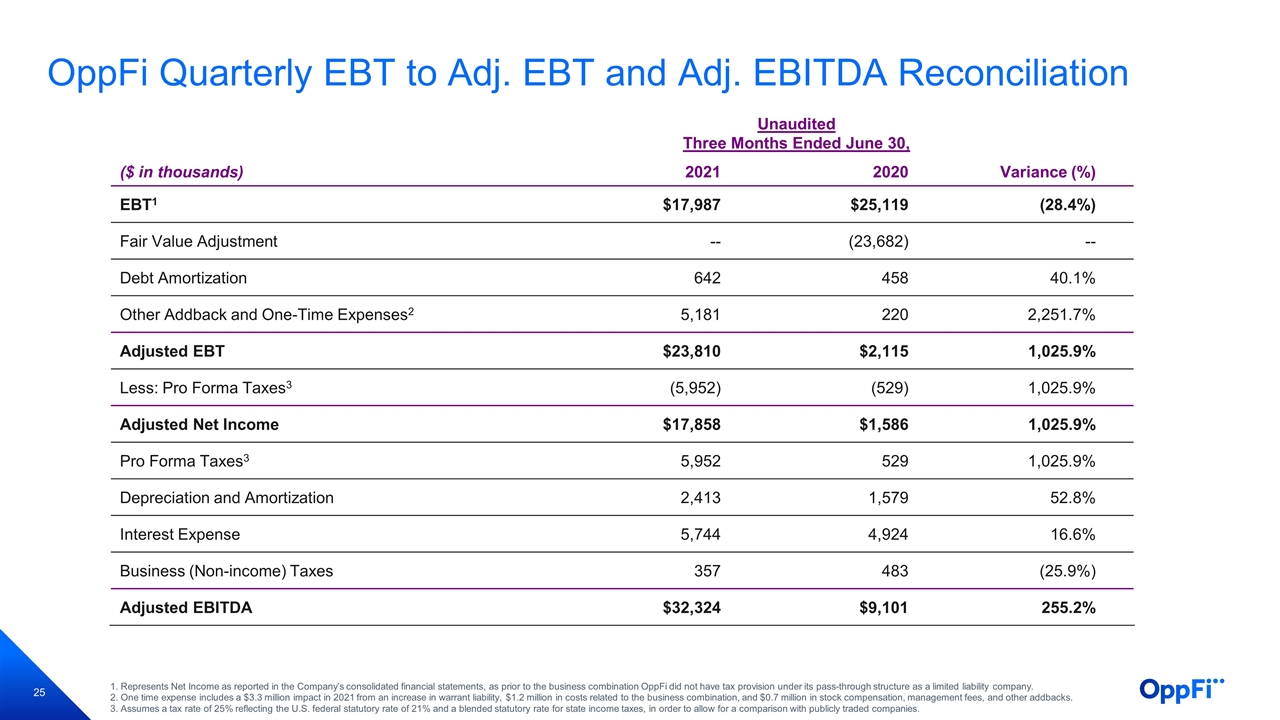
Reconciliation of Non-GAAP Financial Measures
| (In Thousands) Unaudited |
Three Months Ended June 30, | Variance | ||||||||||
| 2021 | 2020 | % | ||||||||||
| EBT(a) |
$ | 17,987 | $ | 25,119 | (28.4 | %) | ||||||
|
|
|
|
|
|
|
|||||||
| FV Adjustments |
— | (23,682 | ) | — | ||||||||
| Debt Amortization |
642 | 458 | 40.1 | % | ||||||||
|
|
|
|
|
|
|
|||||||
| Other Addback and One-Time Expenses(b) |
5,181 | 220 | 2,251.7 | % | ||||||||
|
|
|
|
|
|
|
|||||||
| Adjusted EBT |
$ | 23,810 | $ | 2,115 | 1,025.9 | % | ||||||
|
|
|
|
|
|
|
|||||||
| Less: Pro Forma Taxes(c) |
(5,952 | ) | (529 | ) | 1,025.9 | % | ||||||
|
|
|
|
|
|
|
|||||||
| Adjusted Net Income |
$ | 17,858 | $ | 1,586 | 1,025.9 | % | ||||||
|
|
|
|
|
|
|
|||||||
| Pro Forma Taxes(c) |
5,952 | 529 | 1,025.9 | % | ||||||||
| Depreciation and Amortization |
2,413 | 1,579 | 52.8 | % | ||||||||
| Interest Expense |
5,744 | 4,924 | 16.6 | % | ||||||||
| Business (Non-income) Taxes |
357 | 483 | (25.9 | %) | ||||||||
|
|
|
|
|
|
|
|||||||
| Adjusted EBITDA |
$ | 32,324 | $ | 9,101 | 255.2 | % | ||||||
|
|
|
|
|
|
|
|||||||
| (a) | Represents Net Income as reported in the Company’s consolidated financial statements, as prior to the business combination OppFi did not have tax provision under its pass-through structure as a limited liability company. |
| (b) | One-time expense includes a $3.3 million impact in 2021 from an increase in warrant liability, $1.2 million in costs related to the business combination, and $0.7 million in stock compensation, management fees, and other addbacks. |
| (c) | Assumes a tax rate of 25% reflecting the U.S. federal statutory rate of 21% and a blended statutory rate for state income taxes, in order to allow for a comparison with publicly traded companies. |
| (In Thousands) Unaudited |
Six Months Ended June 30, | Variance | ||||||||||
| 2021 | 2020 | % | ||||||||||
| EBT(a) |
$ | 42,371 | $ | 42,016 | 0.8 | % | ||||||
|
|
|
|
|
|
|
|||||||
| FV Adjustments |
— | (23,808 | ) | — | ||||||||
| Debt Amortization |
1,163 | 977 | 19.0 | % | ||||||||
|
|
|
|
|
|
|
|||||||
| Other Addback and One-Time Expenses(b) |
5,995 | 277 | 2,070.4 | % | ||||||||
|
|
|
|
|
|
|
|||||||
| Adjusted EBT |
$ | 49,529 | $ | 19,462 | 154.5 | % | ||||||
|
|
|
|
|
|
|
|||||||
| Less: Pro Forma Taxes(c) |
(12,382 | ) | (4,865 | ) | 154.5 | % | ||||||
|
|
|
|
|
|
|
|||||||
| Adjusted Net Income |
$ | 37,147 | $ | 14,597 | 154.5 | % | ||||||
|
|
|
|
|
|
|
|||||||
| Pro Forma Taxes(c) |
12,382 | 4,865 | 154.5 | % | ||||||||
| Depreciation and Amortization |
4,577 | 2,976 | 53.8 | % | ||||||||
| Interest Expense |
9,830 | 10,951 | (10.2 | %) | ||||||||
| Business (Non-income) Taxes |
792 | 656 | 20.8 | % | ||||||||
|
|
|
|
|
|
|
|||||||
| Adjusted EBITDA |
$ | 64,728 | $ | 34,045 | 90.1 | % | ||||||
|
|
|
|
|
|
|
|||||||
| (a) | Represents Net Income as reported in the Company’s consolidated financial statements, as prior to the business combination OppFi did not have tax provision under its pass-through structure as a limited liability company. |
| (b) | One-time expense includes a $3.3 million impact in 2021 from an increase in warrant liability, $1.4 million in costs related to the business combination, and $1.3 million in stock compensation, management fees, and other addbacks. |
| (c) | Assumes a tax rate of 25% reflecting the U.S. federal statutory rate of 21% and a blended statutory rate for state income taxes, in order to allow for a comparison with publicly traded companies. |
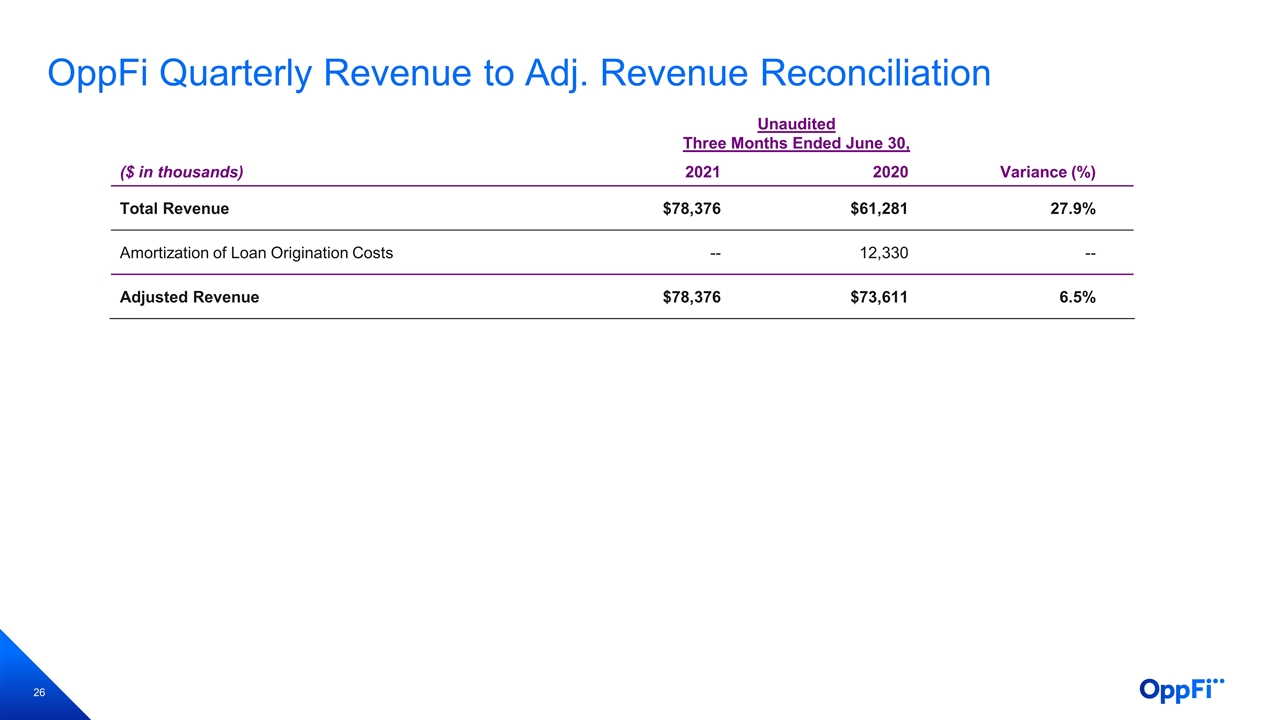
Adjusted Revenue
| (In Thousands) Unaudited |
Three Months Ended June 30, | Variance | ||||||||||
| 2021 | 2020 | % | ||||||||||
| Total Revenue |
$ | 78,376 | $ | 61,281 | 27.9 | % | ||||||
|
|
|
|
|
|
|
|||||||
| Amortization of Loan Origination Costs |
— | 12,330 | — | |||||||||
|
|
|
|
|
|
|
|||||||
| Adjusted Revenue |
$ | 78,376 | $ | 73,611 | 6.5 | % | ||||||
|
|
|
|
|
|
|
|||||||
| (In Thousands) Unaudited |
Six Months Ended June 30, | Variance | ||||||||||
| 2021 | 2020 | % | ||||||||||
| Total Revenue |
$ | 162,633 | $ | 135,934 | 19.6 | % | ||||||
|
|
|
|
|
|
|
|||||||
| Amortization of Loan Origination Costs |
— | 26,646 | — | |||||||||
|
|
|
|
|
|
|
|||||||
| Adjusted Revenue |
$ | 162,633 | $ | 162,580 | 0.0 | % | ||||||
|
|
|
|
|
|
|
|||||||
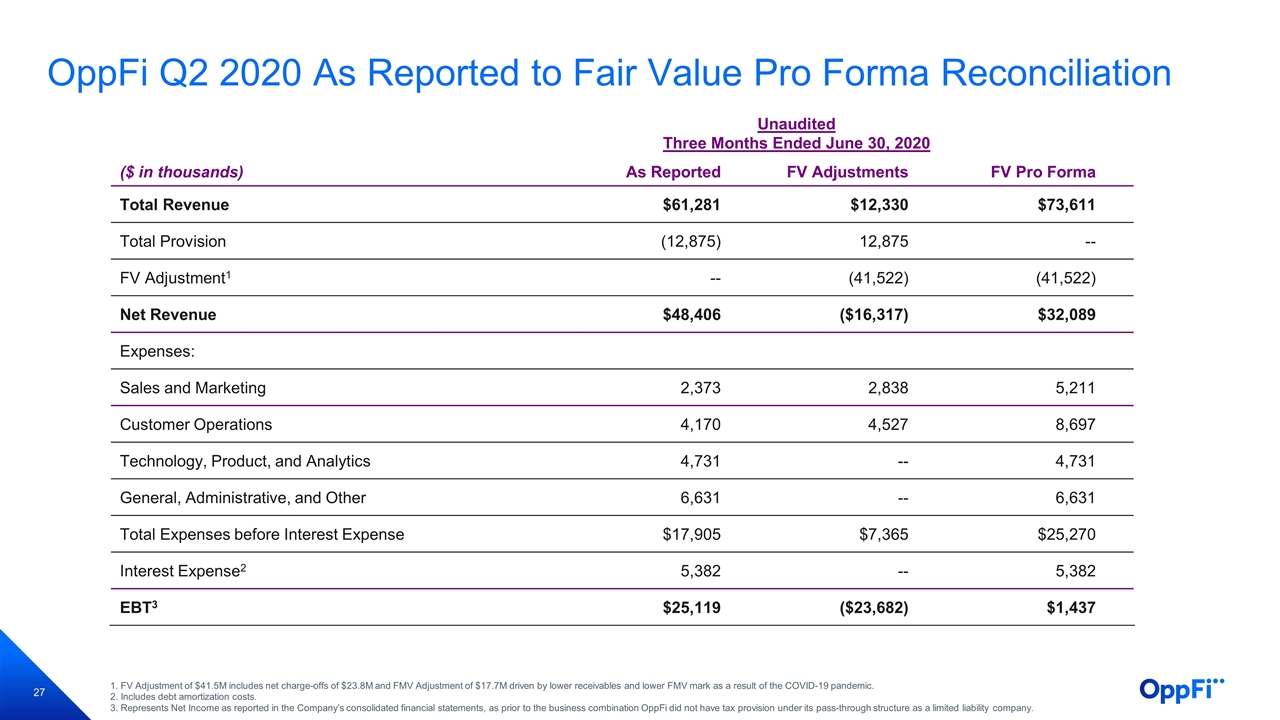
Fair Value Pro Forma
| (In Thousands) Unaudited |
Three Months Ended June 30, 2020 | |||||||||||
| As Reported |
FV Adjustments |
FV Pro Forma |
||||||||||
| Total Revenue |
$ | 61,281 | $ | 12,330 | $ | 73,611 | ||||||
| Total Provision |
(12,875 | ) | 12,875 | — | ||||||||
| FV Adjustment(a) |
— | (41,522 | ) | (41,522 | ) | |||||||
|
|
|
|
|
|
|
|||||||
| Net Revenue |
$ | 48,406 | $ | (16,317 | ) | $ | 32,089 | |||||
|
|
|
|
|
|
|
|||||||
| Expenses: |
||||||||||||
| Sales and Marketing |
2,373 | 2,838 | 5,211 | |||||||||
| Customer Operations |
4,170 | 4,527 | 8,697 | |||||||||
| Technology, Product, and Analytics |
4,731 | — | 4,731 | |||||||||
| General, Administrative, and Other |
6,631 | — | 6,631 | |||||||||
|
|
|
|
|
|
|
|||||||
| Total Expenses before Interest Expense |
$ | 17,905 | $ | 7,365 | $ | 25,270 | ||||||
|
|
|
|
|
|
|
|||||||
| Interest Expense(b) |
5,382 | — | 5,382 | |||||||||
| EBT(c) |
$ | 25,119 | $ | (23,682 | ) | $ | 1,437 | |||||
|
|
|
|
|
|
|
|||||||
| (a) | FV Adjustment of $41.5M includes net charge-offs of $23.8M and FMV Adjustment of $17.7M driven by lower receivables and lower FMV mark as a result of the COVID-19 pandemic. |
| (b) | Includes debt amortization costs. |
| (c) | Represents Net Income as reported in the Company’s consolidated financial statements, as prior to the business combination OppFi did not have tax provision under its pass-through structure as a limited liability company. |
| (In Thousands) Unaudited |
Six Months Ended June 30, 2020 | |||||||||||
| As Reported |
FV Adjustments |
FV Pro Forma |
||||||||||
| Total Revenue |
$ | 135,934 | $ | 26,646 | $ | 162,580 | ||||||
| Total Provision |
(44,875 | ) | 44,875 | — | ||||||||
| FV Adjustment(a) |
— | (75,590 | ) | (75,590 | ) | |||||||
|
|
|
|
|
|
|
|||||||
| Net Revenue |
$ | 91,059 | $ | (4,069 | ) | $ | 86,990 | |||||
|
|
|
|
|
|
|
|||||||
| Expenses: |
||||||||||||
| Sales and Marketing |
6,492 | 9,353 | 15,845 | |||||||||
| Customer Operations |
8,229 | 10,386 | 18,615 | |||||||||
| Technology, Product, and Analytics |
9,174 | — | 9,174 | |||||||||
| General, Administrative, and Other |
13,220 | — | 13,220 | |||||||||
|
|
|
|
|
|
|
|||||||
| Total Expenses before Interest Expense |
$ | 37,115 | $ | 19,739 | $ | 56,854 | ||||||
|
|
|
|
|
|
|
|||||||
| Interest Expense(b) |
11,928 | — | 11,928 | |||||||||
| EBT(c) |
$ | 42,016 | $ | (23,808 | ) | $ | 18,208 | |||||
|
|
|
|
|
|
|
|||||||
| (a) | FV Adjustment of $75.6M includes net charge-offs of $56.0M and FMV Adjustment of $19.6M driven by lower receivables and lower FMV mark as a result of the COVID-19 pandemic. |
| (b) | Includes debt amortization costs. |
| (c) | Represents Net Income as reported in the Company’s consolidated financial statements, as prior to the business combination OppFi did not have tax provision under its pass-through structure as a limited liability company. |
[1] Non-GAAP Financial Measures: Adjusted Net Income, Adjusted Revenue and Adjusted EBITDA are financial measures that have not been prepared in accordance with Generally Accepted Accounting Principles (“GAAP”). See the “Note Regarding Non-GAAP Financial Measures” below for a detailed description and reconciliation of such Non-GAAP financial measures to their most directly comparable GAAP financial measures.
[2] Non-GAAP Financial Measures: Adjusted EBITDA and Adjusted Net Income are financial measures that have not been prepared in accordance with GAAP. The Non-GAAP financial measures of Adjusted EBITDA and Adjusted Net Income for the full year 2021 are provided only on a non-GAAP basis because a reconciliation to the most comparable GAAP financial measures, Net Revenue and GAAP Net Income, is not available without unreasonable effort. OppFi believes that such item and, accordingly, the other items of the reconciliation, would require an unreasonable effort to predict with reasonable certainty the amount or timing of non-GAAP adjustments used to calculate these Non-GAAP financial measures. OppFi believes that any such forecast would result in a broad range of projected values that would not be meaningful to investors.
[3] Receivables defined as unpaid principal of both on- and off-balance sheet loans

Q2 2021 Earnings Presentation August 2021 A Leading FinTech Platform for the Everyday Consumer Exhibit 99.2
Disclaimer This presentation (the “Presentation”) of OppFi Inc. (“OppFi” or the “Company”) is for information purposes only. Certain information contained herein has been derived from sources prepared by third parties. While such information is believed to be reliable for the purposes used herein, the Company makes no representation or warranty with respect to the accuracy of such information. Trademarks and trade names referred to in this Presentation are the property of their respective owners. The information contained herein does not purport to be all-inclusive. This Presentation does not constitute investment, tax, or legal advice. No representation or warranty, express or implied, is or will be given by the Company or any of its respective affiliates, directors, officers, employees or advisers or any other person as to the accuracy or completeness of the information in this Presentation, and no responsibility or liability whatsoever is accepted for the accuracy or sufficiency thereof or for any errors, omissions or misstatements, negligent or otherwise, relating thereto. The information contained in this Presentation is preliminary in nature and is subject to change, and any such changes may be material. The Company disclaims any duty to update the information contained in this Presentation, which information is given only as of the date of this Presentation unless otherwise stated herein. Forward-Looking Statements This Presentation includes "forward-looking statements" within the meaning of the "safe harbor" provisions of the Private Securities Litigation Reform Act of 1995 , Section 27A of the Securities Act of 1933, as amended, and Section 21E of the Securities Exchange Act of 1934, as amended. OppFi's actual results may differ from its expectations, estimates and projections and consequently, you should not rely on these forward-looking statements as predictions of future events. Words such as "expect," "estimate," "project," "budget," "forecast," "anticipate," "intend," "plan," "may," "will," "could," "should," "believes," "predicts," "potential," “possible,” "continue," and similar expressions may identify forward-looking statements, but the absence of these words does not mean that a statement is not forward-looking. These forward-looking statements include, without limitation, OppFi’s expectations for its full year 2021 revenue, Adjusted EBITDA and Adjusted Net Income, OppFi's expectations with respect to the future performance of OppFi’s platform, OppFi’s expectations for its growth and profitability and OppFi's new products and their performance. These forward-looking statements are based on OppFi’s current expectations and assumptions about future events and are based on currently available information as to the outcome and timing of future events. These forward-looking statements involve significant risks and uncertainties that could cause the actual results to differ materially from the expected results. Most of these factors are outside OppFi's control and are difficult to predict. Factors that may cause such differences include, but are not limited to: the impact of COVID-19 on OppFi's business; the impact of stimulus or other government programs; the risk that the business combination disrupts current plans and operations; the ability to recognize the anticipated benefits of the business combination, which may be affected by, among other things, competition, the ability of OppFi to grow and manage growth profitably and retain its key employees; costs related to the business combination; changes in applicable laws or regulations; the possibility that OppFi may be adversely affected by other economic, business, and/or competitive factors; and other risks and uncertainties indicated from time to time in OppFi’s filings with the United States Securities and Exchange Commission, in particular, contained in the section or sections captioned “Risk Factors.” OppFi cautions that the foregoing list of factors is not exclusive, and readers should not place undue reliance upon any forward-looking statements, which speak only as of the date made. OppFi does not undertake or accept any obligation or undertaking to release publicly any updates or revisions to any forward-looking statements to reflect any change in its expectations or any change in events, conditions or circumstances on which any such statement is based. Non-GAAP Financial Measures Certain financial information and data contained this Presentation is unaudited and does not conform to Regulation S-X. Accordingly, such information and data may not be included in, may be adjusted in or may be presented differently in, any periodic filing, information or proxy statement, or prospectus or registration statement to be filed by the Company with the SEC. Some of the financial information and data contained in this Presentation, such as Adjusted Net Income and CAGR and Margin thereof, and Adjusted EBITDA, Adjusted EBT and CAGR and Margin thereof, have not been prepared in accordance with United States generally accepted accounting principles (“GAAP”). These non-GAAP measures of financial results are not GAAP measures of our financial results or liquidity and should not be considered as an alternative to net income (loss) as a measure of financial results, cash flows from operating activities as a measure of liquidity, or any other performance measure derived in accordance with GAAP. The Company believes these non-GAAP measures of financial results provide useful information to management and investors regarding certain financial and business trends relating to the Company’s financial condition and results of operations. The Company’s management uses these non-GAAP measures for trend analyses and for budgeting and planning purposes. The Company believes that the use of these non-GAAP financial measures provides an additional tool for investors to use in evaluating projected operating results and trends in and in comparing the Company’s financial measures with other similar companies, many of which present similar non-GAAP financial measures to investors. Management does not consider these non-GAAP measures in isolation or as an alternative to financial measures determined in accordance with GAAP. The principal limitation of these non-GAAP financial measures is that they exclude significant expenses and income that are required by GAAP to be recorded in the Company’s financial statements. In addition, they are subject to inherent limitations as they reflect the exercise of judgments by management about which expense and income are excluded or included in determining these non-GAAP financial measures. In order to compensate for these limitations, management presents non-GAAP financial measures in connection with GAAP results. You should review the Company’s audited financial statements, which have been filed by the Company with the SEC. A reconciliation for the Company’s non-GAAP financial measures to the most directly comparable GAAP financial measures is located in the Appendix. A reconciliation of the 2021 full year non-GAAP financial measures to the most directly comparable GAAP financial measures is not included in this Presentation, because, without unreasonable efforts, the Company is unable to predict with reasonable certainty the amount or timing of non-GAAP adjustments that are used to calculate these Non-GAAP financial measures. Projected Financial Information This Presentation contains financial forecasts, including with respect to the Company’s estimated and projected revenue, revenue growth, Adjusted Net Income, Adjusted EBT, Adjusted EBITDA, and CAGR and margins with respect to Adjusted Net Income and Adjusted EBITDA. The Company’s certified public accountant has not audited, reviewed, compiled, or performed any procedures with respect to the projections for the purpose of their inclusion in this Presentation, and accordingly, has not expressed an opinion or provided any other form of assurance with respect thereto for the purpose of this Presentation. These projections should not be relied upon as being necessarily indicative of future results. Any estimates, forecasts or projections set forth in the Presentation have been prepared by the Company in good faith on a basis believed to be reasonable. Such estimates, forecasts and projections involve significant elements of subjective judgment and analysis and reflect numerous judgments, estimates and assumptions that are inherently uncertain in prospective financial information of any kind. As such, no representation can be made as to the attainability of such estimates, forecasts and projections. The recipient is cautioned that such estimates, forecasts or projections have not been audited and have not been prepared in conformity with GAAP. The estimates, forecasts and projections included in this Presentation are subject to a wide variety of significant business, economic and competitive risks and uncertainties that could cause actual results to differ materially from those contained in the prospective financial information, which include, but are not limited to, those mentioned in the prior paragraphs under the caption “Forward-Looking Statements.” The recipient therefore should not rely on the estimates, forecasts or projections contained in the Presentation. No Offer or Solicitation This presentation does not constitute an offer to sell, or the solicitation of an offer to buy, any securities, nor shall there be any sale of securities in any states or jurisdictions in which such offer, solicitation or sale would be unlawful. No offer of securities shall be made except by means of a prospectus meeting the requirements of Section 10 of the Securities Act. Website This Presentation contains reproductions and references to the Company’s website and mobile content. The contents of the website and mobile content are not incorporated into this Presentation. Any references to URLs for the websites are intended to be inactive textual references only.

Presenters Jared Kaplan OppFi, CEO Shiven Shah OppFi, CFO

OppFi Overview A platform that puts you in control
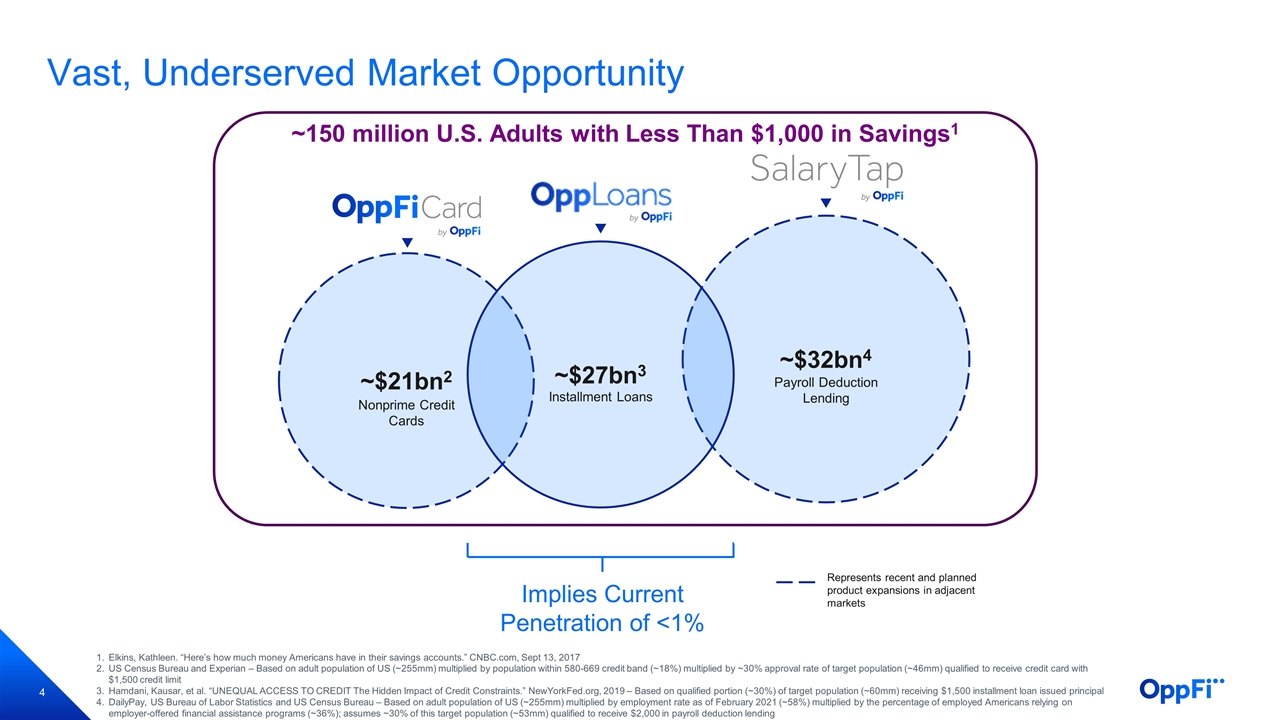
Vast, Underserved Market Opportunity Elkins, Kathleen. “Here’s how much money Americans have in their savings accounts.” CNBC.com, Sept 13, 2017 US Census Bureau and Experian – Based on adult population of US (~255mm) multiplied by population within 580-669 credit band (~18%) multiplied by ~30% approval rate of target population (~46mm) qualified to receive credit card with $1,500 credit limit Hamdani, Kausar, et al. “UNEQUAL ACCESS TO CREDIT The Hidden Impact of Credit Constraints.” NewYorkFed.org, 2019 – Based on qualified portion (~30%) of target population (~60mm) receiving $1,500 installment loan issued principal DailyPay, US Bureau of Labor Statistics and US Census Bureau – Based on adult population of US (~255mm) multiplied by employment rate as of February 2021 (~58%) multiplied by the percentage of employed Americans relying on employer-offered financial assistance programs (~36%); assumes ~30% of this target population (~53mm) qualified to receive $2,000 in payroll deduction lending Implies Current Penetration of <1% ~$21bn2 Nonprime Credit Cards ~$32bn4 Payroll Deduction Lending ~$27bn3 Installment Loans Represents recent and planned product expansions in adjacent markets ~150 million U.S. Adults with Less Than $1,000 in Savings1
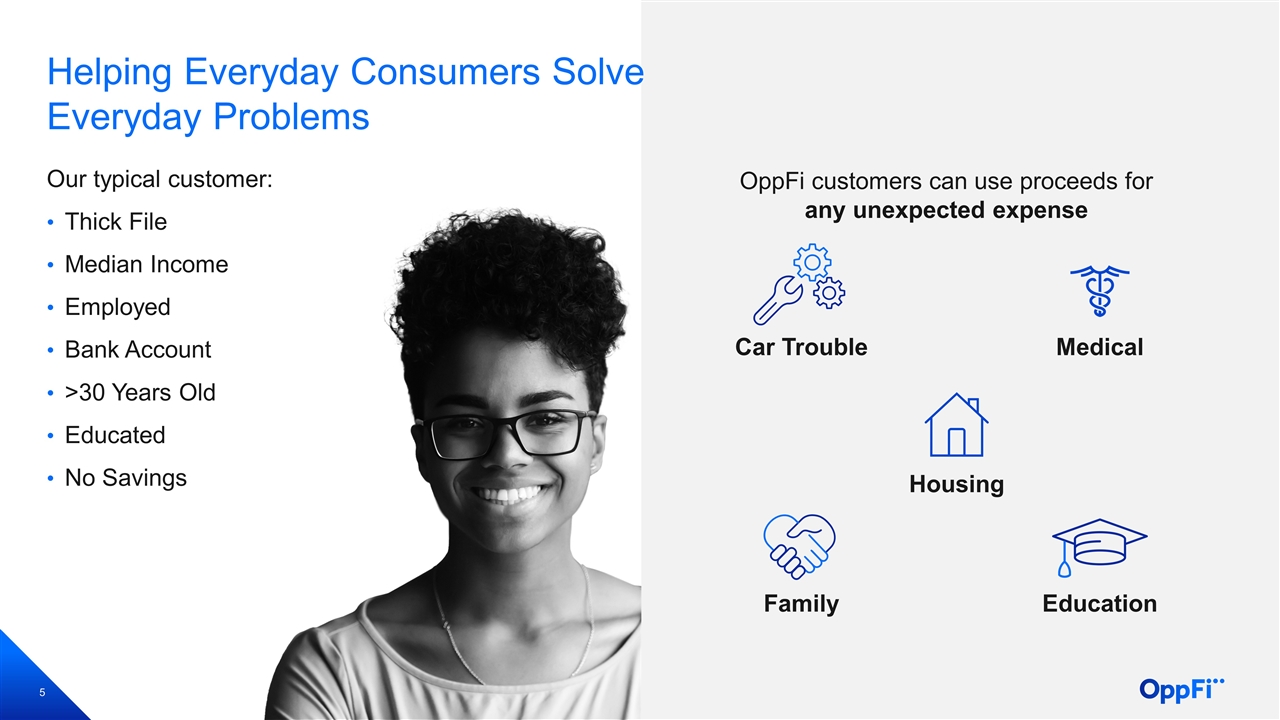
OppFi customers can use proceeds for any unexpected expense Helping Everyday Consumers Solve Everyday Problems Our typical customer: Thick File Median Income Employed Bank Account >30 Years Old Educated No Savings Medical Education Family Car Trouble Housing
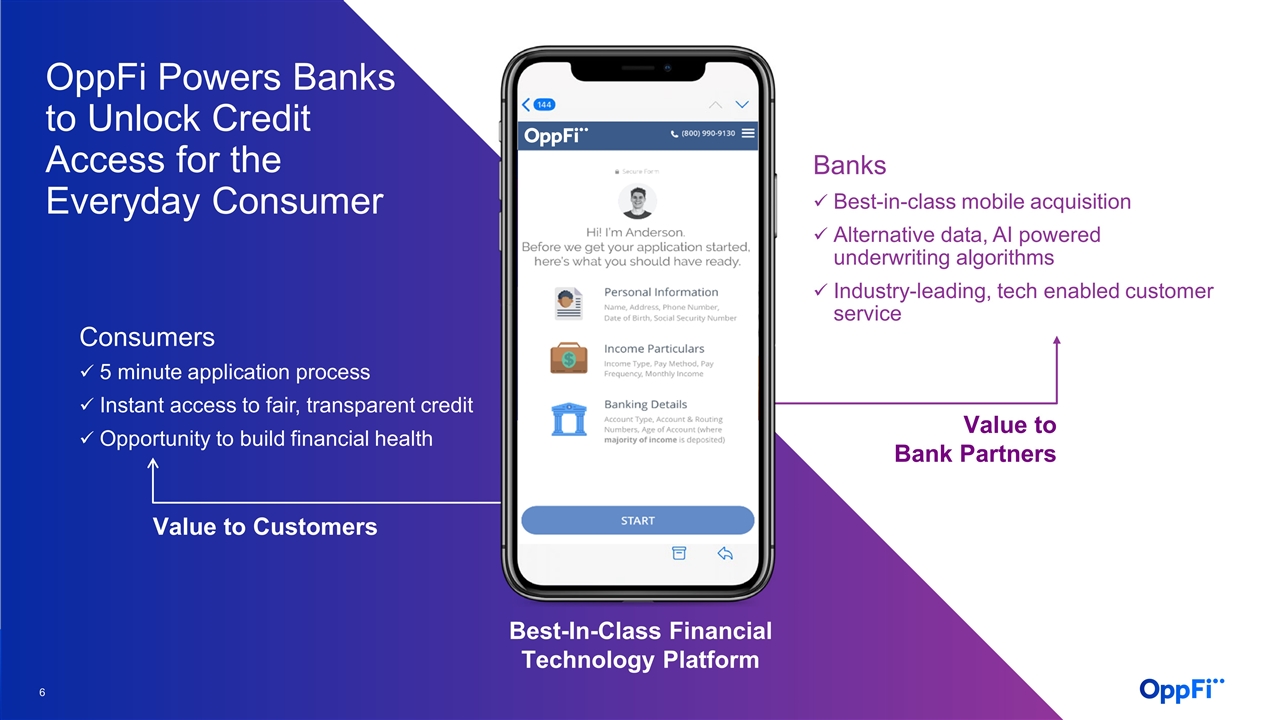
Consumers 5 minute application process Instant access to fair, transparent credit Opportunity to build financial health Best-in-class mobile acquisition Alternative data, AI powered underwriting algorithms Industry-leading, tech enabled customer service Banks Value to Bank Partners Value to Customers OppFi Powers Banks to Unlock Credit Access for the Everyday Consumer Best-In-Class Financial Technology Platform
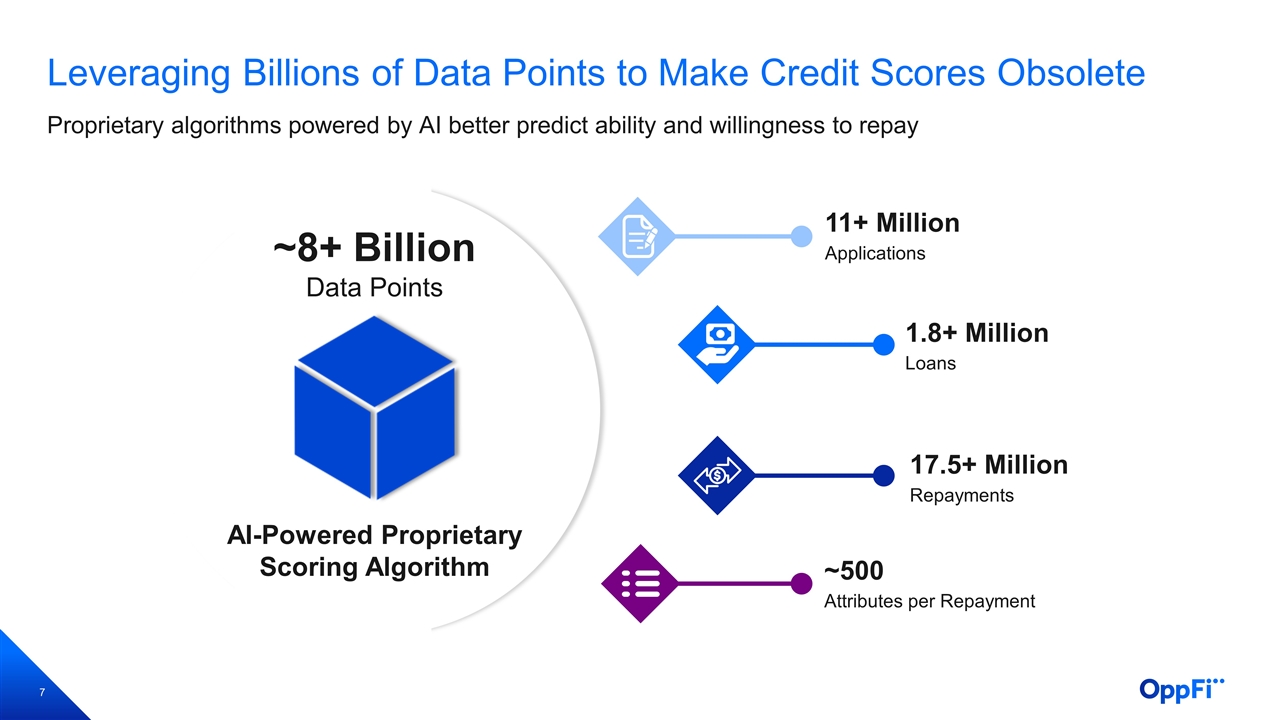
Proprietary algorithms powered by AI better predict ability and willingness to repay Leveraging Billions of Data Points to Make Credit Scores Obsolete 11+ Million Repayments 17.5+ Million Loans 1.8+ Million Attributes per Repayment ~500 Applications AI-Powered Proprietary Scoring Algorithm ~8+ Billion Data Points
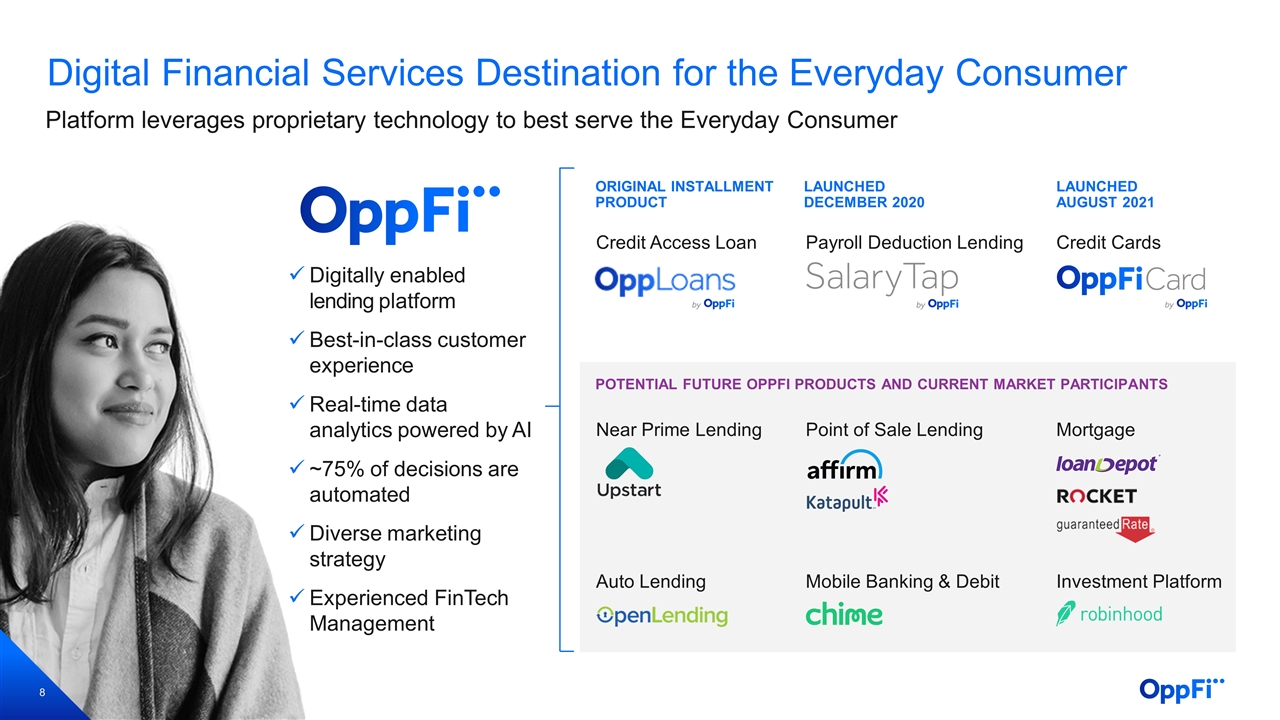
Mobile Banking & Debit Digital Financial Services Destination for the Everyday Consumer Platform leverages proprietary technology to best serve the Everyday Consumer Near Prime Lending Payroll Deduction Lending Auto Lending Credit Cards Digitally enabled lending platform Best-in-class customer experience Real-time data analytics powered by AI ~75% of decisions are automated Diverse marketing strategy Experienced FinTech Management POTENTIAL FUTURE OPPFI PRODUCTS AND CURRENT MARKET PARTICIPANTS LAUNCHED DECEMBER 2020 LAUNCHED AUGUST 2021 ORIGINAL INSTALLMENT PRODUCT Credit Access Loan Point of Sale Lending Mortgage Investment Platform
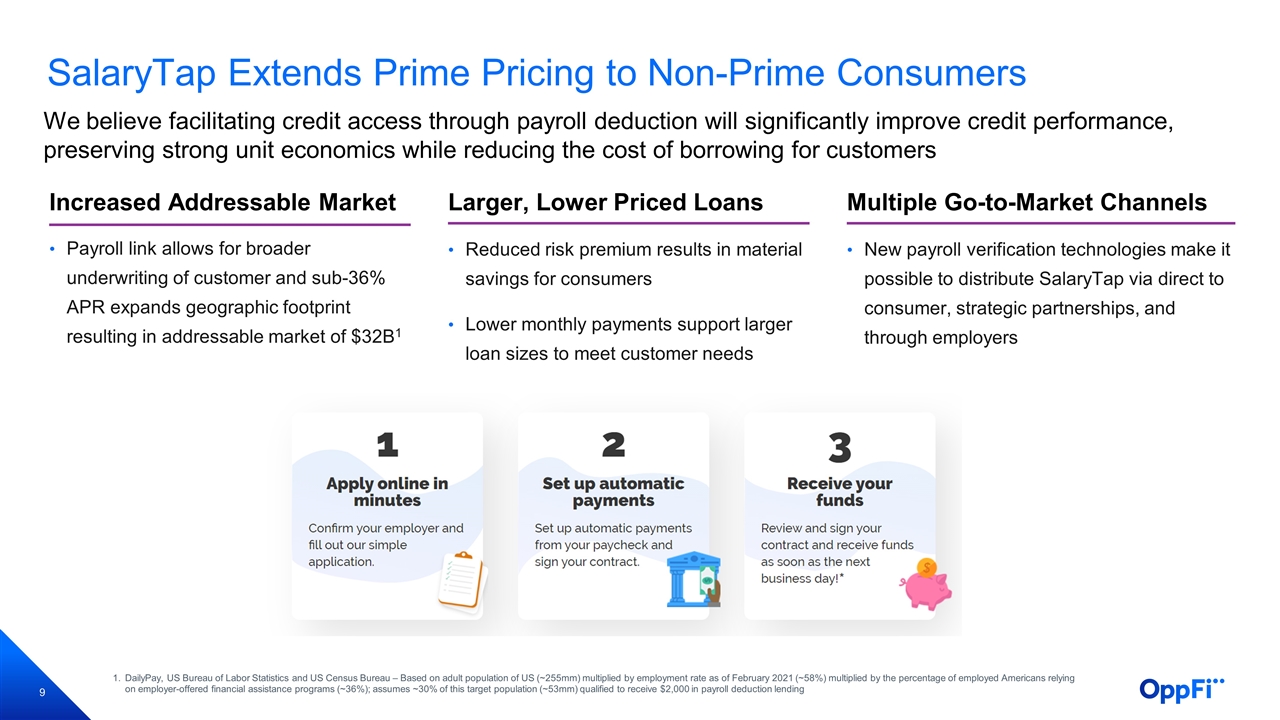
SalaryTap Extends Prime Pricing to Non-Prime Consumers We believe facilitating credit access through payroll deduction will significantly improve credit performance, preserving strong unit economics while reducing the cost of borrowing for customers Increased Addressable Market Larger, Lower Priced Loans Multiple Go-to-Market Channels Payroll link allows for broader underwriting of customer and sub-36% APR expands geographic footprint resulting in addressable market of $32B1 Reduced risk premium results in material savings for consumers Lower monthly payments support larger loan sizes to meet customer needs New payroll verification technologies make it possible to distribute SalaryTap via direct to consumer, strategic partnerships, and through employers DailyPay, US Bureau of Labor Statistics and US Census Bureau – Based on adult population of US (~255mm) multiplied by employment rate as of February 2021 (~58%) multiplied by the percentage of employed Americans relying on employer-offered financial assistance programs (~36%); assumes ~30% of this target population (~53mm) qualified to receive $2,000 in payroll deduction lending
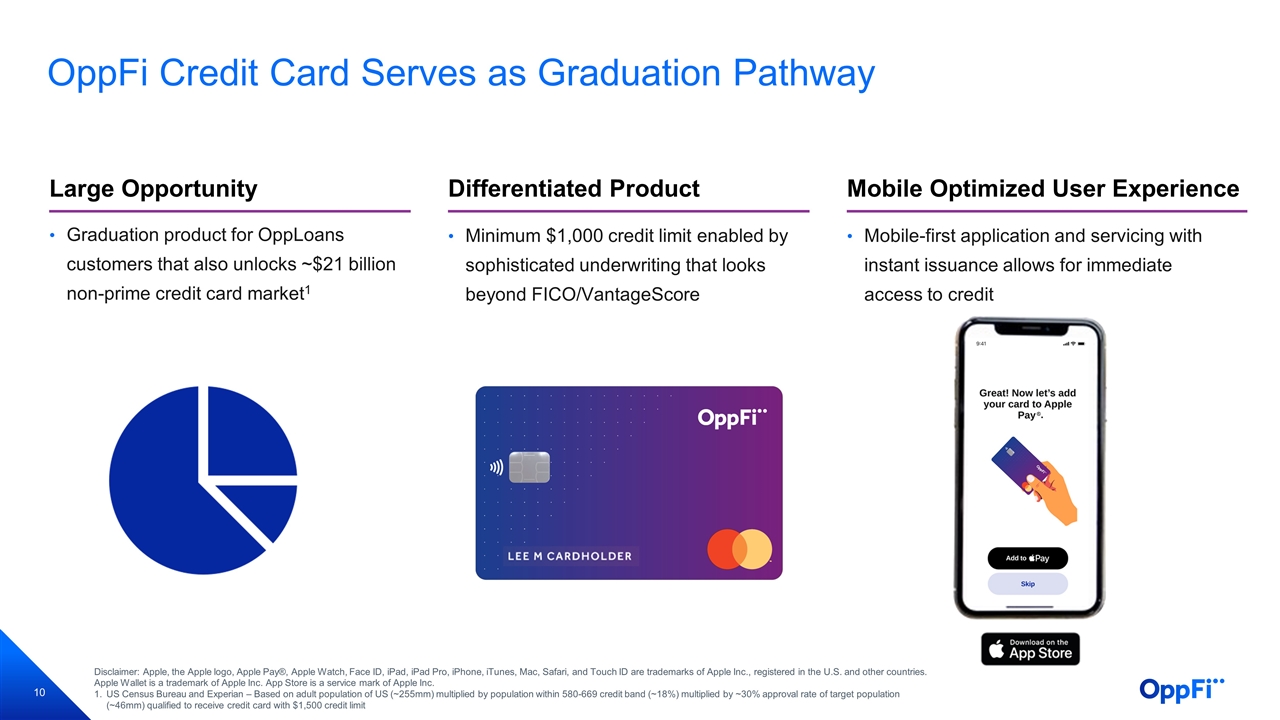
OppFi Credit Card Serves as Graduation Pathway Large Opportunity Differentiated Product Mobile Optimized User Experience Graduation product for OppLoans customers that also unlocks ~$21 billion non-prime credit card market1 Minimum $1,000 credit limit enabled by sophisticated underwriting that looks beyond FICO/VantageScore Mobile-first application and servicing with instant issuance allows for immediate access to credit Disclaimer: Apple, the Apple logo, Apple Pay®, Apple Watch, Face ID, iPad, iPad Pro, iPhone, iTunes, Mac, Safari, and Touch ID are trademarks of Apple Inc., registered in the U.S. and other countries. Apple Wallet is a trademark of Apple Inc. App Store is a service mark of Apple Inc. US Census Bureau and Experian – Based on adult population of US (~255mm) multiplied by population within 580-669 credit band (~18%) multiplied by ~30% approval rate of target population (~46mm) qualified to receive credit card with $1,500 credit limit ®.
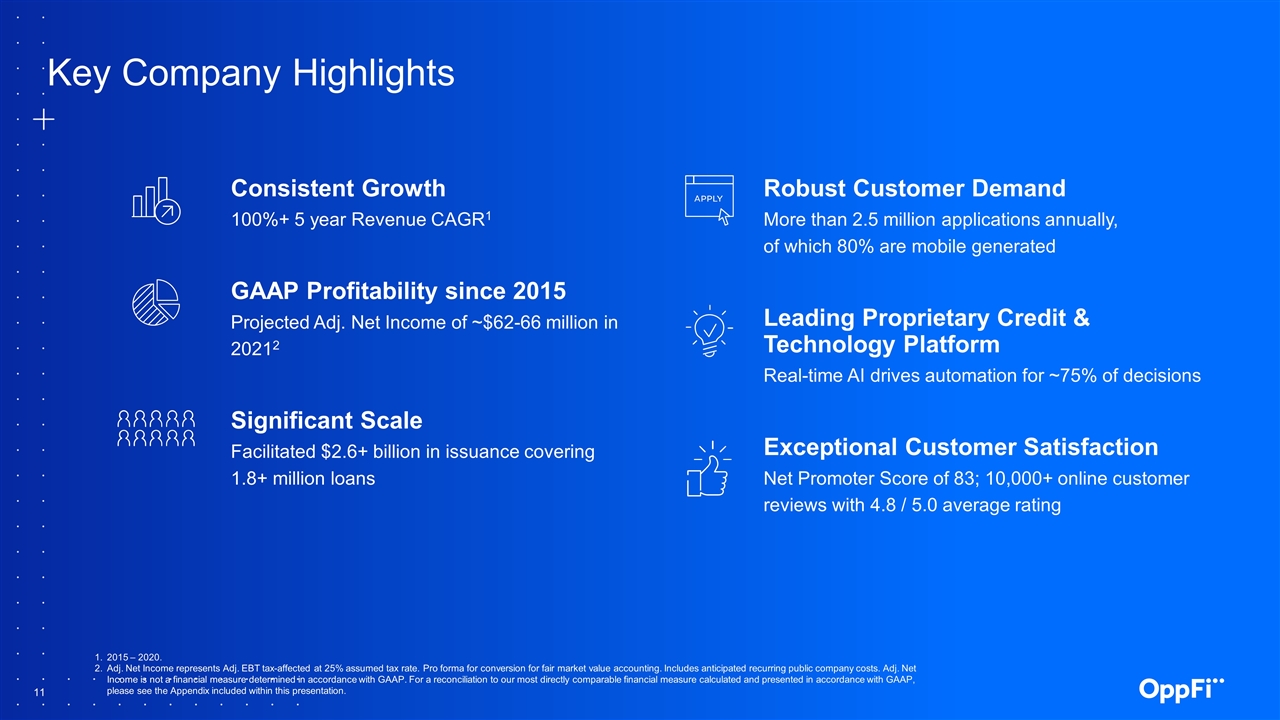
Robust Customer Demand More than 2.5 million applications annually, of which 80% are mobile generated Leading Proprietary Credit & Technology Platform Real-time AI drives automation for ~75% of decisions Exceptional Customer Satisfaction Net Promoter Score of 83; 10,000+ online customer reviews with 4.8 / 5.0 average rating Key Company Highlights Consistent Growth 100%+ 5 year Revenue CAGR1 GAAP Profitability since 2015 Projected Adj. Net Income of ~$62-66 million in 20212 Significant Scale Facilitated $2.6+ billion in issuance covering 1.8+ million loans 2015 – 2020. Adj. Net Income represents Adj. EBT tax-affected at 25% assumed tax rate. Pro forma for conversion for fair market value accounting. Includes anticipated recurring public company costs. Adj. Net Income is not a financial measure determined in accordance with GAAP. For a reconciliation to our most directly comparable financial measure calculated and presented in accordance with GAAP, please see the Appendix included within this presentation.

Financial Performance
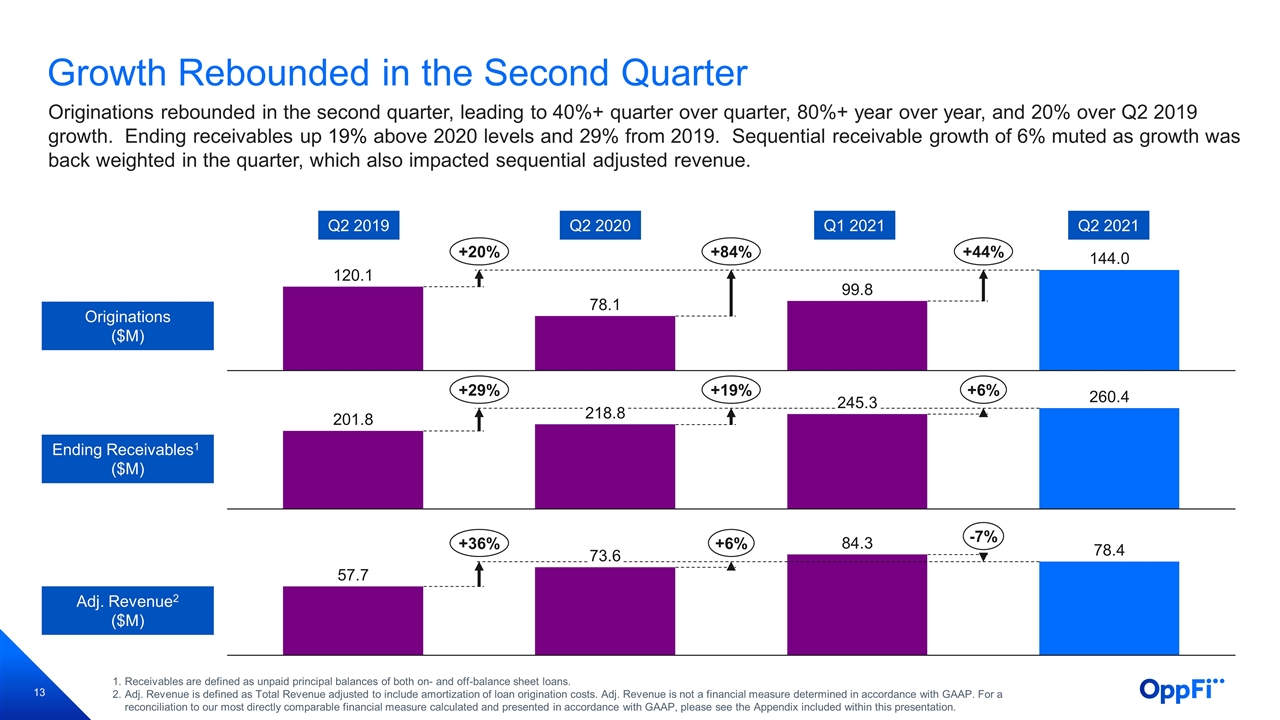
Growth Rebounded in the Second Quarter Originations rebounded in the second quarter, leading to 40%+ quarter over quarter, 80%+ year over year, and 20% over Q2 2019 growth. Ending receivables up 19% above 2020 levels and 29% from 2019. Sequential receivable growth of 6% muted as growth was back weighted in the quarter, which also impacted sequential adjusted revenue. Q2 2019 Q2 2020 Q1 2021 Q2 2021 Originations ($M) Ending Receivables1 ($M) Adj. Revenue2 ($M) Receivables are defined as unpaid principal balances of both on- and off-balance sheet loans. Adj. Revenue is defined as Total Revenue adjusted to include amortization of loan origination costs. Adj. Revenue is not a financial measure determined in accordance with GAAP. For a reconciliation to our most directly comparable financial measure calculated and presented in accordance with GAAP, please see the Appendix included within this presentation.
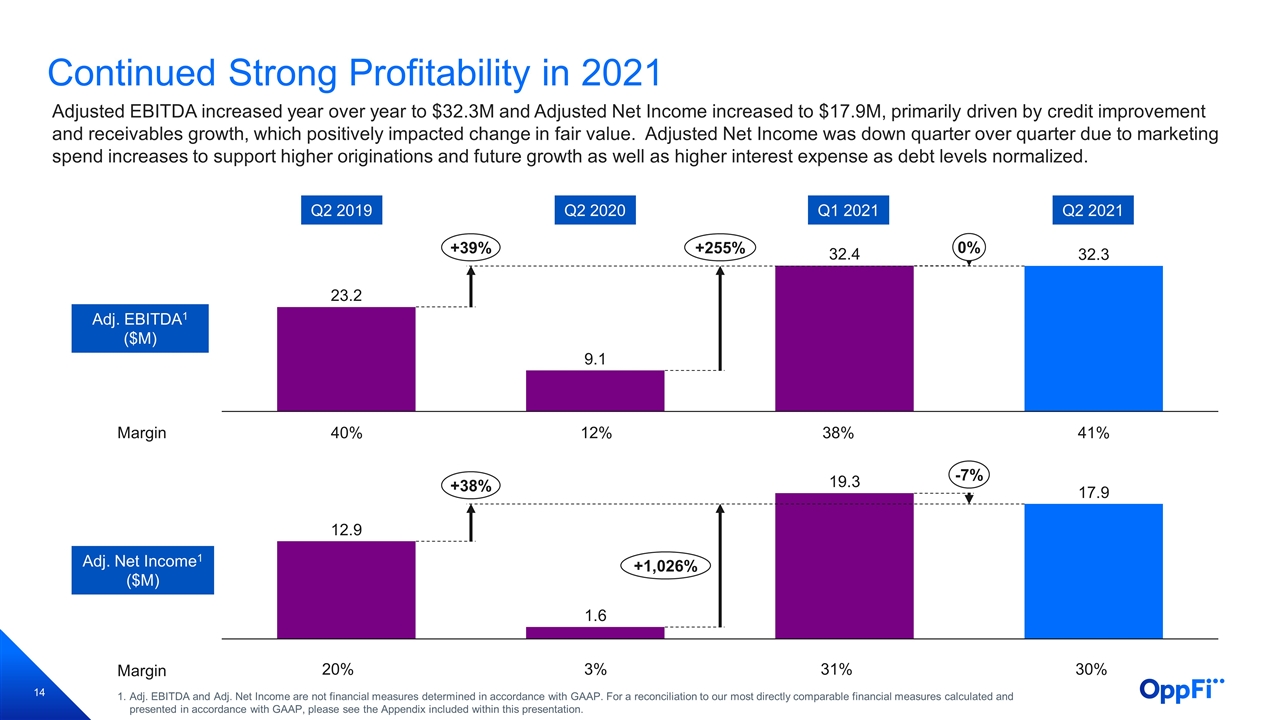
Continued Strong Profitability in 2021 Adjusted EBITDA increased year over year to $32.3M and Adjusted Net Income increased to $17.9M, primarily driven by credit improvement and receivables growth, which positively impacted change in fair value. Adjusted Net Income was down quarter over quarter due to marketing spend increases to support higher originations and future growth as well as higher interest expense as debt levels normalized. Q2 2019 Q2 2020 Q1 2021 Q2 2021 Adj. EBITDA1 ($M) Adj. Net Income1 ($M) 30% 31% 3% 20% 41% 38% 12% 40% Margin Margin Adj. EBITDA and Adj. Net Income are not financial measures determined in accordance with GAAP. For a reconciliation to our most directly comparable financial measures calculated and presented in accordance with GAAP, please see the Appendix included within this presentation.
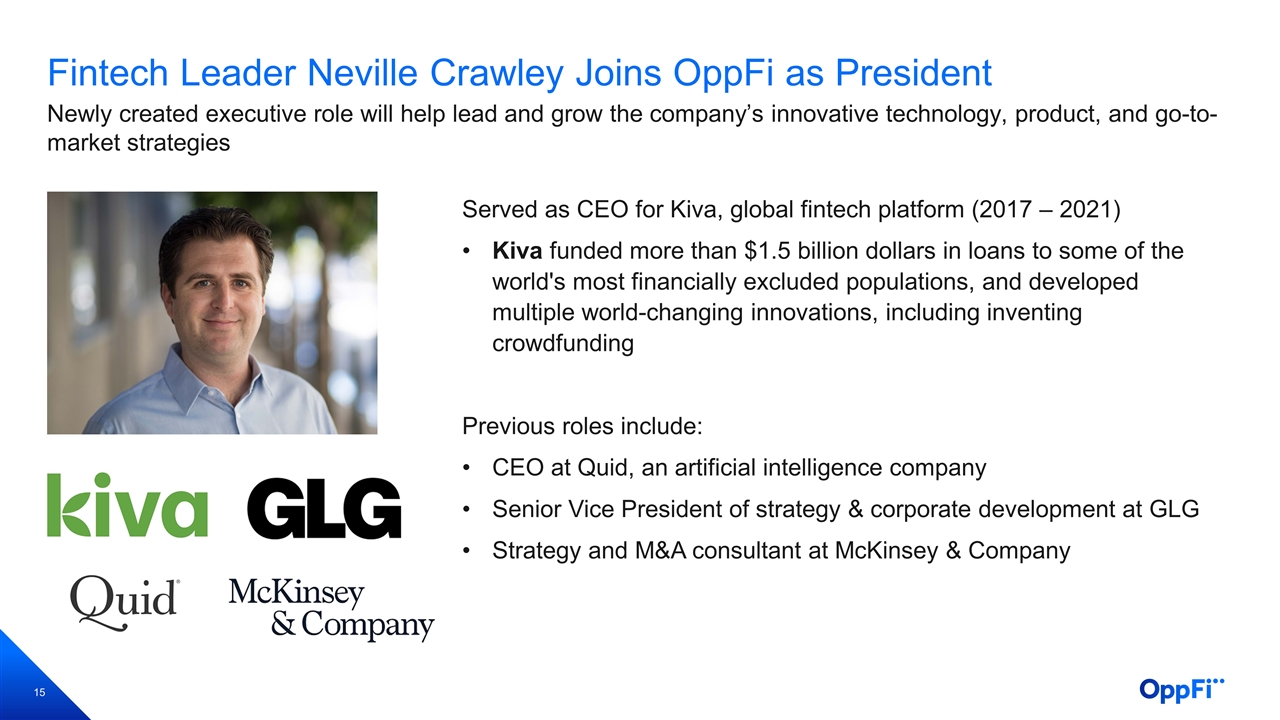
Newly created executive role will help lead and grow the company’s innovative technology, product, and go-to-market strategies Fintech Leader Neville Crawley Joins OppFi as President Served as CEO for Kiva, global fintech platform (2017 – 2021) Kiva funded more than $1.5 billion dollars in loans to some of the world's most financially excluded populations, and developed multiple world-changing innovations, including inventing crowdfunding Previous roles include: CEO at Quid, an artificial intelligence company Senior Vice President of strategy & corporate development at GLG Strategy and M&A consultant at McKinsey & Company
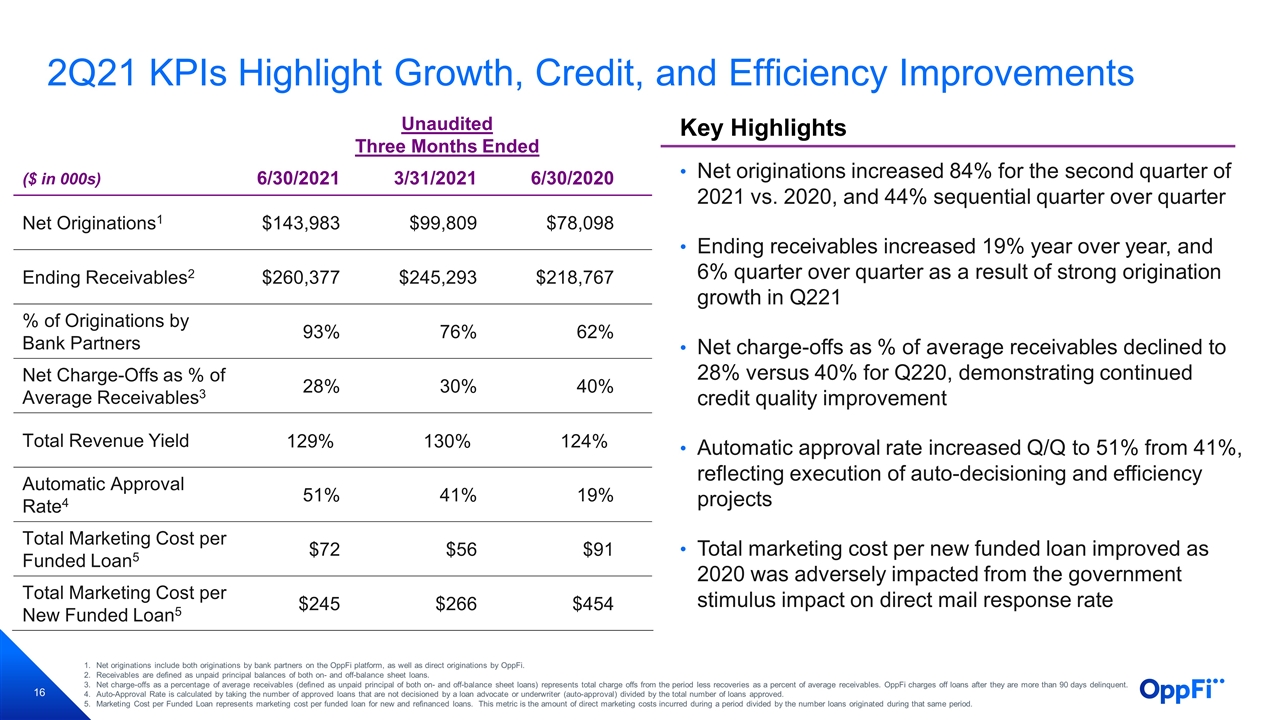
2Q21 KPIs Highlight Growth, Credit, and Efficiency Improvements Unaudited Three Months Ended ($ in 000s) 6/30/2021 3/31/2021 6/30/2020 Net Originations1 $143,983 $99,809 $78,098 Ending Receivables2 $260,377 $245,293 $218,767 % of Originations by Bank Partners 93% 76% 62% Net Charge-Offs as % of Average Receivables3 28% 30% 40% Total Revenue Yield 129% 130% 124% Automatic Approval Rate4 51% 41% 19% Total Marketing Cost per Funded Loan5 $72 $56 $91 Total Marketing Cost per New Funded Loan5 $245 $266 $454 Key Highlights Net originations increased 84% for the second quarter of 2021 vs. 2020, and 44% sequential quarter over quarter Ending receivables increased 19% year over year, and 6% quarter over quarter as a result of strong origination growth in Q221 Net charge-offs as % of average receivables declined to 28% versus 40% for Q220, demonstrating continued credit quality improvement Automatic approval rate increased Q/Q to 51% from 41%, reflecting execution of auto-decisioning and efficiency projects Total marketing cost per new funded loan improved as 2020 was adversely impacted from the government stimulus impact on direct mail response rate Net originations include both originations by bank partners on the OppFi platform, as well as direct originations by OppFi. Receivables are defined as unpaid principal balances of both on- and off-balance sheet loans. Net charge-offs as a percentage of average receivables (defined as unpaid principal of both on- and off-balance sheet loans) represents total charge offs from the period less recoveries as a percent of average receivables. OppFi charges off loans after they are more than 90 days delinquent. Auto-Approval Rate is calculated by taking the number of approved loans that are not decisioned by a loan advocate or underwriter (auto-approval) divided by the total number of loans approved. Marketing Cost per Funded Loan represents marketing cost per funded loan for new and refinanced loans. This metric is the amount of direct marketing costs incurred during a period divided by the number loans originated during that same period.
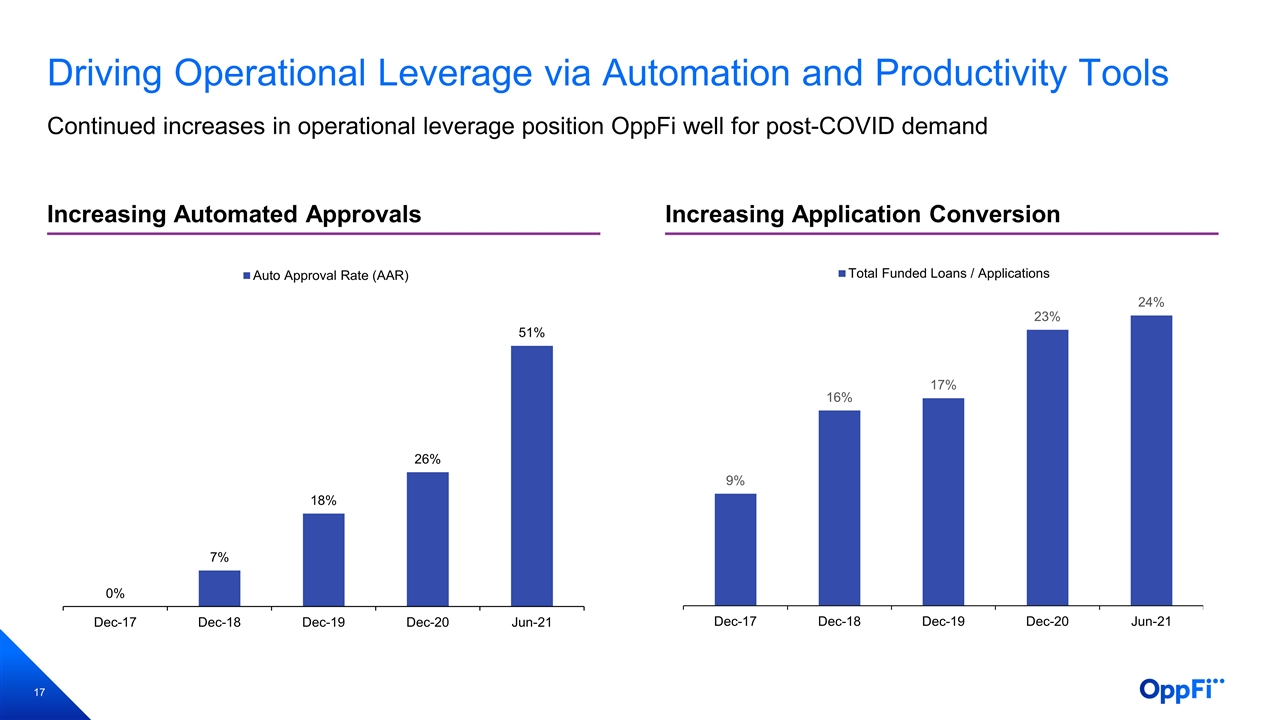
Increasing Automated Approvals Driving Operational Leverage via Automation and Productivity Tools Increasing Application Conversion Continued increases in operational leverage position OppFi well for post-COVID demand
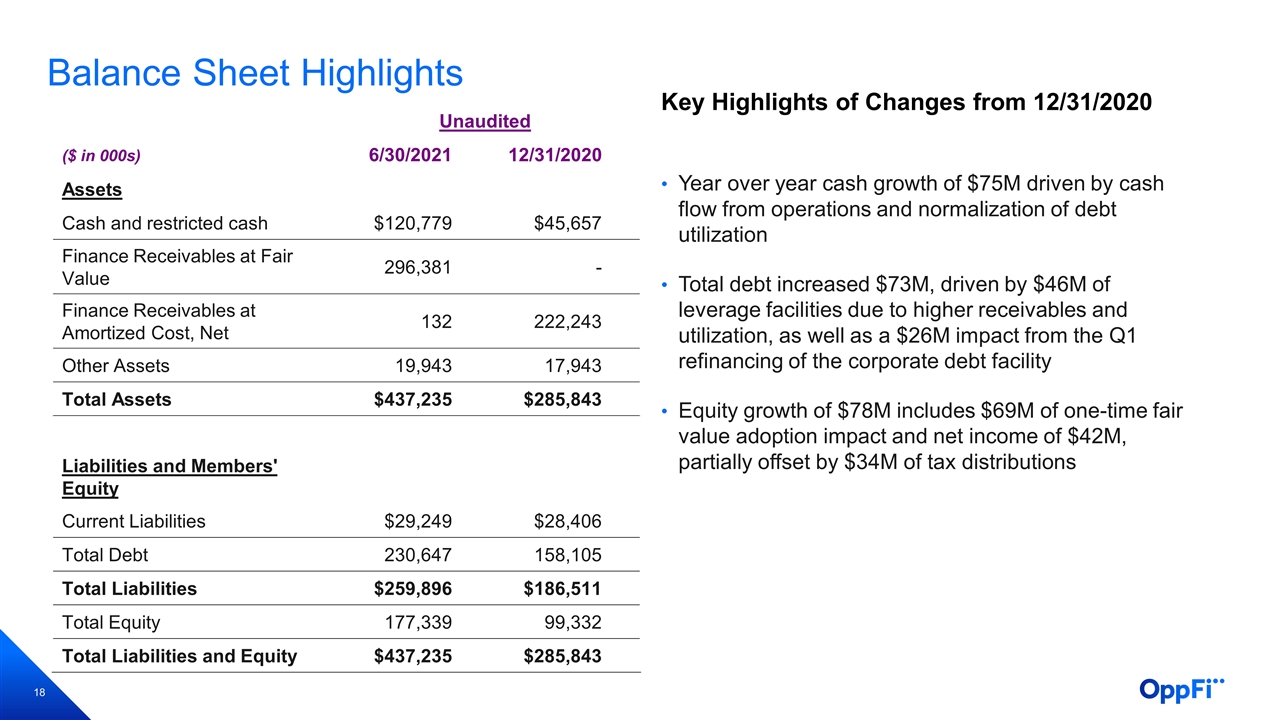
Balance Sheet Highlights Key Highlights of Changes from 12/31/2020 Year over year cash growth of $75M driven by cash flow from operations and normalization of debt utilization Total debt increased $73M, driven by $46M of leverage facilities due to higher receivables and utilization, as well as a $26M impact from the Q1 refinancing of the corporate debt facility Equity growth of $78M includes $69M of one-time fair value adoption impact and net income of $42M, partially offset by $34M of tax distributions Unaudited ($ in 000s) 6/30/2021 12/31/2020 Assets Cash and restricted cash $120,779 $45,657 Finance Receivables at Fair Value 296,381 - Finance Receivables at Amortized Cost, Net 132 222,243 Other Assets 19,943 17,943 Total Assets $437,235 $285,843 Liabilities and Members' Equity Current Liabilities $29,249 $28,406 Total Debt 230,647 158,105 Total Liabilities $259,896 $186,511 Total Equity 177,339 99,332 Total Liabilities and Equity $437,235 $285,843
Full Year 2021 Outlook Revenue Adj. EBITDA1 Adj. Net Income1 Ending receivables of $380-400 million Origination levels returning to pre-COVID levels by the end of the year Net charge-offs as a percentage of average receivables of approximately 35% Yield consistent with historical levels 1Adjusted EBITDA and Adjusted Net Income are not financial measures determined in accordance with GAAP. For a definition of Adjusted EBITDA and Adjusted Net Income and a reconciliation to our most directly comparable financial measure calculated and presented in accordance with GAAP, please see the Appendix included within this presentation. Outlook Assumptions $350 Million to $360 Million $120 Million to $125 Million $62 Million to $66 Million The Company expects the following for full year 2021:
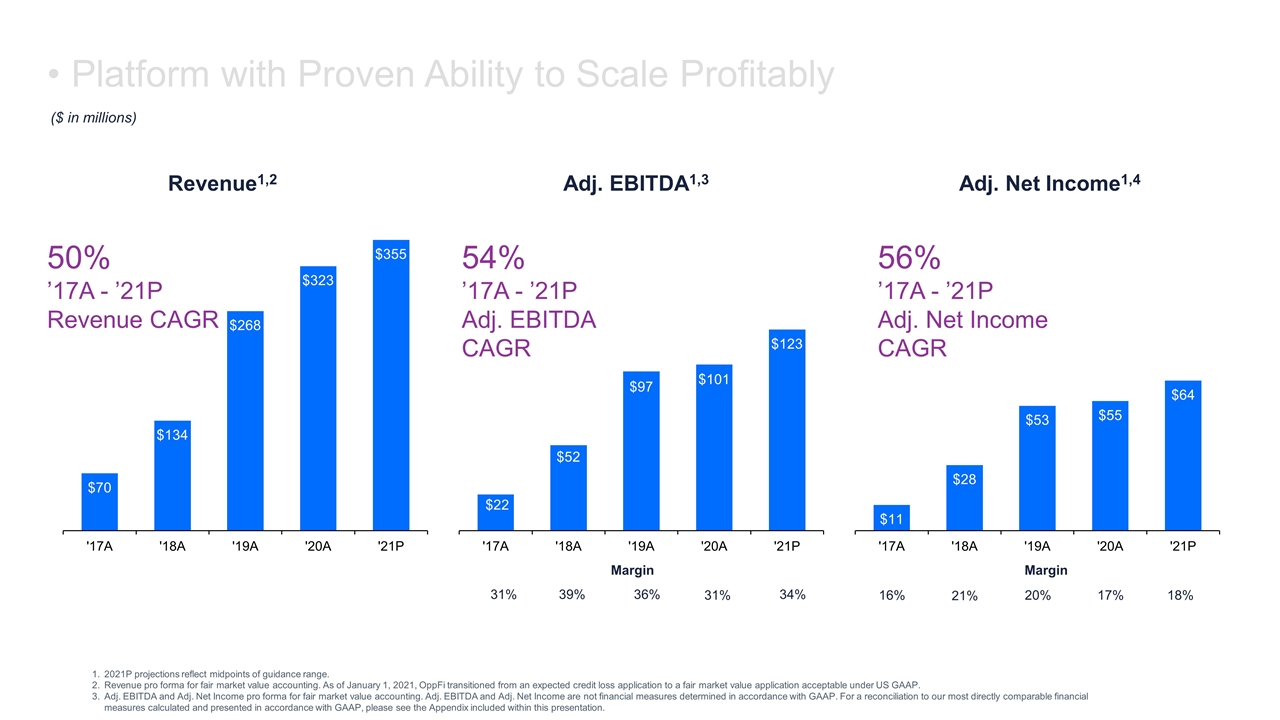
Platform with Proven Ability to Scale Profitably Revenue1,2 Adj. EBITDA1,3 Adj. Net Income1,4 2021P projections reflect midpoints of guidance range. Revenue pro forma for fair market value accounting. As of January 1, 2021, OppFi transitioned from an expected credit loss application to a fair market value application acceptable under US GAAP. Adj. EBITDA and Adj. Net Income pro forma for fair market value accounting. Adj. EBITDA and Adj. Net Income are not financial measures determined in accordance with GAAP. For a reconciliation to our most directly comparable financial measures calculated and presented in accordance with GAAP, please see the Appendix included within this presentation. ($ in millions) Margin 31% 39% 36% 31% 34% Margin 16% 21% 20% 17% 18% 50% ’17A - ’21P Revenue CAGR 54% ’17A - ’21P Adj. EBITDA CAGR 56% ’17A - ’21P Adj. Net Income CAGR

Appendix
2Q21 Financial Results Unaudited Three Months Ended ($ in 000s) 6/30/2021 6/30/2020 YoY % Total Revenue $78,376 $61,281 27.9% Adj. Revenue1 $78,376 $73,611 6.5% Net Income $17,987 $25,119 (28.4%) Adj. Net Income1 $17,858 $1,586 1,025.9% Adj. Net Income Margin 22.8% 2.2% 2,060bps Adj. EBITDA1 $32,324 $9,101 255.2% Adj. EBITDA Margin 41.2% 12.4% 2,880bps Key Highlights Revenue increased by 28% as receivables grew by 19% and yield improved by 420 bps. Revenue impacted by adoption of fair value, which removed FAS91 impact Adjusted Net Income increased by $16.3 million, driven by higher revenue, improved credit, and higher fair value premium driven be receivables growth Adjusted EBITDA increased by $23.2 million to $32.3 million primarily driven by credit improvement and receivables growth, which positively impacted change in fair value Adj. Revenue, Adj. Net Income, and Adj. EBITDA presented pro forma for fair value accounting. Adj. Revenue, Adj. Net Income, and Adj. EBITDA are not financial measures determined in accordance with GAAP. For a reconciliation to our most directly comparable financial measures calculated and presented in accordance with GAAP, please see the Appendix included within this presentation.
OppFi GAAP Income Statements Unaudited Three Months Ended June 30, ($ in thousands) 2021 2020 Variance (%) Total Revenue $78,376 $61,281 27.9% Total Provision (31) (12,875) (100.0%) Change in Fair Value (11,306) -- -- Net Revenue $67,039 $48,406 38.5% Expenses 49,052 23,287 110.6% EBT1 $17,987 $25,119 (28.4%) 1. Represents Net Income as reported in the Company’s consolidated financial statements, as prior to the business combination OppFi did not have tax provision under its pass-through structure as a limited liability company.
OppFi Fair Value Pro Forma Income Statements Unaudited Three Months Ended June 30, ($ in thousands) 2021 2020 Variance (%) Total Revenue $78,376 $73,611 6.5% Total Provision (31) -- -- Change in Fair Value (11,306) (41,522) (72.7%) Net Revenue $67,039 $32,089 108.9% Expenses: Sales and Marketing 11,545 5,211 121.6% Customer Operations 9,876 8,697 13.6% Technology, Product, and Analytics 6,513 4,731 37.7% General, Administrative, and Other 14,733 6,631 122.2% Total Expenses before Interest Expense $42,667 $25,270 68.8% Interest Expense1 6,385 5,382 18.6% EBT2 $17,987 $1,437 1,152.0% 1. Includes debt amortization costs. 2. Represents Net Income as reported in the Company’s consolidated financial statements, as prior to the business combination OppFi did not have tax provision under its pass-through structure as a limited liability company.
OppFi Quarterly EBT to Adj. EBT and Adj. EBITDA Reconciliation Unaudited Three Months Ended June 30, ($ in thousands) 2021 2020 Variance (%) EBT1 $17,987 $25,119 (28.4%) Fair Value Adjustment -- (23,682) -- Debt Amortization 642 458 40.1% Other Addback and One-Time Expenses2 5,181 220 2,251.7% Adjusted EBT $23,810 $2,115 1,025.9% Less: Pro Forma Taxes3 (5,952) (529) 1,025.9% Adjusted Net Income $17,858 $1,586 1,025.9% Pro Forma Taxes3 5,952 529 1,025.9% Depreciation and Amortization 2,413 1,579 52.8% Interest Expense 5,744 4,924 16.6% Business (Non-income) Taxes 357 483 (25.9%) Adjusted EBITDA $32,324 $9,101 255.2% 1. Represents Net Income as reported in the Company’s consolidated financial statements, as prior to the business combination OppFi did not have tax provision under its pass-through structure as a limited liability company. 2. One time expense includes a $3.3 million impact in 2021 from an increase in warrant liability, $1.2 million in costs related to the business combination, and $0.7 million in stock compensation, management fees, and other addbacks. 3. Assumes a tax rate of 25% reflecting the U.S. federal statutory rate of 21% and a blended statutory rate for state income taxes, in order to allow for a comparison with publicly traded companies.
OppFi Quarterly Revenue to Adj. Revenue Reconciliation Unaudited Three Months Ended June 30, ($ in thousands) 2021 2020 Variance (%) Total Revenue $78,376 $61,281 27.9% Amortization of Loan Origination Costs -- 12,330 -- Adjusted Revenue $78,376 $73,611 6.5%
OppFi Q2 2020 As Reported to Fair Value Pro Forma Reconciliation Unaudited Three Months Ended June 30, 2020 ($ in thousands) As Reported FV Adjustments FV Pro Forma Total Revenue $61,281 $12,330 $73,611 Total Provision (12,875) 12,875 -- FV Adjustment1 -- (41,522) (41,522) Net Revenue $48,406 ($16,317) $32,089 Expenses: Sales and Marketing 2,373 2,838 5,211 Customer Operations 4,170 4,527 8,697 Technology, Product, and Analytics 4,731 -- 4,731 General, Administrative, and Other 6,631 -- 6,631 Total Expenses before Interest Expense $17,905 $7,365 $25,270 Interest Expense2 5,382 -- 5,382 EBT3 $25,119 ($23,682) $1,437 1. FV Adjustment of $41.5M includes net charge-offs of $23.8M and FMV Adjustment of $17.7M driven by lower receivables and lower FMV mark as a result of the COVID-19 pandemic. 2. Includes debt amortization costs. 3. Represents Net Income as reported in the Company’s consolidated financial statements, as prior to the business combination OppFi did not have tax provision under its pass-through structure as a limited liability company.
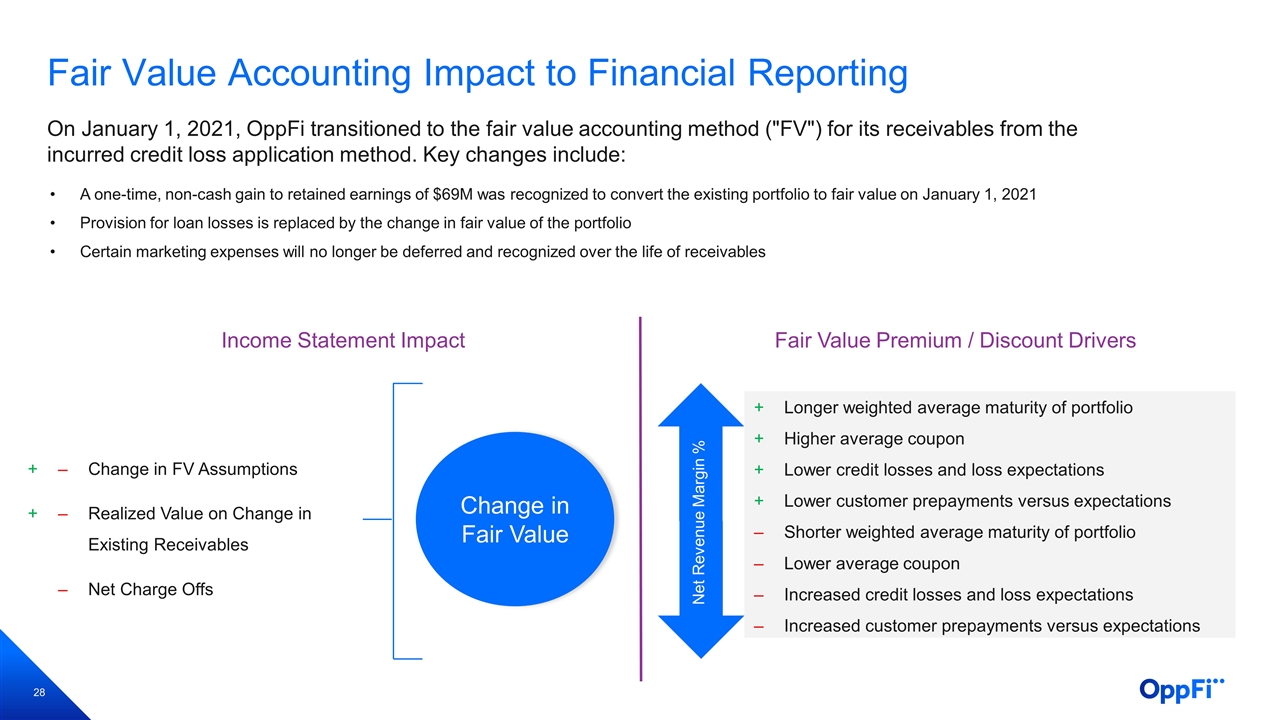
Longer weighted average maturity of portfolio Higher average coupon Lower credit losses and loss expectations Lower customer prepayments versus expectations Shorter weighted average maturity of portfolio Lower average coupon Increased credit losses and loss expectations Increased customer prepayments versus expectations Fair Value Accounting Impact to Financial Reporting A one-time, non-cash gain to retained earnings of $69M was recognized to convert the existing portfolio to fair value on January 1, 2021 Provision for loan losses is replaced by the change in fair value of the portfolio Certain marketing expenses will no longer be deferred and recognized over the life of receivables On January 1, 2021, OppFi transitioned to the fair value accounting method ("FV") for its receivables from the incurred credit loss application method. Key changes include: Change in Fair Value Change in FV Assumptions Realized Value on Change in Existing Receivables Net Charge Offs Net Revenue Margin % Income Statement Impact Fair Value Premium / Discount Drivers
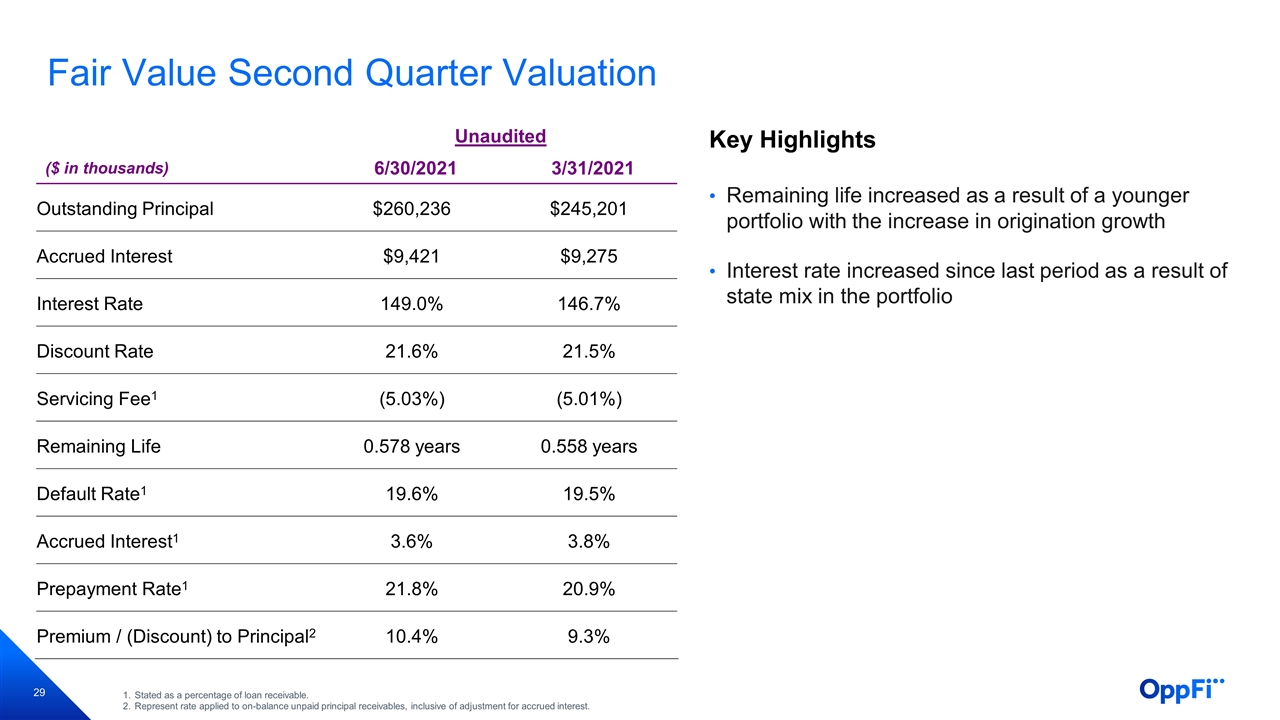
Fair Value Second Quarter Valuation Unaudited ($ in thousands) 6/30/2021 3/31/2021 Outstanding Principal $260,236 $245,201 Accrued Interest $9,421 $9,275 Interest Rate 149.0% 146.7% Discount Rate 21.6% 21.5% Servicing Fee1 (5.03%) (5.01%) Remaining Life 0.578 years 0.558 years Default Rate1 19.6% 19.5% Accrued Interest1 3.6% 3.8% Prepayment Rate1 21.8% 20.9% Premium / (Discount) to Principal2 10.4% 9.3% Stated as a percentage of loan receivable. Represent rate applied to on-balance unpaid principal receivables, inclusive of adjustment for accrued interest. Key Highlights Remaining life increased as a result of a younger portfolio with the increase in origination growth Interest rate increased since last period as a result of state mix in the portfolio
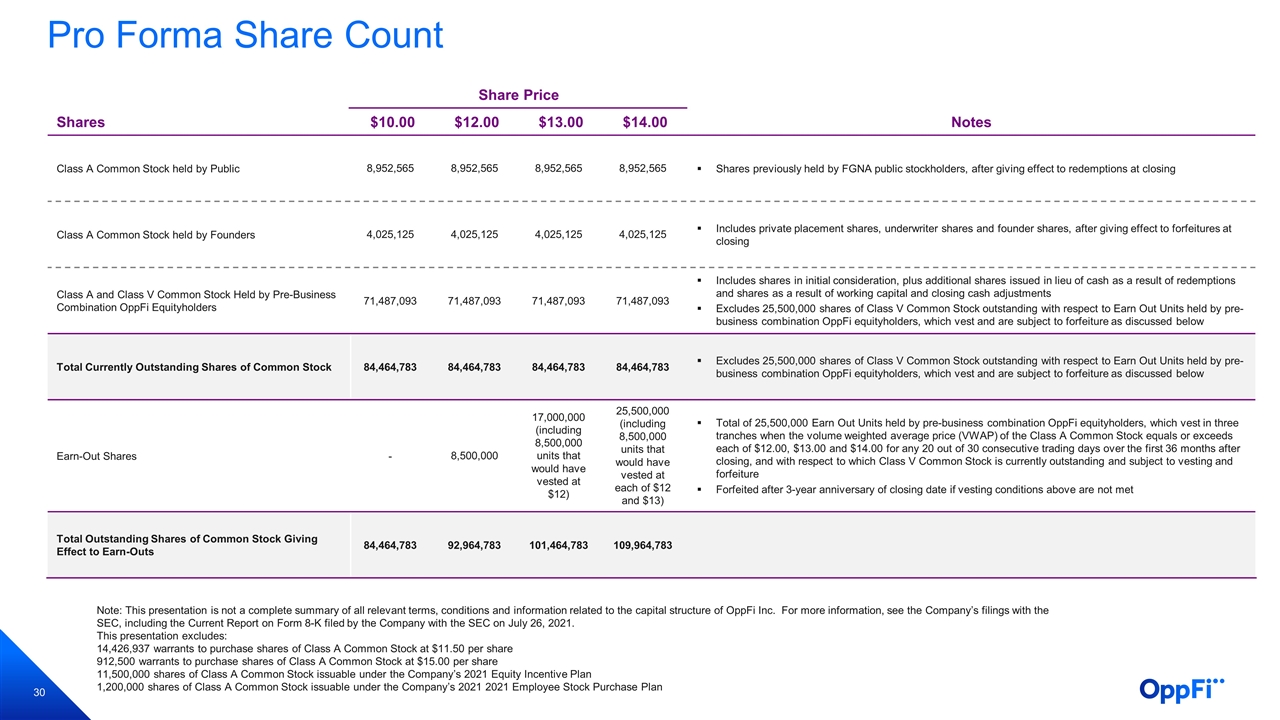
Pro Forma Share Count Shares Share Price Notes $10.00 $12.00 $13.00 $14.00 Class A Common Stock held by Public 8,952,565 8,952,565 8,952,565 8,952,565 Shares previously held by FGNA public stockholders, after giving effect to redemptions at closing Class A Common Stock held by Founders 4,025,125 4,025,125 4,025,125 4,025,125 Includes private placement shares, underwriter shares and founder shares, after giving effect to forfeitures at closing Class A and Class V Common Stock Held by Pre-Business Combination OppFi Equityholders 71,487,093 71,487,093 71,487,093 71,487,093 Includes shares in initial consideration, plus additional shares issued in lieu of cash as a result of redemptions and shares as a result of working capital and closing cash adjustments Excludes 25,500,000 shares of Class V Common Stock outstanding with respect to Earn Out Units held by pre-business combination OppFi equityholders, which vest and are subject to forfeiture as discussed below Total Currently Outstanding Shares of Common Stock 84,464,783 84,464,783 84,464,783 84,464,783 Excludes 25,500,000 shares of Class V Common Stock outstanding with respect to Earn Out Units held by pre-business combination OppFi equityholders, which vest and are subject to forfeiture as discussed below Earn-Out Shares - 8,500,000 17,000,000 (including 8,500,000 units that would have vested at $12) 25,500,000 (including 8,500,000 units that would have vested at each of $12 and $13) Total of 25,500,000 Earn Out Units held by pre-business combination OppFi equityholders, which vest in three tranches when the volume weighted average price (VWAP) of the Class A Common Stock equals or exceeds each of $12.00, $13.00 and $14.00 for any 20 out of 30 consecutive trading days over the first 36 months after closing, and with respect to which Class V Common Stock is currently outstanding and subject to vesting and forfeiture Forfeited after 3-year anniversary of closing date if vesting conditions above are not met Total Outstanding Shares of Common Stock Giving Effect to Earn-Outs 84,464,783 92,964,783 101,464,783 109,964,783 Note: This presentation is not a complete summary of all relevant terms, conditions and information related to the capital structure of OppFi Inc. For more information, see the Company’s filings with the SEC, including the Current Report on Form 8-K filed by the Company with the SEC on July 26, 2021. This presentation excludes: 14,426,937 warrants to purchase shares of Class A Common Stock at $11.50 per share 912,500 warrants to purchase shares of Class A Common Stock at $15.00 per share 11,500,000 shares of Class A Common Stock issuable under the Company’s 2021 Equity Incentive Plan 1,200,000 shares of Class A Common Stock issuable under the Company’s 2021 2021 Employee Stock Purchase Plan