Exhibit 99.1

| FOR IMMEDIATE RELEASE | |||||
Office Properties Income Trust Announces Third Quarter 2022 Results
Net Income of $17.0 Million, or $0.35 Per Share
Normalized FFO of $53.8 Million, or $1.11 Per Share
Leased 606,000 Square Feet with a 21.6% Roll-up in Rents and a 7.2 Year Weighted Average Lease Term
Newton, MA (October 27, 2022): Office Properties Income Trust (Nasdaq: OPI) today announced its financial results for the quarter ended September 30, 2022.
Christopher Bilotto, President and Chief Operating Officer of OPI, made the following statement:
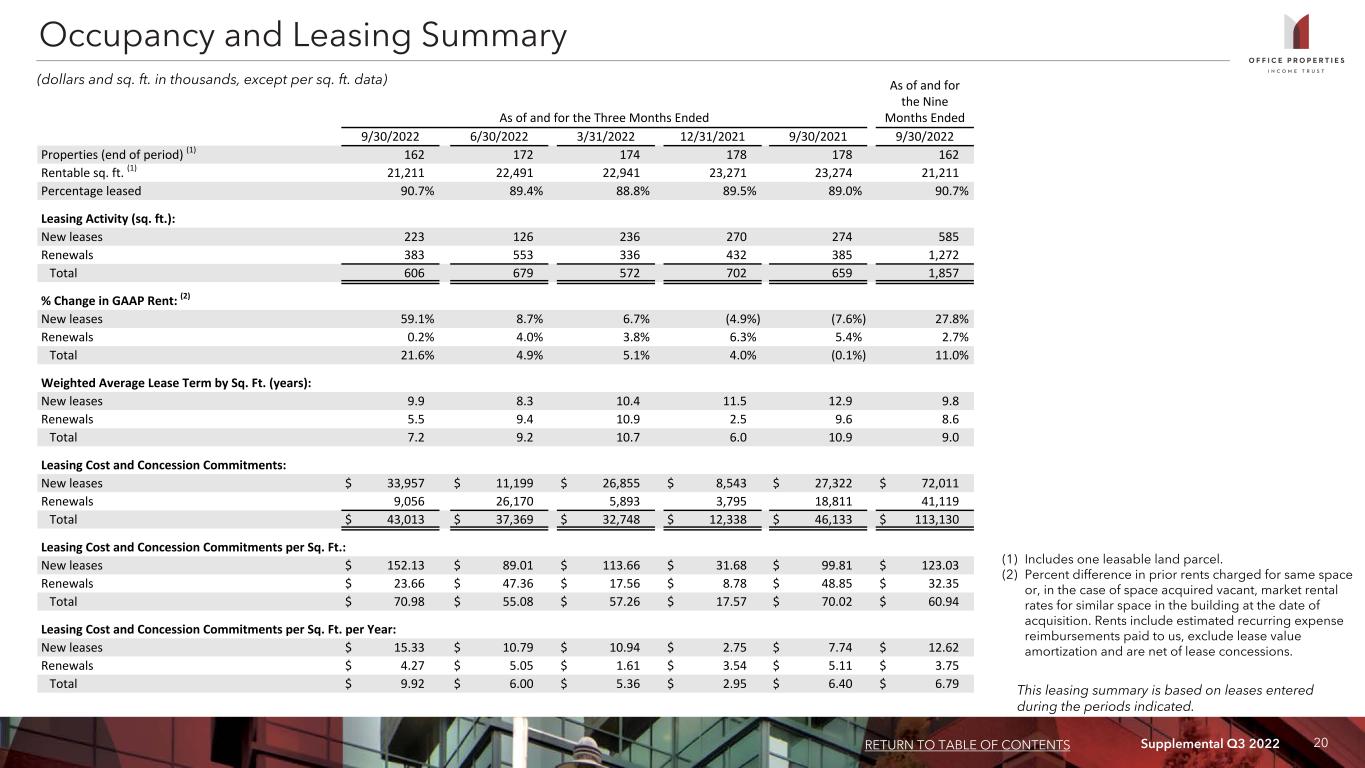
“OPI reported a strong third quarter in a rapidly changing economic environment, with continued same property cash basis NOI growth. We completed 606,000 square feet of new and renewal leasing during the quarter, including a new lease for approximately 84,000 square feet to anchor our Seattle Life Science development. The quarter's leasing resulted in a 21.6% weighted average roll up in rent and a 7.2 year weighted average lease term.
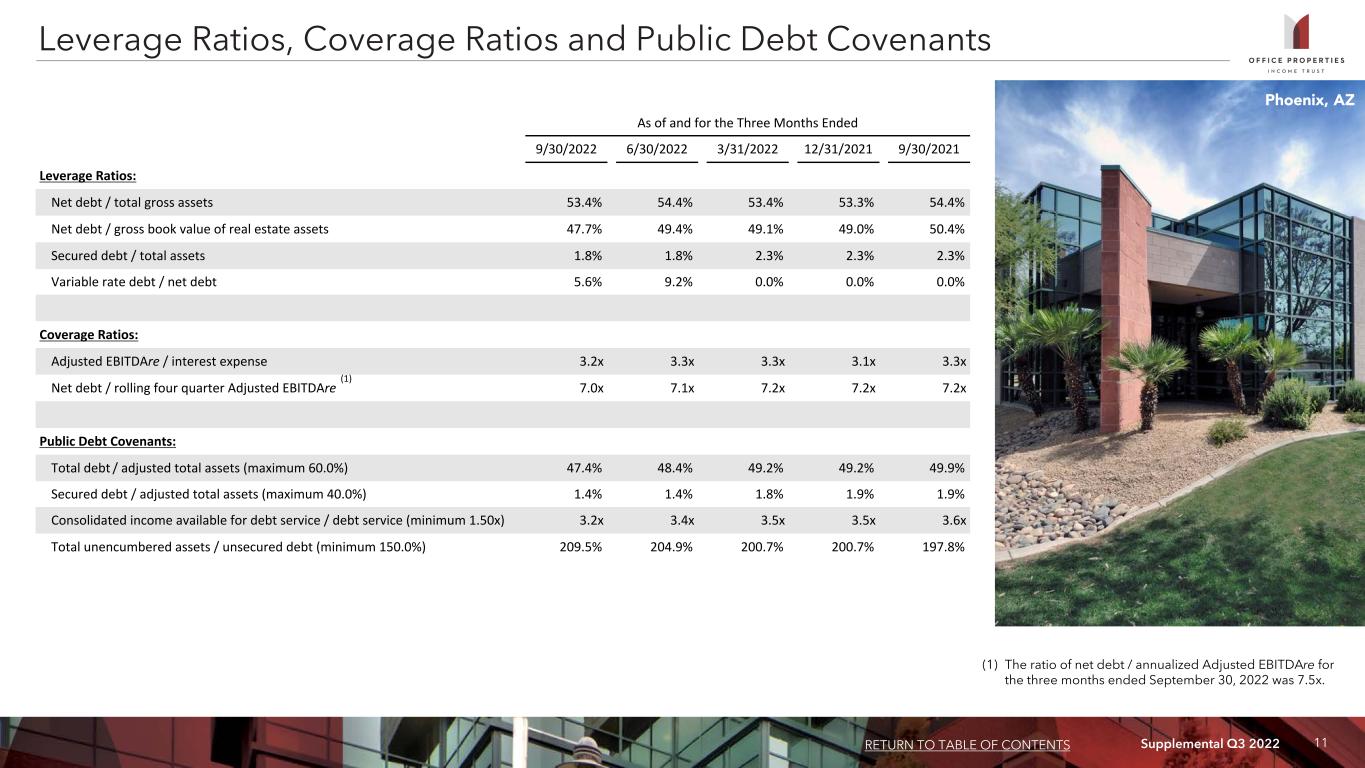
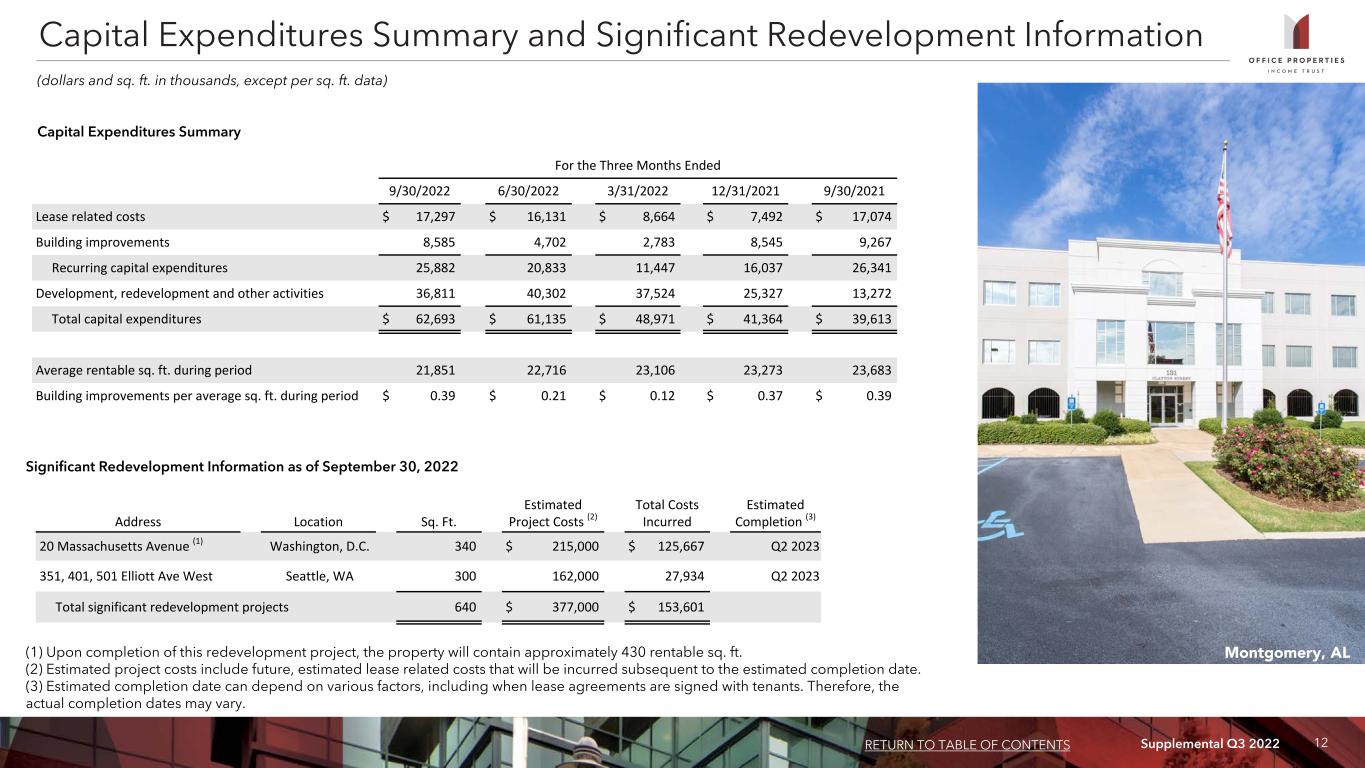
Our 90.7% occupancy at quarter end continues to outperform the broader market and we expect to reach approximately 92% occupancy by year end. During the third quarter, we sold 10 properties for approximately $118 million at a weighted average cap rate of approximately 6.8%. We have sold approximately $196 million of properties year to date, which places us at the high end of our stated objective for the year. As we approach 2023, we remain focused on reducing leverage and maintaining positive leasing momentum, and we anticipate completing our current development projects in the spring."
A Maryland Real Estate Investment Trust with transferable shares of beneficial interest listed on the Nasdaq.
No shareholder, Trustee or officer is personally liable for any act or obligation of the Trust.
Quarterly Results:
| Three Months Ended September 30, | |||||||||||
| 2022 | 2021 | ||||||||||
| Financial | (dollars in thousands, except per share data) | ||||||||||
| Net income | $16,964 | $3,712 | |||||||||
| Net income per share | $0.35 | $0.08 | |||||||||
| Normalized FFO per share | $1.11 | $1.24 | |||||||||
| CAD per share | $0.58 | $0.64 | |||||||||
| Same Property Cash Basis NOI | $82,518 | $82,293 | |||||||||
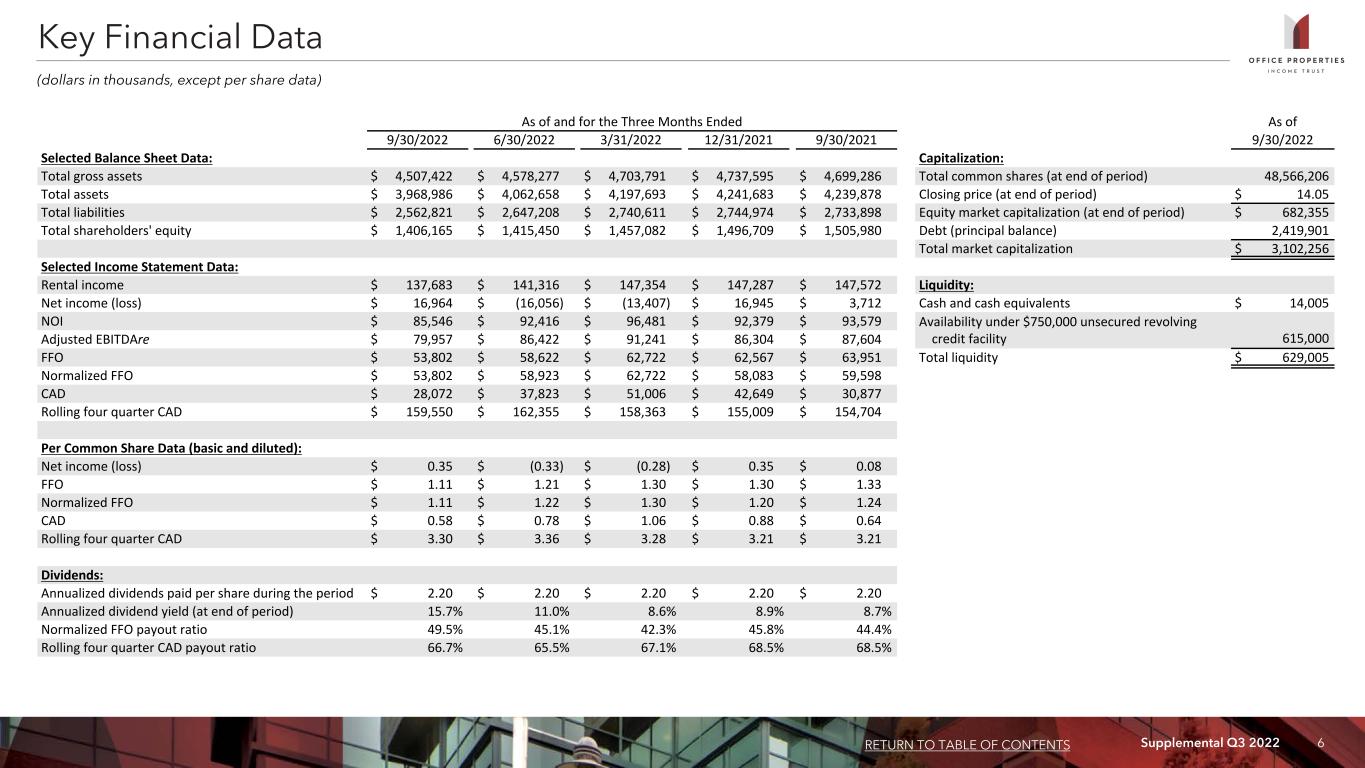
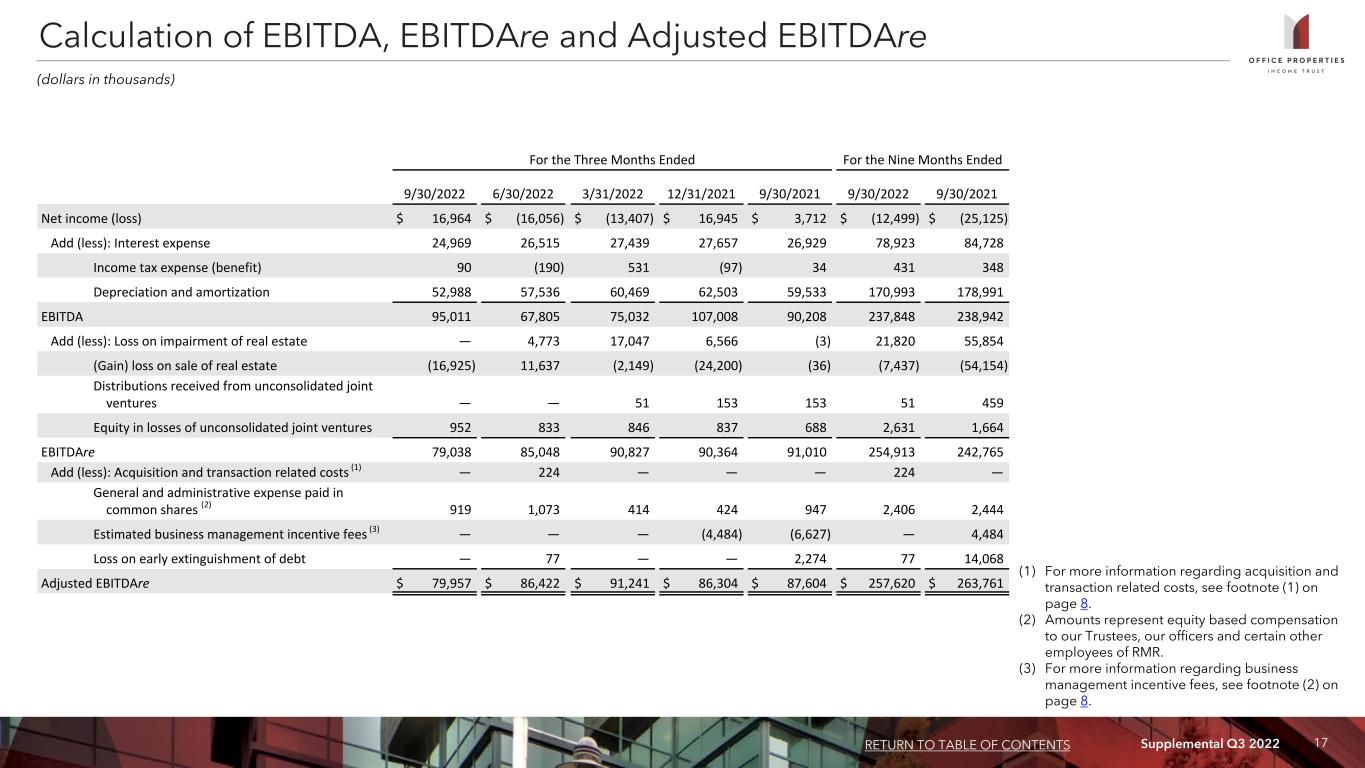
•Net income for the quarter ended September 30, 2022 was $17.0 million, or $0.35 per diluted share, compared to net income of $3.7 million, or $0.08 per diluted share, for the quarter ended September 30, 2021. Net income for the quarter ended September 30, 2022 includes a $16.9 million, or $0.35 per diluted share, net gain on sale of real estate. Net income for the quarter ended September 30, 2021 includes a $2.3 million, or $0.05 per diluted share, loss on early extinguishment of debt and the reversal of $6.6 million, or $0.14 per diluted share, of previously accrued estimated business management incentive fee expense.
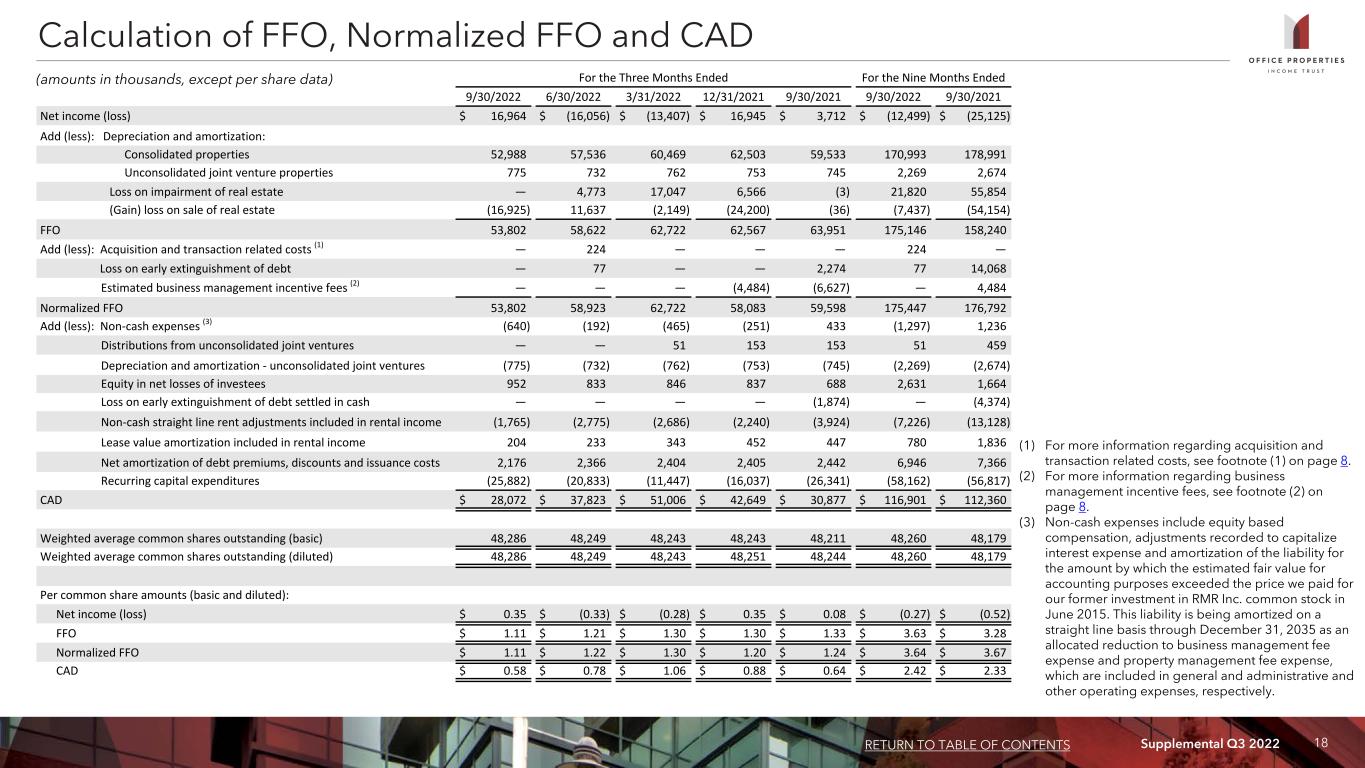
•Normalized funds from operations, or Normalized FFO, and cash available for distribution, or CAD, for the quarter ended September 30, 2022 were $53.8 million, or $1.11 per diluted share, and $28.1 million, or $0.58 per diluted share, respectively, compared to Normalized FFO and CAD for the quarter ended September 30, 2021 of $59.6 million, or $1.24 per diluted share, and $30.9 million, or $0.64 per diluted share, respectively.
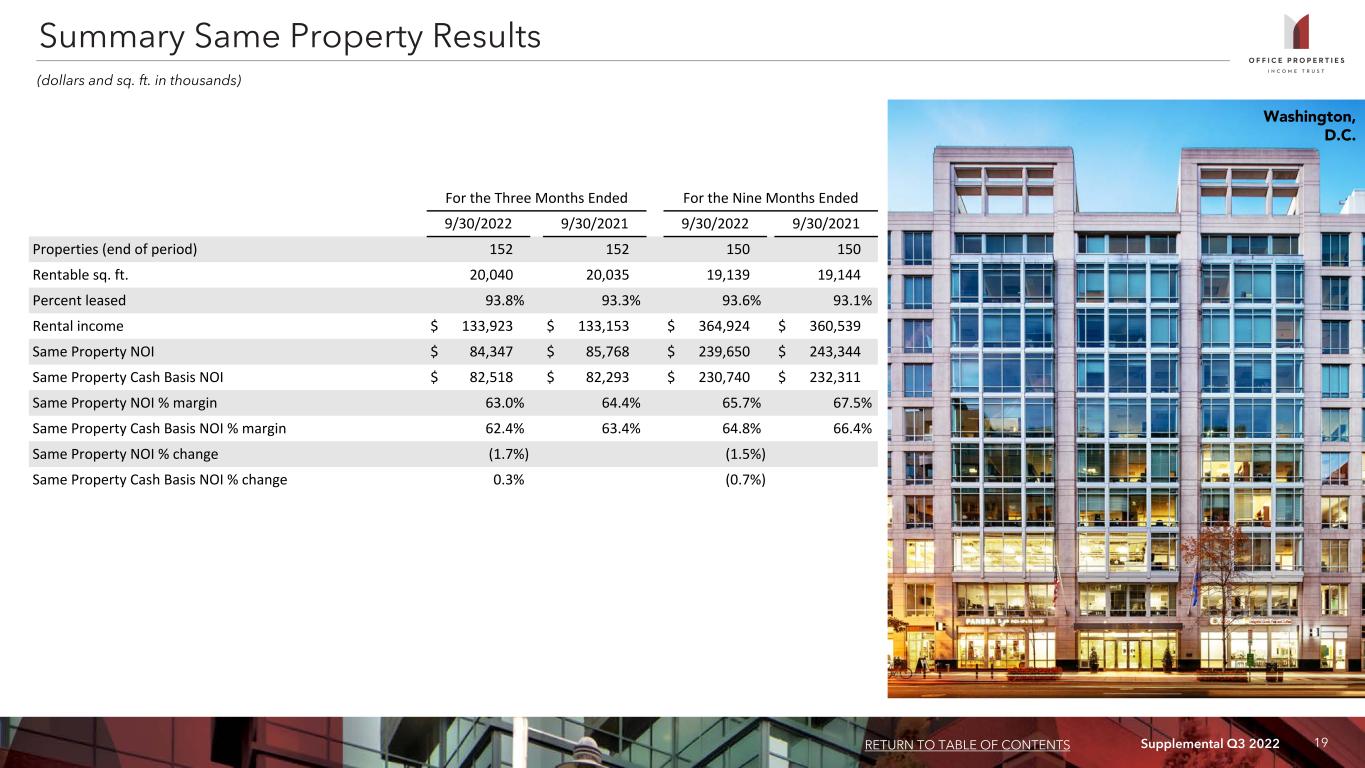
•Same property cash basis net operating income, or Cash Basis NOI, for the quarter ended September 30, 2022 increased 0.3% compared to the quarter ended September 30, 2021.
•Leasing activity for the quarter ended September 30, 2022 was as follows:
| Three Months Ended September 30, 2022 | |||||
| Leasing activity for new and renewal leases (rentable square feet) | 606,000 | ||||
| Weighted average rental rate change (by rentable square feet) | 21.6% | ||||
| Weighted average lease term (by rentable square feet) | 7.2 years | ||||
| Leasing concessions and capital commitments (per square foot per lease year) | $9.92 | ||||
| As of | |||||||||||||||||
| Percent Leased | September 30, 2022 | June 30, 2022 | September 30, 2021 | ||||||||||||||
| All properties | 90.7% | 89.4% | 89.0% | ||||||||||||||
| Same properties | 93.8% | 94.5% | 93.3% | ||||||||||||||
Reconciliations of net income (loss) determined in accordance with U.S. generally accepted accounting principles, or GAAP, to funds from operations, or FFO, Normalized FFO, CAD, net operating income, or NOI, and Cash Basis NOI, and a reconciliation of NOI to Same Property NOI and to Same Property Cash Basis NOI, for the quarters ended September 30, 2022 and 2021 appear later in this press release.
2
Disposition Activities:
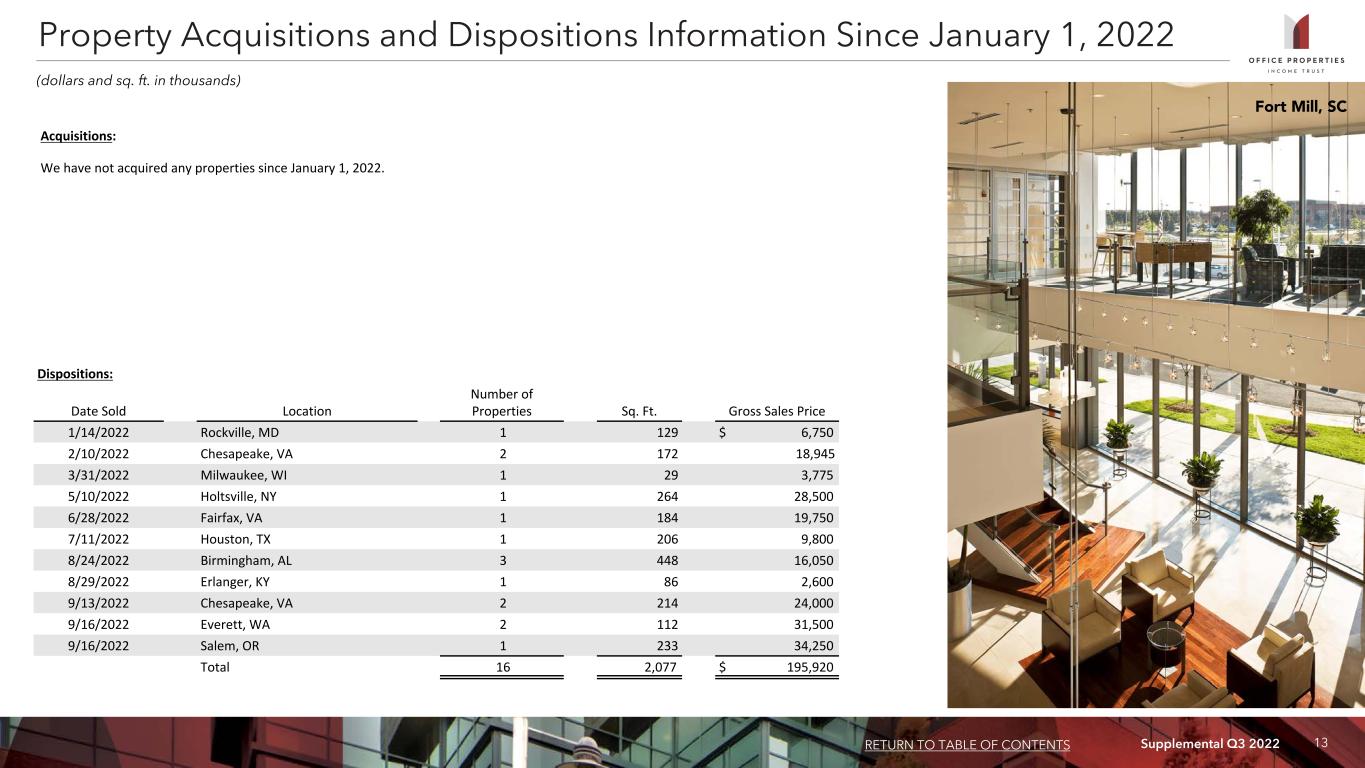
•Since July 1, 2022, OPI sold the following 10 properties containing approximately 1,299,000 rentable square feet for an aggregate sales price of $118.2 million, excluding closing costs:
| Date of Sale | Location | Number of Properties | Rentable Square Feet | Gross Sales Price (1) (in thousands) | ||||||||||||||||||||||
| July 2022 | Houston, TX | 1 | 206,000 | $ | 9,800 | |||||||||||||||||||||
| August 2022 | Birmingham, AL | 3 | 448,000 | 16,050 | ||||||||||||||||||||||
| August 2022 | Erlanger, KY | 1 | 86,000 | 2,600 | ||||||||||||||||||||||
| September 2022 | Chesapeake, VA | 2 | 214,000 | 24,000 | ||||||||||||||||||||||
| September 2022 | Everett, WA | 2 | 112,000 | 31,500 | ||||||||||||||||||||||
| September 2022 | Salem, OR | 1 | 233,000 | 34,250 | ||||||||||||||||||||||
| 10 | 1,299,000 | $ | 118,200 | |||||||||||||||||||||||
(1) Gross sales price is the gross contract price, excluding closing costs.
•As of October 26, 2022, OPI has entered into agreements to sell five properties containing approximately 338,000 rentable square feet for an aggregate sales price of $20.5 million, excluding closing costs.
Liquidity and Financing Activities:
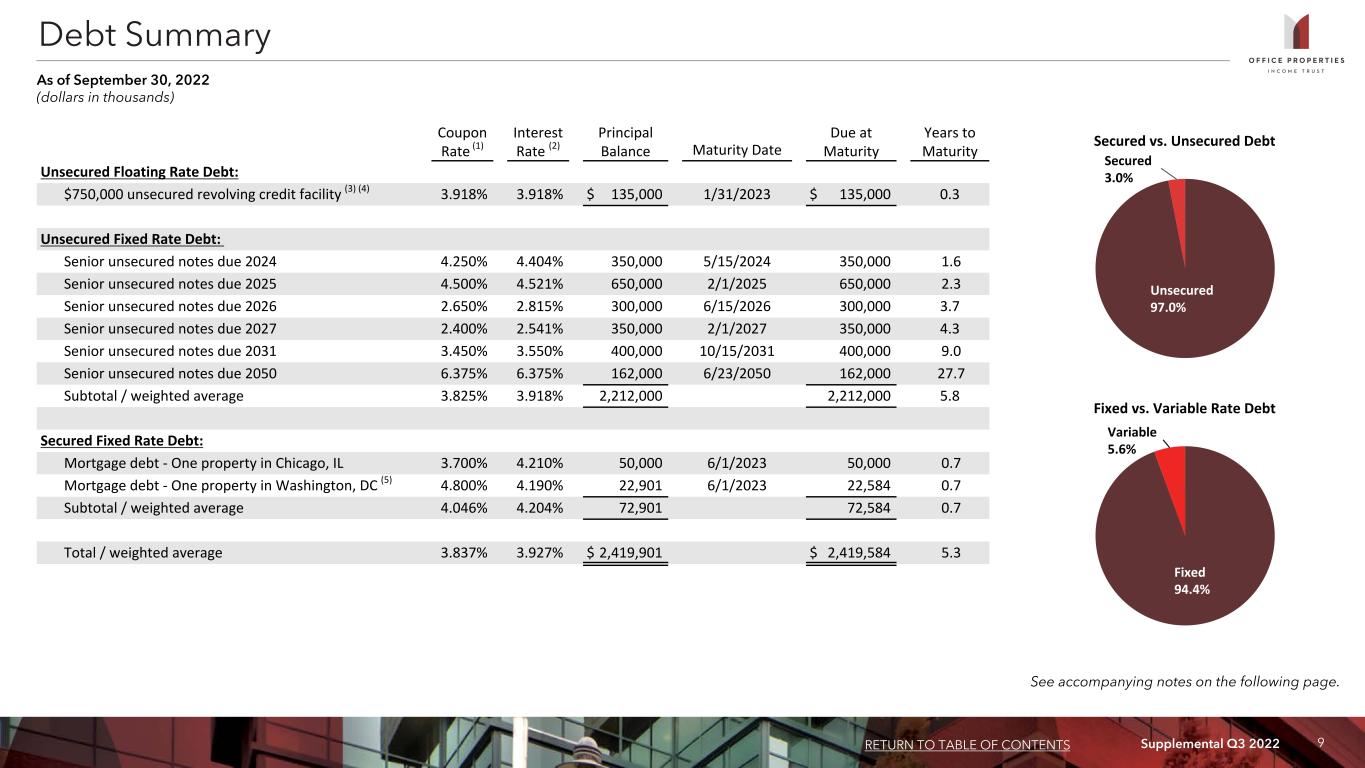
•As of September 30, 2022, OPI had $14.0 million of cash and cash equivalents and $615.0 million available to borrow under its unsecured revolving credit facility.
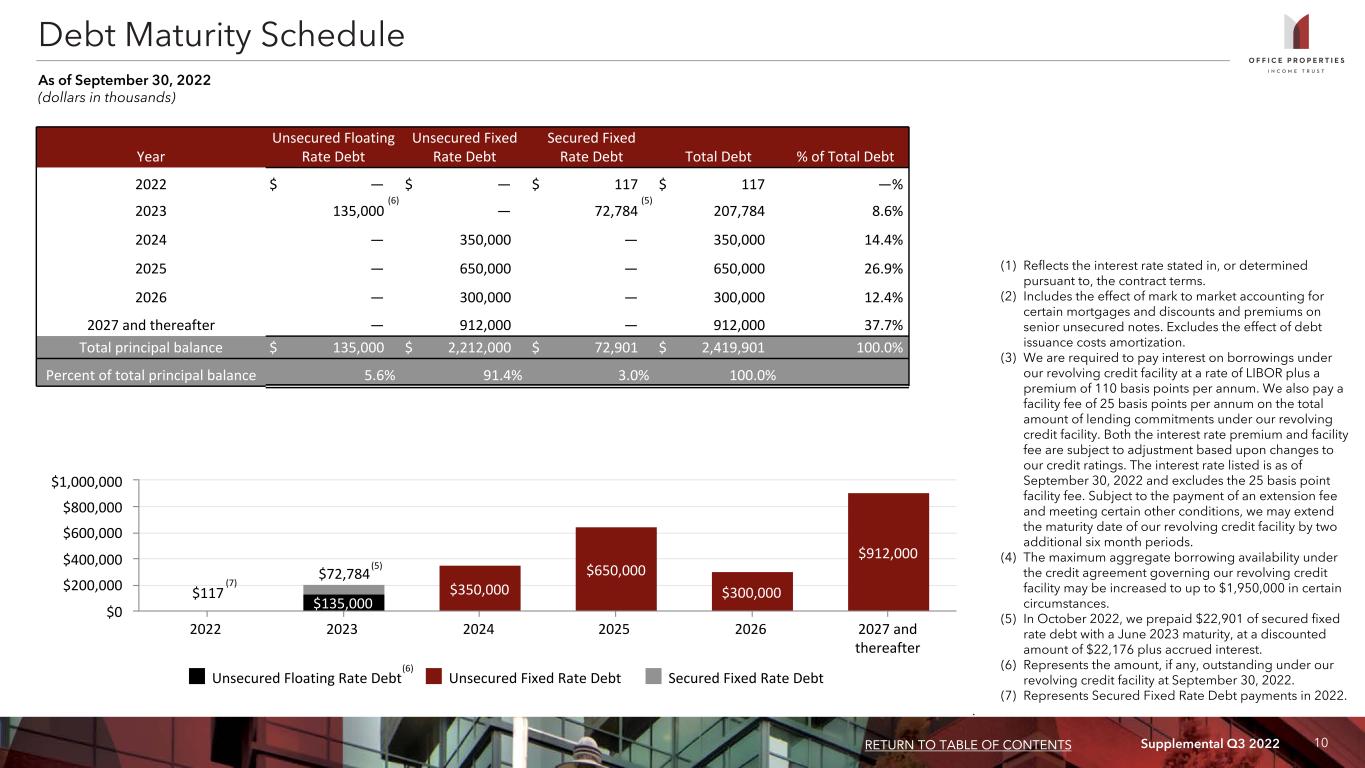
•In October 2022, OPI prepaid, at a discounted amount of $22.2 million plus accrued interest, a mortgage note secured by one property with an outstanding principal balance of $22.9 million, an annual interest rate of 4.80% and a maturity date in June 2023 using cash on hand and borrowings under its revolving credit facility.
Conference Call:
On Friday, October 28, 2022 at 10:00 a.m. Eastern Time, President and Chief Operating Officer, Christopher Bilotto, and Chief Financial Officer and Treasurer, Matthew Brown, will host a conference call to discuss OPI’s third quarter 2022 financial results.
The conference call telephone number is (877) 328-1172. Participants calling from outside the United States and Canada should dial (412) 317-5418. No pass code is necessary to access the call from either number. Participants should dial in about 15 minutes prior to the scheduled start of the call. A replay of the conference call will be available through 11:59 p.m. on Friday, November 4, 2022. To access the replay, dial (412) 317-0088. The replay pass code is 3280081.
A live audio webcast of the conference call will also be available in a listen only mode on OPI’s website, at www.opireit.com. Participants wanting to access the webcast should visit OPI’s website about five minutes before the call. The archived webcast will be available for replay on OPI’s website following the call for about one week. The transcription, recording and retransmission in any way of OPI’s third quarter conference call are strictly prohibited without the prior written consent of OPI.
Supplemental Data:
A copy of OPI’s Third Quarter 2022 Supplemental Operating and Financial Data is available for download at OPI’s website, www.opireit.com. OPI’s website is not incorporated as part of this press release.
3
Non-GAAP Financial Measures:
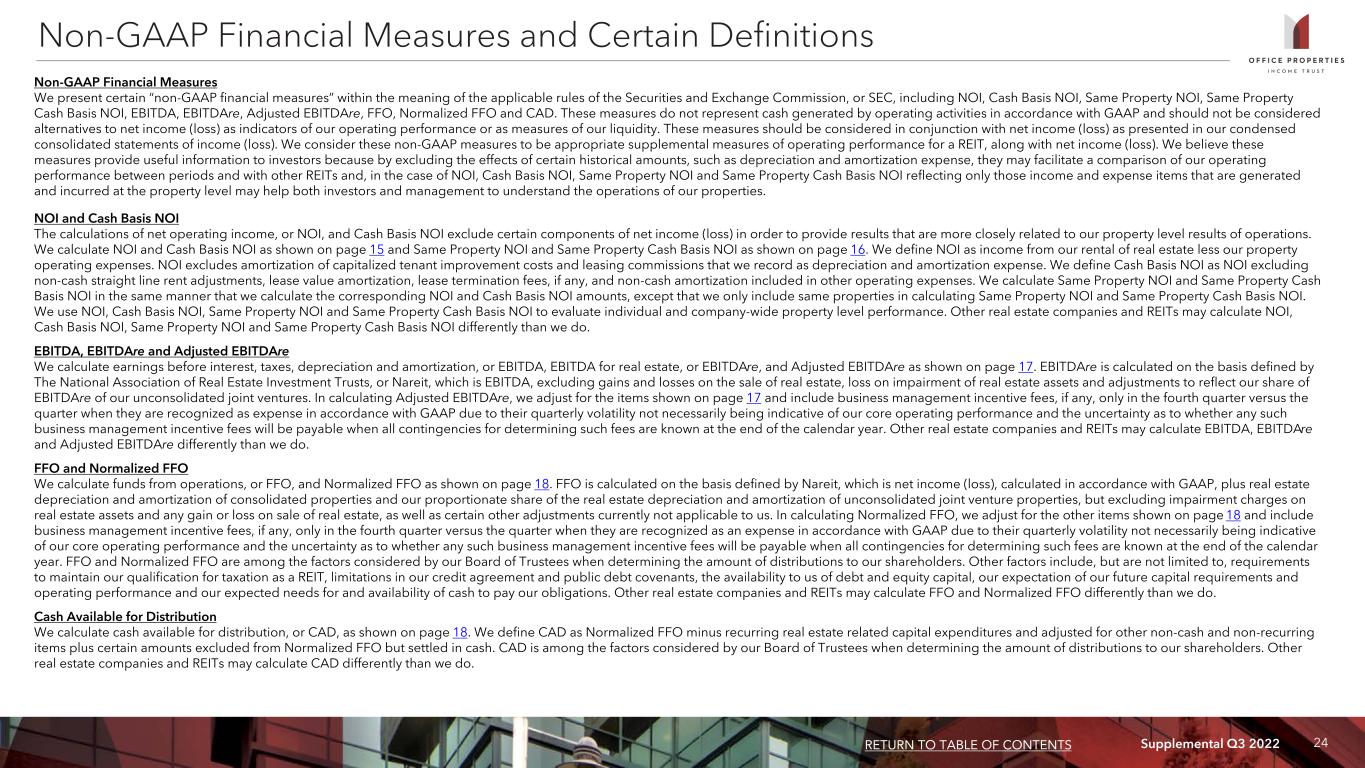
OPI presents certain “non-GAAP financial measures” within the meaning of the applicable rules of the Securities and Exchange Commission, or SEC, including FFO, Normalized FFO, CAD, NOI, Cash Basis NOI, Same Property NOI and Same Property Cash Basis NOI. These measures do not represent cash generated by operating activities in accordance with GAAP and should not be considered alternatives to net income (loss) as indicators of OPI’s operating performance or as measures of OPI’s liquidity. These measures should be considered in conjunction with net income (loss) as presented in OPI's condensed consolidated statements of income (loss). OPI considers these non-GAAP measures to be appropriate supplemental measures of operating performance for a real estate investment trust, or REIT, along with net income (loss). OPI believes these measures provide useful information to investors because by excluding the effects of certain historical amounts, such as depreciation and amortization expense, they may facilitate a comparison of OPI’s operating performance between periods and with other REITs and, in the case of NOI, Cash Basis NOI, Same Property NOI and Same Property Cash Basis NOI reflecting only those income and expense items that are generated and incurred at the property level may help both investors and management to understand the operations of OPI's properties.
Please see the pages attached hereto for a more detailed statement of OPI’s operating results and financial condition and for an explanation of OPI’s calculation of FFO, Normalized FFO, CAD, NOI, Cash Basis NOI, Same Property NOI and Same Property Cash Basis NOI and a reconciliation of those amounts to amounts determined in accordance with GAAP.
About Office Properties Income Trust:
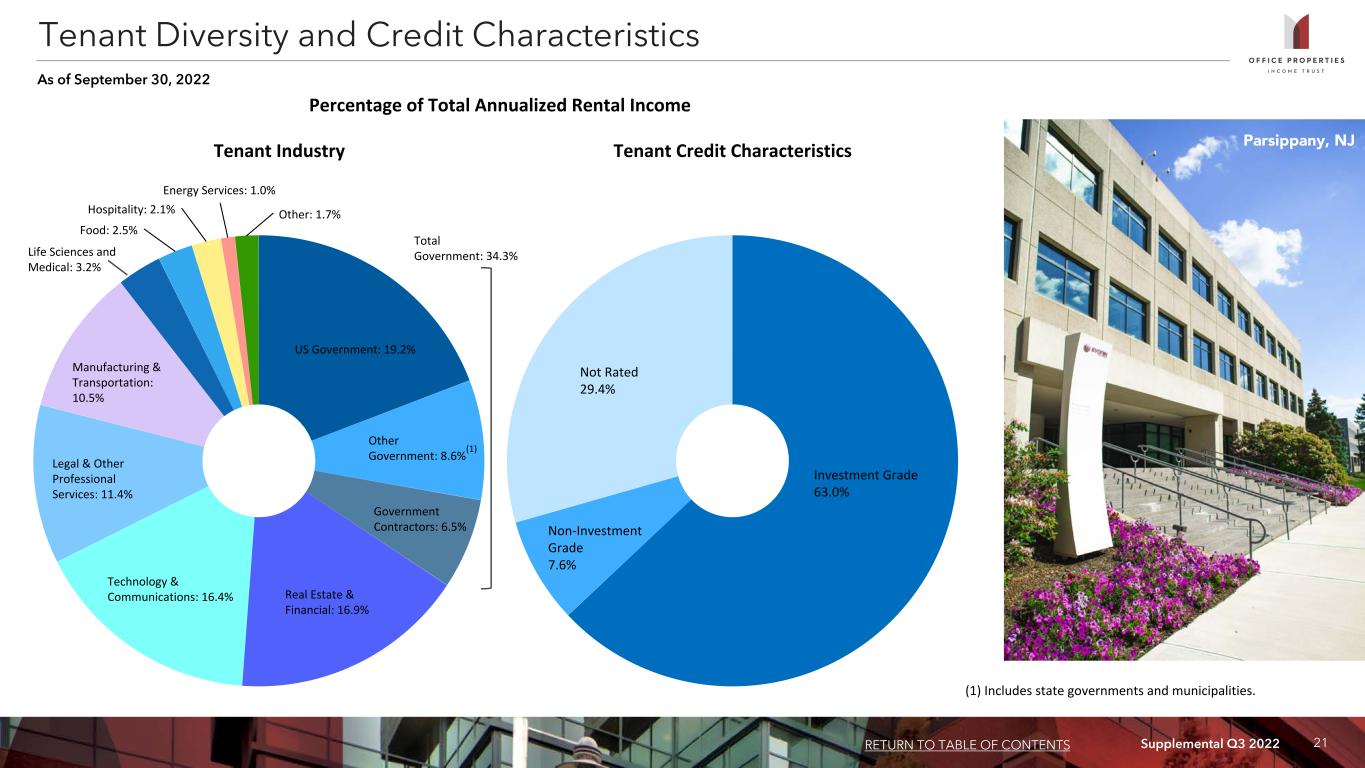
OPI is a national REIT focused on owning and leasing office properties primarily to single tenants and those with high credit quality characteristics. As of September 30, 2022, approximately 63% of OPI's revenues were from investment grade rated tenants. OPI owned and leased more than 160 properties as of September 30, 2022, with approximately 21.2 million square feet located in 31 states and Washington, D.C. In 2022, OPI was named as an Energy Star® Partner of the Year for the fifth consecutive year and a Gold Level Green Lease Leader. OPI is managed by The RMR Group (Nasdaq: RMR), a leading U.S. alternative asset management company with over $37 billion in assets under management as of September 30, 2022, and more than 35 years of institutional experience in buying, selling, financing and operating commercial real estate. OPI is headquartered in Newton, MA. For more information, visit opireit.com.
4
Office Properties Income Trust
Condensed Consolidated Statements of Income (Loss)
(amounts in thousands, except per share data)
(unaudited)
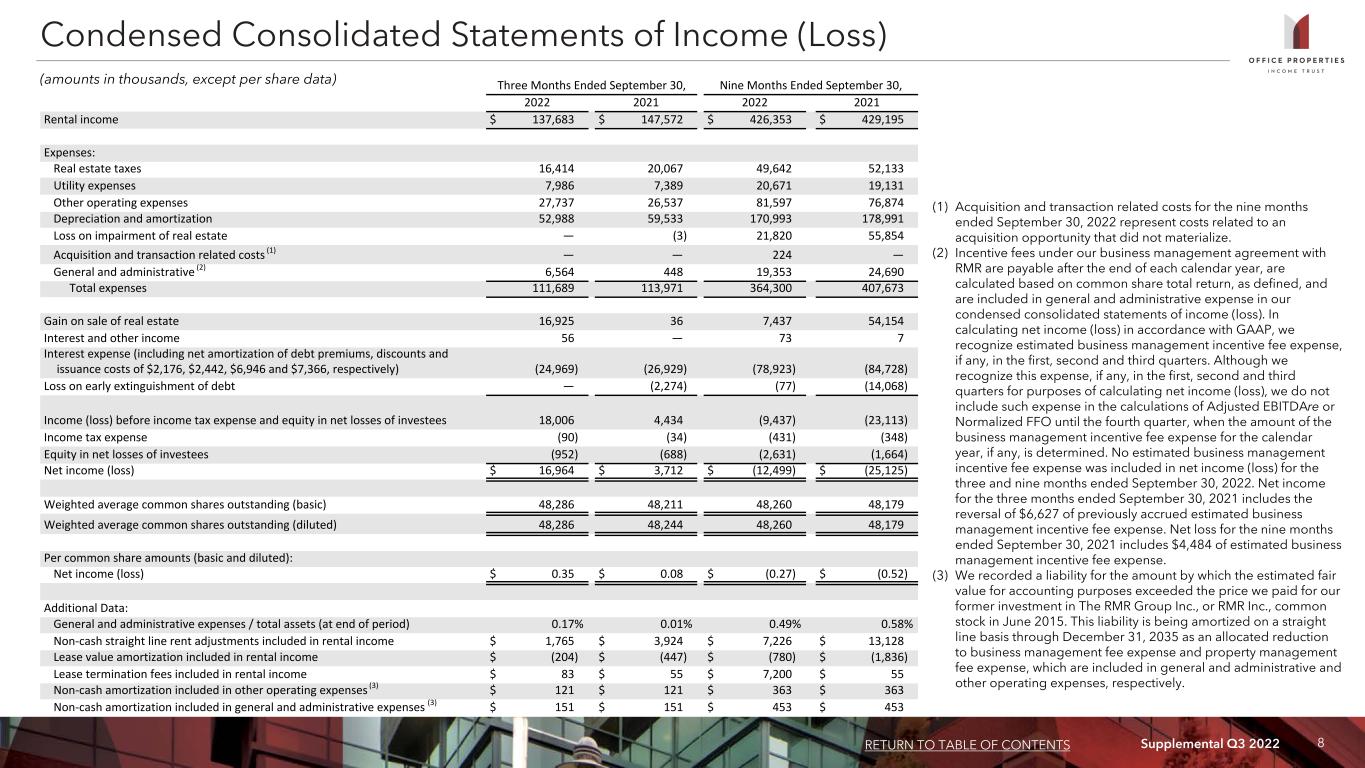
| Three Months Ended September 30, | Nine Months Ended September 30, | |||||||||||||||||||||||||
| 2022 | 2021 | 2022 | 2021 | |||||||||||||||||||||||
| Rental income | $ | 137,683 | $ | 147,572 | $ | 426,353 | $ | 429,195 | ||||||||||||||||||
| Expenses: | ||||||||||||||||||||||||||
| Real estate taxes | 16,414 | 20,067 | 49,642 | 52,133 | ||||||||||||||||||||||
| Utility expenses | 7,986 | 7,389 | 20,671 | 19,131 | ||||||||||||||||||||||
| Other operating expenses | 27,737 | 26,537 | 81,597 | 76,874 | ||||||||||||||||||||||
| Depreciation and amortization | 52,988 | 59,533 | 170,993 | 178,991 | ||||||||||||||||||||||
Loss on impairment of real estate (1) | — | (3) | 21,820 | 55,854 | ||||||||||||||||||||||
Acquisition and transaction related costs (2) | — | — | 224 | — | ||||||||||||||||||||||
General and administrative (3) | 6,564 | 448 | 19,353 | 24,690 | ||||||||||||||||||||||
| Total expenses | 111,689 | 113,971 | 364,300 | 407,673 | ||||||||||||||||||||||
Gain on sale of real estate (4) | 16,925 | 36 | 7,437 | 54,154 | ||||||||||||||||||||||
| Interest and other income | 56 | — | 73 | 7 | ||||||||||||||||||||||
Interest expense (including net amortization of debt premiums, discounts and issuance costs of $2,176, $2,442, $6,946 and $7,366, respectively) | (24,969) | (26,929) | (78,923) | (84,728) | ||||||||||||||||||||||
Loss on early extinguishment of debt (5) | — | (2,274) | (77) | (14,068) | ||||||||||||||||||||||
| Income (loss) before income tax expense and equity in net losses of investees | 18,006 | 4,434 | (9,437) | (23,113) | ||||||||||||||||||||||
| Income tax expense | (90) | (34) | (431) | (348) | ||||||||||||||||||||||
| Equity in net losses of investees | (952) | (688) | (2,631) | (1,664) | ||||||||||||||||||||||
| Net income (loss) | $ | 16,964 | $ | 3,712 | $ | (12,499) | $ | (25,125) | ||||||||||||||||||
| Weighted average common shares outstanding (basic) | 48,286 | 48,211 | 48,260 | 48,179 | ||||||||||||||||||||||
| Weighted average common shares outstanding (diluted) | 48,286 | 48,244 | 48,260 | 48,179 | ||||||||||||||||||||||
| Per common share amounts (basic and diluted): | ||||||||||||||||||||||||||
| Net income (loss) | $ | 0.35 | $ | 0.08 | $ | (0.27) | $ | (0.52) | ||||||||||||||||||
See Notes on pages 6 and 7.
5
Office Properties Income Trust
Funds from Operations, Normalized Funds from Operations and Cash Available for Distribution
(amounts in thousands, except per share data)
(unaudited)
| Three Months Ended September 30, | Nine Months Ended September 30, | |||||||||||||||||||||||||
| 2022 | 2021 | 2022 | 2021 | |||||||||||||||||||||||
Calculation of FFO, Normalized FFO and CAD (6)(7): | ||||||||||||||||||||||||||
| Net income (loss) | $ | 16,964 | $ | 3,712 | $ | (12,499) | $ | (25,125) | ||||||||||||||||||
| Add (less): Depreciation and amortization: | ||||||||||||||||||||||||||
| Consolidated properties | 52,988 | 59,533 | 170,993 | 178,991 | ||||||||||||||||||||||
| Unconsolidated joint venture properties | 775 | 745 | 2,269 | 2,674 | ||||||||||||||||||||||
Loss on impairment of real estate (1) | — | (3) | 21,820 | 55,854 | ||||||||||||||||||||||
Gain on sale of real estate (4) | (16,925) | (36) | (7,437) | (54,154) | ||||||||||||||||||||||
| FFO | 53,802 | 63,951 | 175,146 | 158,240 | ||||||||||||||||||||||
Add (less): Acquisition and transaction related costs (2) | — | — | 224 | — | ||||||||||||||||||||||
Loss on early extinguishment of debt (5) | — | 2,274 | 77 | 14,068 | ||||||||||||||||||||||
Estimated business management incentive fees (3) | — | (6,627) | — | 4,484 | ||||||||||||||||||||||
| Normalized FFO | 53,802 | 59,598 | 175,447 | 176,792 | ||||||||||||||||||||||
Add (less): Non-cash expenses (8) | (640) | 433 | (1,297) | 1,236 | ||||||||||||||||||||||
| Distributions from unconsolidated joint ventures | — | 153 | 51 | 459 | ||||||||||||||||||||||
| Depreciation and amortization - unconsolidated joint ventures | (775) | (745) | (2,269) | (2,674) | ||||||||||||||||||||||
| Equity in net losses of investees | 952 | 688 | 2,631 | 1,664 | ||||||||||||||||||||||
| Loss on early extinguishment of debt settled in cash | — | (1,874) | — | (4,374) | ||||||||||||||||||||||
| Non-cash straight line rent adjustments included in rental income | (1,765) | (3,924) | (7,226) | (13,128) | ||||||||||||||||||||||
| Lease value amortization included in rental income | 204 | 447 | 780 | 1,836 | ||||||||||||||||||||||
Net amortization of debt premiums, discounts and issuance costs | 2,176 | 2,442 | 6,946 | 7,366 | ||||||||||||||||||||||
| Recurring capital expenditures | (25,882) | (26,341) | (58,162) | (56,817) | ||||||||||||||||||||||
| CAD | $ | 28,072 | $ | 30,877 | $ | 116,901 | $ | 112,360 | ||||||||||||||||||
| Weighted average common shares outstanding (basic) | 48,286 | 48,211 | 48,260 | 48,179 | ||||||||||||||||||||||
| Weighted average common shares outstanding (diluted) | 48,286 | 48,244 | 48,260 | 48,179 | ||||||||||||||||||||||
| Per common share amounts (basic and diluted): | ||||||||||||||||||||||||||
| Net income (loss) | $ | 0.35 | $ | 0.08 | $ | (0.27) | $ | (0.52) | ||||||||||||||||||
| FFO | $ | 1.11 | $ | 1.33 | $ | 3.63 | $ | 3.28 | ||||||||||||||||||
| Normalized FFO | $ | 1.11 | $ | 1.24 | $ | 3.64 | $ | 3.67 | ||||||||||||||||||
| CAD | $ | 0.58 | $ | 0.64 | $ | 2.42 | $ | 2.33 | ||||||||||||||||||
| Distributions declared per share | $ | 0.55 | $ | 0.55 | $ | 1.65 | $ | 1.65 | ||||||||||||||||||
(1)Loss on impairment of real estate for the nine months ended September 30, 2022 includes an adjustment of $6,957 to reduce the carrying value of seven properties to their estimated fair values less costs to sell and an adjustment of $14,863 to reduce the carrying value of one property that was held and used as of March 31, 2022 to its estimated fair value. Loss on impairment of real estate for the nine months ended September 30, 2021 represents an adjustment of $55,854 to reduce the carrying value of six properties to their estimated fair values less costs to sell.
(2)Acquisition and transaction related costs for the nine months ended September 30, 2022 represent costs related to an acquisition opportunity that did not materialize.
6
(3)Incentive fees under OPI's business management agreement with The RMR Group LLC are payable after the end of each calendar year, are calculated based on common share total return, as defined, and are included in general and administrative expense in OPI’s condensed consolidated statements of income (loss). In calculating net income (loss) in accordance with GAAP, OPI recognizes estimated business management incentive fee expense, if any, in the first, second and third quarters. Although OPI recognizes this expense, if any, in the first, second and third quarters for purposes of calculating net income (loss), OPI does not include such expense in the calculation of Normalized FFO until the fourth quarter, when the amount of the business management incentive fee expense for the calendar year, if any, is determined. No estimated business management incentive fee expense was included in net income (loss) for the three or nine months ended September 30, 2022. Net income for the three months ended September 30, 2021 includes the reversal of $6,627 of previously accrued estimated business management incentive fee expense. Net loss for the nine months ended September 30, 2021 includes $4,484 of estimated business management incentive fee expense.
(4)Gain on sale of real estate for the three months ended September 30, 2022 represents a $16,925 net gain on the sale of 10 properties. Gain on sale of real estate for the nine months ended September 30, 2022 also includes a $9,488 net loss on the sale of six properties during the six months ended June 30, 2022. Gain on sale of real estate for the nine months ended September 30, 2021 represents a $54,154 net gain on the sale of five properties.
(5)Loss on early extinguishment of debt for the nine months ended September 30, 2022 includes write offs of the unamortized portion of certain discounts and issuance costs resulting from the early repayment of debt. Loss on early extinguishment of debt for the three months ended September 30, 2021 includes a prepayment fee and the write off of the unamortized portion of certain discounts related to OPI's redemption of all $300.0 million of its 4.15% senior unsecured notes due 2022. Loss on early extinguishment of debt for the nine months ended September 30, 2021 also includes prepayment fees related to the repayment of one mortgage note, as well as write offs of the unamortized portion of certain discounts and issuance costs resulting from the early repayment of debt during the six months ended June 30, 2021.
(6)OPI calculates FFO and Normalized FFO as shown above. FFO is calculated on the basis defined by The National Association of Real Estate Investment Trusts, which is net income (loss), calculated in accordance with GAAP, plus real estate depreciation and amortization of consolidated properties and its proportionate share of the real estate depreciation and amortization of unconsolidated joint venture properties, but excluding impairment charges on real estate assets and any gain or loss on sale of real estate, as well as certain other adjustments currently not applicable to OPI. In calculating Normalized FFO, OPI adjusts for the other items shown above and includes business management incentive fees, if any, only in the fourth quarter versus the quarter when they are recognized as an expense in accordance with GAAP due to their quarterly volatility not necessarily being indicative of OPI’s core operating performance and the uncertainty as to whether any such business management incentive fees will be payable when all contingencies for determining such fees are known at the end of the calendar year. FFO and Normalized FFO are among the factors considered by OPI’s Board of Trustees when determining the amount of distributions to OPI’s shareholders. Other factors include, but are not limited to, requirements to maintain OPI's qualification for taxation as a REIT, limitations in OPI’s credit agreement and public debt covenants, the availability to OPI of debt and equity capital, OPI’s expectation of its future capital requirements and operating performance and OPI’s expected needs for and availability of cash to pay its obligations. Other real estate companies and REITs may calculate FFO and Normalized FFO differently than OPI does.
(7)OPI calculates CAD as shown above. OPI defines CAD as Normalized FFO minus recurring real estate related capital expenditures and adjusted for other non-cash and non-recurring items plus certain amounts excluded from Normalized FFO but settled in cash, if any. CAD is among the factors considered by OPI's Board of Trustees when determining the amount of distributions to its shareholders. Other real estate companies and REITs may calculate CAD differently than OPI does.
(8)Non-cash expenses include equity based compensation, adjustments recorded to capitalize interest expense and amortization of the liability for the amount by which the estimated fair value for accounting purposes exceeded the price OPI paid for its former investment in The RMR Group Inc., or RMR Inc., common stock in June 2015. This liability is being amortized on a straight line basis through December 31, 2035 as an allocated reduction to business management fee expense and property management fee expense, which are included in general and administrative and other operating expenses, respectively.
7
Office Properties Income Trust
Calculation and Reconciliation of NOI, Cash Basis NOI, Same Property NOI and
Same Property Cash Basis NOI (1)
(amounts in thousands)
(unaudited)
| Three Months Ended September 30, | Nine Months Ended September 30, | |||||||||||||||||||||||||
| 2022 | 2021 | 2022 | 2021 | |||||||||||||||||||||||
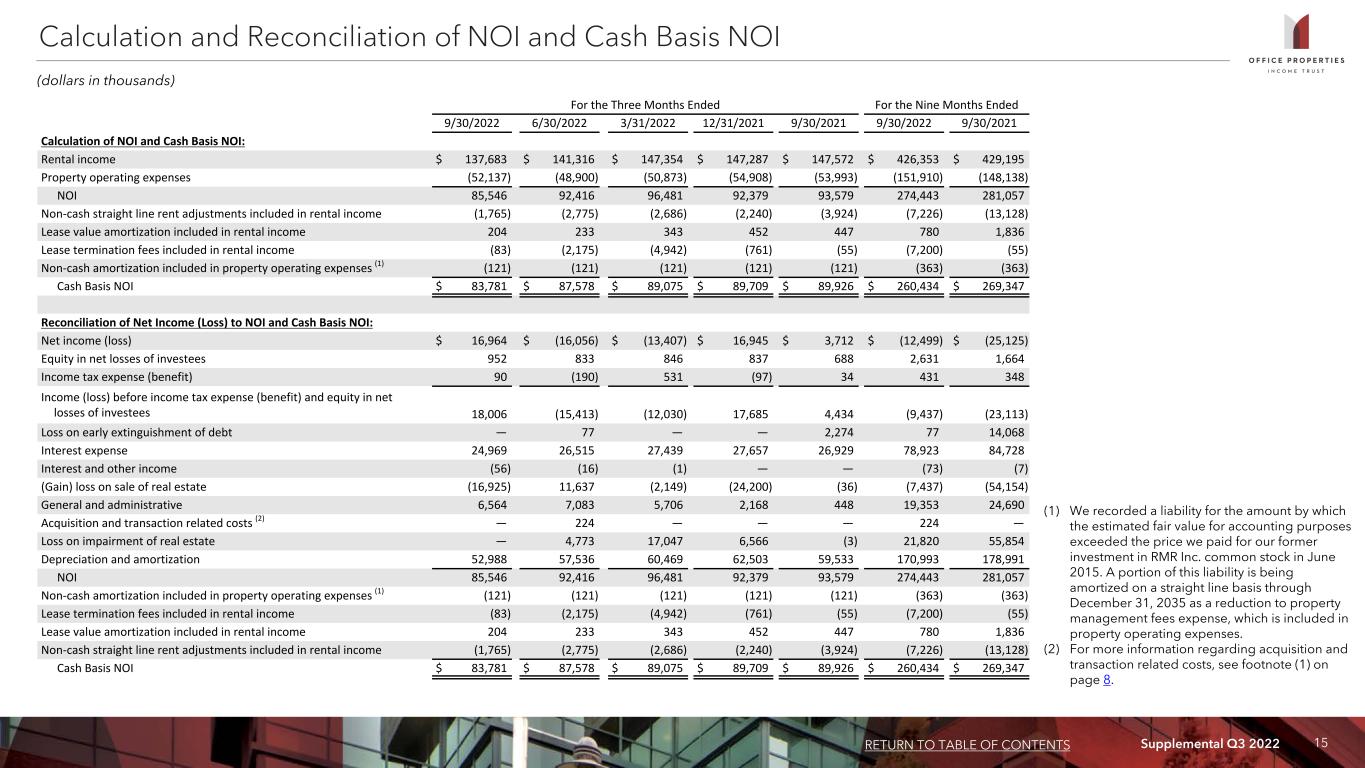
| Calculation of NOI and Cash Basis NOI: | ||||||||||||||||||||||||||
| Rental income | $ | 137,683 | $ | 147,572 | $ | 426,353 | $ | 429,195 | ||||||||||||||||||
| Property operating expenses | (52,137) | (53,993) | (151,910) | (148,138) | ||||||||||||||||||||||
| NOI | 85,546 | 93,579 | 274,443 | 281,057 | ||||||||||||||||||||||
| Non-cash straight line rent adjustments included in rental income | (1,765) | (3,924) | (7,226) | (13,128) | ||||||||||||||||||||||
| Lease value amortization included in rental income | 204 | 447 | 780 | 1,836 | ||||||||||||||||||||||
| Lease termination fees included in rental income | (83) | (55) | (7,200) | (55) | ||||||||||||||||||||||
Non-cash amortization included in property operating expenses (2) | (121) | (121) | (363) | (363) | ||||||||||||||||||||||
| Cash Basis NOI | $ | 83,781 | $ | 89,926 | $ | 260,434 | $ | 269,347 | ||||||||||||||||||
| Reconciliation of Net Income (Loss) to NOI and Cash Basis NOI: | ||||||||||||||||||||||||||
| Net income (loss) | $ | 16,964 | $ | 3,712 | $ | (12,499) | $ | (25,125) | ||||||||||||||||||
| Equity in net losses of investees | 952 | 688 | 2,631 | 1,664 | ||||||||||||||||||||||
| Income tax expense | 90 | 34 | 431 | 348 | ||||||||||||||||||||||
| Income (loss) before income tax expense and equity in net losses of investees | 18,006 | 4,434 | (9,437) | (23,113) | ||||||||||||||||||||||
| Loss on early extinguishment of debt | — | 2,274 | 77 | 14,068 | ||||||||||||||||||||||
| Interest expense | 24,969 | 26,929 | 78,923 | 84,728 | ||||||||||||||||||||||
| Interest and other income | (56) | — | (73) | (7) | ||||||||||||||||||||||
| Gain on sale of real estate | (16,925) | (36) | (7,437) | (54,154) | ||||||||||||||||||||||
| General and administrative | 6,564 | 448 | 19,353 | 24,690 | ||||||||||||||||||||||
| Acquisition and transaction related costs | — | — | 224 | — | ||||||||||||||||||||||
| Loss on impairment of real estate | — | (3) | 21,820 | 55,854 | ||||||||||||||||||||||
| Depreciation and amortization | 52,988 | 59,533 | 170,993 | 178,991 | ||||||||||||||||||||||
| NOI | 85,546 | 93,579 | 274,443 | 281,057 | ||||||||||||||||||||||
Non-cash amortization included in property operating expenses (2) | (121) | (121) | (363) | (363) | ||||||||||||||||||||||
| Lease termination fees included in rental income | (83) | (55) | (7,200) | (55) | ||||||||||||||||||||||
| Lease value amortization included in rental income | 204 | 447 | 780 | 1,836 | ||||||||||||||||||||||
| Non-cash straight line rent adjustments included in rental income | (1,765) | (3,924) | (7,226) | (13,128) | ||||||||||||||||||||||
| Cash Basis NOI | $ | 83,781 | $ | 89,926 | $ | 260,434 | $ | 269,347 | ||||||||||||||||||
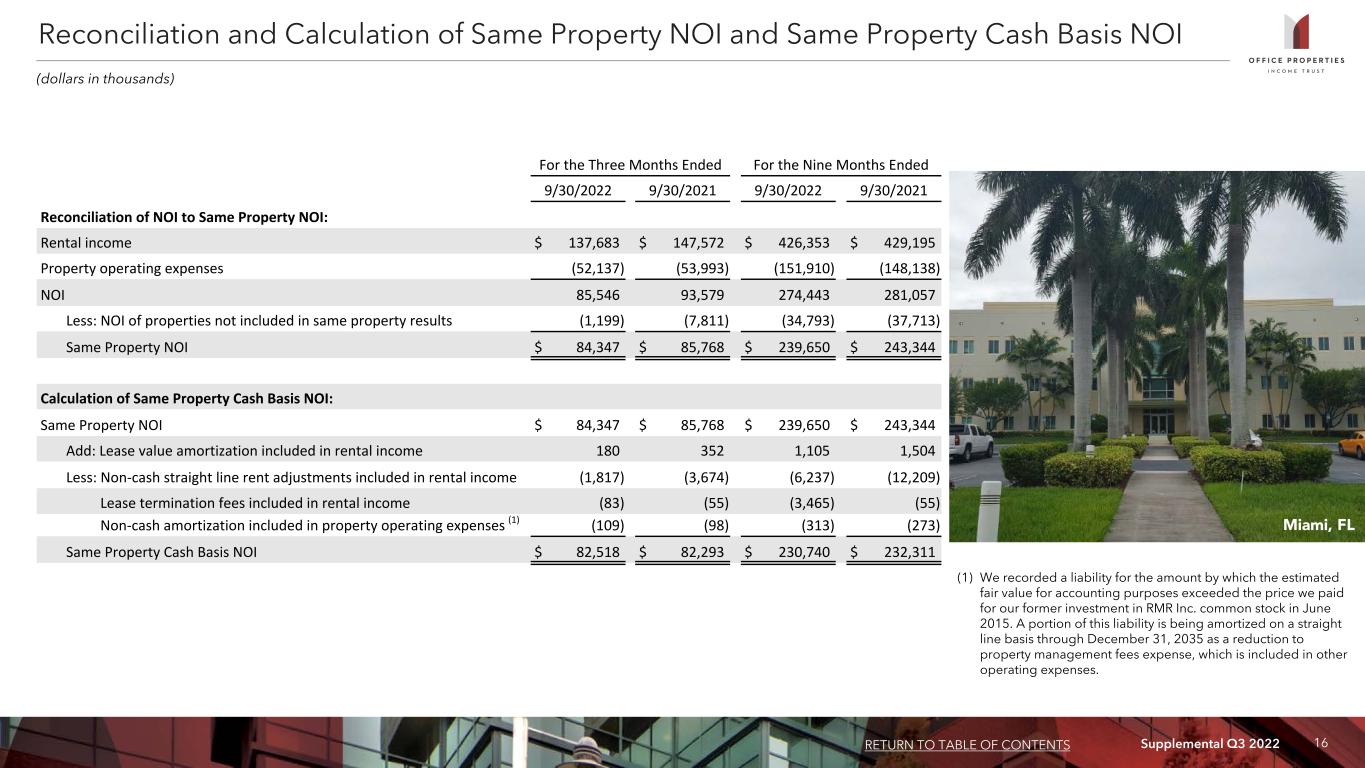
Reconciliation of NOI to Same Property NOI (3) (4): | ||||||||||||||||||||||||||
| Rental income | $ | 137,683 | $ | 147,572 | $ | 426,353 | $ | 429,195 | ||||||||||||||||||
| Property operating expenses | (52,137) | (53,993) | (151,910) | (148,138) | ||||||||||||||||||||||
| NOI | 85,546 | 93,579 | 274,443 | 281,057 | ||||||||||||||||||||||
| Less: NOI of properties not included in same property results | (1,199) | (7,811) | (34,793) | (37,713) | ||||||||||||||||||||||
| Same Property NOI | $ | 84,347 | $ | 85,768 | $ | 239,650 | $ | 243,344 | ||||||||||||||||||
Calculation of Same Property Cash Basis NOI (3) (4): | ||||||||||||||||||||||||||
| Same Property NOI | $ | 84,347 | $ | 85,768 | $ | 239,650 | $ | 243,344 | ||||||||||||||||||
| Add: Lease value amortization included in rental income | 180 | 352 | 1,105 | 1,504 | ||||||||||||||||||||||
| Less: Non-cash straight line rent adjustments included in rental income | (1,817) | (3,674) | (6,237) | (12,209) | ||||||||||||||||||||||
| Lease termination fees included in rental income | (83) | (55) | (3,465) | (55) | ||||||||||||||||||||||
Non-cash amortization included in property operating expenses (2) | (109) | (98) | (313) | (273) | ||||||||||||||||||||||
| Same Property Cash Basis NOI | $ | 82,518 | $ | 82,293 | $ | 230,740 | $ | 232,311 | ||||||||||||||||||
See Notes on page 9.
8
(1) The calculations of NOI and Cash Basis NOI exclude certain components of net income (loss) in order to provide results that are more closely related to OPI’s property level results of operations. OPI calculates NOI and Cash Basis NOI as shown above. OPI defines NOI as income from its rental of real estate less its property operating expenses. NOI excludes amortization of capitalized tenant improvement costs and leasing commissions that OPI records as depreciation and amortization expense. OPI defines Cash Basis NOI as NOI excluding non-cash straight line rent adjustments, lease value amortization, lease termination fees, if any, and non-cash amortization included in other operating expenses. OPI calculates Same Property NOI and Same Property Cash Basis NOI in the same manner that it calculates the corresponding NOI and Cash Basis NOI amounts, except that it only includes same properties in calculating Same Property NOI and Same Property Cash Basis NOI. OPI uses NOI, Cash Basis NOI, Same Property NOI and Same Property Cash Basis NOI to evaluate individual and company-wide property level performance. Other real estate companies and REITs may calculate NOI, Cash Basis NOI, Same Property NOI and Same Property Cash Basis NOI differently than OPI does.
(2) OPI recorded a liability for the amount by which the estimated fair value for accounting purposes exceeded the price OPI paid for its former investment in RMR Inc. common stock in June 2015. A portion of this liability is being amortized on a straight line basis through December 31, 2035 as a reduction to property management fee expense, which is included in property operating expenses.
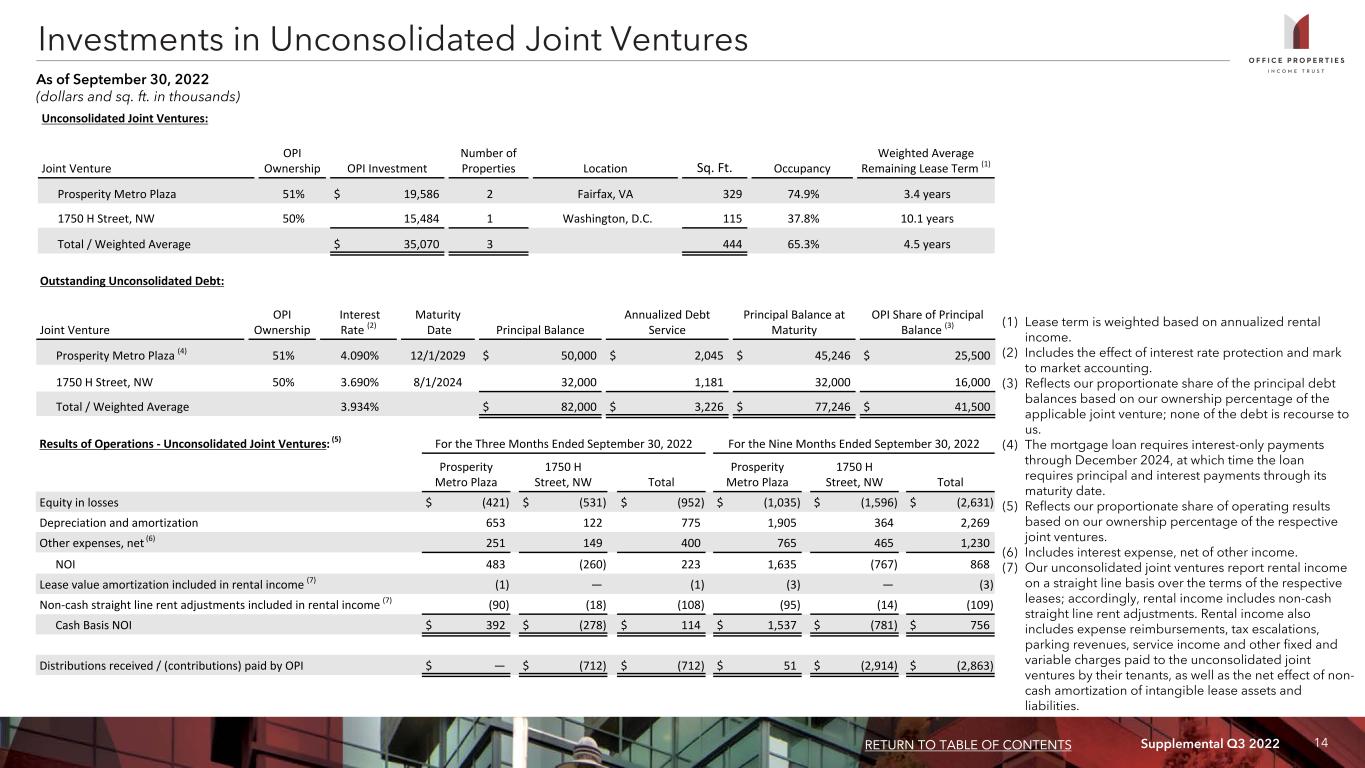
(3) For the three months ended September 30, 2022 and 2021, Same Property NOI and Same Property Cash Basis NOI are based on properties OPI owned continuously since July 1, 2021, and exclude properties classified as held for sale and properties undergoing significant redevelopment, if any, and three properties owned by two unconsolidated joint ventures in which OPI owns 51% and 50% interests.
(4) For the nine months ended September 30, 2022 and 2021, Same Property NOI and Same Property Cash Basis NOI are based on properties OPI owned continuously since January 1, 2021, and exclude properties classified as held for sale and properties undergoing significant redevelopment, if any, and three properties owned by two unconsolidated joint ventures in which OPI owns 51% and 50% interests.
9
Office Properties Income Trust
Condensed Consolidated Balance Sheets
(dollars in thousands, except per share data)
(unaudited)
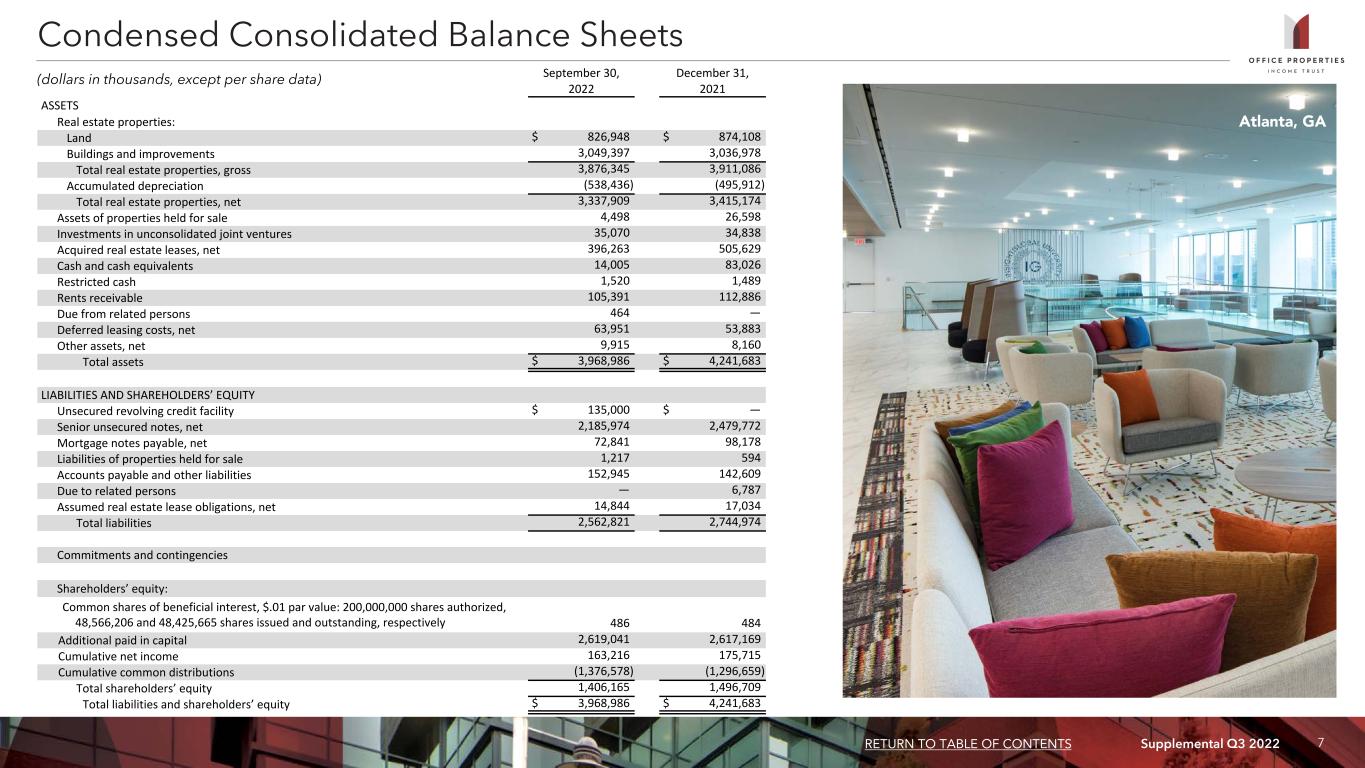
| September 30, | December 31, | |||||||||||||
| 2022 | 2021 | |||||||||||||
| ASSETS | ||||||||||||||
| Real estate properties: | ||||||||||||||
| Land | $ | 826,948 | $ | 874,108 | ||||||||||
| Buildings and improvements | 3,049,397 | 3,036,978 | ||||||||||||
| Total real estate properties, gross | 3,876,345 | 3,911,086 | ||||||||||||
| Accumulated depreciation | (538,436) | (495,912) | ||||||||||||
| Total real estate properties, net | 3,337,909 | 3,415,174 | ||||||||||||
| Assets of properties held for sale | 4,498 | 26,598 | ||||||||||||
| Investments in unconsolidated joint ventures | 35,070 | 34,838 | ||||||||||||
| Acquired real estate leases, net | 396,263 | 505,629 | ||||||||||||
| Cash and cash equivalents | 14,005 | 83,026 | ||||||||||||
| Restricted cash | 1,520 | 1,489 | ||||||||||||
| Rents receivable | 105,391 | 112,886 | ||||||||||||
| Due from related persons | 464 | — | ||||||||||||
| Deferred leasing costs, net | 63,951 | 53,883 | ||||||||||||
| Other assets, net | 9,915 | 8,160 | ||||||||||||
| Total assets | $ | 3,968,986 | $ | 4,241,683 | ||||||||||
| LIABILITIES AND SHAREHOLDERS’ EQUITY | ||||||||||||||
| Unsecured revolving credit facility | $ | 135,000 | $ | — | ||||||||||
| Senior unsecured notes, net | 2,185,974 | 2,479,772 | ||||||||||||
| Mortgage notes payable, net | 72,841 | 98,178 | ||||||||||||
| Liabilities of properties held for sale | 1,217 | 594 | ||||||||||||
| Accounts payable and other liabilities | 152,945 | 142,609 | ||||||||||||
| Due to related persons | — | 6,787 | ||||||||||||
| Assumed real estate lease obligations, net | 14,844 | 17,034 | ||||||||||||
| Total liabilities | 2,562,821 | 2,744,974 | ||||||||||||
| Commitments and contingencies | ||||||||||||||
| Shareholders’ equity: | ||||||||||||||
Common shares of beneficial interest, $.01 par value: 200,000,000 shares authorized, 48,566,206 and 48,425,665 shares issued and outstanding, respectively | 486 | 484 | ||||||||||||
| Additional paid in capital | 2,619,041 | 2,617,169 | ||||||||||||
| Cumulative net income | 163,216 | 175,715 | ||||||||||||
| Cumulative common distributions | (1,376,578) | (1,296,659) | ||||||||||||
| Total shareholders’ equity | 1,406,165 | 1,496,709 | ||||||||||||
| Total liabilities and shareholders’ equity | $ | 3,968,986 | $ | 4,241,683 | ||||||||||
10
Warning Concerning Forward-Looking Statements
This press release contains statements that constitute forward-looking statements within the meaning of the Private Securities Litigation Reform Act of 1995 and other securities laws. Also, whenever OPI uses words such as “believe”, “expect”, “anticipate”, “intend”, “plan”, “estimate”, “will”, “may” and negatives or derivatives of these or similar expressions, OPI is making forward-looking statements. These forward-looking statements are based upon OPI’s present intent, beliefs or expectations, but forward-looking statements are not guaranteed to occur and may not occur. Actual results may differ materially from those contained in or implied by OPI’s forward-looking statements as a result of various factors. Forward-looking statements involve known and unknown risks, uncertainties and other factors, some of which are beyond OPI's control. For example:
•Mr. Bilotto's statements about OPI's same property cash basis NOI growth and leasing activity may imply that OPI will continue to have similar and better results and positive leasing activity in future periods. However, OPI's operating results and ability to realize positive leasing activity depend on various factors, including market conditions and tenants' demand for OPI's properties, the timing of lease expirations and OPI's ability to successfully compete for tenants, among other factors. As a result, OPI may not realize better operating results and positive leasing activity in the future,
•Mr. Bilotto states that OPI's occupancy at quarter end continues to outperform the broader market and that OPI expects to reach approximately 92% occupancy by year end. However, OPI may not be able to successfully compete for tenants or negotiate and execute leases that result in an increase in the occupancy at its properties and occupancy could decline, and any occupancy gain may result from the sale of properties with lower occupancies rather than entering into leases for currently vacant space at properties OPI retains ownership of,
•Mr. Bilotto's statements regarding OPI's property sales year to date and its continued focus on reducing leverage may imply that OPI will achieve its disposition objectives for the year and reduce its leverage. However, OPI may not be able to successfully identify and negotiate and complete sales, any sales it may complete may take longer than expected and it may not realize its target proceeds on properties it elects to sell and further, OPI may not seek to sell additional properties that result in similar proceed amounts. In addition, for various reasons, OPI may be required to increase borrowings in the future, which in turn would increase its leverage. As a result, OPI may not realize the benefits it expects from its property sales or its efforts to reduce leverage,
•Mr. Bilotto states that OPI anticipates completing its development projects in the spring. However, OPI’s development projects may be delayed or take greater time to complete than currently anticipated, and
•OPI has entered into agreements to sell five properties for an aggregate sales price of $20.5 million, excluding closing costs. These transactions are subject to conditions. Those conditions may not be satisfied and these transactions may not occur, may be delayed or the terms may change.
The information contained in OPI’s filings with the SEC, including under “Risk Factors” in OPI’s periodic reports, or incorporated therein, identifies other important factors that could cause OPI’s actual results to differ materially from those stated in or implied by OPI’s forward-looking statements. OPI’s filings with the SEC are available on the SEC's website at www.sec.gov.
You should not place undue reliance upon forward-looking statements.
Except as required by law, OPI does not intend to update or change any forward-looking statements as a result of new information, future events or otherwise.
| Contact: | |||||
| Kevin Barry, Director, Investor Relations | |||||
| (617) 219-1410 | |||||
(END)
11