EXHIBIT 99.1
For Immediate Release
Analyst Inquiries: Media Inquiries:
Mike Eliason Tobin Richer
(317) 249-4559 (317) 249-4521
KAR Auction Services, Inc. Reports First Quarter 2021 Financial Results
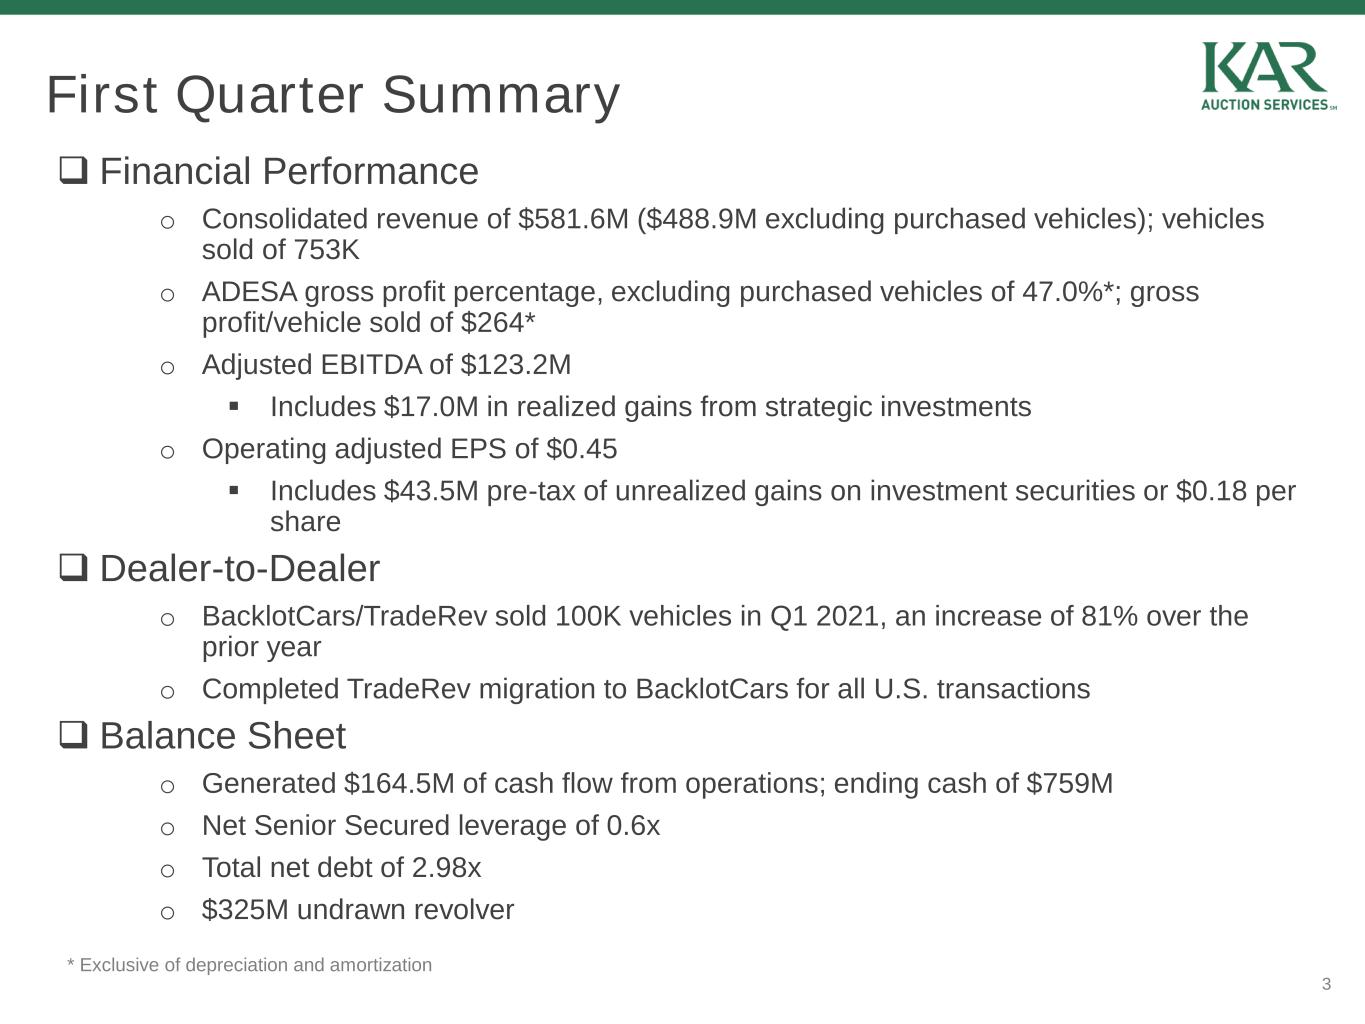
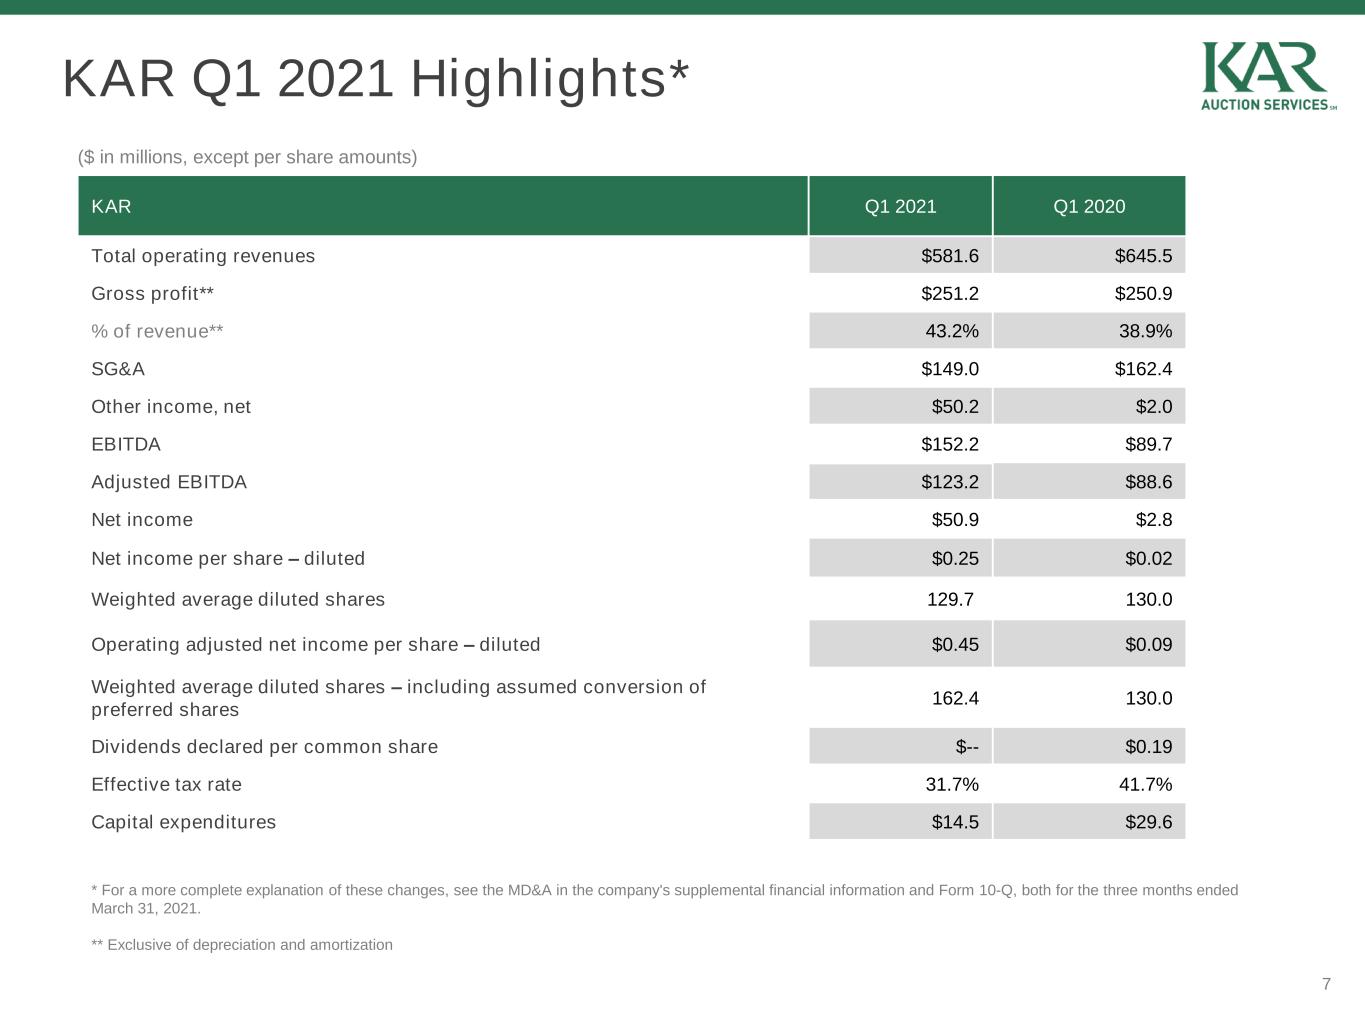
Carmel, IN, May 4, 2021 — KAR Auction Services, Inc. (NYSE: KAR), today reported its first quarter financial results for the period ended March 31, 2021. For the first quarter of 2021, the company reported revenue of $581.6 million as compared with revenue of $645.5 million for the first quarter of 2020, a decrease of 10%. Net income for the first quarter of 2021 increased to $50.9 million, or $0.25 per diluted share, as compared with net income of $2.8 million, or $0.02 per diluted share, in the first quarter of 2020. Adjusted EBITDA for the quarter ended March 31, 2021 increased 39% to $123.2 million, as compared with Adjusted EBITDA of $88.6 million for the quarter ended March 31, 2020. Operating adjusted net income per diluted share increased to $0.45 for the quarter ended March 31, 2021, as compared with operating adjusted net income per diluted share of $0.09 for the quarter ended March 31, 2020.
The company invests in certain early-stage automotive companies and funds that relate to the automotive industry. We believe these investments have resulted in the expansion of relationships in the vehicle remarketing industry. Realized gains on these investments were $17.0 million for the three months ended March 31, 2021. The company had unrealized gains of $43.5 million for the three months ended March 31, 2021.
Impact of COVID-19 on Company Operations
The company has been subject to numerous COVID-19-related orders and directives that have caused us to modify our business practices. All ADESA auction locations in the U.S. and Canada are offering vehicles for sale via ADESA Simulcast, DealerBlock and Simulcast+. Auction locations have resumed offering ancillary and related services, where possible and as permitted by government directives. However, given the evolving health, economic, social and governmental environments, the continuing impact that COVID-19 could have on our business remains uncertain. The broader implications for our business and results of operations remain uncertain and will depend on many factors outside our control, including, without limitation, the timing, extent, trajectory and duration of the pandemic, the imposition of protective public safety measures, the timing and number of people receiving vaccinations and effectiveness, and the timing to which normal economic and operating conditions resumes. Even after the COVID-19 outbreak has subsided, we may continue to experience materially adverse impacts to our business.
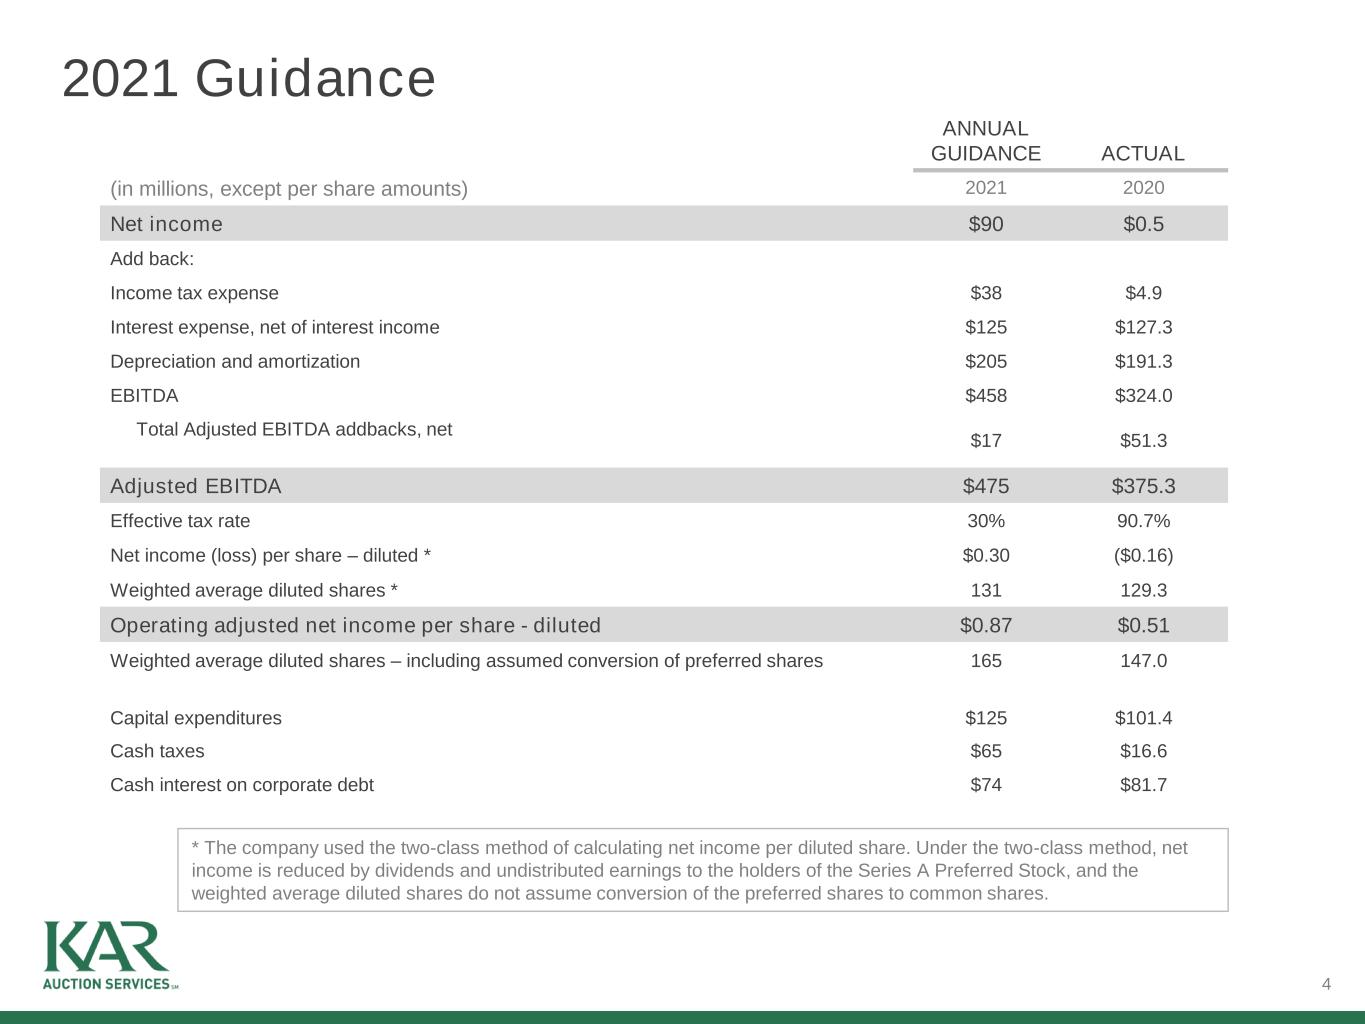
2021 Guidance
The company's previously stated guidance remains unchanged.
Earnings Conference Call Information
KAR will be hosting an earnings conference call and webcast on Wednesday, May 5, 2021 at 8:30 a.m. EDT. The call will be hosted by KAR's Executive Chairman, Jim Hallett, Chief Executive Officer, Peter Kelly and Executive Vice President and Chief Financial Officer, Eric Loughmiller. The conference call may be accessed by calling 1-844-778-4145 and entering participant passcode 8388224, while the live web cast will be available at the investors section of www.karglobal.com. Supplemental financial information for KAR’s first quarter 2021 results is available at the investors section of www.karglobal.com.
The archive of the webcast will also be available following the call and will be available at the investors section of www.karglobal.com for a limited time.
About KAR
KAR Auction Services, Inc. d/b/a KAR Global (NYSE: KAR), provides sellers and buyers across the global wholesale used vehicle industry with innovative, technology-driven remarketing solutions. KAR Global's unique end-to-end platform supports whole car, financing, logistics and other ancillary and related services, including the sale of nearly 3.1 million units valued at over $40 billion through our auctions in 2020. Our integrated physical, online and mobile marketplaces reduce risk, improve transparency and streamline transactions for customers in about 75 countries. Headquartered in Carmel, Indiana, KAR Global has employees across the United States, Canada, Mexico, Uruguay, U.K. and Europe. For more information and the latest KAR Global news, go to www.karglobal.com and follow us on Twitter @KARSpeaks.
Forward-Looking Statements
Certain statements contained in this release include "forward-looking statements" within the meaning of the Private Securities Litigation Reform Act of 1995 and which are subject to certain risks, trends and uncertainties. In particular, statements made that are not historical facts may be forward-looking statements. Words such as “should,” “may,” “will,” “anticipates,” “expects,” “intends,” “plans,” “believes,” “seeks,” “estimates,” and similar expressions identify forward-looking statements. Such statements are based on management's current expectations, are not guarantees of future performance and are subject to risks and uncertainties that could cause actual results to differ materially from the results projected, expressed or implied by these forward-looking statements. Factors that could cause or contribute to such differences include those uncertainties regarding the impact of the COVID-19 pandemic on our business and the economy generally, and those other matters disclosed in the Company’s Securities and Exchange Commission filings. The Company does not undertake any obligation to update any forward-looking statements.
KAR Auction Services, Inc.
Condensed Consolidated Statements of Income
(In millions) (Unaudited)
| | | | | | | | | | | |
| Three Months Ended
March 31, |
| 2021 | | 2020 |
| Operating revenues | | | |
| Auction fees | $ | 235.5 | | | $ | 255.3 | |
| Service revenue | 187.6 | | | 236.2 | |
| Purchased vehicle sales | 92.7 | | | 75.5 | |
| Finance-related revenue | 65.8 | | | 78.5 | |
| Total operating revenues | 581.6 | | | 645.5 | |
| | | |
| Operating expenses | | | |
| Cost of services (exclusive of depreciation and amortization) | 330.4 | | | 394.6 | |
| Selling, general and administrative | 149.0 | | | 162.4 | |
| Depreciation and amortization | 47.0 | | | 47.7 | |
| Total operating expenses | 526.4 | | | 604.7 | |
| | | |
| Operating profit | 55.2 | | | 40.8 | |
| | | |
| Interest expense | 30.9 | | | 38.0 | |
| Other income, net | (50.2) | | | (2.0) | |
| | | |
| Income before income taxes | 74.5 | | | 4.8 | |
| | | |
| Income taxes | 23.6 | | | 2.0 | |
| | | |
| Net income | $ | 50.9 | | | $ | 2.8 | |
| | | |
| Net income per share | | | |
| Basic | $ | 0.25 | | | $ | 0.02 | |
| Diluted | $ | 0.25 | | | $ | 0.02 | |
| | | |
| Dividends declared per common share | $ | — | | | $ | 0.19 | |
KAR Auction Services, Inc.
Condensed Consolidated Balance Sheets
(In millions) (Unaudited)
| | | | | | | | | | | |
| March 31,
2021 | | December 31,
2020 |
| Cash and cash equivalents | $ | 759.0 | | | $ | 752.1 | |
| Restricted cash | 52.5 | | | 60.2 | |
| Trade receivables, net of allowances | 659.3 | | | 367.2 | |
| Finance receivables, net of allowances | 1,958.9 | | | 1,889.0 | |
| Other current assets | 95.8 | | | 106.7 | |
| Total current assets | 3,525.5 | | | 3,175.2 | |
| | | |
| Goodwill | 2,135.9 | | | 2,140.2 | |
| Customer relationships, net of accumulated amortization | 198.9 | | | 211.3 | |
| Operating lease right-of-use assets | 343.0 | | | 350.6 | |
| Property and equipment, net of accumulated depreciation | 578.2 | | | 589.9 | |
| Intangible and other assets | 378.7 | | | 331.0 | |
| Total assets | $ | 7,160.2 | | | $ | 6,798.2 | |
| | | |
Current liabilities, excluding obligations collateralized by
finance receivables and current maturities of debt | $ | 1,386.5 | | | $ | 965.1 | |
| Obligations collateralized by finance receivables | 1,239.1 | | | 1,261.2 | |
| Current maturities of debt | 30.4 | | | 24.3 | |
| Total current liabilities | 2,656.0 | | | 2,250.6 | |
| | | |
| Long-term debt | 1,852.8 | | | 1,853.8 | |
| Operating lease liabilities | 336.3 | | | 344.2 | |
| Other non-current liabilities | 167.8 | | | 184.0 | |
| Temporary equity | 559.8 | | | 549.8 | |
| Stockholders’ equity | 1,587.5 | | | 1,615.8 | |
| Total liabilities, temporary equity and stockholders’ equity | $ | 7,160.2 | | | $ | 6,798.2 | |
KAR Auction Services, Inc.
Condensed Consolidated Statements of Cash Flows
(In millions) (Unaudited)
| | | | | | | | | | | |
| Three Months Ended March 31, |
| 2021 | | 2020 |
| Operating activities | | | |
| Net income | $ | 50.9 | | | $ | 2.8 | |
Adjustments to reconcile net income to net cash provided by operating activities: | | | |
| Depreciation and amortization | 47.0 | | | 47.7 | |
| Provision for credit losses | 5.5 | | | 18.7 | |
| Deferred income taxes | 5.2 | | | (4.7) | |
| Amortization of debt issuance costs | 3.0 | | | 2.7 | |
| Stock-based compensation | 5.4 | | | 5.0 | |
| Contingent consideration adjustment | 11.2 | | | — | |
| Unrealized gain on investment securities | (43.5) | | | — | |
| Other non-cash, net | 1.6 | | | 1.4 | |
Changes in operating assets and liabilities, net of acquisitions: | | | |
| Trade receivables and other assets | (297.8) | | | 210.7 | |
| Accounts payable and accrued expenses | 376.0 | | | (333.5) | |
| Net cash provided by (used by) operating activities | 164.5 | | | (49.2) | |
| Investing activities | | | |
| Net (increase) decrease in finance receivables held for investment | (73.3) | | | 146.3 | |
| Purchases of property, equipment and computer software | (14.5) | | | (29.6) | |
| Investments in securities | (15.3) | | | — | |
| Proceeds from sale of investments | 21.1 | | | — | |
| Proceeds from the sale of PWI | 0.9 | | | — | |
| Proceeds from the sale of property and equipment | 1.9 | | | — | |
| Net cash provided by (used by) investing activities | (79.2) | | | 116.7 | |
| Financing activities | | | |
| Net increase (decrease) in book overdrafts | 39.8 | | | (35.1) | |
| Net increase (decrease) in borrowings from lines of credit | 6.1 | | | (1.8) | |
| Net decrease in obligations collateralized by finance receivables | (25.1) | | | (103.7) | |
| Payments on long-term debt | (2.4) | | | (2.4) | |
| Payments on finance leases | (3.1) | | | (4.4) | |
| Payments of contingent consideration and deferred acquisition costs | (21.3) | | | (22.3) | |
| Issuance of common stock under stock plans | 0.3 | | | 0.4 | |
| Tax withholding payments for vested RSUs | (2.2) | | | (3.4) | |
| Repurchase and retirement of common stock | (80.8) | | | — | |
| Dividends paid to stockholders | — | | | (24.5) | |
| Net cash used by financing activities | (88.7) | | | (197.2) | |
| Effect of exchange rate changes on cash | 2.6 | | | (23.7) | |
| Net decrease in cash, cash equivalents and restricted cash | (0.8) | | | (153.4) | |
| Cash, cash equivalents and restricted cash at beginning of period | 812.3 | | | 560.9 | |
| Cash, cash equivalents and restricted cash at end of period | $ | 811.5 | | | $ | 407.5 | |
| Cash paid for interest, net of proceeds from interest rate derivatives | $ | 15.3 | | | $ | 23.4 | |
| Cash paid for taxes, net of refunds | $ | 11.7 | | | $ | 5.6 | |
KAR Auction Services, Inc.
Reconciliation of Non-GAAP Financial Measures
EBITDA, Adjusted EBITDA, operating adjusted net income and operating adjusted net income per share as presented herein are supplemental measures of our performance that are not required by, or presented in accordance with, generally accepted accounting principles in the United States (“GAAP”). They are not measurements of our financial performance under GAAP and should not be considered as substitutes for net income (loss) or any other performance measures derived in accordance with GAAP. Management believes that these measures provide investors additional meaningful methods to evaluate certain aspects of the company’s results period over period and for the other reasons set forth below.
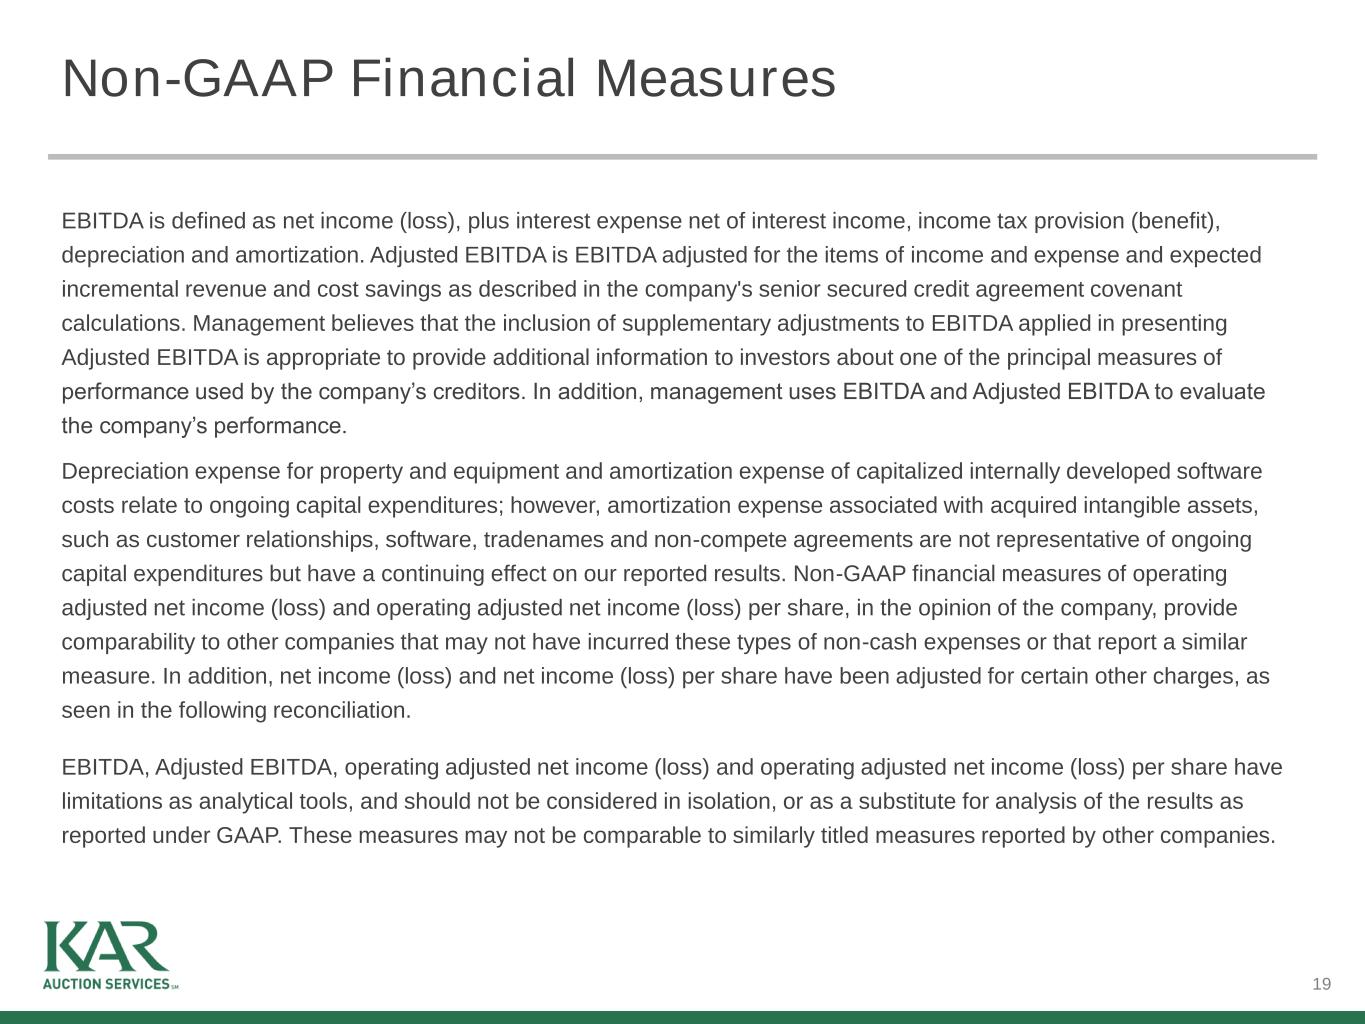
EBITDA is defined as net income (loss), plus interest expense net of interest income, income tax provision (benefit), depreciation and amortization. Adjusted EBITDA is EBITDA adjusted for the items of income and expense and expected incremental revenue and cost savings as described in our senior secured credit agreement covenant calculations. Management believes that the inclusion of supplementary adjustments to EBITDA applied in presenting Adjusted EBITDA is appropriate to provide additional information to investors about one of the principal measures of performance used by our creditors. In addition, management uses EBITDA and Adjusted EBITDA to evaluate our performance.
Depreciation expense for property and equipment and amortization expense of capitalized internally developed software costs relate to ongoing capital expenditures; however, amortization expense associated with acquired intangible assets, such as customer relationships, software, tradenames and noncompete agreements are not representative of ongoing capital expenditures, but have a continuing effect on our reported results. Non-GAAP financial measures of operating adjusted net income and operating adjusted net income per share, in the opinion of the company, provide comparability of the company's performance to other companies that may not have incurred these types of non-cash expenses or that report a similar measure. In addition, operating adjusted net income and operating adjusted net income per share may include adjustments for certain other charges.
EBITDA, Adjusted EBITDA, operating adjusted net income and operating adjusted net income per share have limitations as analytical tools, and should not be considered in isolation or as a substitute for analysis of the results as reported under GAAP. These measures may not be comparable to similarly titled measures reported by other companies.
The following table reconciles EBITDA and Adjusted EBITDA to net income for the periods presented:
| | | | | | | | | | | |
| Three Months Ended
March 31, |
(in millions), (unaudited) | 2021 | | 2020 |
| Net income | $ | 50.9 | | | $ | 2.8 | |
| Add back: | | | |
| Income taxes | 23.6 | | | 2.0 | |
| Interest expense, net of interest income | 30.7 | | | 37.2 | |
| Depreciation and amortization | 47.0 | | | 47.7 | |
| EBITDA | 152.2 | | | 89.7 | |
| Non-cash stock-based compensation | 5.6 | | | 5.3 | |
| Acquisition related costs | 1.5 | | | 1.4 | |
| Securitization interest | (6.8) | | | (11.4) | |
| Loss on asset sales | 0.2 | | | 0.5 | |
| Severance | 0.7 | | | 1.8 | |
| Foreign currency (gains)/losses | 2.2 | | | 0.4 | |
| Contingent consideration adjustment | 11.2 | | | — | |
| Unrealized gains on investment securities | (43.5) | | | — | |
| Other | (0.1) | | | 0.9 | |
| Total addbacks/(deductions) | (29.0) | | | (1.1) | |
| Adjusted EBITDA | $ | 123.2 | | | $ | 88.6 | |
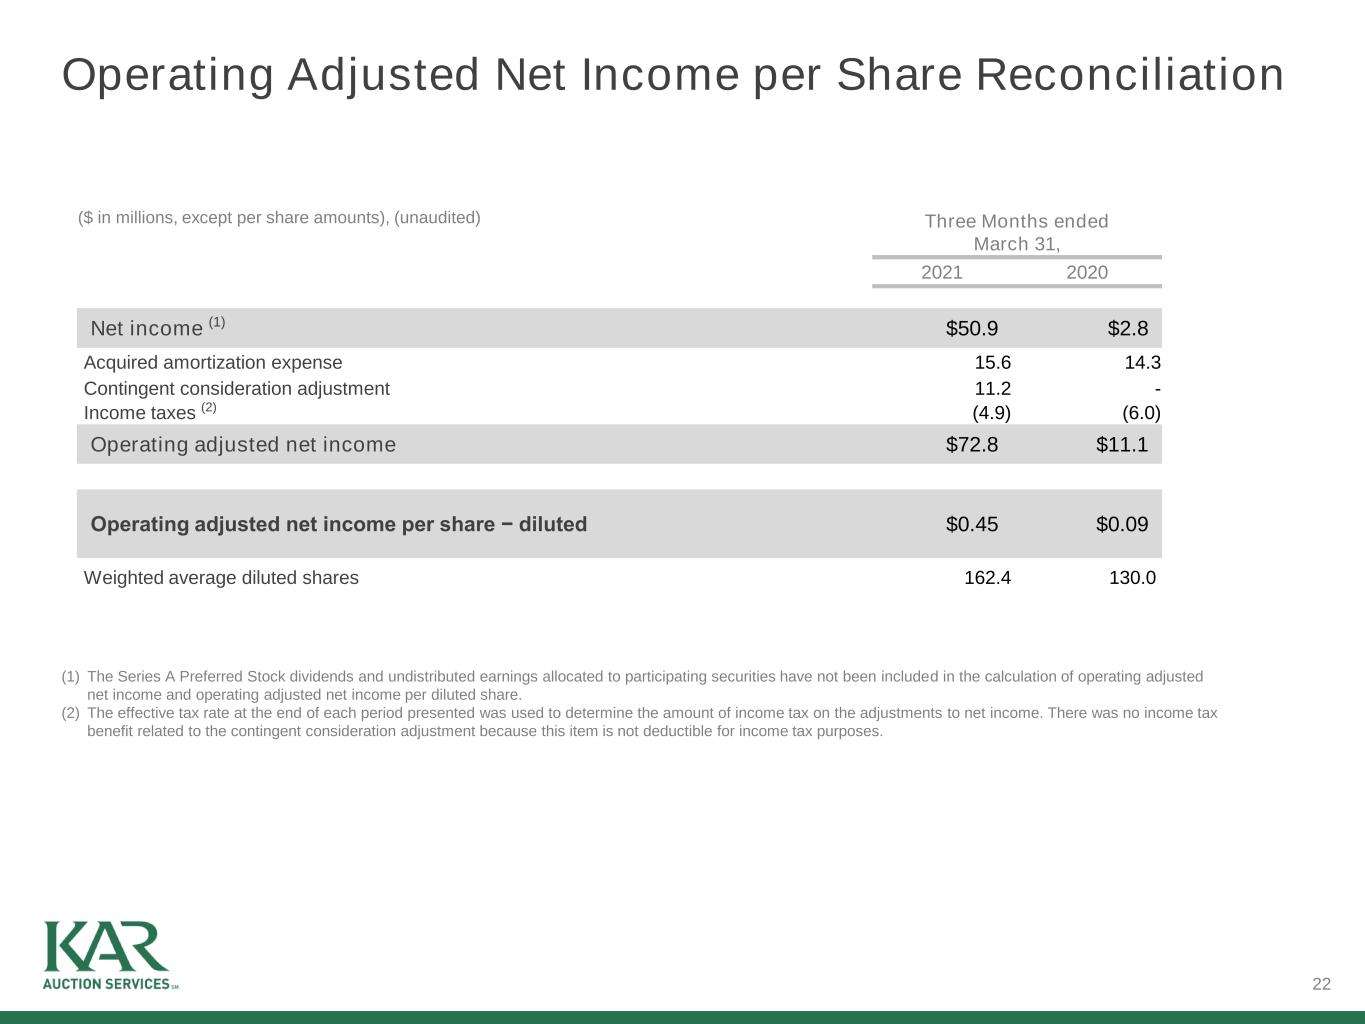
The following table reconciles operating adjusted net income and operating adjusted net income per diluted share to net income for the periods presented:
| | | | | | | | | | | |
| Three Months Ended
March 31, |
(in millions, except per share amounts), (unaudited) | 2021 | | 2020 |
Net income (1) | $ | 50.9 | | | $ | 2.8 | |
| Acquired amortization expense | 15.6 | | | 14.3 | |
| Contingent consideration adjustment | 11.2 | | | — | |
Income taxes (2) | (4.9) | | | (6.0) | |
| Operating adjusted net income | $ | 72.8 | | | $ | 11.1 | |
| | | |
| Operating adjusted net income per share - diluted | $ | 0.45 | | | $ | 0.09 | |
| | | |
Weighted average diluted shares | 162.4 | | | 130.0 | |
(1)The Series A Preferred Stock dividends and undistributed earnings allocated to participating securities have not been included in the calculation of operating adjusted net income and operating adjusted net income per diluted share.
(2)The effective tax rate at the end of each period presented was used to determine the amount of income tax on the adjustments to net income. There was no income tax benefit related to the contingent consideration adjustment because this item is not deductible for income tax purposes.
EXHIBIT 99.2
KAR Auction Services, Inc.
First Quarter 2021 Supplemental Financial Information
May 4, 2021
KAR Auction Services, Inc.
EBITDA and Adjusted EBITDA Measures
EBITDA and Adjusted EBITDA as presented herein are supplemental measures of our performance that are not required by, or presented in accordance with, generally accepted accounting principles in the United States (“GAAP”). They are not measurements of our financial performance under GAAP and should not be considered as substitutes for net income (loss) or any other performance measures derived in accordance with GAAP.
EBITDA is defined as net income (loss), plus interest expense net of interest income, income tax provision (benefit), depreciation and amortization. Adjusted EBITDA is EBITDA adjusted for the items of income and expense and expected incremental revenue and cost savings as described in our senior secured credit agreement covenant calculations. Management believes that the inclusion of supplementary adjustments to EBITDA applied in presenting Adjusted EBITDA is appropriate to provide additional information to investors about one of the principal measures of performance used by our creditors. In addition, management uses EBITDA and Adjusted EBITDA to evaluate our performance. EBITDA and Adjusted EBITDA have limitations as analytical tools, and should not be considered in isolation or as a substitute for analysis of the results as reported under GAAP. These measures may not be comparable to similarly titled measures reported by other companies.
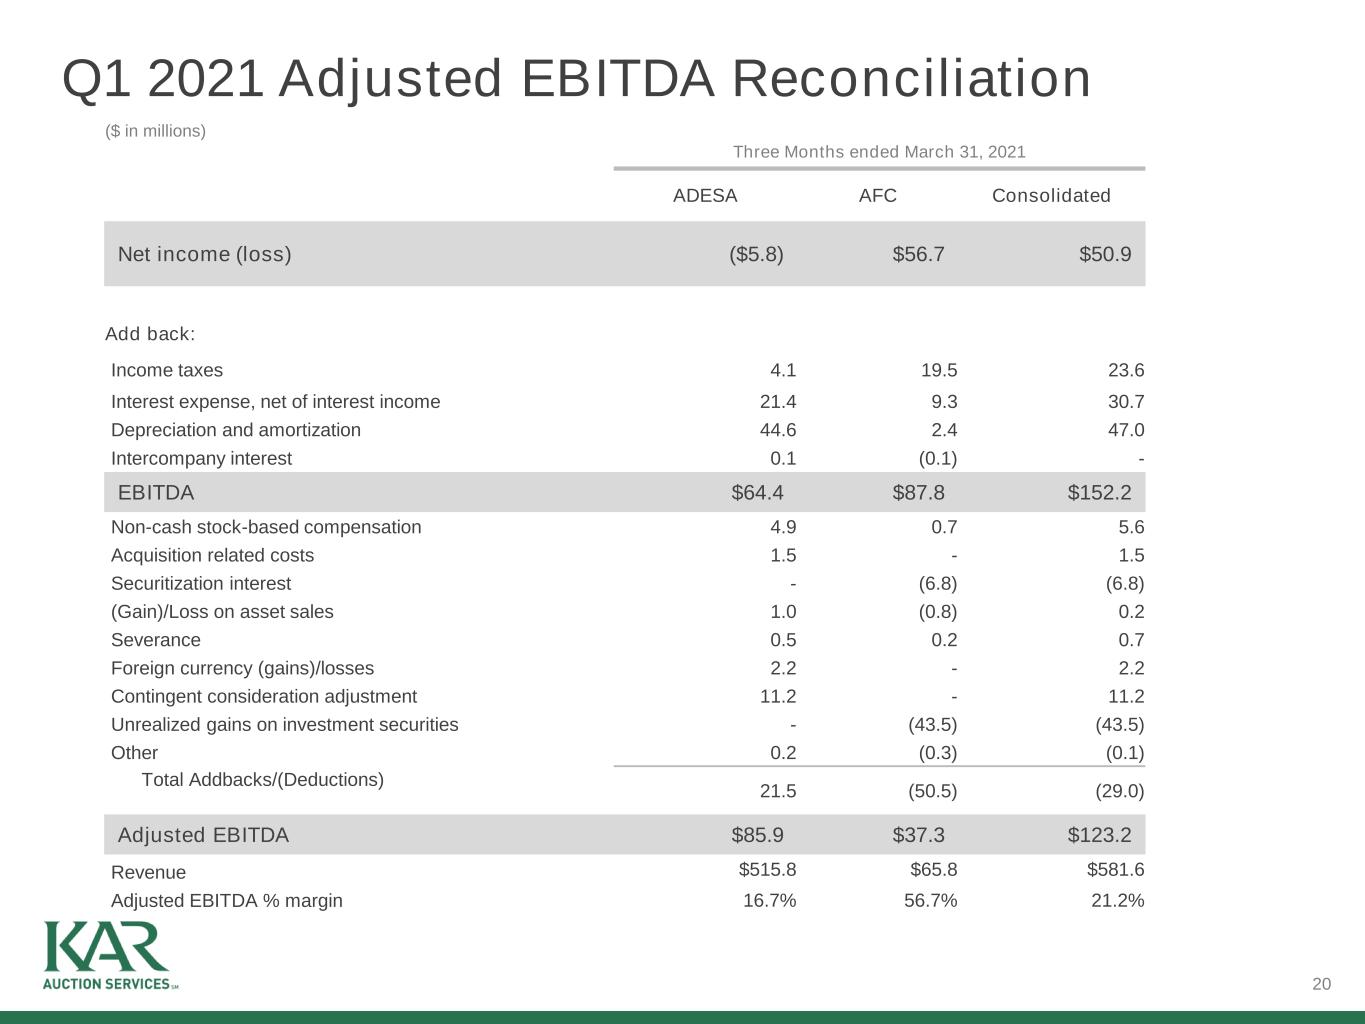
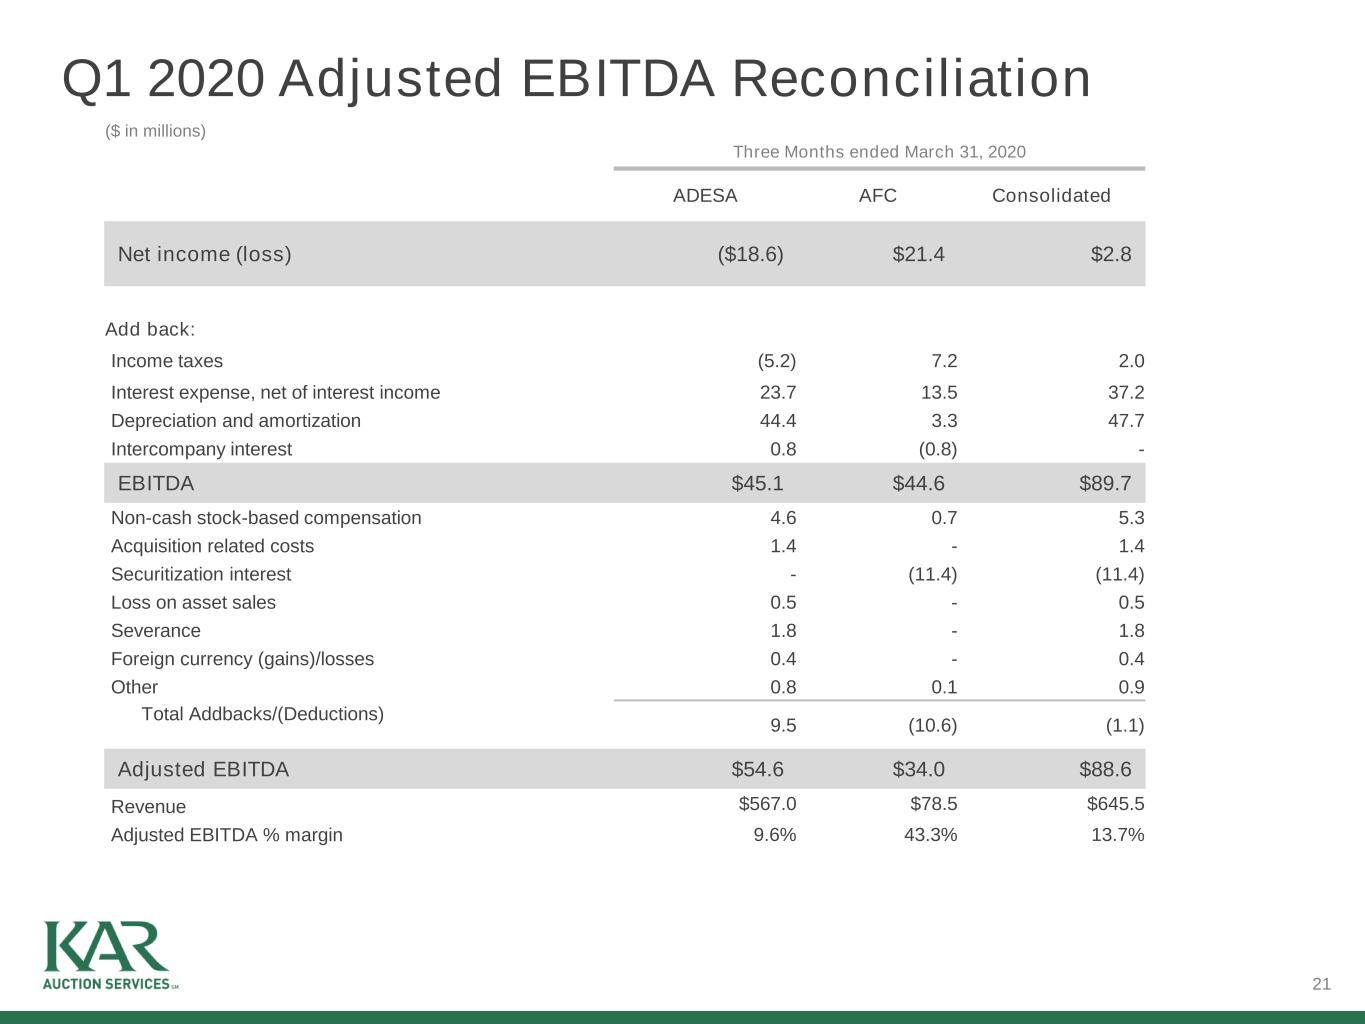
The following tables reconcile EBITDA and Adjusted EBITDA to net income (loss) for the periods presented:
| | | | | | | | | | | | | | | | | |
| Three Months Ended March 31, 2021 |
(Dollars in millions), (Unaudited) | ADESA | | AFC | | Consolidated |
Net income (loss) | $ | (5.8) | | | $ | 56.7 | | | $ | 50.9 | |
| Add back: | | | | | |
| Income taxes | 4.1 | | | 19.5 | | | 23.6 | |
| Interest expense, net of interest income | 21.4 | | | 9.3 | | | 30.7 | |
| Depreciation and amortization | 44.6 | | | 2.4 | | | 47.0 | |
| Intercompany interest | 0.1 | | | (0.1) | | | — | |
| EBITDA | 64.4 | | | 87.8 | | | 152.2 | |
| Non-cash stock-based compensation | 4.9 | | | 0.7 | | | 5.6 | |
| Acquisition related costs | 1.5 | | | — | | | 1.5 | |
| Securitization interest | — | | | (6.8) | | | (6.8) | |
| (Gain)/Loss on asset sales | 1.0 | | | (0.8) | | | 0.2 | |
| Severance | 0.5 | | | 0.2 | | | 0.7 | |
| Foreign currency (gains)/losses | 2.2 | | | — | | | 2.2 | |
| Contingent consideration adjustment | 11.2 | | | — | | | 11.2 | |
| Unrealized gains on investment securities | — | | | (43.5) | | | (43.5) | |
| Other | 0.2 | | | (0.3) | | | (0.1) | |
| Total addbacks/(deductions) | 21.5 | | | (50.5) | | | (29.0) | |
| Adjusted EBITDA | $ | 85.9 | | | $ | 37.3 | | | $ | 123.2 | |
| | | | | | | | | | | | | | | | | |
| Three Months Ended March 31, 2020 |
(Dollars in millions), (Unaudited) | ADESA | | AFC | | Consolidated |
Net income (loss) | $ | (18.6) | | | $ | 21.4 | | | $ | 2.8 | |
| Add back: | | | | | |
| Income taxes | (5.2) | | | 7.2 | | | 2.0 | |
| Interest expense, net of interest income | 23.7 | | | 13.5 | | | 37.2 | |
| Depreciation and amortization | 44.4 | | | 3.3 | | | 47.7 | |
| Intercompany interest | 0.8 | | | (0.8) | | | — | |
| EBITDA | 45.1 | | | 44.6 | | | 89.7 | |
| Non-cash stock-based compensation | 4.6 | | | 0.7 | | | 5.3 | |
| Acquisition related costs | 1.4 | | | — | | | 1.4 | |
| Securitization interest | — | | | (11.4) | | | (11.4) | |
| Loss on asset sales | 0.5 | | | — | | | 0.5 | |
| Severance | 1.8 | | | — | | | 1.8 | |
| Foreign currency (gains)/losses | 0.4 | | | — | | | 0.4 | |
| Other | 0.8 | | | 0.1 | | | 0.9 | |
| Total addbacks/(deductions) | 9.5 | | | (10.6) | | | (1.1) | |
| Adjusted EBITDA | $ | 54.6 | | | $ | 34.0 | | | $ | 88.6 | |
Certain of our loan covenant calculations utilize financial results for the most recent four consecutive fiscal quarters. The following table reconciles EBITDA and Adjusted EBITDA to net income (loss) for the periods presented:
| | | | | | | | | | | | | | | | | | | | | | | | | | | | | |
|
Three Months Ended | | Twelve Months Ended |
(Dollars in millions), (Unaudited) | June 30,
2020 | | September 30,
2020 | | December 31,
2020 | | March 31,
2021 | | March 31,
2021 |
| Net income (loss) | $ | (32.3) | | | $ | 47.1 | | | $ | (17.1) | | | $ | 50.9 | | | $ | 48.6 | |
| Add back: | | | | | | | | | |
| Income taxes | (4.6) | | | 10.9 | | | (3.4) | | | 23.6 | | | 26.5 | |
Interest expense, net of
interest income | 30.6 | | | 29.2 | | | 30.3 | | | 30.7 | | | 120.8 | |
| Depreciation and amortization | 46.5 | | | 46.5 | | | 50.6 | | | 47.0 | | | 190.6 | |
| EBITDA | 40.2 | | | 133.7 | | | 60.4 | | | 152.2 | | | 386.5 | |
| Non-cash stock-based compensation | 2.9 | | | 3.9 | | | 3.0 | | | 5.6 | | | 15.4 | |
| Acquisition related costs | 0.9 | | | 2.4 | | | 4.1 | | | 1.5 | | | 8.9 | |
| Securitization interest | (6.0) | | | (3.7) | | | (6.2) | | | (6.8) | | | (22.7) | |
| Loss on asset sales | 0.5 | | | 0.1 | | | 0.2 | | | 0.2 | | | 1.0 | |
| Severance | 6.5 | | | 2.3 | | | 0.9 | | | 0.7 | | | 10.4 | |
| Foreign currency (gains)/losses | 2.7 | | | 0.1 | | | 1.7 | | | 2.2 | | | 6.7 | |
Goodwill and other intangibles
impairment | 29.8 | | | — | | | — | | | — | | | 29.8 | |
| Contingent consideration adjustment | — | | | — | | | 4.7 | | | 11.2 | | | 15.9 | |
Unrealized gains on investment
securities | — | | | — | | | — | | | (43.5) | | | (43.5) | |
| Other | 2.5 | | | 0.4 | | | (1.3) | | | (0.1) | | | 1.5 | |
| Total addbacks/(deductions) | 39.8 | | | 5.5 | | | 7.1 | | | (29.0) | | | 23.4 | |
| Adjusted EBITDA | $ | 80.0 | | | $ | 139.2 | | | $ | 67.5 | | | $ | 123.2 | | | $ | 409.9 | |
Results of Operations
KAR Results
| | | | | | | | | | | |
| | Three Months Ended March 31, |
| (Dollars in millions except per share amounts) | 2021 | | 2020 |
| Revenues | | | |
| Auction fees | $ | 235.5 | | | $ | 255.3 | |
| Service revenue | 187.6 | | | 236.2 | |
| Purchased vehicle sales | 92.7 | | | 75.5 | |
| Finance-related revenue | 65.8 | | | 78.5 | |
| Total revenues | 581.6 | | | 645.5 | |
| Cost of services* | 330.4 | | | 394.6 | |
| Gross profit* | 251.2 | | | 250.9 | |
| Selling, general and administrative | 149.0 | | | 162.4 | |
| Depreciation and amortization | 47.0 | | | 47.7 | |
| Operating profit | 55.2 | | | 40.8 | |
| Interest expense | 30.9 | | | 38.0 | |
| Other income, net | (50.2) | | | (2.0) | |
| Income before income taxes | 74.5 | | | 4.8 | |
| Income taxes | 23.6 | | | 2.0 | |
| Net income | $ | 50.9 | | | $ | 2.8 | |
| Net income per share | | | |
| Basic | $ | 0.25 | | | $ | 0.02 | |
| Diluted | $ | 0.25 | | | $ | 0.02 | |
* Exclusive of depreciation and amortization
Overview of KAR Results for the Three Months Ended March 31, 2021 and 2020
Overview
For the three months ended March 31, 2021, we had revenue of $581.6 million compared with revenue of $645.5 million for the three months ended March 31, 2020, a decrease of 10%. Businesses acquired in 2020 accounted for an increase in revenue of $25.2 million or 4% of revenue. For a further discussion of revenues, gross profit and selling, general and administrative expenses, see the segment results discussions below.
Depreciation and Amortization
Depreciation and amortization decreased $0.7 million, or 1%, to $47.0 million for the three months ended March 31, 2021, compared with $47.7 million for the three months ended March 31, 2020. The decrease in depreciation and amortization was primarily the result of a reduction in assets placed in service, resulting from a reduction in capital spending.
Interest Expense
Interest expense decreased $7.1 million, or 19%, to $30.9 million for the three months ended March 31, 2021, compared with $38.0 million for the three months ended March 31, 2020. The decrease was primarily attributable to a decrease in the weighted average interest rate of approximately 1% and a decrease of $9.5 million in the average outstanding balance of corporate debt for the three months ended March 31, 2021, compared with the three months ended March 31, 2020. In addition, there was a decrease in interest expense at AFC of $4.3 million, which resulted from a decrease in the average finance receivables balance for the three months March 31, 2021, as compared with the three months ended March 31, 2020.
Other Income, Net
The Company invests in certain early-stage automotive companies and funds that relate to the automotive industry. We believe these investments have resulted in the expansion of relationships in the vehicle remarketing industry. Realized gains on these investments were $17.0 million for the three months ended March 31, 2021. The Company had unrealized gains of $43.5 million at March 31, 2021, as a result of a recent public offering for one of these investment securities. Any future changes in the fair value of these investment securities will be reflected as unrealized gains or losses until these securities are sold.
For the three months ended March 31, 2021, we had other income of $50.2 million compared with $2.0 million for the three months ended March 31, 2020. The increase in other income was primarily attributable to an increase in realized and unrealized gains on investment securities of approximately $60.5 million and other miscellaneous items aggregating $0.7 million, partially offset by an increase in contingent consideration valuation of $11.2 million and an increase in foreign currency losses of $1.8 million.
Income Taxes
We had an effective tax rate of 31.7% for the three months ended March 31, 2021, compared with an effective tax rate of 41.7% for the three months ended March 31, 2020. The effective tax rate for the three months ended March 31, 2021 was unfavorably impacted by the expense for the increase in the estimated value of contingent consideration for which no tax benefits have been recorded. The decrease in the effective tax rate was primarily attributable to lower pretax earnings for the three months ended March 31, 2020. Our effective tax rate for the three months ended March 31, 2020 was calculated using the discrete-period computation method by applying the actual effective tax rate as of March 31, 2020 to our pre-tax income.
Impact of Foreign Currency
For the three months ended March 31, 2021, fluctuations in the European exchange rate increased revenue by $5.6 million, increased operating profit by $0.2 million, decreased net income by $0.3 million and had no impact on net income per diluted share. For the three months ended March 31, 2021, fluctuations in the Canadian exchange rate increased revenue by $3.8 million, operating profit by $1.2 million, net income by $0.3 million and had no impact on net income per diluted share.
Impact of COVID-19 on Our Operations
The Company has been subject to numerous orders and directives that have impacted our ability to operate our business throughout North America and in Europe. As a result of these COVID-19 related restrictions on our operations, we have adjusted our business processes so that we can continue to meet the needs of our customers while complying with the various laws, regulations, mandates and directives in each of the markets in which we operate. In many cases, we have had to limit the number of employees and customers at our physical locations at any given time and modify the delivery of services to our customers. However, these adjustments in our operations have also resulted in improvements in our performance.
During this challenging time, the Company has worked to meet the needs of the wholesale used car marketplace with its technology-based auction platforms throughout North America and in Europe. The Company believes that certain changes to its business processes that were necessitated by the COVID-19 outbreak are sustainable going forward. For example, the Company has reduced the labor required to process wholesale auction transactions and reduced its selling, general and administrative expenses.
ADESA Results
| | | | | | | | | | | |
| Three Months Ended
March 31, |
| (Dollars in millions, except per vehicle amounts) | 2021 | | 2020 |
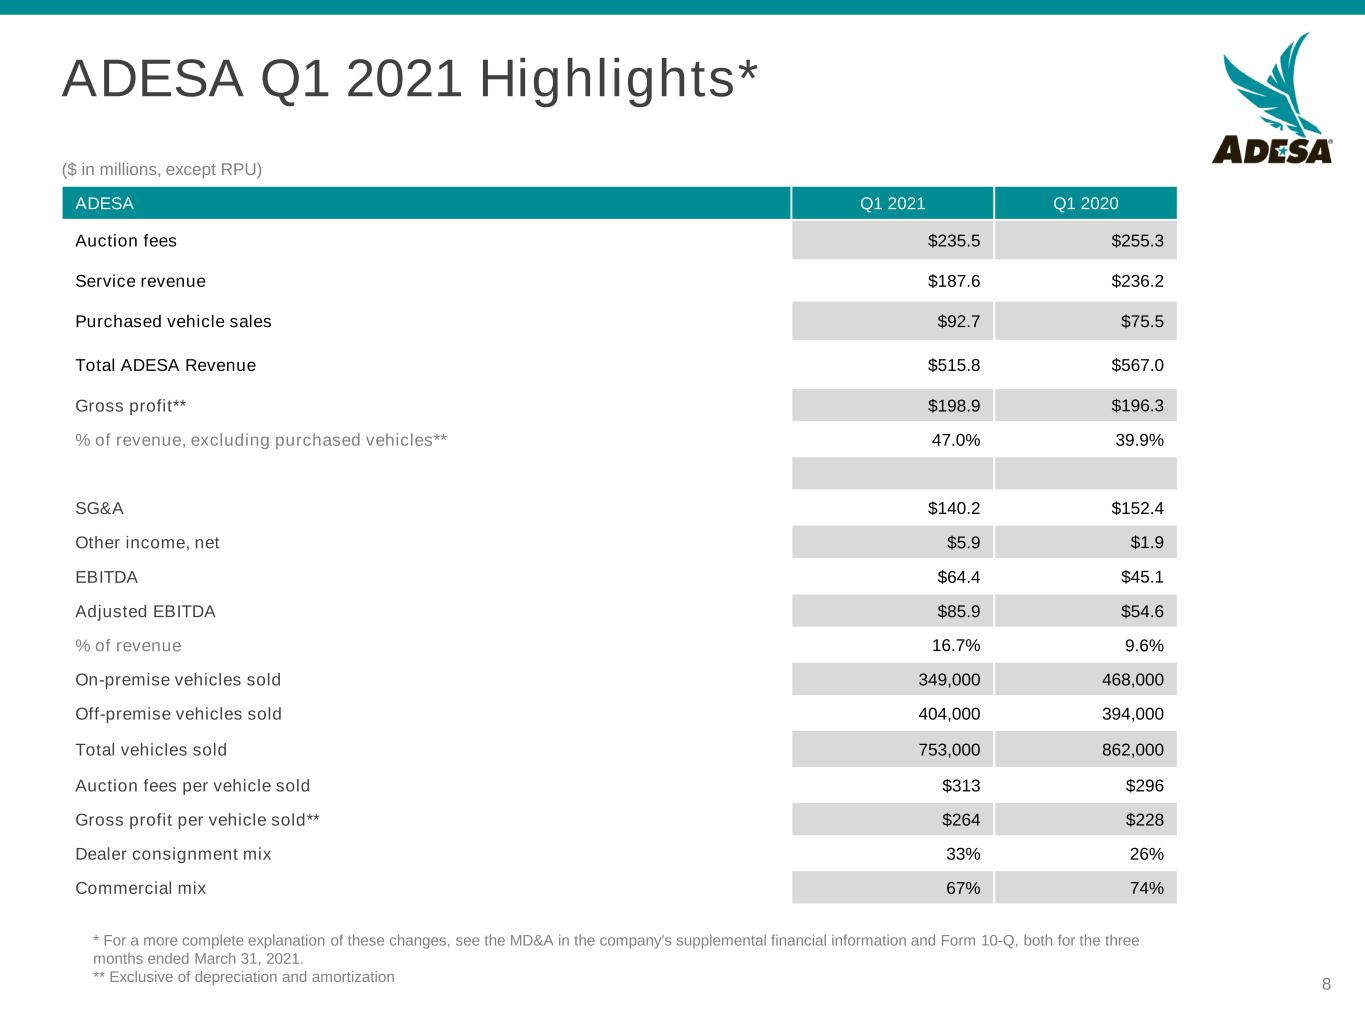
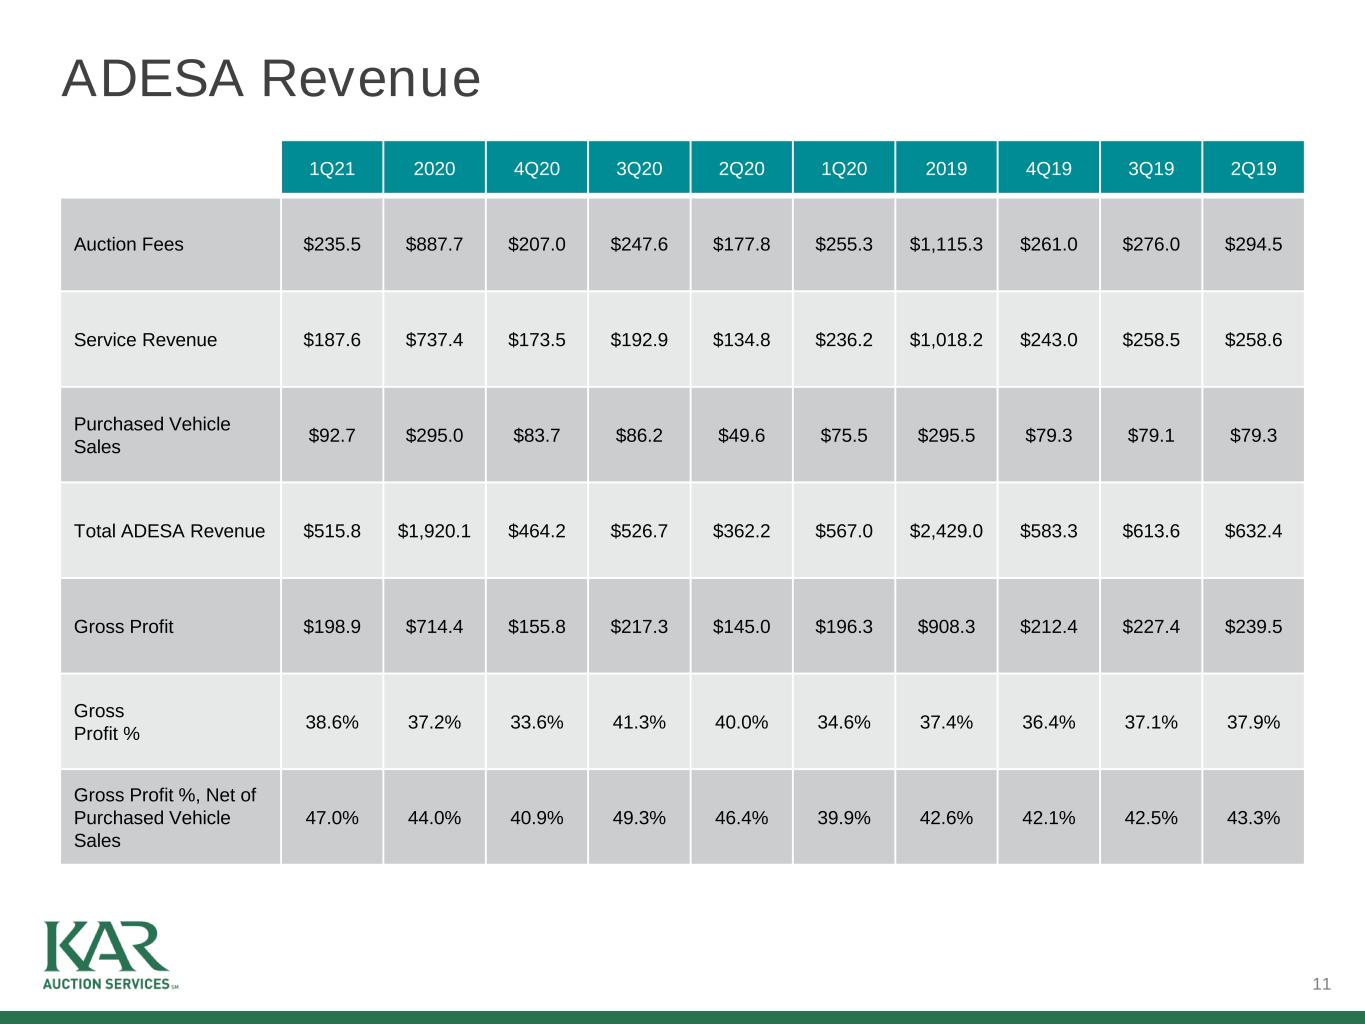
| Auction fees | $ | 235.5 | | | $ | 255.3 | |
| Service revenue | 187.6 | | | 236.2 | |
| Purchased vehicle sales | 92.7 | | | 75.5 | |
| Total ADESA revenue | 515.8 | | | 567.0 | |
| Cost of services* | 316.9 | | | 370.7 | |
| Gross profit* | 198.9 | | | 196.3 | |
| Selling, general and administrative | 140.2 | | | 152.4 | |
| Depreciation and amortization | 44.6 | | | 44.4 | |
| Operating profit (loss) | $ | 14.1 | | | $ | (0.5) | |
| | | |
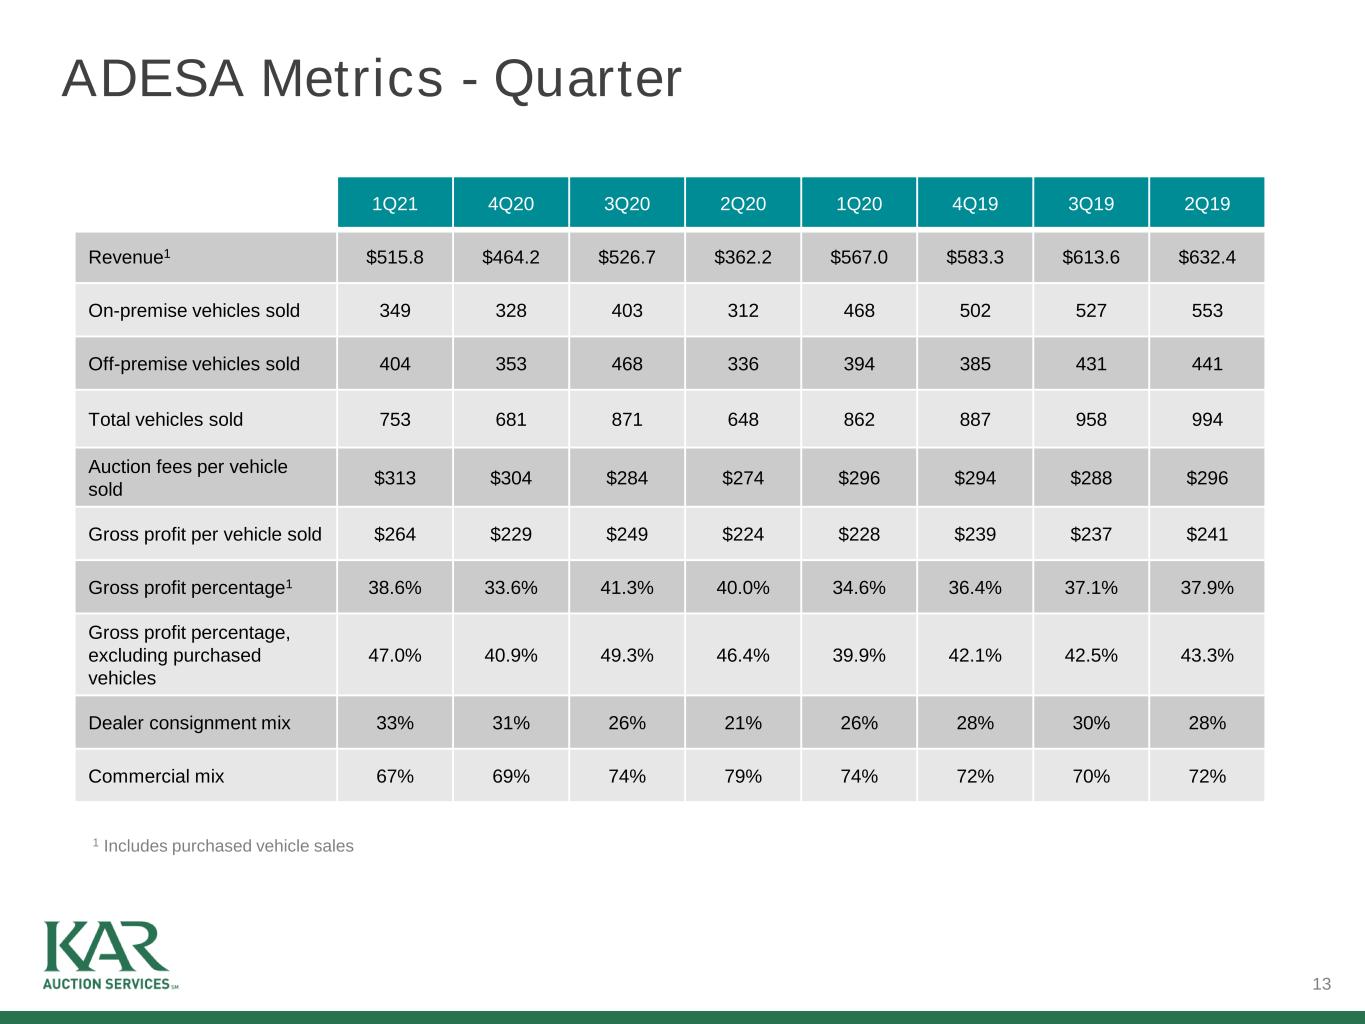
| On-premise vehicles sold | 349,000 | | | 468,000 |
| Off-premise vehicles sold | 404,000 | | 394,000 |
| Total vehicles sold | 753,000 | | 862,000 |
| Auction fees per vehicle sold | $ | 313 | | | $ | 296 | |
| Gross profit per vehicle sold* | $ | 264 | | | $ | 228 | |
| Gross profit percentage, excluding purchased vehicles* | 47.0% | | 39.9% |
| Dealer consignment mix | 33% | | 26% |
| Commercial mix | 67% | | 74% |
* Exclusive of depreciation and amortization
Overview of ADESA Results for the Three Months Ended March 31, 2021 and 2020
Revenue
Revenue from ADESA decreased $51.2 million, or 9%, to $515.8 million for the three months ended March 31, 2021, compared with $567.0 million for the three months ended March 31, 2020. The decrease in revenue was the result of a decrease in the number of vehicles sold, partially offset by an increase in average revenue per vehicle sold. Businesses acquired in 2020 accounted for an increase in revenue of $25.2 million. The change in revenue included the impact of an increase in revenue of $5.6 million due to fluctuations in the European exchange rate and an increase of $3.5 million due to fluctuations in the Canadian exchange rate.
On-premise marketplace sales are initiated online for vehicles at one of our locations across North America and include Simulcast, Simulcast+ and DealerBlock sales. Off-premise marketplace sales are initiated online and include Openlane, TradeRev, BacklotCars and ADESA Europe sales. The 13% decrease in the number of vehicles sold was comprised of a 25% decrease in on-premise vehicles sold and a 3% increase in off-premise vehicles sold. For the quarter ended March 31, 2021, we conducted all sales through digital marketplaces to protect the health and well-being of our workforce and customers. All vehicles were offered online, cars were not driven through the auction lanes and we limited access to our physical locations to promote social distancing measures and help prevent the spread of COVID-19.
Auction fees per vehicle sold for the three months ended March 31, 2021 increased $17, or 6%, primarily as a result of revenues related to higher vehicle values.
Service revenue for the three months ended March 31, 2021 decreased $48.6 million, or 21%, primarily as a result of the decrease in vehicles sold. Typically consigned vehicles located at our facilities utilize our service offerings at a higher rate than off-premise vehicles.
Gross Profit
For the three months ended March 31, 2021, gross profit for ADESA increased $2.6 million, or 1%, to $198.9 million, compared with $196.3 million for the three months ended March 31, 2020. Gross profit for ADESA was 38.6% of revenue for the three months ended March 31, 2021, compared with 34.6% of revenue for the three months ended March 31, 2020. Gross profit as a percentage of revenue increased for the three months ended March 31, 2021 as compared with the three months ended March 31, 2020, as we have taken measures to reduce expenses to help protect our business while our operations have been impacted by COVID-19 and vehicles sold online require less labor. In the first quarter of 2021 we also recorded a benefit of $2.2 million taken under the Canada Emergency Wage Subsidy. On March 20, 2020 our on-premise auctions were shut down in response to the COVID-19 pandemic. While revenue decreased during the closure, cost of services remained consistent, as all non-essential auction employees were paid during the closure. In addition, our gross profit as a percentage of revenue is impacted by purchased vehicles. Excluding purchased vehicle sales, gross profit as a percentage of revenue was 47.0% and 39.9% for the three months ended March 31, 2021 and 2020, respectively. The entire selling and purchase price of the vehicle is recorded as revenue and cost of services for purchased vehicles sold. Businesses acquired in the last 12 months accounted for an increase in cost of services of $13.8 million for the three months ended March 31, 2021.
Selling, General and Administrative
Selling, general and administrative expenses for the ADESA segment decreased $12.2 million, or 8%, to $140.2 million for the three months ended March 31, 2021, compared with $152.4 million for the three months ended March 31, 2020, primarily due to decreases in compensation expense of $21.4 million, professional fees of $3.6 million, marketing costs of $3.4 million, travel expenses of $2.8 million, supplies expense of $2.0 million, telecom expenses of $2.0 million, medical expenses of $1.8 million, severance of $1.7 million, bad debt expense of $1.5 million and the recording of a benefit under the Canada Emergency Wage Subsidy of $1.2 million, partially offset by selling, general and administrative expenses associated with acquisitions of $19.0 million, an increase in incentive-based compensation of $8.9 million and other miscellaneous expenses aggregating $1.3 million.
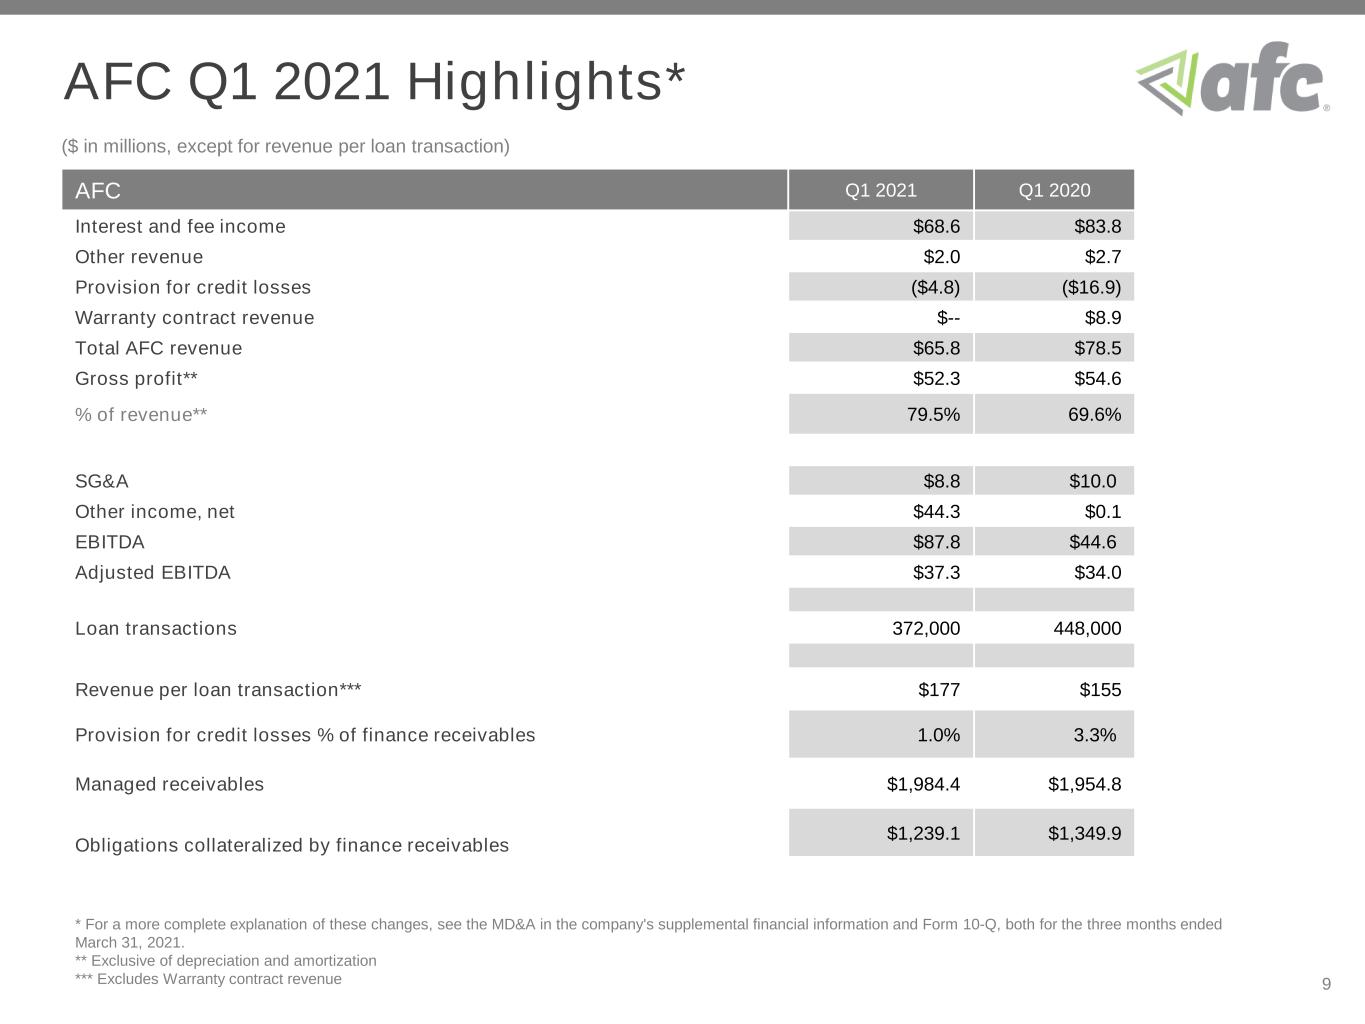
AFC Results
| | | | | | | | | | | |
| Three Months Ended
March 31, |
| (Dollars in millions except volumes and per loan amounts) | 2021 | | 2020 |
| Finance-related revenue | | | |
| Interest and fee income | $ | 68.6 | | | $ | 83.8 | |
| Other revenue | 2.0 | | | 2.7 | |
| Provision for credit losses | (4.8) | | | (16.9) | |
| Warranty contract revenue | — | | | 8.9 | |
| Total AFC revenue | 65.8 | | | 78.5 | |
| Cost of services* | 13.5 | | | 23.9 | |
| Gross profit* | 52.3 | | | 54.6 | |
| Selling, general and administrative | 8.8 | | | 10.0 | |
| Depreciation and amortization | 2.4 | | | 3.3 | |
| Operating profit | $ | 41.1 | | | $ | 41.3 | |
| | | |
| Loan transactions | 372,000 | | 448,000 |
| Revenue per loan transaction, excluding Warranty contract revenue | $ | 177 | | | $ | 155 | |
* Exclusive of depreciation and amortization
Overview of AFC Results for the Three Months Ended March 31, 2021 and 2020
Revenue
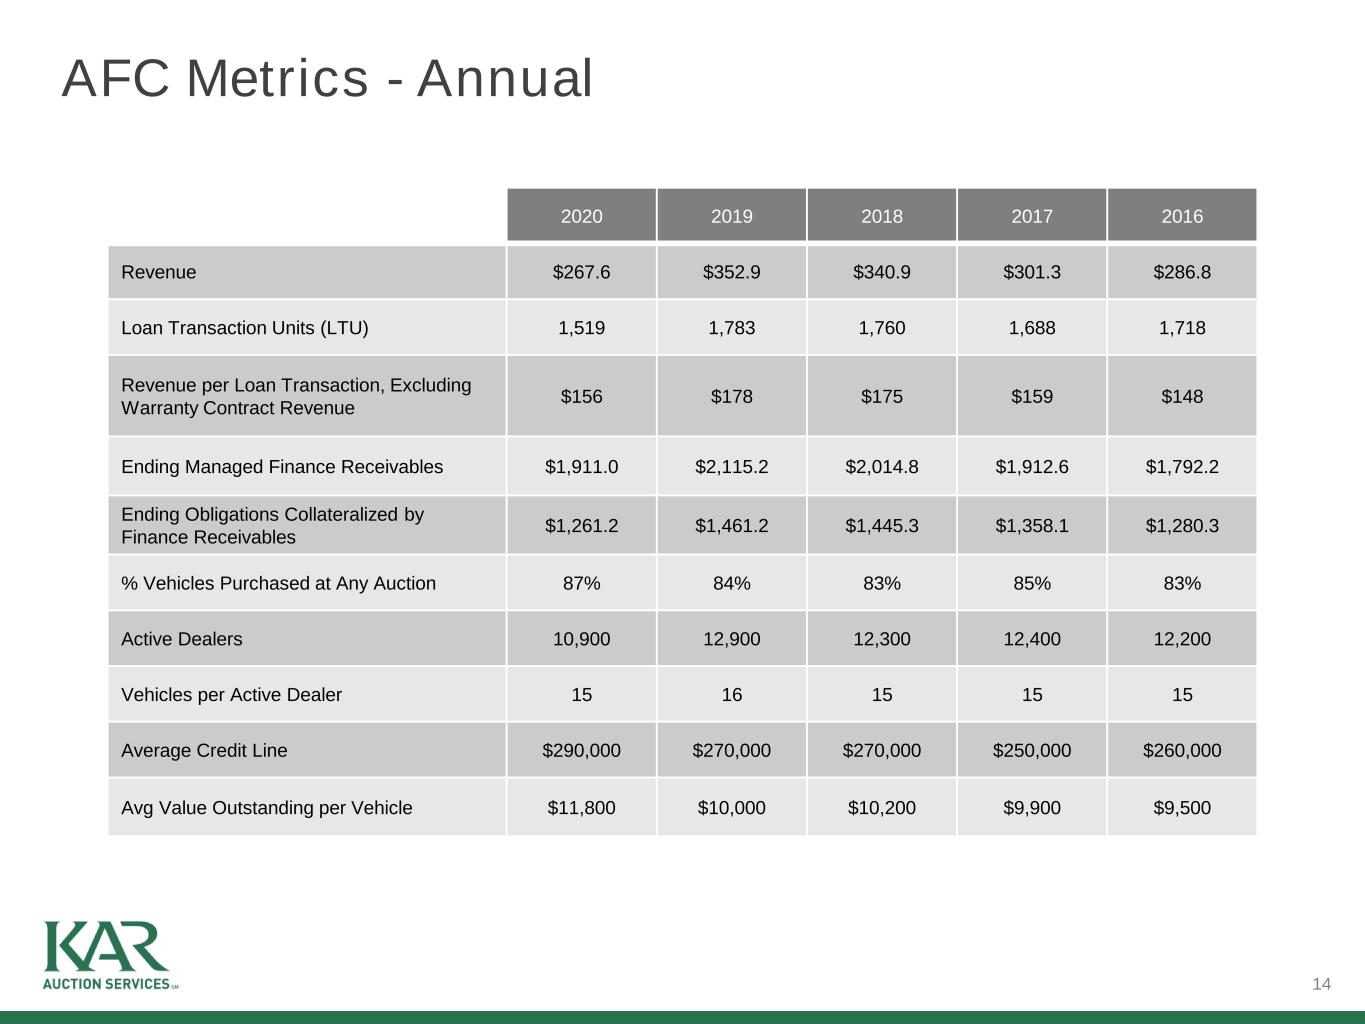
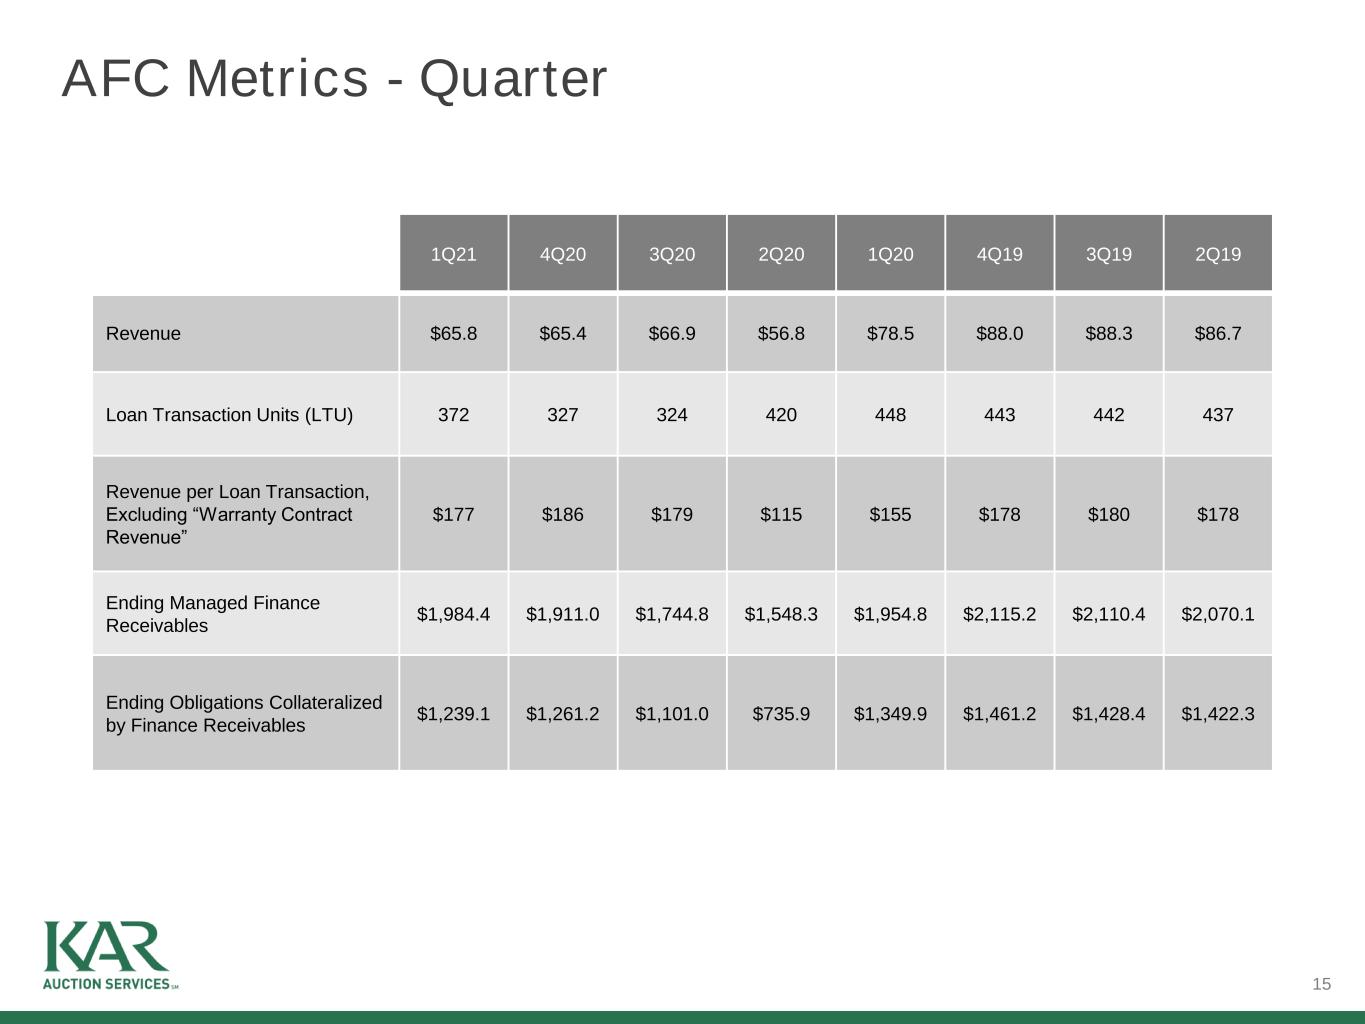
For the three months ended March 31, 2021, AFC revenue decreased $12.7 million, or 16%, to $65.8 million, compared with $78.5 million for the three months ended March 31, 2020. The decrease in revenue was primarily the result of a 17% decrease in loan transactions and the loss of Warranty contract revenue resulting from the sale of PWI in December 2020, partially offset by a 14% increase in revenue per loan transaction.
Revenue per loan transaction, which includes both loans floorplanned and loans curtailed, increased $22, or 14%, primarily as a result of a decrease in provision for credit losses for the three months ended March 31, 2021 and an increase in loan values, partially offset by decreases in interest yield and average portfolio duration. Revenue per loan transaction excludes Warranty contract revenue.
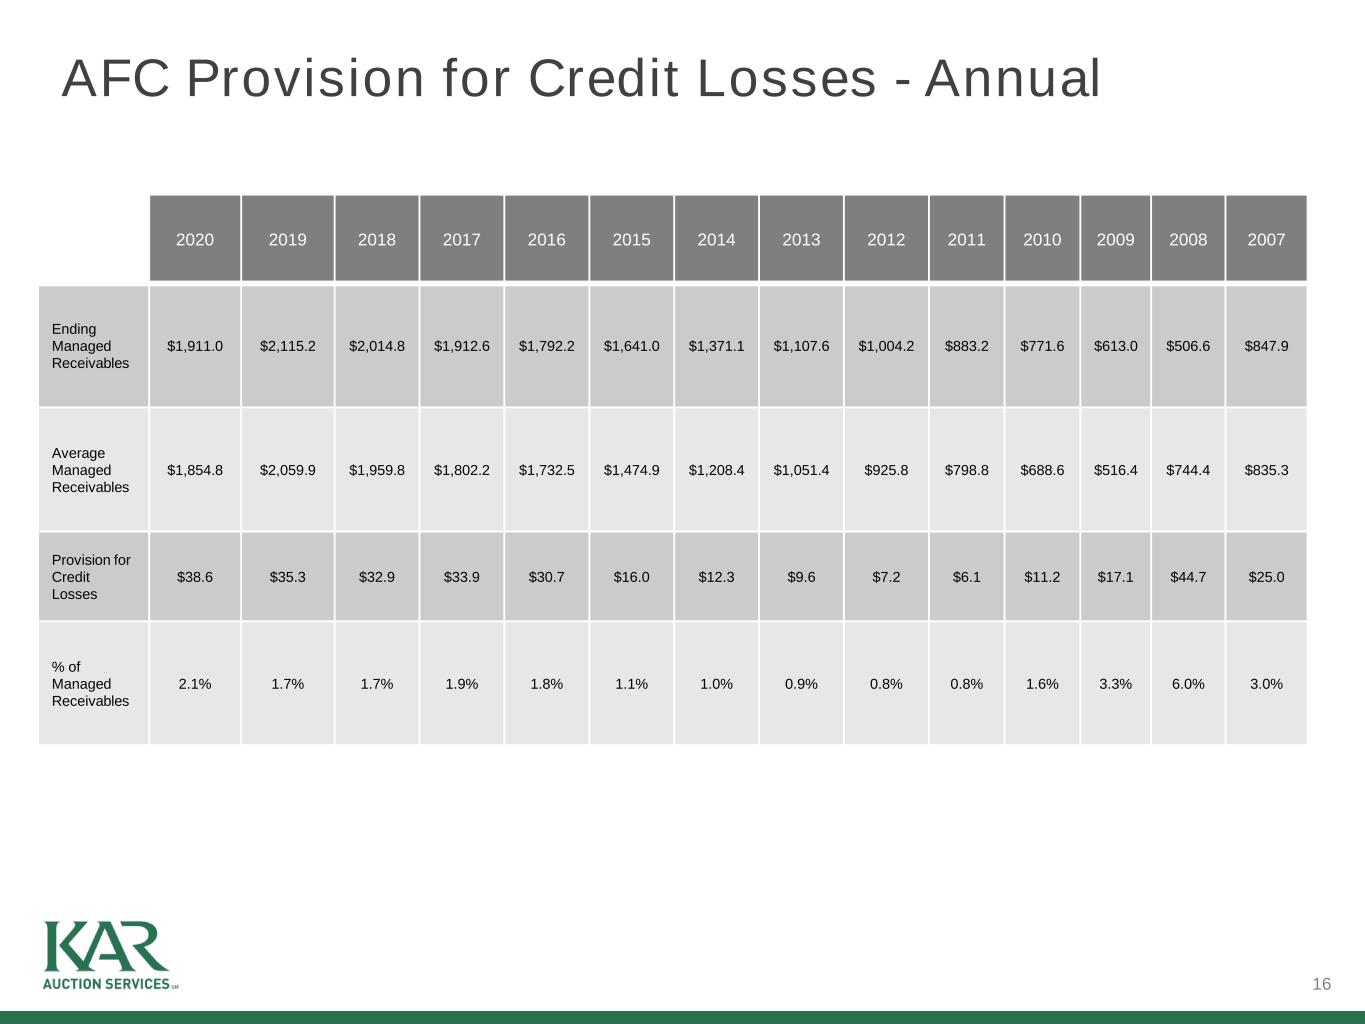
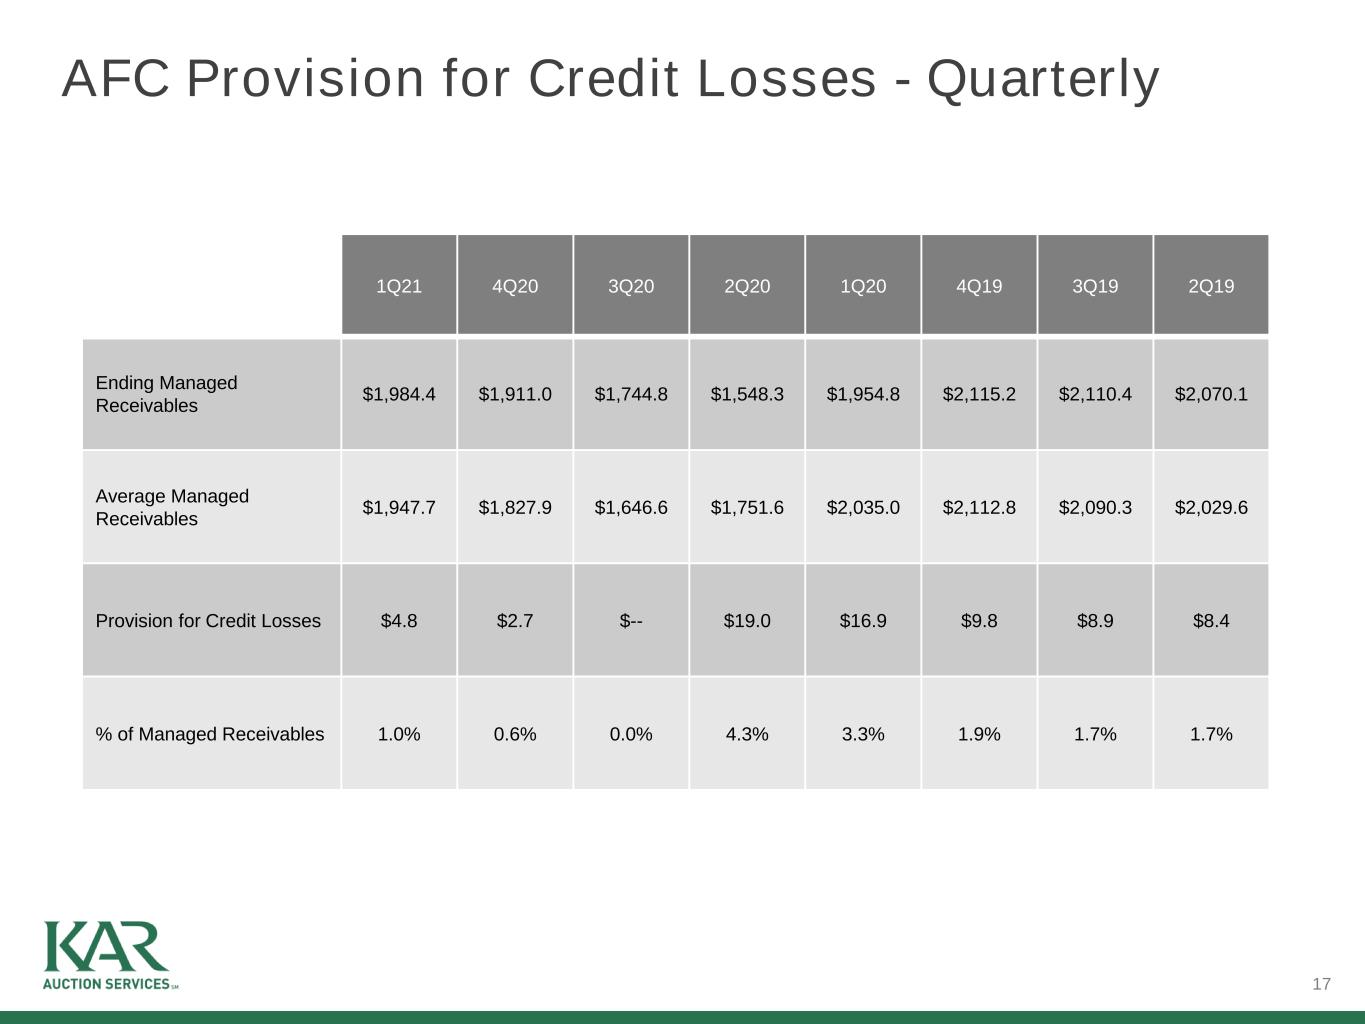
The provision for credit losses decreased to 1.0% of the average managed receivables for the three months ended March 31, 2021 from 3.3% for the three months ended March 31, 2020.
Gross Profit
For the three months ended March 31, 2021, gross profit for the AFC segment decreased $2.3 million, or 4%, to $52.3 million, or 79.5% of revenue, compared with $54.6 million, or 69.6% of revenue, for the three months ended March 31, 2020. Excluding PWI for the three months ended March 31, 2020, AFC's gross profit as a percent of revenue was 75.5%. The increase in gross profit as a percent of revenue was primarily the result of a 16% decrease in revenue and an 44% decrease in cost of services. The decrease in cost of services was primarily the result of decreases in PWI expenses of $6.9 million, compensation expense of $2.6 million, lot audits of $0.8 million and other miscellaneous expenses aggregating $0.1 million.
Selling, General and Administrative
Selling, general and administrative expenses at AFC decreased $1.2 million, or 12%, to $8.8 million for the three months ended March 31, 2021, compared with $10.0 million for the three months ended March 31, 2020 primarily as a result of decreases in PWI expenses of $0.8 million, compensation expense of $0.5 million and other miscellaneous expenses aggregating $0.8 million, partially offset by an increase in incentive-based compensation of $0.9 million.
LIQUIDITY AND CAPITAL RESOURCES
We believe that the significant indicators of liquidity for our business are cash on hand, cash flow from operations, working capital and amounts available under our Credit Facility. Our principal sources of liquidity consist of cash generated by operations and borrowings under our Revolving Credit Facility.
| | | | | | | | | | | | | | | | | |
| March 31, 2021 | | December 31, 2020 | | March 31, 2020 |
| (Dollars in millions) | | |
| Cash and cash equivalents | $ | 759.0 | | | $ | 752.1 | | | $ | 293.1 | |
| Restricted cash | 52.5 | | 60.2 | | 114.4 | |
| Working capital | 869.5 | | 924.6 | | 694.1 | |
| Amounts available under the Revolving Credit Facility* | 325.0 | | 325.0 | | 325.0 | |
| Cash flow from operations for the three months ended | 164.5 | | | | (49.2) | |
* There were related outstanding letters of credit totaling approximately $29.8 million, $28.5 million and $29.7 million at March 31, 2021, December 31, 2020 and March 31, 2020, respectively, which reduced the amount available for borrowings under the Revolving Credit Facility.
We regularly evaluate alternatives for our capital structure and liquidity given our expected cash flows, growth and operating capital requirements as well as capital market conditions. The COVID-19 pandemic has had, and is continuing to have, an adverse impact on our business. As a result, we have implemented several measures that we believe will enhance liquidity for the foreseeable future. Some of these measures included furloughs, prohibiting non-essential business travel, suspending non-essential services provided by certain third parties at our locations, delaying or canceling capital projects at our on-premise marketplace locations and temporarily suspending the Company's quarterly dividend.
We have also taken advantage of legislation introduced to assist companies during this time. In the first quarter of 2021, we recorded a total of approximately $3.4 million claimed under the Canada Emergency Wage Subsidy. These credits partially offset salaries recorded in Canada. We will continue to monitor and assess the impact the CARES Act and similar legislation in other countries may have on our business and financial results. As the impact of the COVID-19 pandemic on the economy and our operations evolves, we will continue to assess our liquidity needs. A continued disruption could materially affect our liquidity.
Summary of Cash Flows
| | | | | | | | | | | |
| Three Months Ended
March 31, |
| (Dollars in millions) | 2021 | | 2020 |
| Net cash provided by (used by): | | | |
| Operating activities | $ | 164.5 | | | $ | (49.2) | |
| Investing activities | (79.2) | | | 116.7 | |
| Financing activities | (88.7) | | | (197.2) | |
| Effect of exchange rate on cash | 2.6 | | | (23.7) | |
| Net decrease in cash, cash equivalents and restricted cash | $ | (0.8) | | | $ | (153.4) | |
Cash flow provided by operating activities was $164.5 million for the three months ended March 31, 2021, compared with cash flow used by operating activities of $49.2 million for the three months ended March 31, 2020. The increase in operating cash flow was primarily attributable to changes in operating assets and liabilities as a result of the timing of collections and the disbursement of funds to consignors for auctions held near period-ends, as well as increased profitability, partially offset by a net decrease in non-cash item adjustments. We had reduced operations beginning March 20, 2020, resulting from COVID-19 restrictions on our business.
Net cash used by investing activities was $79.2 million for the three months ended March 31, 2021, compared with net cash provided by investing activities of $116.7 million for the three months ended March 31, 2020. The increase in net cash used by investing activities was primarily attributable to:
•an increase in the additional finance receivables held for investment of approximately $219.6 million; and
•an increase in investment in securities of approximately $15.3 million;
partially offset by:
•proceeds from sale of investments of approximately $21.1 million; and
•a reduction in capital expenditures of approximately $15.1 million.
Net cash used by financing activities was $88.7 million for the three months ended March 31, 2021, compared with $197.2 million for the three months ended March 31, 2020. The decrease in net cash used by financing activities was primarily attributable to:
•a smaller reduction in the obligations collateralized by finance receivables of approximately $78.6 million;
•a net increase in book overdrafts for the three months ended March 31, 2021 compared with a net decrease in book overdrafts for the three months ended March 31, 2020, resulting in a change of approximately $74.9 million; and
•a decrease in dividends paid to stockholders of approximately $24.5 million;
partially offset by:
•an increase in the repurchase of common stock of approximately $80.8 million.
FOR IMMEDIATE RELEASE
KAR Global Bolsters Digital Marketplaces With Acquisition of Auction Frontier
Velocicast® Technology Fortifies Simulcast Capabilities and Enhances Customer Experience
CARMEL, Ind. – May 4, 2021 – KAR Auction Services, Inc. d/b/a KAR Global (NYSE: KAR), a leading operator of digital marketplaces for wholesale used vehicles, announces the acquisition of Auction Frontier, the pioneer of industry-leading, cloud-based auction simulcast solution Velocicast®. The acquisition reflects the importance of KAR’s ADESA Simulcast and Simulcast+ technologies—both of which are powered by Velocicast—and will accelerate future simulcast innovations to enhance marketplace speed, convenience and real-time analytics for customers.
“For over a decade, KAR has led the digital transformation of the remarketing industry, deploying powerful technologies that provide our customers with the smartest, fastest and most intuitive marketplaces for selling and sourcing inventory,” said Peter Kelly, CEO of KAR Global. “Auction Frontier has rapidly grown Velocicast to become the industry gold standard for simulcast, and we are thrilled to welcome their incredibly talented team to our organization. We have already demonstrated the power of this partnership by jointly developing ADESA Simulcast+ in 2020, the industry’s only fully-automated live-auction platform. And we look forward to supercharging the next generation of digital auction technology for our combined customers.”
Auction Frontier’s Velocicast platform powers digital simulcast sales for more than 300 wholesale and retail auctions across North America and Australia. The technology offers an easy-to-use simulcast interface that enables both sellers and buyers to quickly and efficiently make bidding, buying and selling decisions. Enhanced displays provide instant access to detailed condition reports, photos and valuation tools for vehicles across all sale lanes—meaning dealers can research vehicles, record notes to the vehicle details page and make bidding and buying decisions all through one seamlessly integrated interface. Sellers can monitor bidding activity across all lanes throughout a sale, conveniently rep vehicles, and view enhanced analytics that enable consignors to more confidently adapt sale strategy to real-time market dynamics.
“We’re thrilled to join the KAR Global family, and look forward to bringing even greater value to our customers through expanded capabilities, integrations and functionality on our Velocicast platform,” said Scott Blatter, president of Auction Frontier. “Since inception, our focus at Auction
Frontier has been on building a simulcast ‘done right’ solution—giving buyers and sellers everything they need to be successful right at their fingertips. And now, backed by the full power of KAR’s diverse portfolio of marketplace technologies, services and solutions, we’ll be able to rapidly accelerate future innovation.”
KAR first partnered with Auction Frontier in 2016, launching ADESA Simulcast in 2019. Auction Frontier was founded in 2015.
###
| | | | | |
| KAR Contacts: | |
Media Inquiries: | Analyst Inquiries: |
| Jill Trudeau | Mike Eliason |
| (317) 796-0945 | (317) 249-4559 |
| |
About KAR
KAR Auction Services, Inc. d/b/a KAR Global (NYSE: KAR), provides sellers and buyers across the global wholesale used vehicle industry with innovative, technology-driven remarketing solutions. KAR Global’s unique end-to-end platform supports whole car, financing, logistics and other ancillary and related services, including the sale of nearly 3.1 million units valued at over $40 billion through our auctions in 2020. Our integrated physical, online and mobile marketplaces reduce risk, improve transparency and streamline transactions for customers in about 75 countries. Headquartered in Carmel, Indiana, KAR Global has employees across the United States, Canada, Mexico, Uruguay, U.K. and Europe. For more information and the latest KAR Global news, go to www.karglobal.com and follow us on Twitter @KARspeaks.