I
United States
Securities And Exchange Commission
Washington, D.C. 20549
FORM
Current Report
Pursuant to Section 13 or 15(d) of the Securities Exchange Act of 1934
Date of Report (Date of earliest event reported):

(Exact as specified in its charter)
(State or other jurisdiction of incorporation) | (Commission File Number) | (I.R.S. Employer Identification No.) |
(Address of principal executive offices) (Zip code)
(
(Registrant’s telephone number, including area code)
N/A
(Former name or former address, if changed since last report)
Check the appropriate box below if the Form 8-K filing is intended to simultaneously satisfy the filing obligation of the registrant under any of the following provisions (see General Instruction A.2. below):
Indicate by check mark whether the registrant is an emerging growth company as defined in Rule 405 under the Securities Act (17 CFR 230.405) or Rule 12b-2 under the Exchange Act (17 CFR 240.12b-2).
Emerging growth company
If an emerging growth company, indicate by check mark if the registrant has elected not to use the extended transition period for complying with any new or revised financial accounting standards provided pursuant to Section 13(a) of the Exchange Act. ☐
Securities registered pursuant to Section 12(b) of the Act:
Title of each class | Trading Symbol(s) | Name of each exchange on which registered |
Item 2.02 Results of Operations and Financial Condition
On October 21, 2020, Old Second Bancorp, Inc. (the “Company’s”) issued a press release announcing its financial results for the third quarter ended September 30, 2020, along with certain other financial information. Copies of the Company’s press release and loan portfolio disclosures are attached as Exhibit 99.1 and 99.2, respectively.
Item 8.01 Other Events.
On October 20, 2020, the Company received a notice of non-objection from the Federal Reserve Bank of Chicago (the “Federal Reserve”) to extend its previously-announced stock repurchase program, which expired on September 19, 2020, and originally authorized the Company to repurchase up to 1,494,826 shares of the Company’s common stock (the “Repurchase Program”). As of October 20, 2020, 898,415 shares remained available to be repurchased under the Repurchase Program. Repurchases by the Company under the Repurchase Program may be made from time to time through open market purchases, trading plans established in accordance with U.S. Securities and Exchange Commission rules, privately negotiated transactions, or by other means.
The actual means and timing of any repurchases, quantity of purchased shares and prices will be, subject to certain limitations, at the discretion of management and will depend on a number of factors, including, without limitation, market prices of the Company’s common stock, general market and economic conditions, and applicable legal and regulatory requirements. Repurchases under the Repurchase Program may be initiated, discontinued, suspended or restarted at any time; provided that repurchases under the Repurchase Program after October 20, 2021 would require Federal Reserve non-objection or approval. The Company is not obligated to repurchase any shares under the Repurchase Program.
Item 9.01 Financial Statements and Exhibits
(d) Exhibits
99.1 Press release dated October 21, 2020
99.2 Loan Portfolio Disclosures for Old Second Bancorp, Inc. dated September 30, 2020
3
Signature
Pursuant to the requirements of the Securities Exchange Act of 1934, the Registrant has duly caused this report to be signed on its behalf by the undersigned hereunto duly authorized.
OLD SECOND BANCORP, INC. | ||
Dated: October 21, 2020 | By: | /s/ Bradley S. Adams |
Bradley S. Adams | ||
Executive Vice President and | ||
Chief Financial Officer | ||
4


| | |
(NASDAQ:OSBC) | Exhibit 99.1 | |
| | |
Contact: | Bradley S. Adams | For Immediate Release |
| Chief Financial Officer | October 21, 2020 |
| (630) 906-5484 | |
Old Second Reports Third Quarter Net Income of $10.3 million, or $0.34 per Diluted Share
AURORA, IL, October 21, 2020 – Old Second Bancorp, Inc. (the “Company,” “we,” “us,” and “our”) (NASDAQ: OSBC), the parent company of Old Second National Bank (the “Bank”), today announced financial results for the third quarter of 2020. Our net income was $10.3 million, or $0.34 per diluted share, for the third quarter of 2020, compared to net income of $9.2 million, or $0.31 per diluted share, for the second quarter of 2020, and net income of $12.2 million, or $0.40 per diluted share, for the third quarter of 2019. Net income for the third quarter of 2020 reflects a reduction in net interest income year over year due to changes in economic conditions and market interest rates related to the COVID-19 pandemic, and a reduction in service charges on deposits due to a decline in customer spending. Partially offsetting this reduction to third quarter net income year over year was a $0.10 per diluted share impact of growth in mortgage banking income due to an increase in mortgage originations and refinances stemming from the low interest rate environment.
Operating Results
1
| ● | Noninterest expense was $20.3 million for the third quarter of 2020, an increase of $1.4 million, or 7.3%, compared to $18.9 million for the second quarter of 2020, and an increase of $312,000, or 1.6%, from $20.0 million for the third quarter of 2019. The increase compared to the linked quarter was primarily attributable to growth in salaries and employee benefits related to deferrals recorded in the second quarter of 2020 on the SBA Paycheck Protection Program (“PPP”) loan origination costs. The increase compared to the year over year period was also primarily attributable to salaries and employee benefits largely resulting from growth in full time equivalent employees, increases in employee insurance costs, and annual employee merit increases in early 2020. |
| ● | The provision for income taxes expense was $3.4 million for the third quarter of 2020, compared to provision expense of $3.1 million for the second quarter of 2020, and $4.0 million of provision expense for the third quarter of 2019. The increase in tax expense for the linked quarter was due to an increase of $1.3 million in pretax income compared to the second quarter of 2020, and the decrease in tax expense for the year over year period was due to the reduction in pretax income of $2.6 million. |
| ● | During the third quarter of 2020, we repurchased 137,756 shares of our common stock at a weighted average price of $8.34 per share pursuant to our stock repurchase program. |
| ● | On October 19, 2020, our Board of Directors declared a cash dividend of $0.01 per share payable on November 9, 2020, to stockholders of record as of October 30, 2020. |
COVID-19 Operational Update
During this unprecedented time, the health and safety of our customers and employees remain our top priority.
| ● | We established client assistance programs, including offering commercial, consumer, and mortgage loan payment deferrals for certain clients. We also suspended late fees for consumer loans through June 30, 2020, and, although consumer late fees have been reinstated, we will continue to re-evaluate late fee assessments based on the ongoing COVID-19 pandemic. |
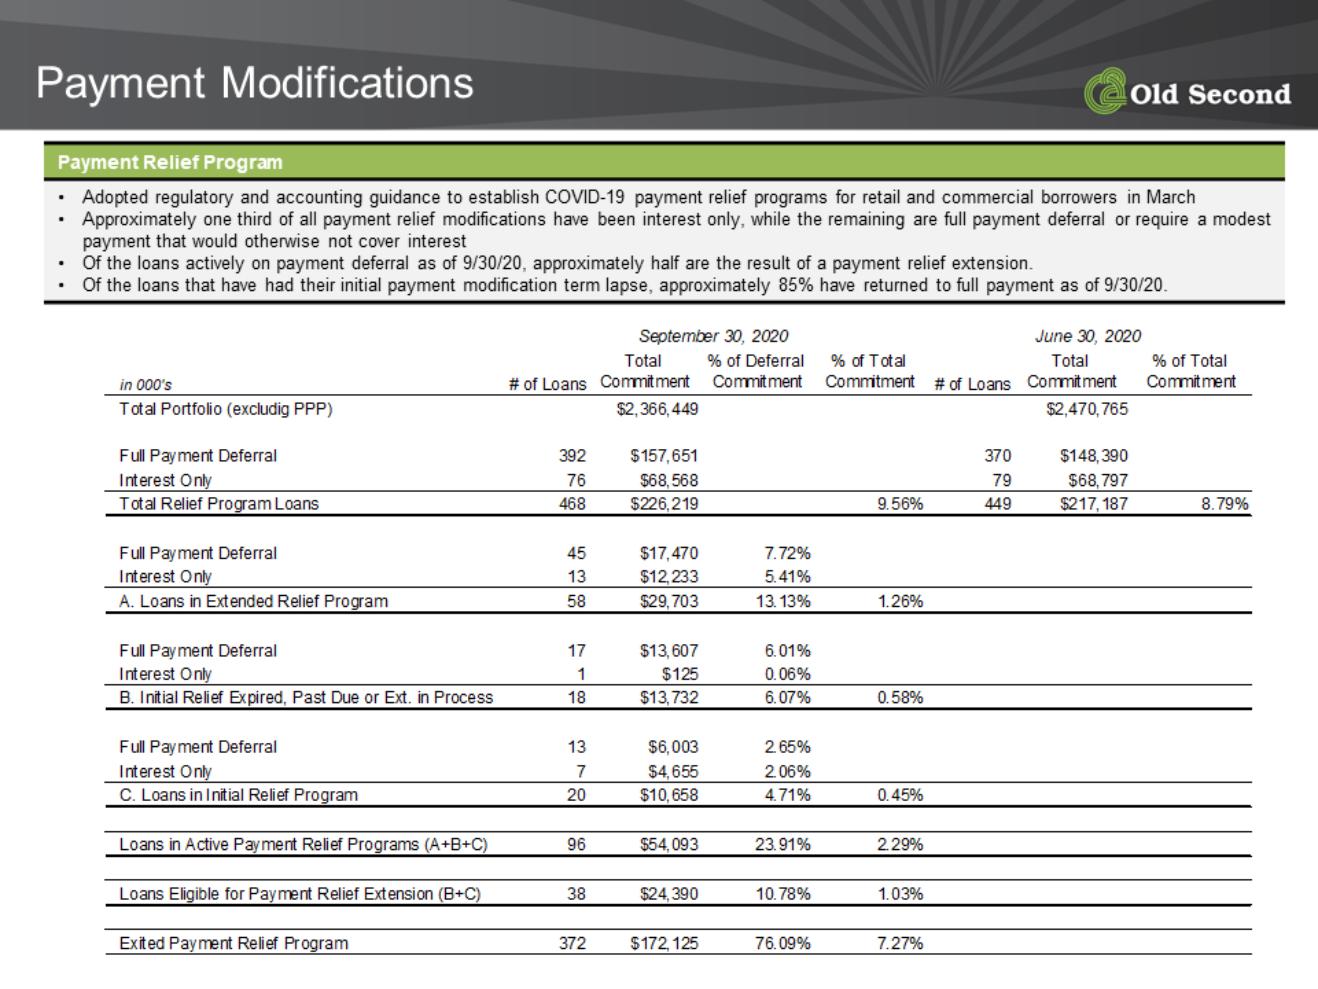
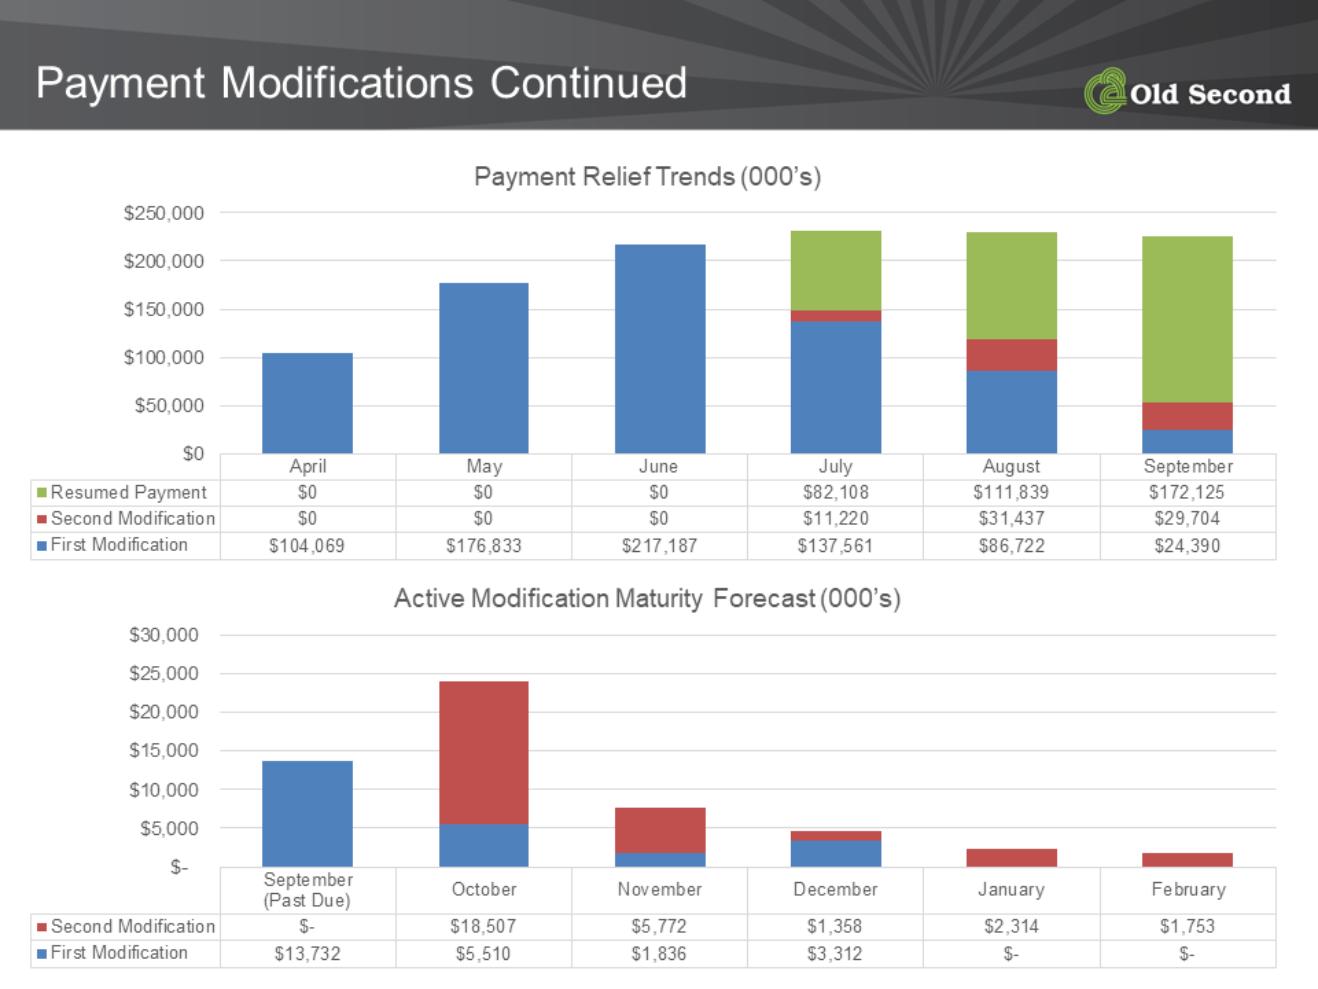
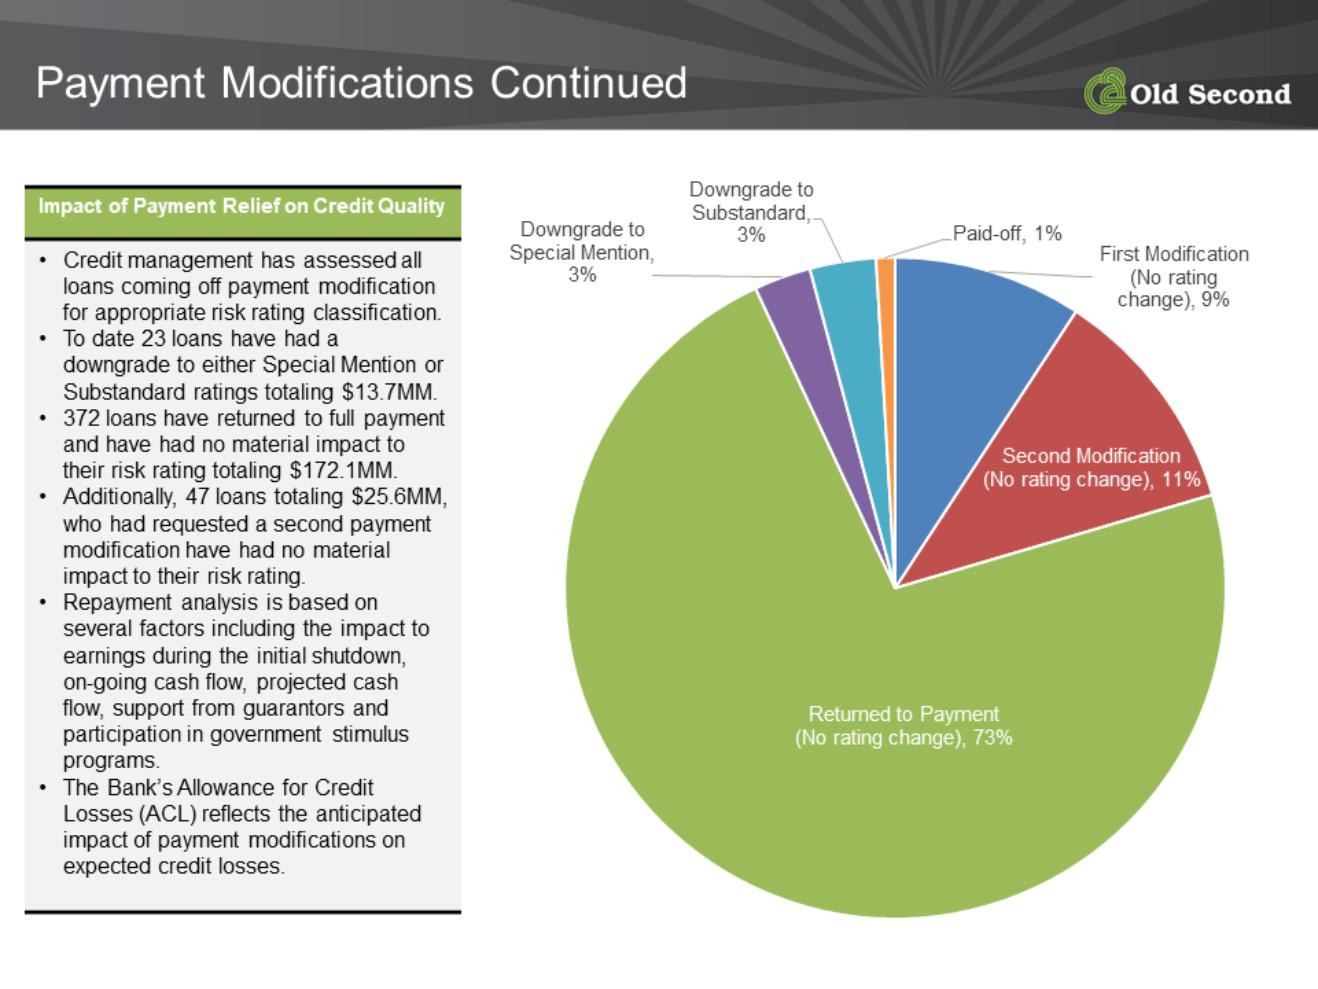
| ● | Late in the first quarter of 2020, we began granting loan payment deferrals to certain borrowers affected by the pandemic. As of September 30, 2020, our clients had requested loan payment deferrals on 468 loans totaling $226.2 million. As of September 30, 2020, 372 loans, representing $172.1 million outstanding, or 76.1% of the original loan balances deferred, have resumed payments. |
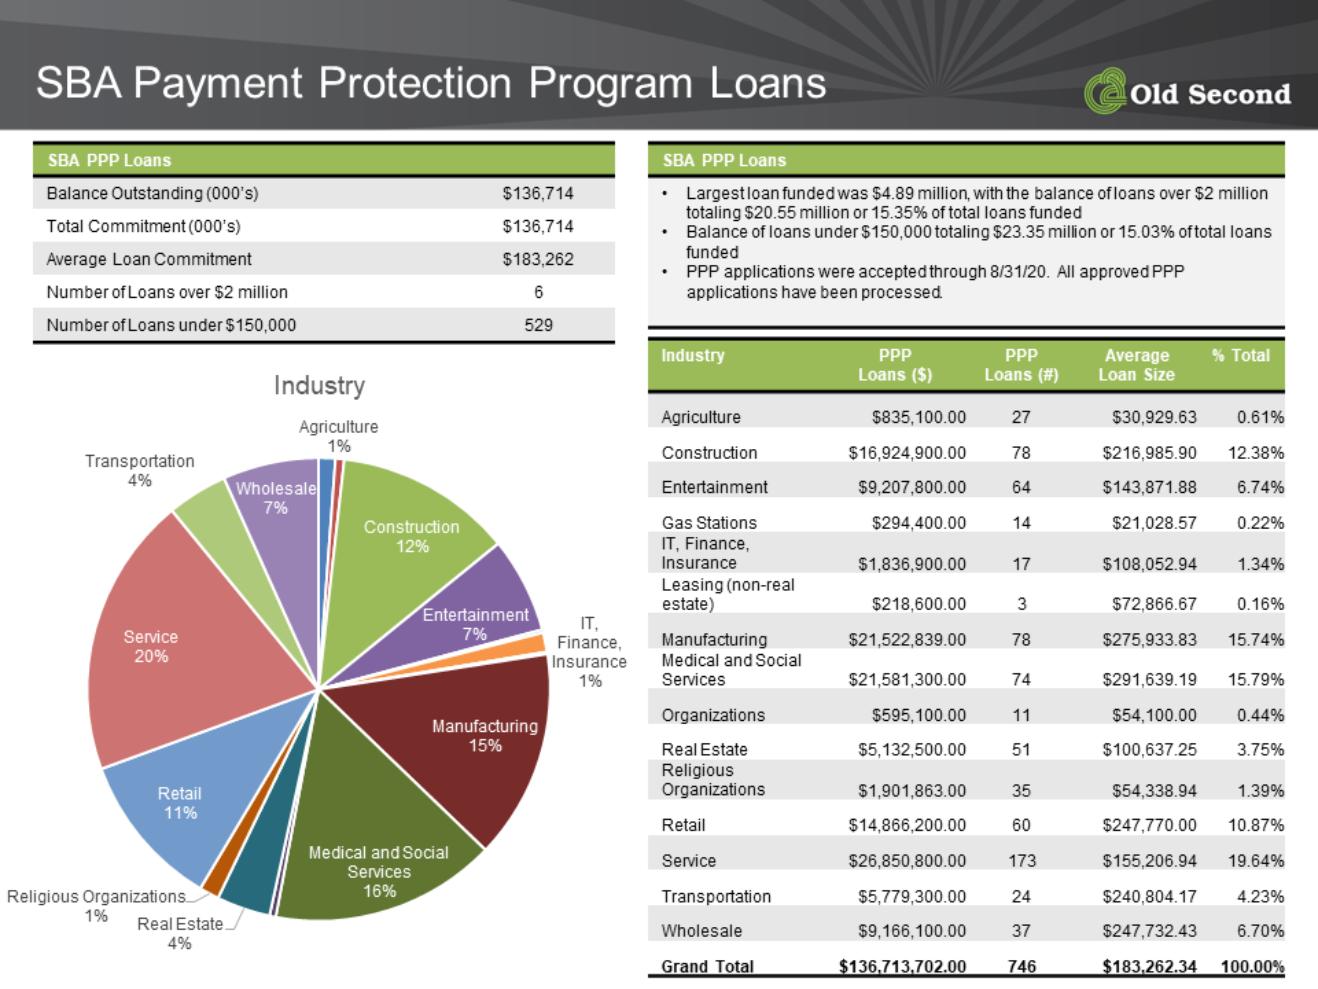
| ● | We are participating in the Coronavirus Aid, Relief and Economic Security Act (“CARES” Act). As of September 30, 2020, we had processed 746 loan applications for the PPP loans, representing a total of $136.7 million. Early in the fourth quarter of 2020, we started to submit applications for PPP loan forgiveness to the SBA, and will continue to submit applications throughout the remainder of 2020. We anticipate receiving funds for PPP loan forgiveness from the SBA well into the first quarter of 2021. |
President and Chief Executive Officer Jim Eccher said “Our results this quarter are a testament to the strength of our balance sheet, the diversity of our business mix and a consistent focus on quality underwriting. Expenses are well controlled, capital levels are extremely strong and we believe we are well positioned to navigate the challenges that lie ahead for credit quality in our industry. I would like to thank our employees for their continued hard work in meeting the needs of our customers and communities during these challenging times. Our balance sheet positioning remains somewhat conservative with substantial excess liquidity given the difficulty in forecasting the ultimate path of the national and local economies. As a result, our efforts are focused first on helping our customers navigate uncertain times, and second, on looking for opportunities to invest and grow the Old Second franchise.”
2
Capital Ratios
| Minimum Capital | | Well Capitalized | | | | | | | | | | ||
| Adequacy with | | Under Prompt | | | | | | | | | | ||
| Capital Conservation | | Corrective Action | | September 30, | | June 30, | | September 30, | |||||
| Buffer, if applicable1 | | Provisions2 | | 2020 | | 2020 | | 2019 | |||||
The Company | | | | | | | | | | | | | | |
Common equity tier 1 capital ratio | 7.00 | % | | N/A | | | 11.97 | % | | 11.31 | % | | 10.89 | % |
Total risk-based capital ratio | 10.50 | % | | N/A | | | 14.33 | % | | 13.63 | % | | 14.34 | % |
Tier 1 risk-based capital ratio | 8.50 | % | | N/A | | | 13.08 | % | | 12.39 | % | | 13.45 | % |
Tier 1 leverage ratio | 4.00 | % | | N/A | | | 10.07 | % | | 10.06 | % | | 11.54 | % |
| | | | | | | | | | | | | | |
The Bank | | | | | | | | | | | | | | |
Common equity tier 1 capital ratio | 7.00 | % | | 6.50 | % | | 14.24 | % | | 13.46 | % | | 14.83 | % |
Total risk-based capital ratio | 10.50 | % | | 10.00 | % | | 15.49 | % | | 14.71 | % | | 15.72 | % |
Tier 1 risk-based capital ratio | 8.50 | % | | 8.00 | % | | 14.24 | % | | 13.46 | % | | 14.83 | % |
Tier 1 leverage ratio | 4.00 | % | | 5.00 | % | | 10.90 | % | | 10.86 | % | | 12.68 | % |
1 Amounts are shown inclusive of a capital conservation buffer of 2.50%. Under the Federal Reserve’s Small Bank Holding Company Policy Statement, the Company is not subject to the minimum capital adequacy and capital conservation buffer capital requirements at the holding company level, unless otherwise advised by the Federal Reserve (such capital requirements are applicable only at the Bank level). Although the minimum regulatory capital requirements are not applicable to the Company, we calculate these ratios for our own planning and monitoring purposes.
2 The prompt corrective action provisions are only applicable at the Bank level.
| ● | The ratios shown above exceed levels required to be considered “well capitalized.” |
Asset Quality & Earning Assets
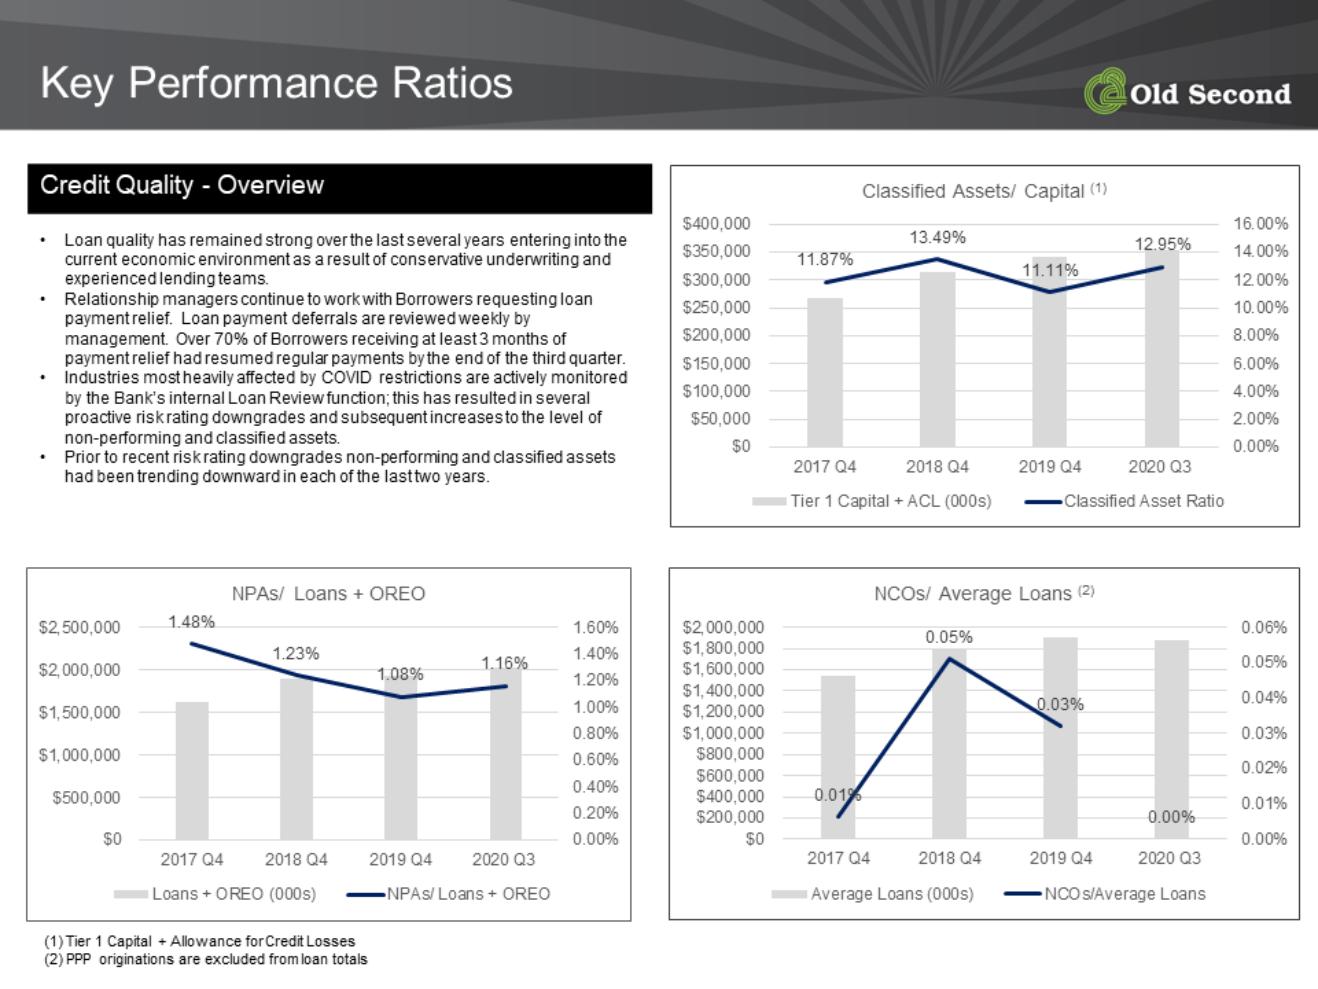
| ● | Nonperforming loans totaled $19.5 million at September 30, 2020, compared to $20.2 million at June 30, 2020, and $13.4 million at September 30, 2019. Credit metrics continue to be relatively stable regarding nonperforming loan levels, and management is carefully monitoring loans considered to be in a classified status. Nonperforming loans, as a percent of total loans were 1.0% at both September 30, 2020 and June 30, 2020, and 0.7% at September 30, 2019. Our adoption of CECL on January 1, 2020, resulted in a change in the accounting for purchased credit impaired (“PCI”) loans, which are now considered purchased credit deteriorated (“PCD”) loans under CECL. Prior to January 1, 2020, past due and nonaccrual loans excluded PCI loans, even if contractually past due or if we did not expect to receive payment in full, as we were accreting interest income over the expected life of the loans. PCD loans acquired in our acquisition of ABC Bank totaled $10.6 million, net of purchase accounting adjustments, at September 30, 2020. PCD loans that meet the definition of nonperforming are now included in our nonperforming disclosures. |
| ● | OREO assets totaled $2.7 million at September 30, 2020, compared to $5.1 million at June 30, 2020, and $4.7 million at September 30, 2019. We recorded write-downs of $46,000 in the third quarter of 2020, compared to $60,000 in the second quarter of 2020 and $203,000 in the third quarter of 2020. Nonperforming assets, as a percent of total loans plus OREO, were 1.2% at both September 30, 2020 and June 30, 2020, and 0.9% at September 30, 2019. |
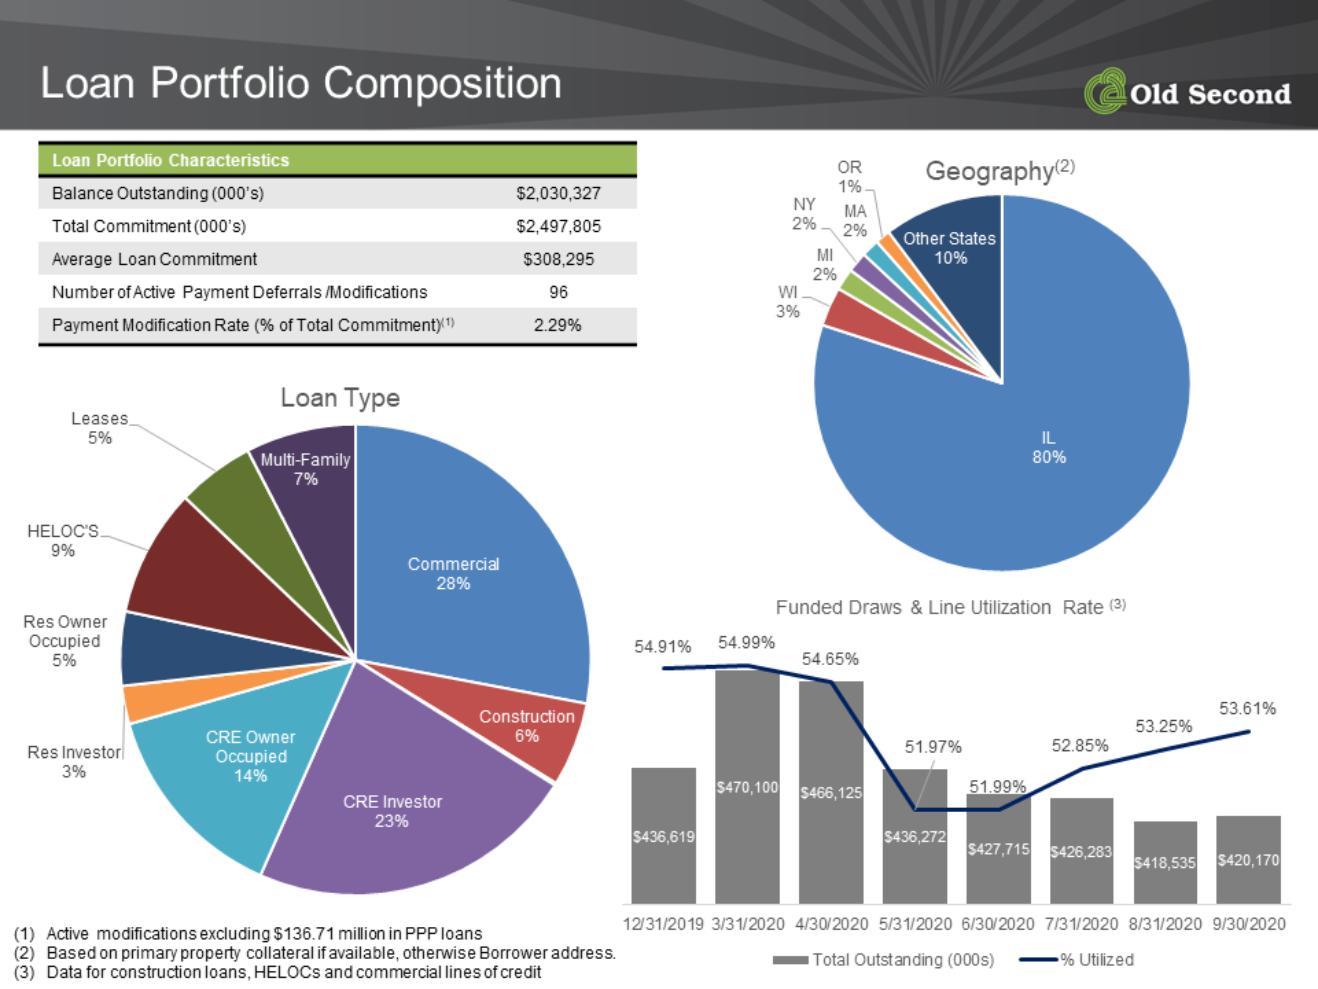
| ● | Total loans were $2.03 billion at September 30, 2020, reflecting a decrease of $22.0 million compared to June 30, 2020, but an increase of $130.5 million compared to September 30, 2019. Growth in the year over year period was due primarily to an increase in our commercial portfolio stemming from PPP loan originations of $136.7 million, as well as organic growth primarily in our leases and commercial real estate-–investor portfolios. Average loans (including loans held-for-sale) for the third quarter of 2020 totaled $2.05 billion, reflecting a decrease of $3.1 million from the second quarter of 2020 and an increase of $153.5 million from the third quarter of 2019. |
| ● | Available-for-sale securities totaled $448.4 million at September 30, 2020, compared to $447.4 million at June 30, 2020, and $488.4 million at September 30, 2019. Total securities available-for-sale increased a net $1.0 million from the linked quarter due to a purchase of $1.8 million of agency mortgage backed securities and unrealized mark to market gains of $5.8 million, offset by $6.1 million of calls, maturities and paydowns. A decline of $40.0 million was realized in the year over year period due primarily to security maturities and paydowns recorded in the first quarter of 2020. |
3
Net Interest Income
Analysis of Average Balances, | |||||||||||||||||||||||
Tax Equivalent Income / Expense and Rates | |||||||||||||||||||||||
(Dollars in thousands - unaudited) | |||||||||||||||||||||||
| |||||||||||||||||||||||
| Quarters Ended | ||||||||||||||||||||||
| September 30, 2020 | | June 30, 2020 | | September 30, 2019 | ||||||||||||||||||
| Average | | Income / | | Rate | | Average | | Income / | | Rate | | Average | | Income / | | Rate | ||||||
| Balance | | Expense | | % | | Balance | | Expense | | % | | Balance | | Expense | | % | ||||||
Assets | | | | | | | | | | | | | | | | | | | | | | | |
Interest earning deposits with financial institutions | $ | 263,199 | | $ | 68 | | 0.10 | | $ | 153,532 | | $ | 42 | | 0.11 | | $ | 21,425 | | $ | 119 | | 2.20 |
Securities: | | | | | | | | | | | | | | | | | | | | | | | |
Taxable | | 251,760 | | | 1,458 | | 2.30 | | | 247,868 | | | 1,694 | | 2.75 | | | 260,842 | | | 2,296 | | 3.49 |
Non-taxable (TE)1 | | 196,648 | | | 1,680 | | 3.40 | | | 204,840 | | | 1,767 | | 3.47 | | | 233,208 | | | 2,176 | | 3.70 |
Total securities (TE)1 | | 448,408 | | | 3,138 | | 2.78 | | | 452,708 | | | 3,461 | | 3.07 | | | 494,050 | | | 4,472 | | 3.59 |
Dividends from FHLBC and FRBC | | 9,917 | | | 118 | | 4.73 | | | 9,917 | | | 123 | | 4.99 | | | 10,398 | | | 154 | | 5.88 |
Loans and loans held-for-sale1, 2 | | 2,048,968 | | | 22,078 | | 4.29 | | | 2,052,060 | | | 22,460 | | 4.40 | | | 1,895,454 | | | 25,159 | | 5.27 |
Total interest earning assets | | 2,770,492 | | | 25,402 | | 3.65 | | | 2,668,217 | | | 26,086 | | 3.93 | | | 2,421,327 | | | 29,904 | | 4.90 |
Cash and due from banks | | 31,354 | | | - | | - | | | 30,594 | | | - | | - | | | 34,315 | | | - | | - |
Allowance for credit losses on loans | | (31,518) | | | - | | - | | | (30,747) | | | - | | - | | | (19,452) | | | - | | - |
Other noninterest bearing assets | | 185,228 | | | - | | - | | | 187,305 | | | - | | - | | | 172,250 | | | - | | - |
Total assets | $ | 2,955,556 | | | | | | | $ | 2,855,369 | | | | | | | $ | 2,608,440 | | | | | |
| | | | | | | | | | | | | | | | | | | | | | | |
Liabilities and Stockholders' Equity | | | | | | | | | | | | | | | | | | | | | | | |
NOW accounts | $ | 470,474 | | $ | 106 | | 0.09 | | $ | 457,772 | | $ | 129 | | 0.11 | | $ | 420,437 | | $ | 334 | | 0.32 |
Money market accounts | | 306,763 | | | 91 | | 0.12 | | | 279,873 | | | 85 | | 0.12 | | | 282,797 | | | 269 | | 0.38 |
Savings accounts | | 378,957 | | | 102 | | 0.11 | | | 359,358 | | | 171 | | 0.19 | | | 308,483 | | | 121 | | 0.16 |
Time deposits | | 417,952 | | | 1,084 | | 1.03 | | | 439,735 | | | 1,442 | | 1.32 | | | 420,429 | | | 1,672 | | 1.58 |
Interest bearing deposits | | 1,574,146 | | | 1,383 | | 0.35 | | | 1,536,738 | | | 1,827 | | 0.48 | | | 1,432,146 | | | 2,396 | | 0.66 |
Securities sold under repurchase agreements | | 54,313 | | | 28 | | 0.21 | | | 45,882 | | | 23 | | 0.20 | | | 40,342 | | | 135 | | 1.33 |
Other short-term borrowings | | 8,204 | | | 24 | | 1.16 | | | 8,396 | | | 34 | | 1.63 | | | 75,310 | | | 429 | | 2.26 |
Junior subordinated debentures | | 25,773 | | | 285 | | 4.40 | | | 25,773 | | | 283 | | 4.42 | | | 57,716 | | | 933 | | 6.41 |
Senior notes | | 44,337 | | | 673 | | 6.04 | | | 44,310 | | | 673 | | 6.11 | | | 44,222 | | | 682 | | 6.12 |
Notes payable and other borrowings | | 25,482 | | | 144 | | 2.25 | | | 26,551 | | | 165 | | 2.50 | | | 10,973 | | | 89 | | 3.22 |
Total interest bearing liabilities | | 1,732,255 | | | 2,537 | | 0.58 | | | 1,687,650 | | | 3,005 | | 0.72 | | | 1,660,709 | | | 4,664 | | 1.11 |
Noninterest bearing deposits | | 892,811 | | | - | | - | | | 854,324 | | | - | | - | | | 651,863 | | | - | | - |
Other liabilities | | 39,589 | | | - | | - | | | 39,613 | | | - | | - | | | 30,329 | | | - | | - |
Stockholders' equity | | 290,901 | | | - | | - | | | 273,782 | | | - | | - | | | 265,539 | | | - | | - |
Total liabilities and stockholders' equity | $ | 2,955,556 | | | | | | | $ | 2,855,369 | | | | | | | $ | 2,608,440 | | | | | |
Net interest income (GAAP) | | | | $ | 22,509 | | | | | | | $ | 22,707 | | | | | | | $ | 24,780 | | |
Net interest margin (GAAP) | | | | | | | 3.23 | | | | | | | | 3.42 | | | | | | | | 4.06 |
| | | | | | | | | | | | | | | | | | | | | | | |
Net interest income (TE)1 | | | | $ | 22,865 | | | | | | | $ | 23,081 | | | | | | | $ | 25,240 | | |
Net interest margin (TE)1 | | | | | | | 3.28 | | | | | | | | 3.48 | | | | | | | | 4.14 |
Core net interest margin (TE - excluding PPP loans)1 | | | | | | | 3.34 | | | | | | | | 3.51 | | | | | | | | N/A |
Interest bearing liabilities to earning assets | | 62.53 | % | | | | | | | 63.25 | % | | | | | | | 68.59 | % | | | | |
| | | | | | | | | | | | | | | | | | | | | | | |
1 Tax equivalent (TE) basis is calculated using a marginal tax rate of 21% in 2020 and 2019. See the discussion entitled “Non-GAAP Presentations” below and the table on page 17 that provides a reconciliation of each non-GAAP measure to the most comparable GAAP equivalent.
2 Interest income from loans is shown on a tax equivalent basis, which is a non-GAAP financial measure as discussed in the table on page 17, and includes fees of $975,000 for the third quarter of 2020, $718,000 for the second quarter of 2020, and $295,000 for the third quarter of 2019. Nonaccrual loans are included in the above stated average balances.
Net interest income (TE) was $22.9 million for the third quarter of 2020, which reflects a decrease of $216,000 compared to the second quarter of 2020, and a decrease of $2.4 million compared to the third quarter of 2019. The tax equivalent adjustment for the third quarter of 2020 was $356,000, compared to $374,000 for the second quarter of 2020, and $460,000 for the third quarter of 2019. Average interest earning assets increased $102.3 million to $2.77 billion for the third quarter of 2020, compared to the second quarter of 2020, primarily due to growth in interest earning deposits with financial institutions. Average interest earning assets increased $349.2 million in the third quarter of 2020, compared to the third quarter of 2019. Average loans, including loans held-for-sale, decreased $3.1 million for the third quarter of 2020, compared to the second quarter of 2020, but increased $153.5 million compared to the third quarter of 2019. Growth in volumes of earning assets for the third quarter of 2020, compared to the second quarter of 2020 and
4
the third quarter of 2019, was more than offset by a decline in yields. The yield on average earning assets decreased 28 basis points in the third quarter of 2020, compared to the second quarter of 2020, and decreased 125 basis points compared to the third quarter of 2019, primarily due to the lowering of interest rates by the Federal Reserve in the second quarter of 2020 in response to the COVID-19 pandemic, and $136.7 million of PPP loans issued at 1.00% in the second and third quarters of 2020.
Total securities income was $3.1 million in the third quarter of 2020, a decrease of $323,000 compared to the second quarter of 2020, and a decrease of $1.3 million compared to the third quarter of 2019, due primarily to reductions in yields and volumes. Security sales and paydowns in the third quarter of 2020 totaled $6.1 million, which were partially offset by a $1.8 million purchase of an agency mortgage backed security. Our overall yield on tax equivalent municipal securities was 3.40% for the third quarter of 2020, compared to 3.47% for the second quarter of 2020, and 3.70% for the third quarter of 2019. Taxable security yields also declined in the third quarter of 2020, resulting in a decrease to the overall tax equivalent yield for the total securities portfolio of 29 basis points from June 30, 2020, and 81 basis points from September 30, 2019.
Average interest bearing liabilities increased $44.6 million in the third quarter of 2020, compared to the second quarter of 2020, driven by a $37.4 million increase in average interest bearing deposits, and an $8.4 million increase in average securities sold under repurchase agreements for the linked quarter. Average interest bearing liabilities increased $71.5 million in the third quarter of 2020, compared to the third quarter of 2019, primarily driven by a $142.0 million increase in interest bearing deposits, a $14.0 million increases in securities sold under repurchase agreements, and a $14.5 million increase in notes payable and other borrowings, partially offset by a reduction in other short-term borrowings of $67.1 million, and a $31.9 million decrease in junior subordinated debentures. The cost of interest bearing liabilities for the third quarter of 2020 decreased by 14 basis points from the second quarter of 2020, and decreased 53 basis points from the third quarter of 2019. Growth in our average noninterest bearing demand deposits of $240.9 million in the year over year period has assisted us in controlling our cost of funds stemming from average interest bearing deposits and borrowings, which totaled 0.38% for the third quarter of 2020, 0.48% for the second quarter of 2020, and 0.80% for the third quarter of 2019.
For the third quarter of 2020, average other short-term borrowings, which consisted solely of FHLBC advances, totaled $8.2 million, compared to $8.4 million for the second quarter of 2020, and $75.3 million for the third quarter of 2019. Average rates paid on short-term FHLBC advances decreased from 2.26% in the third quarter of 2019 to 1.63% in the second quarter of 2020, and to 1.16% in the third quarter of 2020, reflecting the falling interest rate environment. We drew on a $4.0 million zero interest borrowing from the FHLB’s COVID-19 relief program in the third quarter of 2020; these borrowings were available to members for a one year term. The decrease noted in junior subordinated debentures year over year stems from the March 2020 redemption of our trust preferred securities issued by Old Second Capital Trust I and related junior subordinated debentures, which resulted in a payment of $33.0 million, including accrued interest. The redemption was funded with cash on hand and a $20.0 million term note issued at one month Libor plus 1.75%, with principal and interest payable over the next three years, included within notes payable and other borrowings.
Our net interest margin (TE) decreased 20 basis points to 3.28% for the third quarter of 2020, compared to 3.48% for the second quarter of 2020, and decreased 86 basis points compared to 4.14% for the third quarter of 2019. Our core net interest margin (TE), a non-GAAP financial measure that excludes the impact of our PPP loans, was 3.34% for the third quarter of 2020, compared to 3.51% for the second quarter of 2020 and 4.14% for the third quarter of 2019. The reductions were due primarily to falling interest rates over the past nine months. See the discussion entitled “Non-GAAP Presentations” in the table on page 17 that provides a reconciliation of each non-GAAP measure to the most comparable GAAP equivalent.
5
Noninterest Income
| | | | | | | | | | | 3rd Quarter 2020 | | |||||||||
Noninterest Income | | Three Months Ended | | Percent Change From | | ||||||||||||||||
(Dollars in thousands) | | September 30, | | June 30, | | September 30, | | June 30, | September 30, | | |||||||||||
|
| 2020 |
| 2020 |
| 2019 |
| 2020 |
| 2019 |
| ||||||||||
Trust income | | $ | 1,506 | | $ | 1,664 | | $ | 1,730 | | (9.5) | | (12.9) | | |||||||
Service charges on deposits | | | 1,322 | | | 1,120 | | | 2,020 | | 18.0 | | (34.6) | | |||||||
Residential mortgage banking revenue | | | | | | | | | | | | | | | |||||||
Secondary mortgage fees | | | 492 | | | 505 | | | 282 | | (2.6) | | 74.5 | | |||||||
Mortgage servicing rights mark to market loss | | | (160) | | | (445) | | | (946) | | 64.0 | | 83.1 | | |||||||
Mortgage servicing income | | | 521 | | | 458 | | | 460 | | 13.8 | | 13.3 | | |||||||
Net gain on sales of mortgage loans | | | 5,246 | | | 4,631 | | | 2,074 | | 13.3 | | 152.9 | | |||||||
Total residential mortgage banking revenue | | | 6,099 | | | 5,149 | | | 1,870 | | 18.5 | | 226.1 | | |||||||
Securities (losses) gains, net | | | (1) | | | - | | | 3,463 | | N/M | | (100.0) | | |||||||
Change in cash surrender value of BOLI | | | 459 | | | 532 | | | 267 | | (13.7) | | 71.9 | | |||||||
Death benefit realized on BOLI | | | (2) | | | 59 | | | - | | (103.4) | | N/M | | |||||||
Card related income | | | 1,499 | | | 1,311 | | | 1,595 | | 14.3 | | (6.0) | | |||||||
Other income | | | 803 | | | 860 | | | 988 | | (6.6) | | (18.7) | | |||||||
Total noninterest income | | $ | 11,685 | | $ | 10,695 | | $ | 11,933 | | 9.3 | | (2.1) | | |||||||
N/M - Not meaningful.
Noninterest income increased $990,000, or 9.3%, in the third quarter of 2020, compared to the second quarter of 2020, but decreased $248,000, or 2.1%, compared to the third quarter of 2019. The increase from the linked quarter was primarily driven by $950,000 of growth in residential mortgage banking revenue, attributable to a $615,000 increase in net gain on sales of mortgage loans and a $285,000 reduction in mark to market losses on MSRs in the third quarter of 2020, compared to the prior quarter. Service charges on deposits also increased in the third quarter of 2020, compared to the second quarter of 2020, as consumer spending began to increase.
The decrease in noninterest income in the third quarter of 2020 compared to the third quarter of 2019 is due to a $224,000 reduction in trust income due to declines in the value of assets under management over the past year, a $698,000 reduction in service charges on deposits as consumer spending decreased during the COVID-19 pandemic, and no securities gains recorded in the third quarter of 2020, compared to $3.5 million of security gains recorded in the 2019 like period. In addition, card related income and other income also declined in the year over year period.
These year over year declines were materially offset by $4.2 million of growth in residential mortgage banking revenue in the third quarter of 2020, compared to the third quarter of 2019, due to the low interest rate environment and resultant increases in mortgage originations and refinances, as well as a $192,000 increase in the cash surrender value of BOLI in the third quarter of 2020 compared to the third quarter of 2019.
6
Noninterest Expense
| | | | | | | | | | | 3rd Quarter 2020 | | ||
Noninterest Expense | | Three Months Ended | | Percent Change From | | |||||||||
(Dollars in thousands) | | September 30, | | June 30, | | September 30, | | June 30, | | September 30, | | |||
|
| 2020 |
| 2020 |
| 2019 |
| 2020 |
| 2019 |
| |||
Salaries | | $ | 9,731 | | $ | 8,588 | | $ | 9,460 | | 13.3 | | 2.9 | |
Officers incentive | | | 968 | | | 968 | | | 923 | | - | | 4.9 | |
Benefits and other | | | 1,887 | | | 1,786 | | | 1,679 | | 5.7 | | 12.4 | |
Total salaries and employee benefits | | | 12,586 | | | 11,342 | | | 12,062 | | 11.0 | | 4.3 | |
Occupancy, furniture and equipment expense | | | 2,003 | | | 1,935 | | | 2,235 | | 3.5 | | (10.4) | |
Computer and data processing | | | 1,226 | | | 1,247 | | | 1,490 | | (1.7) | | (17.7) | |
FDIC insurance | | | 191 | | | 155 | | | (114) | | 23.2 | | (267.5) | |
General bank insurance | | | 281 | | | 237 | | | 270 | | 18.6 | | 4.1 | |
Amortization of core deposit intangible asset | | | 122 | | | 124 | | | 157 | | (1.6) | | (22.3) | |
Advertising expense | | | 62 | | | 57 | | | 360 | | 8.8 | | (82.8) | |
Card related expense | | | 566 | | | 514 | | | 531 | | 10.1 | | 6.6 | |
Legal fees | | | 169 | | | 176 | | | 111 | | (4.0) | | 52.3 | |
Other real estate owned expense, net | | | 125 | | | 143 | | | 26 | | (12.6) | | 380.8 | |
Other expense | | | 2,935 | | | 2,966 | | | 2,826 | | (1.0) | | 3.9 | |
Total noninterest expense | | $ | 20,266 | | $ | 18,896 | | $ | 19,954 | | 7.3 | | 1.6 | |
Efficiency ratio (GAAP)1 | | | 58.27 | % | | 55.13 | % | | 57.82 | % | | | | |
Adjusted efficiency ratio (non-GAAP)2 | | | 57.47 | % | | 54.28 | % | | 56.93 | % | | | | |
1 The efficiency ratio shown in the table above is a GAAP financial measure calculated as noninterest expense, excluding amortization of core deposits and OREO expenses, divided by the sum of net interest income and total noninterest income less any BOLI death benefit recorded, net gains or losses on securities and mark to market gains or losses on MSRs.
2 The adjusted efficiency ratio shown in the table above is a non-GAAP financial measure calculated as noninterest expense, excluding amortization of core deposits and OREO expenses, divided by the sum of net interest income on a fully tax equivalent basis, total noninterest income less net gains or losses on securities and mark to market gains or losses on MSRs, and includes a tax equivalent adjustment on the change in cash surrender value of BOLI. See the discussion entitled “Non-GAAP Presentations” below and the table on page 17 that provides a reconciliation of each non-GAAP financial measure to the most comparable GAAP equivalent.
Noninterest expense for the third quarter of 2020 increased $1.4 million, or 7.3%, compared to the second quarter of 2020, and increased $312,000, or 1.6%, compared to the third quarter of 2019. The linked quarter decrease is primarily attributable to a $1.2 million increase in salaries and employee benefits stemming from an increase in deferrals of new loan origination costs related to PPP loans in the second quarter of 2020, with no like level of origination cost deferrals in the third quarter of 2020. In addition, occupancy, furniture and equipment expense increased $68,000 in the third quarter of 2020 compared to the linked quarter due to planned building repairs at various branches.
The year over year increase in noninterest expense is primarily attributable to a $524,000 increase in salaries and employee benefits due to growth in full-time equivalent employees, merit increases in early 2020, and employee insurance and other benefits increases, a $305,000 increase in FDIC insurance due to an accrual reversal in the prior year, a $99,000 increase in other real estate owned expense, net, primarily due to closing costs on property sales in the third quarter of 2020, and a $109,000 increase in other expense due to audit fees, consulting and management fees, and deferred director expense. These increases were partially offset by a $232,000 reduction in occupancy, furniture and equipment expense, a $264,000 decrease in computer and data processing expense, and a $298,000 decrease in advertising expense.
7
Earning Assets
| | | | | | | | | | | September 30, 2020 | | ||
Loans | | As of | | Percent Change From | | |||||||||
(dollars in thousands) | | September 30, | | June 30, | | September 30, | | June 30, | | September 30, | | |||
|
| 2020 |
| 2020 |
| 2019 |
| 2020 |
| 2019 |
| |||
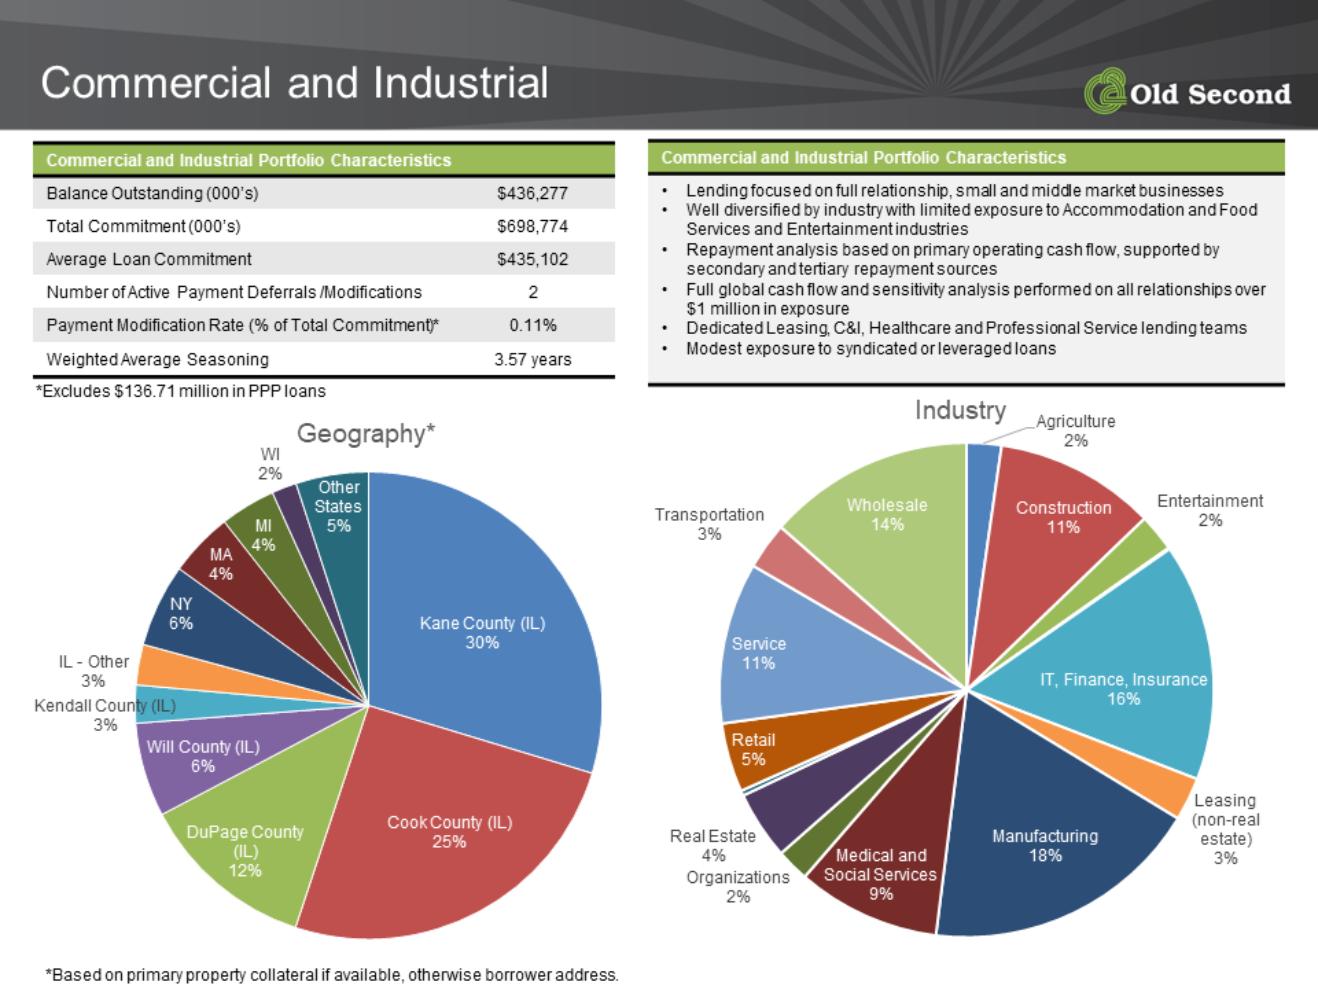
Commercial | | $ | 436,277 | | $ | 441,642 | | $ | 333,664 | | (1.2) | | 30.8 | |
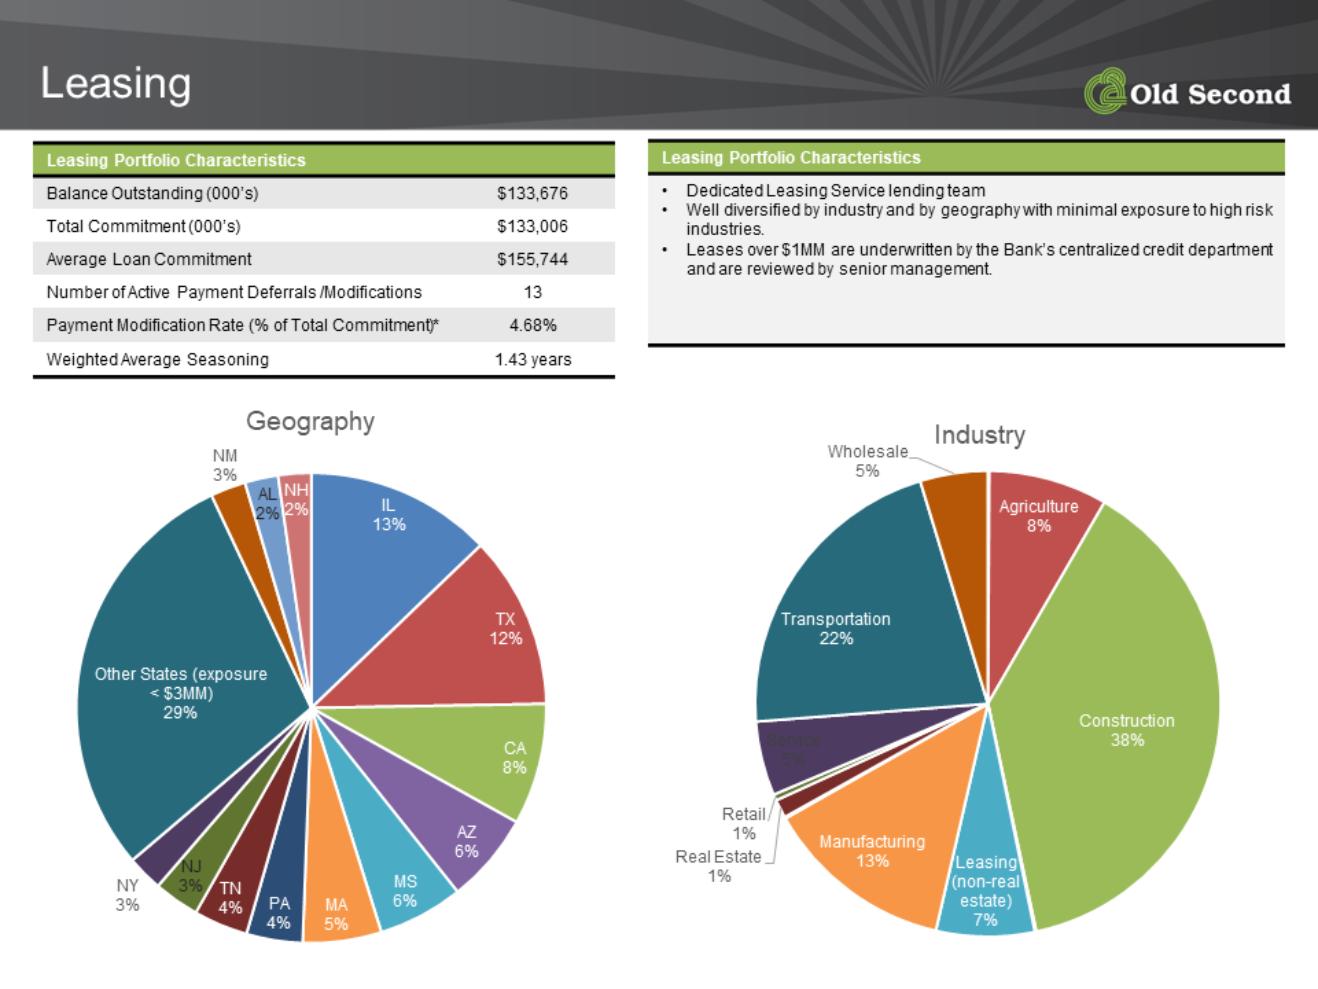
Leases | | | 133,676 | | | 133,293 | | | 108,152 | | 0.3 | | 23.6 | |
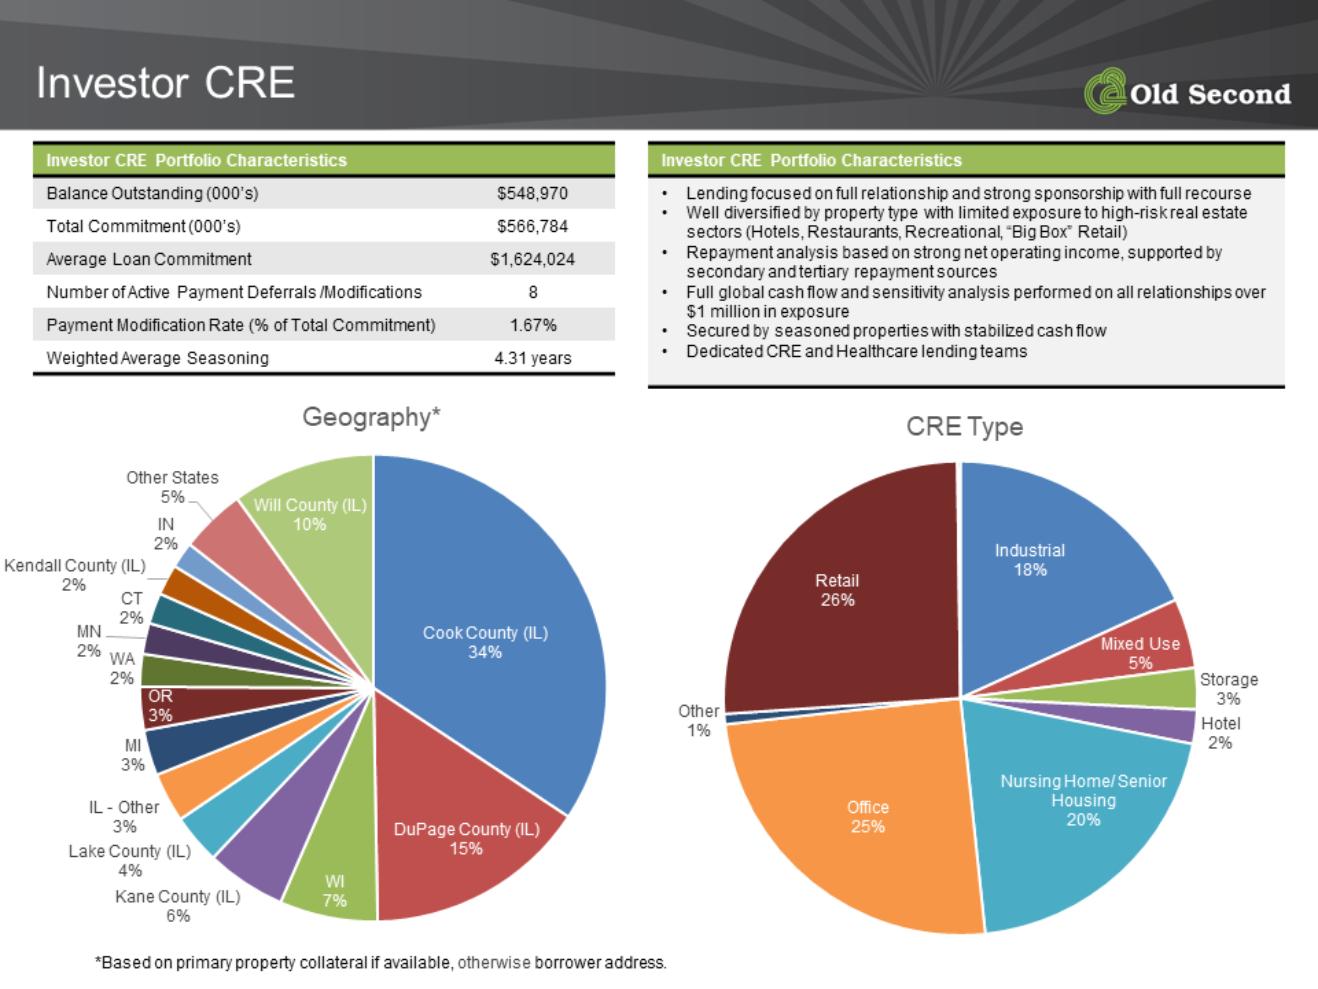
Commercial real estate - Investor | | | 548,970 | | | 525,714 | | | 491,794 | | 4.4 | | 11.6 | |
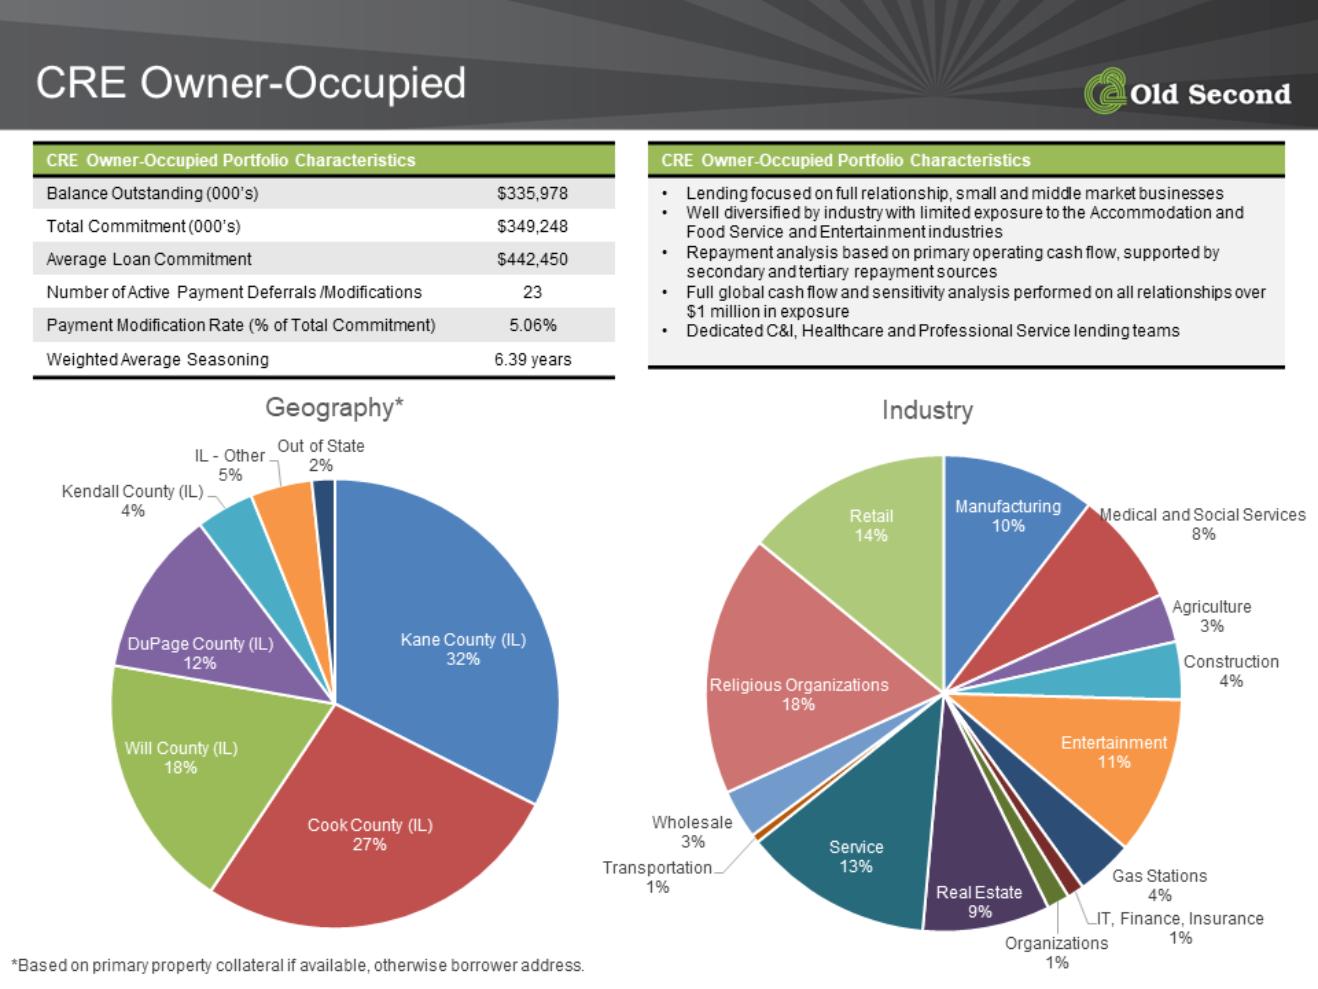
Commercial real estate - Owner occupied | | | 335,978 | | | 343,982 | | | 334,986 | | (2.3) | | 0.3 | |
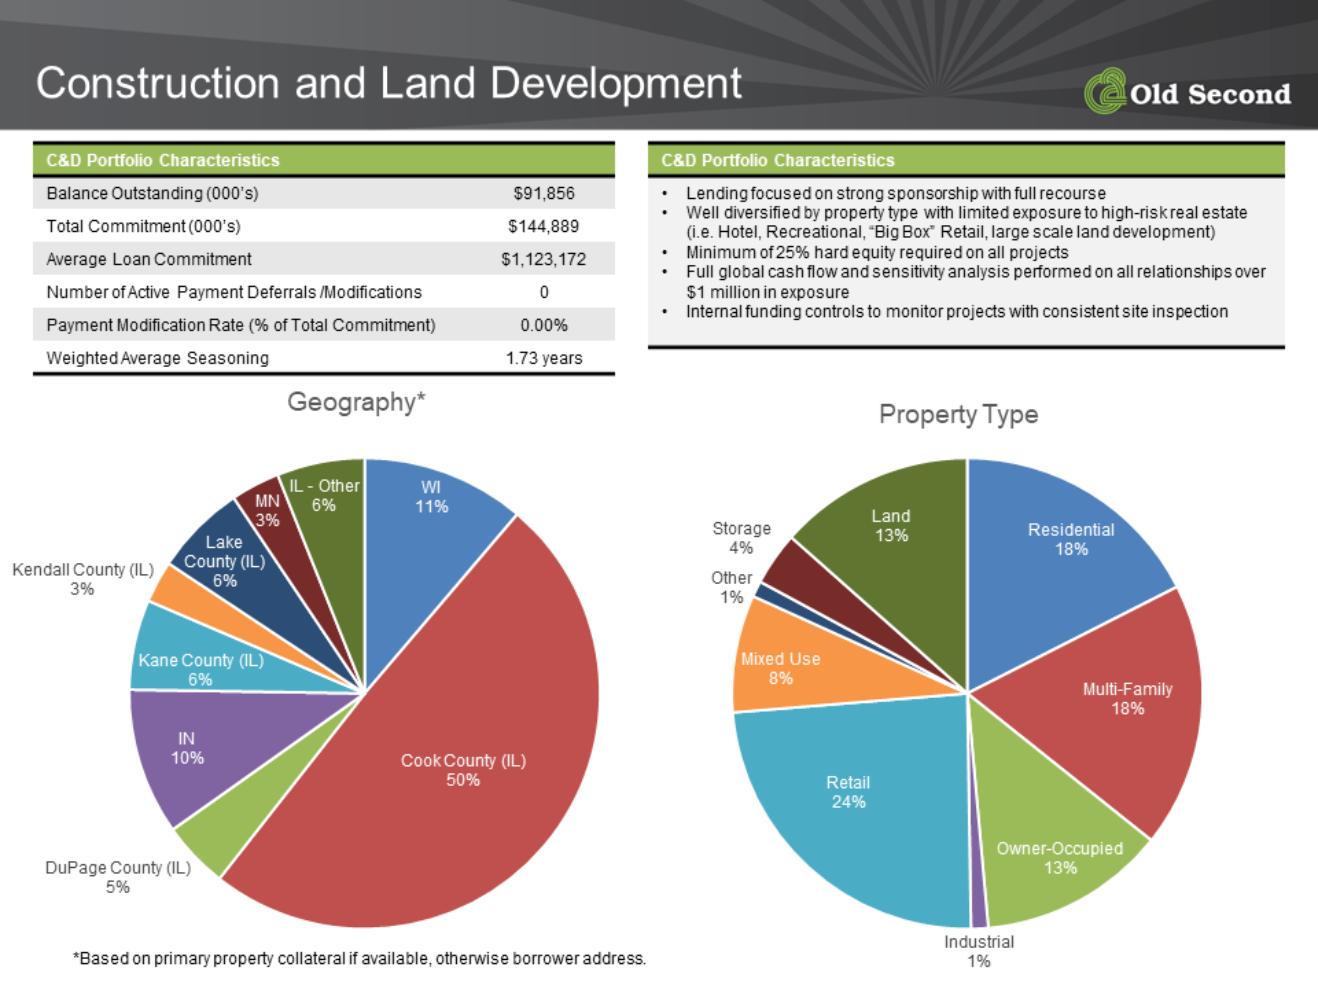
Construction | | | 91,856 | | | 83,939 | | | 91,066 | | 9.4 | | 0.9 | |
Residential real estate - Investor | | | 61,923 | | | 69,421 | | | 68,989 | | (10.8) | | (10.2) | |
Residential real estate - Owner occupied | | | 114,283 | | | 126,303 | | | 136,046 | | (9.5) | | (16.0) | |
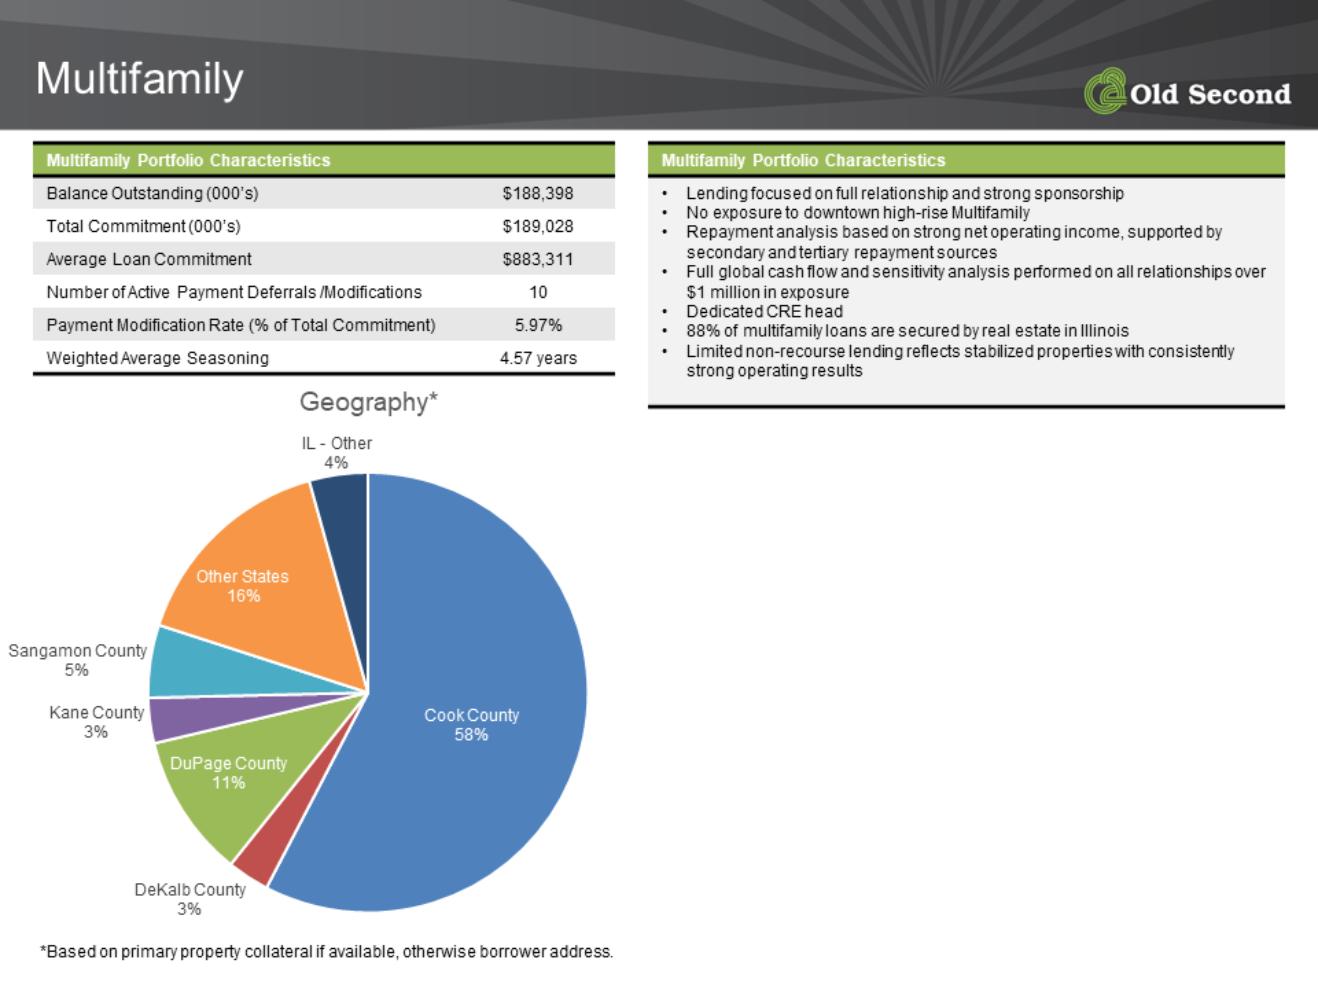
Multifamily | | | 188,398 | | | 197,521 | | | 183,476 | | (4.6) | | 2.7 | |
HELOC | | | 85,882 | | | 89,170 | | | 90,791 | | (3.7) | | (5.4) | |
HELOC - Purchased | | | 22,312 | | | 26,467 | | | 35,518 | | (15.7) | | (37.2) | |
Other1 | | | 10,772 | | | 14,884 | | | 14,140 | | (27.6) | | (23.8) | |
Total loans, excluding deferred loan costs and PCI | | | 2,030,327 | | | 2,052,336 | | | 1,888,622 | | (1.1) | | 7.5 | |
Net deferred loan costs | | | - | | | - | | | 2,054 | | - | | (100.0) | |
Total loans, excluding PCI2 | | | 2,030,327 | | | 2,052,336 | | | 1,890,676 | | (1.1) | | 7.4 | |
PCI loans, net of purchase accounting adjustments | | | - | | | - | | | 9,135 | | - | | (100.0) | |
Total loans | | $ | 2,030,327 | | $ | 2,052,336 | | $ | 1,899,811 | | (1.1) | | 6.9 | |
1 Other class includes consumer and overdrafts.
2 As a result of our adoption of the new CECL accounting standard effective January 1, 2020, loans formerly referred to as PCI loans are considered PCD loans under CECL for all periods presented after December 31, 2019, and are included in the amounts above based on loan type.
Total loans decreased by $22.0 million at September 30, 2020, compared to June 30, 2020, and increased $130.5 million for the year over year period. Growth in the year over year period was primarily due to PPP loan originations of $136.7 million, recorded within commercial loans, as well as organic growth primarily in our leases and commercial real estate-investor loan portfolios. As required by CECL, the balance (or amortized cost basis) of PCD loans are carried on a gross basis (rather than net of the associated credit loss estimate), and the expected credit losses for PCD loans are estimated and separately recognized as part of the allowance for credit losses. Accordingly, at January 1, 2020, $2.5 million of purchase accounting adjustments related to PCD loans were reclassified to the allowance for credit losses from loans, resulting in an increase to total PCD loans.
| | | | | | | | | | | September 30, 2020 | ||
Securities | | As of | | Percent Change From | |||||||||
(dollars in thousands) | | September 30, | | June 30, | | September 30, | | June 30, | | September 30, | |||
|
| 2020 |
| 2020 |
| 2019 |
| 2020 |
| 2019 | |||
Securities available-for-sale, at fair value | | | | | | | | | | | | | |
U.S. Treasury | | $ | 4,134 | | $ | 4,147 | | $ | 4,038 | | (0.3) | | 2.4 |
U.S. government agencies | | | 7,005 | | | 7,276 | | | 9,143 | | (3.7) | | (23.4) |
U.S. government agency mortgage-backed | | | 18,219 | | | 16,779 | | | 16,940 | | 8.6 | | 7.6 |
States and political subdivisions | | | 249,777 | | | 250,364 | | | 238,727 | | (0.2) | | 4.6 |
Collateralized mortgage obligations | | | 57,013 | | | 56,113 | | | 64,121 | | 1.6 | | (11.1) |
Asset-backed securities | | | 81,585 | | | 80,026 | | | 83,182 | | 1.9 | | (1.9) |
Collateralized loan obligations | | | 30,688 | | | 32,731 | | | 72,271 | | (6.2) | | (57.5) |
Total securities available-for-sale | | $ | 448,421 | | $ | 447,436 | | $ | 488,422 | | 0.2 | | (8.2) |
| | | | | | | | | | | | | |
Our securities portfolio totaled $448.4 million as of September 30, 2020, an increase of $1.0 million from $447.4 million as of June 30, 2020, and a decrease of $40.0 million from September 30, 2019. The increase in the portfolio during the third quarter of 2020, compared to the prior quarter, was due to purchases of $1.9 million and unrealized mark to market gains of $5.8 million, partially offset by $6.1 million of security calls, maturities and paydowns. The decrease in the securities portfolio in the year over year period was primarily due to the calls on collateralized loan obligations over the past year. Net security losses of $1,000 were recorded in the third quarter of 2020, no security sales were recorded in the second quarter of 2020, and $3.5 million of net security gains were recorded in the third quarter of 2019.
8
Asset Quality
| | | | | | | | | | | September 30, 2020 | ||
Nonperforming assets | | As of | | Percent Change From | |||||||||
(dollars in thousands) | | September 30, | | June 30, | | September 30, | | June 30, | | September 30, | |||
|
| 2020 |
| 2020 |
| 2019 |
| 2020 | | 2019 | |||
Nonaccrual loans | | $ | 20,076 | | $ | 18,343 | | $ | 11,852 | | 9.4 | | 69.4 |
Performing troubled debt restructured loans accruing interest | |
| 334 | |
| 978 | |
| 1,532 | | (65.8) | | (78.2) |
Loans past due 90 days or more and still accruing interest | |
| 422 | |
| 840 | |
| 18 | | (49.8) | | N/M |
Total nonperforming loans | |
| 20,832 | |
| 20,161 | |
| 13,402 | | 3.3 | | 55.4 |
Other real estate owned | |
| 2,686 | |
| 5,082 | |
| 4,682 | | (47.1) | | (42.6) |
Total nonperforming assets | | $ | 23,518 | | $ | 25,243 | | $ | 18,084 | | (6.8) | | 30.0 |
| | | | | | | | | | | | | |
PCD loans, net of purchase accounting adjustments1 | | $ | 10,638 | | $ | 11,096 | | $ | 9,135 | | (4.1) | | 16.5 |
| | | | | | | | | | | | | |
| | | | | | | | | | | | | |
30-89 days past due loans and still accruing interest | | $ | 5,511 | | $ | 11,330 | | $ | 7,937 | | | | |
Nonaccrual loans to total loans | | | 1.0 | % | | 0.9 | % | | 0.6 | % | | | |
Nonperforming loans to total loans | | | 1.0 | % | | 1.0 | % | | 0.7 | % | | | |
Nonperforming assets to total loans plus OREO | | | 1.2 | % | | 1.2 | % | | 0.9 | % | | | |
Purchased credit-deteriorated loans to total loans | | | 0.5 | % | | 0.5 | % | | 0.5 | % | | | |
| | | | | | | | | | | | | |
Allowance for credit losses | | $ | 32,918 | | $ | 31,273 | | $ | 19,651 | | | | |
Allowance for credit losses to total loans | | | 1.6 | % | | 1.5 | % | | 1.0 | % | | | |
Allowance for credit losses to nonaccrual loans | | | 164.0 | % | | 170.5 | % | | 165.8 | % | | | |
N/M - Not meaningful.
1 In 2020, due to the adoption of CECL, PCD loans are now included in total nonperforming assets, if their risk rating at period end so indicates. For September 30, 2019, PCI loans were not included within total nonperforming assets since we were accreting interest income over the expected life of the loans.
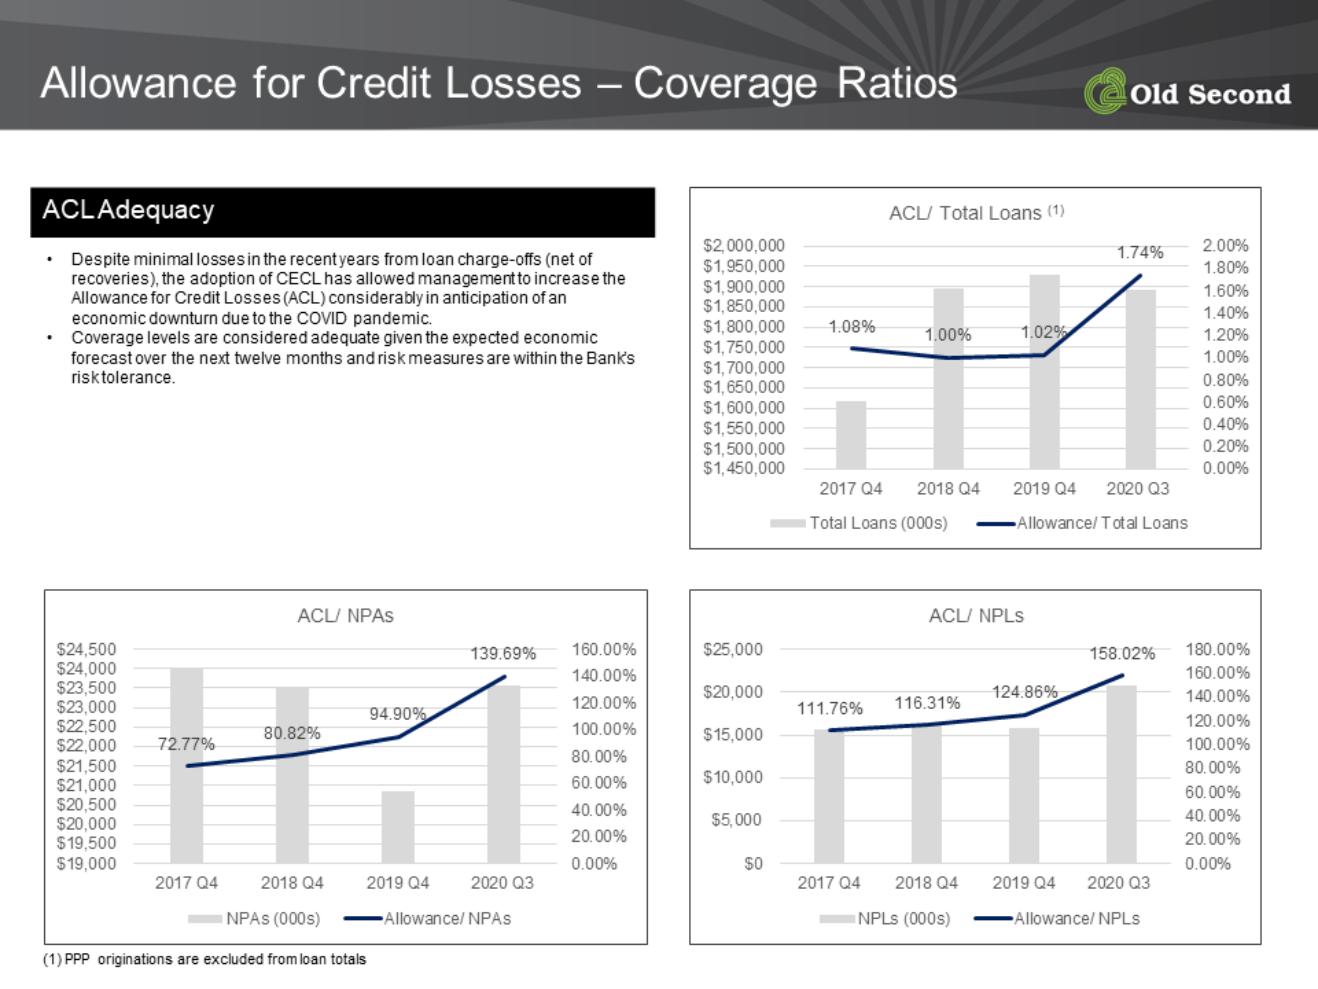
Nonperforming loans consist of nonaccrual loans, performing troubled debt restructured loans accruing interest and loans 90 days or more past due and still accruing interest. We historically excluded PCI loans meeting nonperforming criteria from our nonperforming disclosures as long as their cash flows and the timing of such cash flows continued to be estimable and probable of collection. As a result of CECL implementation on January 1, 2020, PCI loans became PCD loans. PCD loans that meet the definition of nonperforming are now included in our nonperforming disclosures. Nonperforming loans to total loans was 1.0% for both the third quarter of 2020 and the second quarter of 2020, and 0.7% for the third quarter of 2019. Nonperforming assets to total loans plus OREO remained stable and ended at 1.2% for the third and second quarter of 2020, and 0.9% for the third quarter of 2019, as our loan portfolio grew year over year, and we continued OREO liquidations and recorded write-downs. Our allowance for credit losses to total loans was 1.6% as of September 30, 2020, compared to 1.5% as of June 30, 2020 and 1.0% as of September 30, 2019.
9
The following table shows classified assets by segment for the following periods.
| | | | | | | | | | | September 30, 2020 | | ||
Classified loans | | As of | | Percent Change From | | |||||||||
(dollars in thousands) | | September 30, | | June 30, | | September 30, | | June 30, | | September 30, | | |||
|
| 2020 |
| 2020 |
| 2019 |
| 2020 |
| 2019 | | |||
Commercial | | $ | 5,992 | | $ | 8,627 | | $ | 8,079 | | (30.5) | | (25.8) | |
Leases | | | 3,270 | | | 254 | | | 74 | | N/M | | N/M | |
Commercial real estate - Investor | | | 5,596 | | | 5,445 | | | 7,928 | | 2.8 | | (29.4) | |
Commercial real estate - Owner occupied | | | 9,658 | | | 9,432 | | | 5,807 | | 2.4 | | 66.3 | |
Construction | | | 5,108 | | | 2,318 | | | 264 | | 120.4 | | N/M | |
Residential real estate - Investor | | | 1,526 | | | 1,454 | | | 984 | | 5.0 | | 55.1 | |
Residential real estate - Owner occupied | | | 3,836 | | | 4,270 | | | 3,766 | | (10.2) | | 1.9 | |
Multifamily | | | 5,834 | | | 5,562 | | | 430 | | 4.9 | | N/M | |
HELOC | | | 1,566 | | | 1,690 | | | 1,804 | | (7.3) | | (13.2) | |
HELOC - Purchased | | | - | | | 113 | | | 181 | | (100.0) | | (100.0) | |
Other1 | | | 271 | | | 353 | | | 22 | | (23.2) | | N/M | |
Total classified loans, excluding PCI loans | | | 42,657 | | | 39,518 | | | 29,339 | | 7.9 | | 45.4 | |
PCI loans, net of purchase accounting adjustments2 | | | - | | | - | | | 9,135 | | - | | (100.0) | |
Total classified loans | | $ | 42,657 | | $ | 39,518 | | $ | 38,474 | | 7.9 | | 10.9 | |
N/M - Not meaningful.
1 Other class includes consumer and overdrafts.
2 For purposes of this table, as of September 30, 2019, classified loan amounts excluded $9.1 million of PCD loans, net of purchase accounting adjustments, formerly PCI loans, even if contractually past due or if we did not expect to receive payment in full, as we were accreting interest income over the expected life of the loans.
Classified loans include nonaccrual, performing troubled debt restructurings, PCD loans (formerly PCI loans, as applicable), and all other loans considered substandard. Classified loans totaled $42.7 million as of September 30, 2020, an increase of $3.1 million, or 7.9%, from the prior linked quarter, and an increase of $4.2 million, or 10.9%, from the third quarter of 2019. All PCD loans stem from our acquisition of ABC Bank in 2018.
Allowance for Credit Losses on Loans and Unfunded Commitments
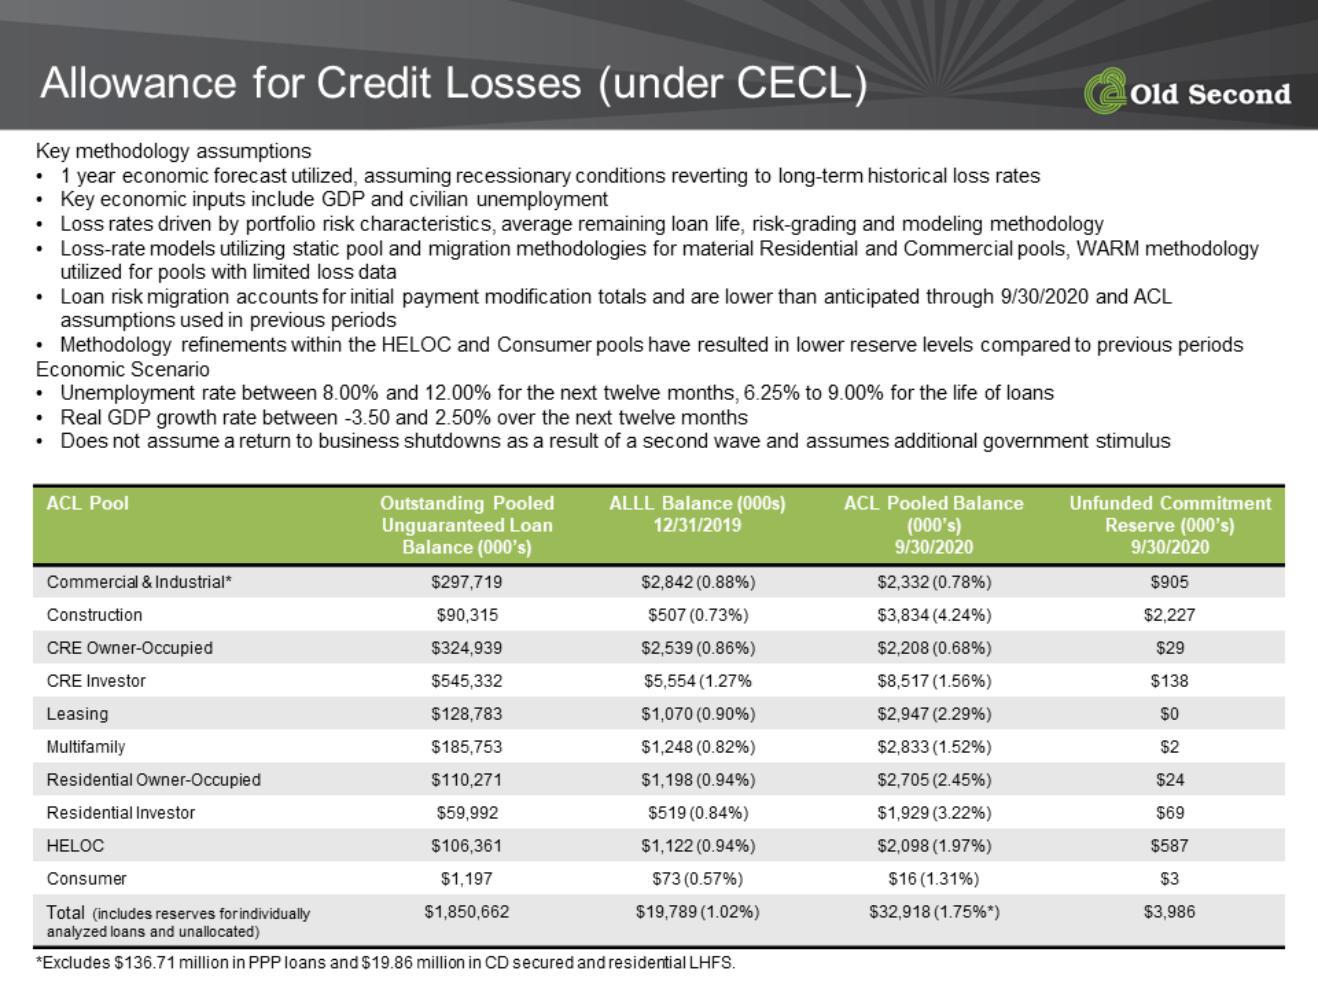
At September 30, 2020, our allowance for credit losses (“ACL”) on loans totaled $32.9 million, and our ACL on unfunded commitments, included in other liabilities, totaled $4.0 million. The increase in our ACL from year-end 2019 was driven by the $10.4 million of provision expense recorded year to date in 2020, and by the adoption of CECL on January 1, 2020, in which we recognized an increase in our ACL on outstanding loans of $5.9 million and an increase in our ACL on unfunded commitments of $1.7 million as a cumulative effect adjustment from change in accounting policies. During the third quarter of 2020, we recorded $1.3 million of ACL related to loans, and $980,000 of reduction to the ACL related to unfunded commitments, resulting in total provision expense of $300,000. The decline in the ACL for unfunded commitments in the third quarter of 2020, compared to the prior quarter, was primarily related to commercial unfunded commitments, with a decrease in the funding rate assumptions based on our analysis of the last 12 months of utilization. The total increase in the ACL during 2020 reflects forecasted credit deterioration due to the COVID-19 pandemic and the resultant recession. Our ACL on loans to total loans was 1.6% as of September 30, 2020, compared to 1.5% as of June 30, 2020 and 1.0% at both December 31, 2019 and September 30, 2019. The ACL on unfunded commitments totaled $4.0 million as of September 30, 2020, compared to $5.0 million as of June 30, 2020.
10
Net Charge-off Summary
Loan Charge-offs, net of recoveries | Quarters Ended | |||||||||||||
(dollars in thousands) | September 30, | | % of | | June 30, | | % of | | September 30, | | % of | |||
| 2020 | | Total 2 | | 2020 | | Total 2 | | 2019 | | Total 2 | |||
Commercial | $ | (7) | | 1.9 | | $ | (2) | | (1.2) | | $ | 10 | | 3.7 |
Leases | | 119 | | (32.6) | | | - | | - | | | 47 | | 17.3 |
Commercial real estate - Investor | | (102) | | 27.9 | | | (14) | | (8.4) | | | 147 | | 54.2 |
Commercial real estate - Owner occupied | | (420) | | 115.1 | | | 292 | | 174.9 | | | - | | - |
Construction | | 59 | | (16.2) | | | - | | - | | | 7 | | 2.6 |
Residential real estate - Investor | | (15) | | 4.1 | | | (2) | | (1.2) | | | (6) | | (2.2) |
Residential real estate - Owner occupied | | (25) | | 6.8 | | | (66) | | (39.5) | | | (13) | | (4.8) |
Multifamily | | - | | - | | | - | | - | | | - | | - |
HELOC | | (52) | | 14.2 | | | (53) | | (31.7) | | | (2) | | (0.7) |
HELOC - Purchased | | 66 | | (18.1) | | | - | | - | | | - | | - |
Other 1 | | 12 | | (3.1) | | | 12 | | 7.1 | | | 81 | | 29.9 |
Net charge-offs / (recoveries) | $ | (365) | | 100.0 | | $ | 167 | | 100.0 | | $ | 271 | | 100.0 |
| | | | | | | | | | | | | | |
N/M - Not meaningful.
1 Other class includes consumer and overdrafts.
2 Represents the percentage of net charge-offs attributable to each category of loans.
Gross charge-offs for the third quarter of 2020 were $451,000, compared to $406,000 for the second quarter of, 2020, and $397,000 for the third quarter of 2019. Gross recoveries were $816,000 for the third quarter of 2020, compared to $239,000 for the second quarter of 2020 and $126,000 for the third quarter of 2019. Continued recoveries are indicative of the ongoing aggressive efforts by management to effectively manage and resolve prior charge-offs.
Deposits
Total deposits were $2.48 billion at September 30, 2020, an increase of $27.9 million compared to June 30, 2020, resulting from net increases in savings, NOW and money market accounts of $52.4 million, partially offset by a decreases in demand deposits of $1.6 million, and time deposits of $23.0 million. Total deposits increased $404.8 million in the year over year period driven primarily by growth in demand deposits of $245.7 million, and savings, NOW and money market accounts of $181.2 million, partially offset by a decrease in time deposits of $22.2 million.
Borrowings
As of September 30, 2020, we had $6.1 million in other short-term borrowings compared to $8.3 million as of June 30, 2020, and $84.0 million as of September 30, 2019. Due to growth in deposits, our need for short-term funding in 2020 has declined year over year.
We are indebted on senior notes totaling $44.3 million, net of deferred issuance costs, as of September 30, 2020. We are also indebted on $25.8 million of junior subordinated debentures, net of deferred issuance costs, which is related to the trust preferred securities issued by our statutory trust subsidiary, Old Second Capital Trust II. On March 2, 2020, we redeemed the trust preferred securities and related junior subordinated debentures issued by Old Second Capital Trust I, which resulted in a decrease in junior subordinated debentures of $32.0 million. Notes payable and other borrowings totaled $24.5 million as of September 30, 2020, and is comprised of $18.0 million outstanding on a $20.0 million term note we originated to facilitate the redemption of our trust preferred securities and related junior subordinated debentures issued by Old Second Capital Trust I, and $6.5 million of a long-term FHLBC advance acquired in our ABC Bank acquisition that matures on February 2, 2026.
Non-GAAP Presentations: Management has disclosed in this earnings release certain non-GAAP financial measures to evaluate and measure our performance, including the presentation of net interest income and net interest margin on a fully taxable equivalent basis, our efficiency ratio calculations and core net interest margin on a taxable equivalent basis. The net interest margin fully taxable equivalent is calculated by dividing net interest income on a tax equivalent basis by average earning assets for the period. Management believes this measure provides investors with information regarding balance sheet profitability. Consistent with industry practice, management has disclosed the efficiency ratio including and excluding certain items, which is discussed in the noninterest expense presentation on page 7. Our core net interest margin on a taxable equivalent basis excludes the impact of our PPP loans. These non-GAAP financial
11
measures should not be considered as a substitute for GAAP financial measures, and we strongly encourage investors to review the GAAP financial measures included in this earnings release and not to place undue reliance upon any single financial measure. In addition, because non-GAAP financial measures are not standardized, it may not be possible to compare the non-GAAP financial measures presented in this earnings release with other companies’ non-GAAP financial measures having the same or similar names. The tables on page 17 provide a reconciliation of each non-GAAP financial measure to the most comparable GAAP equivalent.
Forward-Looking Statements: This earnings release and statements by our management may contain forward-looking statements within the Private Securities Litigation Reform Act of 1995. Forward looking statements can be identified by words such as “anticipate,” “expect,” “intend,” “believe,” “may,” “likely,” “will” or other statements that indicate future periods. Examples of forward-looking statements include, but are not limited to, statements regarding the economic outlook and our belief that we are well-positioned to capitalize on opportunities with substantial capital flexibility and strong liquidity. Such forward-looking statements are subject to risks, uncertainties, and other factors, which could cause actual results to differ materially from future results expressed or implied by such forward-looking statements. The following factors, among others, could cause actual results to differ materially from the anticipated results or other expectations expressed in the forward-looking statements, (1) the strength of the United States economy in general and the strength of the local economies in which we conduct our operations may be different than expected, including, but not limited to, due to the negative impacts and disruptions resulting from the recent outbreak of the novel coronavirus, or COVID-19, on the economies and communities we serve, which may have an adverse impact on the our business, operations and performance, and could have a negative impact on our credit portfolio, share price, borrowers, and on the economy as a whole, both domestically and globally; (2) the rate of delinquencies and amounts of charge-offs, the level of allowance for credit loss, the rates of loan growth, or adverse changes in asset quality in our loan portfolio, which may result in increased credit risk-related losses and expenses; (3) changes in legislation, regulation, policies, or administrative practices, whether by judicial, governmental, or legislative action, including, but not limited to, the Coronavirus Aid, Relief, and Economic Security Act, or the “CARES Act”; (4) adverse conditions in the stock market, the public debt market and other capital markets (including changes in interest rate conditions) could have a negative impact on us; and (5) changes in interest rates, which may affect our net income, prepayment penalty income, mortgage banking income, and other future cash flows, or the market value of our assets, including our investment securities. Additional risks and uncertainties are contained in the “Risk Factors” and forward-looking statements disclosure in our most recent Annual Report on Form 10-K and Quarterly Reports on Form 10-Q. The inclusion of this forward-looking information should not be construed as a representation by us or any person that future events, plans, or expectations contemplated by us will be achieved. We undertake no obligation to publicly update or revise any forward-looking statements, whether as a result of new information, future events, or otherwise, except as required by law.
Conference Call
We will host an earnings call on Thursday, October 22, 2020, at 11:00 a.m. Eastern Time (10:00 a.m. Central Time). Investors may listen to our earnings call via telephone by dialing 844-369-8770. Investors should call into the dial-in number set forth above at least 10 minutes prior to the scheduled start of the call.
A replay of the earnings call will be available until 11:00 a.m. Eastern Time (10:00 a.m. Central Time) on October 30, 2020, by dialing 877-481-4010, using Conference ID: 37797.
12
Old Second Bancorp, Inc. and Subsidiaries
(In thousands)
| | (unaudited) | | | | |
| | September 30, | | December 31, | ||
|
| 2020 |
| 2019 | ||
Assets | | | | | | |
Cash and due from banks | | $ | 29,489 | | $ | 34,096 |
Interest earning deposits with financial institutions | | | 283,651 | | | 16,536 |
Cash and cash equivalents | | | 313,140 | | | 50,632 |
Securities available-for-sale, at fair value | | | 448,421 | | | 484,648 |
Federal Home Loan Bank Chicago ("FHLBC") and Federal Reserve Bank Chicago ("FRBC") stock | | | 9,917 | | | 9,917 |
Loans held-for-sale | | | 10,229 | | | 3,061 |
Loans | | | 2,030,327 | | | 1,930,812 |
Less: allowance for credit losses on loans | | | 32,918 | | | 19,789 |
Net loans | | | 1,997,409 | | | 1,911,023 |
Premises and equipment, net | | | 44,914 | | | 44,354 |
Other real estate owned | | | 2,686 | | | 5,004 |
Mortgage servicing rights, net | | | 5,010 | | | 5,935 |
Goodwill and core deposit intangible | | | 20,901 | | | 21,275 |
Bank-owned life insurance ("BOLI") | | | 62,222 | | | 61,763 |
Deferred tax assets, net | | | 9,626 | | | 11,459 |
Other assets | | | 50,349 | | | 26,474 |
Total assets | | $ | 2,974,824 | | $ | 2,635,545 |
| | | | | | |
Liabilities | | | | | | |
Deposits: | | | | | | |
Noninterest bearing demand | | $ | 889,085 | | $ | 669,795 |
Interest bearing: | | | | | | |
Savings, NOW, and money market | | | 1,185,731 | | | 1,015,285 |
Time | | | 404,427 | | | 441,669 |
Total deposits | | | 2,479,243 | | | 2,126,749 |
Securities sold under repurchase agreements | | | 59,268 | | | 48,693 |
Other short-term borrowings | | | 6,125 | | | 48,500 |
Junior subordinated debentures | | | 25,773 | | | 57,734 |
Senior notes | | | 44,349 | | | 44,270 |
Notes payable and other borrowings | | | 24,469 | | | 6,673 |
Other liabilities | | | 39,329 | | | 25,062 |
Total liabilities | | | 2,678,556 | | | 2,357,681 |
| | | | | | |
Stockholders’ Equity | | | | | | |
Common stock | | | 34,957 | | | 34,854 |
Additional paid-in capital | | | 121,746 | | | 120,657 |
Retained earnings | | | 228,825 | | | 213,723 |
Accumulated other comprehensive income | | | 11,044 | | | 4,562 |
Treasury stock | | | (100,304) | | | (95,932) |
Total stockholders’ equity | | | 296,268 | | | 277,864 |
Total liabilities and stockholders’ equity | | $ | 2,974,824 | | $ | 2,635,545 |
| | | | | | |
13
Old Second Bancorp, Inc. and Subsidiaries
Consolidated Statements of Income
(In thousands, except share data)
| | | (unaudited) | | (unaudited) | | |||||||
| | Three Months Ended September 30, | | Nine Months Ended September 30, | | ||||||||
|
| 2020 |
| 2019 |
| 2020 |
| 2019 |
| ||||
Interest and dividend income | | | | | | | | | | | | | |
Loans, including fees | | $ | 21,980 | | $ | 25,109 | | $ | 67,924 | | $ | 74,132 | |
Loans held-for-sale | | | 95 | | | 47 | | | 241 | | | 100 | |
Securities: | | | | | | | | | | | | | |
Taxable | | | 1,458 | | | 2,296 | | | 5,315 | | | 6,933 | |
Tax exempt | | | 1,327 | | | 1,719 | | | 4,178 | | | 5,958 | |
Dividends from FHLBC and FRBC stock | | | 118 | | | 154 | | | 366 | | | 459 | |
Interest bearing deposits with financial institutions | | | 68 | | | 119 | | | 185 | | | 344 | |
Total interest and dividend income | | | 25,046 | | | 29,444 | | | 78,209 | | | 87,926 | |
Interest expense | | | | | | | | | | | | | |
Savings, NOW, and money market deposits | | | 299 | | | 724 | | | 1,319 | | | 2,254 | |
Time deposits | | | 1,084 | | | 1,672 | | | 4,292 | | | 4,931 | |
Securities sold under repurchase agreements | | | 28 | | | 135 | | | 167 | | | 431 | |
Other short-term borrowings | | | 24 | | | 429 | | | 167 | | | 1,611 | |
Junior subordinated debentures | | | 285 | | | 933 | | | 1,932 | | | 2,791 | |
Senior notes | | | 673 | | | 682 | | | 2,019 | | | 2,026 | |
Notes payable and other borrowings | | | 144 | | | 89 | | | 439 | | | 312 | |
Total interest expense | | | 2,537 | | | 4,664 | | | 10,335 | | | 14,356 | |
Net interest and dividend income | | | 22,509 | | | 24,780 | | | 67,874 | | | 73,570 | |
Provision for credit losses | | | 300 | | | 550 | | | 10,413 | | | 1,450 | |
Net interest and dividend income after provision for credit losses | | | 22,209 | | | 24,230 | | | 57,461 | | | 72,120 | |
Noninterest income | | | | | | | | | | | | | |
Trust income | | | 1,506 | | | 1,730 | | | 4,702 | | | 4,955 | |
Service charges on deposits | | | 1,322 | | | 2,020 | | | 4,168 | | | 5,841 | |
Secondary mortgage fees | | | 492 | | | 282 | | | 1,267 | | | 621 | |
Mortgage servicing rights mark to market loss | | | (160) | | | (946) | | | (2,739) | | | (2,902) | |
Mortgage servicing income | | | 521 | | | 460 | | | 1,447 | | | 1,408 | |
Net gain on sales of mortgage loans | | | 5,246 | | | 2,074 | | | 12,123 | | | 3,999 | |
Securities (losses) gains, net | | | (1) | | | 3,463 | | | (25) | | | 4,476 | |
Change in cash surrender value of BOLI | | | 459 | | | 267 | | | 942 | | | 1,045 | |
Death benefit realized on BOLI | | | (2) | | | - | | | 57 | | | - | |
Card related income | | | 1,499 | | | 1,595 | | | 4,097 | | | 4,433 | |
Other income | | | 803 | | | 988 | | | 2,663 | | | 2,682 | |
Total noninterest income | | | 11,685 | | | 11,933 | | | 28,702 | | | 26,558 | |
Noninterest expense | | | | | | | | | | | | | |
Salaries and employee benefits | | | 12,586 | | | 12,062 | | | 36,846 | | | 35,261 | |
Occupancy, furniture and equipment | | | 2,003 | | | 2,235 | | | 6,239 | | | 6,149 | |
Computer and data processing | | | 1,226 | | | 1,490 | | | 3,808 | | | 4,346 | |
FDIC insurance | | | 191 | | | (114) | | | 403 | | | 176 | |
General bank insurance | | | 281 | | | 270 | | | 764 | | | 756 | |
Amortization of core deposit intangible | | | 122 | | | 157 | | | 374 | | | 410 | |
Advertising expense | | | 62 | | | 360 | | | 228 | | | 975 | |
Card related expense | | | 566 | | | 531 | | | 1,612 | | | 1,360 | |
Legal fees | | | 169 | | | 111 | | | 476 | | | 480 | |
Other real estate expense, net | | | 125 | | | 26 | | | 505 | | | 324 | |
Other expense | | | 2,935 | | | 2,826 | | | 8,909 | | | 9,037 | |
Total noninterest expense | | | 20,266 | | | 19,954 | | | 60,164 | | | 59,274 | |
Income before income taxes | | | 13,628 | | | 16,209 | | | 25,999 | | | 39,404 | |
Provision for income taxes | | | 3,363 | | | 4,036 | | | 6,221 | | | 9,485 | |
Net income | | $ | 10,265 | | $ | 12,173 | | $ | 19,778 | | $ | 29,919 | |
| | | | | | | | | | | | | |
Basic earnings per share | | $ | 0.35 | | $ | 0.41 | | $ | 0.67 | | $ | 1.00 | |
Diluted earnings per share | | | 0.34 | | | 0.40 | | | 0.65 | | | 0.98 | |
Dividends declared per share | | | 0.01 | | | 0.01 | | | 0.03 | | | 0.03 | |
| | | | | | | | |
Ending common shares outstanding | | 29,451,585 | | 29,903,154 | | 29,451,585 | | 29,903,154 |
Weighted-average basic shares outstanding | | 29,559,026 | | 29,899,063 | | 29,708,239 | | 29,880,511 |
Weighted-average diluted shares outstanding | | 30,102,301 | | 30,438,333 | | 30,261,721 | | 30,390,965 |
14
Old Second Bancorp, Inc. and Subsidiaries
Quarterly Consolidated Average Balance
(In thousands, unaudited)
| | | 2019 | | 2020 | | ||||||||||||||||
Assets |
| 1st Qtr |
| 2nd Qtr |
| 3rd Qtr |
| 4th Qtr |
| 1st Qtr |
| 2nd Qtr |
| 3rd Qtr | | |||||||
Cash and due from banks | | $ | 33,749 | | $ | 33,618 | | $ | 34,315 | | $ | 34,417 | | $ | 32,549 | | $ | 30,594 | | $ | 31,354 | |
Interest earning deposits with financial institutions | | | 18,842 | | | 19,053 | | | 21,425 | | | 27,720 | | | 27,989 | | | 153,532 | | | 263,199 | |
Cash and cash equivalents | | | 52,591 | | | 52,671 | | | 55,740 | | | 62,137 | | | 60,538 | | | 184,126 | | | 294,553 | |
| | | | | | | | | | | | | | | | | | | | | | |
Securities available-for-sale, at fair value | | | 513,491 | | | 520,006 | | | 494,050 | | | 485,802 | | | 475,718 | | | 452,708 | | | 448,408 | |
FHLBC and FRBC stock | | | 11,463 | | | 11,317 | | | 10,398 | | | 9,763 | | | 9,917 | | | 9,917 | | | 9,917 | |
Loans held-for-sale | | | 1,853 | | | 2,870 | | | 4,462 | | | 3,441 | | | 3,623 | | | 13,978 | | | 13,384 | |
Loans | | | 1,893,659 | | | 1,894,454 | | | 1,890,992 | | | 1,899,849 | | | 1,941,760 | | | 2,038,082 | | | 2,035,584 | |
Less: allowance for credit losses on loans | | | 19,235 | | | 19,435 | | | 19,452 | | | 20,063 | | | 23,507 | | | 30,747 | | | 31,518 | |
Net loans | | | 1,874,424 | | | 1,875,019 | | | 1,871,540 | | | 1,879,786 | | | 1,918,253 | | | 2,007,335 | | | 2,004,066 | |
| | | | | | | | | | | | | | | | | | | | | | |
Premises and equipment, net | | | 42,270 | | | 42,271 | | | 42,754 | | | 43,614 | | | 44,613 | | | 44,658 | | | 44,802 | |
Other real estate owned | | | 6,779 | | | 6,012 | | | 5,427 | | | 4,961 | | | 5,127 | | | 5,040 | | | 3,087 | |
Mortgage servicing rights, net | | | 7,334 | | | 6,551 | | | 5,578 | | | 5,447 | | | 5,053 | | | 4,451 | | | 4,645 | |
Goodwill and core deposit intangible | | | 21,747 | | | 21,618 | | | 21,476 | | | 21,337 | | | 21,208 | | | 21,084 | | | 20,960 | |
Bank-owned life insurance ("BOLI") | | | 61,661 | | | 62,124 | | | 62,445 | | | 62,259 | | | 61,873 | | | 61,790 | | | 61,897 | |
Deferred tax assets, net | | | 20,878 | | | 16,458 | | | 13,750 | | | 12,738 | | | 9,682 | | | 13,511 | | | 12,051 | |
Other assets | | | 21,098 | | | 19,041 | | | 20,820 | | | 22,893 | | | 25,156 | | | 36,771 | | | 37,786 | |
Total other assets | | | 181,767 | | | 174,075 | | | 172,250 | | | 173,249 | | | 172,712 | | | 187,305 | | | 185,228 | |
Total assets | | $ | 2,635,589 | | $ | 2,635,958 | | $ | 2,608,440 | | $ | 2,614,178 | | $ | 2,640,761 | | $ | 2,855,369 | | $ | 2,955,556 | |
| | | | | | | | | | | | | | | | | | | | | | |
Liabilities | | | | | | | | | | | | | | | | | | | | | | |
Deposits: | | | | | | | | | | | | | | | | | | | | | | |
Noninterest bearing demand | | $ | 625,423 | | $ | 645,580 | | $ | 651,863 | | $ | 678,136 | | $ | 676,755 | | $ | 854,324 | | $ | 892,811 | |
Interest bearing: | | | | | | | | | | | | | | | | | | | | | | |
Savings, NOW, and money market | | | 1,055,563 | | | 1,044,950 | | | 1,011,717 | | | 1,010,948 | | | 1,025,511 | | | 1,097,003 | | | 1,156,194 | |
Time | | | 445,076 | | | 422,975 | | | 420,429 | | | 437,236 | | | 448,763 | | | 439,735 | | | 417,952 | |
Total deposits | | | 2,126,062 | | | 2,113,505 | | | 2,084,009 | | | 2,126,320 | | | 2,151,029 | | | 2,391,062 | | | 2,466,957 | |
| | | | | | | | | | | | | | | | | | | | | | |
Securities sold under repurchase agreements | | | 45,157 | | | 44,184 | | | 40,342 | | | 45,146 | | | 47,825 | | | 45,882 | | | 54,313 | |
Other short-term borrowings | | | 98,328 | | | 93,369 | | | 75,310 | | | 28,772 | | | 23,069 | | | 8,396 | | | 8,204 | |
Junior subordinated debentures | | | 57,692 | | | 57,704 | | | 57,716 | | | 57,728 | | | 47,200 | | | 25,773 | | | 25,773 | |
Senior Notes | | | 44,171 | | | 44,196 | | | 44,222 | | | 44,258 | | | 44,284 | | | 44,310 | | | 44,337 | |
Notes payable and other borrowings | | | 15,273 | | | 13,101 | | | 10,973 | | | 8,768 | | | 14,762 | | | 26,551 | | | 25,482 | |
Other liabilities | | | 13,750 | | | 19,586 | | | 30,329 | | | 28,026 | | | 28,490 | | | 39,613 | | | 39,589 | |
Total liabilities | | | 2,400,433 | | | 2,385,645 | | | 2,342,901 | | | 2,339,018 | | | 2,356,659 | | | 2,581,587 | | | 2,664,655 | |
| | | | | | | | | | | | | | | | | | | | | | |
Stockholders' equity | | | | | | | | | | | | | | | | | | | | | | |
Common stock | | | 34,775 | | | 34,825 | | | 34,825 | | | 34,845 | | | 34,900 | | | 34,957 | | | 34,957 | |
Additional paid-in capital | | | 119,051 | | | 119,381 | | | 120,076 | | | 120,517 | | | 120,829 | | | 121,253 | | | 121,643 | |
Retained earnings | | | 180,398 | | | 188,453 | | | 199,228 | | | 209,942 | | | 215,467 | | | 216,183 | | | 224,405 | |
Accumulated other comprehensive (loss) income | | | (3,102) | | | 3,705 | | | 7,417 | | | 5,806 | | | 9,131 | | | 219 | | | 9,305 | |
Treasury stock | | | (95,966) | | | (96,051) | | | (96,007) | | | (95,950) | | | (96,225) | | | (98,830) | | | (99,409) | |
Total stockholders' equity | | | 235,156 | | | 250,313 | | | 265,539 | | | 275,160 | | | 284,102 | | | 273,782 | | | 290,901 | |
Total liabilities and stockholders' equity | | $ | 2,635,589 | | $ | 2,635,958 | | $ | 2,608,440 | | $ | 2,614,178 | | $ | 2,640,761 | | $ | 2,855,369 | | $ | 2,955,556 | |
| | | | | | | | | | | | | | | | | | | | | | |
Total Earning Assets | | $ | 2,439,308 | | $ | 2,447,700 | | $ | 2,421,327 | | $ | 2,426,575 | | $ | 2,459,007 | | $ | 2,668,217 | | $ | 2,770,492 | |
Total Interest Bearing Liabilities | | | 1,761,260 | | | 1,720,479 | | | 1,660,709 | | | 1,632,856 | | | 1,651,414 | | | 1,687,650 | | | 1,732,255 | |
15
Old Second Bancorp, Inc. and Subsidiaries
Quarterly Consolidated Statements of Income
(In thousands, except per share data, unaudited)
| | | | | | | | | | | | | | | | | | | | | | |
| | 2019 | | 2020 | ||||||||||||||||||
|
| 1st Qtr |
| 2nd Qtr |
| 3rd Qtr |
| 4th Qtr |
| 1st Qtr |
| 2nd Qtr |
| 3rd Qtr | | |||||||
Interest and Dividend Income | | | | | | | | | | | | | | | | | | | | | | |
Loans, including fees | | $ | 24,099 | | $ | 24,924 | | $ | 25,109 | | $ | 23,587 | | $ | 23,597 | | $ | 22,347 | | $ | 21,980 | |
Loans held-for-sale | | | 22 | | | 31 | | | 47 | | | 33 | | | 36 | | | 110 | | | 95 | |
Securities: | | | | | | | | | | | | | | | | | | | | | | |
Taxable | | | 2,414 | | | 2,223 | | | 2,296 | | | 2,323 | | | 2,163 | | | 1,694 | | | 1,458 | |
Tax exempt | | | 2,098 | | | 2,141 | | | 1,719 | | | 1,467 | | | 1,455 | | | 1,396 | | | 1,327 | |
Dividends from FHLB and FRBC stock | | | 149 | | | 156 | | | 154 | | | 143 | | | 125 | | | 123 | | | 118 | |
Interest bearing deposits with financial institutions | | | 114 | | | 111 | | | 119 | | | 115 | | | 75 | | | 42 | | | 68 | |
Total interest and dividend income | | | 28,896 | | | 29,586 | | | 29,444 | | | 27,668 | | | 27,451 | | | 25,712 | | | 25,046 | |
Interest Expense | | | | | | | | | | | | | | | | | | | | | | |
Savings, NOW, and money market deposits | | | 771 | | | 759 | | | 724 | | | 706 | | | 635 | | | 385 | | | 299 | |
Time deposits | | | 1,618 | | | 1,641 | | | 1,672 | | | 1,805 | | | 1,766 | | | 1,442 | | | 1,084 | |
Securities sold under repurchase agreements | | | 149 | | | 147 | | | 135 | | | 146 | | | 116 | | | 23 | | | 28 | |
Other short-term borrowings | | | 607 | | | 575 | | | 429 | | | 144 | | | 109 | | | 34 | | | 24 | |
Junior subordinated debentures | | | 927 | | | 931 | | | 933 | | | 933 | | | 1,364 | | | 283 | | | 285 | |
Senior notes | | | 672 | | | 672 | | | 682 | | | 673 | | | 673 | | | 673 | | | 673 | |
Notes payable and other borrowings | | | 116 | | | 107 | | | 89 | | | 72 | | | 130 | | | 165 | | | 144 | |
Total interest expense | | | 4,860 | | | 4,832 | | | 4,664 | | | 4,479 | | | 4,793 | | | 3,005 | | | 2,537 | |
Net interest and dividend income | | | 24,036 | | | 24,754 | | | 24,780 | | | 23,189 | | | 22,658 | | | 22,707 | | | 22,509 | |
Provision for credit losses | | | 450 | | | 450 | | | 550 | | | 150 | | | 7,984 | | | 2,129 | | | 300 | |
Net interest and dividend income after provision for credit losses | | | 23,586 | | | 24,304 | | | 24,230 | | | 23,039 | | | 14,674 | | | 20,578 | | | 22,209 | |
Noninterest Income | | | | | | | | | | | | | | | | | | | | | | |
Trust income | | | 1,486 | | | 1,739 | | | 1,730 | | | 1,700 | | | 1,532 | | | 1,664 | | | 1,506 | |
Service charges on deposits | | | 1,862 | | | 1,959 | | | 2,020 | | | 1,874 | | | 1,726 | | | 1,120 | | | 1,322 | |
Secondary mortgage fees | | | 136 | | | 203 | | | 282 | | | 151 | | | 270 | | | 505 | | | 492 | |
Mortgage servicing rights mark to market (loss) gain | | | (819) | | | (1,137) | | | (946) | | | 240 | | | (2,134) | | | (445) | | | (160) | |
Mortgage servicing income | | | 457 | | | 491 | | | 460 | | | 473 | | | 468 | | | 458 | | | 521 | |
Net gain on sales of mortgage loans | | | 762 | | | 1,163 | | | 2,074 | | | 1,113 | | | 2,246 | | | 4,631 | | | 5,246 | |
Securities gains (losses)-, net | | | 27 | | | 986 | | | 3,463 | | | 35 | | | (24) | | | - | | | (1) | |
Change in cash surrender value of BOLI | | | 458 | | | 320 | | | 267 | | | 370 | | | (49) | | | 532 | | | 459 | |
Death benefit realized on BOLI | | | - | | | - | | | - | | | 872 | | | - | | | 59 | | | (2) | |
Card related income | | | 1,285 | | | 1,552 | | | 1,595 | | | 1,428 | | | 1,287 | | | 1,311 | | | 1,499 | |
Other income | | | 828 | | | 867 | | | 988 | | | 986 | | | 1,000 | | | 860 | | | 803 | |
Total noninterest income | | | 6,482 | | | 8,143 | | | 11,933 | | | 9,242 | | | 6,322 | | | 10,695 | | | 11,685 | |
Noninterest Expense | | | | | | | | | | | | | | | | | | | | | | |
Salaries and employee benefits | | | 11,612 | | | 11,587 | | | 12,062 | | | 11,608 | | | 12,918 | | | 11,342 | | | 12,586 | |
Occupancy, furniture and equipment | | | 1,989 | | | 1,925 | | | 2,235 | | | 2,140 | | | 2,301 | | | 1,935 | | | 2,003 | |
Computer and data processing | | | 1,332 | | | 1,524 | | | 1,490 | | | 1,285 | | | 1,335 | | | 1,247 | | | 1,226 | |
FDIC insurance | | | 174 | | | 116 | | | (114) | | | - | | | 57 | | | 155 | | | 191 | |
General bank insurance | | | 250 | | | 236 | | | 270 | | | 246 | | | 246 | | | 237 | | | 281 | |
Amortization of core deposit intangible | | | 132 | | | 121 | | | 157 | | | 129 | | | 128 | | | 124 | | | 122 | |
Advertising expense | | | 234 | | | 381 | | | 360 | | | 250 | | | 109 | | | 57 | | | 62 | |
Card related expense | | | 355 | | | 474 | | | 531 | | | 596 | | | 532 | | | 514 | | | 566 | |
Legal fees | | | 126 | | | 243 | | | 111 | | | 195 | | | 131 | | | 176 | | | 169 | |
Other real estate expense, net | | | 50 | | | 248 | | | 26 | | | 99 | | | 237 | | | 143 | | | 125 | |
Other expense | | | 2,940 | | | 3,271 | | | 2,826 | | | 3,280 | | | 3,008 | | | 2,966 | | | 2,935 | |
Total noninterest expense | | | 19,194 | | | 20,126 | | | 19,954 | | | 19,828 | | | 21,002 | | | 18,896 | | | 20,266 | |
Income (loss) before income taxes | | | 10,874 | | | 12,321 | | | 16,209 | | | 12,453 | | | (6) | | | 12,377 | | | 13,628 | |
Provision for (benefit from) income taxes | | | 2,406 | | | 3,043 | | | 4,036 | | | 2,917 | | | (281) | | | 3,139 | | | 3,363 | |
Net income | | $ | 8,468 | | $ | 9,278 | | $ | 12,173 | | $ | 9,536 | | $ | 275 | | $ | 9,238 | | $ | 10,265 | |
| | | | | | | | | | | | | | | | | | | | | | |
Basic earnings per share | | $ | 0.28 | | $ | 0.31 | | $ | 0.41 | | $ | 0.32 | | $ | 0.01 | | $ | 0.31 | | $ | 0.35 | |
Diluted earnings per share | | | 0.28 | | | 0.31 | | | 0.40 | | | 0.31 | | | 0.01 | | | 0.31 | | | 0.34 | |
Dividends paid per share | | | 0.01 | | | 0.01 | | | 0.01 | | | 0.01 | | | 0.01 | | | 0.01 | | | 0.01 | |
16
Reconciliation of Non-GAAP Financial Measures
The tables below provide a reconciliation of each non-GAAP financial measure to the most comparable GAAP measure for the periods indicated. Dollar amounts below in thousands:
| | Quarters Ended | | |||||||
| | September 30, | | June 30, | | September 30, | | |||
|
| 2020 |
| 2020 | | 2019 | | |||
Net Interest Margin | | | | | | | | | | |
Interest income (GAAP) | | $ | 25,046 | | $ | 25,712 | | $ | 29,444 | |
Taxable-equivalent adjustment: | | | | | | | | | | |
Loans | | | 3 | | | 3 | | | 3 | |
Securities | | | 353 | | | 371 | | | 457 | |
Interest income (TE) | | | 25,402 | | | 26,086 | | | 29,904 | |
Interest expense (GAAP) | | | 2,537 | | | 3,005 | | | 4,664 | |
Net interest income (TE) | | $ | 22,865 | | $ | 23,081 | | $ | 25,240 | |
Paycheck Protection Program ("PPP") loan - interest and fee income | | | 736 | | | 603 | | | NA | |
Net interest income (TE) - excluding PPP loans | | $ | 22,129 | | | 22,478 | | | NA | |
Net interest income (GAAP) | | $ | 22,509 | | $ | 22,707 | | $ | 24,780 | |
Average interest earning assets | | $ | 2,770,492 | | $ | 2,668,217 | | $ | 2,421,327 | |
Average PPP loans | | $ | 136,281 | | $ | 90,447 | | | N/A | |
Average interest earning assets, excluding PPP loans | | $ | 2,634,211 | | $ | 2,577,770 | | | N/A | |
Net interest margin (GAAP) | | | 3.23 | % | | 3.42 | % | | 4.06 | % |
Net interest margin (TE) | | | 3.28 | % | | 3.48 | % | | 4.14 | % |
Core net interest margin (TE - excluding PPP loans) | | | 3.34 | % | | 3.51 | % | | N/A | |
| | GAAP | | Non-GAAP | | ||||||||||||||
| | | Three Months Ended | | | Three Months Ended | | ||||||||||||
| | September 30, | | June 30, | | September 30, | | September 30, | | June 30, | | September 30, | | ||||||
| | 2020 | | 2020 | | 2019 | | 2020 | | 2020 | | 2019 | | ||||||
Efficiency Ratio / Adjusted Efficiency Ratio | | | | | | | | | | | | | | | | | | | |
(Dollars in thousands) | | | | | | | | | | | | | | | | | | | |
| | | | | | | | | | | | | | | | | | | |
Noninterest expense | | $ | 20,266 | | $ | 18,896 | | $ | 19,954 | | $ | 20,266 | | $ | 18,896 | | $ | 19,954 | |
Less amortization of core deposit | | | 122 | | | 124 | | | 157 | | | 122 | | | 124 | | | 157 | |
Less other real estate expense, net | | | 125 | | | 143 | | | 26 | | | 125 | | | 143 | | | 26 | |
Noninterest expense less adjustments | | $ | 20,019 | | $ | 18,629 | | $ | 19,771 | | $ | 20,019 | | $ | 18,629 | | $ | 19,771 | |
| | | | | | | | | | | | | | | | | | | |
Net interest income | | $ | 22,509 | | $ | 22,707 | | $ | 24,780 | | $ | 22,509 | | $ | 22,707 | | $ | 24,780 | |
Taxable-equivalent adjustment: | | | | | | | | | | | | | | | | | | | |
Loans | | | N/A | | | N/A | | | N/A | | | 3 | | | 3 | | | 3 | |
Securities | | | N/A | | | N/A | | | N/A | | | 353 | | | 371 | | | 457 | |
Net interest income including adjustments | | | 22,509 | | | 22,707 | | | 24,780 | | | 22,865 | | | 23,081 | | | 25,240 | |
Noninterest income | | | 11,685 | | | 10,695 | | | 11,933 | | | 11,685 | | | 10,695 | | | 11,933 | |
Less death benefit related to BOLI | | | (2) | | | 59 | | | - | | | (2) | | | 59 | | | - | |
Less securities (losses) gains, net | | | (1) | | | - | | | 3,463 | | | (1) | | | - | | | 3,463 | |
Less MSRs mark to market loss | | | (160) | | | (445) | | | (946) | | | (160) | | | (445) | | | (946) | |
Taxable-equivalent adjustment: | | | | | | | | | | | | | | | | | | | |
Change in cash surrender value of BOLI | | | N/A | | | N/A | | | N/A | | | 122 | | | 157 | | | 71 | |
Noninterest income (less) / including adjustments | | | 11,848 | | | 11,081 | | | 9,416 | | | 11,970 | | | 11,238 | | | 9,487 | |
| | | | | | | | | | | | | | | | | | | |
Net interest income including adjustments plus noninterest income (less) / including adjustments | | $ | 34,357 | | $ | 33,788 | | $ | 34,196 | | $ | 34,835 | | $ | 34,319 | | $ | 34,727 | |
Efficiency ratio / Adjusted efficiency ratio | | | 58.27 | % | | 55.13 | % | | 57.82 | % | | 57.47 | % | | 54.28 | % | | 56.93 | % |
17
Exhibit 99.2
| Old Second Bancorp, Inc. Loan Portfolio Disclosures As of June 30, 2020 |
| Loan Portfolio Composition Loan Portfolio Characteristics Balance Outstanding (000’s) $2,052,336 Total Commitment (000’s) $2,539,355 Average Loan Commitment $352,024 Number of Payment Deferrals /Modifications 449 Payment Modification Rate (% of Total Commitment)* 9.03% Loan Portfolio Characteristics • Lending focused on full relationship, small and middle market businesses • Well diversified by industry with minimal exposure to high risk industries • Repayment analysis based on primary operating cash flow, supported by secondary and tertiary repayment sources • Full global cash flow and sensitivity analysis performed on all relationships over $1 million in exposure • Dedicated Leasing, C&I, CRE, Healthcare and Professional Service lending teams Commercial & Industrial 28% Construction 6% CRE Investor 21% CRE Owner- Occupied Farm Land 13% 1% Residential Investor 3% Residential Owner-Occupied 5% HELOC 10% Leasing 5% Multifamily 8% Loan Type IL 81% CA 2% NY 2% WI 4% MI 2% MA 1% Other States 8% Geography* *Based on primary property collateral if available, otherwise borrower address. *Excludes $133.89 million in PPP loans |
| Commercial and Industrial (includes Leasing) Commercial and Industrial Portfolio Characteristics Balance Outstanding (000’s) $574,935 Total Commitment (000’s) $838,075 Average Loan Commitment $351,247 Number of Payment Deferrals /Modifications 164 Payment Modification Rate (% of Total Commitment)* 6.16%* Weighted Average Seasoning 3.50 years Commercial and Industrial Portfolio Characteristics • Lending focused on full relationship, small and middle market businesses • Well diversified by industry with limited exposure to Accommodation and Food Services and Entertainment industries • Repayment analysis based on primary operating cash flow, supported by secondary and tertiary repayment sources • Full global cash flow and sensitivity analysis performed on all relationships over $1 million in exposure • Dedicated Leasing, C&I, Healthcare and Professional Service lending teams • Modest exposure to syndicated or leveraged loans DuPage County (IL) 11% Kane County (IL) 26% Kendall County (IL) 2% Cook County (IL) 23% Will County (IL) 7% IL Other 2% CA 2% MA 3% MI 3% NY 6% TX 2% WI 2% Other States 11% Geography* *Based on primary property collateral if available, otherwise borrower address. Accomodation and Food Services 2% Agriculture 3% Health Care 8% Information and Finance 13% Manufacturing 18% Administration and Support 2% Construction 15% Other Services 2% Professional Services 6% Rental and Leasing 7% Retail Trade 4% Transportation and Warehousing 6% Wholesale Trade 13% Industry *Excludes $133.89 million in PPP loans |
| CRE Owner-Occupied CRE Owner-Occupied Portfolio Characteristics Balance Outstanding (000’s) $343,982 Total Commitment (000’s) $357,453 Average Loan Commitment $549,928 Number of Payment Deferrals /Modifications 72 Payment Modification Rate (% of Total Commitment) 15.97% Weighted Average Seasoning 6.13 years Commercial and Industrial Portfolio Characteristics • Lending focused on full relationship, small and middle market businesses • Well diversified by industry with limited exposure to the Accommodation and Food Service and Entertainment industries • Repayment analysis based on primary operating cash flow, supported by secondary and tertiary repayment sources • Full global cash flow and sensitivity analysis performed on all relationships over $1 million in exposure • Dedicated C&I, Healthcare and Professional Service lending teams DuPage County (IL) 14% Kane County (IL) 28% Kendall County (IL) 5% Cook County (IL) 32% Will County (IL) 17% IL Other 2% Out of State 2% Geography* *Based on primary property collateral if available, otherwise borrower address. Accomodation and Food Services 3% Agriculture 3% Entertainment 7% Education 3% Health Care 9% Information and Finance 1% Manufacturing 10% Administration and Support 1% Construction 4% Other Services 23% Professional Services 4% Rental and Leasing 9% Retail Trade 18% Transportation and Warehousing 1% Wholesale Trade 3% Industry |
| CRE Investor (includes Multifamily) CRE Investor Portfolio Characteristics Balance Outstanding (000’s) $723,235 Total Commitment (000’s) $735,069 Average Loan Commitment $1,287,336 Number of Payment Deferrals /Modifications 56 Payment Modification Rate (% of Total Commitment) 11.22% Weighted Average Seasoning 4.41 years CRE Investor Portfolio Characteristics • Lending focused on full relationship and strong sponsorship • Well diversified by property type with limited exposure to high-risk real estate sectors (Hotel, Restaurant, Recreational and “Big Box” Retail) • Repayment analysis based on strong net operating income, supported by secondary and tertiary repayment sources • Full global cash flow and sensitivity analysis performed on all relationships over $1 million in exposure • Secured by seasoned properties with stabilized cash flow • Dedicated CRE and Healthcare lending teams Hotel 2% Industrial 13% Medical Office 2% Mini Storage 2% Mixed-Use 3% Office 16% Restaurant 2% Retail 15% Senior Housing 14% Multifamily 27% National Drugstore Chain 4% CRE Type DuPage County (IL) 12% Kane County (IL) 8% Cook County (IL) 47% Will County (IL) 7% IL Other 5% WI 8% MI 3% OH 2% CA 2% Other States 6% Geography* *Based on primary property collateral if available, otherwise borrower address. |
| CRE Non-Owner Occupied (excludes Multifamily) CRE Non-Owner Occupied Portfolio Characteristics Balance Outstanding (000’s) $525,714 Total Commitment (000’s) $535,551 Average Loan Commitment $1,525,785 Number of Payment Deferrals /Modifications 40 Payment Modification Rate (% of Total Commitment) 13.84% Weighted Average Seasoning 4.34 years CRE Non-Owner Occupied Portfolio Characteristics • Lending focused on full relationship and strong sponsorship with full recourse • Well diversified by property type with limited exposure to high-risk real estate sectors (Hotels, Restaurants, Recreational, “Big Box” Retail) • Repayment analysis based on strong net operating income, supported by secondary and tertiary repayment sources • Full global cash flow and sensitivity analysis performed on all relationships over $1 million in exposure • Secured by seasoned properties with stabilized cash flow • Dedicated CRE and Healthcare lending teams DuPage County (IL) 16% Kane County (IL) 9% Cook County (IL) 38% Will County (IL) 8% IL Other 5% CA 3% CT 2% IN 2% MI 3% OH 3% WI 7% Other States 4% Geography* *Based on primary property collateral if available, otherwise borrower address. Hotel 3% Industrial 24% Medical Office 4% Mini Storage 4% Mixed-Use 5% Office 29% Restaurant 3% Retail 27% CRE Type |
| CRE Non-Owner Occupied Retail CRE Non-Owner Occupied Retail Portfolio Characteristics Balance Outstanding (000’s) $109,284 Total Commitment (000’s) $110,536 Average Loan Commitment $1,300,425 Number of Payment Deferrals /Modifications 15 Payment Modification Rate (% of Total Commitment) 33.89% Weighted Average Seasoning 6.46 years CRE Non-Owner Occupied Retail Portfolio Characteristics • Lending focused on full relationship and strong sponsorship with full recourse • Limited exposure to “Big Box” Retail • Repayment based on strong net operating income, supported by secondary and tertiary repayment sources • Full global cash flow and sensitivity analysis performed on all relationships over $1 million in exposure • Secured by seasoned properties with stabilized cash flow • Dedicated CRE lending head Retail Strip, No Anchor 31% Retail "Big Box" 14% Retail "Mid Box" 5% Retail, Anchored 19% Retail "Small Box" 31% Retail Type DuPage County (IL) 14% Kane County (IL) 16% Cook County (IL) 35% Will County (IL) 9% IL Other 9% WI 14% GA 3% Geography* *Based on primary property collateral if available, otherwise borrower address. |
| CRE Non-Owner Occupied Office CRE Non-Owner Occupied Office Portfolio Characteristics Balance Outstanding (000’s) $114,953 Total Commitment (000’s) $118,127 Average Loan Commitment $1,618,172 Number of Payment Deferrals /Modifications 7 Payment Modification Rate (% of Total Commitment) 11.03% Weighted Average Seasoning 4.04 years CRE Non-Owner Occupied Office Portfolio Characteristics • Lending focused on full relationship and strong sponsorship with full recourse • No exposure to downtown high-rise Office • Repayment based on strong net operating income, supported by secondary and tertiary repayment sources • Full global cash flow and sensitivity analysis performed on all relationships over $1 million in exposure • Secured by seasoned properties with stabilized cash flow • Dedicated CRE lending head > 50,000 SF 49% 5,000 - 50,000 SF 4% < 5,000 SF 47% Office Property Size DuPage County (IL) 15% Kane County (IL) 9% Cook County (IL) 57% Will County (IL) 15% IL Other 2% Other States 2% Geography* *Based on primary property collateral if available, otherwise borrower address. |
| Multifamily Multifamily Portfolio Characteristics Balance Outstanding (000’s) $197,521 Total Commitment (000’s) $199,519 Average Loan Commitment $906,902 Number of Payment Deferrals /Modifications 16 Payment Modification Rate (% of Total Commitment) 4.34% Weighted Average Seasoning 4.60 years Multifamily Portfolio Characteristics • Lending focused on full relationship and strong sponsorship • No exposure to downtown high-rise Multifamily • Repayment analysis based on strong net operating income, supported by secondary and tertiary repayment sources • Full global cash flow and sensitivity analysis performed on all relationships over $1 million in exposure • Dedicated CRE head • 88% of multifamily loans are secured by real estate in Illinois • Limited non-recourse lending reflects stabilized properties with consistently strong operating results DuPage County (IL) 2% Kane County (IL) 7% Cook County (IL) 72% DeKalb County (IL) 3% IL Other 4% WI 11% Other States 1% Geography* *Based on primary property collateral if available, otherwise borrower address. |
| Construction and Land Development C&D Portfolio Characteristics Balance Outstanding (000’s) $83,939 Total Commitment (000’s) $155,968 Average Loan Commitment $1,624,662 Number of Payment Deferrals /Modifications 2 Payment Modification Rate (% of Total Commitment 1.47% Weighted Average Seasoning 1.60 years C&D Portfolio Characteristics • Lending focused on strong sponsorship with full recourse • Well diversified by property type with limited exposure to high-risk real estate (i.e. Hotel, Recreational, “Big Box” Retail, large scale land development) • Minimum of 25% hard equity required on all projects • Full global cash flow and sensitivity analysis performed on all relationships over $1 million in exposure • Internal funding controls to monitor projects with consistent site inspection Industrial 1% Land 10% Mixed-Use 14% Multifamily 15% Office 7% Recreational 1% Residential 17% Retail 22% Owner-Occupied 13% Property Type DuPage County (IL) 21% Kane County (IL) 5% Cook County (IL) 39% Lake County (IL) 5% Will County (IL) 5% IL Other 3% WI 10% MN 3% IN 9% Geography* *Based on primary property collateral if available, otherwise borrower address. |
| Payment Modifications Payment Modifications Balance Outstanding (000’s) $216,381 Total Commitment (000’s) $217,188 Average Loan Commitment $483,715 Number of Payment Deferrals /Modifications 449 Payment Modification Rate (% of Total Commitment) 9.03%* Payment Modifications • Adopted regulatory and accounting guidance to establish COVID-19 modification program for retail and commercial borrowers in March • Approximately one third of all payment modifications are interest only, while two thirds are full payment deferral or require a modest payment that would otherwise not cover interest • 85% of payment modifications are for a term of 90 days or less, the remainder are for 120 days or 180 days Payment Deferral Interest Only 55% 32% Payment Modification 13% Modification Type *Five CRE Non-Owner Occupied Retail loans totaling $17.98 million requested payment deferral, but have been making full payments. Excluding these borrowers would reduce the Payment Modification Rate to 8.28% and reduce the % of CRE Non-Owner Occupied payment modifications from 34% to 28% of total modifications. Commercial & Industrial 20% CRE Owner-Occupied 26% CRE Non-Owner Occupied 34% Multifamily 4% Construction 1% HELOC 3% 1-4 Family Closed- End 12% Modifications by Loan Type |
| Payment Modifications Continued • Processed first COVID payment modification in late March and a total of 449 COVID payment modifications through June 30, 2020. • The payment modification requests has abated since the end of May with a total of 42 modifications in progress through June 30, 2020. • Less than 40% of Commercial (C&I, CRE Owner-Occupied, CRE Investor) payment modifications are expected to be extended to 6 months based on early indications from borrowers currently in payment modification arrangements. March April May June % of Total Portfolio 0.09% 4.26% 7.24% 9.03% Construction $- $- $2,599,983 $2,599,983 C&I and Leasing $2,031,669 $23,559,117 $30,403,990 $43,368,509 CRE Owner-Occ. $- $32,729,791 $46,889,418 $57,072,438 CRE Non-Owner $- $24,354,261 $61,894,016 $74,102,754 Multifamily $- $2,805,085 $6,660,132 $8,651,255 Residential and Consumer $- $20,620,675 $28,385,785 $31,392,682 $- $50,000,000 $100,000,000 $150,000,000 $200,000,000 $250,000,000 Payment Modification Trends |
| Payment Modifications Continued Loan Portfolio Total Portfolio Commitment (000’s) % of Total Commitment (000’s) Total Commitment Deferred (000’s) % of Total Portfolio Deferred Weighted LTV CRE-secured Deferred Loans Commercial & Industrial (inc. Leasing) $704,183* 28.22% $43,369 6.16% NA Construction Industry $123,129 4.85% $7,963 6.47% NA Transportation Industry $50,887 2.00% $10,320 20.28% NA Bars & Restaurants $12,316 0.49% $3,759 30.52% NA Day Care Providers $4,119 0.16% $1,775 43.09% NA Real Estate & Leasing $60,615 2.39% $5,000 8.25% NA CRE Owner-Occupied $357,453 14.08% $57,072 15.97% 64% Religious Organizations $60,892 2.40% $18,171 29.84% 67% Day Care Providers $4,446 0.18% $4,446 100.00% 74% Gas Stations $18,988 0.75% $5,575 29.36% 60% Performing Arts Theatre $4,492 0.18% $4,492 100.00% 74% Bars & Restaurants $10,750 0.42% $4,794 44.60% 65% Recreation $17,028 0.67% $2,727 16.01% 26% CRE Non-Owner Occupied $535,551 21.09% $74,103 13.84%** 58% Retail $110,284 4.37% $37,463 33.89%** 59% Hotel $13,224 0.52% $13,224 100.00% 48% Restaurant $12,612 0.50% $1,658 13.15% 36% Office $118,127 4.65% $13,028 11.03% 66% Multifamily $199,519 7.86% $8,651 4.34% 58% • Payment modifications are intended to assist borrowers impacted by COVID-19. As such, businesses most impacted by social distancing guidelines and government shutdown have requested and have been granted payment modification to date (see below). • All loan modifications listed below qualify for temporary suspension of TDR requirements per Section 4013 of the CARES Act. *Excludes $133.89 million in PPP loans. **Excluding five loans that had requested payment deferral, but have continued to make full payment, the CRE Non-Owner Occupied rate would be reduced from 13.84% to 10.50% and the CRE NOO Retail rate would be reduced from 33.89% to 17.66%. |
| SBA Payment Protection Program Loans Accomodation and Food Services 6% Entertainment 1% Education 4% Health Care 15% Information and Finance 1% Manufacturing 16% Administration and Support 4% Construction Other Services 13% 5% Professional Services 9% Rental and Leasing 4% Retail Trade 11% Transportation and Warehousing 4% Wholesale Trade 7% Industry April May June Loans Booked 267 630 669 Volume ($) $96,260,916 $131,122,702 $133,892,302 $- $20,000,000 $40,000,000 $60,000,000 $80,000,000 $100,000,000 $120,000,000 $140,000,000 $160,000,000 PPP Funding YTD SBA PPP Loans Balance Outstanding (000’s) $133,892 Total Commitment (000’s) $133,892 Average Loan Commitment $200,138 Number of Loans over $2 million 6 Number of Loans under $150,000 454 SBA PPP Loans • Largest loan funded was $4.89 million, with the balance of loans over $2 million totaling $20.55 million or 15.35% of total loans funded • Balance of loans under $150,000 totaling $23.35 million or 17.44% of total loans funded • Continuing to accept PPP applications, albeit at very low dollar amounts |
| Allowance for Credit Losses (under CECL) ACL Pool Outstanding Pooled Unguaranteed Loan Balance (000’s) ALLL Balance (000s) 12/31/2019 ACL Pooled Balance (000’s) 6/30/2020 Unfunded Commitment Reserve (000’s) 6/30/2020 Commercial & Industrial* $305,903 $2,842 (0.88%) $2,274 (0.74%) $985 Construction $82,024 $507 (0.73%) $3,498 (4.27%) $3,063 CRE Owner-Occupied $334,688 $2,539 (0.86%) $2,261 (0.68%) $33 CRE Investor $521,973 $5,554 (1.27% $7,599 (1.46%) $0 Leasing $132,009 $1,070 (0.90%) $1,939 (1.47%) $0 Multifamily $195,174 $1,248 (0.82%) $3,036 (1.56%) $9 Residential Owner-Occupied $121,494 $1,198 (0.94%) $3,055 (2.51%) $46 Residential Investor $67,719 $519 (0.84%) $2,207 (3.26%) $65 HELOC $112,927 $1,122 (0.94%) $2,399 (2.12%) $761 Consumer $1,196 $73 (0.57%) $18 (1.48%) $3 Total (includes reserves for individually analyzed loans and unallocated) $1,875,488 $19,789 (1.02%) $31,274 (1.63%*) $4,966 Key methodology assumptions • 1 year economic forecast utilized, assuming recessionary conditions reverting to long-term historical loss rates • Key economic inputs include GDP and civilian unemployment • Loss rates driven by portfolio risk characteristics, average remaining loan life, risk-grading and modeling methodology • Loss-rate models utilizing static pool and migration methodologies for material Residential and Commercial pools, WARM methodology utilized for pools with limited loss data • Loan risk migration accounts for initial payment modification totals and are lower than anticipated through 6/30/2020 and ACL assumptions used in previous periods • Methodology refinements within the HELOC and Consumer pools have resulted in lower reserve levels compared to previous periods Economic Scenario • Unemployment rate between 8.00% and 12.00% for the next twelve months, 6.25% to 10.00% for the life of loans • Real GDP growth rate between -5.00 and 2.00% over the next twelve months • Does not assume a return to business shutdowns as a result of a second wave and assumes additional government stimulus *Excludes $133.89 million in PPP loans |
| Allowance for Credit Losses (under CECL) ACL Pool Outstanding Pooled Unguaranteed Loan Balance (000’s) ALLL Balance (000s) 12/31/2019 ACL Pooled Balance (000’s) 6/30/2020 Unfunded Commitment Reserve (000’s) 6/30/2020 Commercial & Industrial* $305,903 $2,842 (0.88%) $2,274 (0.74%) $985 Construction $82,024 $507 (0.73%) $3,498 (4.27%) $3,063 CRE Owner-Occupied $334,688 $2,539 (0.86%) $2,261 (0.68%) $33 CRE Investor $521,973 $5,554 (1.27% $7,599 (1.46%) $0 Leasing $132,009 $1,070 (0.90%) $1,939 (1.47%) $0 Multifamily $195,174 $1,248 (0.82%) $3,036 (1.56%) $9 Residential Owner-Occupied $121,494 $1,198 (0.94%) $3,055 (2.51%) $46 Residential Investor $67,719 $519 (0.84%) $2,207 (3.26%) $65 HELOC $112,927 $1,122 (0.94%) $2,399 (2.12%) $761 Consumer $1,196 $73 (0.57%) $18 (1.48%) $3 Total (includes reserves for individually analyzed loans and unallocated) $1,875,488 $19,789 (1.02%) $31,274 (1.63%*) $4,966 Key methodology assumptions • 1 year economic forecast utilized, assuming recessionary conditions reverting to long-term historical loss rates • Key economic inputs include GDP and civilian unemployment • Loss rates driven by portfolio risk characteristics, average remaining loan life, risk-grading and modeling methodology • Loss-rate models utilizing static pool and migration methodologies for material Residential and Commercial pools, WARM methodology utilized for pools with limited loss data • Loan risk migration accounts for initial payment modification totals and are lower than anticipated through 6/30/2020 and ACL assumptions used in previous periods • Methodology refinements within the HELOC and Consumer pools have resulted in lower reserve levels compared to previous periods Economic Scenario • Unemployment rate between 8.00% and 12.00% for the next twelve months, 6.25% to 10.00% for the life of loans • Real GDP growth rate between -5.00 and 2.00% over the next twelve months • Does not assume a return to business shutdowns as a result of a second wave and assumes additional government stimulus *Excludes $133.89 million in PPP loans |
| Allowance for Credit Losses (under CECL) ACL Pool Outstanding Pooled Unguaranteed Loan Balance (000’s) ALLL Balance (000s) 12/31/2019 ACL Pooled Balance (000’s) 6/30/2020 Unfunded Commitment Reserve (000’s) 6/30/2020 Commercial & Industrial* $305,903 $2,842 (0.88%) $2,274 (0.74%) $985 Construction $82,024 $507 (0.73%) $3,498 (4.27%) $3,063 CRE Owner-Occupied $334,688 $2,539 (0.86%) $2,261 (0.68%) $33 CRE Investor $521,973 $5,554 (1.27% $7,599 (1.46%) $0 Leasing $132,009 $1,070 (0.90%) $1,939 (1.47%) $0 Multifamily $195,174 $1,248 (0.82%) $3,036 (1.56%) $9 Residential Owner-Occupied $121,494 $1,198 (0.94%) $3,055 (2.51%) $46 Residential Investor $67,719 $519 (0.84%) $2,207 (3.26%) $65 HELOC $112,927 $1,122 (0.94%) $2,399 (2.12%) $761 Consumer $1,196 $73 (0.57%) $18 (1.48%) $3 Total (includes reserves for individually analyzed loans and unallocated) $1,875,488 $19,789 (1.02%) $31,274 (1.63%*) $4,966 Key methodology assumptions • 1 year economic forecast utilized, assuming recessionary conditions reverting to long-term historical loss rates • Key economic inputs include GDP and civilian unemployment • Loss rates driven by portfolio risk characteristics, average remaining loan life, risk-grading and modeling methodology • Loss-rate models utilizing static pool and migration methodologies for material Residential and Commercial pools, WARM methodology utilized for pools with limited loss data • Loan risk migration accounts for initial payment modification totals and are lower than anticipated through 6/30/2020 and ACL assumptions used in previous periods • Methodology refinements within the HELOC and Consumer pools have resulted in lower reserve levels compared to previous periods Economic Scenario • Unemployment rate between 8.00% and 12.00% for the next twelve months, 6.25% to 10.00% for the life of loans • Real GDP growth rate between -5.00 and 2.00% over the next twelve months • Does not assume a return to business shutdowns as a result of a second wave and assumes additional government stimulus *Excludes $133.89 million in PPP loans |
| Allowance for Credit Losses (under CECL) ACL Pool Outstanding Pooled Unguaranteed Loan Balance (000’s) ALLL Balance (000s) 12/31/2019 ACL Pooled Balance (000’s) 6/30/2020 Unfunded Commitment Reserve (000’s) 6/30/2020 Commercial & Industrial* $305,903 $2,842 (0.88%) $2,274 (0.74%) $985 Construction $82,024 $507 (0.73%) $3,498 (4.27%) $3,063 CRE Owner-Occupied $334,688 $2,539 (0.86%) $2,261 (0.68%) $33 CRE Investor $521,973 $5,554 (1.27% $7,599 (1.46%) $0 Leasing $132,009 $1,070 (0.90%) $1,939 (1.47%) $0 Multifamily $195,174 $1,248 (0.82%) $3,036 (1.56%) $9 Residential Owner-Occupied $121,494 $1,198 (0.94%) $3,055 (2.51%) $46 Residential Investor $67,719 $519 (0.84%) $2,207 (3.26%) $65 HELOC $112,927 $1,122 (0.94%) $2,399 (2.12%) $761 Consumer $1,196 $73 (0.57%) $18 (1.48%) $3 Total (includes reserves for individually analyzed loans and unallocated) $1,875,488 $19,789 (1.02%) $31,274 (1.63%*) $4,966 Key methodology assumptions • 1 year economic forecast utilized, assuming recessionary conditions reverting to long-term historical loss rates • Key economic inputs include GDP and civilian unemployment • Loss rates driven by portfolio risk characteristics, average remaining loan life, risk-grading and modeling methodology • Loss-rate models utilizing static pool and migration methodologies for material Residential and Commercial pools, WARM methodology utilized for pools with limited loss data • Loan risk migration accounts for initial payment modification totals and are lower than anticipated through 6/30/2020 and ACL assumptions used in previous periods • Methodology refinements within the HELOC and Consumer pools have resulted in lower reserve levels compared to previous periods Economic Scenario • Unemployment rate between 8.00% and 12.00% for the next twelve months, 6.25% to 10.00% for the life of loans • Real GDP growth rate between -5.00 and 2.00% over the next twelve months • Does not assume a return to business shutdowns as a result of a second wave and assumes additional government stimulus *Excludes $133.89 million in PPP loans |