Exhibit 99.1
OpenText Reports Fourth Quarter and Fiscal Year 2022 Financial Results
Record Total Revenues, Annual Cloud Revenues and Annual Recurring Revenues
Fiscal 2022 Annual Highlights Y/Y
| | | | | | | | | | | | | | | | | | | | | | | |
Total Revenues (in millions) | | Annual Recurring Revenues (in millions) | | Cloud Revenues (in millions) |
| Reported | Constant Currency | | Reported | Constant Currency | | Reported | Constant Currency |
| $3,494 | $3,533 | | $2,866 | $2,892 | | $1,535 | $1,545 |
| +3.2% | +4.3% | | +4.5% | +5.5% | | +9.1% | +9.8% |
Annual Recurring Revenues represent 82% of Total Revenues |
•Record Total revenues of $3.5 billion up 3.2% Y/Y or up 4.3% Y/Y in constant currency
•Record Annual recurring revenues of $2.9 billion, up 4.5% Y/Y or up 5.5% Y/Y in constant currency
•Record Cloud revenues of $1.5 billion up 9.1% Y/Y or up 9.8% in constant currency, becomes our largest revenue contributor
•Record FY’22 Enterprise cloud bookings(1) of $466 million
•Operating cash flows were $982 million and free cash flows(1) were $889 million, up 9.4% Y/Y
•GAAP-based net income of $397 million, up 27.8% Y/Y, margin of 11.4%, up 220 basis points Y/Y
•Adjusted EBITDA(1) of $1.3 billion, margin of 36.2% while making key investments in cloud, edge and security
•Record capital returns of $415 million via dividends and share repurchases
•GAAP-based diluted earnings per share (EPS) of $1.46, Non-GAAP diluted EPS of $3.22
•Quarterly cash dividend increased by 10%
Fiscal 2022 Fourth Quarter Highlights
| | | | | | | | | | | | | | | | | | | | | | | |
Total Revenues (in millions) | | Annual Recurring Revenues (in millions) | | Cloud Revenues (in millions) |
| Reported | Constant Currency | | Reported | Constant Currency | | Reported | Constant Currency |
| $902 | $935 | | $740 | $762 | | $412 | $420 |
| +1.0% | +4.7% | | +6.6% | +9.8% | | +14.3% | +16.6% |
Annual Recurring Revenues represent 82% of Total Revenues |
•Total revenues of $902 million, up 1.0% Y/Y or up 4.7% in constant currency
•Annual recurring revenues of $740 million, up 6.6% Y/Y or up 9.8% in constant currency
•Cloud revenues of $412 million, up 14.3% Y/Y or up 16.6% in constant currency
•Operating cash flows were $252 million and free cash flows(1) were $214 million
•GAAP-based net income of $102 million, down 43.6% Y/Y, margin of 11.3%, down 900 basis points Y/Y
•Adjusted EBITDA(2) of $314 million, margin of 34.8%
•GAAP-based diluted earnings per share (EPS) of $0.38, Non-GAAP diluted EPS(1) of $0.80
•During the quarter, the Company repurchased and cancelled 1.0 million shares for $41 million under our share repurchase plans
Waterloo, ON, August 4, 2022 - Open Text Corporation (NASDAQ: OTEX), (TSX: OTEX), today announced its financial results for the fourth quarter and year ended June 30, 2022.
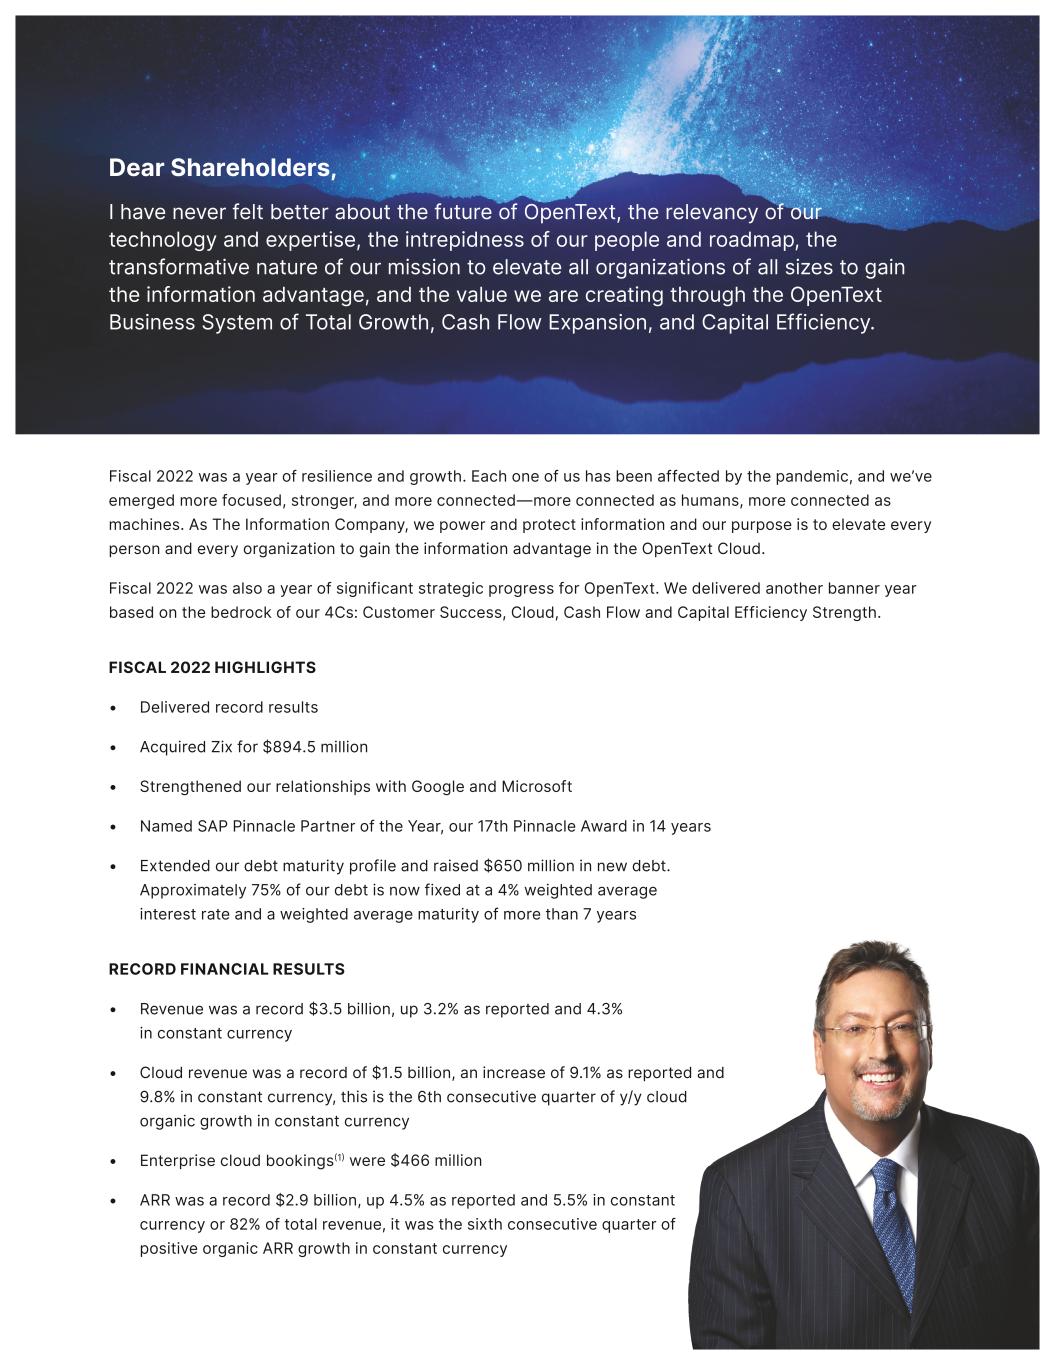
“Our strong fourth quarter and year-end results reflect customers’ accelerating journey to the OpenText Cloud,” said Mark J. Barrenechea, OpenText CEO & CTO. “In Fiscal 2022, OpenText delivered a record $3.5 billion of total revenues, led by record cloud revenues and cloud bookings. Fiscal 2022 annual recurring revenues reached record $2.9 billion, representing 82% of total revenues.”
“OpenText is more relevant than ever before as we help customers build and own their digital fabrics to transform their organizations and do more with less,” added Mr. Barrenechea. “Through our recently unveiled Project Titanium, we have taken a massive step forward in strengthening the OpenText Cloud as a foundation of modern work, digital supply chains, customer experiences and secure computing. OpenText is ready for all economic scenarios, and our outlook for Fiscal 2023 focuses on continued cloud and free cash flow growth.”
“Let me thank our entire team for their amazing efforts to keep one another safe and well while delivering outstanding service to our customers. The team continues to raise their game each quarter amidst a dynamic environment.”
“OpenText delivered an exceptional year,” said Madhu Ranganathan, OpenText EVP, CFO. “Our team delivered a solid Fiscal 2022 with adjusted EBITDA of $1.3 billion and strong free cash flows of $889 million. With approximately $1.7 billion in cash as of June 30, 2022 and a net leverage ratio of 2.0x, our balance sheet and liquidity position remain strong. Our strategic investments in product innovation and go-to-market initiatives continue to position us well to win in the cloud.”
(1) Enterprise cloud bookings is defined as the total value from cloud services and subscription contracts, entered into in the fiscal year that are new, committed and incremental to our existing contracts, excluding the impact of Carbonite and Zix.
(2) Please see Note 2 “Use of Non-GAAP Financial Measures” to the consolidated financial statements below.
Financial Highlights for Fiscal 2022 and Q4 with Year Over Year Comparisons
| | | | | | | | | | | | | | | | | | | | | | | | | | |
Summary of Annual Results | | | | | | | | |
| (In millions, except per share data) | FY'22 | FY'21 | $ Change | % Change | | FY'22 in CC* | % Change in CC* | |
| Revenues: | | | | | | | | |
| Cloud services and subscriptions | $1,535.0 | | $1,407.4 | | $127.6 | | 9.1 | % | | $1,544.7 | | 9.8 | % | |
| Customer support | 1,331.0 | | 1,334.1 | | ($3.1) | | (0.2) | % | | 1,347.3 | | 1.0 | % | |
| Total annual recurring revenues** | $2,866.0 | | $2,741.5 | | $124.5 | | 4.5 | % | | $2,892.0 | | 5.5 | % | |
| License | 358.4 | | 384.7 | | ($26.4) | | (6.9) | % | | 367.0 | | (4.6) | % | |
| Professional service and other | 269.5 | | 259.9 | | $9.6 | | 3.7 | % | | 274.3 | | 5.5 | % | |
Total revenues | $3,493.8 | | $3,386.1 | | $107.7 | | 3.2 | % | | $3,533.3 | | 4.3 | % | |
| GAAP-based operating income | $ | 644.8 | | $740.9 | | ($96.1) | | (13.0) | % | | N/A | N/A | |
Non-GAAP-based operating income (1) | $1,176.9 | | $1,230.0 | | ($53.0) | | (4.3) | % | | $1,199.9 | | (2.4) | % | |
| GAAP-based net income attributable to OpenText | $397.1 | | $310.7 | | $86.4 | | 27.8 | % | | N/A | N/A | |
| GAAP-based EPS, diluted | $1.46 | | $1.14 | | $0.32 | | 28.1 | % | | N/A | N/A | |
Non-GAAP-based EPS, diluted (1)(2) | $3.22 | | $3.39 | | ($0.17) | | (5.0) | % | | $3.35 | | (1.2) | % | |
Adjusted EBITDA (1) | $1,265.0 | | $1,315.0 | | ($50.0) | | (3.8) | % | | $1,288.1 | | (2.1) | % | |
| Operating cash flows | $981.8 | | $876.1 | | $105.7 | | 12.1 | % | | N/A | N/A | |
Free cash flows (1) | $888.7 | | $812.4 | | $76.3 | | 9.4 | % | | N/A | N/A | |
| | | | | | | | | | | | | | | | | | | | | | | | | | |
Summary of Quarterly Results | | | | | | | | |
| (In millions, except per share data) | Q4 FY'22 | Q4 FY'21 | $ Change | % Change | | Q4 FY'22 in CC* | % Change in CC* | |
| Revenues: | | | | | | | | |
| Cloud services and subscriptions | $411.6 | | $360.2 | | $51.4 | | 14.3 | % | | $420.0 | | 16.6 | % | |
| Customer support | 328.3 | | 334.3 | | ($5.9) | | (1.8) | % | | 342.3 | | 2.4 | % | |
| Total annual recurring revenues** | $739.9 | | $694.4 | | $45.5 | | 6.6 | % | | $762.2 | | 9.8 | % | |
| License | 94.7 | | 132.5 | | ($37.9) | | (28.6) | % | | 101.3 | | (23.6) | % | |
| Professional service and other | 67.8 | | 66.6 | | $1.3 | | 1.9 | % | | 71.9 | | 7.9 | % | |
Total revenues | $902.5 | | $893.5 | | $8.9 | | 1.0 | % | | $935.4 | | 4.7 | % | |
| GAAP-based operating income | $137.6 | | $171.7 | | ($34.1) | | (19.9) | % | | N/A | N/A | |
Non-GAAP-based operating income (1) | $291.0 | | $293.9 | | ($2.9) | | (1.0) | % | | $303.9 | | 3.4 | % | |
| GAAP-based net income attributable to OpenText | $102.2 | | $181.3 | | ($79.1) | | (43.6) | % | | N/A | N/A | |
| GAAP-based EPS, diluted | $0.38 | | $0.66 | | ($0.28) | | (42.4) | % | | N/A | N/A | |
Non-GAAP-based EPS, diluted (1)(2) | $0.80 | | $0.80 | | $— | | — | % | | $0.89 | | 11.3 | % | |
Adjusted EBITDA (1) | $313.6 | | $314.8 | | ($1.2) | | (0.4) | % | | $326.7 | | 3.8 | % | |
| Operating cash flows | $251.9 | | $296.2 | | ($44.2) | | (14.9) | % | | N/A | N/A | |
Free cash flows (1) | $213.8 | | $268.8 | | ($55.0) | | (20.5) | % | | N/A | N/A | |
(1) Please see Note 2 “Use of Non-GAAP Financial Measures” to the consolidated financial statements below.
(2) Please also see Note 14 to the Company's Fiscal 2018 Consolidated Financial Statements on Form 10-K. Reflective of the amount of net tax benefit arising from the internal reorganization assumed to be allocable to the current period based on the forecasted utilization period.
Note: Individual line items in tables may be adjusted by non-material amounts to enable totals to align to published financial statements.
*CC: Constant currency for this purpose is defined as the current period reported revenues/expenses/earnings represented at the prior comparative period's foreign exchange rate.
**Annual recurring revenue is defined as the sum of Cloud services and subscriptions revenue and Customer support revenue.
Dividend and Share Repurchases
As part of our quarterly, non-cumulative cash dividend program, the Board declared on August 3, 2022, a cash dividend increase of 10% to $0.24299 per common share. The record date for this dividend is September 2, 2022 and the payment date is September 23, 2022. OpenText believes strongly in returning value to its shareholders and intends to maintain its dividend program. Any future declarations of dividends and the establishment of future record and payment dates are all subject to the final determination and discretion of the Board of Directors.
Quarterly Business Highlights
•Key customer wins in the quarter include: Carl Zeiss AG, Citgo Petroleum Corporation, Close Brothers, Evermark, Hydro Quebec, Legal Aid Western Australia, MUFG Bank, One World Apparel, Phillips Lytle, Region Skane, Salt River Project, Sysmex
•OpenText accelerates cloud investments with Project Titanium
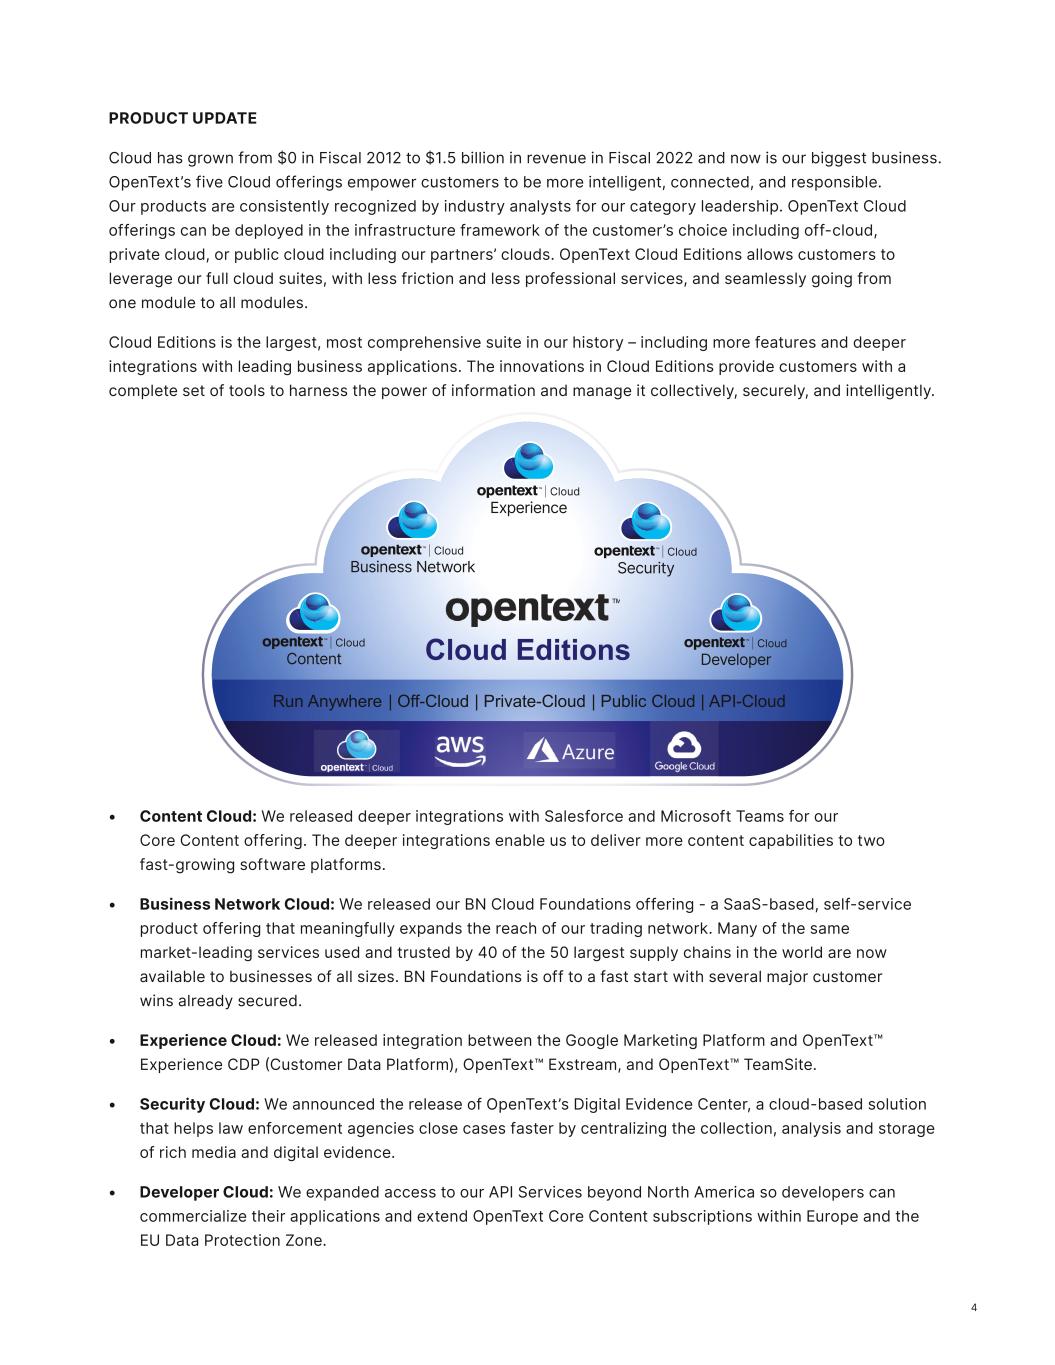
•OpenText powers the Information Advantage with Cloud Editions 22.2
•OpenText extends reach of its Information Management solutions in DACH region through partnership with Scheer Group
•OpenText showcases Business-to-Anything integration at Gartner® Supply Chain Symposium/Xpo 2022
•OpenText unveils new threat intelligence technology and other security advancements at RSA Conference
•OpenText partners with Girl Scouts to help members become cyber resilient
•OpenText World EMEA 2022 showcases innovations enabling the Information Advantage
| | | | | | | | | | | | | | |
Summary of Annual Results | | | | |
| | FY'22 | FY'21 | % Change | |
| Revenue (millions) | $3,493.8 | | $3,386.1 | | 3.2 | % | |
| GAAP-based gross margin | 69.6 | % | 69.4 | % | 15 | | bps |
Non-GAAP-based gross margin (1) | 75.6 | % | 76.1 | % | (54) | | bps |
| GAAP-based EPS, diluted | $1.46 | | $1.14 | | 28.1 | % | |
Non-GAAP-based EPS, diluted (1)(2) | $3.22 | | $3.39 | | (5.0) | % | |
| | | | | | | | | | | | | | | | | | | | | | | |
Summary of Quarterly Results | | | | | | | |
| | Q4 FY'22 | Q3 FY'22 | Q4 FY'21 | % Change (Q4 FY'22 vs Q3 FY'22) | | % Change (Q4 FY'22 vs Q4 FY'21) | |
| Revenue (millions) | $902.5 | | $882.3 | | $893.5 | | 2.3 | % | | 1.0 | % | |
| GAAP-based gross margin | 70.2 | % | 68.9 | % | 69.6 | % | 130 | | bps | 60 | | bps |
Non-GAAP-based gross margin (1) | 75.9 | % | 74.5 | % | 75.8 | % | 140 | | bps | 10 | | bps |
| GAAP-based EPS, diluted | $0.38 | | $0.28 | | $0.66 | | 35.7 | % | | (42.4) | % | |
Non-GAAP-based EPS, diluted (1)(2) | $0.80 | | $0.70 | | $0.80 | | 14.3 | % | | — | % | |
(1) Please see Note 2 “Use of Non-GAAP Financial Measures” to the consolidated financial statements below.
(2) Please also see Note 14 to the Company's Fiscal 2018 Consolidated Financial Statements on Form 10-K. Reflective of the amount of net tax benefit arising from the internal reorganization assumed to be allocable to the current period based on the forecasted utilization period.
Conference Call Information
OpenText posted our quarterly shareholder letter and investor presentation on its Investor Relations website at http://investors.opentext.com and invites the public to listen to the earnings conference call today at 5:00 p.m. ET (2:00 p.m. PT) by dialing 1-800-319-4610 (toll-free) or +1-604-638-5340 (international). Please dial-in 10 minutes ahead of time to ensure proper connection. Alternatively, a live webcast of the earnings conference call will be available on the Investor Relations section of the Company's website at http://investors.opentext.com/investor-events-and-presentations.
A replay of the call will be available beginning August 4, 2022 at 7:00 p.m. ET through 11:59 p.m. on August 18, 2022 and can be accessed by dialing 1-855-669-9658 (toll-free) or +1-604-674-8052 (international) and using passcode 9157 followed by the number sign.
Please see below note (2) for a reconciliation of U.S. GAAP-based financial measures used in this press release to Non-GAAP-based financial measures.
About OpenText
OpenText, The Information Company™, enables organizations to gain insight through market leading information management solutions, powered by OpenText Cloud Editions. For more information about OpenText (NASDAQ: OTEX, TSX: OTEX) visit opentext.com.
Cautionary Statement Regarding Forward-Looking Statements
Certain statements in this press release, including statements about the focus of Open Text Corporation (“OpenText” or “the Company”) in our fiscal year ending June 30, 2023 (Fiscal 2023) on growth, future cloud growth and market share gains, future organic growth initiatives and deployment of capital, intention to maintain a dividend program, potential share repurchases pursuant to its share repurchase plans, future tax rates, new platform and product offerings and associated benefits to customers, scaling OpenText, and other matters, which may contain words such as “anticipates”, “expects”, “intends”, “plans”, “believes”, “seeks”, “estimates”, “may”, “could”, “would”, “might”, “will” and variations of these words or similar expressions are considered forward-looking statements or information under applicable securities laws. In addition, any information or statements that refer to expectations, beliefs, plans, projections, objectives, performance or other characterizations of future events or circumstances, including any underlying assumptions, are forward-looking, and based on our current expectations,
forecasts and projections about the operating environment, economies and markets in which we operate. Forward-looking statements reflect our current estimates, beliefs and assumptions, which are based on management's perception of historic trends, current conditions and expected future developments, as well as other factors it believes are appropriate in the circumstances, such as certain assumptions about the economy, as well as market, financial and operational assumptions. Management's estimates, beliefs and assumptions are inherently subject to significant business, economic, competitive and other uncertainties and contingencies regarding future events and, as such, are subject to change. We can give no assurance that such estimates, beliefs and assumptions will prove to be correct. Such forward-looking statements involve known and unknown risks and uncertainties such as those relating to the duration and severity of the COVID-19 pandemic, including any new strains or resurgences, as well as our ability to develop, protect and maintain our intellectual property and proprietary technology and to operate without infringing on the proprietary rights of others. For additional information with respect to risks and other factors which could occur, see the Company's Annual Report on Form 10-K, Quarterly Reports on Form 10-Q and other securities filings with the Securities and Exchange Commission (SEC) and other securities regulators. Readers are cautioned not to place undue reliance upon any such forward-looking statements, which speak only as of the date made. Unless otherwise required by applicable securities laws, the Company disclaims any intention or obligation to update or revise any forward-looking statements, whether as a result of new information, future events or otherwise.
For more information, please contact:
Harry E. Blount
Senior Vice President, Global Head of Investor Relations
Open Text Corporation
415-963-0825
Copyright ©2022 Open Text. OpenText is a trademark or registered trademark of Open Text. The list of trademarks is not exhaustive of other trademarks. Registered trademarks, product names, company names, brands and service names mentioned herein are property of Open Text. All rights reserved. For more information, visit: http://www.opentext.com/who-we-are/copyright-information.
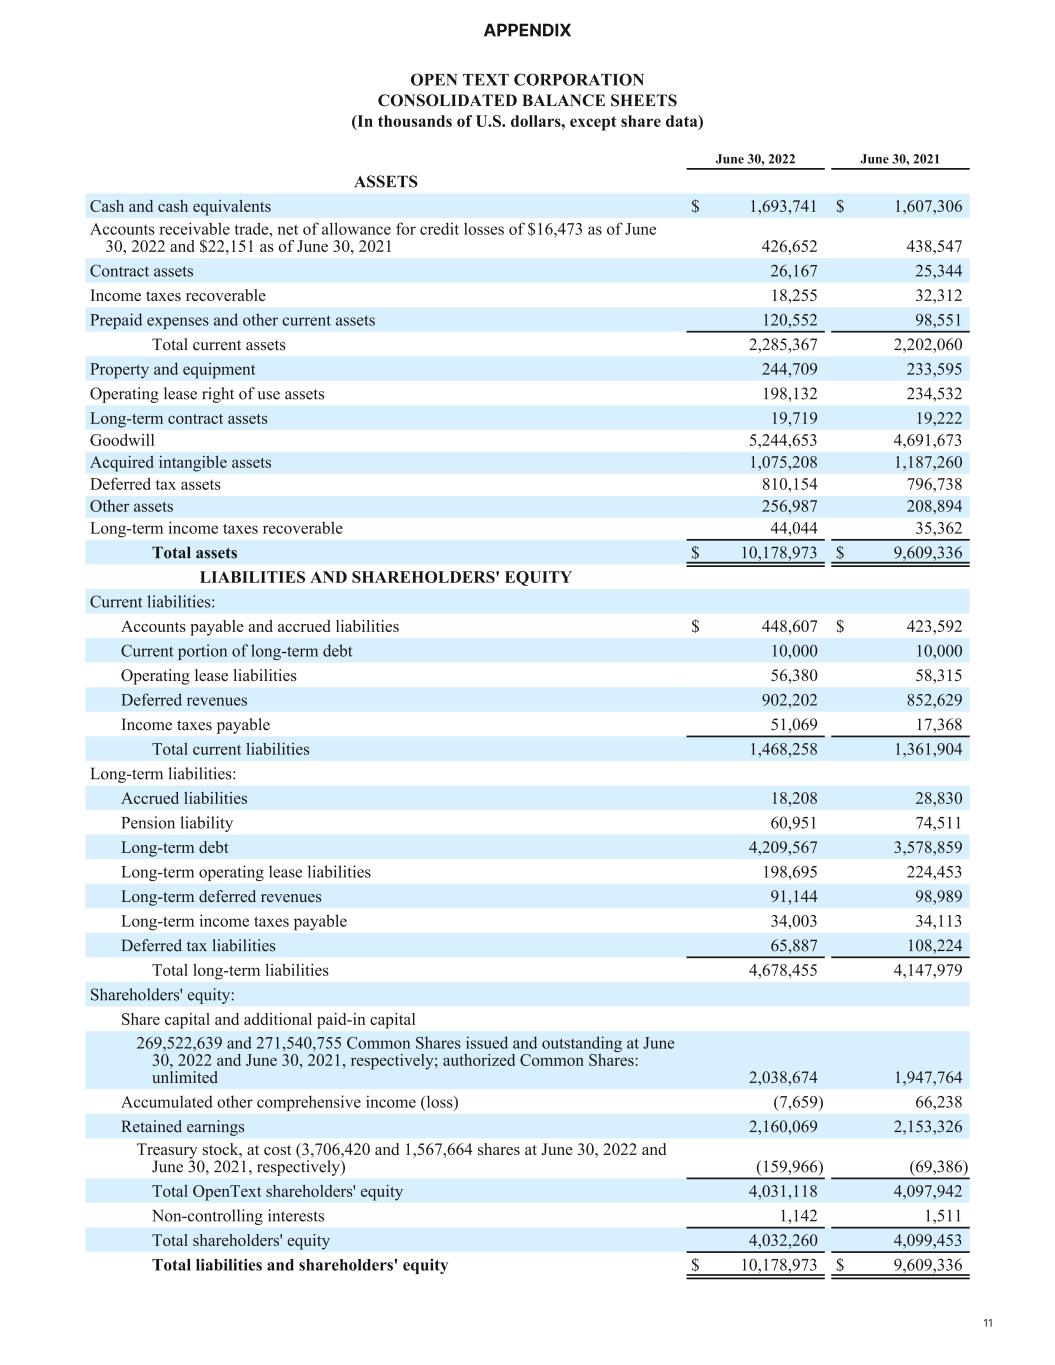
OPEN TEXT CORPORATION
CONSOLIDATED BALANCE SHEETS
(In thousands of U.S. dollars, except share data)
| | | | | | | | | | | |
| | June 30, 2022 | | June 30, 2021 |
| ASSETS | | | |
| Cash and cash equivalents | $ | 1,693,741 | | | $ | 1,607,306 | |
Accounts receivable trade, net of allowance for credit losses of $16,473 as of June 30, 2022 and $22,151 as of June 30, 2021 | 426,652 | | | 438,547 | |
| Contract assets | 26,167 | | | 25,344 | |
| Income taxes recoverable | 18,255 | | | 32,312 | |
| Prepaid expenses and other current assets | 120,552 | | | 98,551 | |
| Total current assets | 2,285,367 | | | 2,202,060 | |
| Property and equipment | 244,709 | | | 233,595 | |
| Operating lease right of use assets | 198,132 | | | 234,532 | |
| Long-term contract assets | 19,719 | | | 19,222 | |
| Goodwill | 5,244,653 | | | 4,691,673 | |
| Acquired intangible assets | 1,075,208 | | | 1,187,260 | |
| Deferred tax assets | 810,154 | | | 796,738 | |
| Other assets | 256,987 | | | 208,894 | |
| Long-term income taxes recoverable | 44,044 | | | 35,362 | |
| Total assets | $ | 10,178,973 | | | $ | 9,609,336 | |
| LIABILITIES AND SHAREHOLDERS' EQUITY | | | |
| Current liabilities: | | | |
| Accounts payable and accrued liabilities | $ | 448,607 | | | $ | 423,592 | |
| Current portion of long-term debt | 10,000 | | | 10,000 | |
| Operating lease liabilities | 56,380 | | | 58,315 | |
| Deferred revenues | 902,202 | | | 852,629 | |
| Income taxes payable | 51,069 | | | 17,368 | |
| Total current liabilities | 1,468,258 | | | 1,361,904 | |
| Long-term liabilities: | | | |
| Accrued liabilities | 18,208 | | | 28,830 | |
| Pension liability | 60,951 | | | 74,511 | |
| Long-term debt | 4,209,567 | | | 3,578,859 | |
| Long-term operating lease liabilities | 198,695 | | | 224,453 | |
| Long-term deferred revenues | 91,144 | | | 98,989 | |
| Long-term income taxes payable | 34,003 | | | 34,113 | |
| Deferred tax liabilities | 65,887 | | | 108,224 | |
| Total long-term liabilities | 4,678,455 | | | 4,147,979 | |
| Shareholders' equity: | | | |
| Share capital and additional paid-in capital | | | |
269,522,639 and 271,540,755 Common Shares issued and outstanding at June 30, 2022 and June 30, 2021, respectively; authorized Common Shares: unlimited | 2,038,674 | | | 1,947,764 | |
| Accumulated other comprehensive income (loss) | (7,659) | | | 66,238 | |
| Retained earnings | 2,160,069 | | | 2,153,326 | |
Treasury stock, at cost (3,706,420 and 1,567,664 shares at June 30, 2022 and June 30, 2021, respectively) | (159,966) | | | (69,386) | |
| Total OpenText shareholders' equity | 4,031,118 | | | 4,097,942 | |
| Non-controlling interests | 1,142 | | | 1,511 | |
| Total shareholders' equity | 4,032,260 | | | 4,099,453 | |
| Total liabilities and shareholders' equity | $ | 10,178,973 | | | $ | 9,609,336 | |
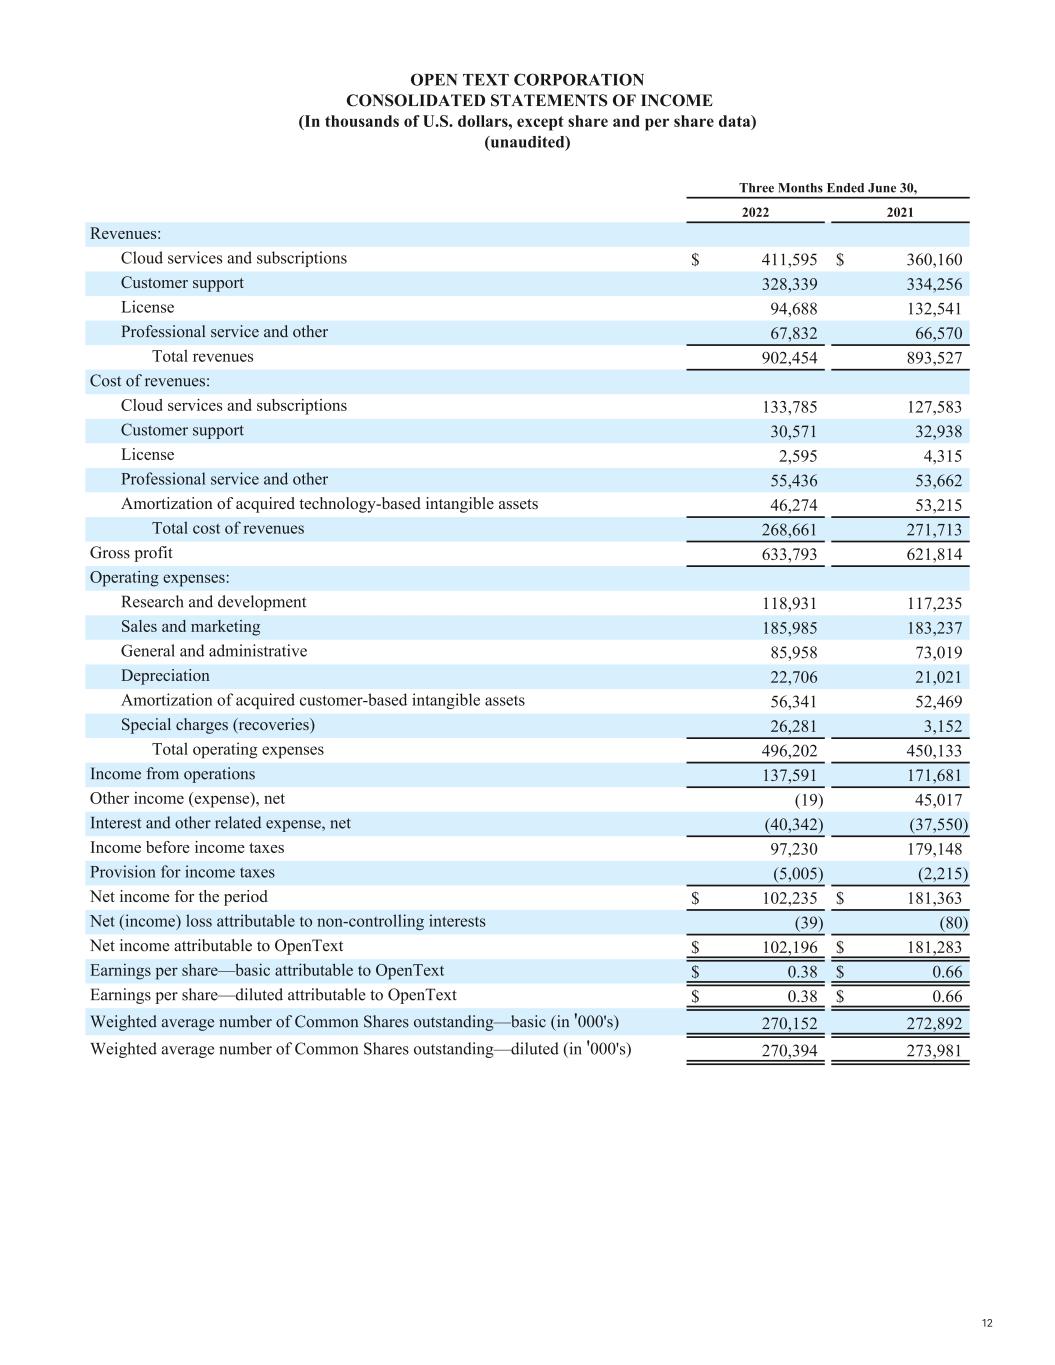
OPEN TEXT CORPORATION
CONSOLIDATED STATEMENTS OF INCOME
(In thousands of U.S. dollars, except share and per share data)
(unaudited)
| | | | | | | | | | | | | | | |
| | Three Months Ended June 30, | | |
| | 2022 | | 2021 | | | | |
| Revenues: | | | | | | | |
| Cloud services and subscriptions | $ | 411,595 | | | $ | 360,160 | | | | | |
| Customer support | 328,339 | | | 334,256 | | | | | |
| License | 94,688 | | | 132,541 | | | | | |
| Professional service and other | 67,832 | | | 66,570 | | | | | |
| Total revenues | 902,454 | | | 893,527 | | | | | |
| Cost of revenues: | | | | | | | |
| Cloud services and subscriptions | 133,785 | | | 127,583 | | | | | |
| Customer support | 30,571 | | | 32,938 | | | | | |
| License | 2,595 | | | 4,315 | | | | | |
| Professional service and other | 55,436 | | | 53,662 | | | | | |
| Amortization of acquired technology-based intangible assets | 46,274 | | | 53,215 | | | | | |
| Total cost of revenues | 268,661 | | | 271,713 | | | | | |
| Gross profit | 633,793 | | | 621,814 | | | | | |
| Operating expenses: | | | | | | | |
| Research and development | 118,931 | | | 117,235 | | | | | |
| Sales and marketing | 185,985 | | | 183,237 | | | | | |
| General and administrative | 85,958 | | | 73,019 | | | | | |
| Depreciation | 22,706 | | | 21,021 | | | | | |
| Amortization of acquired customer-based intangible assets | 56,341 | | | 52,469 | | | | | |
| Special charges (recoveries) | 26,281 | | | 3,152 | | | | | |
| Total operating expenses | 496,202 | | | 450,133 | | | | | |
| Income from operations | 137,591 | | | 171,681 | | | | | |
| Other income (expense), net | (19) | | | 45,017 | | | | | |
| Interest and other related expense, net | (40,342) | | | (37,550) | | | | | |
| Income before income taxes | 97,230 | | | 179,148 | | | | | |
| Provision for income taxes | (5,005) | | | (2,215) | | | | | |
| Net income for the period | $ | 102,235 | | | $ | 181,363 | | | | | |
| Net (income) loss attributable to non-controlling interests | (39) | | | (80) | | | | | |
| Net income attributable to OpenText | $ | 102,196 | | | $ | 181,283 | | | | | |
| Earnings per share—basic attributable to OpenText | $ | 0.38 | | | $ | 0.66 | | | | | |
| Earnings per share—diluted attributable to OpenText | $ | 0.38 | | | $ | 0.66 | | | | | |
Weighted average number of Common Shares outstanding—basic (in '000's) | 270,152 | | | 272,892 | | | | | |
Weighted average number of Common Shares outstanding—diluted (in '000's) | 270,394 | | | 273,981 | | | | | |
OPEN TEXT CORPORATION
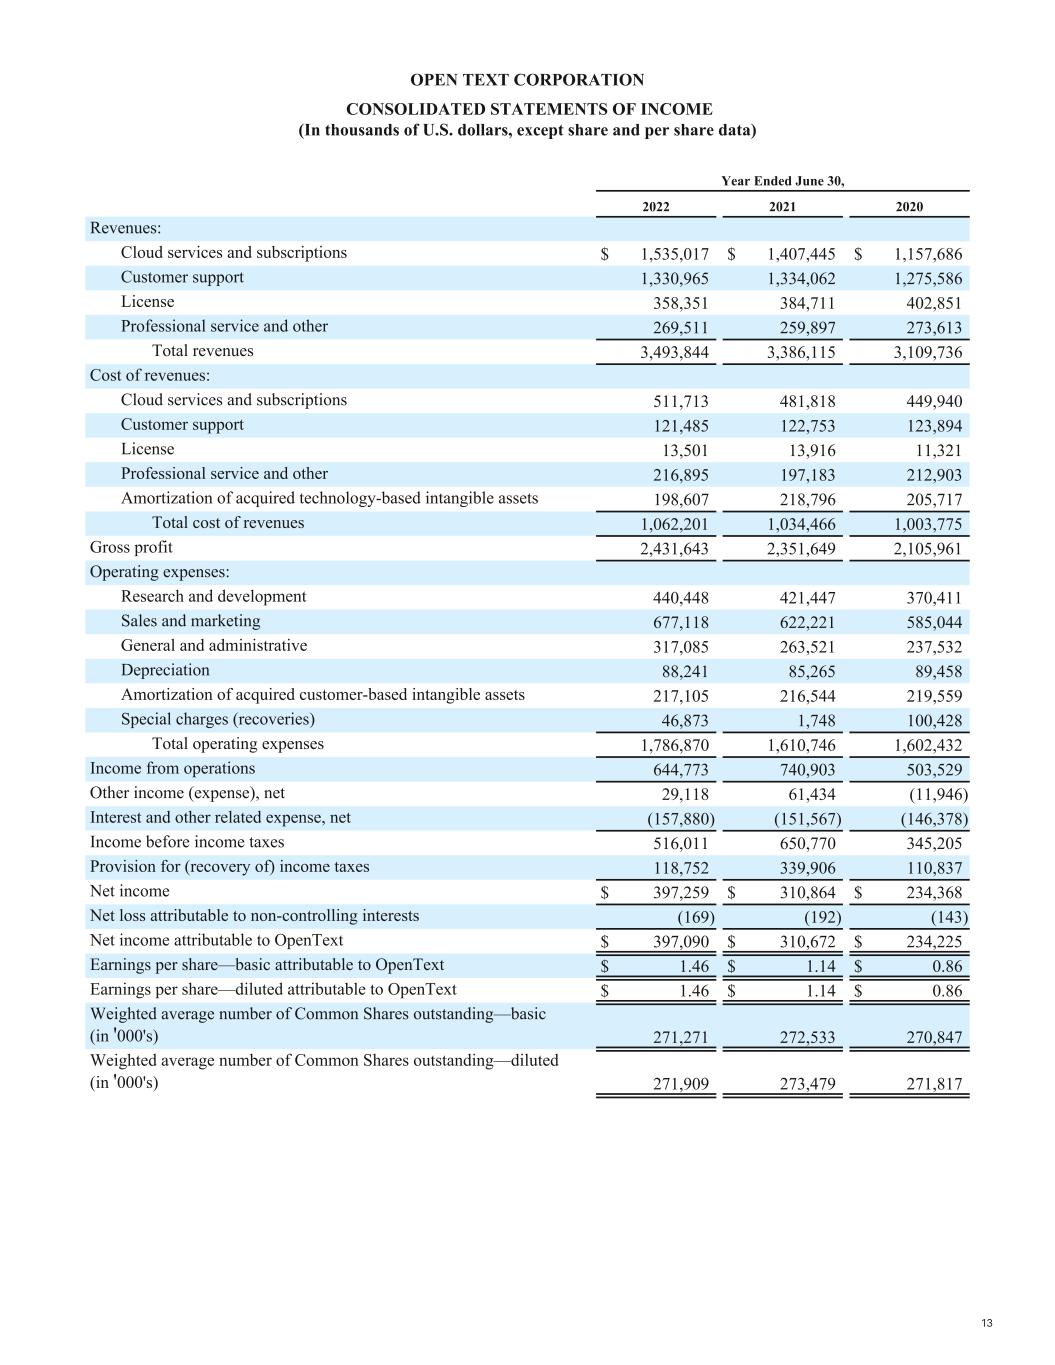
CONSOLIDATED STATEMENTS OF INCOME
(In thousands of U.S. dollars, except share and per share data)
| | | | | | | | | | | | | | | | | |
| | Year Ended June 30, |
| | 2022 | | 2021 | | 2020 |
| Revenues: | | | | | |
| Cloud services and subscriptions | $ | 1,535,017 | | | $ | 1,407,445 | | | $ | 1,157,686 | |
| Customer support | 1,330,965 | | | 1,334,062 | | | 1,275,586 | |
| License | 358,351 | | | 384,711 | | | 402,851 | |
| Professional service and other | 269,511 | | | 259,897 | | | 273,613 | |
| Total revenues | 3,493,844 | | | 3,386,115 | | | 3,109,736 | |
| Cost of revenues: | | | | | |
| Cloud services and subscriptions | 511,713 | | | 481,818 | | | 449,940 | |
| Customer support | 121,485 | | | 122,753 | | | 123,894 | |
| License | 13,501 | | | 13,916 | | | 11,321 | |
| Professional service and other | 216,895 | | | 197,183 | | | 212,903 | |
| Amortization of acquired technology-based intangible assets | 198,607 | | | 218,796 | | | 205,717 | |
| Total cost of revenues | 1,062,201 | | | 1,034,466 | | | 1,003,775 | |
| Gross profit | 2,431,643 | | | 2,351,649 | | | 2,105,961 | |
| Operating expenses: | | | | | |
| Research and development | 440,448 | | | 421,447 | | | 370,411 | |
| Sales and marketing | 677,118 | | | 622,221 | | | 585,044 | |
| General and administrative | 317,085 | | | 263,521 | | | 237,532 | |
| Depreciation | 88,241 | | | 85,265 | | | 89,458 | |
| Amortization of acquired customer-based intangible assets | 217,105 | | | 216,544 | | | 219,559 | |
| Special charges (recoveries) | 46,873 | | | 1,748 | | | 100,428 | |
| Total operating expenses | 1,786,870 | | | 1,610,746 | | | 1,602,432 | |
| Income from operations | 644,773 | | | 740,903 | | | 503,529 | |
| Other income (expense), net | 29,118 | | | 61,434 | | | (11,946) | |
| Interest and other related expense, net | (157,880) | | | (151,567) | | | (146,378) | |
| Income before income taxes | 516,011 | | | 650,770 | | | 345,205 | |
| Provision for (recovery of) income taxes | 118,752 | | | 339,906 | | | 110,837 | |
| Net income | $ | 397,259 | | | $ | 310,864 | | | $ | 234,368 | |
| Net loss attributable to non-controlling interests | (169) | | | (192) | | | (143) | |
| Net income attributable to OpenText | $ | 397,090 | | | $ | 310,672 | | | $ | 234,225 | |
| Earnings per share—basic attributable to OpenText | $ | 1.46 | | | $ | 1.14 | | | $ | 0.86 | |
| Earnings per share—diluted attributable to OpenText | $ | 1.46 | | | $ | 1.14 | | | $ | 0.86 | |
Weighted average number of Common Shares outstanding—basic (in '000's) | 271,271 | | | 272,533 | | | 270,847 | |
Weighted average number of Common Shares outstanding—diluted (in '000's) | 271,909 | | | 273,479 | | | 271,817 | |
OPEN TEXT CORPORATION
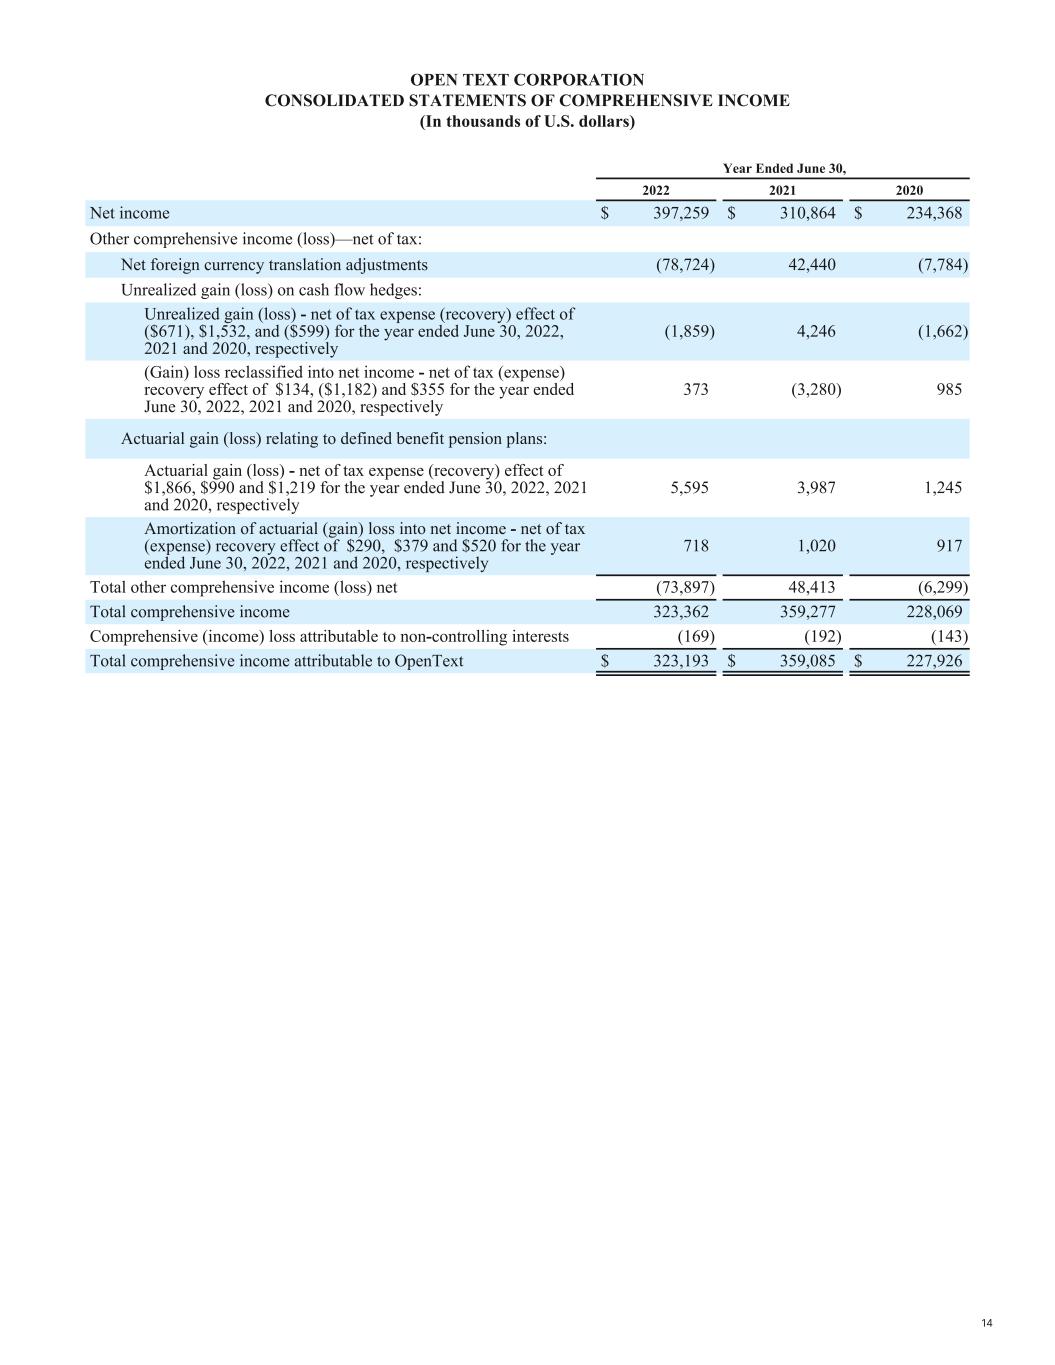
CONSOLIDATED STATEMENTS OF COMPREHENSIVE INCOME
(In thousands of U.S. dollars)
| | | | | | | | | | | | | | | | | | | | | |
| | | | Year Ended June 30, |
| | | | | | 2022 | | 2021 | | 2020 |
| Net income | | | | | $ | 397,259 | | | $ | 310,864 | | | $ | 234,368 | |
| Other comprehensive income (loss)—net of tax: | | | | | | | | | |
| Net foreign currency translation adjustments | | | | | (78,724) | | | 42,440 | | | (7,784) | |
| Unrealized gain (loss) on cash flow hedges: | | | | | | | | | |
Unrealized gain (loss) - net of tax expense (recovery) effect of ($671), $1,532, and ($599) for the year ended June 30, 2022, 2021 and 2020, respectively | | | | | (1,859) | | | 4,246 | | | (1,662) | |
(Gain) loss reclassified into net income - net of tax (expense) recovery effect of $134, ($1,182) and $355 for the year ended June 30, 2022, 2021 and 2020, respectively | | | | | 373 | | | (3,280) | | | 985 | |
| Actuarial gain (loss) relating to defined benefit pension plans: | | | | | | | | | |
Actuarial gain (loss) - net of tax expense (recovery) effect of $1,866, $990 and $1,219 for the year ended June 30, 2022, 2021 and 2020, respectively | | | | | 5,595 | | | 3,987 | | | 1,245 | |
Amortization of actuarial (gain) loss into net income - net of tax (expense) recovery effect of $290, $379 and $520 for the year ended June 30, 2022, 2021 and 2020, respectively | | | | | 718 | | | 1,020 | | | 917 | |
| Total other comprehensive income (loss) net | | | | | (73,897) | | | 48,413 | | | (6,299) | |
| Total comprehensive income | | | | | 323,362 | | | 359,277 | | | 228,069 | |
Comprehensive (income) loss attributable to non-controlling interests | | | | | (169) | | | (192) | | | (143) | |
| Total comprehensive income attributable to OpenText | | | | | $ | 323,193 | | | $ | 359,085 | | | $ | 227,926 | |
OPEN TEXT CORPORATION
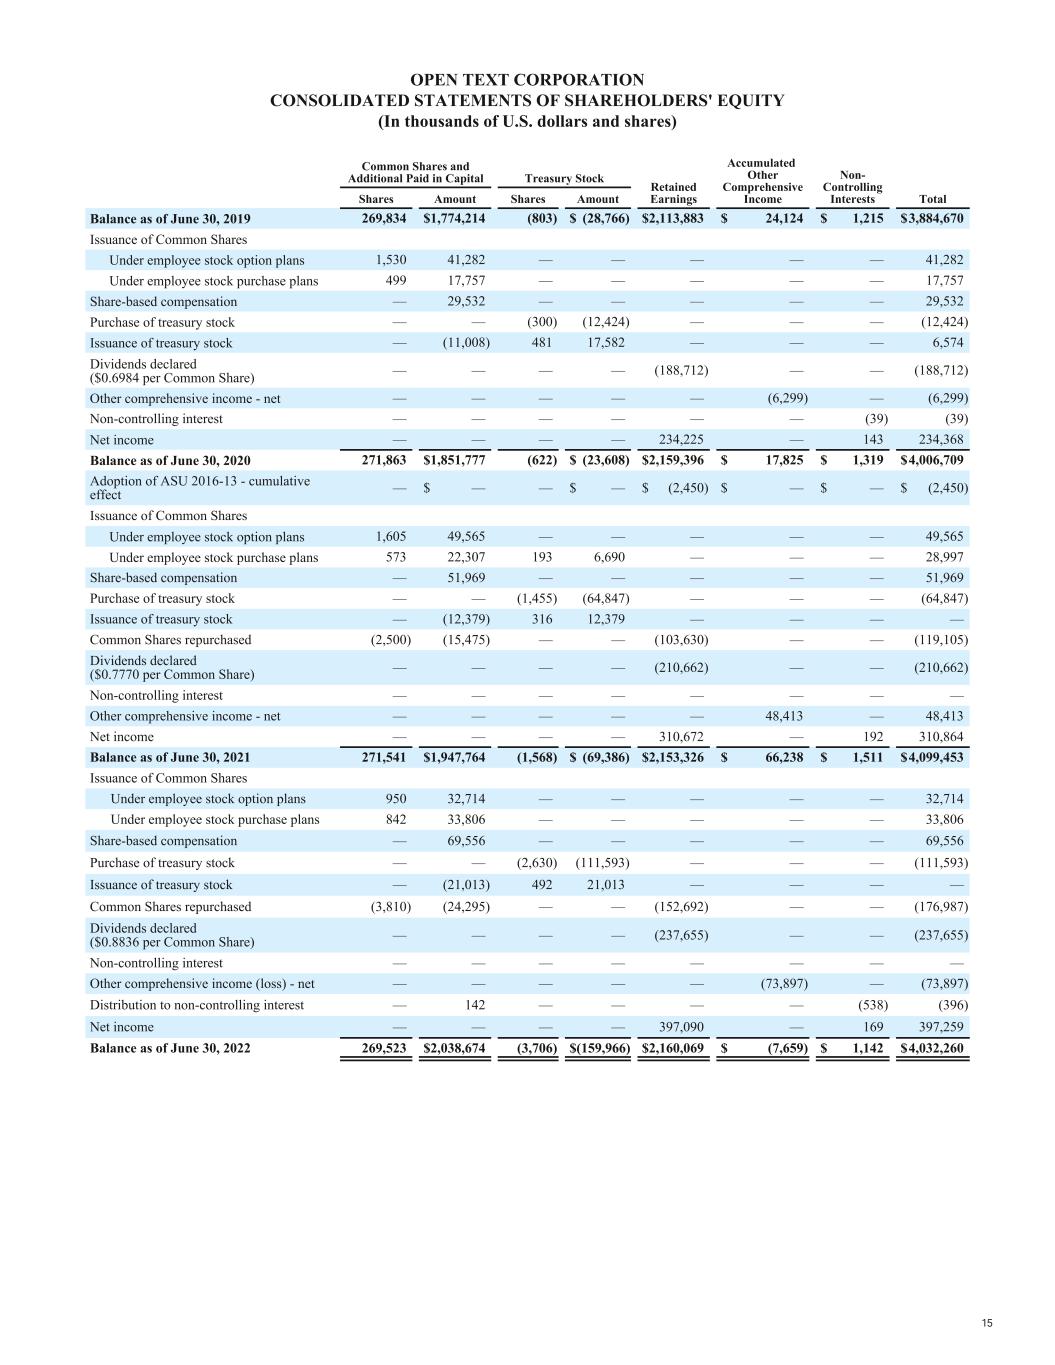
CONSOLIDATED STATEMENTS OF SHAREHOLDERS' EQUITY
(In thousands of U.S. dollars and shares)
| | | | | | | | | | | | | | | | | | | | | | | | | | | | | | | | | | | | | | | | | | | | | | | |
| Common Shares and Additional Paid in Capital | | Treasury Stock | | Retained
Earnings | | Accumulated Other
Comprehensive
Income | | Non-Controlling Interests | | Total |
| Shares | | Amount | | Shares | | Amount | |
| Balance as of June 30, 2019 | 269,834 | | | $ | 1,774,214 | | | (803) | | | $ | (28,766) | | | $ | 2,113,883 | | | $ | 24,124 | | | $ | 1,215 | | | $ | 3,884,670 | |
| Issuance of Common Shares | | | | | | | | | | | | | | | |
| Under employee stock option plans | 1,530 | | | 41,282 | | | — | | | — | | | — | | | — | | | — | | | 41,282 | |
| Under employee stock purchase plans | 499 | | | 17,757 | | | — | | | — | | | — | | | — | | | — | | | 17,757 | |
| Share-based compensation | — | | | 29,532 | | | — | | | — | | | — | | | — | | | — | | | 29,532 | |
| Purchase of treasury stock | — | | | — | | | (300) | | | (12,424) | | | — | | | — | | | — | | | (12,424) | |
| Issuance of treasury stock | — | | | (11,008) | | | 481 | | | 17,582 | | | — | | | — | | | — | | | 6,574 | |
Dividends declared
($0.6984 per Common Share) | — | | | — | | | — | | | — | | | (188,712) | | | — | | | — | | | (188,712) | |
| Other comprehensive income - net | — | | | — | | | — | | | — | | | — | | | (6,299) | | | — | | | (6,299) | |
| Non-controlling interest | — | | | — | | | — | | | — | | | — | | | — | | | (39) | | | (39) | |
| Net income | — | | | — | | | — | | | — | | | 234,225 | | | — | | | 143 | | | 234,368 | |
| Balance as of June 30, 2020 | 271,863 | | | $ | 1,851,777 | | | (622) | | | $ | (23,608) | | | $ | 2,159,396 | | | $ | 17,825 | | | $ | 1,319 | | | $ | 4,006,709 | |
| Adoption of ASU 2016-13 - cumulative effect | — | | | $ | — | | | — | | | $ | — | | | $ | (2,450) | | | $ | — | | | $ | — | | | $ | (2,450) | |
| Issuance of Common Shares | | | | | | | | | | | | | | | |
| Under employee stock option plans | 1,605 | | | 49,565 | | | — | | | — | | | — | | | — | | | — | | | 49,565 | |
| Under employee stock purchase plans | 573 | | | 22,307 | | | 193 | | | 6,690 | | | — | | | — | | | — | | | 28,997 | |
| Share-based compensation | — | | | 51,969 | | | — | | | — | | | — | | | — | | | — | | | 51,969 | |
| Purchase of treasury stock | — | | | — | | | (1,455) | | | (64,847) | | | — | | | — | | | — | | | (64,847) | |
| Issuance of treasury stock | — | | | (12,379) | | | 316 | | | 12,379 | | | — | | | — | | | — | | | — | |
| Common Shares repurchased | (2,500) | | | (15,475) | | | — | | | — | | | (103,630) | | | — | | | — | | | (119,105) | |
Dividends declared
($0.7770 per Common Share) | — | | | — | | | — | | | — | | | (210,662) | | | — | | | — | | | (210,662) | |
| Non-controlling interest | — | | | — | | | — | | | — | | | — | | | — | | | — | | | — | |
| Other comprehensive income - net | — | | | — | | | — | | | — | | | — | | | 48,413 | | | — | | | 48,413 | |
| Net income | — | | | — | | | — | | | — | | | 310,672 | | | — | | | 192 | | | 310,864 | |
| Balance as of June 30, 2021 | 271,541 | | | $ | 1,947,764 | | | (1,568) | | | $ | (69,386) | | | $ | 2,153,326 | | | $ | 66,238 | | | $ | 1,511 | | | $ | 4,099,453 | |
| Issuance of Common Shares | | | | | | | | | | | | | | | |
| Under employee stock option plans | 950 | | | 32,714 | | | — | | | — | | | — | | | — | | | — | | | 32,714 | |
| Under employee stock purchase plans | 842 | | | 33,806 | | | — | | | — | | | — | | | — | | | — | | | 33,806 | |
| Share-based compensation | — | | | 69,556 | | | — | | | — | | | — | | | — | | | — | | | 69,556 | |
| Purchase of treasury stock | — | | | — | | | (2,630) | | | (111,593) | | | — | | | — | | | — | | | (111,593) | |
| Issuance of treasury stock | — | | | (21,013) | | | 492 | | | 21,013 | | | — | | | — | | | — | | | — | |
| Common Shares repurchased | (3,810) | | | (24,295) | | | — | | | — | | | (152,692) | | | — | | | — | | | (176,987) | |
Dividends declared
($0.8836 per Common Share) | — | | | — | | | — | | | — | | | (237,655) | | | — | | | — | | | (237,655) | |
| Non-controlling interest | — | | | — | | | — | | | — | | | — | | | — | | | — | | | — | |
| Other comprehensive income (loss) - net | — | | | — | | | — | | | — | | | — | | | (73,897) | | | — | | | (73,897) | |
| Distribution to non-controlling interest | — | | | 142 | | | — | | | — | | | — | | | — | | | (538) | | | (396) | |
| Net income | — | | | — | | | — | | | — | | | 397,090 | | | — | | | 169 | | | 397,259 | |
| Balance as of June 30, 2022 | 269,523 | | | $ | 2,038,674 | | | (3,706) | | | $ | (159,966) | | | $ | 2,160,069 | | | $ | (7,659) | | | $ | 1,142 | | | $ | 4,032,260 | |
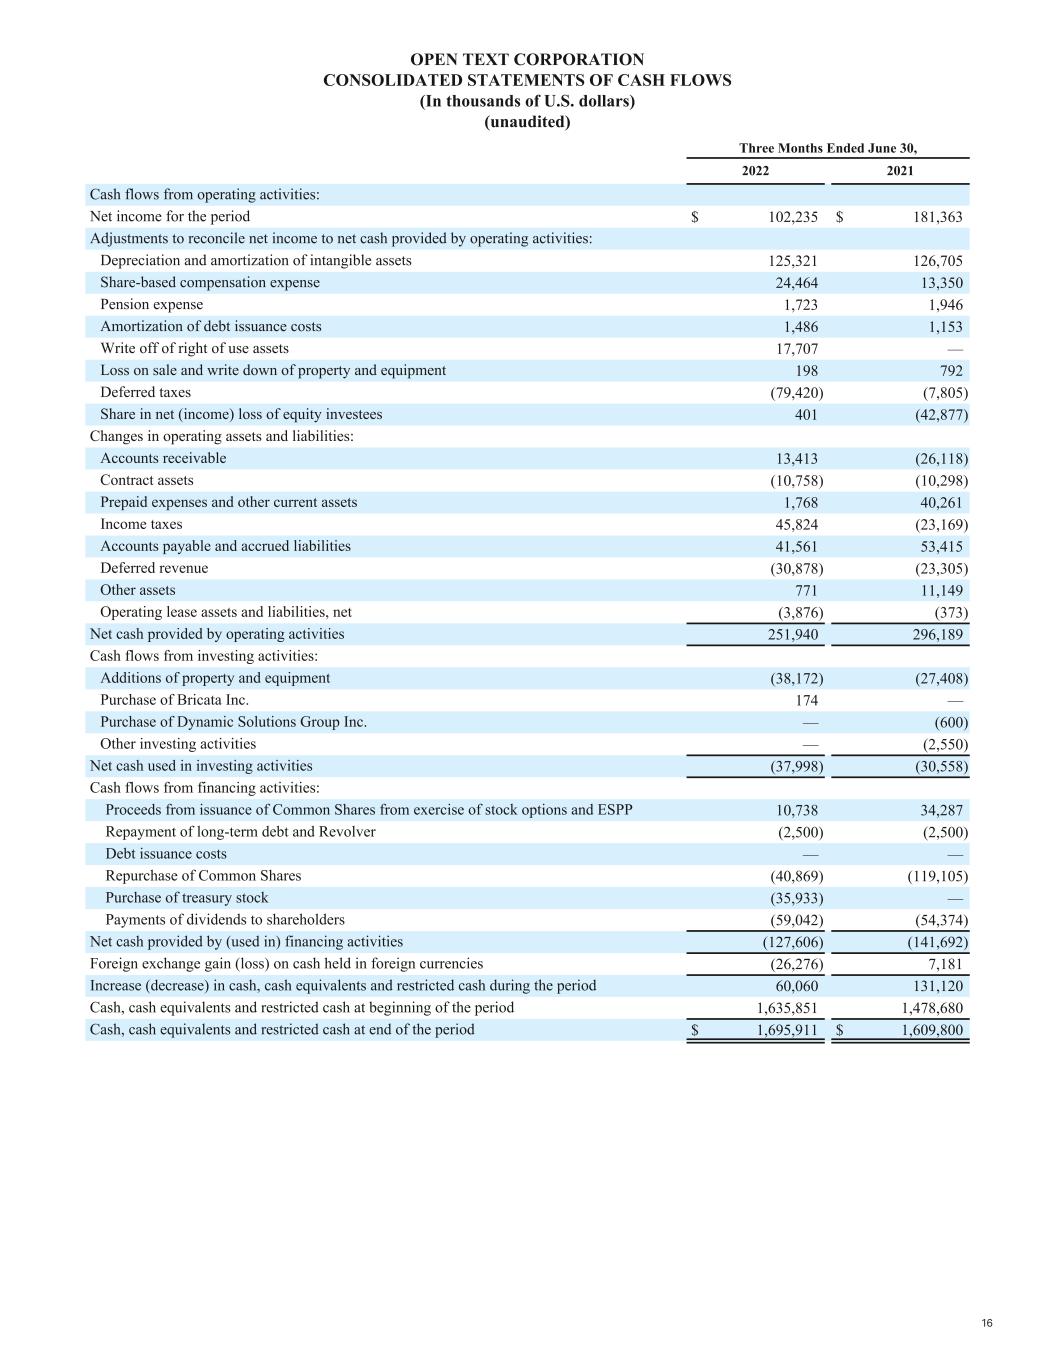
OPEN TEXT CORPORATION
CONSOLIDATED STATEMENTS OF CASH FLOWS
(In thousands of U.S. dollars)
(unaudited)
| | | | | | | | | | | | | | | |
| Three Months Ended June 30, | | |
| | 2022 | | 2021 | | | | |
| Cash flows from operating activities: | | | | | | | |
| Net income for the period | $ | 102,235 | | | $ | 181,363 | | | | | |
| Adjustments to reconcile net income to net cash provided by operating activities: | | | | | | | |
| Depreciation and amortization of intangible assets | 125,321 | | | 126,705 | | | | | |
| Share-based compensation expense | 24,464 | | | 13,350 | | | | | |
| Pension expense | 1,723 | | | 1,946 | | | | | |
| Amortization of debt issuance costs | 1,486 | | | 1,153 | | | | | |
| Write off of right of use assets | 17,707 | | | — | | | | | |
| | | | | | | |
| Loss on sale and write down of property and equipment | 198 | | | 792 | | | | | |
| Deferred taxes | (79,420) | | | (7,805) | | | | | |
| Share in net (income) loss of equity investees | 401 | | | (42,877) | | | | | |
| Changes in operating assets and liabilities: | | | | | | | |
| Accounts receivable | 13,413 | | | (26,118) | | | | | |
| Contract assets | (10,758) | | | (10,298) | | | | | |
| Prepaid expenses and other current assets | 1,768 | | | 40,261 | | | | | |
| Income taxes | 45,824 | | | (23,169) | | | | | |
| Accounts payable and accrued liabilities | 41,561 | | | 53,415 | | | | | |
| Deferred revenue | (30,878) | | | (23,305) | | | | | |
| Other assets | 771 | | | 11,149 | | | | | |
| Operating lease assets and liabilities, net | (3,876) | | | (373) | | | | | |
| Net cash provided by operating activities | 251,940 | | | 296,189 | | | | | |
| Cash flows from investing activities: | | | | | | | |
| Additions of property and equipment | (38,172) | | | (27,408) | | | | | |
| | | | | | | |
| Purchase of Bricata Inc. | 174 | | | — | | | | | |
| | | | | | | |
| Purchase of Dynamic Solutions Group Inc. | — | | | (600) | | | | | |
| Other investing activities | — | | | (2,550) | | | | | |
| Net cash used in investing activities | (37,998) | | | (30,558) | | | | | |
| Cash flows from financing activities: | | | | | | | |
| Proceeds from issuance of Common Shares from exercise of stock options and ESPP | 10,738 | | | 34,287 | | | | | |
| | | | | | | |
| Repayment of long-term debt and Revolver | (2,500) | | | (2,500) | | | | | |
| | | | | | | |
| Debt issuance costs | — | | | — | | | | | |
| Repurchase of Common Shares | (40,869) | | | (119,105) | | | | | |
| Purchase of treasury stock | (35,933) | | | — | | | | | |
| | | | | | | |
| Payments of dividends to shareholders | (59,042) | | | (54,374) | | | | | |
| Net cash provided by (used in) financing activities | (127,606) | | | (141,692) | | | | | |
| Foreign exchange gain (loss) on cash held in foreign currencies | (26,276) | | | 7,181 | | | | | |
| Increase (decrease) in cash, cash equivalents and restricted cash during the period | 60,060 | | | 131,120 | | | | | |
| Cash, cash equivalents and restricted cash at beginning of the period | 1,635,851 | | | 1,478,680 | | | | | |
| Cash, cash equivalents and restricted cash at end of the period | $ | 1,695,911 | | | $ | 1,609,800 | | | | | |
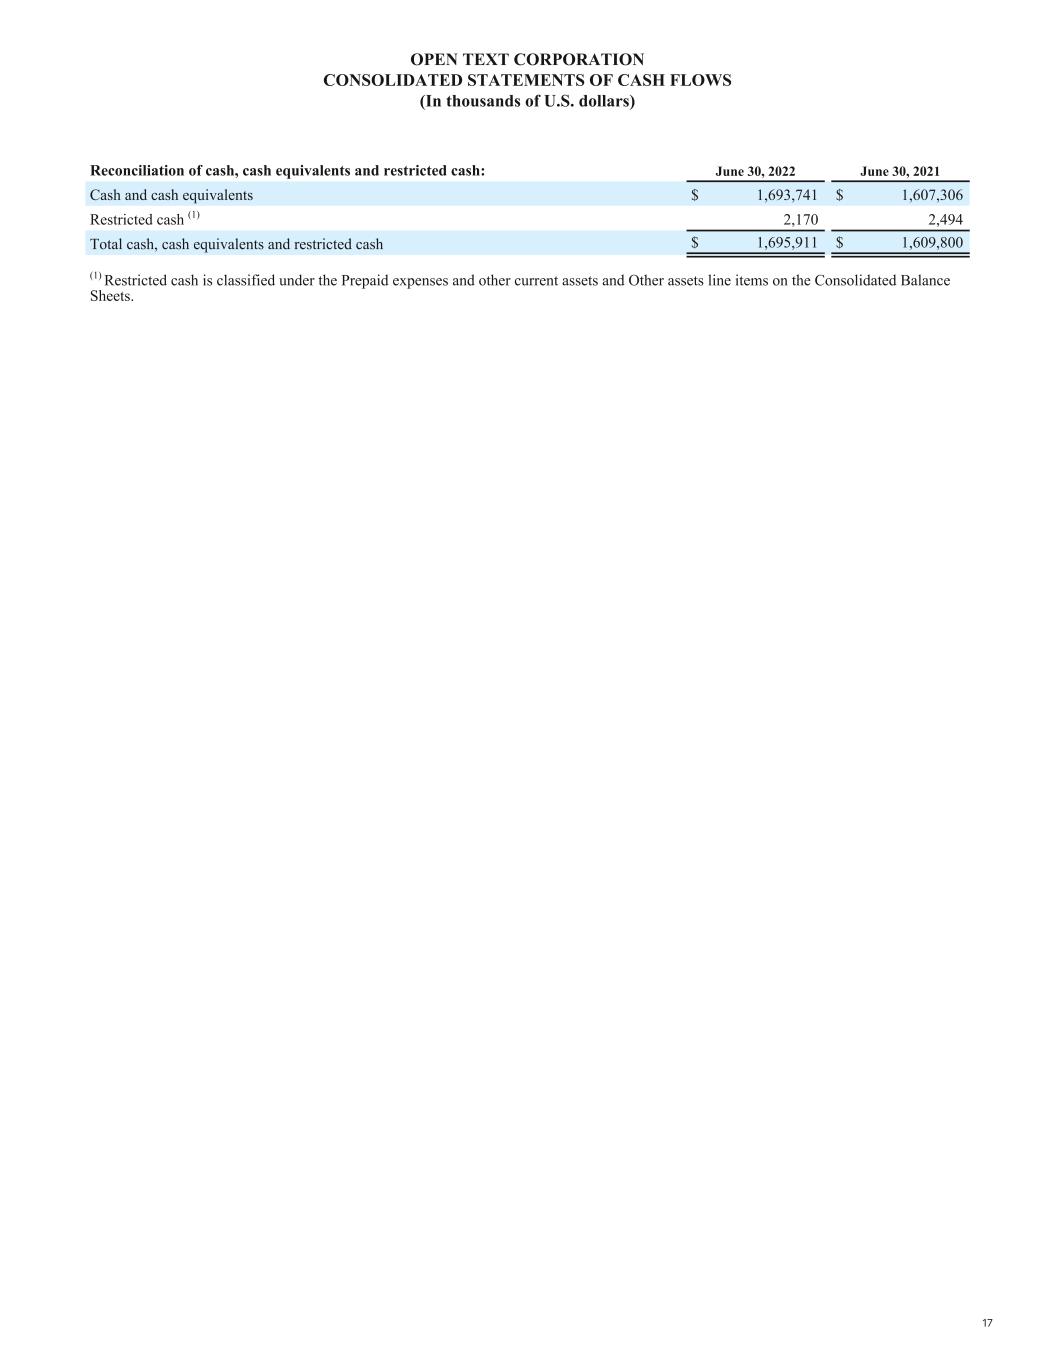
OPEN TEXT CORPORATION
CONSOLIDATED STATEMENTS OF CASH FLOWS
(In thousands of U.S. dollars)
| | | | | | | | | | | |
| Reconciliation of cash, cash equivalents and restricted cash: | June 30, 2022 | | June 30, 2021 |
| Cash and cash equivalents | $ | 1,693,741 | | | $ | 1,607,306 | |
Restricted cash (1) | 2,170 | | | 2,494 | |
| Total cash, cash equivalents and restricted cash | $ | 1,695,911 | | | $ | 1,609,800 | |
| | | |
(1) Restricted cash is classified under the Prepaid expenses and other current assets and Other assets line items on the Consolidated Balance Sheets. |
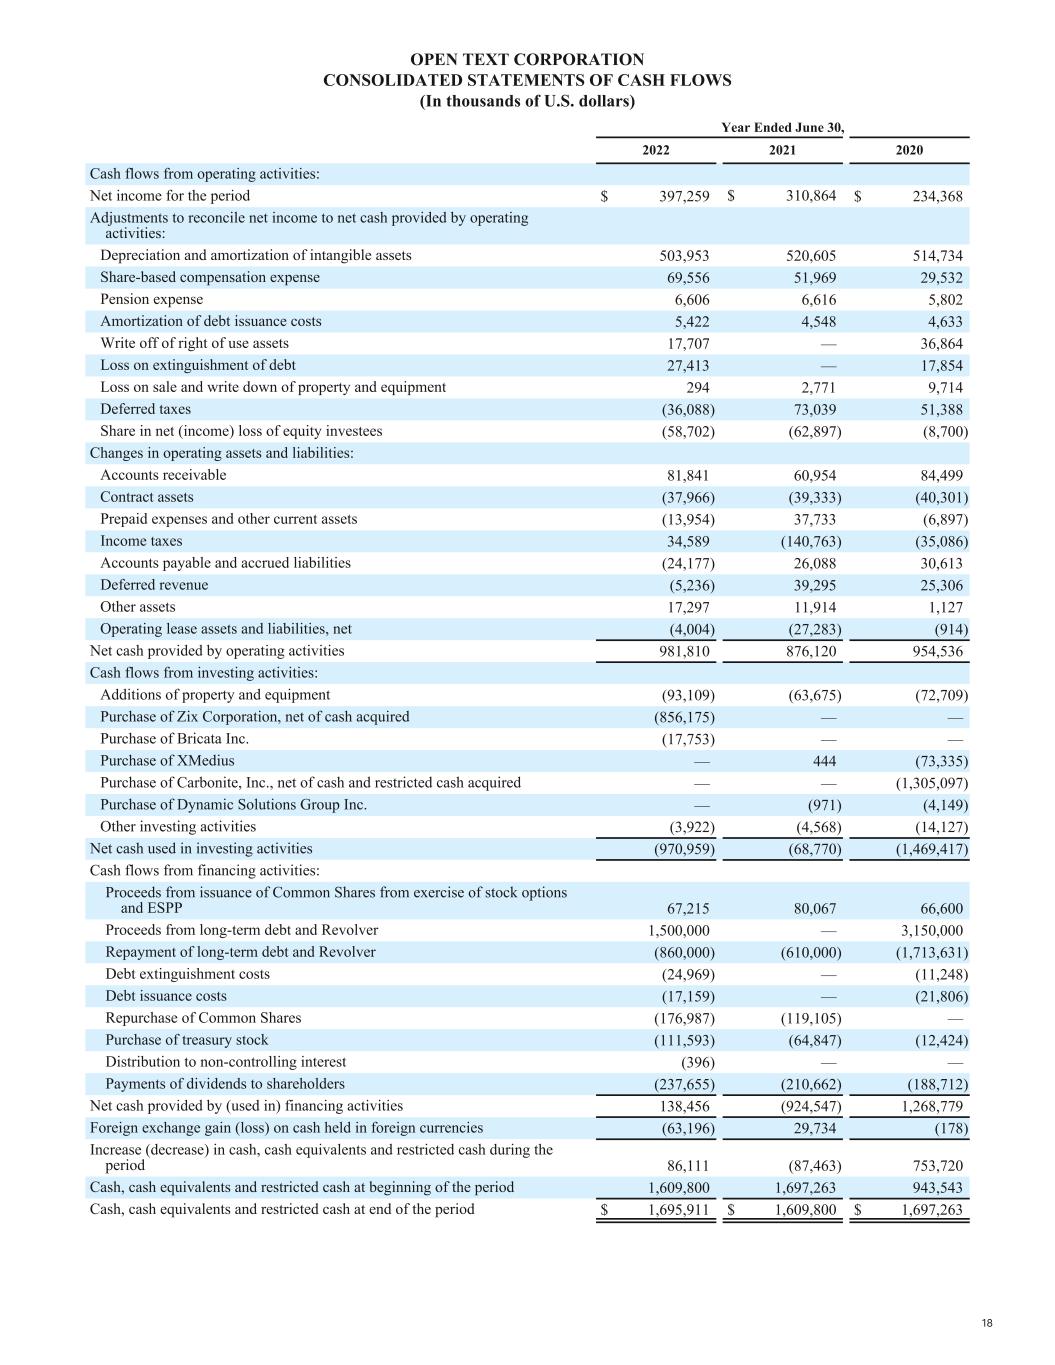
OPEN TEXT CORPORATION
CONSOLIDATED STATEMENTS OF CASH FLOWS
(In thousands of U.S. dollars)
| | | | | | | | | | | | | | | | | | | | | |
| | | Year Ended June 30, |
| | | | | | 2022 | | 2021 | | 2020 |
| Cash flows from operating activities: | | | | | | | | | |
| Net income for the period | | | | | $ | 397,259 | | | $ | 310,864 | | | $ | 234,368 | |
| Adjustments to reconcile net income to net cash provided by operating activities: | | | | | | | | | |
| Depreciation and amortization of intangible assets | | | | | 503,953 | | | 520,605 | | | 514,734 | |
| Share-based compensation expense | | | | | 69,556 | | | 51,969 | | | 29,532 | |
| Pension expense | | | | | 6,606 | | | 6,616 | | | 5,802 | |
| Amortization of debt issuance costs | | | | | 5,422 | | | 4,548 | | | 4,633 | |
| Write off of right of use assets | | | | | 17,707 | | | — | | | 36,864 | |
| Loss on extinguishment of debt | | | | | 27,413 | | | — | | | 17,854 | |
| Loss on sale and write down of property and equipment | | | | | 294 | | | 2,771 | | | 9,714 | |
| Deferred taxes | | | | | (36,088) | | | 73,039 | | | 51,388 | |
| Share in net (income) loss of equity investees | | | | | (58,702) | | | (62,897) | | | (8,700) | |
| Changes in operating assets and liabilities: | | | | | | | | | |
| Accounts receivable | | | | | 81,841 | | | 60,954 | | | 84,499 | |
| Contract assets | | | | | (37,966) | | | (39,333) | | | (40,301) | |
| Prepaid expenses and other current assets | | | | | (13,954) | | | 37,733 | | | (6,897) | |
| Income taxes | | | | | 34,589 | | | (140,763) | | | (35,086) | |
| Accounts payable and accrued liabilities | | | | | (24,177) | | | 26,088 | | | 30,613 | |
| Deferred revenue | | | | | (5,236) | | | 39,295 | | | 25,306 | |
| Other assets | | | | | 17,297 | | | 11,914 | | | 1,127 | |
| Operating lease assets and liabilities, net | | | | | (4,004) | | | (27,283) | | | (914) | |
| Net cash provided by operating activities | | | | | 981,810 | | | 876,120 | | | 954,536 | |
| Cash flows from investing activities: | | | | | | | | | |
| Additions of property and equipment | | | | | (93,109) | | | (63,675) | | | (72,709) | |
| Purchase of Zix Corporation, net of cash acquired | | | | | (856,175) | | | — | | | — | |
| Purchase of Bricata Inc. | | | | | (17,753) | | | — | | | — | |
| Purchase of XMedius | | | | | — | | | 444 | | | (73,335) | |
| Purchase of Carbonite, Inc., net of cash and restricted cash acquired | | | | | — | | | — | | | (1,305,097) | |
| Purchase of Dynamic Solutions Group Inc. | | | | | — | | | (971) | | | (4,149) | |
| Other investing activities | | | | | (3,922) | | | (4,568) | | | (14,127) | |
| Net cash used in investing activities | | | | | (970,959) | | | (68,770) | | | (1,469,417) | |
| Cash flows from financing activities: | | | | | | | | | |
| Proceeds from issuance of Common Shares from exercise of stock options and ESPP | | | | | 67,215 | | | 80,067 | | | 66,600 | |
| Proceeds from long-term debt and Revolver | | | | | 1,500,000 | | | — | | | 3,150,000 | |
| Repayment of long-term debt and Revolver | | | | | (860,000) | | | (610,000) | | | (1,713,631) | |
| Debt extinguishment costs | | | | | (24,969) | | | — | | | (11,248) | |
| Debt issuance costs | | | | | (17,159) | | | — | | | (21,806) | |
| Repurchase of Common Shares | | | | | (176,987) | | | (119,105) | | | — | |
| Purchase of treasury stock | | | | | (111,593) | | | (64,847) | | | (12,424) | |
| Distribution to non-controlling interest | | | | | (396) | | | — | | | — | |
| Payments of dividends to shareholders | | | | | (237,655) | | | (210,662) | | | (188,712) | |
| Net cash provided by (used in) financing activities | | | | | 138,456 | | | (924,547) | | | 1,268,779 | |
| Foreign exchange gain (loss) on cash held in foreign currencies | | | | | (63,196) | | | 29,734 | | | (178) | |
| Increase (decrease) in cash, cash equivalents and restricted cash during the period | | | | | 86,111 | | | (87,463) | | | 753,720 | |
| Cash, cash equivalents and restricted cash at beginning of the period | | | | | 1,609,800 | | | 1,697,263 | | | 943,543 | |
| Cash, cash equivalents and restricted cash at end of the period | | | | | $ | 1,695,911 | | | $ | 1,609,800 | | | $ | 1,697,263 | |
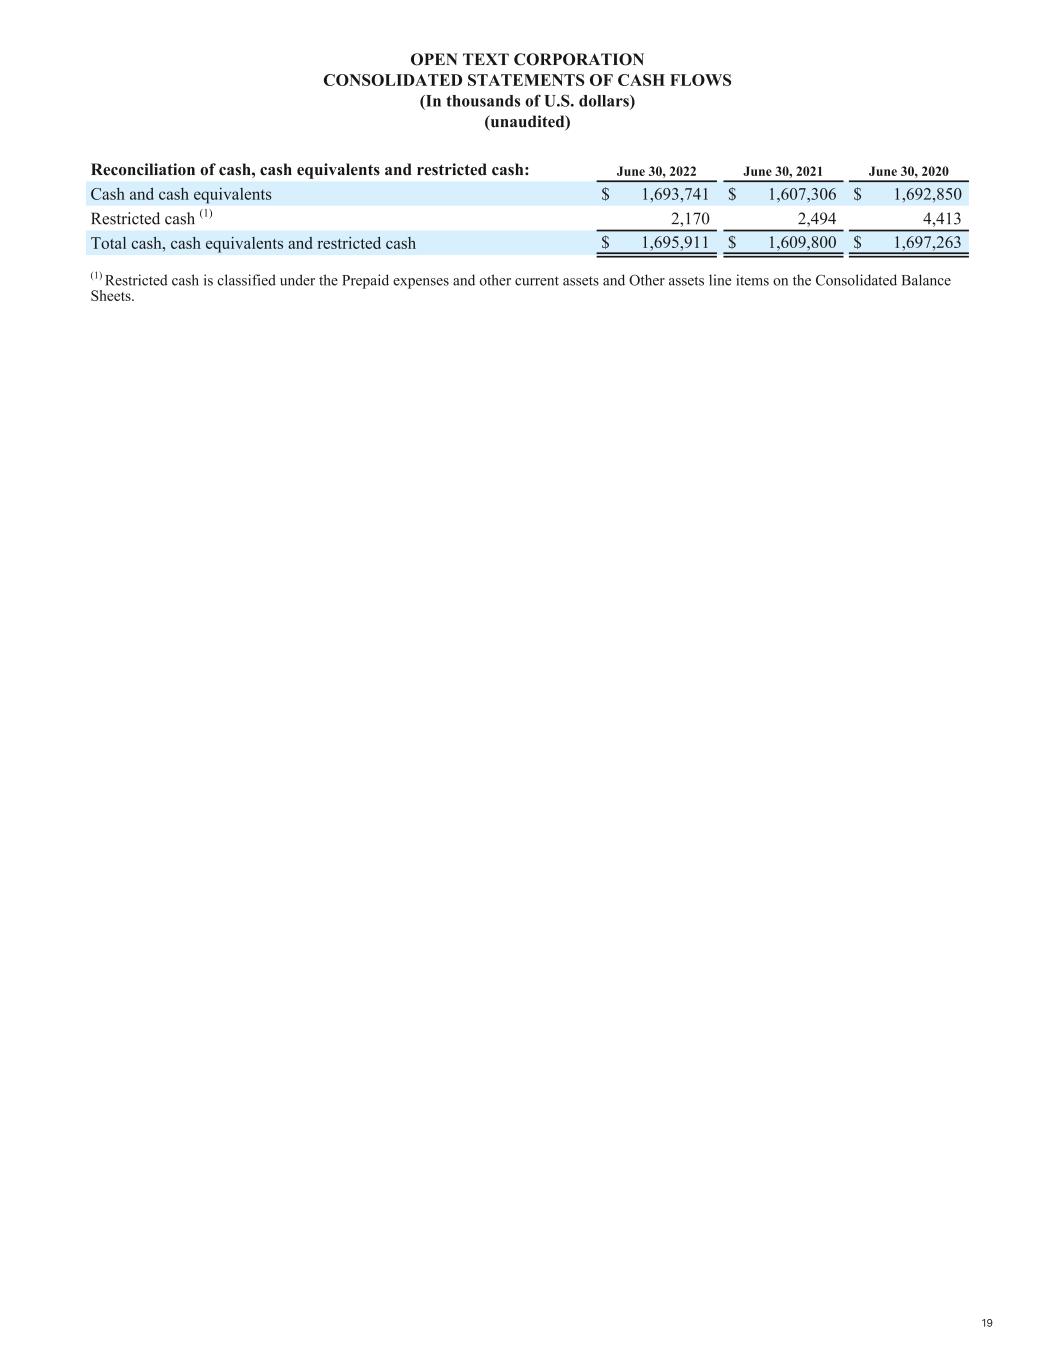
OPEN TEXT CORPORATION
CONSOLIDATED STATEMENTS OF CASH FLOWS
(In thousands of U.S. dollars)
(unaudited)
| | | | | | | | | | | | | | | | | |
| Reconciliation of cash, cash equivalents and restricted cash: | June 30, 2022 | | June 30, 2021 | | June 30, 2020 |
| Cash and cash equivalents | $ | 1,693,741 | | | $ | 1,607,306 | | | $ | 1,692,850 | |
Restricted cash (1) | 2,170 | | | 2,494 | | | 4,413 | |
| Total cash, cash equivalents and restricted cash | $ | 1,695,911 | | | $ | 1,609,800 | | | $ | 1,697,263 | |
| | | | | |
(1) Restricted cash is classified under the Prepaid expenses and other current assets and Other assets line items on the Consolidated Balance Sheets. |
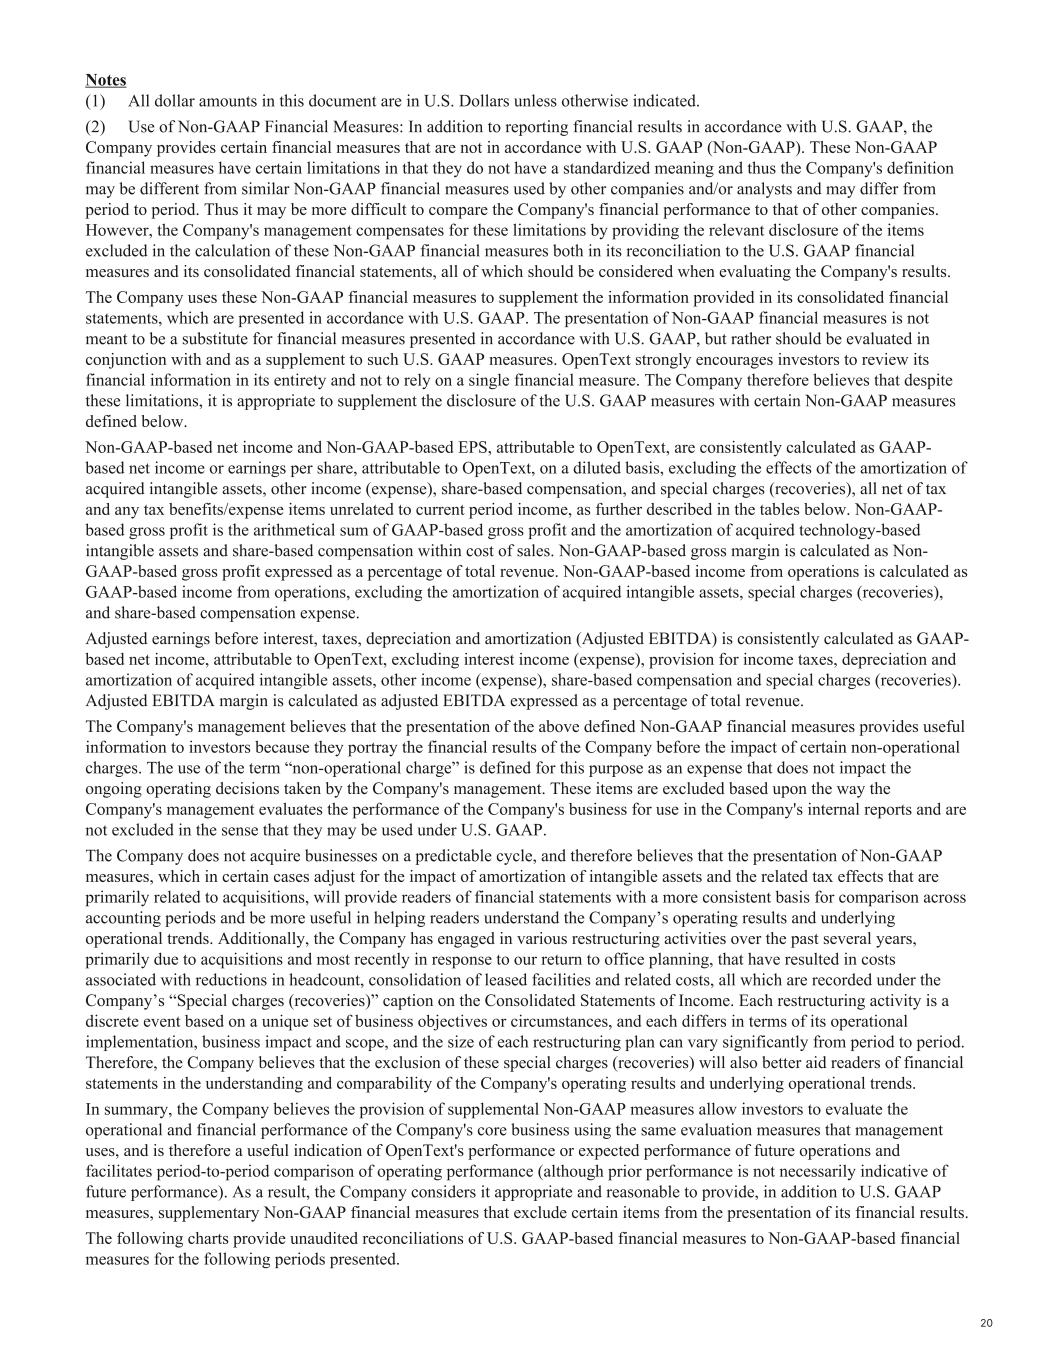
Notes
(1) All dollar amounts in this press release are in U.S. Dollars unless otherwise indicated.
(2) Use of Non-GAAP Financial Measures: In addition to reporting financial results in accordance with U.S. GAAP, the Company provides certain financial measures that are not in accordance with U.S. GAAP (Non-GAAP). These Non-GAAP financial measures have certain limitations in that they do not have a standardized meaning and thus the Company's definition may be different from similar Non-GAAP financial measures used by other companies and/or analysts and may differ from period to period. Thus it may be more difficult to compare the Company's financial performance to that of other companies. However, the Company's management compensates for these limitations by providing the relevant disclosure of the items excluded in the calculation of these Non-GAAP financial measures both in its reconciliation to the U.S. GAAP financial measures and its consolidated financial statements, all of which should be considered when evaluating the Company's results.
The Company uses these Non-GAAP financial measures to supplement the information provided in its consolidated financial statements, which are presented in accordance with U.S. GAAP. The presentation of Non-GAAP financial measures is not meant to be a substitute for financial measures presented in accordance with U.S. GAAP, but rather should be evaluated in conjunction with and as a supplement to such U.S. GAAP measures. OpenText strongly encourages investors to review its financial information in its entirety and not to rely on a single financial measure. The Company therefore believes that despite these limitations, it is appropriate to supplement the disclosure of the U.S. GAAP measures with certain Non-GAAP measures defined below.
Non-GAAP-based net income and Non-GAAP-based EPS, attributable to OpenText, are consistently calculated as GAAP-based net income or earnings per share, attributable to OpenText, on a diluted basis, excluding the effects of the amortization of acquired intangible assets, other income (expense), share-based compensation, and special charges (recoveries), all net of tax and any tax benefits/expense items unrelated to current period income, as further described in the tables below. Non-GAAP-based gross profit is the arithmetical sum of GAAP-based gross profit and the amortization of acquired technology-based intangible assets and share-based compensation within cost of sales. Non-GAAP-based gross margin is calculated as Non-GAAP-based gross profit expressed as a percentage of total revenue. Non-GAAP-based income from operations is calculated as GAAP-based income from operations, excluding the amortization of acquired intangible assets, special charges (recoveries), and share-based compensation expense.
Adjusted earnings before interest, taxes, depreciation and amortization (Adjusted EBITDA) is consistently calculated as GAAP-based net income, attributable to OpenText, excluding interest income (expense), provision for income taxes, depreciation and amortization of acquired intangible assets, other income (expense), share-based compensation and special charges (recoveries). Adjusted EBITDA margin is calculated as adjusted EBITDA expressed as a percentage of total revenue.
The Company's management believes that the presentation of the above defined Non-GAAP financial measures provides useful information to investors because they portray the financial results of the Company before the impact of certain non-operational charges. The use of the term “non-operational charge” is defined for this purpose as an expense that does not impact the ongoing operating decisions taken by the Company's management. These items are excluded based upon the way the Company's management evaluates the performance of the Company's business for use in the Company's internal reports and are not excluded in the sense that they may be used under U.S. GAAP.
The Company does not acquire businesses on a predictable cycle, and therefore believes that the presentation of Non-GAAP measures, which in certain cases adjust for the impact of amortization of intangible assets and the related tax effects that are primarily related to acquisitions, will provide readers of financial statements with a more consistent basis for comparison across accounting periods and be more useful in helping readers understand the Company’s operating results and underlying operational trends. Additionally, the Company has engaged in various restructuring activities over the past several years, primarily due to acquisitions and most recently in response to our return to office planning, that have resulted in costs associated with reductions in headcount, consolidation of leased facilities and related costs, all which are recorded under the Company’s “Special charges (recoveries)” caption on the Consolidated Statements of Income. Each restructuring activity is a discrete event based on a unique set of business objectives or circumstances, and each differs in terms of its operational implementation, business impact and scope, and the size of each restructuring plan can vary significantly from period to period. Therefore, the Company believes that the exclusion of these special charges (recoveries) will also better aid readers of financial statements in the understanding and comparability of the Company's operating results and underlying operational trends.
In summary, the Company believes the provision of supplemental Non-GAAP measures allow investors to evaluate the operational and financial performance of the Company's core business using the same evaluation measures that management uses, and is therefore a useful indication of OpenText's performance or expected performance of future operations and facilitates period-to-period comparison of operating performance (although prior performance is not necessarily indicative of future performance). As a result, the Company considers it appropriate and reasonable to provide, in addition to U.S. GAAP measures, supplementary Non-GAAP financial measures that exclude certain items from the presentation of its financial results.
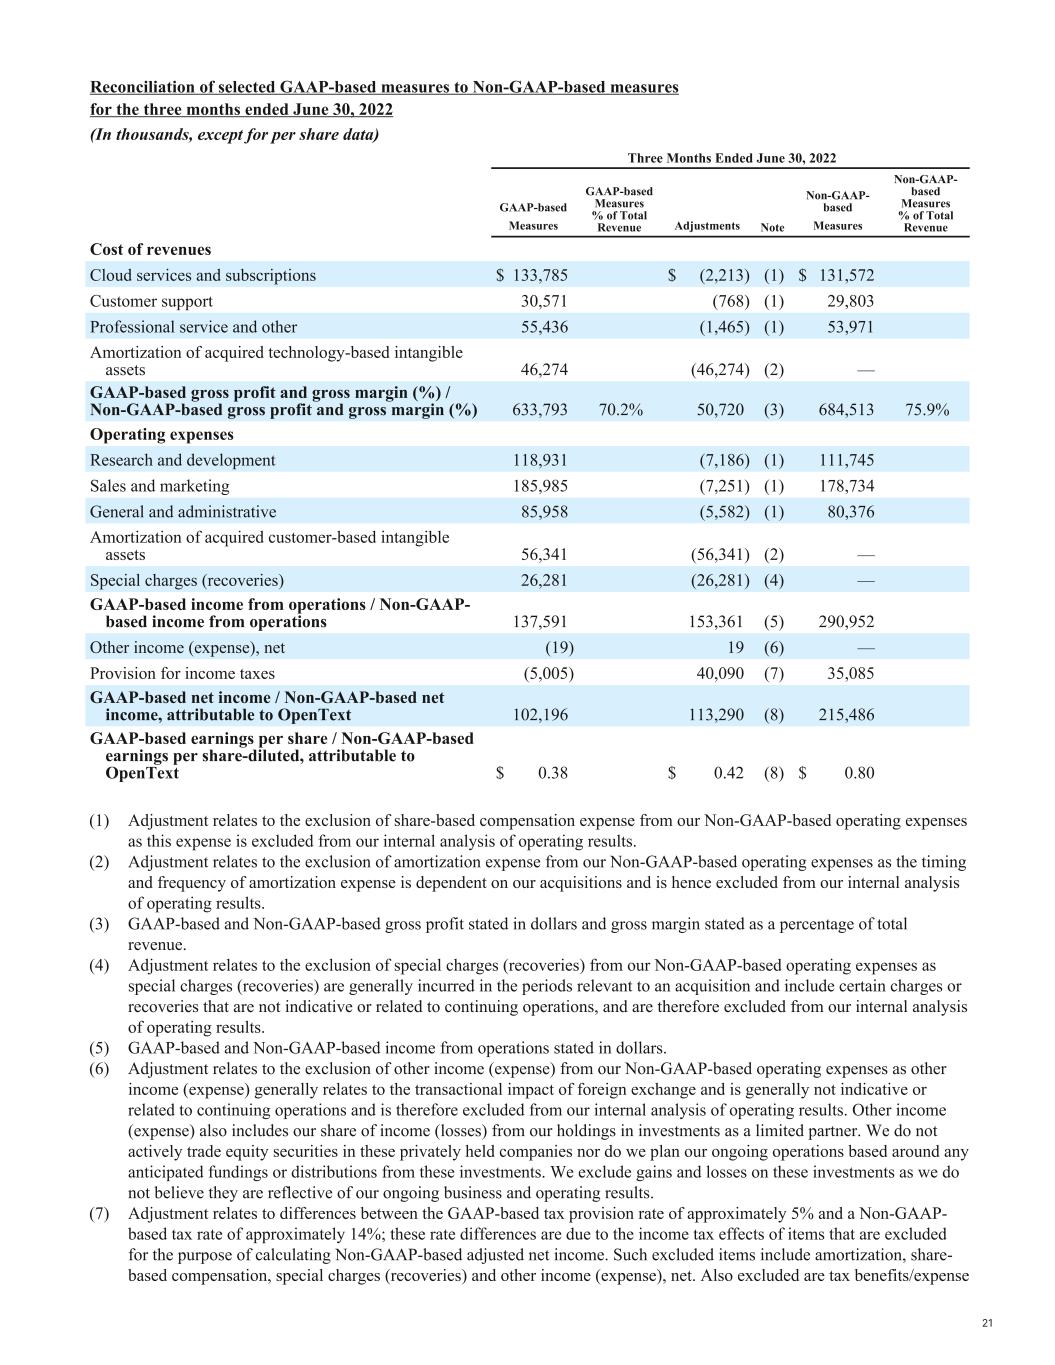
The following charts provide unaudited reconciliations of U.S. GAAP-based financial measures to Non-GAAP-based financial measures for the following periods presented.
| | | | | | | | | | | | | | | | | | | | |
Reconciliation of selected GAAP-based measures to Non-GAAP-based measures for the three months ended June 30, 2022 (In thousands, except for per share data) |
| | Three Months Ended June 30, 2022 |
| | GAAP-based Measures | GAAP-based Measures
% of Total Revenue | Adjustments | Note | Non-GAAP-based Measures | Non-GAAP-based Measures
% of Total Revenue |
| Cost of revenues | | | | | | |
| Cloud services and subscriptions | $ | 133,785 | | | $ | (2,213) | | (1) | $ | 131,572 | | |
| Customer support | 30,571 | | | (768) | | (1) | 29,803 | | |
| Professional service and other | 55,436 | | | (1,465) | | (1) | 53,971 | | |
| Amortization of acquired technology-based intangible assets | 46,274 | | | (46,274) | | (2) | — | | |
| GAAP-based gross profit and gross margin (%) / Non-GAAP-based gross profit and gross margin (%) | 633,793 | | 70.2% | 50,720 | | (3) | 684,513 | | 75.9% |
| Operating expenses | | | | | | |
| Research and development | 118,931 | | | (7,186) | | (1) | 111,745 | | |
| Sales and marketing | 185,985 | | | (7,251) | | (1) | 178,734 | | |
| General and administrative | 85,958 | | | (5,582) | | (1) | 80,376 | | |
| Amortization of acquired customer-based intangible assets | 56,341 | | | (56,341) | | (2) | — | | |
| Special charges (recoveries) | 26,281 | | | (26,281) | | (4) | — | | |
| GAAP-based income from operations / Non-GAAP-based income from operations | 137,591 | | | 153,361 | | (5) | 290,952 | | |
| Other income (expense), net | (19) | | | 19 | | (6) | — | | |
| Provision for income taxes | (5,005) | | | 40,090 | | (7) | 35,085 | | |
| GAAP-based net income / Non-GAAP-based net income, attributable to OpenText | 102,196 | | | 113,290 | | (8) | 215,486 | | |
| GAAP-based earnings per share / Non-GAAP-based earnings per share-diluted, attributable to OpenText | $ | 0.38 | | | $ | 0.42 | | (8) | $ | 0.80 | | |
(1) Adjustment relates to the exclusion of share-based compensation expense from our Non-GAAP-based operating expenses as this expense is excluded from our internal analysis of operating results.
(2) Adjustment relates to the exclusion of amortization expense from our Non-GAAP-based operating expenses as the timing and frequency of amortization expense is dependent on our acquisitions and is hence excluded from our internal analysis of operating results.
(3) GAAP-based and Non-GAAP-based gross profit stated in dollars and gross margin stated as a percentage of total revenue.
(4) Adjustment relates to the exclusion of special charges (recoveries) from our Non-GAAP-based operating expenses as special charges (recoveries) are generally incurred in the periods relevant to an acquisition and include certain charges or recoveries that are not indicative or related to continuing operations, and are therefore excluded from our internal analysis of operating results.
(5) GAAP-based and Non-GAAP-based income from operations stated in dollars.
(6) Adjustment relates to the exclusion of other income (expense) from our Non-GAAP-based operating expenses as other income (expense) generally relates to the transactional impact of foreign exchange and is generally not indicative or related to continuing operations and is therefore excluded from our internal analysis of operating results. Other income (expense) also includes our share of income (losses) from our holdings in investments as a limited partner. We do not actively trade equity securities in these privately held companies nor do we plan our ongoing operations based around any anticipated fundings or distributions from these investments. We exclude gains and losses on these investments as we do not believe they are reflective of our ongoing business and operating results.
(7) Adjustment relates to differences between the GAAP-based tax provision rate of approximately 5% and a Non-GAAP-based tax rate of approximately 14%; these rate differences are due to the income tax effects of items that are excluded for the purpose of calculating Non-GAAP-based adjusted net income. Such excluded items include amortization, share-based compensation, special charges (recoveries) and other income (expense), net. Also excluded are tax benefits/expense
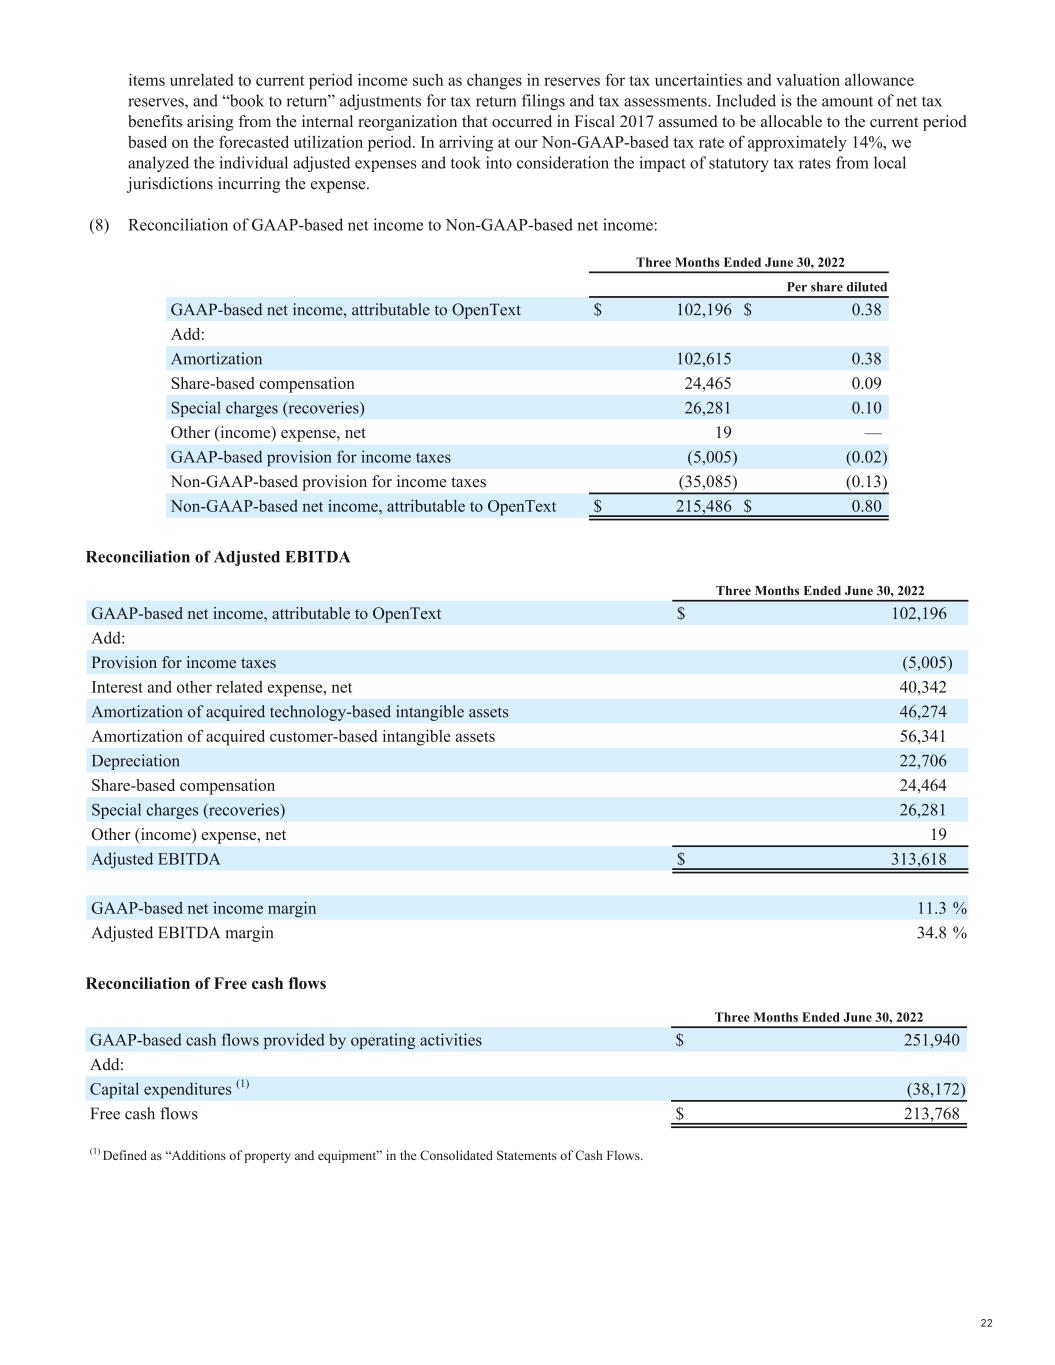
items unrelated to current period income such as changes in reserves for tax uncertainties and valuation allowance reserves, and “book to return” adjustments for tax return filings and tax assessments. Included is the amount of net tax benefits arising from the internal reorganization that occurred in Fiscal 2017 assumed to be allocable to the current period based on the forecasted utilization period. In arriving at our Non-GAAP-based tax rate of approximately 14%, we analyzed the individual adjusted expenses and took into consideration the impact of statutory tax rates from local jurisdictions incurring the expense.
(8) Reconciliation of GAAP-based net income to Non-GAAP-based net income:
| | | | | | | | |
| Three Months Ended June 30, 2022 |
| | Per share diluted |
| GAAP-based net income, attributable to OpenText | $ | 102,196 | | $ | 0.38 | |
| Add: | | |
| Amortization | 102,615 | | 0.38 | |
| Share-based compensation | 24,465 | | 0.09 | |
| Special charges (recoveries) | 26,281 | | 0.10 | |
| Other (income) expense, net | 19 | | — | |
| GAAP-based provision for income taxes | (5,005) | | (0.02) | |
| Non-GAAP-based provision for income taxes | (35,085) | | (0.13) | |
| Non-GAAP-based net income, attributable to OpenText | $ | 215,486 | | $ | 0.80 | |
Reconciliation of Adjusted EBITDA
| | | | | |
| Three Months Ended June 30, 2022 |
| GAAP-based net income, attributable to OpenText | $ | 102,196 | |
| Add: | |
| Provision for income taxes | (5,005) | |
| Interest and other related expense, net | 40,342 | |
| Amortization of acquired technology-based intangible assets | 46,274 | |
| Amortization of acquired customer-based intangible assets | 56,341 | |
| Depreciation | 22,706 | |
| Share-based compensation | 24,464 | |
| Special charges (recoveries) | 26,281 | |
| Other (income) expense, net | 19 | |
| Adjusted EBITDA | $ | 313,618 | |
| |
| GAAP-based net income margin | 11.3 | % |
| Adjusted EBITDA margin | 34.8 | % |
Reconciliation of Free cash flows
| | | | | |
| Three Months Ended June 30, 2022 |
| GAAP-based cash flows provided by operating activities | $ | 251,940 | |
| Add: | |
Capital expenditures (1) | (38,172) | |
| Free cash flows | $ | 213,768 | |
| |
(1) Defined as “Additions of property and equipment” in the Consolidated Statements of Cash Flows. |
| | | | | | | | | | | | | | | | | | | | |
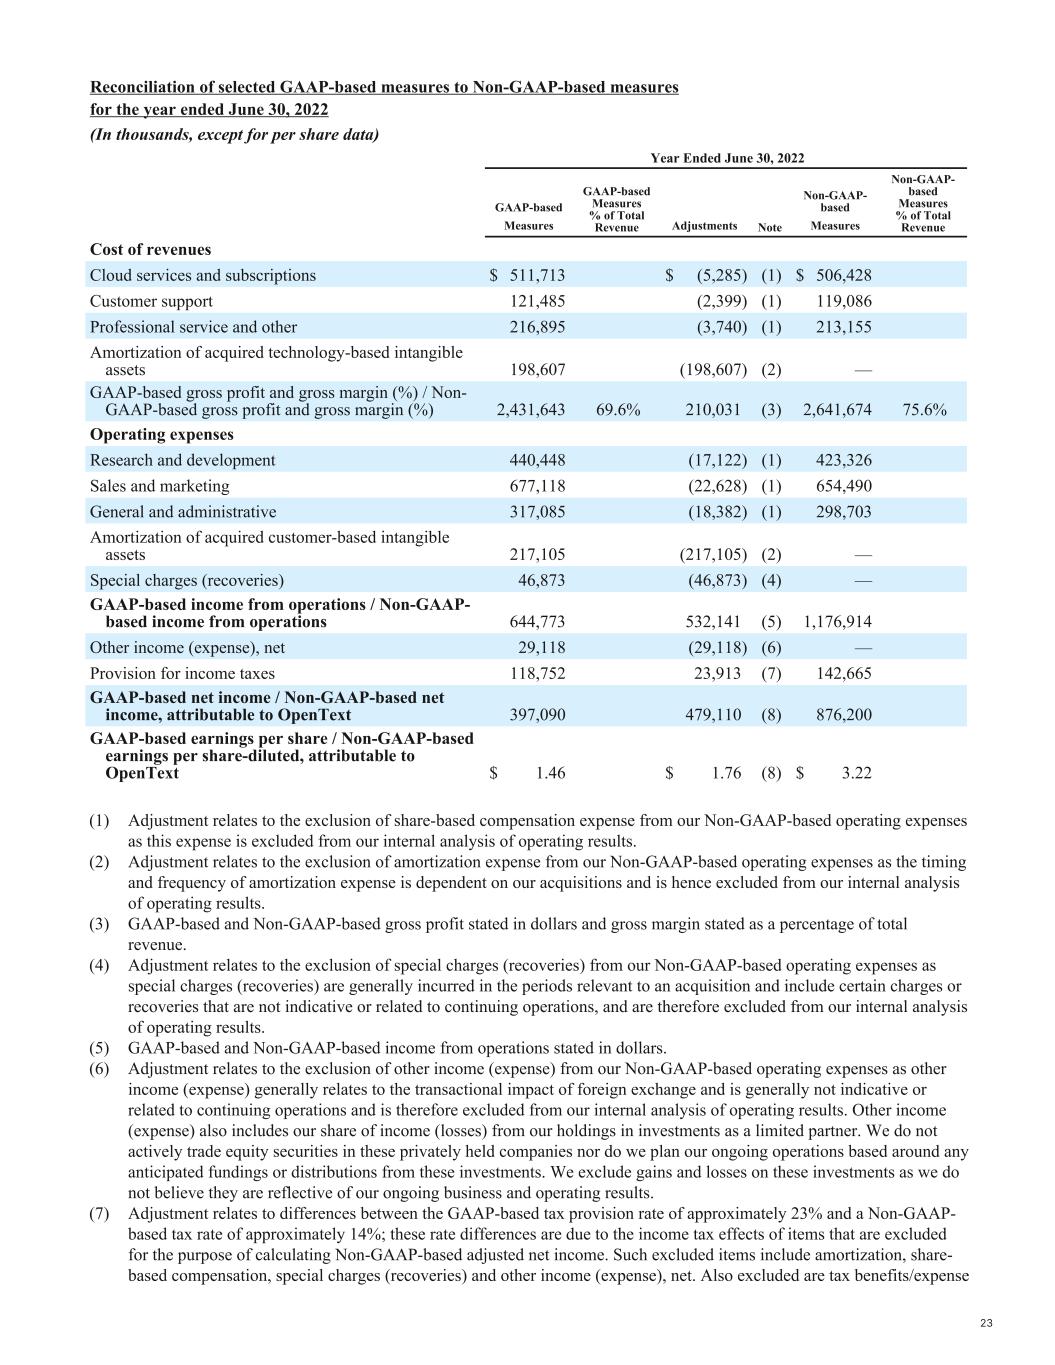
Reconciliation of selected GAAP-based measures to Non-GAAP-based measures for the year ended June 30, 2022 (In thousands, except for per share data) |
| | Year Ended June 30, 2022 |
| | GAAP-based Measures | GAAP-based Measures
% of Total Revenue | Adjustments | Note | Non-GAAP-based Measures | Non-GAAP-based Measures
% of Total Revenue |
| Cost of revenues | | | | | | |
| Cloud services and subscriptions | $ | 511,713 | | | $ | (5,285) | | (1) | $ | 506,428 | | |
| Customer support | 121,485 | | | (2,399) | | (1) | 119,086 | | |
| Professional service and other | 216,895 | | | (3,740) | | (1) | 213,155 | | |
| Amortization of acquired technology-based intangible assets | 198,607 | | | (198,607) | | (2) | — | | |
| GAAP-based gross profit and gross margin (%) / Non-GAAP-based gross profit and gross margin (%) | 2,431,643 | | 69.6% | 210,031 | | (3) | 2,641,674 | | 75.6% |
| Operating expenses | | | | | | |
| Research and development | 440,448 | | | (17,122) | | (1) | 423,326 | | |
| Sales and marketing | 677,118 | | | (22,628) | | (1) | 654,490 | | |
| General and administrative | 317,085 | | | (18,382) | | (1) | 298,703 | | |
| Amortization of acquired customer-based intangible assets | 217,105 | | | (217,105) | | (2) | — | | |
| Special charges (recoveries) | 46,873 | | | (46,873) | | (4) | — | | |
| GAAP-based income from operations / Non-GAAP-based income from operations | 644,773 | | | 532,141 | | (5) | 1,176,914 | | |
| Other income (expense), net | 29,118 | | | (29,118) | | (6) | — | | |
| Provision for income taxes | 118,752 | | | 23,913 | | (7) | 142,665 | | |
| GAAP-based net income / Non-GAAP-based net income, attributable to OpenText | 397,090 | | | 479,110 | | (8) | 876,200 | | |
| GAAP-based earnings per share / Non-GAAP-based earnings per share-diluted, attributable to OpenText | $ | 1.46 | | | $ | 1.76 | | (8) | $ | 3.22 | | |
(1) Adjustment relates to the exclusion of share-based compensation expense from our Non-GAAP-based operating expenses as this expense is excluded from our internal analysis of operating results.
(2) Adjustment relates to the exclusion of amortization expense from our Non-GAAP-based operating expenses as the timing and frequency of amortization expense is dependent on our acquisitions and is hence excluded from our internal analysis of operating results.
(3) GAAP-based and Non-GAAP-based gross profit stated in dollars and gross margin stated as a percentage of total revenue.
(4) Adjustment relates to the exclusion of special charges (recoveries) from our Non-GAAP-based operating expenses as special charges (recoveries) are generally incurred in the periods relevant to an acquisition and include certain charges or recoveries that are not indicative or related to continuing operations, and are therefore excluded from our internal analysis of operating results.
(5) GAAP-based and Non-GAAP-based income from operations stated in dollars.
(6) Adjustment relates to the exclusion of other income (expense) from our Non-GAAP-based operating expenses as other income (expense) generally relates to the transactional impact of foreign exchange and is generally not indicative or related to continuing operations and is therefore excluded from our internal analysis of operating results. Other income (expense) also includes our share of income (losses) from our holdings in investments as a limited partner. We do not actively trade equity securities in these privately held companies nor do we plan our ongoing operations based around any anticipated fundings or distributions from these investments. We exclude gains and losses on these investments as we do not believe they are reflective of our ongoing business and operating results.
(7) Adjustment relates to differences between the GAAP-based tax provision rate of approximately 23% and a Non-GAAP-based tax rate of approximately 14%; these rate differences are due to the income tax effects of items that are excluded for the purpose of calculating Non-GAAP-based adjusted net income. Such excluded items include amortization, share-based compensation, special charges (recoveries) and other income (expense), net. Also excluded are tax benefits/expense
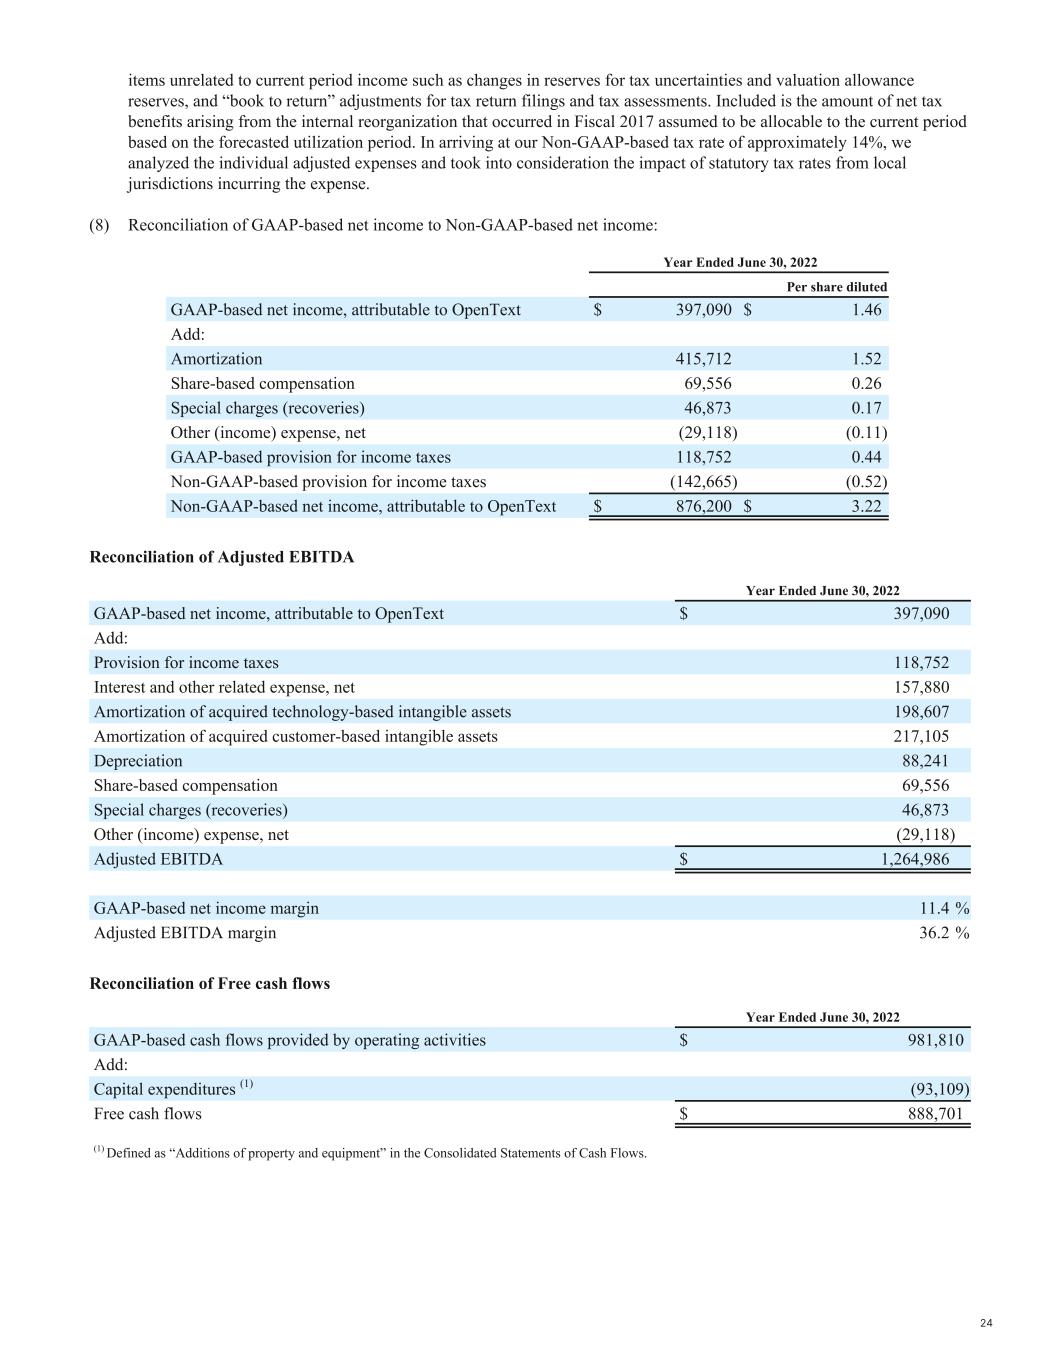
items unrelated to current period income such as changes in reserves for tax uncertainties and valuation allowance reserves, and “book to return” adjustments for tax return filings and tax assessments. Included is the amount of net tax benefits arising from the internal reorganization that occurred in Fiscal 2017 assumed to be allocable to the current period based on the forecasted utilization period. In arriving at our Non-GAAP-based tax rate of approximately 14%, we analyzed the individual adjusted expenses and took into consideration the impact of statutory tax rates from local jurisdictions incurring the expense.
(8) Reconciliation of GAAP-based net income to Non-GAAP-based net income:
| | | | | | | | |
| Year Ended June 30, 2022 |
| | Per share diluted |
| GAAP-based net income, attributable to OpenText | $ | 397,090 | | $ | 1.46 | |
| Add: | | |
| Amortization | 415,712 | | 1.52 | |
| Share-based compensation | 69,556 | | 0.26 | |
| Special charges (recoveries) | 46,873 | | 0.17 | |
| Other (income) expense, net | (29,118) | | (0.11) | |
| GAAP-based provision for income taxes | 118,752 | | 0.44 | |
| Non-GAAP-based provision for income taxes | (142,665) | | (0.52) | |
| Non-GAAP-based net income, attributable to OpenText | $ | 876,200 | | $ | 3.22 | |
Reconciliation of Adjusted EBITDA
| | | | | |
| Year Ended June 30, 2022 |
| GAAP-based net income, attributable to OpenText | $ | 397,090 | |
| Add: | |
| Provision for income taxes | 118,752 | |
| Interest and other related expense, net | 157,880 | |
| Amortization of acquired technology-based intangible assets | 198,607 | |
| Amortization of acquired customer-based intangible assets | 217,105 | |
| Depreciation | 88,241 | |
| Share-based compensation | 69,556 | |
| Special charges (recoveries) | 46,873 | |
| Other (income) expense, net | (29,118) | |
| Adjusted EBITDA | $ | 1,264,986 | |
| |
| GAAP-based net income margin | 11.4 | % |
| Adjusted EBITDA margin | 36.2 | % |
Reconciliation of Free cash flows
| | | | | |
| Year Ended June 30, 2022 |
| GAAP-based cash flows provided by operating activities | $ | 981,810 | |
| Add: | |
Capital expenditures (1) | (93,109) | |
| Free cash flows | $ | 888,701 | |
| |
(1) Defined as “Additions of property and equipment” in the Consolidated Statements of Cash Flows. |
| | | | | | | | | | | | | | | | | | | | |
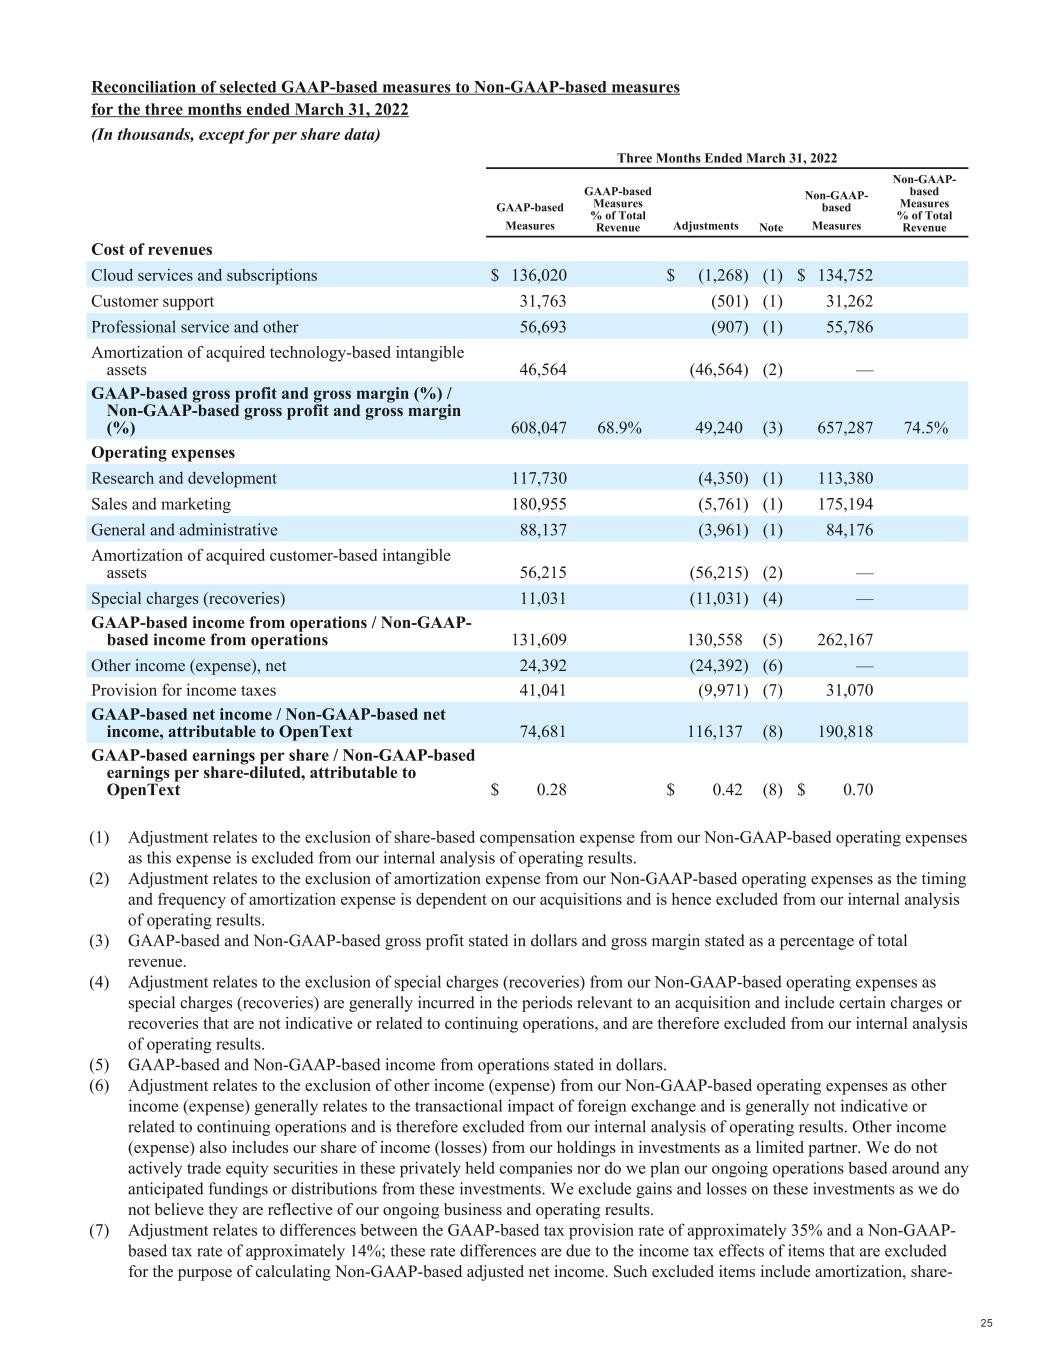
Reconciliation of selected GAAP-based measures to Non-GAAP-based measures for the three months ended March 31, 2022 (In thousands, except for per share data) |
| | Three Months Ended March 31, 2022 |
| | GAAP-based Measures | GAAP-based Measures
% of Total Revenue | Adjustments | Note | Non-GAAP-based Measures | Non-GAAP-based Measures
% of Total Revenue |
| Cost of revenues | | | | | | |
| Cloud services and subscriptions | $ | 136,020 | | | $ | (1,268) | | (1) | $ | 134,752 | | |
| Customer support | 31,763 | | | (501) | | (1) | 31,262 | | |
| Professional service and other | 56,693 | | | (907) | | (1) | 55,786 | | |
| Amortization of acquired technology-based intangible assets | 46,564 | | | (46,564) | | (2) | — | | |
| GAAP-based gross profit and gross margin (%) /Non-GAAP-based gross profit and gross margin (%) | 608,047 | | 68.9% | 49,240 | | (3) | 657,287 | | 74.5% |
| Operating expenses | | | | | | |
| Research and development | 117,730 | | | (4,350) | | (1) | 113,380 | | |
| Sales and marketing | 180,955 | | | (5,761) | | (1) | 175,194 | | |
| General and administrative | 88,137 | | | (3,961) | | (1) | 84,176 | | |
| Amortization of acquired customer-based intangible assets | 56,215 | | | (56,215) | | (2) | — | | |
| Special charges (recoveries) | 11,031 | | | (11,031) | | (4) | — | | |
| GAAP-based income from operations / Non-GAAP-based income from operations | 131,609 | | | 130,558 | | (5) | 262,167 | | |
| Other income (expense), net | 24,392 | | | (24,392) | | (6) | — | | |
| Provision for income taxes | 41,041 | | | (9,971) | | (7) | 31,070 | | |
| GAAP-based net income / Non-GAAP-based net income, attributable to OpenText | 74,681 | | | 116,137 | | (8) | 190,818 | | |
| GAAP-based earnings per share / Non-GAAP-based earnings per share-diluted, attributable to OpenText | $ | 0.28 | | | $ | 0.42 | | (8) | $ | 0.70 | | |
(1) Adjustment relates to the exclusion of share-based compensation expense from our Non-GAAP-based operating expenses as this expense is excluded from our internal analysis of operating results.
(2) Adjustment relates to the exclusion of amortization expense from our Non-GAAP-based operating expenses as the timing and frequency of amortization expense is dependent on our acquisitions and is hence excluded from our internal analysis of operating results.
(3) GAAP-based and Non-GAAP-based gross profit stated in dollars and gross margin stated as a percentage of total revenue.
(4) Adjustment relates to the exclusion of special charges (recoveries) from our Non-GAAP-based operating expenses as special charges (recoveries) are generally incurred in the periods relevant to an acquisition and include certain charges or recoveries that are not indicative or related to continuing operations, and are therefore excluded from our internal analysis of operating results.
(5) GAAP-based and Non-GAAP-based income from operations stated in dollars.
(6) Adjustment relates to the exclusion of other income (expense) from our Non-GAAP-based operating expenses as other income (expense) generally relates to the transactional impact of foreign exchange and is generally not indicative or related to continuing operations and is therefore excluded from our internal analysis of operating results. Other income (expense) also includes our share of income (losses) from our holdings in investments as a limited partner. We do not actively trade equity securities in these privately held companies nor do we plan our ongoing operations based around any anticipated fundings or distributions from these investments. We exclude gains and losses on these investments as we do not believe they are reflective of our ongoing business and operating results.
(7) Adjustment relates to differences between the GAAP-based tax provision rate of approximately 35% and a Non-GAAP-based tax rate of approximately 14%; these rate differences are due to the income tax effects of items that are excluded for the purpose of calculating Non-GAAP-based adjusted net income. Such excluded items include amortization, share-
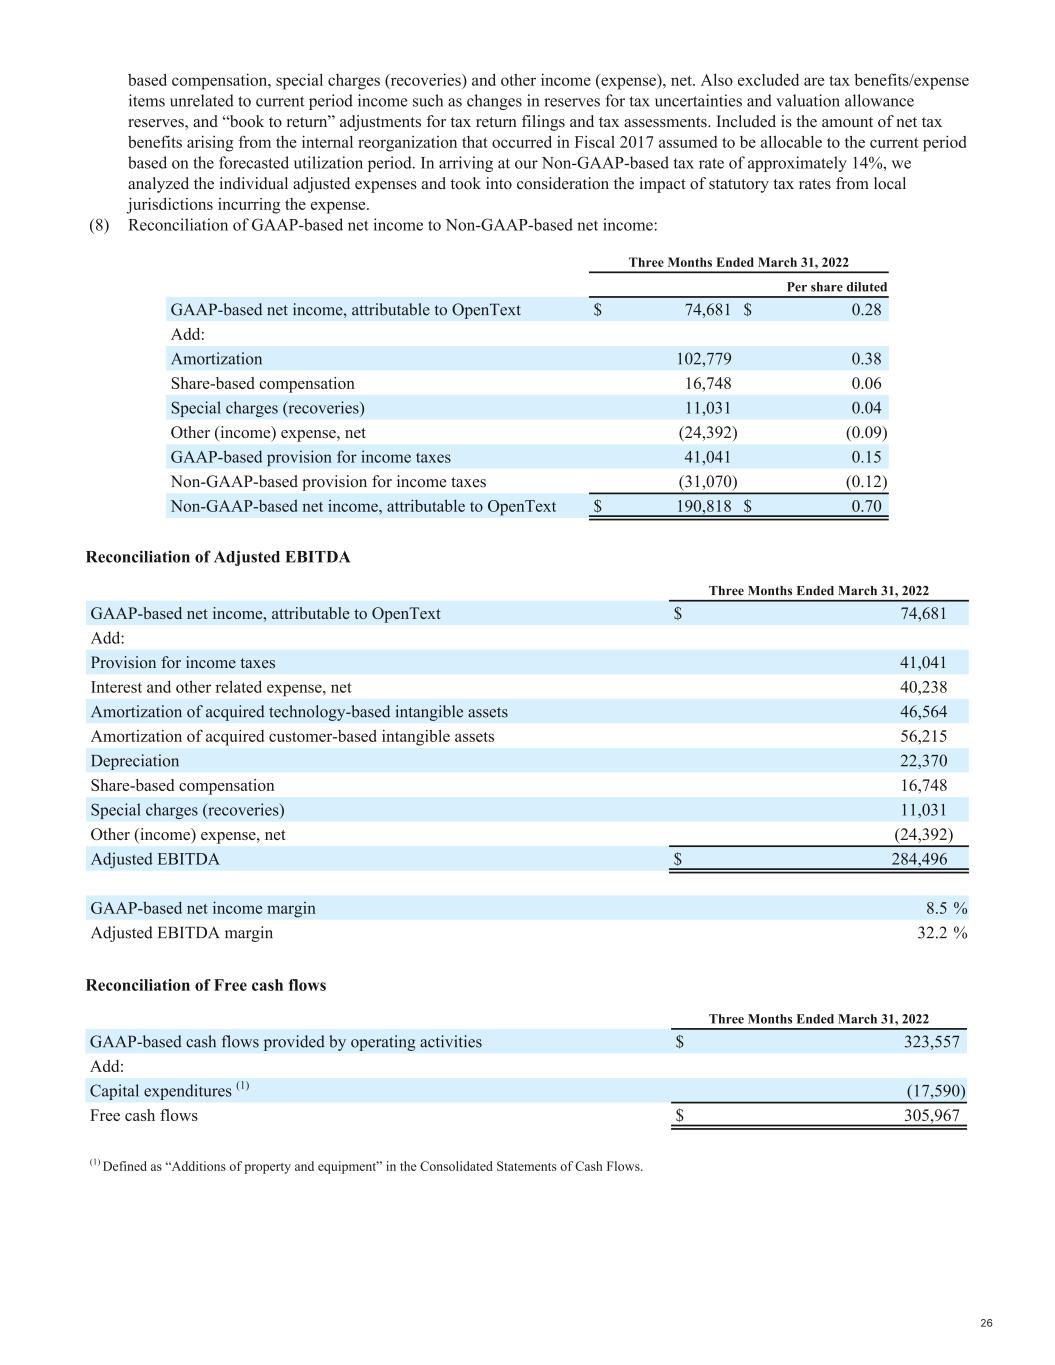
based compensation, special charges (recoveries) and other income (expense), net. Also excluded are tax benefits/expense items unrelated to current period income such as changes in reserves for tax uncertainties and valuation allowance reserves, and “book to return” adjustments for tax return filings and tax assessments. Included is the amount of net tax benefits arising from the internal reorganization that occurred in Fiscal 2017 assumed to be allocable to the current period based on the forecasted utilization period. In arriving at our Non-GAAP-based tax rate of approximately 14%, we analyzed the individual adjusted expenses and took into consideration the impact of statutory tax rates from local jurisdictions incurring the expense.
(8) Reconciliation of GAAP-based net income to Non-GAAP-based net income:
| | | | | | | | |
| Three Months Ended March 31, 2022 |
| | Per share diluted |
| GAAP-based net income, attributable to OpenText | $ | 74,681 | | $ | 0.28 | |
| Add: | | |
| Amortization | 102,779 | | 0.38 | |
| Share-based compensation | 16,748 | | 0.06 | |
| Special charges (recoveries) | 11,031 | | 0.04 | |
| Other (income) expense, net | (24,392) | | (0.09) | |
| GAAP-based provision for income taxes | 41,041 | | 0.15 | |
| Non-GAAP-based provision for income taxes | (31,070) | | (0.12) | |
| Non-GAAP-based net income, attributable to OpenText | $ | 190,818 | | $ | 0.70 | |
Reconciliation of Adjusted EBITDA
| | | | | |
| Three Months Ended March 31, 2022 |
| GAAP-based net income, attributable to OpenText | $ | 74,681 | |
| Add: | |
| Provision for income taxes | 41,041 | |
| Interest and other related expense, net | 40,238 | |
| Amortization of acquired technology-based intangible assets | 46,564 | |
| Amortization of acquired customer-based intangible assets | 56,215 | |
| Depreciation | 22,370 | |
| Share-based compensation | 16,748 | |
| Special charges (recoveries) | 11,031 | |
| Other (income) expense, net | (24,392) | |
| Adjusted EBITDA | $ | 284,496 | |
| |
| GAAP-based net income margin | 8.5 | % |
| Adjusted EBITDA margin | 32.2 | % |
Reconciliation of Free cash flows
| | | | | |
| Three Months Ended March 31, 2022 |
| GAAP-based cash flows provided by operating activities | $ | 323,557 | |
| Add: | |
Capital expenditures (1) | (17,590) | |
| Free cash flows | $ | 305,967 | |
| |
(1) Defined as “Additions of property and equipment” in the Consolidated Statements of Cash Flows. |
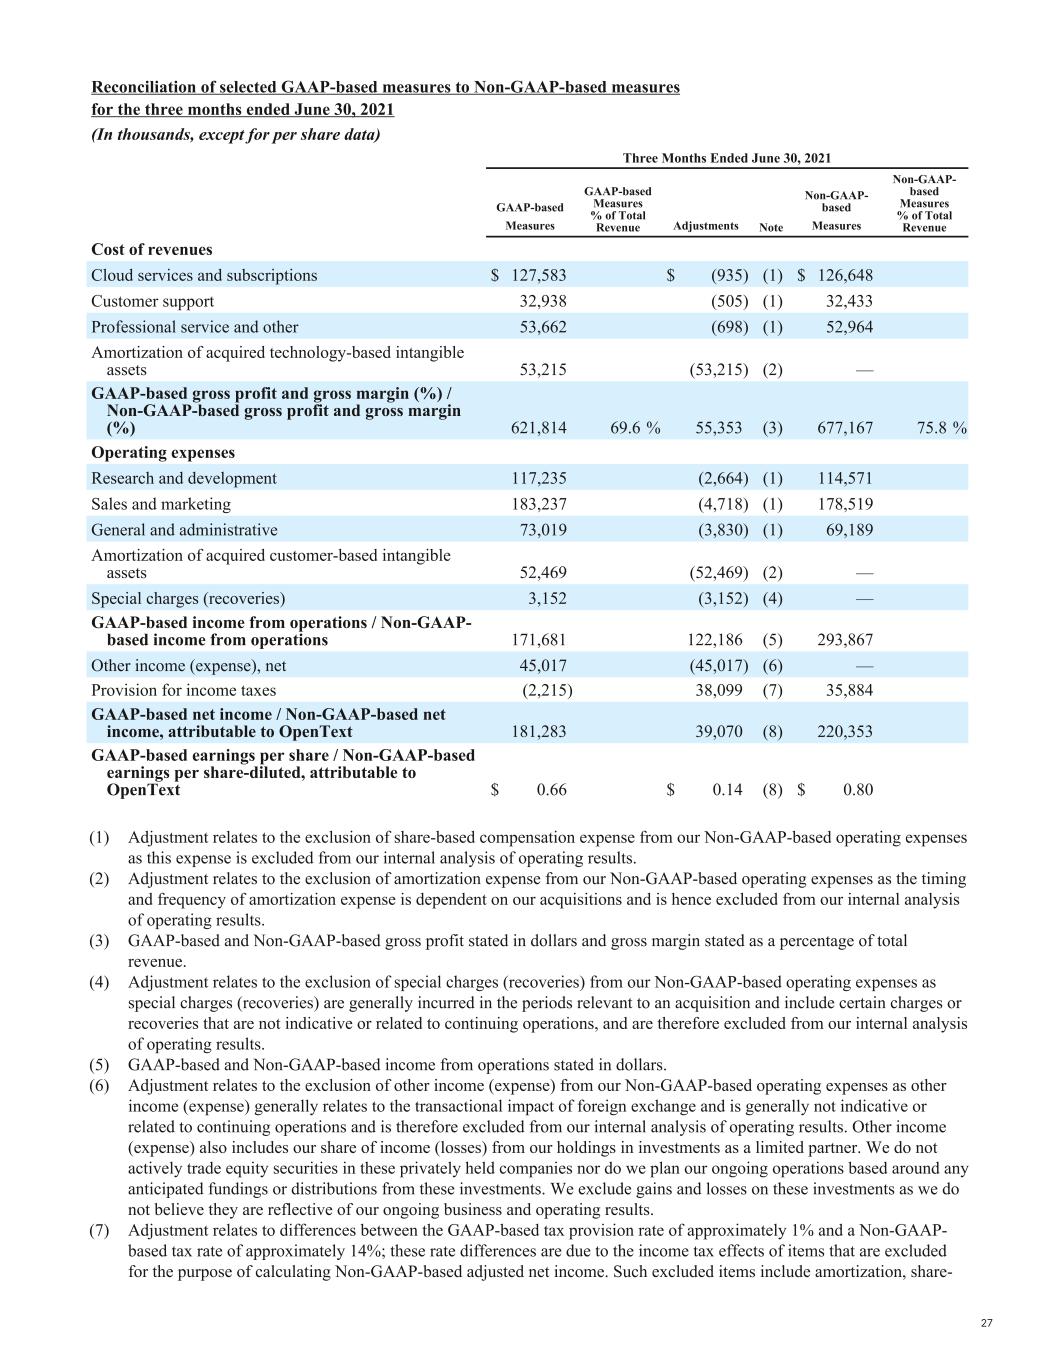
| | | | | | | | | | | | | | | | | | | | |
Reconciliation of selected GAAP-based measures to Non-GAAP-based measures for the three months ended June 30, 2021 (In thousands, except for per share data) |
| | Three Months Ended June 30, 2021 |
| | GAAP-based Measures | GAAP-based Measures
% of Total Revenue | Adjustments | Note | Non-GAAP-based Measures | Non-GAAP-based Measures
% of Total Revenue |
| Cost of revenues | | | | | | |
| Cloud services and subscriptions | $ | 127,583 | | | $ | (935) | | (1) | $ | 126,648 | | |
| Customer support | 32,938 | | | (505) | | (1) | 32,433 | | |
| Professional service and other | 53,662 | | | (698) | | (1) | 52,964 | | |
| Amortization of acquired technology-based intangible assets | 53,215 | | | (53,215) | | (2) | — | | |
| GAAP-based gross profit and gross margin (%) /Non-GAAP-based gross profit and gross margin (%) | 621,814 | | 69.6 | % | 55,353 | | (3) | 677,167 | | 75.8 | % |
| Operating expenses | | | | | | |
| Research and development | 117,235 | | | (2,664) | | (1) | 114,571 | | |
| Sales and marketing | 183,237 | | | (4,718) | | (1) | 178,519 | | |
| General and administrative | 73,019 | | | (3,830) | | (1) | 69,189 | | |
| Amortization of acquired customer-based intangible assets | 52,469 | | | (52,469) | | (2) | — | | |
| Special charges (recoveries) | 3,152 | | | (3,152) | | (4) | — | | |
| GAAP-based income from operations / Non-GAAP-based income from operations | 171,681 | | | 122,186 | | (5) | 293,867 | | |
| Other income (expense), net | 45,017 | | | (45,017) | | (6) | — | | |
| Provision for income taxes | (2,215) | | | 38,099 | | (7) | 35,884 | | |
| GAAP-based net income / Non-GAAP-based net income, attributable to OpenText | 181,283 | | | 39,070 | | (8) | 220,353 | | |
| GAAP-based earnings per share / Non-GAAP-based earnings per share-diluted, attributable to OpenText | $ | 0.66 | | | $ | 0.14 | | (8) | $ | 0.80 | | |
(1) Adjustment relates to the exclusion of share-based compensation expense from our Non-GAAP-based operating expenses as this expense is excluded from our internal analysis of operating results.
(2) Adjustment relates to the exclusion of amortization expense from our Non-GAAP-based operating expenses as the timing and frequency of amortization expense is dependent on our acquisitions and is hence excluded from our internal analysis of operating results.
(3) GAAP-based and Non-GAAP-based gross profit stated in dollars and gross margin stated as a percentage of total revenue.
(4) Adjustment relates to the exclusion of special charges (recoveries) from our Non-GAAP-based operating expenses as special charges (recoveries) are generally incurred in the periods relevant to an acquisition and include certain charges or recoveries that are not indicative or related to continuing operations, and are therefore excluded from our internal analysis of operating results.
(5) GAAP-based and Non-GAAP-based income from operations stated in dollars.
(6) Adjustment relates to the exclusion of other income (expense) from our Non-GAAP-based operating expenses as other income (expense) generally relates to the transactional impact of foreign exchange and is generally not indicative or related to continuing operations and is therefore excluded from our internal analysis of operating results. Other income (expense) also includes our share of income (losses) from our holdings in investments as a limited partner. We do not actively trade equity securities in these privately held companies nor do we plan our ongoing operations based around any anticipated fundings or distributions from these investments. We exclude gains and losses on these investments as we do not believe they are reflective of our ongoing business and operating results.
(7) Adjustment relates to differences between the GAAP-based tax provision rate of approximately 1% and a Non-GAAP-based tax rate of approximately 14%; these rate differences are due to the income tax effects of items that are excluded for the purpose of calculating Non-GAAP-based adjusted net income. Such excluded items include amortization, share-
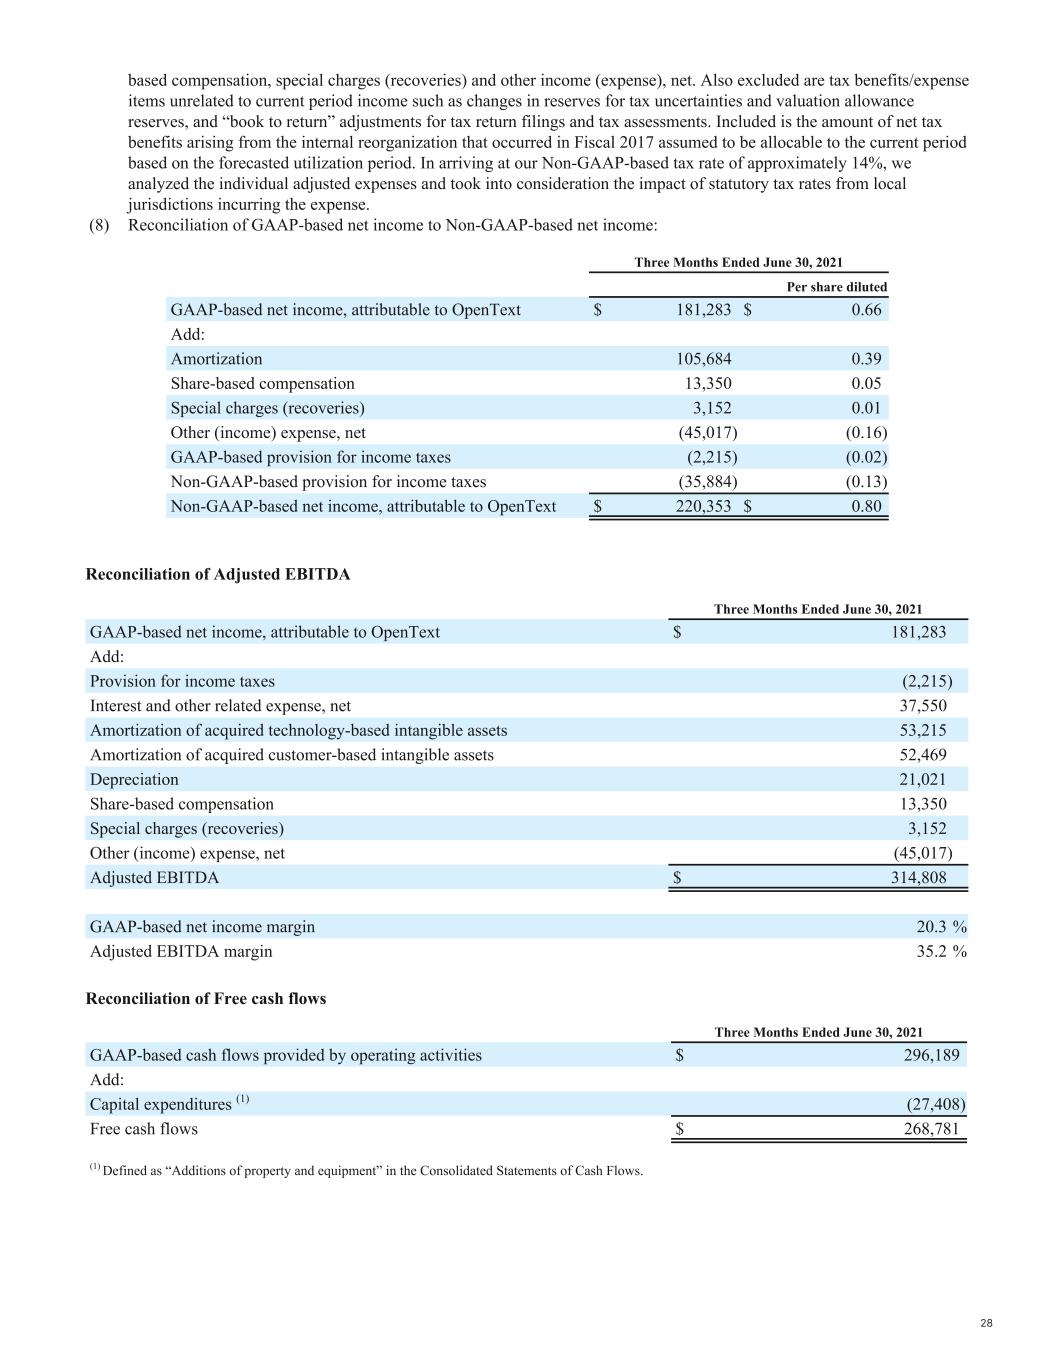
based compensation, special charges (recoveries) and other income (expense), net. Also excluded are tax benefits/expense items unrelated to current period income such as changes in reserves for tax uncertainties and valuation allowance reserves, and “book to return” adjustments for tax return filings and tax assessments. Included is the amount of net tax benefits arising from the internal reorganization that occurred in Fiscal 2017 assumed to be allocable to the current period based on the forecasted utilization period. In arriving at our Non-GAAP-based tax rate of approximately 14%, we analyzed the individual adjusted expenses and took into consideration the impact of statutory tax rates from local jurisdictions incurring the expense.
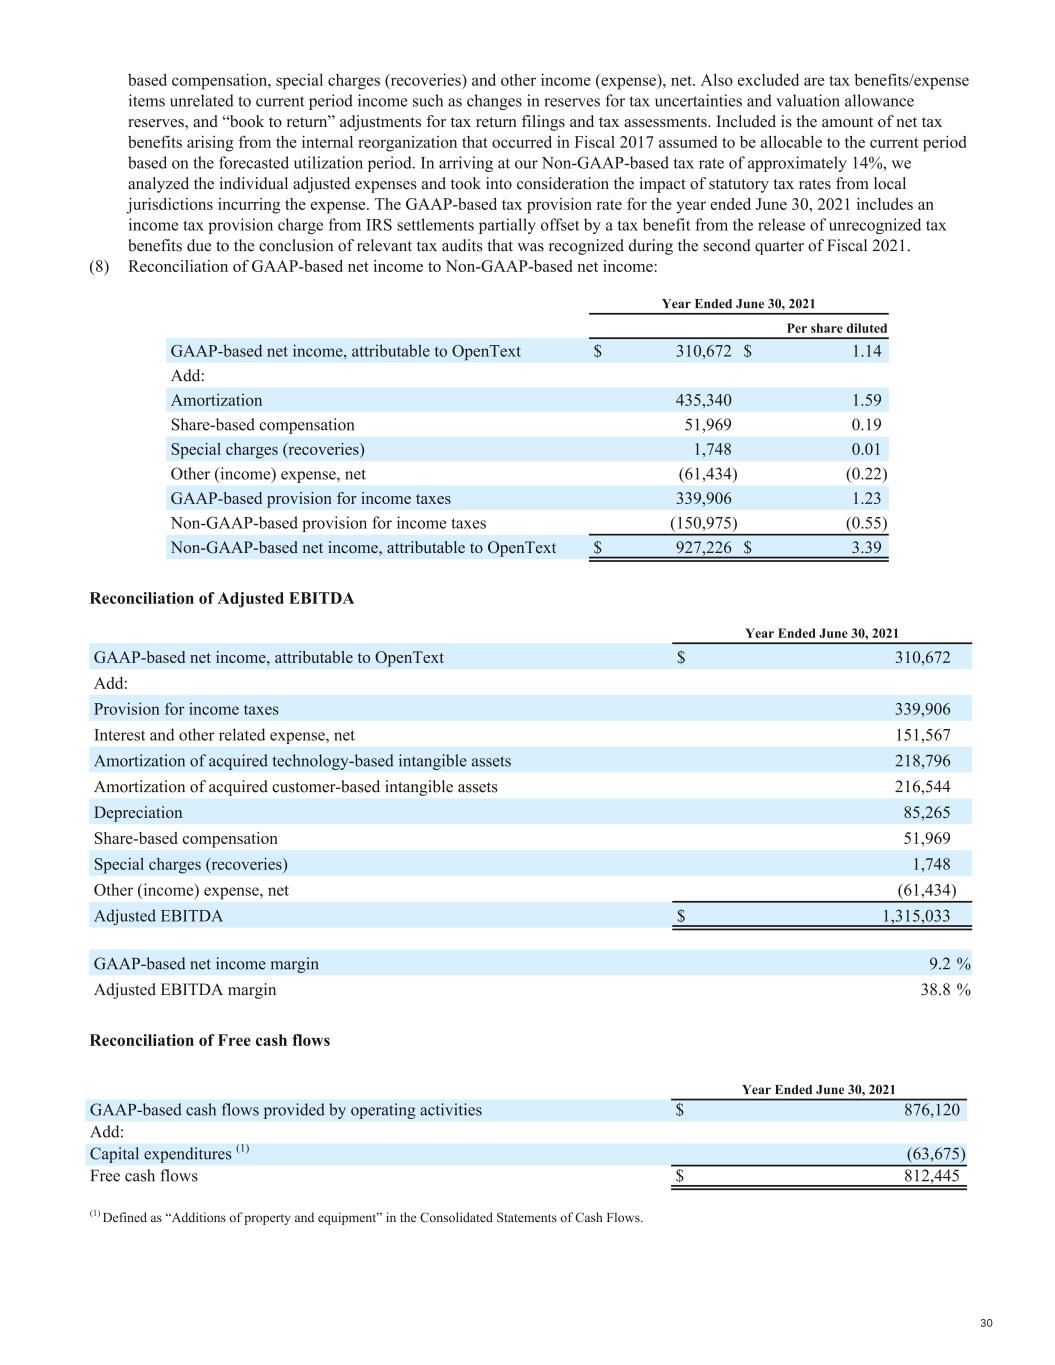
(8) Reconciliation of GAAP-based net income to Non-GAAP-based net income:
| | | | | | | | |
| Three Months Ended June 30, 2021 |
| | Per share diluted |
| GAAP-based net income, attributable to OpenText | $ | 181,283 | | $ | 0.66 | |
| Add: | | |
| Amortization | 105,684 | | 0.39 | |
| Share-based compensation | 13,350 | | 0.05 | |
| Special charges (recoveries) | 3,152 | | 0.01 | |
| Other (income) expense, net | (45,017) | | (0.16) | |
| GAAP-based provision for income taxes | (2,215) | | (0.02) | |
| Non-GAAP-based provision for income taxes | (35,884) | | (0.13) | |
| Non-GAAP-based net income, attributable to OpenText | $ | 220,353 | | $ | 0.80 | |
|
|
Reconciliation of Adjusted EBITDA
| | | | | |
| Three Months Ended June 30, 2021 |
| GAAP-based net income, attributable to OpenText | $ | 181,283 | |
| Add: | |
| Provision for income taxes | (2,215) | |
| Interest and other related expense, net | 37,550 | |
| Amortization of acquired technology-based intangible assets | 53,215 | |
| Amortization of acquired customer-based intangible assets | 52,469 | |
| Depreciation | 21,021 | |
| Share-based compensation | 13,350 | |
| Special charges (recoveries) | 3,152 | |
| Other (income) expense, net | (45,017) | |
| Adjusted EBITDA | $ | 314,808 | |
| |
| GAAP-based net income margin | 20.3 | % |
| Adjusted EBITDA margin | 35.2 | % |
Reconciliation of Free cash flows
| | | | | |
| Three Months Ended June 30, 2021 |
| GAAP-based cash flows provided by operating activities | $ | 296,189 | |
| Add: | |
Capital expenditures (1) | (27,408) | |
| Free cash flows | $ | 268,781 | |
| |
(1) Defined as “Additions of property and equipment” in the Consolidated Statements of Cash Flows. |
| | | | | | | | | | | | | | | | | | | | |
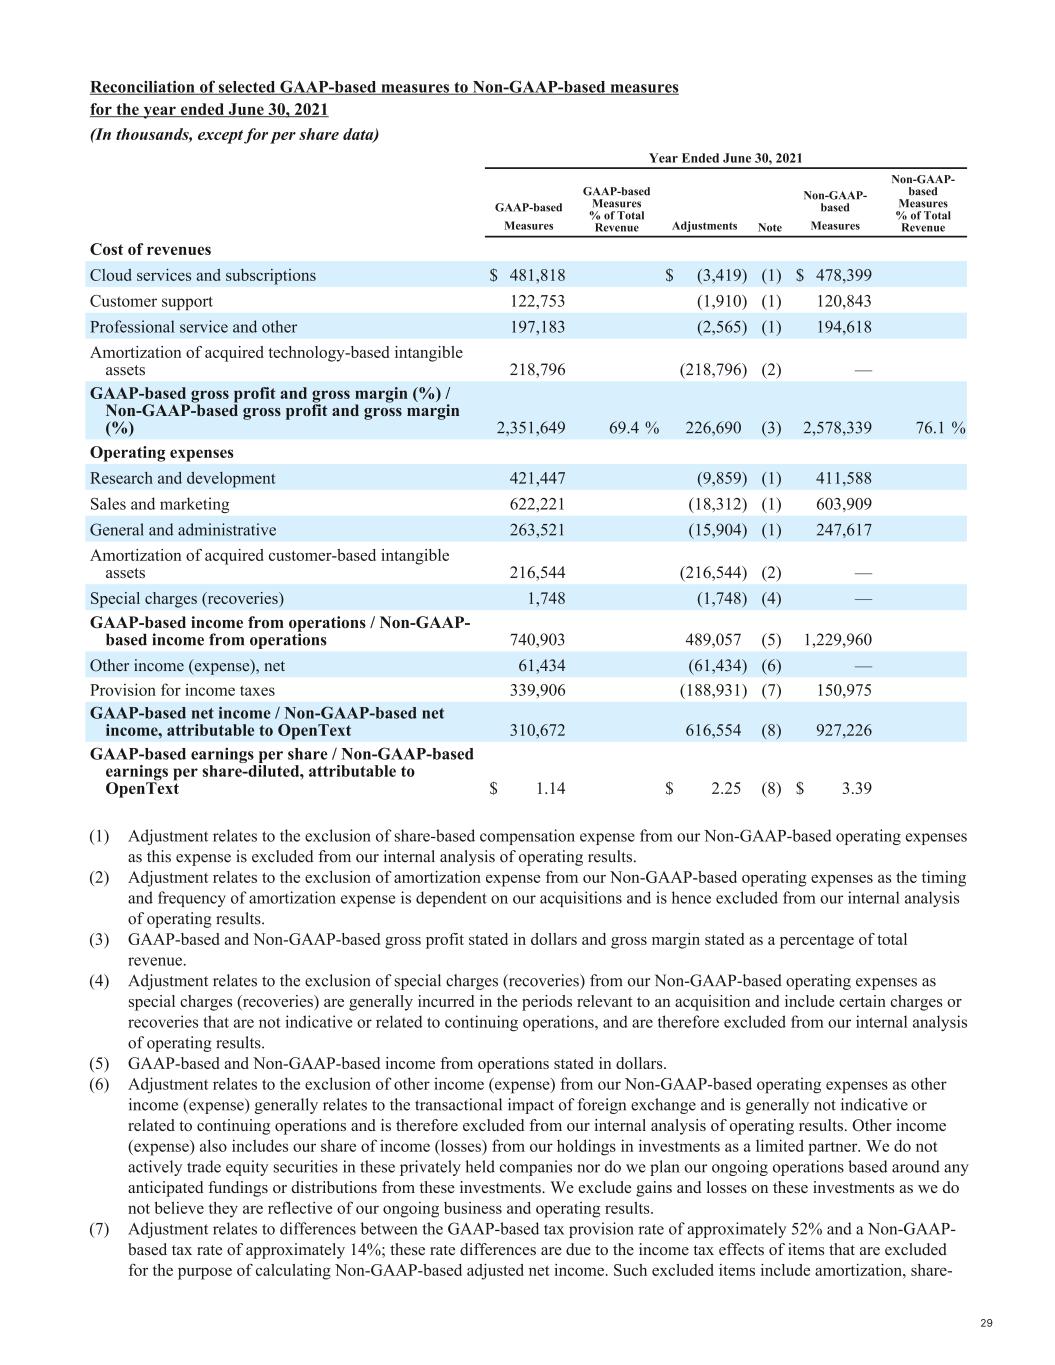
Reconciliation of selected GAAP-based measures to Non-GAAP-based measures for the year ended June 30, 2021 (In thousands, except for per share data) |
| | Year Ended June 30, 2021 |
| | GAAP-based Measures | GAAP-based Measures
% of Total Revenue | Adjustments | Note | Non-GAAP-based Measures | Non-GAAP-based Measures
% of Total Revenue |
| Cost of revenues | | | | | | |
| Cloud services and subscriptions | $ | 481,818 | | | $ | (3,419) | | (1) | $ | 478,399 | | |
| Customer support | 122,753 | | | (1,910) | | (1) | 120,843 | | |
| Professional service and other | 197,183 | | | (2,565) | | (1) | 194,618 | | |
| Amortization of acquired technology-based intangible assets | 218,796 | | | (218,796) | | (2) | — | | |
| GAAP-based gross profit and gross margin (%) / Non-GAAP-based gross profit and gross margin (%) | 2,351,649 | | 69.4 | % | 226,690 | | (3) | 2,578,339 | | 76.1 | % |
| Operating expenses | | | | | | |
| Research and development | 421,447 | | | (9,859) | | (1) | 411,588 | | |
| Sales and marketing | 622,221 | | | (18,312) | | (1) | 603,909 | | |
| General and administrative | 263,521 | | | (15,904) | | (1) | 247,617 | | |
| Amortization of acquired customer-based intangible assets | 216,544 | | | (216,544) | | (2) | — | | |
| Special charges (recoveries) | 1,748 | | | (1,748) | | (4) | — | | |
| GAAP-based income from operations / Non-GAAP-based income from operations | 740,903 | | | 489,057 | | (5) | 1,229,960 | | |
| Other income (expense), net | 61,434 | | | (61,434) | | (6) | — | | |
| Provision for income taxes | 339,906 | | | (188,931) | | (7) | 150,975 | | |
| GAAP-based net income / Non-GAAP-based net income, attributable to OpenText | 310,672 | | | 616,554 | | (8) | 927,226 | | |
| GAAP-based earnings per share / Non-GAAP-based earnings per share-diluted, attributable to OpenText | $ | 1.14 | | | $ | 2.25 | | (8) | $ | 3.39 | | |
(1) Adjustment relates to the exclusion of share-based compensation expense from our Non-GAAP-based operating expenses as this expense is excluded from our internal analysis of operating results.
(2) Adjustment relates to the exclusion of amortization expense from our Non-GAAP-based operating expenses as the timing and frequency of amortization expense is dependent on our acquisitions and is hence excluded from our internal analysis of operating results.
(3) GAAP-based and Non-GAAP-based gross profit stated in dollars and gross margin stated as a percentage of total revenue.
(4) Adjustment relates to the exclusion of special charges (recoveries) from our Non-GAAP-based operating expenses as special charges (recoveries) are generally incurred in the periods relevant to an acquisition and include certain charges or recoveries that are not indicative or related to continuing operations, and are therefore excluded from our internal analysis of operating results.
(5) GAAP-based and Non-GAAP-based income from operations stated in dollars.
(6) Adjustment relates to the exclusion of other income (expense) from our Non-GAAP-based operating expenses as other income (expense) generally relates to the transactional impact of foreign exchange and is generally not indicative or related to continuing operations and is therefore excluded from our internal analysis of operating results. Other income (expense) also includes our share of income (losses) from our holdings in investments as a limited partner. We do not actively trade equity securities in these privately held companies nor do we plan our ongoing operations based around any anticipated fundings or distributions from these investments. We exclude gains and losses on these investments as we do not believe they are reflective of our ongoing business and operating results.
(7) Adjustment relates to differences between the GAAP-based tax provision rate of approximately 52% and a Non-GAAP-based tax rate of approximately 14%; these rate differences are due to the income tax effects of items that are excluded for the purpose of calculating Non-GAAP-based adjusted net income. Such excluded items include amortization, share-
based compensation, special charges (recoveries) and other income (expense), net. Also excluded are tax benefits/expense items unrelated to current period income such as changes in reserves for tax uncertainties and valuation allowance reserves, and “book to return” adjustments for tax return filings and tax assessments. Included is the amount of net tax benefits arising from the internal reorganization that occurred in Fiscal 2017 assumed to be allocable to the current period based on the forecasted utilization period. In arriving at our Non-GAAP-based tax rate of approximately 14%, we analyzed the individual adjusted expenses and took into consideration the impact of statutory tax rates from local jurisdictions incurring the expense. The GAAP-based tax provision rate for the year ended June 30, 2021 includes an income tax provision charge from IRS settlements partially offset by a tax benefit from the release of unrecognized tax benefits due to the conclusion of relevant tax audits that was recognized during the second quarter of Fiscal 2021.
(8) Reconciliation of GAAP-based net income to Non-GAAP-based net income:
| | | | | | | | |
| Year Ended June 30, 2021 |
| | Per share diluted |
| GAAP-based net income, attributable to OpenText | $ | 310,672 | | $ | 1.14 | |
| Add: | | |
| Amortization | 435,340 | | 1.59 | |
| Share-based compensation | 51,969 | | 0.19 | |
| Special charges (recoveries) | 1,748 | | 0.01 | |
| Other (income) expense, net | (61,434) | | (0.22) | |
| GAAP-based provision for income taxes | 339,906 | | 1.23 | |
| Non-GAAP-based provision for income taxes | (150,975) | | (0.55) | |
| Non-GAAP-based net income, attributable to OpenText | $ | 927,226 | | $ | 3.39 | |
Reconciliation of Adjusted EBITDA
| | | | | |
| Year Ended June 30, 2021 |
| GAAP-based net income, attributable to OpenText | $ | 310,672 | |
| Add: | |
| Provision for income taxes | 339,906 | |
| Interest and other related expense, net | 151,567 | |
| Amortization of acquired technology-based intangible assets | 218,796 | |
| Amortization of acquired customer-based intangible assets | 216,544 | |
| Depreciation | 85,265 | |
| Share-based compensation | 51,969 | |
| Special charges (recoveries) | 1,748 | |
| Other (income) expense, net | (61,434) | |
| Adjusted EBITDA | $ | 1,315,033 | |
| |
| GAAP-based net income margin | 9.2 | % |
| Adjusted EBITDA margin | 38.8 | % |
Reconciliation of Free cash flows
| | | | | |
| Year Ended June 30, 2021 |
| GAAP-based cash flows provided by operating activities | $ | 876,120 | |
| Add: | |
Capital expenditures (1) | (63,675) | |
| Free cash flows | $ | 812,445 | |
| |
(1) Defined as “Additions of property and equipment” in the Consolidated Statements of Cash Flows. |
(3) The following tables provide a composition of our major currencies for revenue and expenses, expressed as a percentage, for the year ended June 30, 2022 and 2021:
| | | | | | | | | | | | | | | | | |
| | Three Months Ended June 30, 2022 | | Three Months Ended June 30, 2021 |
| Currencies | % of Revenue | % of Expenses(1) | | % of Revenue | % of Expenses(1) |
| EURO | 22 | % | 12 | % | | 24 | % | 14 | % |
| GBP | 3 | % | 5 | % | | 5 | % | 5 | % |
| CAD | 3 | % | 14 | % | | 3 | % | 13 | % |
| USD | 63 | % | 54 | % | | 60 | % | 53 | % |
| Other | 9 | % | 15 | % | | 8 | % | 15 | % |
| Total | 100 | % | 100 | % | | 100 | % | 100 | % |
| | | | | | | | | | | | | | | | | |
| | Year Ended June 30, 2022 | | Year Ended June 30, 2021 |
| Currencies | % of Revenue | % of Expenses(1) | | % of Revenue | % of Expenses(1) |
| EURO | 23 | % | 13 | % | | 23 | % | 14 | % |
| GBP | 4 | % | 6 | % | | 5 | % | 6 | % |
| CAD | 3 | % | 14 | % | | 3 | % | 9 | % |
| USD | 62 | % | 53 | % | | 61 | % | 55 | % |
| Other | 8 | % | 14 | % | | 8 | % | 16 | % |
| Total | 100 | % | 100 | % | | 100 | % | 100 | % |
(1) Expenses include all cost of revenues and operating expenses included within the Consolidated Statements of Income, except for amortization of intangible assets, share-based compensation and special charges (recoveries).