Exhibit 99.2 TM Anadarko Basin – Operational leader with the
Ovintiv Edge January 29 – 30, 2020Exhibit 99.2 TM Anadarko Basin – Operational leader with the Ovintiv Edge January 29 – 30, 2020
2 We are Ovintiv2 We are Ovintiv
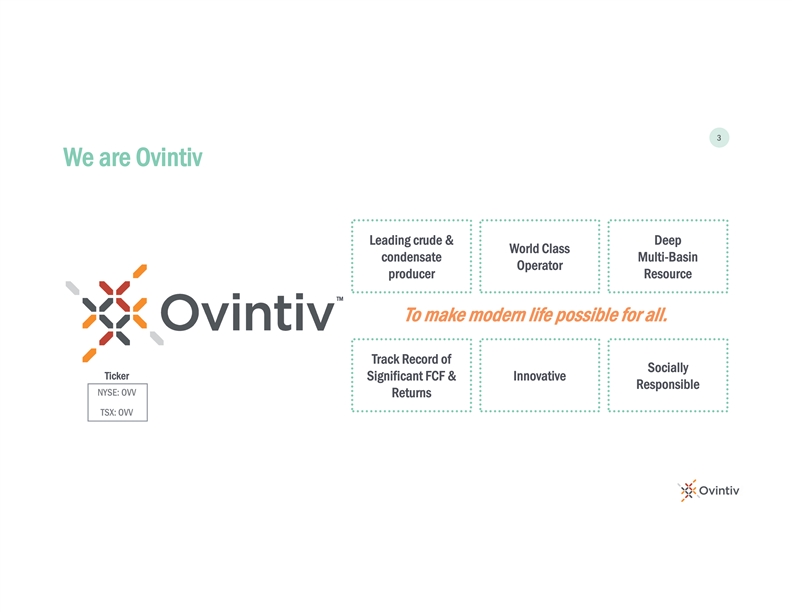
3 We are Ovintiv Leading crude & Deep World Class condensate
Multi-Basin Operator producer Resource TM To make modern life possible for all. Track Record of Socially Ticker Significant FCF & Innovative Responsible NYSE: OVV Returns TSX: OVV3 We are Ovintiv Leading crude & Deep World Class condensate
Multi-Basin Operator producer Resource TM To make modern life possible for all. Track Record of Socially Ticker Significant FCF & Innovative Responsible NYSE: OVV Returns TSX: OVV
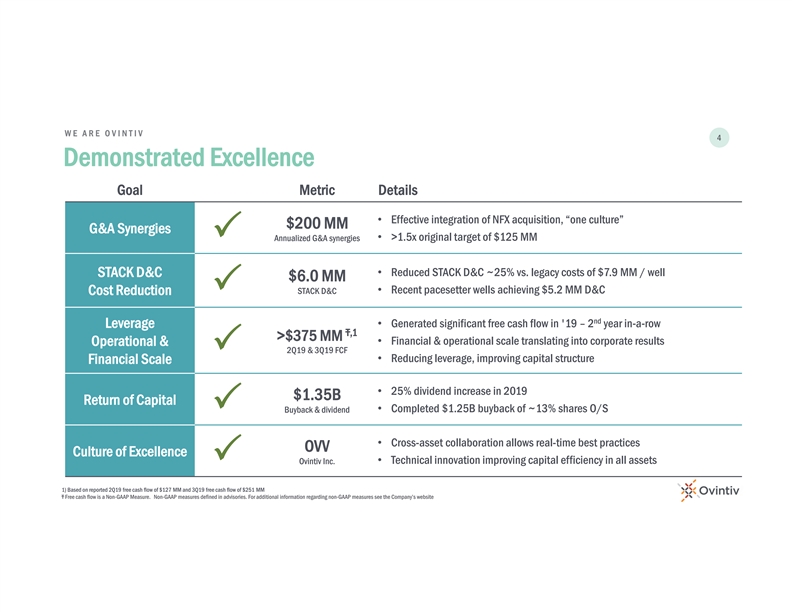
WE ARE OVINTIV 4 Demonstrated Excellence Goal Metric Details •
Effective integration of NFX acquisition, “one culture” $200 MM G&A Synergies Annualized G&A synergies • >1.5x original target of $125 MM P • Reduced STACK D&C ~25% vs. legacy costs of $7.9 MM / well STACK
D&C $6.0 MM STACK D&C • Recent pacesetter wells achieving $5.2 MM D&C Cost ReductionP nd • Generated significant free cash flow in '19 – 2 year in-a-row Leverage Ŧ,1 >$375 MM • Financial &
operational scale translating into corporate results Operational & 2Q19 & 3Q19 FCF P • Reducing leverage, improving capital structure Financial Scale • 25% dividend increase in 2019 $1.35B Return of Capital • Completed
$1.25B buyback of ~13% shares O/S Buyback & dividend P • Cross-asset collaboration allows real-time best practices OVV Culture of Excellence Ovintiv Inc. • Technical innovation improving capital efficiency in all assets P 1)
Based on reported 2Q19 free cash flow of $127 MM and 3Q19 free cash flow of $251 MM Ŧ Free cash flow is a Non-GAAP Measure. Non-GAAP measures defined in advisories. For additional information regarding non-GAAP measures see the Company’s
websiteWE ARE OVINTIV 4 Demonstrated Excellence Goal Metric Details • Effective integration of NFX acquisition, “one culture” $200 MM G&A Synergies Annualized G&A synergies • >1.5x original target of $125 MM P
• Reduced STACK D&C ~25% vs. legacy costs of $7.9 MM / well STACK D&C $6.0 MM STACK D&C • Recent pacesetter wells achieving $5.2 MM D&C Cost ReductionP nd • Generated significant free cash flow in '19 – 2
year in-a-row Leverage Ŧ,1 >$375 MM • Financial & operational scale translating into corporate results Operational & 2Q19 & 3Q19 FCF P • Reducing leverage, improving capital structure Financial Scale • 25%
dividend increase in 2019 $1.35B Return of Capital • Completed $1.25B buyback of ~13% shares O/S Buyback & dividend P • Cross-asset collaboration allows real-time best practices OVV Culture of Excellence Ovintiv Inc. •
Technical innovation improving capital efficiency in all assets P 1) Based on reported 2Q19 free cash flow of $127 MM and 3Q19 free cash flow of $251 MM Ŧ Free cash flow is a Non-GAAP Measure. Non-GAAP measures defined in advisories. For
additional information regarding non-GAAP measures see the Company’s website
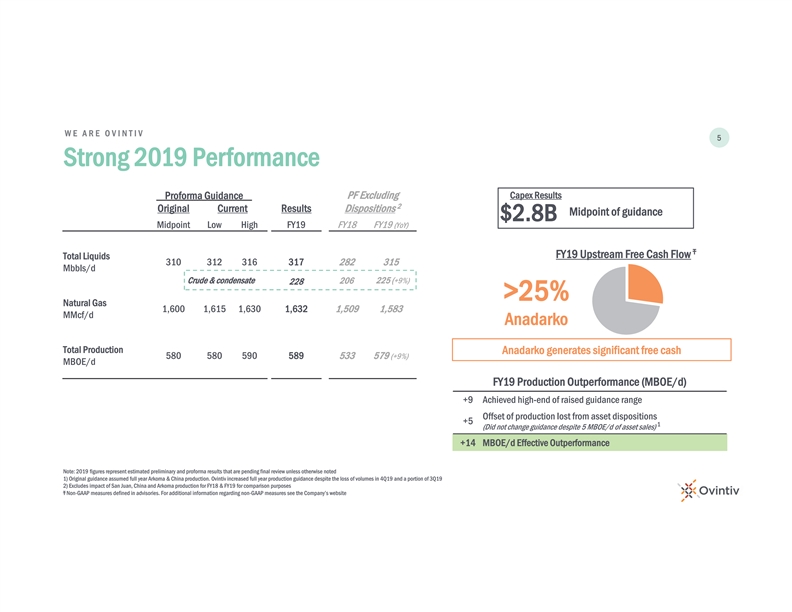
WE ARE OVINTIV 5 Strong 2019 Performance Proforma Guidance PF Excluding
Capex Results 2 Original Current Results Dispositions Midpoint of guidance $2.8B Midpoint Low High FY19 FY18 FY19 (YoY) Ŧ FY19 Upstream Free Cash Flow Total Liquids 310 312 316 317 282 315 Mbbls/d Crude & condensate 225 (+9%) 206 228
>25% Natural Gas 1,600 1,615 1,630 1,632 1,509 1,583 MMcf/d Anadarko Total Production Anadarko generates significant free cash 580 580 590 589 533 579 (+9%) MBOE/d FY19 Production Outperformance (MBOE/d) +9 Achieved high-end of raised guidance
range Offset of production lost from asset dispositions +5 1 (Did not change guidance despite 5 MBOE/d of asset sales) +14 MBOE/d Effective Outperformance Note: 2019 figures represent estimated preliminary and proforma results that are pending final
review unless otherwise noted 1) Original guidance assumed full year Arkoma & China production. Ovintiv increased full year production guidance despite the loss of volumes in 4Q19 and a portion of 3Q19 2) Excludes impact of San Juan, China and
Arkoma production for FY18 & FY19 for comparison purposes Ŧ Non-GAAP measures defined in advisories. For additional information regarding non-GAAP measures see the Company’s websiteWE ARE OVINTIV 5 Strong 2019 Performance Proforma
Guidance PF Excluding Capex Results 2 Original Current Results Dispositions Midpoint of guidance $2.8B Midpoint Low High FY19 FY18 FY19 (YoY) Ŧ FY19 Upstream Free Cash Flow Total Liquids 310 312 316 317 282 315 Mbbls/d Crude & condensate
225 (+9%) 206 228 >25% Natural Gas 1,600 1,615 1,630 1,632 1,509 1,583 MMcf/d Anadarko Total Production Anadarko generates significant free cash 580 580 590 589 533 579 (+9%) MBOE/d FY19 Production Outperformance (MBOE/d) +9 Achieved high-end of
raised guidance range Offset of production lost from asset dispositions +5 1 (Did not change guidance despite 5 MBOE/d of asset sales) +14 MBOE/d Effective Outperformance Note: 2019 figures represent estimated preliminary and proforma results that
are pending final review unless otherwise noted 1) Original guidance assumed full year Arkoma & China production. Ovintiv increased full year production guidance despite the loss of volumes in 4Q19 and a portion of 3Q19 2) Excludes impact of San
Juan, China and Arkoma production for FY18 & FY19 for comparison purposes Ŧ Non-GAAP measures defined in advisories. For additional information regarding non-GAAP measures see the Company’s website
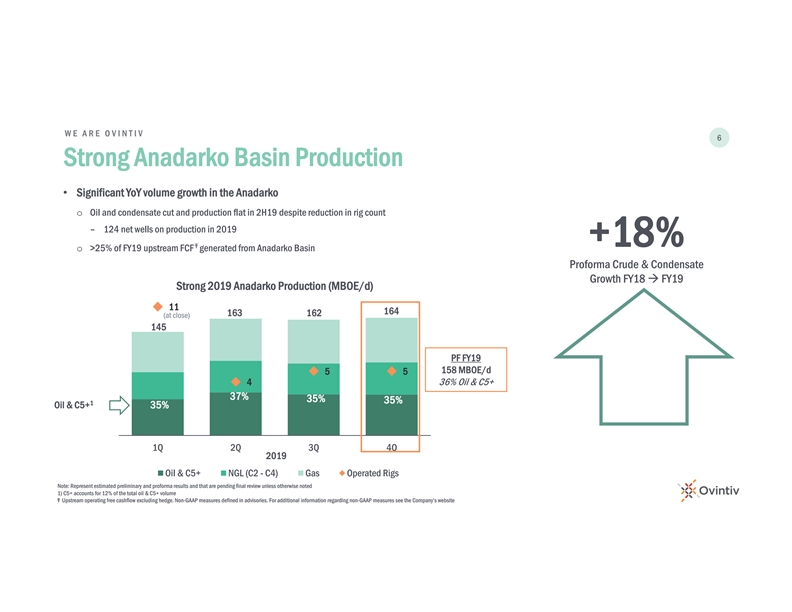
WE ARE OVINTIV 6 Strong Anadarko Basin Production • Significant
YoY volume growth in the Anadarko o Oil and condensate cut and production flat in 2H19 despite reduction in rig count – 124 net wells on production in 2019 +18% Ŧ o >25% of FY19 upstream FCF generated from Anadarko Basin Proforma Crude
& Condensate Growth FY18 à FY19 Strong 2019 Anadarko Production (MBOE/d) 11 164 163 162 (at close) 145 PF FY19 158 MBOE/d 55 4 36% Oil & C5+ 37% 35% 35% 1 Oil & C5+ 35% 1Q 2Q 3Q 4Q 2019 Oil & C5+ NGL (C2 - C4) Gas Operated Rigs
Note: Represent estimated preliminary and proforma results and that are pending final review unless otherwise noted 1) C5+ accounts for 12% of the total oil & C5+ volume Ŧ Upstream operating free cashflow excluding hedge. Non-GAAP measures
defined in advisories. For additional information regarding non-GAAP measures see the Company’s websiteWE ARE OVINTIV 6 Strong Anadarko Basin Production • Significant YoY volume growth in the Anadarko o Oil and condensate cut and
production flat in 2H19 despite reduction in rig count – 124 net wells on production in 2019 +18% Ŧ o >25% of FY19 upstream FCF generated from Anadarko Basin Proforma Crude & Condensate Growth FY18 à FY19 Strong 2019 Anadarko
Production (MBOE/d) 11 164 163 162 (at close) 145 PF FY19 158 MBOE/d 55 4 36% Oil & C5+ 37% 35% 35% 1 Oil & C5+ 35% 1Q 2Q 3Q 4Q 2019 Oil & C5+ NGL (C2 - C4) Gas Operated Rigs Note: Represent estimated preliminary and proforma results and
that are pending final review unless otherwise noted 1) C5+ accounts for 12% of the total oil & C5+ volume Ŧ Upstream operating free cashflow excluding hedge. Non-GAAP measures defined in advisories. For additional information regarding
non-GAAP measures see the Company’s website
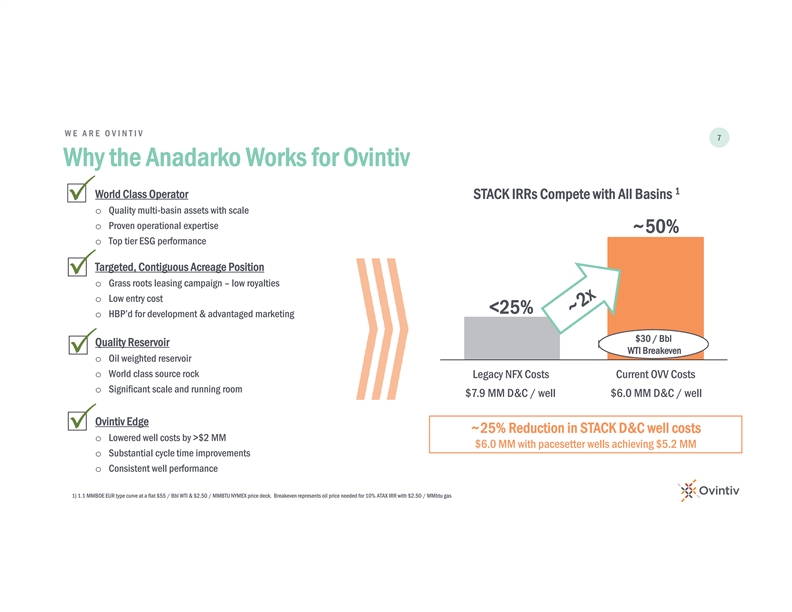
WE ARE OVINTIV 7 Why the Anadarko Works for Ovintiv 1 World Class
Operator STACK IRRs Compete with All Basins P o Quality multi-basin assets with scale o Proven operational expertise ~50% o Top tier ESG performance Targeted, Contiguous Acreage Position P o Grass roots leasing campaign – low royalties
o Low entry cost <25% o HBP’d for development & advantaged marketing $30 / Bbl Quality Reservoir WTI Breakeven P o Oil weighted reservoir o World class source rock Legacy NFX Costs Current OVV Costs o Significant scale and running
room $7.9 MM D&C / well $6.0 MM D&C / well Ovintiv Edge ~25% Reduction in STACK D&C well costs P o Lowered well costs by >$2 MM $6.0 MM with pacesetter wells achieving $5.2 MM o Substantial cycle time improvements o Consistent
well performance 1) 1.1 MMBOE EUR type curve at a flat $55 / Bbl WTI & $2.50 / MMBTU NYMEX price deck. Breakeven represents oil price needed for 10% ATAX IRR with $2.50 / MMbtu gasWE ARE OVINTIV 7 Why the Anadarko Works for Ovintiv 1 World Class
Operator STACK IRRs Compete with All Basins P o Quality multi-basin assets with scale o Proven operational expertise ~50% o Top tier ESG performance Targeted, Contiguous Acreage Position P o Grass roots leasing campaign – low royalties
o Low entry cost <25% o HBP’d for development & advantaged marketing $30 / Bbl Quality Reservoir WTI Breakeven P o Oil weighted reservoir o World class source rock Legacy NFX Costs Current OVV Costs o Significant scale and running
room $7.9 MM D&C / well $6.0 MM D&C / well Ovintiv Edge ~25% Reduction in STACK D&C well costs P o Lowered well costs by >$2 MM $6.0 MM with pacesetter wells achieving $5.2 MM o Substantial cycle time improvements o Consistent
well performance 1) 1.1 MMBOE EUR type curve at a flat $55 / Bbl WTI & $2.50 / MMBTU NYMEX price deck. Breakeven represents oil price needed for 10% ATAX IRR with $2.50 / MMbtu gas

8 World Class Operator 8 World Class Operator
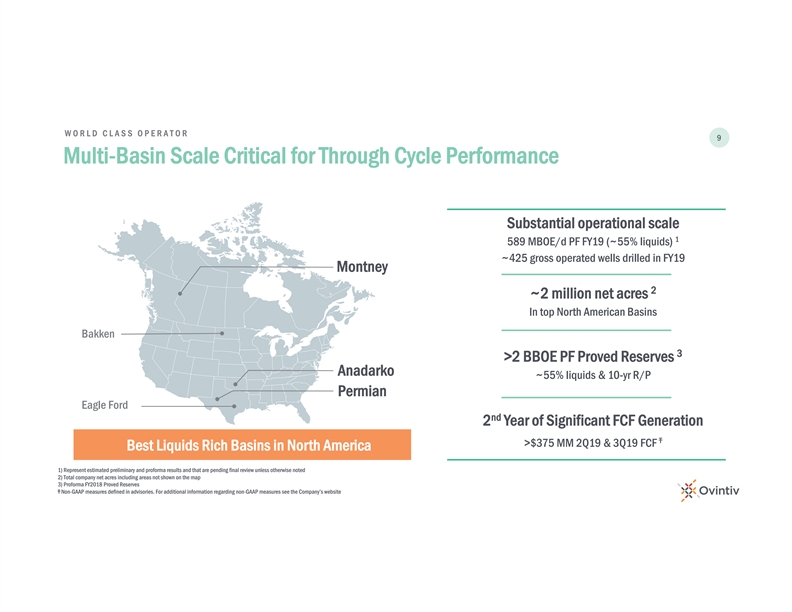
WORLD CLASS OPERATOR 9 Multi-Basin Scale Critical for Through Cycle
Performance Substantial operational scale 1 589 MBOE/d PF FY19 (~55% liquids) ~425 gross operated wells drilled in FY19 Montney 2 ~2 million net acres In top North American Basins Bakken 3 >2 BBOE PF Proved Reserves Anadarko ~55% liquids &
10-yr R/P Permian Eagle Ford nd 2 Year of Significant FCF Generation Ŧ >$375 MM 2Q19 & 3Q19 FCF Best Liquids Rich Basins in North America 1) Represent estimated preliminary and proforma results and that are pending final review unless
otherwise noted 2) Total company net acres including areas not shown on the map 3) Proforma FY2018 Proved Reserves Ŧ Non-GAAP measures defined in advisories. For additional information regarding non-GAAP measures see the Company’s
websiteWORLD CLASS OPERATOR 9 Multi-Basin Scale Critical for Through Cycle Performance Substantial operational scale 1 589 MBOE/d PF FY19 (~55% liquids) ~425 gross operated wells drilled in FY19 Montney 2 ~2 million net acres In top North American
Basins Bakken 3 >2 BBOE PF Proved Reserves Anadarko ~55% liquids & 10-yr R/P Permian Eagle Ford nd 2 Year of Significant FCF Generation Ŧ >$375 MM 2Q19 & 3Q19 FCF Best Liquids Rich Basins in North America 1) Represent estimated
preliminary and proforma results and that are pending final review unless otherwise noted 2) Total company net acres including areas not shown on the map 3) Proforma FY2018 Proved Reserves Ŧ Non-GAAP measures defined in advisories. For
additional information regarding non-GAAP measures see the Company’s website
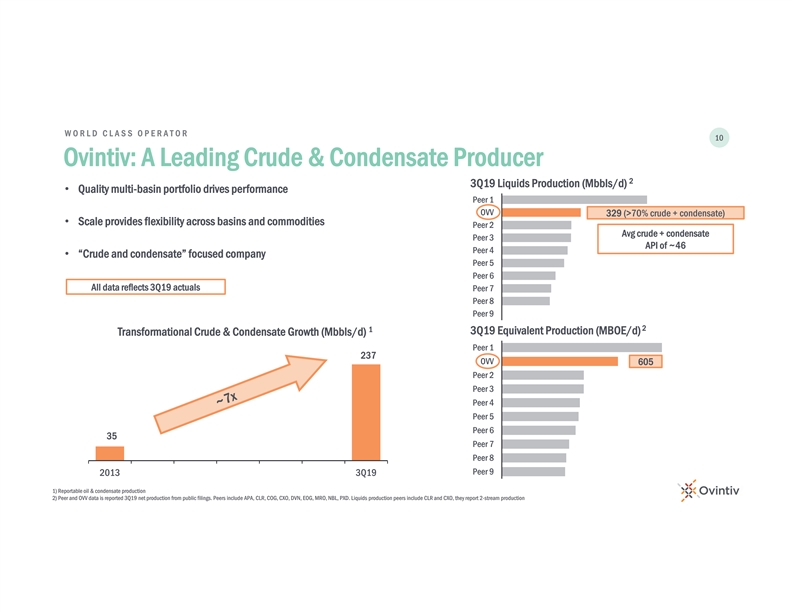
WORLD CLASS OPERATOR 10 Ovintiv: A Leading Crude & Condensate
Producer 2 3Q19 Liquids Production (Mbbls/d) • Quality multi-basin portfolio drives performance Peer 1 OVV 329 (>70% crude + condensate) • Scale provides flexibility across basins and commodities Peer 2 Avg crude + condensate Peer 3
API of ~46 Peer 4 • “Crude and condensate” focused company Peer 5 Peer 6 All data reflects 3Q19 actuals Peer 7 Peer 8 Peer 9 2 1 3Q19 Equivalent Production (MBOE/d) Transformational Crude & Condensate Growth (Mbbls/d) Peer 1
237 OVV 605 Peer 2 Peer 3 Peer 4 Peer 5 Peer 6 35 Peer 7 Peer 8 Peer 9 2013 3Q19 1) Reportable oil & condensate production 2) Peer and OVV data is reported 3Q19 net production from public filings. Peers include APA, CLR, COG, CXO, DVN, EOG, MRO,
NBL, PXD. Liquids production peers include CLR and CXO, they report 2-stream productionWORLD CLASS OPERATOR 10 Ovintiv: A Leading Crude & Condensate Producer 2 3Q19 Liquids Production (Mbbls/d) • Quality multi-basin portfolio drives
performance Peer 1 OVV 329 (>70% crude + condensate) • Scale provides flexibility across basins and commodities Peer 2 Avg crude + condensate Peer 3 API of ~46 Peer 4 • “Crude and condensate” focused company Peer 5 Peer 6
All data reflects 3Q19 actuals Peer 7 Peer 8 Peer 9 2 1 3Q19 Equivalent Production (MBOE/d) Transformational Crude & Condensate Growth (Mbbls/d) Peer 1 237 OVV 605 Peer 2 Peer 3 Peer 4 Peer 5 Peer 6 35 Peer 7 Peer 8 Peer 9 2013 3Q19 1)
Reportable oil & condensate production 2) Peer and OVV data is reported 3Q19 net production from public filings. Peers include APA, CLR, COG, CXO, DVN, EOG, MRO, NBL, PXD. Liquids production peers include CLR and CXO, they report 2-stream
production
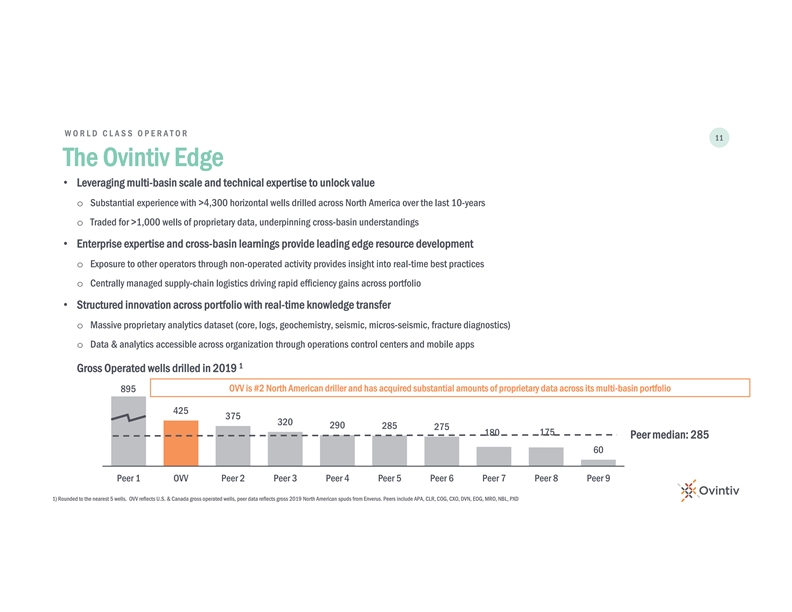
WORLD CLASS OPERATOR 11 The Ovintiv Edge • Leveraging multi-basin
scale and technical expertise to unlock value o Substantial experience with >4,300 horizontal wells drilled across North America over the last 10-years o Traded for >1,000 wells of proprietary data, underpinning cross-basin understandings
• Enterprise expertise and cross-basin learnings provide leading edge resource development o Exposure to other operators through non-operated activity provides insight into real-time best practices o Centrally managed supply-chain logistics
driving rapid efficiency gains across portfolio • Structured innovation across portfolio with real-time knowledge transfer o Massive proprietary analytics dataset (core, logs, geochemistry, seismic, micros-seismic, fracture diagnostics) o Data
& analytics accessible across organization through operations control centers and mobile apps 1 Gross Operated wells drilled in 2019 895 OVV is #2 North American driller and has acquired substantial amounts of proprietary data across its
multi-basin portfolio 425 375 320 290 285 275 175 180 Peer median: 285 60 Peer 1 OVV Peer 2 Peer 3 Peer 4 Peer 5 Peer 6 Peer 7 Peer 8 Peer 9 1) Rounded to the nearest 5 wells. OVV reflects U.S. & Canada gross operated wells, peer data reflects
gross 2019 North American spuds from Enverus. Peers include APA, CLR, COG, CXO, DVN, EOG, MRO, NBL, PXDWORLD CLASS OPERATOR 11 The Ovintiv Edge • Leveraging multi-basin scale and technical expertise to unlock value o Substantial experience
with >4,300 horizontal wells drilled across North America over the last 10-years o Traded for >1,000 wells of proprietary data, underpinning cross-basin understandings • Enterprise expertise and cross-basin learnings provide leading edge
resource development o Exposure to other operators through non-operated activity provides insight into real-time best practices o Centrally managed supply-chain logistics driving rapid efficiency gains across portfolio • Structured innovation
across portfolio with real-time knowledge transfer o Massive proprietary analytics dataset (core, logs, geochemistry, seismic, micros-seismic, fracture diagnostics) o Data & analytics accessible across organization through operations control
centers and mobile apps 1 Gross Operated wells drilled in 2019 895 OVV is #2 North American driller and has acquired substantial amounts of proprietary data across its multi-basin portfolio 425 375 320 290 285 275 175 180 Peer median: 285 60 Peer 1
OVV Peer 2 Peer 3 Peer 4 Peer 5 Peer 6 Peer 7 Peer 8 Peer 9 1) Rounded to the nearest 5 wells. OVV reflects U.S. & Canada gross operated wells, peer data reflects gross 2019 North American spuds from Enverus. Peers include APA, CLR, COG, CXO,
DVN, EOG, MRO, NBL, PXD
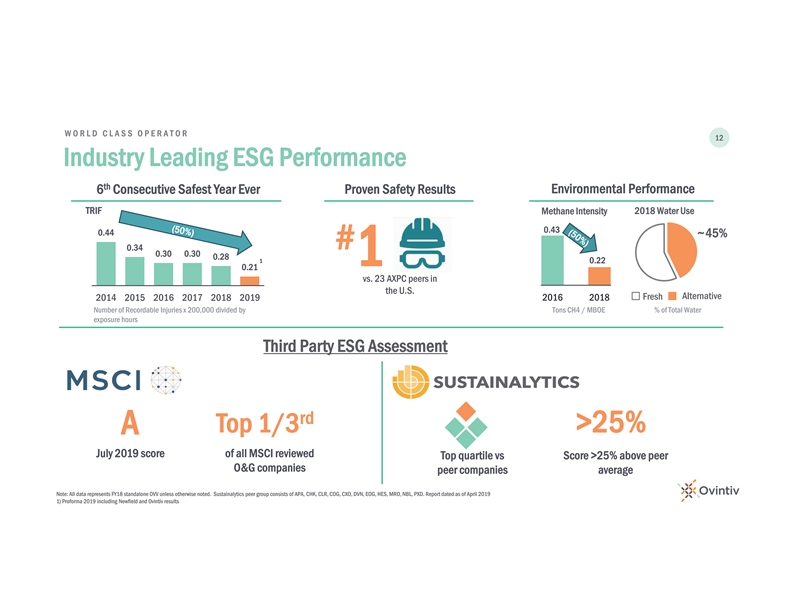
WORLD CLASS OPERATOR 12 Industry Leading ESG Performance th
Environmental Performance 6 Consecutive Safest Year Ever Proven Safety Results TRIF Methane Intensity 2018 Water Use 0.43 0.44 ~45% # 0.34 0.30 0.30 0.28 1 0.22 1 0.21 vs. 23 AXPC peers in the U.S. Alternative Fresh 2014 2015 2016 2017 2018 2019
2016 2018 Number of Recordable Injuries x 200,000 divided by Tons CH4 / MBOE % of Total Water exposure hours <$6.0 Third Party ESG Assessment rd Top 1/3 >25% A July 2019 score of all MSCI reviewed Top quartile vs Score >25% above peer
O&G companies peer companies average Note: All data represents FY18 standalone OVV unless otherwise noted. Sustainalytics peer group consists of APA, CHK, CLR, COG, CXO, DVN, EOG, HES, MRO, NBL, PXD. Report dated as of April 2019 1) Proforma
2019 including Newfield and Ovintiv resultsWORLD CLASS OPERATOR 12 Industry Leading ESG Performance th Environmental Performance 6 Consecutive Safest Year Ever Proven Safety Results TRIF Methane Intensity 2018 Water Use 0.43 0.44 ~45% # 0.34 0.30
0.30 0.28 1 0.22 1 0.21 vs. 23 AXPC peers in the U.S. Alternative Fresh 2014 2015 2016 2017 2018 2019 2016 2018 Number of Recordable Injuries x 200,000 divided by Tons CH4 / MBOE % of Total Water exposure hours <$6.0 Third Party ESG Assessment rd
Top 1/3 >25% A July 2019 score of all MSCI reviewed Top quartile vs Score >25% above peer O&G companies peer companies average Note: All data represents FY18 standalone OVV unless otherwise noted. Sustainalytics peer group consists of APA,
CHK, CLR, COG, CXO, DVN, EOG, HES, MRO, NBL, PXD. Report dated as of April 2019 1) Proforma 2019 including Newfield and Ovintiv results
13 Targeted, Contiguous Acreage Position13 Targeted, Contiguous Acreage
Position
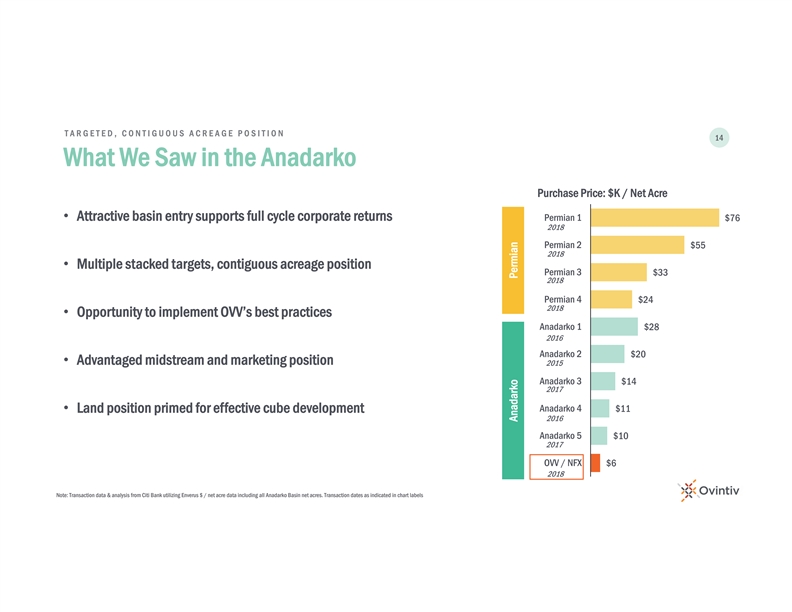
TARGETED, CONTIGUOUS ACREAGE POSITION 14 What We Saw in the Anadarko
Purchase Price: $K / Net Acre • Attractive basin entry supports full cycle corporate returns Permian 1 $76 2018 Permian 2 $55 2018 • Multiple stacked targets, contiguous acreage position Permian 3 $33 2018 Permian 4 $24 2018 •
Opportunity to implement OVV’s best practices Anadarko 1 $28 2016 Anadarko 2 $20 • Advantaged midstream and marketing position 2015 Anadarko 3 $14 2017 Anadarko 4 $11 • Land position primed for effective cube development 2016
Anadarko 5 $10 2017 OVV / NFX $6 2018 Note: Transaction data & analysis from Citi Bank utilizing Enverus $ / net acre data including all Anadarko Basin net acres. Transaction dates as indicated in chart labels Anadarko PermianTARGETED,
CONTIGUOUS ACREAGE POSITION 14 What We Saw in the Anadarko Purchase Price: $K / Net Acre • Attractive basin entry supports full cycle corporate returns Permian 1 $76 2018 Permian 2 $55 2018 • Multiple stacked targets, contiguous acreage
position Permian 3 $33 2018 Permian 4 $24 2018 • Opportunity to implement OVV’s best practices Anadarko 1 $28 2016 Anadarko 2 $20 • Advantaged midstream and marketing position 2015 Anadarko 3 $14 2017 Anadarko 4 $11 • Land
position primed for effective cube development 2016 Anadarko 5 $10 2017 OVV / NFX $6 2018 Note: Transaction data & analysis from Citi Bank utilizing Enverus $ / net acre data including all Anadarko Basin net acres. Transaction dates as indicated
in chart labels Anadarko Permian
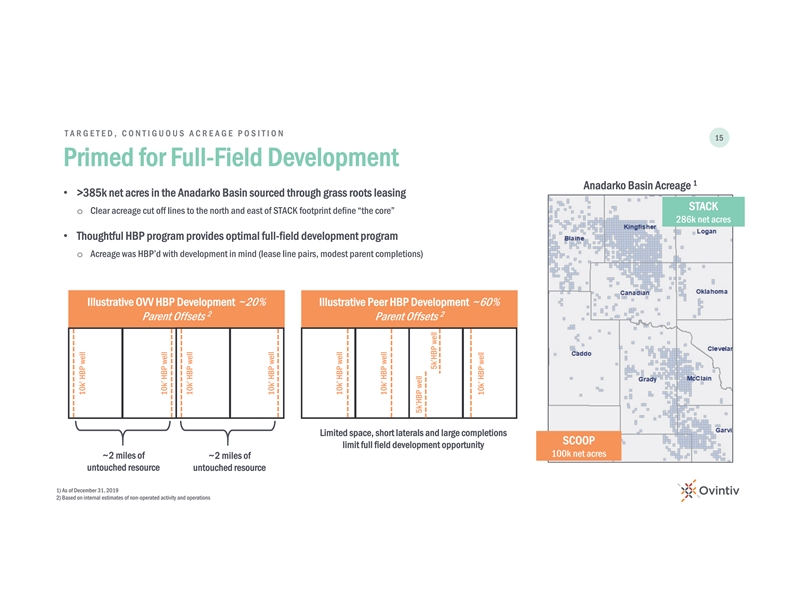
TARGETED, CONTIGUOUS ACREAGE POSITION 15 Primed for Full-Field
Development 1 Anadarko Basin Acreage • >385k net acres in the Anadarko Basin sourced through grass roots leasing STACK o Clear acreage cut off lines to the north and east of STACK footprint define “the core” 286k net acres
• Thoughtful HBP program provides optimal full-field development program o Acreage was HBP’d with development in mind (lease line pairs, modest parent completions) Illustrative OVV HBP Development ~20% Illustrative Peer HBP Development
~60% 2 2 Parent Offsets Parent Offsets Limited space, short laterals and large completions SCOOP limit full field development opportunity 100k net acres ~2 miles of ~2 miles of untouched resource untouched resource 1) As of December 31, 2019 2)
Based on internal estimates of non-operated activity and operations 10k’ HBP well 10k’ HBP well 10k’ HBP well 10k’ HBP well 10k’ HBP well 10k’ HBP well 5k’HBP well 5k’HBP well 10k’ HBP
wellTARGETED, CONTIGUOUS ACREAGE POSITION 15 Primed for Full-Field Development 1 Anadarko Basin Acreage • >385k net acres in the Anadarko Basin sourced through grass roots leasing STACK o Clear acreage cut off lines to the north and east of
STACK footprint define “the core” 286k net acres • Thoughtful HBP program provides optimal full-field development program o Acreage was HBP’d with development in mind (lease line pairs, modest parent completions) Illustrative
OVV HBP Development ~20% Illustrative Peer HBP Development ~60% 2 2 Parent Offsets Parent Offsets Limited space, short laterals and large completions SCOOP limit full field development opportunity 100k net acres ~2 miles of ~2 miles of untouched
resource untouched resource 1) As of December 31, 2019 2) Based on internal estimates of non-operated activity and operations 10k’ HBP well 10k’ HBP well 10k’ HBP well 10k’ HBP well 10k’ HBP well 10k’ HBP well
5k’HBP well 5k’HBP well 10k’ HBP well
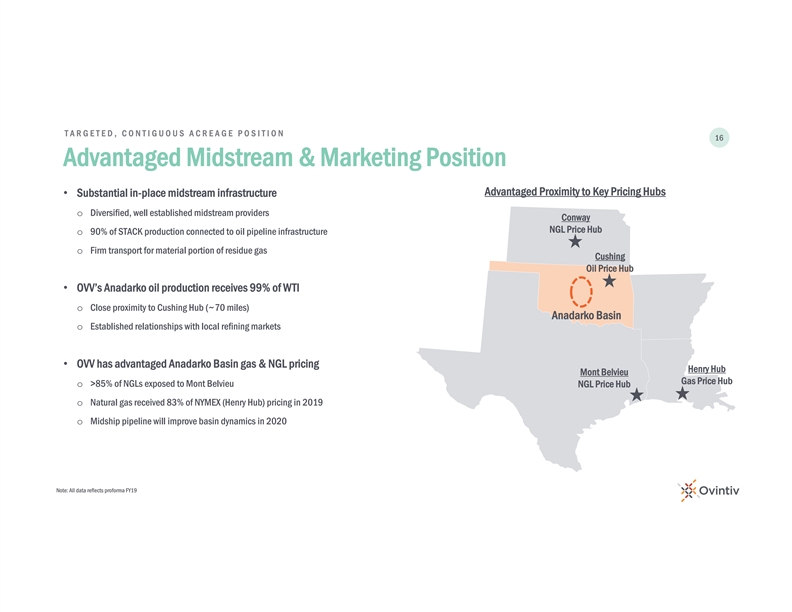
TARGETED, CONTIGUOUS ACREAGE POSITION 16 Advantaged Midstream &
Marketing Position Advantaged Proximity to Key Pricing Hubs • Substantial in-place midstream infrastructure o Diversified, well established midstream providers Conway NGL Price Hub o 90% of STACK production connected to oil pipeline
infrastructure o Firm transport for material portion of residue gas Cushing Oil Price Hub • OVV’s Anadarko oil production receives 99% of WTI o Close proximity to Cushing Hub (~70 miles) Anadarko Basin o Established relationships with
local refining markets • OVV has advantaged Anadarko Basin gas & NGL pricing Henry Hub Mont Belvieu Gas Price Hub o >85% of NGLs exposed to Mont Belvieu NGL Price Hub o Natural gas received 83% of NYMEX (Henry Hub) pricing in 2019 o
Midship pipeline will improve basin dynamics in 2020 Note: All data reflects proforma FY19TARGETED, CONTIGUOUS ACREAGE POSITION 16 Advantaged Midstream & Marketing Position Advantaged Proximity to Key Pricing Hubs • Substantial in-place
midstream infrastructure o Diversified, well established midstream providers Conway NGL Price Hub o 90% of STACK production connected to oil pipeline infrastructure o Firm transport for material portion of residue gas Cushing Oil Price Hub •
OVV’s Anadarko oil production receives 99% of WTI o Close proximity to Cushing Hub (~70 miles) Anadarko Basin o Established relationships with local refining markets • OVV has advantaged Anadarko Basin gas & NGL pricing Henry Hub
Mont Belvieu Gas Price Hub o >85% of NGLs exposed to Mont Belvieu NGL Price Hub o Natural gas received 83% of NYMEX (Henry Hub) pricing in 2019 o Midship pipeline will improve basin dynamics in 2020 Note: All data reflects proforma
FY19
17 Quality Reservoir17 Quality Reservoir
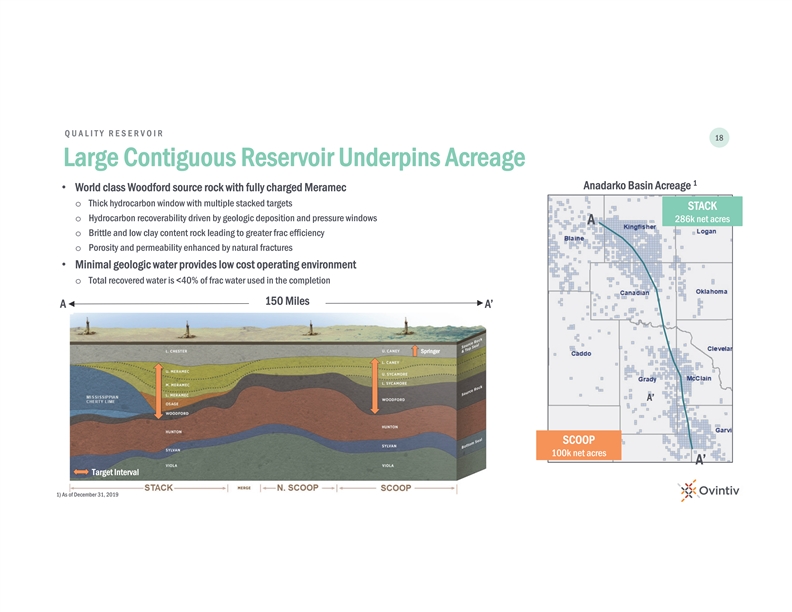
QUALITY RESERV OIR 18 Large Contiguous Reservoir Underpins Acreage 1
Anadarko Basin Acreage • World class Woodford source rock with fully charged Meramec o Thick hydrocarbon window with multiple stacked targets STACK o Hydrocarbon recoverability driven by geologic deposition and pressure windows 286k net acres
A o Brittle and low clay content rock leading to greater frac efficiency o Porosity and permeability enhanced by natural fractures • Minimal geologic water provides low cost operating environment o Total recovered water is <40% of frac
water used in the completion 150 Miles A A’ Springer A’ SCOOP 100k net acres A’ Target Interval 1) As of December 31, 2019QUALITY RESERV OIR 18 Large Contiguous Reservoir Underpins Acreage 1 Anadarko Basin Acreage • World
class Woodford source rock with fully charged Meramec o Thick hydrocarbon window with multiple stacked targets STACK o Hydrocarbon recoverability driven by geologic deposition and pressure windows 286k net acres A o Brittle and low clay content rock
leading to greater frac efficiency o Porosity and permeability enhanced by natural fractures • Minimal geologic water provides low cost operating environment o Total recovered water is <40% of frac water used in the completion 150 Miles A
A’ Springer A’ SCOOP 100k net acres A’ Target Interval 1) As of December 31, 2019
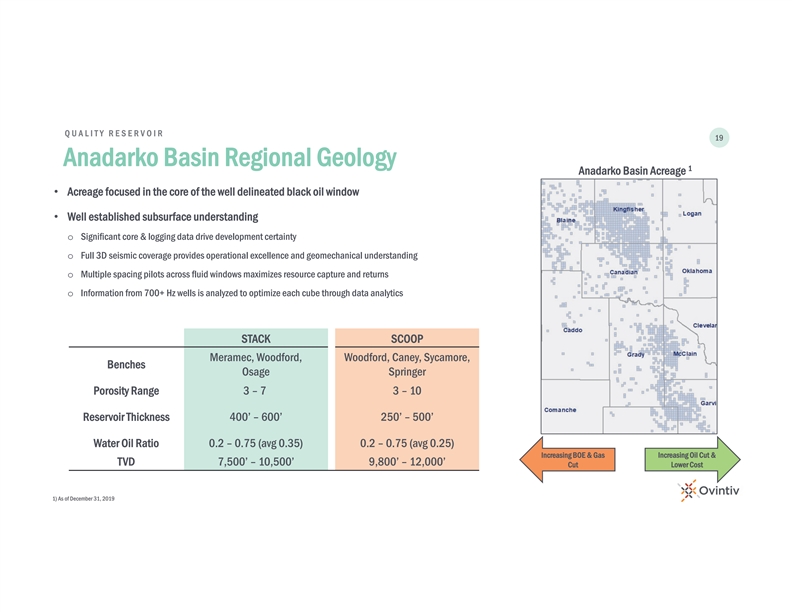
QUALITY RESERV OIR 19 Anadarko Basin Regional Geology 1 Anadarko Basin
Acreage • Acreage focused in the core of the well delineated black oil window • Well established subsurface understanding o Significant core & logging data drive development certainty o Full 3D seismic coverage provides operational
excellence and geomechanical understanding o Multiple spacing pilots across fluid windows maximizes resource capture and returns o Information from 700+ Hz wells is analyzed to optimize each cube through data analytics STACK SCOOP Meramec, Woodford,
Woodford, Caney, Sycamore, Benches Osage Springer Porosity Range 3 – 7 3 – 10 Reservoir Thickness 400’ – 600’ 250’ – 500’ Water Oil Ratio 0.2 – 0.75 (avg 0.35) 0.2 – 0.75 (avg 0.25)
Increasing BOE & Gas Increasing Oil Cut & TVD 7,500’ – 10,500’ 9,800’ – 12,000’ Cut Lower Cost Targets 1) As of December 31, 2019QUALITY RESERV OIR 19 Anadarko Basin Regional Geology 1 Anadarko Basin
Acreage • Acreage focused in the core of the well delineated black oil window • Well established subsurface understanding o Significant core & logging data drive development certainty o Full 3D seismic coverage provides operational
excellence and geomechanical understanding o Multiple spacing pilots across fluid windows maximizes resource capture and returns o Information from 700+ Hz wells is analyzed to optimize each cube through data analytics STACK SCOOP Meramec, Woodford,
Woodford, Caney, Sycamore, Benches Osage Springer Porosity Range 3 – 7 3 – 10 Reservoir Thickness 400’ – 600’ 250’ – 500’ Water Oil Ratio 0.2 – 0.75 (avg 0.35) 0.2 – 0.75 (avg 0.25)
Increasing BOE & Gas Increasing Oil Cut & TVD 7,500’ – 10,500’ 9,800’ – 12,000’ Cut Lower Cost Targets 1) As of December 31, 2019
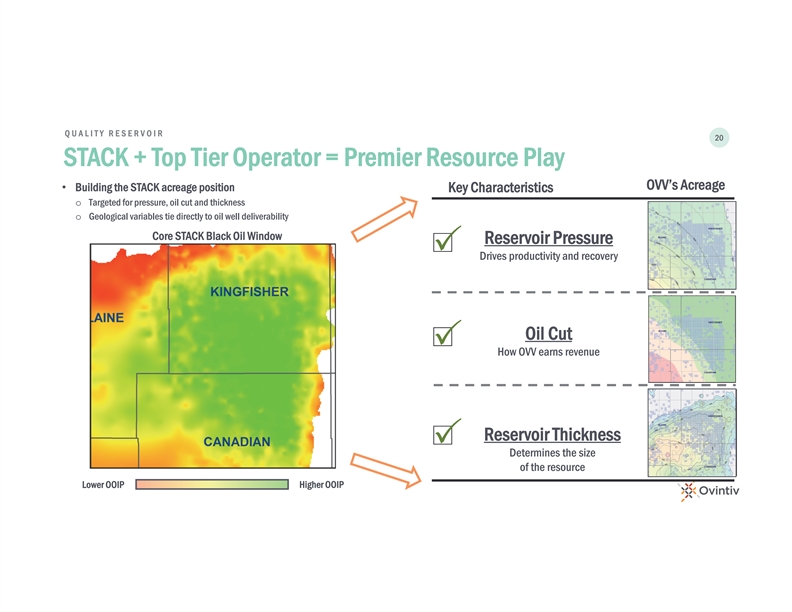
QUALITY RESERV OIR 20 STACK + Top Tier Operator = Premier Resource Play
OVV’s Acreage • Building the STACK acreage position Key Characteristics o Targeted for pressure, oil cut and thickness o Geological variables tie directly to oil well deliverability Core STACK Black Oil Window Reservoir Pressure P
Drives productivity and recovery Oil Cut P How OVV earns revenue Reservoir Thickness P Determines the size of the resource Lower OOIP Higher OOIPQUALITY RESERV OIR 20 STACK + Top Tier Operator = Premier Resource Play OVV’s Acreage
• Building the STACK acreage position Key Characteristics o Targeted for pressure, oil cut and thickness o Geological variables tie directly to oil well deliverability Core STACK Black Oil Window Reservoir Pressure P Drives productivity
and recovery Oil Cut P How OVV earns revenue Reservoir Thickness P Determines the size of the resource Lower OOIP Higher OOIP

21 Ovintiv Edge21 Ovintiv Edge
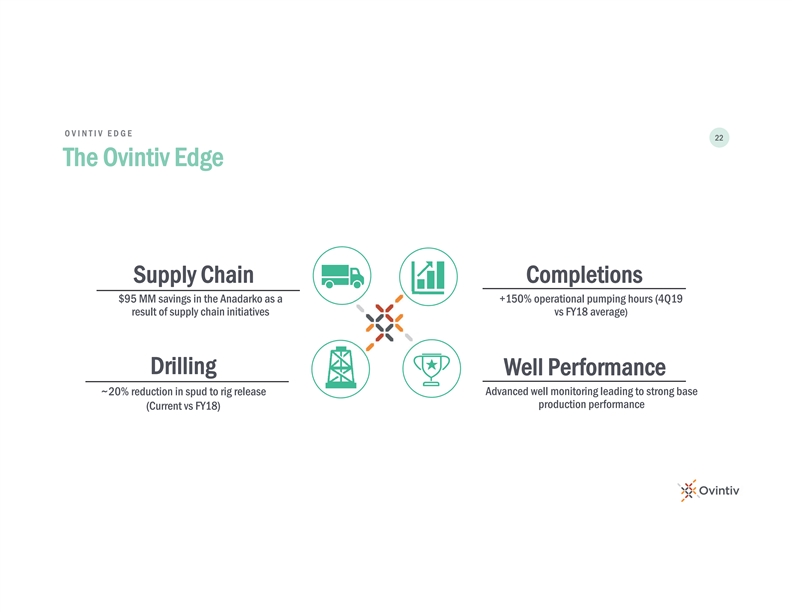
OVINTIV EDGE 22 The Ovintiv Edge Supply Chain Completions $95 MM
savings in the Anadarko as a +150% operational pumping hours (4Q19 result of supply chain initiatives vs FY18 average) Drilling Well Performance ~20% reduction in spud to rig release Advanced well monitoring leading to strong base production
performance (Current vs FY18)OVINTIV EDGE 22 The Ovintiv Edge Supply Chain Completions $95 MM savings in the Anadarko as a +150% operational pumping hours (4Q19 result of supply chain initiatives vs FY18 average) Drilling Well Performance ~20%
reduction in spud to rig release Advanced well monitoring leading to strong base production performance (Current vs FY18)
OVINTIV EDGE 23 Differentiated Supply Chain Management 1 •
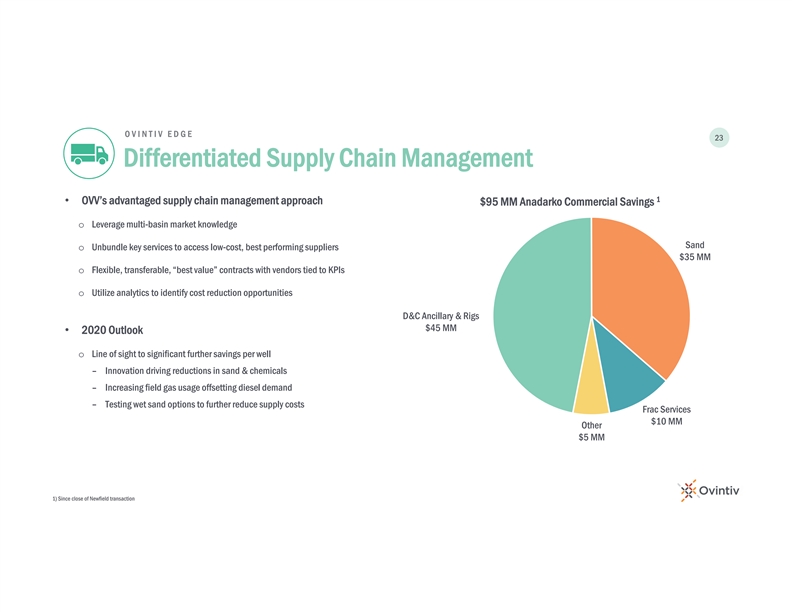
OVV’s advantaged supply chain management approach $95 MM Anadarko Commercial Savings o Leverage multi-basin market knowledge Sand o Unbundle key services to access low-cost, best performing suppliers $35 MM o Flexible, transferable,
“best value” contracts with vendors tied to KPIs o Utilize analytics to identify cost reduction opportunities D&C Ancillary & Rigs $45 MM • 2020 Outlook o Line of sight to significant further savings per well –
Innovation driving reductions in sand & chemicals – Increasing field gas usage offsetting diesel demand – Testing wet sand options to further reduce supply costs Frac Services $10 MM Other $5 MM 1) Since close of Newfield
transactionOVINTIV EDGE 23 Differentiated Supply Chain Management 1 • OVV’s advantaged supply chain management approach $95 MM Anadarko Commercial Savings o Leverage multi-basin market knowledge Sand o Unbundle key services to access
low-cost, best performing suppliers $35 MM o Flexible, transferable, “best value” contracts with vendors tied to KPIs o Utilize analytics to identify cost reduction opportunities D&C Ancillary & Rigs $45 MM • 2020 Outlook o
Line of sight to significant further savings per well – Innovation driving reductions in sand & chemicals – Increasing field gas usage offsetting diesel demand – Testing wet sand options to further reduce supply costs Frac
Services $10 MM Other $5 MM 1) Since close of Newfield transaction
OVINTIV EDGE 24 STACK Drilling Innovation 1 OVV Leading STACK Driller
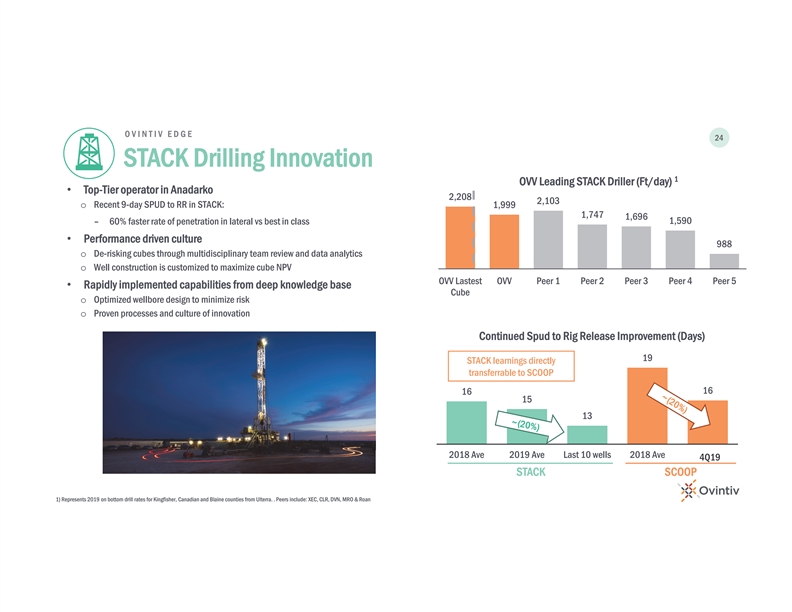
(Ft/day) • Top-Tier operator in Anadarko 2,208 2,103 o Recent 9-day SPUD to RR in STACK: 1,999 1,747 1,696 1,590 – 60% faster rate of penetration in lateral vs best in class • Performance driven culture 988 o De-risking cubes
through multidisciplinary team review and data analytics o Well construction is customized to maximize cube NPV OVV Lastest OVV Peer 1 Peer 2 Peer 3 Peer 4 Peer 5 • Rapidly implemented capabilities from deep knowledge base Cube o Optimized
wellbore design to minimize risk o Proven processes and culture of innovation Continued Spud to Rig Release Improvement (Days) 19 STACK learnings directly transferrable to SCOOP 16 16 15 13 2018 Ave 2019 Ave Last 10 wells 2018 Ave 2019 Ave 4Q19
STACK SCOOP 1) Represents 2019 on bottom drill rates for Kingfisher, Canadian and Blaine counties from Ulterra. . Peers include: XEC, CLR, DVN, MRO & RoanOVINTIV EDGE 24 STACK Drilling Innovation 1 OVV Leading STACK Driller (Ft/day) •
Top-Tier operator in Anadarko 2,208 2,103 o Recent 9-day SPUD to RR in STACK: 1,999 1,747 1,696 1,590 – 60% faster rate of penetration in lateral vs best in class • Performance driven culture 988 o De-risking cubes through
multidisciplinary team review and data analytics o Well construction is customized to maximize cube NPV OVV Lastest OVV Peer 1 Peer 2 Peer 3 Peer 4 Peer 5 • Rapidly implemented capabilities from deep knowledge base Cube o Optimized wellbore
design to minimize risk o Proven processes and culture of innovation Continued Spud to Rig Release Improvement (Days) 19 STACK learnings directly transferrable to SCOOP 16 16 15 13 2018 Ave 2019 Ave Last 10 wells 2018 Ave 2019 Ave 4Q19 STACK SCOOP
1) Represents 2019 on bottom drill rates for Kingfisher, Canadian and Blaine counties from Ulterra. . Peers include: XEC, CLR, DVN, MRO & Roan
OVINTIV EDGE 25 Execution Rapidly Improved Anadarko Returns •
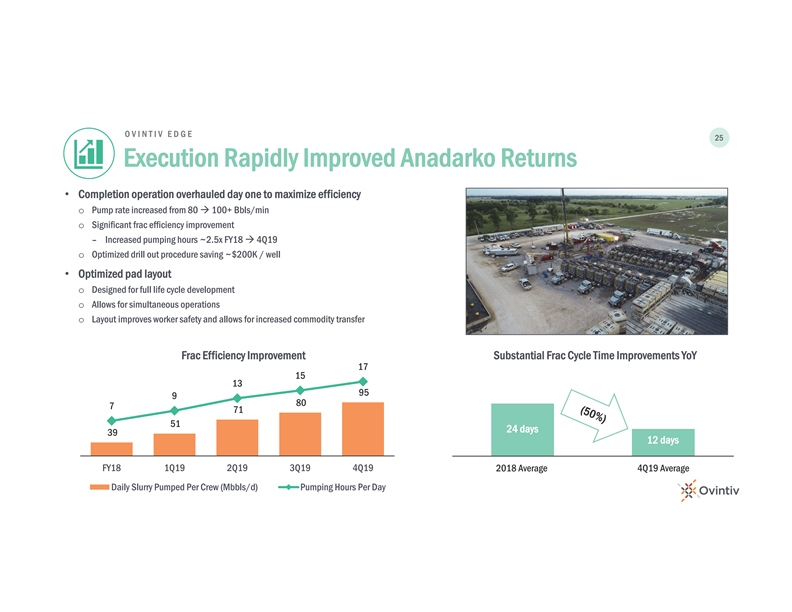
Completion operation overhauled day one to maximize efficiency o Pump rate increased from 80 à 100+ Bbls/min o Significant frac efficiency improvement – Increased pumping hours ~2.5x FY18 à 4Q19 o Optimized drill out procedure saving
~$200K / well • Optimized pad layout o Designed for full life cycle development o Allows for simultaneous operations o Layout improves worker safety and allows for increased commodity transfer Frac Efficiency Improvement Substantial Frac Cycle
Time Improvements YoY 17 15 13 95 9 80 7 71 51 24 days 39 12 days FY18 1Q19 2Q19 3Q19 4Q19 2018 Average 4Q19 Average Daily Slurry Pumped Per Crew (Mbbls/d) Pumping Hours Per DayOVINTIV EDGE 25 Execution Rapidly Improved Anadarko Returns •
Completion operation overhauled day one to maximize efficiency o Pump rate increased from 80 à 100+ Bbls/min o Significant frac efficiency improvement – Increased pumping hours ~2.5x FY18 à 4Q19 o Optimized drill out procedure saving
~$200K / well • Optimized pad layout o Designed for full life cycle development o Allows for simultaneous operations o Layout improves worker safety and allows for increased commodity transfer Frac Efficiency Improvement Substantial Frac Cycle
Time Improvements YoY 17 15 13 95 9 80 7 71 51 24 days 39 12 days FY18 1Q19 2Q19 3Q19 4Q19 2018 Average 4Q19 Average Daily Slurry Pumped Per Crew (Mbbls/d) Pumping Hours Per Day
OVINTIV EDGE 26 Redesigned Production Facilities • Sustainable
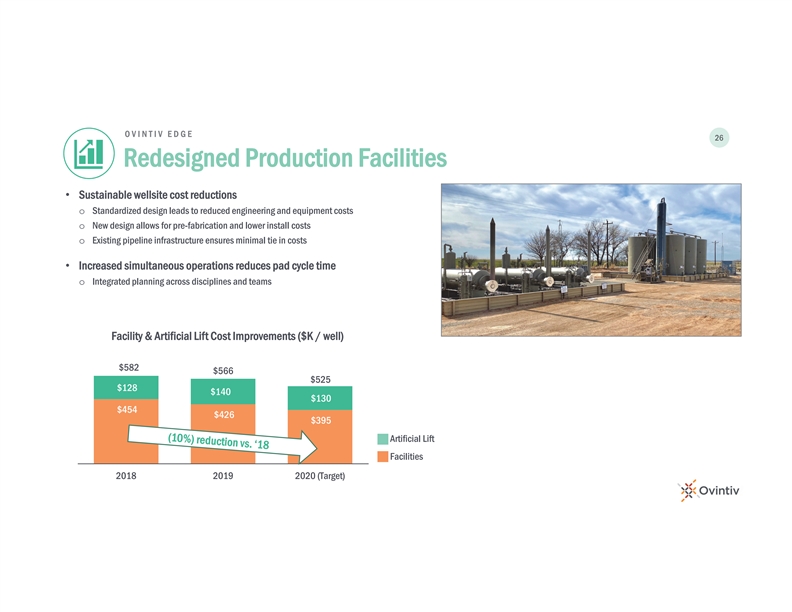
wellsite cost reductions o Standardized design leads to reduced engineering and equipment costs o New design allows for pre-fabrication and lower install costs o Existing pipeline infrastructure ensures minimal tie in costs • Increased
simultaneous operations reduces pad cycle time o Integrated planning across disciplines and teams Facility & Artificial Lift Cost Improvements ($K / well) $582 $566 $525 $128 $140 $130 $454 $426 $395 Artificial Lift Facilities 2018 2019 2020
(Target)OVINTIV EDGE 26 Redesigned Production Facilities • Sustainable wellsite cost reductions o Standardized design leads to reduced engineering and equipment costs o New design allows for pre-fabrication and lower install costs o Existing
pipeline infrastructure ensures minimal tie in costs • Increased simultaneous operations reduces pad cycle time o Integrated planning across disciplines and teams Facility & Artificial Lift Cost Improvements ($K / well) $582 $566 $525 $128
$140 $130 $454 $426 $395 Artificial Lift Facilities 2018 2019 2020 (Target)
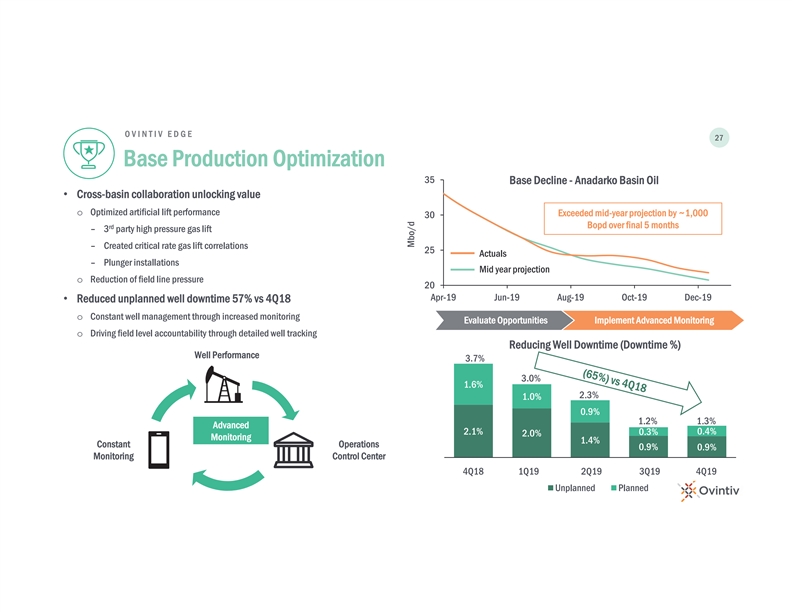
OVINTIV EDGE 27 Base Production Optimization 35 Base Decline - Anadarko
Basin Oil • Cross-basin collaboration unlocking value o Optimized artificial lift performance Exceeded mid-year projection by ~1,000 30 Bopd over final 5 months rd –3 party high pressure gas lift – Created critical rate gas lift
correlations 25 Actuals – Plunger installations Mid year projection o Reduction of field line pressure 20 Apr-19 Jun-19 Aug-19 Oct-19 Dec-19 • Reduced unplanned well downtime 57% vs 4Q18 o Constant well management through increased
monitoring Evaluate Opportunities Implement Advanced Monitoring o Driving field level accountability through detailed well tracking Reducing Well Downtime (Downtime %) Well Performance 3.7% 3.0% 1.6% 2.3% 1.0% 0.9% 1.2% 1.3% Advanced 2.1% 0.3% 0.4%
2.0% Monitoring 1.4% Constant Operations 0.9% 0.9% Monitoring Control Center 18-Q4 19-Q1 19-Q2 19-Q3 19-Q4 4Q18 1Q19 2Q19 3Q19 4Q19 Unplanned Planned Mbo/dOVINTIV EDGE 27 Base Production Optimization 35 Base Decline - Anadarko Basin Oil •
Cross-basin collaboration unlocking value o Optimized artificial lift performance Exceeded mid-year projection by ~1,000 30 Bopd over final 5 months rd –3 party high pressure gas lift – Created critical rate gas lift correlations 25
Actuals – Plunger installations Mid year projection o Reduction of field line pressure 20 Apr-19 Jun-19 Aug-19 Oct-19 Dec-19 • Reduced unplanned well downtime 57% vs 4Q18 o Constant well management through increased monitoring Evaluate
Opportunities Implement Advanced Monitoring o Driving field level accountability through detailed well tracking Reducing Well Downtime (Downtime %) Well Performance 3.7% 3.0% 1.6% 2.3% 1.0% 0.9% 1.2% 1.3% Advanced 2.1% 0.3% 0.4% 2.0% Monitoring 1.4%
Constant Operations 0.9% 0.9% Monitoring Control Center 18-Q4 19-Q1 19-Q2 19-Q3 19-Q4 4Q18 1Q19 2Q19 3Q19 4Q19 Unplanned Planned Mbo/d
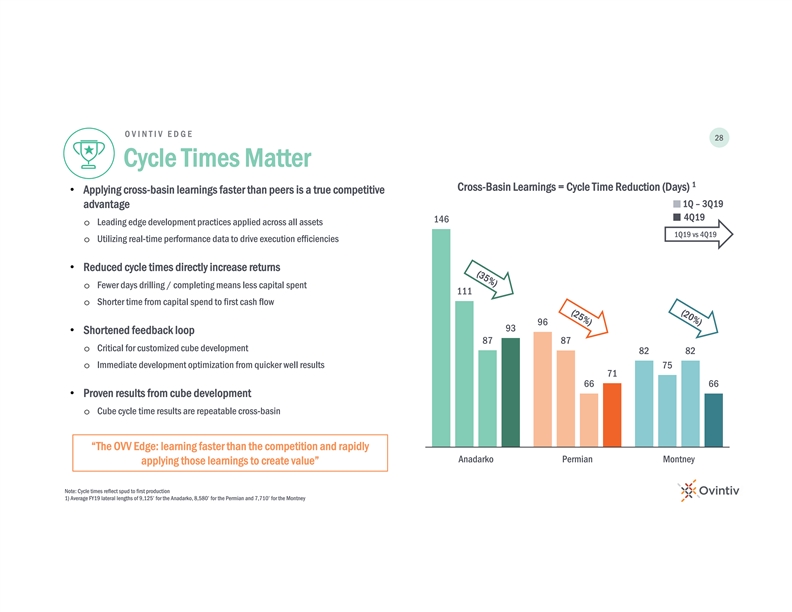
OVINTIV EDGE 28 Cycle Times Matter 1 Cross-Basin Learnings = Cycle Time
Reduction (Days) • Applying cross-basin learnings faster than peers is a true competitive 1Q – 3Q19 advantage 4Q19 146 o Leading edge development practices applied across all assets 1Q19 vs 4Q19 o Utilizing real-time performance data to
drive execution efficiencies • Reduced cycle times directly increase returns o Fewer days drilling / completing means less capital spent 111 o Shorter time from capital spend to first cash flow 96 93 • Shortened feedback loop 87 87 o
Critical for customized cube development 82 82 o Immediate development optimization from quicker well results 75 71 66 66 • Proven results from cube development o Cube cycle time results are repeatable cross-basin “The OVV Edge: learning
faster than the competition and rapidly Anadarko Permian Montney applying those learnings to create value” Note: Cycle times reflect spud to first production 1) Average FY19 lateral lengths of 9,125’ for the Anadarko, 8,580’ for
the Permian and 7,710’ for the MontneyOVINTIV EDGE 28 Cycle Times Matter 1 Cross-Basin Learnings = Cycle Time Reduction (Days) • Applying cross-basin learnings faster than peers is a true competitive 1Q – 3Q19 advantage 4Q19 146 o
Leading edge development practices applied across all assets 1Q19 vs 4Q19 o Utilizing real-time performance data to drive execution efficiencies • Reduced cycle times directly increase returns o Fewer days drilling / completing means less
capital spent 111 o Shorter time from capital spend to first cash flow 96 93 • Shortened feedback loop 87 87 o Critical for customized cube development 82 82 o Immediate development optimization from quicker well results 75 71 66 66 •
Proven results from cube development o Cube cycle time results are repeatable cross-basin “The OVV Edge: learning faster than the competition and rapidly Anadarko Permian Montney applying those learnings to create value” Note: Cycle
times reflect spud to first production 1) Average FY19 lateral lengths of 9,125’ for the Anadarko, 8,580’ for the Permian and 7,710’ for the Montney

29 Strong Returns29 Strong Returns
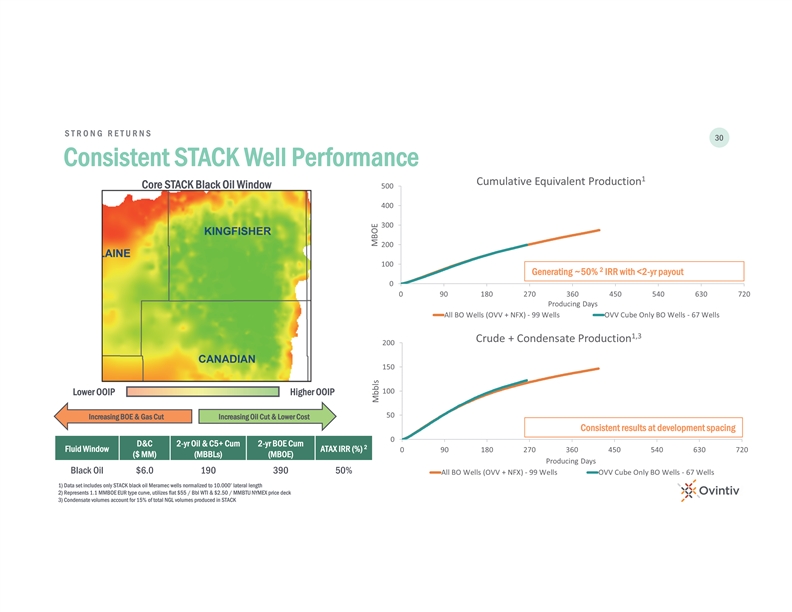
STRONG RETUR N S 30 Consistent STACK Well Performance Core STACK Black
Oil Window 2 Generating ~50% IRR with <2-yr payout Lower OOIP Higher OOIP Increasing BOE & Gas Cut Increasing Oil Cut & Lower Cost Consistent results at development spacing D&C 2-yr Oil & C5+ Cum 2-yr BOE Cum 2 Fluid Window ATAX
IRR (%) ($ MM) (MBBLs) (MBOE) Black Oil $6.0 190 390 50% 1) Data set includes only STACK black oil Meramec wells normalized to 10.000’ lateral length 2) Represents 1.1 MMBOE EUR type curve, utilizes flat $55 / Bbl WTI & $2.50 / MMBTU NYMEX
price deck 3) Condensate volumes account for 15% of total NGL volumes produced in STACKSTRONG RETUR N S 30 Consistent STACK Well Performance Core STACK Black Oil Window 2 Generating ~50% IRR with <2-yr payout Lower OOIP Higher OOIP Increasing BOE
& Gas Cut Increasing Oil Cut & Lower Cost Consistent results at development spacing D&C 2-yr Oil & C5+ Cum 2-yr BOE Cum 2 Fluid Window ATAX IRR (%) ($ MM) (MBBLs) (MBOE) Black Oil $6.0 190 390 50% 1) Data set includes only STACK
black oil Meramec wells normalized to 10.000’ lateral length 2) Represents 1.1 MMBOE EUR type curve, utilizes flat $55 / Bbl WTI & $2.50 / MMBTU NYMEX price deck 3) Condensate volumes account for 15% of total NGL volumes produced in
STACK
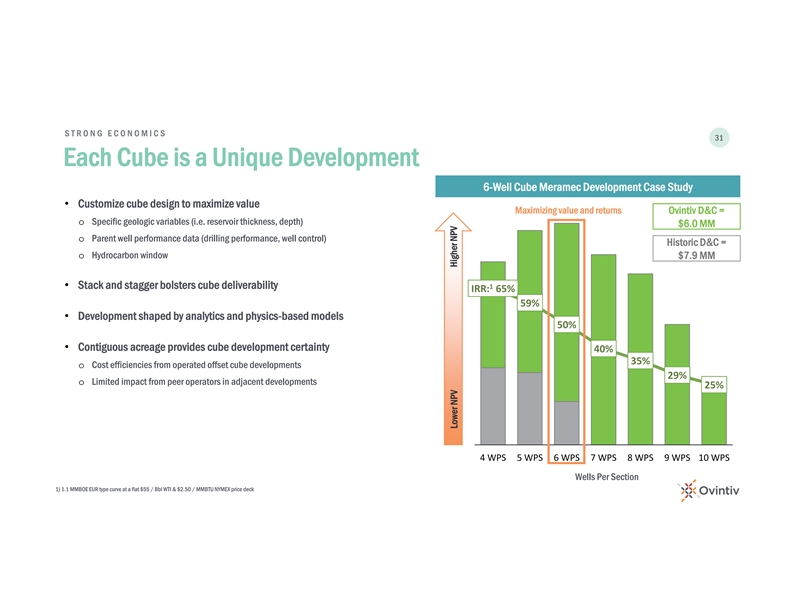
STRONG ECONOMICS 31 Each Cube is a Unique Development 6-Well Cube
Meramec Development Case Study 100% • Customize cube design to maximize value Maximizing value and returns Ovintiv D&C = o Specific geologic variables (i.e. reservoir thickness, depth) $6.0 MM 90% o Parent well performance data (drilling
performance, well control) Historic D&C = 80% o Hydrocarbon window $7.9 MM 70% • Stack and stagger bolsters cube deliverability1 IRR:65% 60% 59% • Development shaped by analytics and physics-based models 50% 50% • Contiguous
acreage provides cube development certainty 40% 40% 35% o Cost efficiencies from operated offset cube developments 30% 29% o Limited impact from peer operators in adjacent developments 25% 20% 10% 0% 4 WPS 5 WPS 6 WPS 7 WPS 8 WPS 9 WPS 10 WPS Wells
Per Section 1) 1.1 MMBOE EUR type curve at a flat $55 / Bbl WTI & $2.50 / MMBTU NYMEX price deck Lower NPV Higher NPVSTRONG ECONOMICS 31 Each Cube is a Unique Development 6-Well Cube Meramec Development Case Study 100% • Customize cube
design to maximize value Maximizing value and returns Ovintiv D&C = o Specific geologic variables (i.e. reservoir thickness, depth) $6.0 MM 90% o Parent well performance data (drilling performance, well control) Historic D&C = 80% o
Hydrocarbon window $7.9 MM 70% • Stack and stagger bolsters cube deliverability1 IRR:65% 60% 59% • Development shaped by analytics and physics-based models 50% 50% • Contiguous acreage provides cube development certainty 40% 40%
35% o Cost efficiencies from operated offset cube developments 30% 29% o Limited impact from peer operators in adjacent developments 25% 20% 10% 0% 4 WPS 5 WPS 6 WPS 7 WPS 8 WPS 9 WPS 10 WPS Wells Per Section 1) 1.1 MMBOE EUR type curve at a flat
$55 / Bbl WTI & $2.50 / MMBTU NYMEX price deck Lower NPV Higher NPV
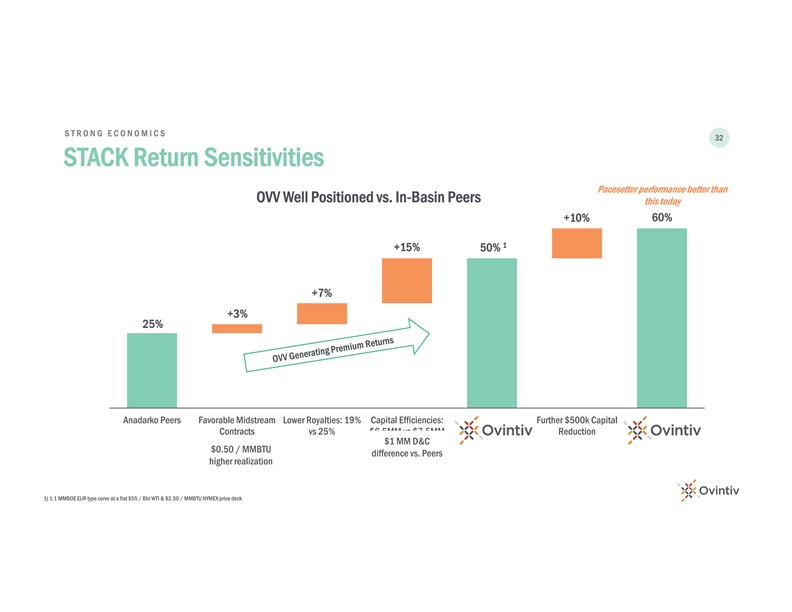
STRONG ECONOMICS 32 STACK Return Sensitivities Pacesetter performance
better than OVV Well Positioned vs. In-Basin Peers this today 60% +10% 1 +15% 50% +7% +3% 25% Anadarko Peers Favorable Midstream Lower Royalties: 19% Capital Efficiencies: Ovintiv Further $500k Capital Future OVV Returns Contracts vs 25% $6.5MM vs
$7.5MM Reduction $1 MM D&C $0.50 / MMBTU difference vs. Peers higher realization 1) 1.1 MMBOE EUR type curve at a flat $55 / Bbl WTI & $2.50 / MMBTU NYMEX price deckSTRONG ECONOMICS 32 STACK Return Sensitivities Pacesetter performance better
than OVV Well Positioned vs. In-Basin Peers this today 60% +10% 1 +15% 50% +7% +3% 25% Anadarko Peers Favorable Midstream Lower Royalties: 19% Capital Efficiencies: Ovintiv Further $500k Capital Future OVV Returns Contracts vs 25% $6.5MM vs $7.5MM
Reduction $1 MM D&C $0.50 / MMBTU difference vs. Peers higher realization 1) 1.1 MMBOE EUR type curve at a flat $55 / Bbl WTI & $2.50 / MMBTU NYMEX price deck
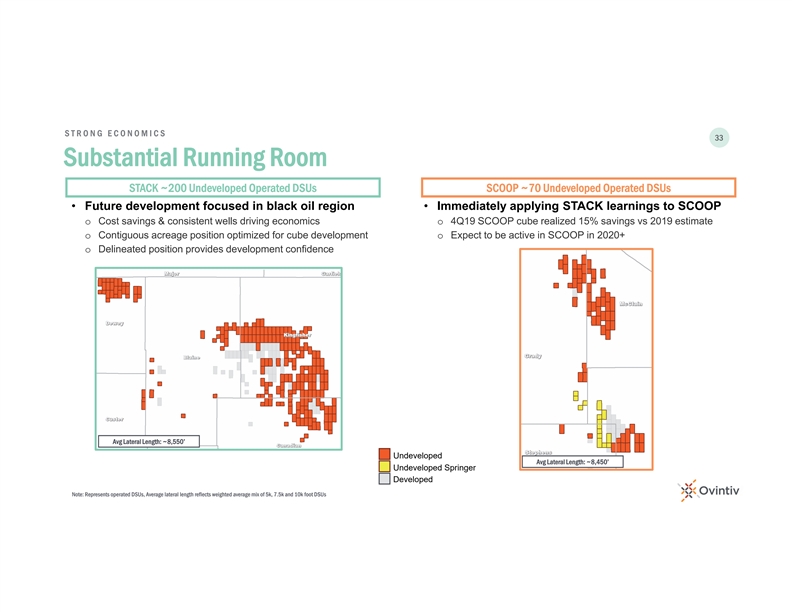
STRONG ECONOMICS 33 Substantial Running Room STACK ~200 Undeveloped
Operated DSUs SCOOP ~70 Undeveloped Operated DSUs • Future development focused in black oil region • Immediately applying STACK learnings to SCOOP o Cost savings & consistent wells driving economics o 4Q19 SCOOP cube realized 15%
savings vs 2019 estimate o Contiguous acreage position optimized for cube development o Expect to be active in SCOOP in 2020+ o Delineated position provides development confidence Avg Lateral Length: ~8,550’ Undeveloped Avg Lateral Length:
~8,450’ Undeveloped Springer Developed Note: Represents operated DSUs, Average lateral length reflects weighted average mix of 5k, 7.5k and 10k foot DSUsSTRONG ECONOMICS 33 Substantial Running Room STACK ~200 Undeveloped Operated DSUs SCOOP
~70 Undeveloped Operated DSUs • Future development focused in black oil region • Immediately applying STACK learnings to SCOOP o Cost savings & consistent wells driving economics o 4Q19 SCOOP cube realized 15% savings vs 2019
estimate o Contiguous acreage position optimized for cube development o Expect to be active in SCOOP in 2020+ o Delineated position provides development confidence Avg Lateral Length: ~8,550’ Undeveloped Avg Lateral Length: ~8,450’
Undeveloped Springer Developed Note: Represents operated DSUs, Average lateral length reflects weighted average mix of 5k, 7.5k and 10k foot DSUs
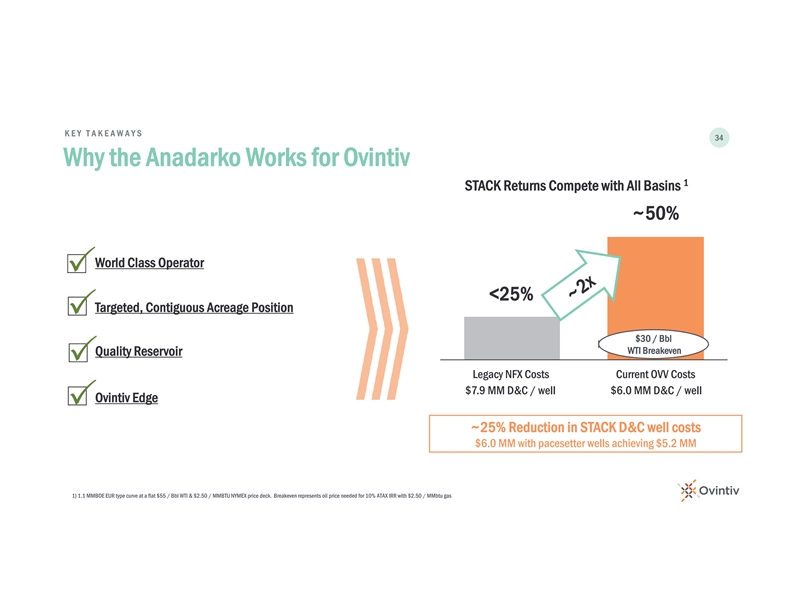
KEY TAKEAWAY S 34 Why the Anadarko Works for Ovintiv 1 STACK Returns
Compete with All Basins ~50% World Class Operator P <25% Targeted, Contiguous Acreage Position P $30 / Bbl WTI Breakeven Quality Reservoir P Legacy NFX Costs Current OVV Costs $7.9 MM D&C / well $6.0 MM D&C / well Ovintiv Edge
P ~25% Reduction in STACK D&C well costs $6.0 MM with pacesetter wells achieving $5.2 MM 1) 1.1 MMBOE EUR type curve at a flat $55 / Bbl WTI & $2.50 / MMBTU NYMEX price deck. Breakeven represents oil price needed for 10% ATAX IRR with
$2.50 / MMbtu gasKEY TAKEAWAY S 34 Why the Anadarko Works for Ovintiv 1 STACK Returns Compete with All Basins ~50% World Class Operator P <25% Targeted, Contiguous Acreage Position P $30 / Bbl WTI Breakeven Quality Reservoir P Legacy
NFX Costs Current OVV Costs $7.9 MM D&C / well $6.0 MM D&C / well Ovintiv Edge P ~25% Reduction in STACK D&C well costs $6.0 MM with pacesetter wells achieving $5.2 MM 1) 1.1 MMBOE EUR type curve at a flat $55 / Bbl WTI & $2.50 /
MMBTU NYMEX price deck. Breakeven represents oil price needed for 10% ATAX IRR with $2.50 / MMbtu gas
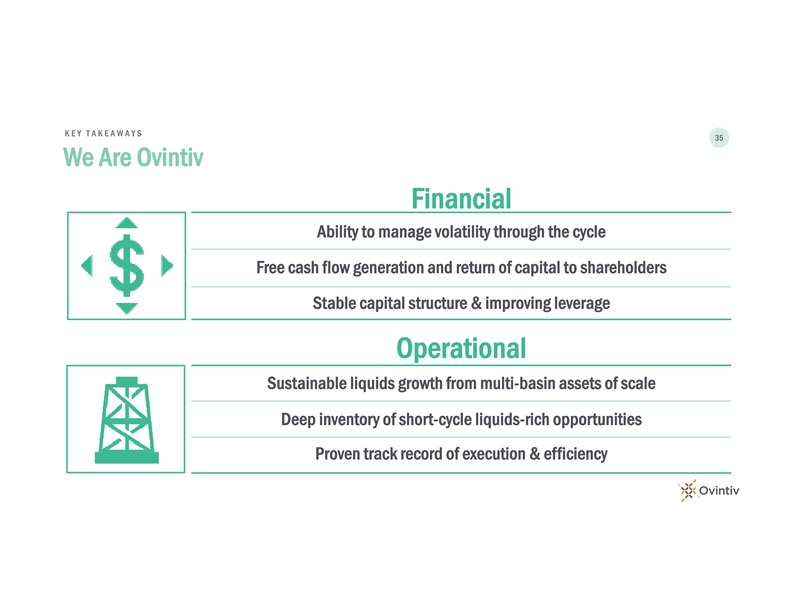
KEY TAKEAWAY S 35 We Are Ovintiv Financial Ability to manage volatility
through the cycle Free cash flow generation and return of capital to shareholders Stable capital structure & improving leverage Operational Sustainable liquids growth from multi-basin assets of scale Deep inventory of short-cycle liquids-rich
opportunities Proven track record of execution & efficiencyKEY TAKEAWAY S 35 We Are Ovintiv Financial Ability to manage volatility through the cycle Free cash flow generation and return of capital to shareholders Stable capital structure &
improving leverage Operational Sustainable liquids growth from multi-basin assets of scale Deep inventory of short-cycle liquids-rich opportunities Proven track record of execution & efficiency
36 Future Oriented Information This presentation contains
forward-looking statements or information (collectively, “FLS”) within the meaning of applicable securities legislation, including Section 27A of the Securities Act of 1933, as amended, and Section 21E of the Securities Exchange Act of
1934, as amended. FLS include: • expectation of meeting or exceeding targets in corporate guidance • anticipated outlook and priorities therein, management of balance sheet and credit rating, access to liquidity, available free cash
flow, returns, • anticipated capital program, including focus of development and allocation thereof, number of wells on stream, level of capital productivity, dividend growth, deleveraging, and focus on capital and efficient operations
expected return and source of funding • growth in long-term shareholder value and plan to return cash to shareholders, including anticipated dividends • anticipated production, including growth from core assets, cash flow, free cash
flow, capital coverage, payout, profit, net present value, rates of • expected net debt, net debt to adjusted EBITDA, target leverage, financial capacity and other debt metrics return, recovery, return on capital employed, production and
execution efficiency, operating, income and cash flow margin, and margin growth, • commodity price outlook including expected timeframes • outcomes of risk management program, including exposure to commodity prices and foreign exchange,
amount of hedged production, market • benefits of the Ovintiv Edge, well performance, completions intensity, location, running room and scale of assets, including its competitiveness access, market diversification strategy and physical sales
locations and pace of growth against peers, and costs within assets • environmental, health and safety performance • number of potential drilling locations, well spacing, number of wells per pad, decline rate, rig count, rig release
metrics, focus and timing of • portfolio refinement and timing of closing thereof drilling, anticipated vertical and horizontal drilling, cycle times, commodity composition, gas-oil ratios and operating performance compared to •
advantages of multi-basin portfolio type curves • benefits of the corporate reorganization, including opportunity to enhance long-term value for shareholders, liquidity and capital market access, • pacesetting metrics being indicative of
future well performance and costs, and sustainability thereof exposure to larger pools of investment, comparability with U.S. peers, increase in passive and index ownership and benefits of the new brand • timing, success and benefits from
innovation, cube development approach, advanced completions design, scale of development, high-intensity and logo completions and precision targeting, and transferability of ideas • estimated tax impacts and other costs to the company and
shareholders • anticipated efficiencies, including well costs, G&A, drilling and completion cycle times, supply chain management, and operating, corporate, • timing of special meeting of securityholders transportation and processing
activities • the company’s sustainable business roadmap and elements thereof • leading position and quality of plays in North America • ESG approach, performance and results, and sustainability thereof • estimated
reserves and resources, including product types and stacked resource potential • expected transportation and processing capacity, commitments, curtailments and restrictions, including flexibility of commercial arrangements and costs and timing
of certain infrastructure being operational FLS involve assumptions, risks and uncertainties that may cause such statements not to occur or results to differ materially. These assumptions include: future commodity prices and differentials; foreign
exchange rates; assumptions contained in corporate guidance and as specified herein; data contained in key modeling statistics; availability of attractive hedges and enforceability of risk management program; results from innovations; expectation
that counterparties will fulfill their obligations; access to transportation and processing facilities; assumed tax, royalty and regulatory regimes; and expectations and projections made in light of Ovintiv's historical experience and its perception
of historical trends. Risks and uncertainties include: ability to achieve anticipated benefits of the corporate reorganization; ability to generate sufficient cash flow to meet obligations; commodity price volatility; ability to secure adequate
transportation and potential pipeline curtailments; variability and discretion to declare and pay dividends, if any; timing and costs of well, facilities and pipeline construction; business interruption, property and casualty losses or unexpected
technical difficulties; counterparty and credit risk; changes in credit rating and its impact on access to liquidity, including ability to issue commercial paper; currency and interest rates; risks inherent in corporate guidance; failure to achieve
cost and efficiency initiatives; risks in marketing operations; risks associated with technology; risks that the description of transactions in external communications may not properly reflect the underlying legal and tax principles of the corporate
reorganization; changes in or interpretation of laws or regulations; risks associated with existing and potential lawsuits and regulatory actions; impact of disputes arising with partners, including suspension of certain obligations and inability to
dispose of assets or interests in certain arrangements; ability to acquire or find additional reserves; imprecision of reserves estimates and estimates of recoverable quantities and future net revenue; risks associated with past and future
acquisitions or divestitures of certain assets or other transactions or receipt of amounts contemplated under the transaction agreements (such transactions may include third-party capital investments, farm-outs or partnerships, which Ovintiv may
refer to from time to time as “partnerships” or “joint ventures” and the funds received in respect thereof which Ovintiv may refer to from time to time as “proceeds”, “deferred purchase price” and/or
“carry capital”, regardless of the legal form) as a result of various conditions not being met; and other risks and uncertainties, as described in Ovintiv’s or Encana Corporation’s most recent Annual Report on Form 10-K and
Quarterly Report on Form 10-Q and as described from time to time in Ovintiv’s other periodic filings as filed on SEDAR and EDGAR. Although Ovintiv believes such FLS are reasonable, there can be no assurance they will prove to be correct. The
above assumptions, risks and uncertainties are not exhaustive. FLS are made as of the date hereof and, except as required by law, Ovintiv undertakes no obligation to update or revise any FLS. Certain future oriented financial information or
financial outlook information is included in this presentation to communicate current expectations as to Ovintiv’s performance. Readers are cautioned that it may not be appropriate for other purposes. Rates of return for a particular asset or
well are on a before-tax basis and are based on specified commodity prices with local pricing offsets, capital costs associated with drilling, completing and equipping a well, field operating expenses and certain type curve assumptions. Pacesetter
well costs for a particular asset are a composite of the best drilling performance and best completions performance wells in the current quarter in such asset and are presented for comparison purposes. Drilling and completions costs have been
normalized as specified in this presentation based on certain lateral lengths for a particular asset. For convenience, references in this presentation to “Ovintiv”, the “Company”, “we”, “us” and
“our” may, where applicable, refer only to or include any relevant direct and indirect subsidiary corporations and partnerships (“Subsidiaries”) of Ovintiv Inc., and the assets, activities and initiatives of such
Subsidiaries.36 Future Oriented Information This presentation contains forward-looking statements or information (collectively, “FLS”) within the meaning of applicable securities legislation, including Section 27A of the Securities Act
of 1933, as amended, and Section 21E of the Securities Exchange Act of 1934, as amended. FLS include: • expectation of meeting or exceeding targets in corporate guidance • anticipated outlook and priorities therein, management of balance
sheet and credit rating, access to liquidity, available free cash flow, returns, • anticipated capital program, including focus of development and allocation thereof, number of wells on stream, level of capital productivity, dividend growth,
deleveraging, and focus on capital and efficient operations expected return and source of funding • growth in long-term shareholder value and plan to return cash to shareholders, including anticipated dividends • anticipated production,
including growth from core assets, cash flow, free cash flow, capital coverage, payout, profit, net present value, rates of • expected net debt, net debt to adjusted EBITDA, target leverage, financial capacity and other debt metrics return,
recovery, return on capital employed, production and execution efficiency, operating, income and cash flow margin, and margin growth, • commodity price outlook including expected timeframes • outcomes of risk management program,
including exposure to commodity prices and foreign exchange, amount of hedged production, market • benefits of the Ovintiv Edge, well performance, completions intensity, location, running room and scale of assets, including its competitiveness
access, market diversification strategy and physical sales locations and pace of growth against peers, and costs within assets • environmental, health and safety performance • number of potential drilling locations, well spacing, number
of wells per pad, decline rate, rig count, rig release metrics, focus and timing of • portfolio refinement and timing of closing thereof drilling, anticipated vertical and horizontal drilling, cycle times, commodity composition, gas-oil ratios
and operating performance compared to • advantages of multi-basin portfolio type curves • benefits of the corporate reorganization, including opportunity to enhance long-term value for shareholders, liquidity and capital market access,
• pacesetting metrics being indicative of future well performance and costs, and sustainability thereof exposure to larger pools of investment, comparability with U.S. peers, increase in passive and index ownership and benefits of the new
brand • timing, success and benefits from innovation, cube development approach, advanced completions design, scale of development, high-intensity and logo completions and precision targeting, and transferability of ideas • estimated tax
impacts and other costs to the company and shareholders • anticipated efficiencies, including well costs, G&A, drilling and completion cycle times, supply chain management, and operating, corporate, • timing of special meeting of
securityholders transportation and processing activities • the company’s sustainable business roadmap and elements thereof • leading position and quality of plays in North America • ESG approach, performance and results, and
sustainability thereof • estimated reserves and resources, including product types and stacked resource potential • expected transportation and processing capacity, commitments, curtailments and restrictions, including flexibility of
commercial arrangements and costs and timing of certain infrastructure being operational FLS involve assumptions, risks and uncertainties that may cause such statements not to occur or results to differ materially. These assumptions include: future
commodity prices and differentials; foreign exchange rates; assumptions contained in corporate guidance and as specified herein; data contained in key modeling statistics; availability of attractive hedges and enforceability of risk management
program; results from innovations; expectation that counterparties will fulfill their obligations; access to transportation and processing facilities; assumed tax, royalty and regulatory regimes; and expectations and projections made in light of
Ovintiv's historical experience and its perception of historical trends. Risks and uncertainties include: ability to achieve anticipated benefits of the corporate reorganization; ability to generate sufficient cash flow to meet obligations;
commodity price volatility; ability to secure adequate transportation and potential pipeline curtailments; variability and discretion to declare and pay dividends, if any; timing and costs of well, facilities and pipeline construction; business
interruption, property and casualty losses or unexpected technical difficulties; counterparty and credit risk; changes in credit rating and its impact on access to liquidity, including ability to issue commercial paper; currency and interest rates;
risks inherent in corporate guidance; failure to achieve cost and efficiency initiatives; risks in marketing operations; risks associated with technology; risks that the description of transactions in external communications may not properly reflect
the underlying legal and tax principles of the corporate reorganization; changes in or interpretation of laws or regulations; risks associated with existing and potential lawsuits and regulatory actions; impact of disputes arising with partners,
including suspension of certain obligations and inability to dispose of assets or interests in certain arrangements; ability to acquire or find additional reserves; imprecision of reserves estimates and estimates of recoverable quantities and future
net revenue; risks associated with past and future acquisitions or divestitures of certain assets or other transactions or receipt of amounts contemplated under the transaction agreements (such transactions may include third-party capital
investments, farm-outs or partnerships, which Ovintiv may refer to from time to time as “partnerships” or “joint ventures” and the funds received in respect thereof which Ovintiv may refer to from time to time as
“proceeds”, “deferred purchase price” and/or “carry capital”, regardless of the legal form) as a result of various conditions not being met; and other risks and uncertainties, as described in Ovintiv’s or
Encana Corporation’s most recent Annual Report on Form 10-K and Quarterly Report on Form 10-Q and as described from time to time in Ovintiv’s other periodic filings as filed on SEDAR and EDGAR. Although Ovintiv believes such FLS are
reasonable, there can be no assurance they will prove to be correct. The above assumptions, risks and uncertainties are not exhaustive. FLS are made as of the date hereof and, except as required by law, Ovintiv undertakes no obligation to update or
revise any FLS. Certain future oriented financial information or financial outlook information is included in this presentation to communicate current expectations as to Ovintiv’s performance. Readers are cautioned that it may not be
appropriate for other purposes. Rates of return for a particular asset or well are on a before-tax basis and are based on specified commodity prices with local pricing offsets, capital costs associated with drilling, completing and equipping a well,
field operating expenses and certain type curve assumptions. Pacesetter well costs for a particular asset are a composite of the best drilling performance and best completions performance wells in the current quarter in such asset and are presented
for comparison purposes. Drilling and completions costs have been normalized as specified in this presentation based on certain lateral lengths for a particular asset. For convenience, references in this presentation to “Ovintiv”, the
“Company”, “we”, “us” and “our” may, where applicable, refer only to or include any relevant direct and indirect subsidiary corporations and partnerships (“Subsidiaries”) of Ovintiv Inc.,
and the assets, activities and initiatives of such Subsidiaries.
37 Advisory Regarding Oil & Gas Information All reserves estimates
in this presentation are effective as of December 31, 2018, prepared by qualified reserves evaluators in accordance with procedures and standards contained in the Canadian Oil and Gas Evaluation ( COGE ) Handbook, National Instrument 51-101 (NI
51-101) and SEC regulations,as applicable. Detailed Canadian and U.S. protocol disclosure will be contained in the Form 51-101F1 and Annual Report on Form 10-K, respectively. Information on the forecast prices and costs used in preparing the
Canadian protocol estimates are contained in the Form 51-101F1. For additional information relating to risks associated with the estimates of reserves, see Item 1A. Risk Factors of the Annual Report on Form 10-K. Reserves are the estimated remaining
quantities of oil and natural gas and related substances anticipated to be recoverable from known accumulations, from a given date forward, based on: analysis of drilling, geological, geophysical and engineering data, the use of established
technology, and specified economic conditions, which are generally accepted as being reasonable. Proved reserves are those reserves which can be estimated with a high degree of certainty to be recoverable. It is likely that the actual remaining
quantities recovered will exceed the estimated proved reserves. Ovintiv uses the terms play and resource play. Play encompasses resource plays, geological formations and conventional plays. Resource play describes an accumulation of hydrocarbons
known to exist over a large areal expanse and/or thick vertical section, which when compared to a conventional play, typically has a lower geological and/or commercial development risk and lower average decline rate. As used by Ovintiv, estimated
ultimate recovery (“EUR”) has the meaning set out jointly by the Society of Petroleum Engineers and World Petroleum Congress in the year 2000, being those quantities of petroleum which are estimated, on a given date, to be potentially
recoverable from an accumulation, plus those quantities already produced therefrom. Ovintiv has provided information with respect to its assets which are “analogous information” as defined in NI 51-101, including estimates of EUR and
production type curves. This analogous information is presented on a basin, sub-basin or area basis utilizing data derived from Ovintiv's internal sources, as well as from a variety of publicly available information sources which are predominantly
independent in nature. Production type curves are based on a methodology of analog, empirical and theoretical assessments and workflow with consideration of the specific asset, and as depicted in this presentation, is representative of
Ovintiv’s current program, including relative to current performance, but are not necessarily indicative of ultimate recovery. Some of this data may not have been prepared by qualified reserves evaluators, may have been prepared based on
internal estimates, and the preparation of any estimates may not be in strict accordance with COGEH. Estimates by engineering and geo-technical practitioners may vary and the differences may be significant. Ovintiv believes that the provision of
this analogous information is relevant to Ovintiv's oil and gas activities, given its acreage position and operations (either ongoing or planned) in the areas in question, and such information has been updated as of the date hereof unless
otherwisespecified. Due to the early life nature of the various emerging plays discussed in this presentation, EUR is the most relevant specific assignable category of estimated resources. There is no certainty that any portion of the resources will
be discovered. There is no certainty that it will be commercially viable to produce any portion of the estimated EUR. Estimates of Ovintiv potential gross inventory locations, including premium return well inventory, include proved undeveloped
reserves, probable undeveloped reserves, un-risked 2C contingent resources and unbooked inventory locations. As of December 31, 2018, onaproforma basis, 2,012 proved undeveloped locations, 3,844 probable undeveloped locations and 3,265 un-risked 2C
contingent resource locations (in the development pending, development on-hold or development unclarified project maturity sub-classes) have been categorized as either reserves or contingent resources. Unbooked locations have not been classified as
either reserves or resources and are internal estimates that have been identified by management as an estimation of Ovintiv's multi-year potential drilling activities based on evaluation of applicable geologic, seismic, engineering, production,
resource and acreage information. There is no certainty that Ovintiv will drill all unbooked locations and if drilled there is no certainty that such locations will result in additional oil and gas reserves, resources or production. The locations on
which Ovintiv will actually drill wells, including the number and timing thereof is ultimately dependent upon the availability of capital, regulatory and partner approvals, seasonal restrictions, equipment and personnel, oil and natural gas prices,
costs, actual drilling results, additional reservoir information that is obtained, production rate recovery, transportation constraints and other factors. While certain of the unbooked locations may have been de-risked by drilling existing wells in
relative close proximity to such locations, many of other unbooked locations are farther away from existing wells where management has less information about the characteristics of the reservoir and therefore there is more uncertainty whether wells
will be drilled in such locations and if drilled there is more uncertainty that such wells will result in additional proved or probable reserves, resources or production. 30-day IP and other short-term rates are not necessarily indicative of
long-term performance or of ultimate recovery. The conversion of natural gas volumes to barrels of oil equivalent (“BOE”) is on the basis of six thousand cubic feet to one barrel. BOE is based on a generic energy equivalency conversion
method primarily applicable at the burner tip and does not represent economic value equivalency at the wellhead. Readers are cautioned that BOE may be misleading, particularly if used in isolation.37 Advisory Regarding Oil & Gas Information All
reserves estimates in this presentation are effective as of December 31, 2018, prepared by qualified reserves evaluators in accordance with procedures and standards contained in the Canadian Oil and Gas Evaluation ( COGE ) Handbook, National
Instrument 51-101 (NI 51-101) and SEC regulations,as applicable. Detailed Canadian and U.S. protocol disclosure will be contained in the Form 51-101F1 and Annual Report on Form 10-K, respectively. Information on the forecast prices and costs used in
preparing the Canadian protocol estimates are contained in the Form 51-101F1. For additional information relating to risks associated with the estimates of reserves, see Item 1A. Risk Factors of the Annual Report on Form 10-K. Reserves are the
estimated remaining quantities of oil and natural gas and related substances anticipated to be recoverable from known accumulations, from a given date forward, based on: analysis of drilling, geological, geophysical and engineering data, the use of
established technology, and specified economic conditions, which are generally accepted as being reasonable. Proved reserves are those reserves which can be estimated with a high degree of certainty to be recoverable. It is likely that the actual
remaining quantities recovered will exceed the estimated proved reserves. Ovintiv uses the terms play and resource play. Play encompasses resource plays, geological formations and conventional plays. Resource play describes an accumulation of
hydrocarbons known to exist over a large areal expanse and/or thick vertical section, which when compared to a conventional play, typically has a lower geological and/or commercial development risk and lower average decline rate. As used by Ovintiv,
estimated ultimate recovery (“EUR”) has the meaning set out jointly by the Society of Petroleum Engineers and World Petroleum Congress in the year 2000, being those quantities of petroleum which are estimated, on a given date, to be
potentially recoverable from an accumulation, plus those quantities already produced therefrom. Ovintiv has provided information with respect to its assets which are “analogous information” as defined in NI 51-101, including estimates of
EUR and production type curves. This analogous information is presented on a basin, sub-basin or area basis utilizing data derived from Ovintiv's internal sources, as well as from a variety of publicly available information sources which are
predominantly independent in nature. Production type curves are based on a methodology of analog, empirical and theoretical assessments and workflow with consideration of the specific asset, and as depicted in this presentation, is representative of
Ovintiv’s current program, including relative to current performance, but are not necessarily indicative of ultimate recovery. Some of this data may not have been prepared by qualified reserves evaluators, may have been prepared based on
internal estimates, and the preparation of any estimates may not be in strict accordance with COGEH. Estimates by engineering and geo-technical practitioners may vary and the differences may be significant. Ovintiv believes that the provision of
this analogous information is relevant to Ovintiv's oil and gas activities, given its acreage position and operations (either ongoing or planned) in the areas in question, and such information has been updated as of the date hereof unless
otherwisespecified. Due to the early life nature of the various emerging plays discussed in this presentation, EUR is the most relevant specific assignable category of estimated resources. There is no certainty that any portion of the resources will
be discovered. There is no certainty that it will be commercially viable to produce any portion of the estimated EUR. Estimates of Ovintiv potential gross inventory locations, including premium return well inventory, include proved undeveloped
reserves, probable undeveloped reserves, un-risked 2C contingent resources and unbooked inventory locations. As of December 31, 2018, onaproforma basis, 2,012 proved undeveloped locations, 3,844 probable undeveloped locations and 3,265 un-risked 2C
contingent resource locations (in the development pending, development on-hold or development unclarified project maturity sub-classes) have been categorized as either reserves or contingent resources. Unbooked locations have not been classified as
either reserves or resources and are internal estimates that have been identified by management as an estimation of Ovintiv's multi-year potential drilling activities based on evaluation of applicable geologic, seismic, engineering, production,
resource and acreage information. There is no certainty that Ovintiv will drill all unbooked locations and if drilled there is no certainty that such locations will result in additional oil and gas reserves, resources or production. The locations on
which Ovintiv will actually drill wells, including the number and timing thereof is ultimately dependent upon the availability of capital, regulatory and partner approvals, seasonal restrictions, equipment and personnel, oil and natural gas prices,
costs, actual drilling results, additional reservoir information that is obtained, production rate recovery, transportation constraints and other factors. While certain of the unbooked locations may have been de-risked by drilling existing wells in
relative close proximity to such locations, many of other unbooked locations are farther away from existing wells where management has less information about the characteristics of the reservoir and therefore there is more uncertainty whether wells
will be drilled in such locations and if drilled there is more uncertainty that such wells will result in additional proved or probable reserves, resources or production. 30-day IP and other short-term rates are not necessarily indicative of
long-term performance or of ultimate recovery. The conversion of natural gas volumes to barrels of oil equivalent (“BOE”) is on the basis of six thousand cubic feet to one barrel. BOE is based on a generic energy equivalency conversion
method primarily applicable at the burner tip and does not represent economic value equivalency at the wellhead. Readers are cautioned that BOE may be misleading, particularly if used in isolation.
38 TM38 TM
39 Appendix39 Appendix
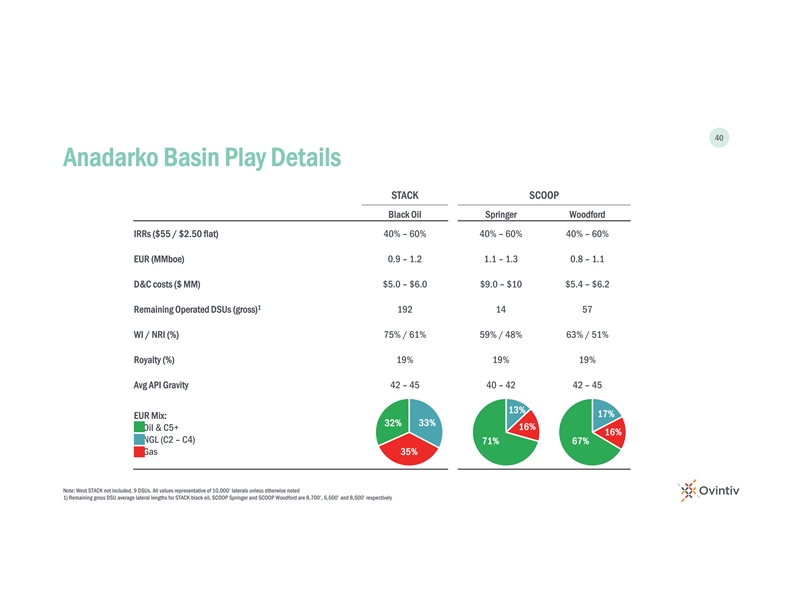
40 Anadarko Basin Play Details STACK SCOOP Black Oil Springer Woodford
IRRs ($55 / $2.50 flat) 40% – 60% 40% – 60% 40% – 60% EUR (MMboe) 0.9 – 1.2 1.1 – 1.3 0.8 – 1.1 D&C costs ($ MM) $5.0 – $6.0 $9.0 – $10 $5.4 – $6.2 1 Remaining Operated DSUs (gross) 192 14 57
WI / NRI (%) 75% / 61% 59% / 48% 63% / 51% Royalty (%) 19% 19% 19% Avg API Gravity 42 – 45 40 – 42 42 – 45 13% 17% EUR Mix: 32% 33% 16% Oil & C5+ 16% NGL (C2 – C4) 71% 67% Gas 35% Note: West STACK not included, 9 DSUs.
All values representative of 10,000’ laterals unless otherwise noted 1) Remaining gross DSU average lateral lengths for STACK black oil, SCOOP Springer and SCOOP Woodford are 8,700’, 6,600’ and 8,500’ respectively40 Anadarko
Basin Play Details STACK SCOOP Black Oil Springer Woodford IRRs ($55 / $2.50 flat) 40% – 60% 40% – 60% 40% – 60% EUR (MMboe) 0.9 – 1.2 1.1 – 1.3 0.8 – 1.1 D&C costs ($ MM) $5.0 – $6.0 $9.0 – $10
$5.4 – $6.2 1 Remaining Operated DSUs (gross) 192 14 57 WI / NRI (%) 75% / 61% 59% / 48% 63% / 51% Royalty (%) 19% 19% 19% Avg API Gravity 42 – 45 40 – 42 42 – 45 13% 17% EUR Mix: 32% 33% 16% Oil & C5+ 16% NGL (C2 –
C4) 71% 67% Gas 35% Note: West STACK not included, 9 DSUs. All values representative of 10,000’ laterals unless otherwise noted 1) Remaining gross DSU average lateral lengths for STACK black oil, SCOOP Springer and SCOOP Woodford are
8,700’, 6,600’ and 8,500’ respectively
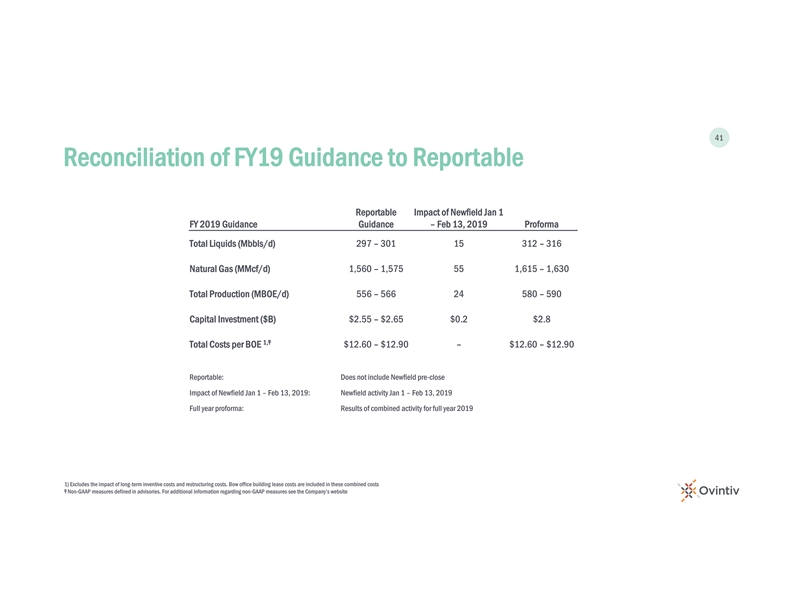
41 Reconciliation of FY19 Guidance to Reportable Reportable Impact of
Newfield Jan 1 FY 2019 Guidance Guidance – Feb 13, 2019 Proforma Total Liquids (Mbbls/d) 297 – 301 15 312 – 316 Natural Gas (MMcf/d) 1,560 – 1,575 55 1,615 – 1,630 Total Production (MBOE/d) 556 – 566 24 580
– 590 Capital Investment ($B) $2.55 – $2.65 $0.2 $2.8 1,Ŧ Total Costs per BOE $12.60 – $12.90 – $12.60 – $12.90 Reportable: Does not include Newfield pre-close Impact of Newfield Jan 1 – Feb 13, 2019:
Newfield activity Jan 1 – Feb 13, 2019 Full year proforma: Results of combined activity for full year 2019 1) Excludes the impact of long-term inventive costs and restructuring costs. Bow office building lease costs are included in these
combined costs Ŧ Non-GAAP measures defined in advisories. For additional information regarding non-GAAP measures see the Company’s website41 Reconciliation of FY19 Guidance to Reportable Reportable Impact of Newfield Jan 1 FY 2019
Guidance Guidance – Feb 13, 2019 Proforma Total Liquids (Mbbls/d) 297 – 301 15 312 – 316 Natural Gas (MMcf/d) 1,560 – 1,575 55 1,615 – 1,630 Total Production (MBOE/d) 556 – 566 24 580 – 590 Capital
Investment ($B) $2.55 – $2.65 $0.2 $2.8 1,Ŧ Total Costs per BOE $12.60 – $12.90 – $12.60 – $12.90 Reportable: Does not include Newfield pre-close Impact of Newfield Jan 1 – Feb 13, 2019: Newfield activity Jan 1
– Feb 13, 2019 Full year proforma: Results of combined activity for full year 2019 1) Excludes the impact of long-term inventive costs and restructuring costs. Bow office building lease costs are included in these combined costs Ŧ
Non-GAAP measures defined in advisories. For additional information regarding non-GAAP measures see the Company’s website
