panl-20230510
0001606909false00016069092023-05-102023-05-10

UNITED STATES
SECURITIES AND EXCHANGE COMMISSION
WASHINGTON, D.C. 20549
______________
 
FORM 8-K
CURRENT REPORT
 
PURSUANT TO SECTION 13 OR 15(D) OF THE
SECURITIES EXCHANGE ACT OF 1934 
 
Date of Report (Date of earliest event reported): May 10, 2023  
 
PANGAEA LOGISTICS SOLUTIONS LTD.
(Exact Name of Registrant as Specified in Charter)
 
Bermuda001-3679898-1205464
(State or Other Jurisdiction(Commission(IRS Employer
of Incorporation)File Number)Identification No.)
 
c/o Phoenix Bulk Carriers (US) LLC
109 Long Wharf, Newport, Rhode Island 02840
(Address of Principal Executive Offices) (Zip Code)
 
(401) 846-7790
(Registrant’s Telephone Number, Including Area Code)
Not Applicable
(Former Name or Former Address, if Changed Since Last Report)
 
Check the appropriate box below if the Form 8-K filing is intended to simultaneously satisfy the filing obligation of the registrant under any of the following provisions (see General Instruction A.2. below):
 
 Written communications pursuant to Rule 425 under the Securities Act (17 CFR 230.425)
 
 Soliciting material pursuant to Rule 14a-12 under the Exchange Act (17 CFR 240.14a-12)
 
 Pre-commencement communications pursuant to Rule 14d-2(b) under the Exchange Act (17 CFR 240.14d-2(b))
 
 Pre-commencement communications pursuant to Rule 13e-4(c) under the Exchange Act (17 CFR 240.13e 4(c))
 
Securities registered pursuant to Section 12(b) of the Act:
Title of each classTrading Symbol(s)Name of exchange on which registered
Common StockPANLNASDAQ

Indicate by check mark whether the registrant is an emerging growth company as defined in Rule 405 of the Securities Act of 1933 (17 CFR 230.405) or Rule 12b-2 of the Securities Exchange Act of 1934 (17 CFR 240.12b-2).

Emerging growth company 

If an emerging growth company, indicate by check mark if the registrant has elected not to use the extended transition period for complying with any new or revised financial accounting standards provided pursuant to Section 13(a) of the Exchange Act. 


Item 2.02Results of Operations and Financial Condition.

On May 10, 2023, Registrant issued a press release announcing financial results for three months ended March 31, 2023. The press release is furnished as Exhibit 99.1, its Quarterly Investor Presentation is attached as Exhibit 99.2.
 
The information contained in, or incorporated into, this Current Report on Form 8-K is being furnished and shall not be deemed "filed" for purposes of Section 18 of the Securities Exchange Act of 1934, as amended (the "Exchange Act"), or otherwise subject to the liabilities under that section, nor shall it be incorporated by reference in any filing under the Securities Act of 1933, as amended, or the Exchange Act, except as expressly set forth by specific reference in any such filing.

Item 9.01Financial Statements and Exhibits.
 
(d)Exhibits
ExhibitDescription
 
99.1    Press Release of Pangaea Logistics Solutions Ltd., dated May 10, 2023 Reporting Financial Results for the three months ended March 31, 2023 (furnish pursuant to Item 2.02).

99.2    Q1 2023 Investor Presentation of Pangaea Logistics Solutions Ltd. dated May 10, 2023.

104    Cover Page Interactive Data File ( embedded within Inline XBRL document)


SIGNATURE
 
 
Pursuant to the requirements of the Securities Exchange Act of 1934, the registrant has duly caused this report to be signed on its behalf by the undersigned hereunto duly authorized.
 
Dated: May 10, 2023
 PANGAEA LOGISTICS SOLUTIONS LTD.
  
 By: /s/ Gianni Del Signore
  Name: Gianni Del Signore
Title: Chief Financial Officer


Pangaea Logistics Solutions Ltd. Reports Financial Results for the Quarter Ended March 31, 2023
NEWPORT, RI - May 10, 2023 - Pangaea Logistics Solutions Ltd. (“Pangaea” or the “Company”) (NASDAQ: PANL), a global provider of comprehensive maritime logistics solutions, announced today its results for the three months ended March 31, 2023.
FIRST QUARTER 2023 RESULTS
(As compared to the first Quarter 2022)

Net income attributable to Pangaea of $3.5 million, or $0.08 per diluted share
- Adjusted net income attributable to Pangaea of $5.1 million, or $0.11 per diluted share
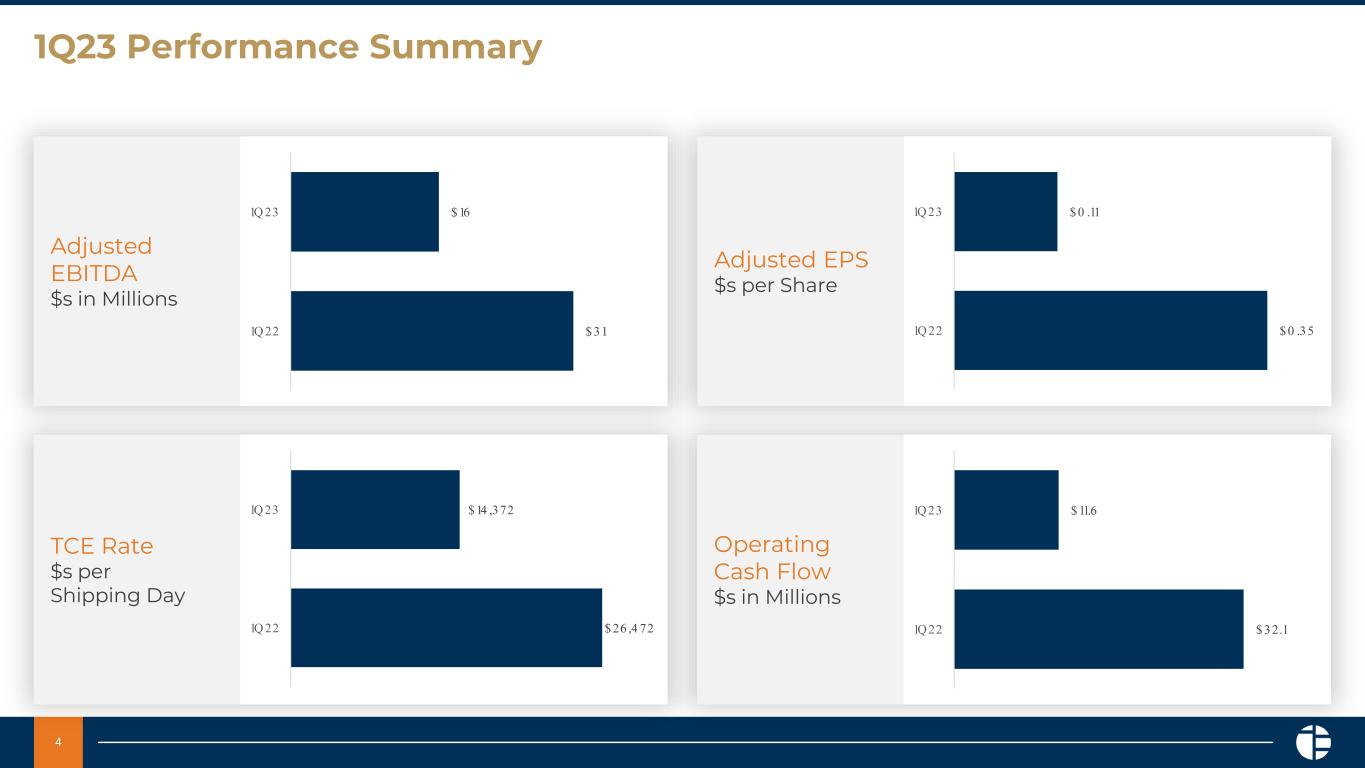
Operating cash flow of $11.6 million, a decrease of 64% y/y
Adjusted EBITDA of $16.2 million, a decrease of 48% y/y
Time Charter Equivalent ("TCE") rates earned by Pangaea of $14,372 per day, a decline of 46% y/y
Pangaea’s TCE rates exceeded the average Baltic Panamax and Supramax indices by approximately 48%
Cash and cash equivalents of $129.1 million, an increase of $59.2 million y/y
Ratio of net debt to trailing twelve-month Adjusted EBITDA of 1.3x

For the first quarter ended March 31, 2023, Pangaea reported non-GAAP adjusted net income of $5.1 million, or $0.11 per diluted share, on total revenue of $113.7 million. First quarter TCE rates declined 46% on a year-over-year basis, while total shipping days, which include both voyage and time charter days, declined 17% to 3,958 days, when compared to the year-ago period.

The TCE earned was $14,372 per day for the three months ended March 31, 2023, compared to an average of $26,472 per day for the same period in 2022. During the first quarter 2023, the Company’s average TCE rate exceeded the benchmark average Baltic Panamax and Supramax indices by approximately 48%, supported by Pangaea’s long-term contracts of affreightment ("COAs"), specialized fleet, and cargo-focused strategy.

Total Adjusted EBITDA decreased 48% to $16.2 million in the first quarter, as seasonal demand weakness negatively impacted market rates. Adjusted EBITDA margin declined 204 basis points to 14.3% in the first quarter 2023, when compared to the year-ago period, driven by lower market rates. After bottoming in February 2023 at $6,200/day, market rates increased to over $13,000/day in April 2023, an increase of 110%. Pangaea currently anticipates a further strengthening in market rates during the second quarter of 2023, given a combination of improved seasonal demand, strengthening activity in Asia and tightness in global shipping capacity.

As of March 31, 2023, the Company had $129.1 million in cash and equivalents. Total debt, including lease finance obligations was $290 million. At the end of the first quarter 2023, the Company's net debt to trailing twelve-month adjusted EBITDA was at 1.3x. During the three months ended March 31, 2023, the Company repaid $5.8 million of long-term debt, $4.1 million of finance leases, and paid $4.6 million of cash dividends.

The Company's Board of Directors declared a quarterly cash dividend of $0.10 per common share, to be paid on June 15, 2023, to all shareholders of record as of June 1, 2023.

STRATEGIC UPDATE

Pangaea remains committed to developing a leading dry bulk logistics and transportation services company of scale, providing its customers with specialized shipping and supply chain and logistics offerings in commodity and niche markets, which drive premium returns measured in time charter equivalent per day.

Leverage integrated shipping and logistics model. In addition to operating the largest high ice class dry bulk fleet of panamax and post-panamax vessels globally, Pangaea also performs stevedoring services, together with port and terminal operations capabilities. In May 2023, Pangaea announced that it has entered into a definitive agreement to acquire marine port terminal operations in Port Everglades/Ft. Lauderdale, Port of Palm Beach, Florida, and Port of Baltimore, Maryland. Pangaea currently operates terminals and performs stevedoring in four ports in North America. Under the terms of the agreement, Pangaea will acquire all onshore assets, licenses and business operations related to the acquired terminal operations for a total purchase price of $7.2 million. With this acquisition, Pangaea expands its North American terminal network to include the mid-Atlantic and southeastern United States. The acquisition provides Pangaea with additional dry bulk distribution capabilities within growing commerce centers, while augmenting its integrated ocean freight and shoreside solutions offering. The acquisition is subject to regulatory review and customary closing conditions. The Company expects to close the transaction during the second quarter of 2023.

Continue to drive strong fleet utilization. In the first quarter, Pangaea's 24 owned vessels were fully utilized and supplemented with an average of 20 chartered-in vessels to support cargo and COA commitments. Utilizing its nimble fleet approach, the Company reduced its exposure to the market by redelivering chartered-in vessels and reducing its average chartered-in fleet from 25 vessels on average during 2022 to 20 vessels in the first quarter 2023. However, due to improving market rates in the second quarter, the Company increased its charter-in fleet to 25 as of today.


Continue to drive fleet upgrades and refreshment. In May 2023, Pangaea announced the acquisition of a 61,000 dwt dry bulk vessel in the second-hand market for $26.6 million cash. Built in 2014, this vessel, to be re-named Bulk Prudence, is expected to be delivered to Pangaea in June 2023, representing the 25th owned vessel in its fleet. The vessel is currently expected to enter into service immediately after delivery. Looking ahead, the Company intends to opportunistically manage its fleet with the purpose of maximizing TCE rates, while continuing to support client requirements on an on-demand basis.

MANAGEMENT COMMENTARY

“During a seasonally slower period for the global dry bulk shipping market, we delivered an average TCE rate that was nearly 50% higher than market benchmark indices, resulting in another consecutive quarter of profitability,” stated Mark Filanowski, Chief Executive Officer of Pangaea Logistics Solutions. “Since bottoming in February, market rates have recovered materially, given a combination of improved seasonal demand, strengthening activity in Asia and tightness in global shipping capacity. During April, market rates averaged over $13,000/day, up from $6,200/day in February, and our cargo portfolio will provide premium contract revenue, positioning our business for sequential growth entering the second quarter 2023, despite macroeconomic uncertainty.”

“Pangaea continues to maintain a disciplined capital allocation strategy designed to drive long-term value creation for our shareholders,” continued Filanowski. “On a trailing four-quarter basis, we’ve generated over $100 million in free cash flow, positioning us to reduce net leverage and return capital to shareholders, while investing in high-return organic and inorganic growth opportunities that align with our integrated shipping and logistics strategy. Over the last year, we’ve increased our quarterly cash dividend by 100% to $0.10 per share, further positioning us as a stable, yield-centric equity. On a year-to-date basis, we’ve continued to refresh our fleet with the divestiture of the Bulk Newport, a dry bulk vessel built in 2003, followed by the purchase of the Bulk Prudence, a 61,000 dwt Ultramax vessel built in 2014, bringing our total owned fleet to 25 vessels. In June, we expect to close on our purchase of port terminal operations in Fort Lauderdale, Florida and Baltimore, Maryland that, at a strategic level, will both expand our onshore capabilities in growing regional hubs and further position us as an integrated shipping-logistics business of scale.”

“Looking ahead, we anticipate Pangaea will generate strong free cash flow this year, positioning us to further reward our shareholders, reduce debt outstanding and opportunistically refresh our existing fleet with newer, more efficient vessels, particularly given recently enacted emissions regulations enacted earlier this year. As we continue to build our onshore logistics capabilities, we see the potential for further synergies with our ocean freight offering. We continue to focus on moving closer to our customer, while managing an end-to-end supply chain solution that drives long-term margin expansion and profitable growth, over the long-term.”

FIRST QUARTER 2023 CONFERENCE CALL

The Company’s management team will host a conference call to discuss the Company’s financial results on Thursday, May 11, 2023 at 8:00 a.m., Eastern Time (ET). Accompanying presentation materials will be available in the Investor Relations section of the Company’s website at https://www.pangaeals.com/investors/. To listen to a live broadcast, go to the site at least 15 minutes prior to the scheduled start time in order to register, download, and install any necessary audio software.

To participate in the live teleconference:

Domestic Live: 1-800-225-9448
International Live: 1-203-518-9708
Conference ID:     PANLQ123     

To listen to a replay of the teleconference, which will be available through May 18, 2023:

Domestic Replay: 1-800-723-0528
International Replay: 1-402-220-2654


Pangaea Logistics Solutions Ltd.
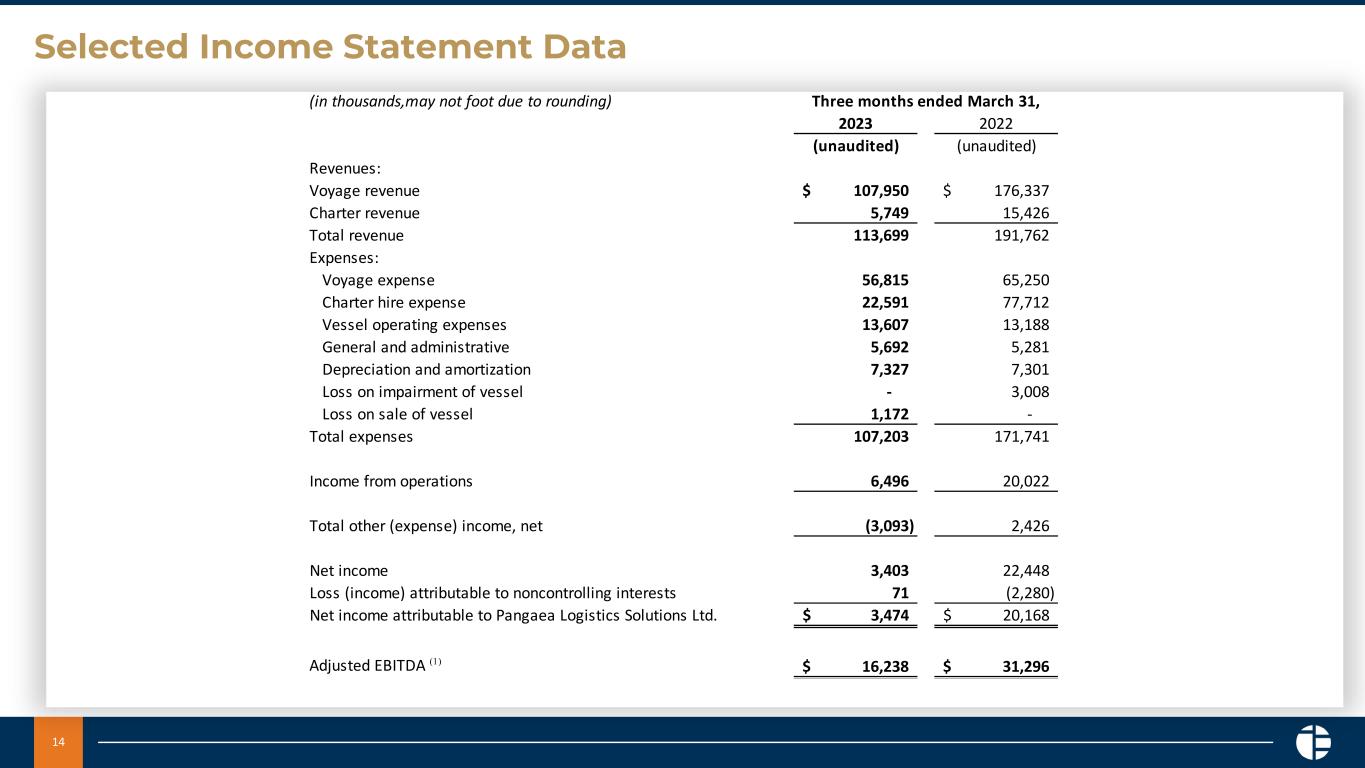
Consolidated Statements of Operations
(unaudited)
Three Months Ended March 31,
20232022
Revenues:
Voyage revenue$107,950,123 $176,336,751 
Charter revenue5,748,952 15,425,652 
Total revenue113,699,075 191,762,403 
Expenses:
Voyage expense56,814,631 65,250,467 
Charter hire expense22,590,840 77,711,607 
Vessel operating expense13,606,815 13,187,833 
General and administrative5,691,733 5,281,388 
Depreciation and amortization7,326,860 7,301,419 
Loss on impairment of vessel 3,007,809 
Loss on sale of vessel1,172,196 — 
Total expenses107,203,075 171,740,523 
Income from operations6,496,000 20,021,880 
Other income (expense): 
Interest expense(4,250,514)(3,371,712)
Interest income1,049,846 539 
Loss (income) attributable to Non-controlling interest recorded as long-term liability interest expense
144,736 (1,840,333)
Unrealized (loss) gain on derivative instruments, net(423,569)7,500,314 
Other income386,413 137,207 
Total other (expense) income, net(3,093,088)2,426,015 
Net income3,402,912 22,447,895 
Loss (income) attributable to non-controlling interests71,355 (2,279,930)
Net income attributable to Pangaea Logistics Solutions Ltd.$3,474,267 $20,167,965 
Earnings per common share:
Basic$0.08 $0.45 
Diluted$0.08 $0.45 
Weighted average shares used to compute earnings per common share:
Basic44,712,290 44,388,960 
Diluted45,116,719 45,192,983 


Pangaea Logistics Solutions Ltd.
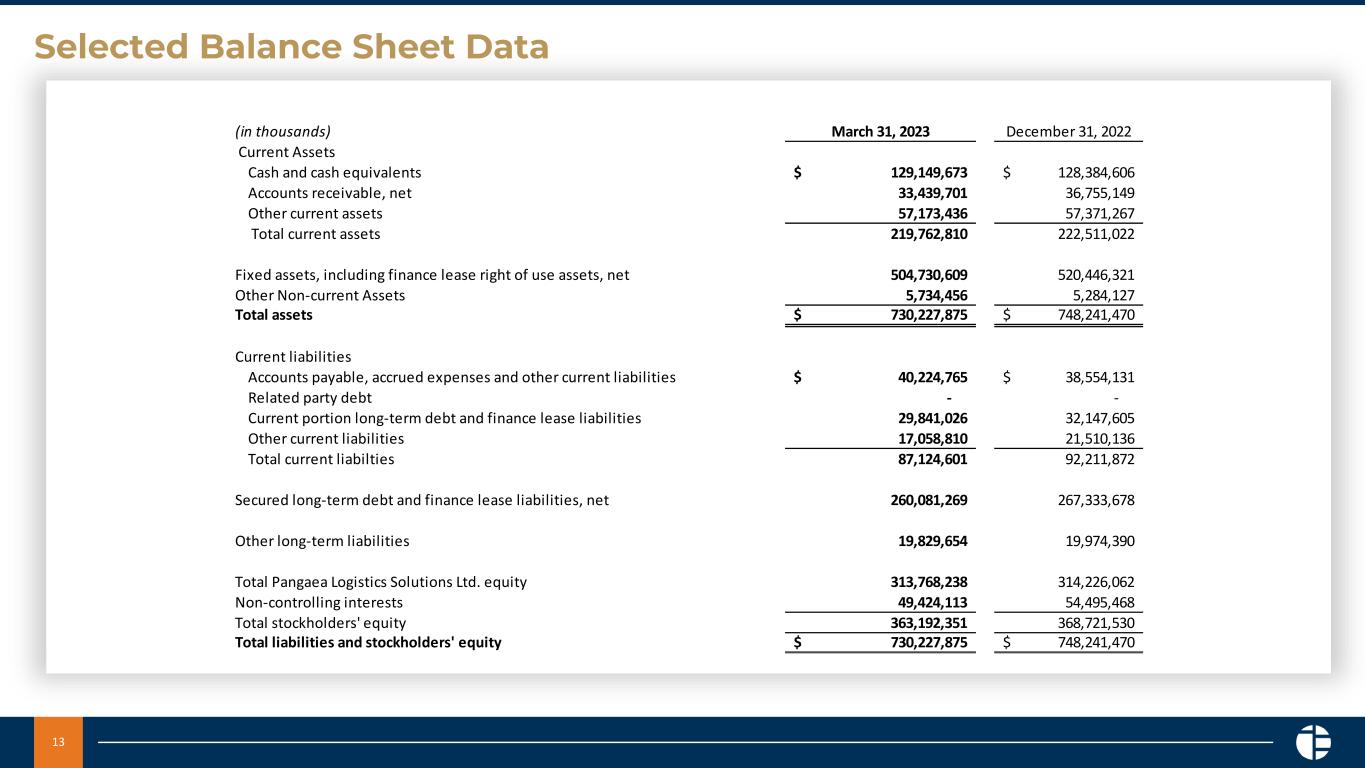
Consolidated Balance Sheets
March 31, 2023December 31, 2022
(unaudited)(audited)
Assets
Current assets
Cash and cash equivalents$129,149,673 $128,384,606 
Accounts receivable (net of allowance of $4,197,323 and $4,367,848 at March 31, 2023 and December 31, 2022, respectively)33,439,701 36,755,149 
Bunker inventory26,734,280 29,104,436 
Advance hire, prepaid expenses and other current assets30,439,156 28,266,831 
Total current assets219,762,810 222,511,022 
Fixed assets, net461,744,846 476,524,752 
Finance lease right of use assets, net42,985,763 43,921,569 
Other non-current Assets5,734,456 5,284,127 
Total assets$730,227,875 $748,241,470 
Liabilities and stockholders' equity
Current liabilities
Accounts payable, accrued expenses and other current liabilities$40,224,765 $38,554,131 
Deferred revenue16,419,178 20,883,958 
Current portion of secured long-term debt13,373,846 15,782,530 
Current portion of finance lease liabilities16,467,180 16,365,075 
Dividend payable639,632 626,178 
Total current liabilities87,124,601 92,211,872 
Secured long-term debt, net95,561,614 98,819,739 
Finance lease liabilities, net164,519,655 168,513,939 
Long-term liabilities - other19,829,654 19,974,390 
Commitments and contingencies
Stockholders' equity:
Preferred stock, $0.0001 par value, 1,000,000 shares authorized and no shares issued or outstanding — 
Common stock, $0.0001 par value, 100,000,000 shares authorized; 46,466,622 shares issued and outstanding at March 31, 2023; 45,898,395 shares issued and outstanding at December 31, 20224,648 4,590 
Additional paid-in capital163,623,173 162,894,080 
Retained earnings150,140,417 151,327,392 
Total Pangaea Logistics Solutions Ltd. equity313,768,238 314,226,062 
Non-controlling interests49,424,113 54,495,468 
Total stockholders' equity363,192,351 368,721,530 
Total liabilities and stockholders' equity$730,227,875 $748,241,470 


Pangaea Logistics Solutions, Ltd.
Consolidated Statements of Cash Flows

Three Months Ended March 31,
20232022
Operating activitiesUnauditedUnaudited
Net income$3,402,912 $22,447,895 
Adjustments to reconcile net income to net cash provided by operations: 
Depreciation and amortization expense7,326,860 7,301,419 
Amortization of deferred financing costs239,207 256,830 
Amortization of prepaid rent30,484 30,484 
Unrealized loss (gain) on derivative instruments423,569 (7,500,314)
Income from equity method investee(386,413)(137,207)
(Loss) earnings attributable to non-controlling interest recorded as other long term liability(144,736)1,840,333 
(Recovery) provision for doubtful accounts(170,525)696,869 
Loss on impairment of vessel 3,007,809 
Loss on sale of vessel1,172,196 — 
Drydocking costs(1,347,899)(1,638,364)
Share-based compensation856,434 827,806 
Change in operating assets and liabilities:
Accounts receivable3,485,973 12,196,570 
Bunker inventory2,370,157 (12,061,014)
Advance hire, prepaid expenses and other current assets(2,917,384)6,255,996 
Accounts payable, accrued expenses and other current liabilities1,695,595 4,843,359 
Deferred revenue(4,464,780)(6,306,463)
Net cash provided by operating activities11,571,650 32,062,008 
Investing activities  
Purchase of vessels and vessel improvements(75,291)(18,261,685)
Purchase of fixed assets and equipment (67,178)
(Contributions to) payment from non-consolidated subsidiaries(63,917)81,495 
Proceeds from sale of vessel8,933,700 — 
Net cash provided by (used in) investing activities8,794,492 (18,247,368)
Financing activities
Payments of financing fees and issuance costs (331,317)
Payments of long-term debt(5,765,505)(3,353,207)
Proceeds from finance leases 15,000,000 
Payments of finance lease obligations(4,060,499)(3,837,280)
Dividends paid to non-controlling interests(5,000,000)(5,000,000)
Accrued common stock dividends paid(4,647,788)(2,292,620)
Cash paid for incentive compensation shares relinquished(127,283)(287,630)
Net cash used in financing activities(19,601,075)(102,054)
Net increase in cash and cash equivalents765,067 13,712,586 
Cash and cash equivalents at beginning of period128,384,606 56,208,902 
Cash and cash equivalents at end of period$129,149,673 $69,921,488 


Pangaea Logistics Solutions Ltd.
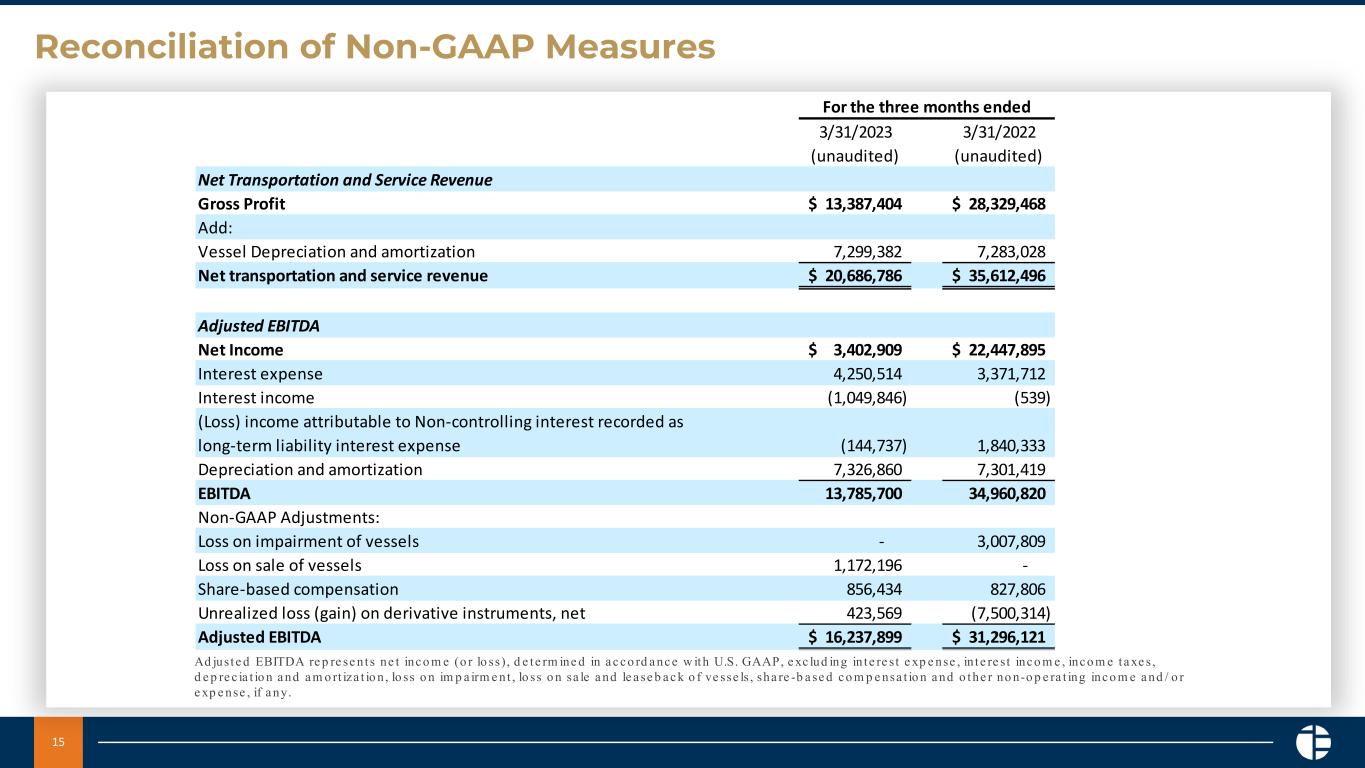
Reconciliation of Non-GAAP Measures
(unaudited)
Three Months Ended March 31,
20232022
Net Transportation and Service Revenue
Gross Profit$13,387,407 $28,329,468 
Add:
Vessel Depreciation and Amortization7,299,382 7,283,028 
Net transportation and service revenue$20,686,789 $35,612,496 
Adjusted EBITDA
Net Income3,402,912 22,447,895 
Interest expense, net3,200,668 3,371,173 
(Loss) income attributable to Non-controlling interest recorded as long-term liability interest expense
(144,736)1,840,333 
Depreciation and amortization7,326,860 7,301,419 
EBITDA13,785,704 34,960,820 
Non-GAAP Adjustments:
Loss on impairment of vessels 3,007,809 
Loss on sale of vessels1,172,196 — 
Share-based compensation856,434 827,806 
Unrealized loss (gain) on derivative instruments, net423,569 (7,500,314)
Adjusted EBITDA$16,237,903 $31,296,121 
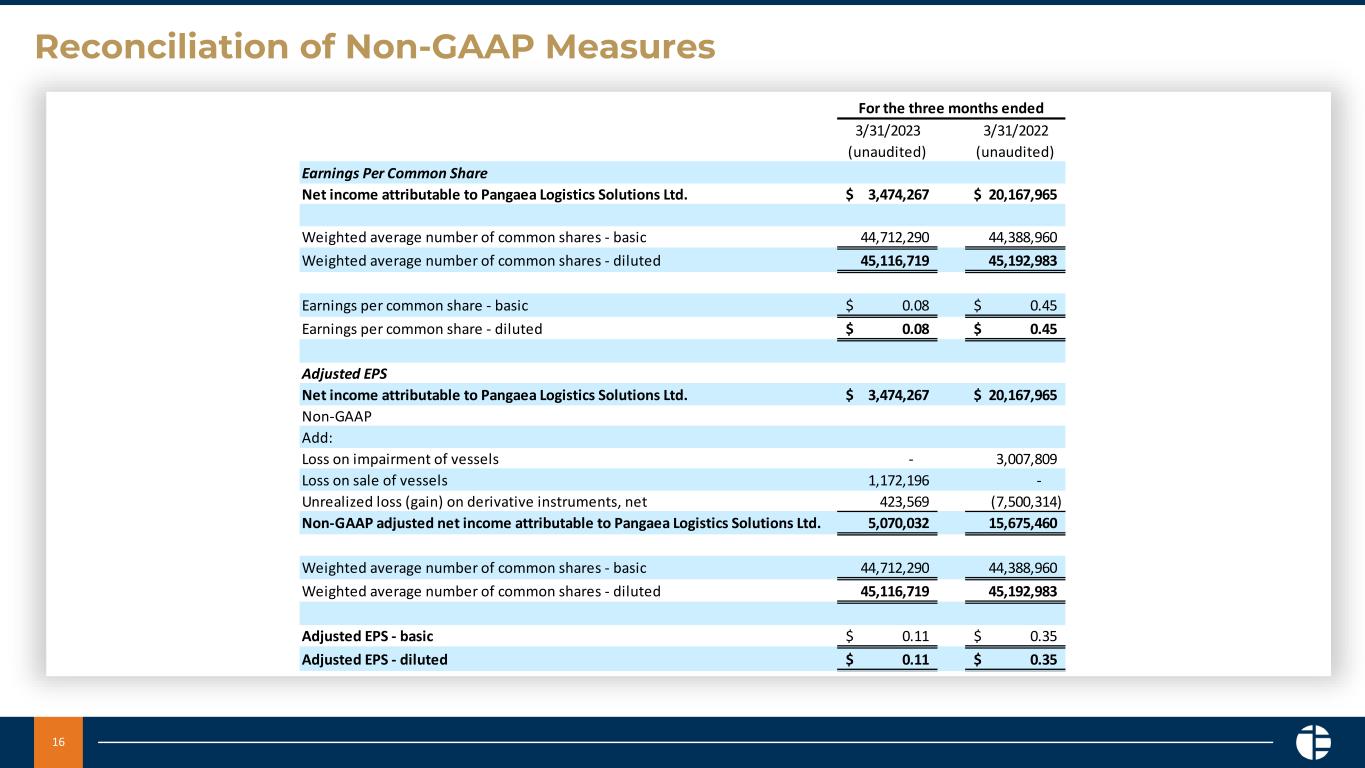
Earnings Per Common Share
Net income attributable to Pangaea Logistics Solutions Ltd.$3,474,267 $20,167,965 
Weighted average number of common shares outstanding - basic44,712,290 44,388,960 
Weighted average number of common shares outstanding - diluted45,116,719 45,192,983 
Earnings per common share - basic$0.08 $0.45 
Earnings per common share - diluted$0.08 $0.45 
Adjusted EPS
Net Income attributable to Pangaea Logistics Solutions Ltd.$3,474,267 $20,167,965 
Non-GAAP
Add: loss on impairment of vessels 3,007,809 
Loss on sale of vessels1,172,196 — 
Unrealized loss (gain) on derivative instruments423,569 (7,500,314)
Non-GAAP adjusted net income attributable to Pangaea Logistics Solutions Ltd.$5,070,032 $15,675,460 
Weighted average number of common shares - basic44,712,290 44,388,960 
Weighted average number of common shares - diluted45,116,719 45,192,983 
Adjusted EPS - basic$0.11 $0.35 
Adjusted EPS - diluted$0.11 $0.35 


INFORMATION ABOUT NON-GAAP FINANCIAL MEASURES. As used herein, “GAAP” refers to accounting principles generally accepted in the United States of America. To supplement our consolidated financial statements prepared and presented in accordance with GAAP, this earnings release discusses non-GAAP financial measures, including non-GAAP net revenue and non-GAAP adjusted EBITDA. This is considered a non-GAAP financial measure as defined in Rule 101 of Regulation G promulgated by the Securities and Exchange Commission. Generally, a non-GAAP financial measure is a numerical measure of a company’s historical or future performance, financial position, or cash flows that either excludes or includes amounts that are not normally excluded or included in the most directly comparable measure calculated and presented in accordance with GAAP. The presentation of this non-GAAP financial information is not intended to be considered in isolation or as a substitute for, or superior to, the financial information prepared and presented in accordance with GAAP.

We use non-GAAP financial measures for internal financial and operational decision making purposes and as a means to evaluate period-to-period comparisons of the performance and results of operations of our core business. Our management believes that non-GAAP financial measures provide meaningful supplemental information regarding the performance of our core business by excluding charges that are not incurred in the normal course of business. Non-GAAP financial measures also facilitate management's internal planning and comparisons to our historical performance and liquidity. We believe certain non-GAAP financial measures are useful to investors as they allow for greater transparency with respect to key metrics used by management in its financial and operational decision making and are used by our institutional investors and the analyst community to help them analyze the performance and operational results of our core business.

Gross Profit. Gross profit represents total revenue less net transportation and service revenue and less vessel depreciation and amortization.

Net transportation and service revenue. Net transportation and service revenue represents total revenue less the total direct costs of transportation and services, which includes charter hire, voyage and vessel operating expenses. Net transportation and service revenue is included because it is used by management and certain investors to measure performance by comparison to other logistic service providers. Net transportation and service revenue is not an item recognized by the generally accepted accounting principles in the United States of America, or U.S. GAAP, and should not be considered as an alternative to net income, operating income, or any other indicator of a company's operating performance required by U.S. GAAP. Pangaea’s definition of net transportation and service revenue used here may not be comparable to an operating measure used by other companies.

Adjusted EBITDA and adjusted EPS. Adjusted EBITDA represents net income (or loss), determined in accordance with U.S. GAAP, excluding interest expense, interest income, income taxes, depreciation and amortization, loss on impairment, loss on sale and leaseback of vessels, share-based compensation and other non-operating income and/or expense, if any. Earnings per share represents net income divided by the weighted average number of common shares outstanding. Adjusted earnings per share represents net income attributable to Pangaea Logistics Solutions Ltd. plus, when applicable, loss on sale of vessel, loss on sale and leaseback of vessel, loss on impairment of vessel, unrealized gains and losses on derivative instruments, and certain non-recurring charges, divided by the weighted average number of shares of common stock.

There are limitations related to the use of net revenue versus income from operations, adjusted EBITDA versus income from operations, and adjusted EPS versus EPS calculated in accordance with GAAP. In particular, Pangaea’s definition of adjusted EBITDA used here are not comparable to EBITDA.

The table set forth above provides a reconciliation of the non-GAAP financial measures presented during the period to the most directly comparable financial measures prepared in accordance with GAAP.

About Pangaea Logistics Solutions Ltd.

Pangaea Logistics Solutions Ltd. (NASDAQ: PANL) provides logistics services to a broad base of industrial customers who require the transportation of a wide variety of dry bulk cargoes, including grains, pig iron, hot briquetted iron, bauxite, alumina, cement clinker, dolomite, and limestone. The Company addresses the transportation needs of its customers with a comprehensive set of services and activities, including cargo loading, cargo discharge, vessel chartering, and voyage planning. Learn more at www.pangaeals.com.


Investor Relations Contacts
Gianni Del SignoreStefan C. Neely
Chief Financial OfficerVallum Advisors
401-846-7790
[email protected][email protected]

Forward-Looking Statements

Certain statements in this press release are “forward-looking statements” within the meaning of the Private Securities Litigation Act of 1995. These forward-looking statements are based on our current expectations and beliefs and are subject to a number of risk factors and uncertainties that could cause actual results to differ materially from those described in the forward-looking statements. The Company disclaims any obligation to publicly update or revise these statements whether as a result of new information, future events or otherwise, except as required by law. Such risks and uncertainties include, without limitation, the strength of world economies and currencies, general market conditions, including fluctuations in charter rates and vessel values, changes in demand for dry bulk shipping capacity, changes in our operating expenses, including bunker prices, dry-docking and insurance costs, the market for our vessels, availability of financing and refinancing, charter counterparty performance, ability to obtain financing and comply with covenants in such financing arrangements, changes in governmental rules and regulations or actions taken by regulatory authorities, potential liability from pending or future litigation, general domestic and international political conditions, potential disruption of shipping routes due to accidents or political events, vessels breakdowns and instances of off-hires and other factors, as well as other risks that have been included in filings with the Securities and Exchange Commission, all of which are available at www.sec.gov.

1Q23 Earnings Call Presentation

 
2 Safe Harbor 1Q23 Earnings Call Presentation This presentation may include certain forward-looking statements within the meaning of the Private Securities Litigation Reform Act of 1995, including statements regarding future financial performance, future growth and future acquisitions. These statements are based on Pangaea’s and managements’ current expectations or beliefs and are subject to uncertainty and changes in circumstances. Actual results may vary materially from those expressed or implied by the statements herein due to changes in economic, business, competitive and/or regulatory factors, and other risks and uncertainties affecting the operation of Pangaea’s business. These risks, uncertainties and contingencies include: business conditions; weather and natural disasters; changing interpretations of GAAP; outcomes of government reviews; inquiries and investigations and related litigation; continued compliance with government regulations; legislation or regulatory environments; requirements or changes adversely affecting the business in which Pangaea is engaged; fluctuations in customer demand; management of rapid growth; intensity of competition from other providers of logistics and shipping services; general economic conditions; geopolitical events and regulatory changes; and other factors set forth in Pangaea’s filings with the Securities and Exchange Commission and the filings of its predecessors. The information set forth herein should be read in light of such risks. Further, investors should keep in mind that certain of Pangaea’s financial results are unaudited and do not conform to SEC Regulation S-X and as a result such information may fluctuate materially depending on many factors. Accordingly, Pangaea’s financial results in any particular period may not be indicative of future results. Pangaea is not under any obligation to, and expressly disclaims any obligation to, update or alter its forward-looking statements, whether as a result of new information, future events, changes in assumptions or otherwise.
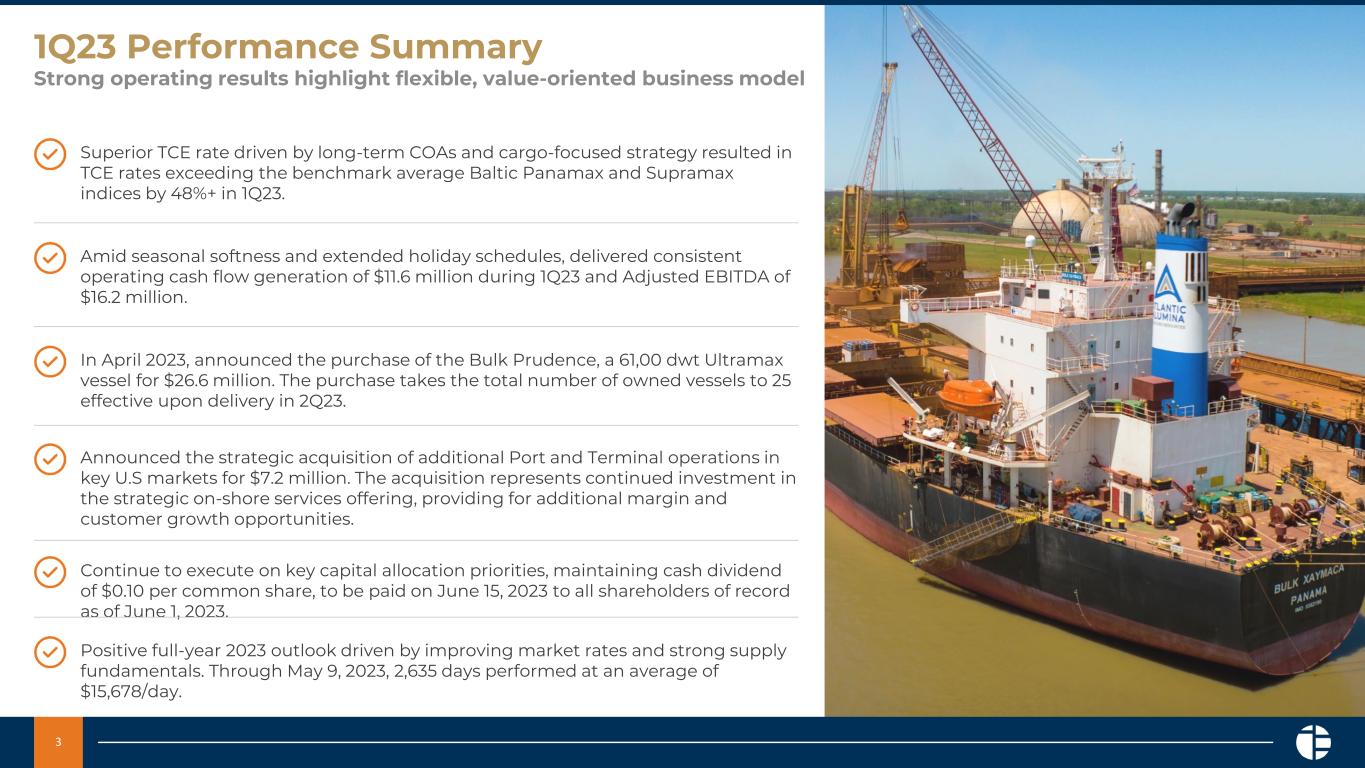

 
3 1Q23 Performance Summary Strong operating results highlight flexible, value-oriented business model Superior TCE rate driven by long-term COAs and cargo-focused strategy resulted in TCE rates exceeding the benchmark average Baltic Panamax and Supramax indices by 48%+ in 1Q23. Amid seasonal softness and extended holiday schedules, delivered consistent operating cash flow generation of $11.6 million during 1Q23 and Adjusted EBITDA of $16.2 million. In April 2023, announced the purchase of the Bulk Prudence, a 61,00 dwt Ultramax vessel for $26.6 million. The purchase takes the total number of owned vessels to 25 effective upon delivery in 2Q23. Announced the strategic acquisition of additional Port and Terminal operations in key U.S markets for $7.2 million. The acquisition represents continued investment in the strategic on-shore services offering, providing for additional margin and customer growth opportunities. Continue to execute on key capital allocation priorities, maintaining cash dividend of $0.10 per common share, to be paid on June 15, 2023 to all shareholders of record as of June 1, 2023. Positive full-year 2023 outlook driven by improving market rates and strong supply fundamentals. Through May 9, 2023, 2,635 days performed at an average of $15,678/day.

 
4 1Q23 Performance Summary Adjusted EBITDA $s in Millions Adjusted EPS $s per Share TCE Rate $s per Shipping Day Operating Cash Flow $s in Millions $ 16 $ 31 1Q 23 1Q 22 $ 11.6 $ 32.1 1Q 23 1Q 22 $ 0 .11 $ 0 .35 1Q 23 1Q 22 $ 14 ,372 $ 26 ,4 72 1Q 23 1Q 22
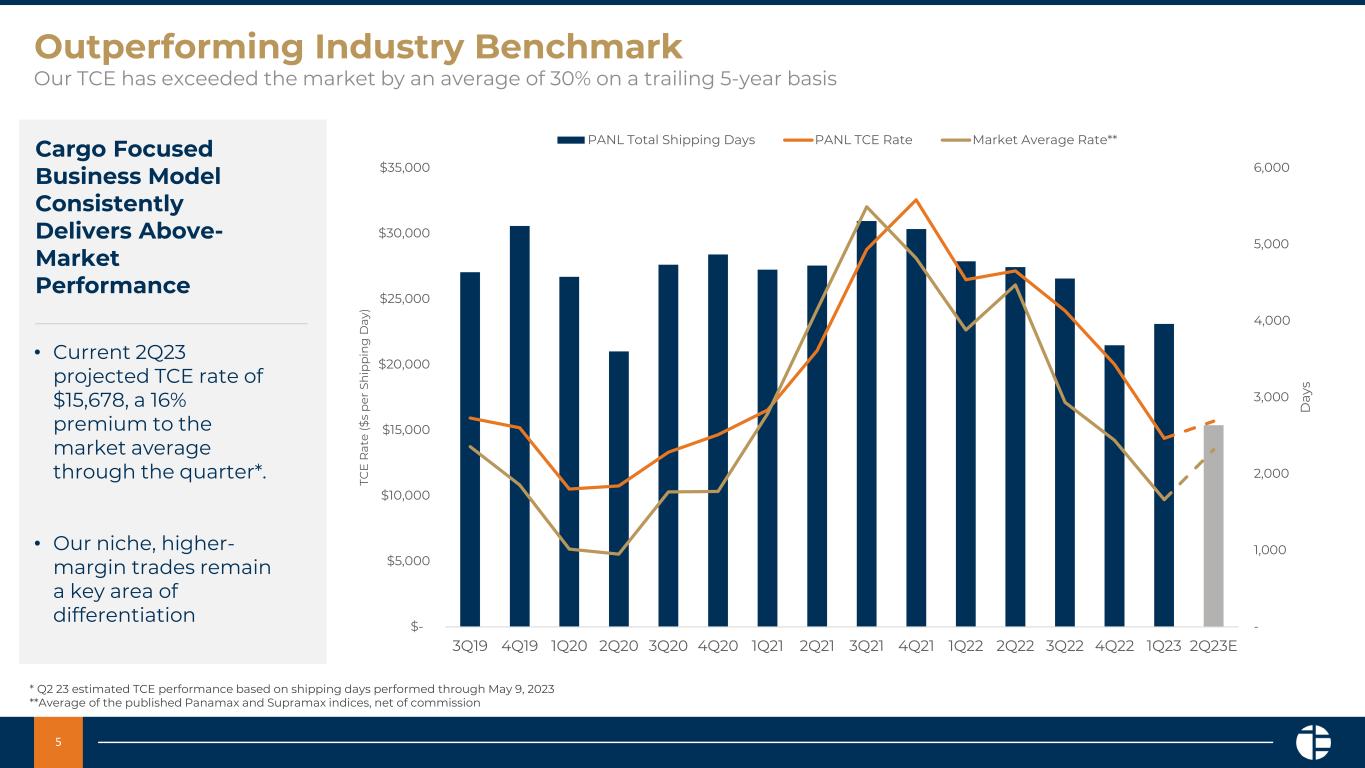

 
5 Outperforming Industry Benchmark Our TCE has exceeded the market by an average of 30% on a trailing 5-year basis Cargo Focused Business Model Consistently Delivers Above- Market Performance • Current 2Q23 projected TCE rate of $15,678, a 16% premium to the market average through the quarter*. • Our niche, higher- margin trades remain a key area of differentiation * Q2 23 estimated TCE performance based on shipping days performed through May 9, 2023 **Average of the published Panamax and Supramax indices, net of commission - 1,000 2,000 3,000 4,000 5,000 6,000 $- $5,000 $10,000 $15,000 $20,000 $25,000 $30,000 $35,000 3Q19 4Q19 1Q20 2Q20 3Q20 4Q20 1Q21 2Q21 3Q21 4Q21 1Q22 2Q22 3Q22 4Q22 1Q23 2Q23E D ay s TC E R at e ($ s p er S h ip p in g D ay ) PANL Total Shipping Days PANL TCE Rate Market Average Rate**
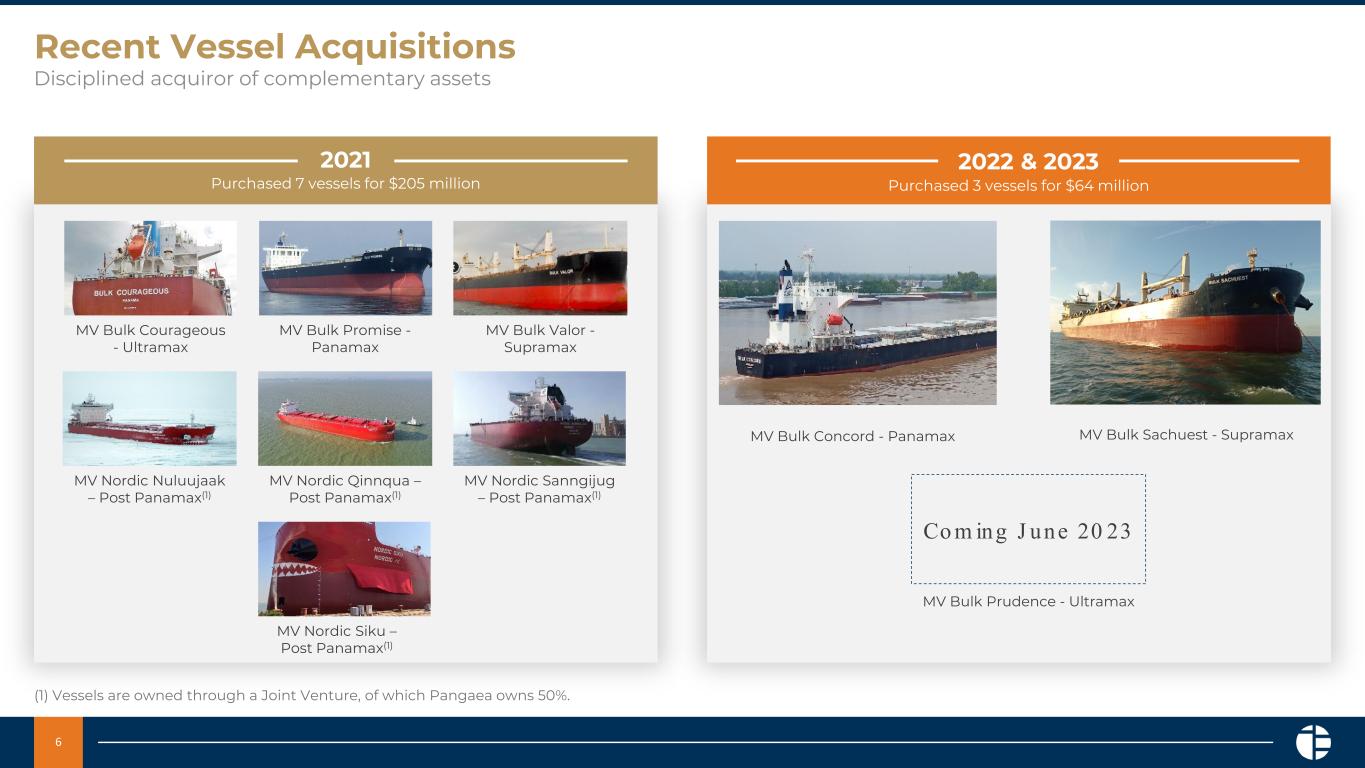

 
6 Recent Vessel Acquisitions Disciplined acquiror of complementary assets MV Bulk Sachuest - Supramax MV Bulk Courageous - Ultramax MV Bulk Promise - Panamax MV Bulk Valor - Supramax MV Bulk Concord - Panamax MV Nordic Nuluujaak – Post Panamax(1) MV Nordic Qinnqua – Post Panamax(1) MV Nordic Sanngijug – Post Panamax(1) MV Nordic Siku – Post Panamax(1) (1) Vessels are owned through a Joint Venture, of which Pangaea owns 50%. 2021 Purchased 7 vessels for $205 million Purchased 3 vessels for $64 million 2022 & 2023 Co m ing J une 20 23 MV Bulk Prudence - Ultramax
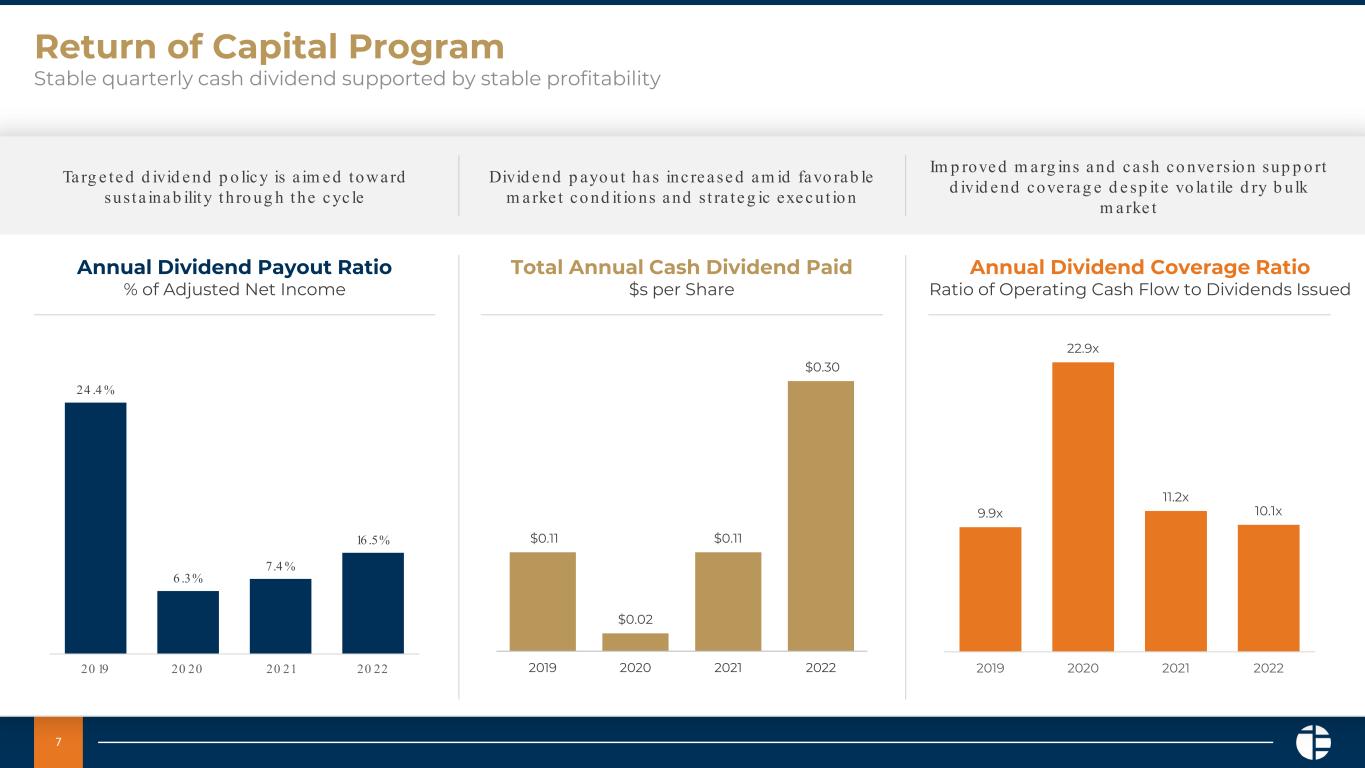

 
7 Return of Capital Program Stable quarterly cash dividend supported by stable profitability Annual Dividend Payout Ratio % of Adjusted Net Income Total Annual Cash Dividend Paid $s per Share Annual Dividend Coverage Ratio Ratio of Operating Cash Flow to Dividends Issued $0.11 $0.02 $0.11 $0.30 2019 2020 2021 2022 24 .4 % 6 .3% 7.4 % 16 .5% 20 19 20 20 20 21 20 22 Ta rg e te d d ivid e nd p o lic y is a im e d towa rd sust a ina b ilit y t h ro ug h the c yc le Divid e nd p ayo ut ha s inc re a se d a m id favo ra b le m a rke t co nd it io ns a nd s t ra te g ic exe c ut io n Im p rove d m a rg ins a nd c a sh co nve rs io n sup p o rt d ivid e nd cove ra g e d e sp ite vo la t ile d ry b ulk m a rke t 9.9x 22.9x 11.2x 10.1x 2019 2020 2021 2022
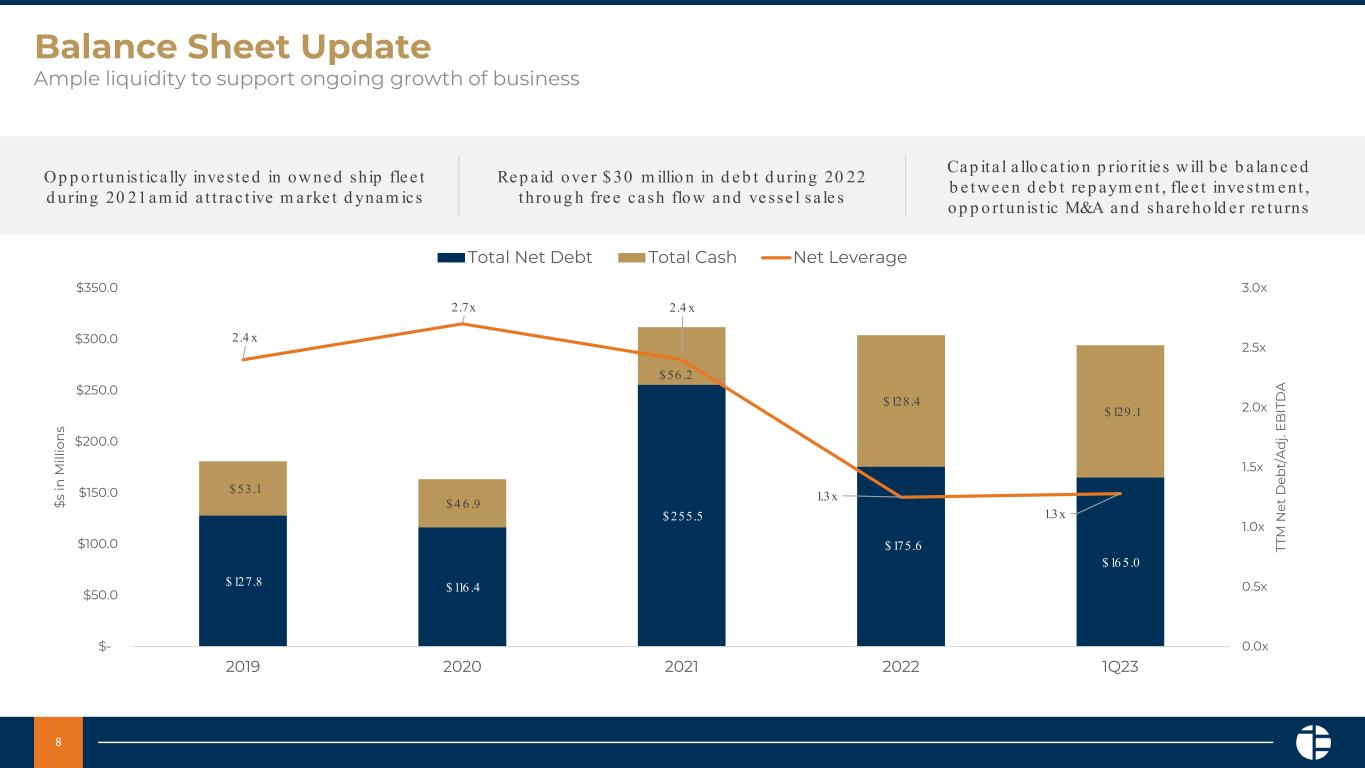

 
8 $ 127.8 $ 116 .4 $ 255.5 $ 175.6 $ 16 5.0 $ 53 .1 $ 4 6 .9 $ 56 .2 $ 128 .4 $ 129 .1 2.4 x 2.7x 2.4 x 1.3x 1.3x 0.0x 0.5x 1.0x 1.5x 2.0x 2.5x 3.0x $- $50.0 $100.0 $150.0 $200.0 $250.0 $300.0 $350.0 2019 2020 2021 2022 1Q23 TT M N et D eb t/ A d j. E B IT D A $s in M ill io n s Total Net Debt Total Cash Net Leverage Balance Sheet Update Ample liquidity to support ongoing growth of business O p p o rtunis t ic a lly inve ste d in ow ne d sh ip fle e t d uring 20 21 a m id a t t ra c t ive m a rke t d yna m ic s Re p a id ove r $ 30 m illio n in d e b t d uring 20 22 thro ug h fre e c a sh flow a nd ve sse l sa le s Ca p it a l a llo c a t io n p rio rit ie s w ill b e b a la nce d b e twe e n d e b t re p aym e nt , fle e t inve stm e nt , o p p o rtunis t ic M&A a nd sha re ho ld e r re turns
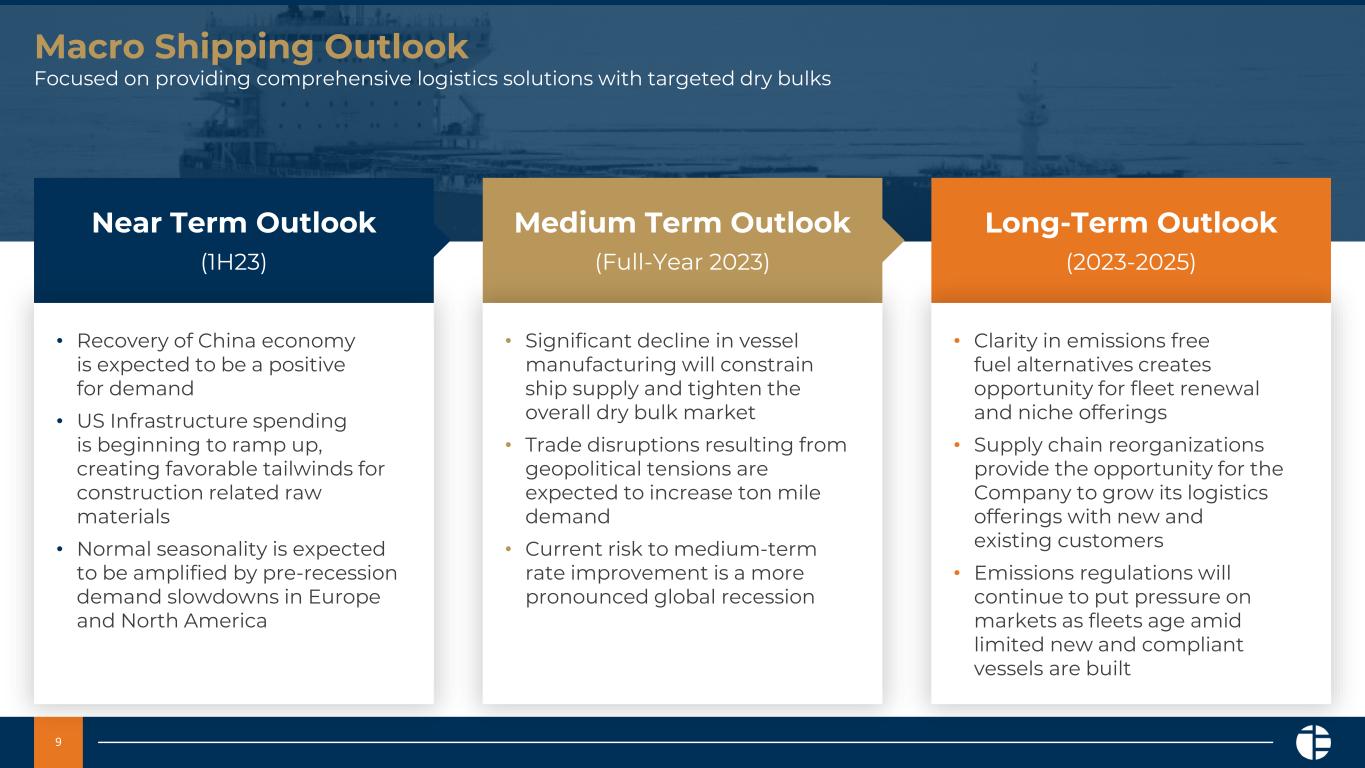

 
9 Macro Shipping Outlook Focused on providing comprehensive logistics solutions with targeted dry bulks Near Term Outlook (1H23) Medium Term Outlook (Full-Year 2023) Long-Term Outlook (2023-2025) • Recovery of China economy is expected to be a positive for demand • US Infrastructure spending is beginning to ramp up, creating favorable tailwinds for construction related raw materials • Normal seasonality is expected to be amplified by pre-recession demand slowdowns in Europe and North America • Significant decline in vessel manufacturing will constrain ship supply and tighten the overall dry bulk market • Trade disruptions resulting from geopolitical tensions are expected to increase ton mile demand • Current risk to medium-term rate improvement is a more pronounced global recession • Clarity in emissions free fuel alternatives creates opportunity for fleet renewal and niche offerings • Supply chain reorganizations provide the opportunity for the Company to grow its logistics offerings with new and existing customers • Emissions regulations will continue to put pressure on markets as fleets age amid limited new and compliant vessels are built
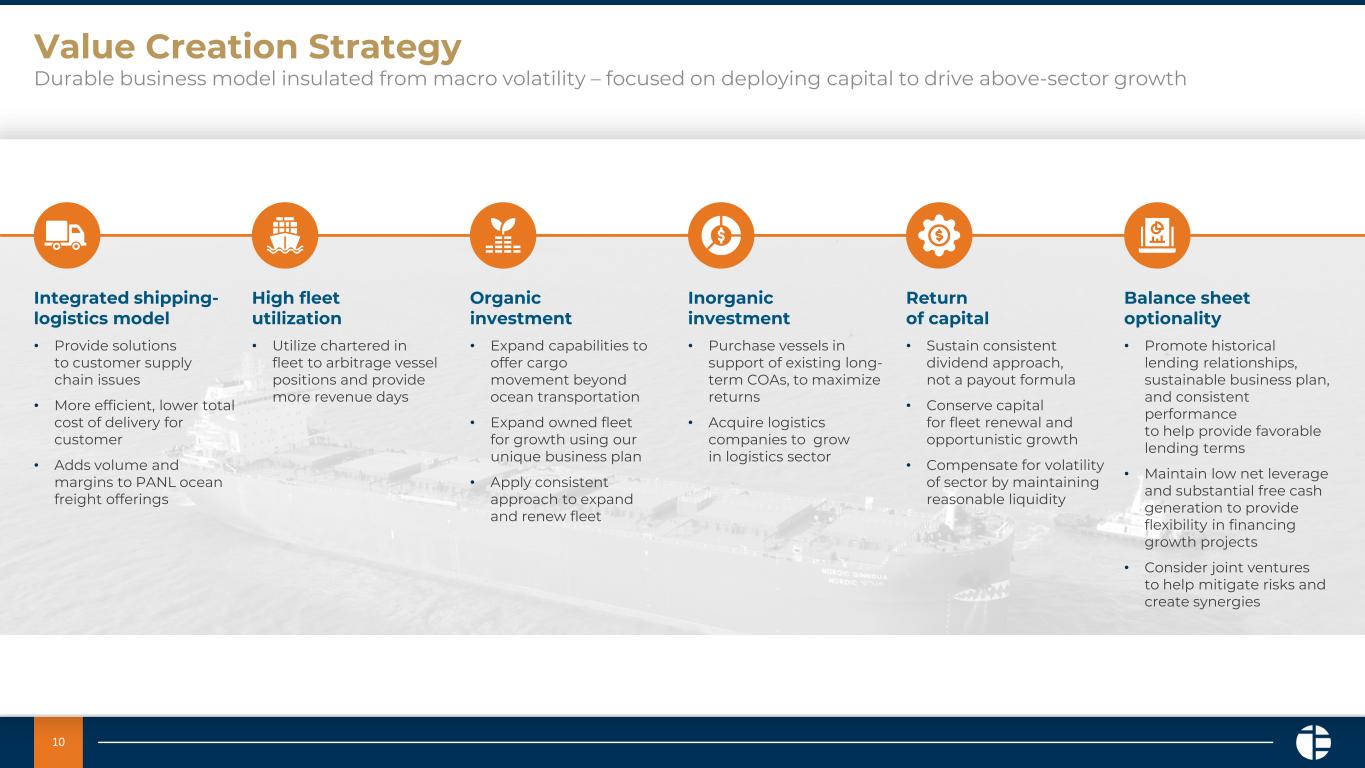

 
10 Value Creation Strategy Durable business model insulated from macro volatility – focused on deploying capital to drive above-sector growth Integrated shipping- logistics model • Provide solutions to customer supply chain issues • More efficient, lower total cost of delivery for customer • Adds volume and margins to PANL ocean freight offerings High fleet utilization • Utilize chartered in fleet to arbitrage vessel positions and provide more revenue days Organic investment • Expand capabilities to offer cargo movement beyond ocean transportation • Expand owned fleet for growth using our unique business plan • Apply consistent approach to expand and renew fleet Inorganic investment • Purchase vessels in support of existing long- term COAs, to maximize returns • Acquire logistics companies to grow in logistics sector Return of capital • Sustain consistent dividend approach, not a payout formula • Conserve capital for fleet renewal and opportunistic growth • Compensate for volatility of sector by maintaining reasonable liquidity Balance sheet optionality • Promote historical lending relationships, sustainable business plan, and consistent performance to help provide favorable lending terms • Maintain low net leverage and substantial free cash generation to provide flexibility in financing growth projects • Consider joint ventures to help mitigate risks and create synergies
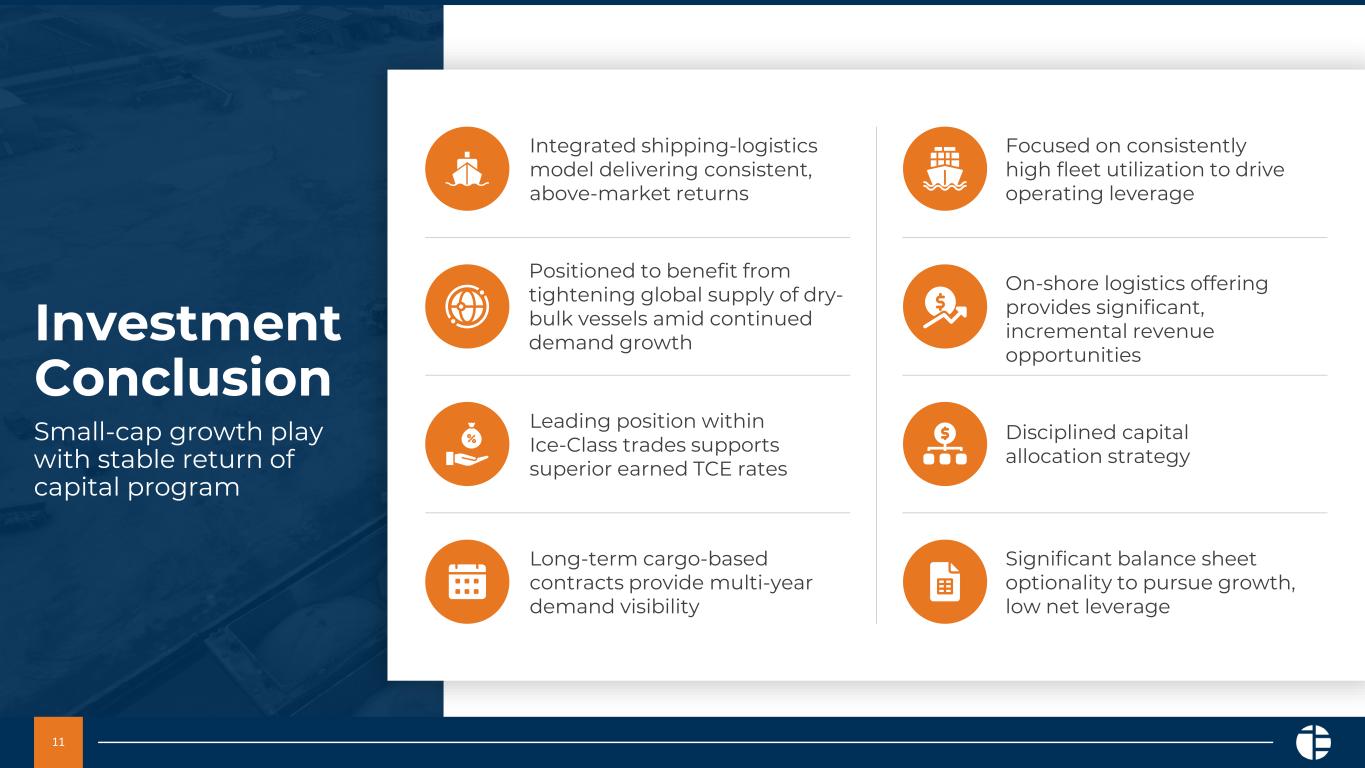

 
11 Investment Conclusion Small-cap growth play with stable return of capital program Integrated shipping-logistics model delivering consistent, above-market returns Focused on consistently high fleet utilization to drive operating leverage Positioned to benefit from tightening global supply of dry- bulk vessels amid continued demand growth On-shore logistics offering provides significant, incremental revenue opportunities Leading position within Ice-Class trades supports superior earned TCE rates Disciplined capital allocation strategy Long-term cargo-based contracts provide multi-year demand visibility Significant balance sheet optionality to pursue growth, low net leverage

 
Co nfid e n t ia l: Pa ng a e a Lo g is t ic s So lu t io ns Appendix

 
13 Selected Balance Sheet Data (in thousands) March 31, 2023 December 31, 2022 Current Assets Cash and cash equivalents 129,149,673$ 128,384,606$ Accounts receivable, net 33,439,701 36,755,149 Other current assets 57,173,436 57,371,267 Total current assets 219,762,810 222,511,022 Fixed assets, including finance lease right of use assets, net 504,730,609 520,446,321 Other Non-current Assets 5,734,456 5,284,127 Total assets 730,227,875$ 748,241,470$ Current liabilities Accounts payable, accrued expenses and other current liabilities 40,224,765$ 38,554,131$ Related party debt - - Current portion long-term debt and finance lease liabilities 29,841,026 32,147,605 Other current liabilities 17,058,810 21,510,136 Total current liabilties 87,124,601 92,211,872 Secured long-term debt and finance lease liabilities, net 260,081,269 267,333,678 Other long-term liabilities 19,829,654 19,974,390 Total Pangaea Logistics Solutions Ltd. equity 313,768,238 314,226,062 Non-controlling interests 49,424,113 54,495,468 Total stockholders' equity 363,192,351 368,721,530 Total liabilities and stockholders' equity 730,227,875$ 748,241,470$

 
14 Selected Income Statement Data (in thousands,may not foot due to rounding) 2023 2022 (unaudited) (unaudited) Revenues: Voyage revenue 107,950$ 176,337$ Charter revenue 5,749 15,426 Total revenue 113,699 191,762 Expenses: Voyage expense 56,815 65,250 Charter hire expense 22,591 77,712 Vessel operating expenses 13,607 13,188 General and administrative 5,692 5,281 Depreciation and amortization 7,327 7,301 Loss on impairment of vessel - 3,008 Loss on sale of vessel 1,172 - Total expenses 107,203 171,741 Income from operations 6,496 20,022 Total other (expense) income, net (3,093) 2,426 Net income 3,403 22,448 Loss (income) attributable to noncontrolling interests 71 (2,280) Net income attributable to Pangaea Logistics Solutions Ltd. 3,474$ 20,168$ Adjusted EBITDA (1) 16,238$ 31,296$ Three months ended March 31,

 
15 Reconciliation of Non-GAAP Measures 3/31/2023 3/31/2022 (unaudited) (unaudited) Net Transportation and Service Revenue Gross Profit 13,387,404$ 28,329,468$ Add: Vessel Depreciation and amortization 7,299,382 7,283,028 Net transportation and service revenue 20,686,786$ 35,612,496$ Adjusted EBITDA Net Income 3,402,909$ 22,447,895$ Interest expense 4,250,514 3,371,712 Interest income (1,049,846) (539) (Loss) income attributable to Non-controlling interest recorded as long-term liability interest expense (144,737) 1,840,333 Depreciation and amortization 7,326,860 7,301,419 EBITDA 13,785,700 34,960,820 Non-GAAP Adjustments: Loss on impairment of vessels - 3,007,809 Loss on sale of vessels 1,172,196 - Share-based compensation 856,434 827,806 Unrealized loss (gain) on derivative instruments, net 423,569 (7,500,314) Adjusted EBITDA 16,237,899$ 31,296,121$ For the three months ended Ad just e d EBITDA re p re se n t s ne t inc o m e (o r lo ss) , d e t e rm ine d in a c c o rd a nc e w ith U.S. GAAP, e xc lud ing in t e re s t e xp e nse , in t e re st inc o m e , inc o m e t a xe s , d e p re c ia t io n a nd a m o rt iza t io n , lo ss o n im p a irm e nt , lo ss o n sa le a nd le a se b a c k o f ve sse ls , sha re -b a se d c o m p e nsa t io n a nd o the r no n-o p e ra t ing inc o m e a nd / o r e xp e nse , if a ny.

 
16 Reconciliation of Non-GAAP Measures 3/31/2023 3/31/2022 (unaudited) (unaudited) Earnings Per Common Share Net income attributable to Pangaea Logistics Solutions Ltd. 3,474,267$ 20,167,965$ Weighted average number of common shares - basic 44,712,290 44,388,960 Weighted average number of common shares - diluted 45,116,719 45,192,983 Earnings per common share - basic 0.08$ 0.45$ Earnings per common share - diluted 0.08$ 0.45$ Adjusted EPS Net income attributable to Pangaea Logistics Solutions Ltd. 3,474,267$ 20,167,965$ Non-GAAP Add: Loss on impairment of vessels - 3,007,809 Loss on sale of vessels 1,172,196 - Unrealized loss (gain) on derivative instruments, net 423,569 (7,500,314) Non-GAAP adjusted net income attributable to Pangaea Logistics Solutions Ltd. 5,070,032 15,675,460 Weighted average number of common shares - basic 44,712,290 44,388,960 Weighted average number of common shares - diluted 45,116,719 45,192,983 Adjusted EPS - basic 0.11$ 0.35$ Adjusted EPS - diluted 0.11$ 0.35$ For the three months ended