FOR RELEASE: CONTACT: | New Hartford, NY, March 15, 2021 Christopher R. Byrnes (315) 738-0600 ext. 6226 [email protected], www.partech.com | |||||||
PAR TECHNOLOGY CORPORATION ANNOUNCES FOURTH QUARTER AND FULL YEAR 2020 RESULTS
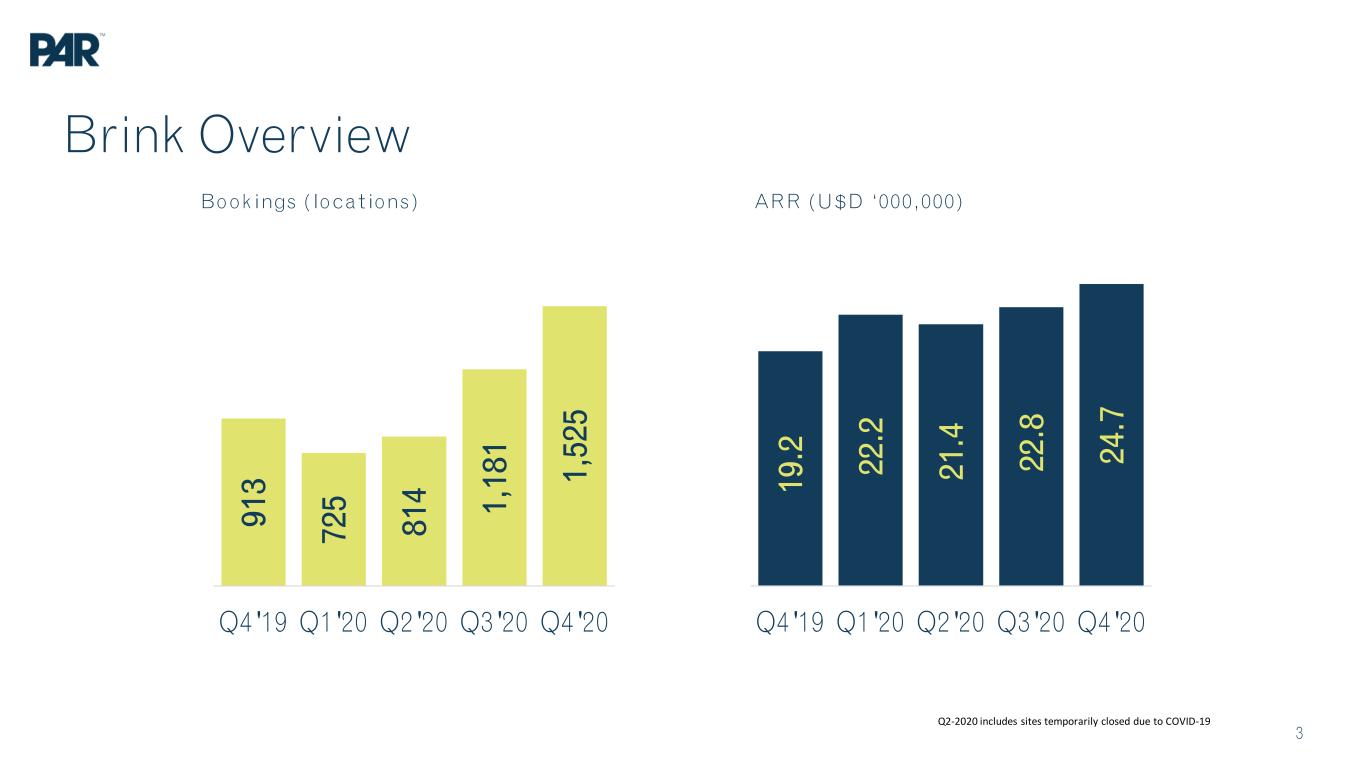
•New Brink Bookings in Q4 = 1,525 a 67% YoY increase from Q4 ‘19
•Total Company Revenues increased 10.6% vs. Q4 ‘19
New Hartford, NY- March 15, 2021 -- PAR Technology Corporation (NYSE: PAR) (“PAR Technology” or the “Company”) today announced its results for its fourth quarter and for the year ended December 31, 2020.
Summary of Fiscal 2020 Fourth Quarter
•Revenues were $58.5 million for the fourth quarter of 2020, compared to $52.9 million for the same period in 2019, a 10.6% increase.
•GAAP net loss for the fourth quarter of 2020 was $13.0 million, or $0.60 loss per share, compared to a GAAP net loss of $5.8 million, or $0.35 loss per share reported for the same period in 2019.
•Non-GAAP net loss for the fourth quarter of 2020 was $8.0 million, or $0.37 loss per share, compared to non-GAAP net loss of $3.8 million, or $0.23 loss per share, for the same period in 2019.
Summary of Year-to-Date Financial Results
•Revenues were $213.8 million for the year ended December 31, 2020, compared to $187.2 million for the same period in 2019, a 14.2% increase.
•GAAP net loss for the year ended December 31, 2020 was $36.6 million, or $1.92 loss per share, compared to a GAAP net loss of $15.6 million, or $0.96 loss per share, reported for the same period in 2019.
•Non-GAAP net loss for the year ended December 31, 2020 was $20.0 million, or $1.05 loss per share, compared to non-GAAP net loss of $10.8 million, or $0.67 loss per share, for the same period in 2019.
A reconciliation and description of non-GAAP financial measures to corresponding GAAP financial measures is included in the tables at the end of this press release.
Savneet Singh, PAR Technology CEO & President commented on the quarter, “Q4 was the strongest bookings quarter in Brink history, continuing the acceleration we saw in Q3 and totaling 1,525. The strong pace of bookings were ahead of our internal expectations, and we installed 885 new Brink sites in Q4 '20, a 42% increase from Q4 ’19. Strategically, our pipeline of newly signed customers is higher than it has ever been and I am looking forward to sharing additional details on these wins with you when appropriate.”
Mr. Singh continued, “Throughout 2020, we sustained our revenue growth, while maintaining a strong focus on investment, all the while managing the impact of the pandemic. We accelerated our investments in people, internal product development, customer service and more recently, sales. These important investments are necessary to build upon our compelling competitive advantages in enterprise restaurants. These initiatives reflect our commitment to aggressively pursue the substantial market opportunities ahead for our Company and the strong desire we have to ensure we are positioned to win. I am proud of our team’s execution and I am energized by the opportunities in front of us as a Company.”
Highlights of Brink Product Line – Fourth Quarter 2020:
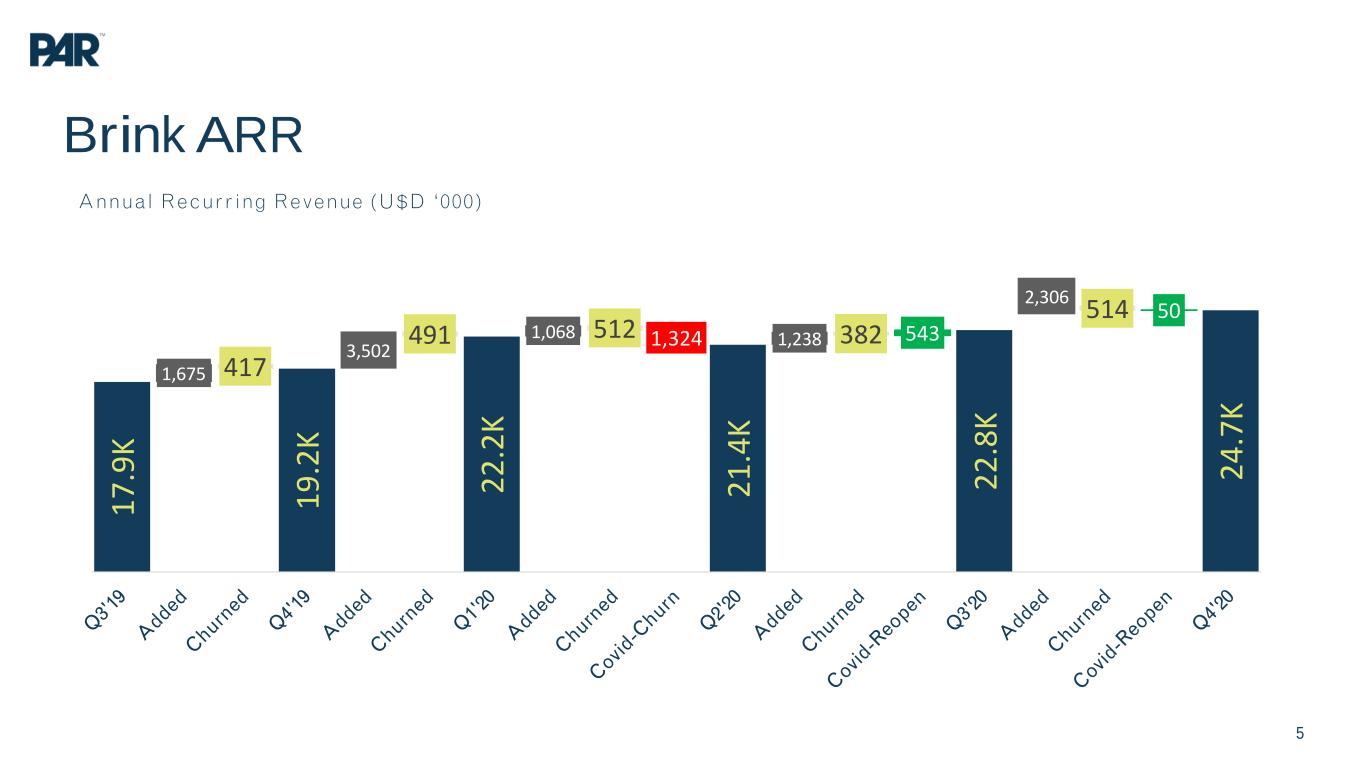
-- Brink ARR at end of Q4 '20 totaled $24.7 million - an increase of $5.5 million, 29% from end of Q4 '19
-- New store activations in Q4 '20 totaled 885 sites
-- Brink bookings in Q4 ‘20 totaled 1,525 sites
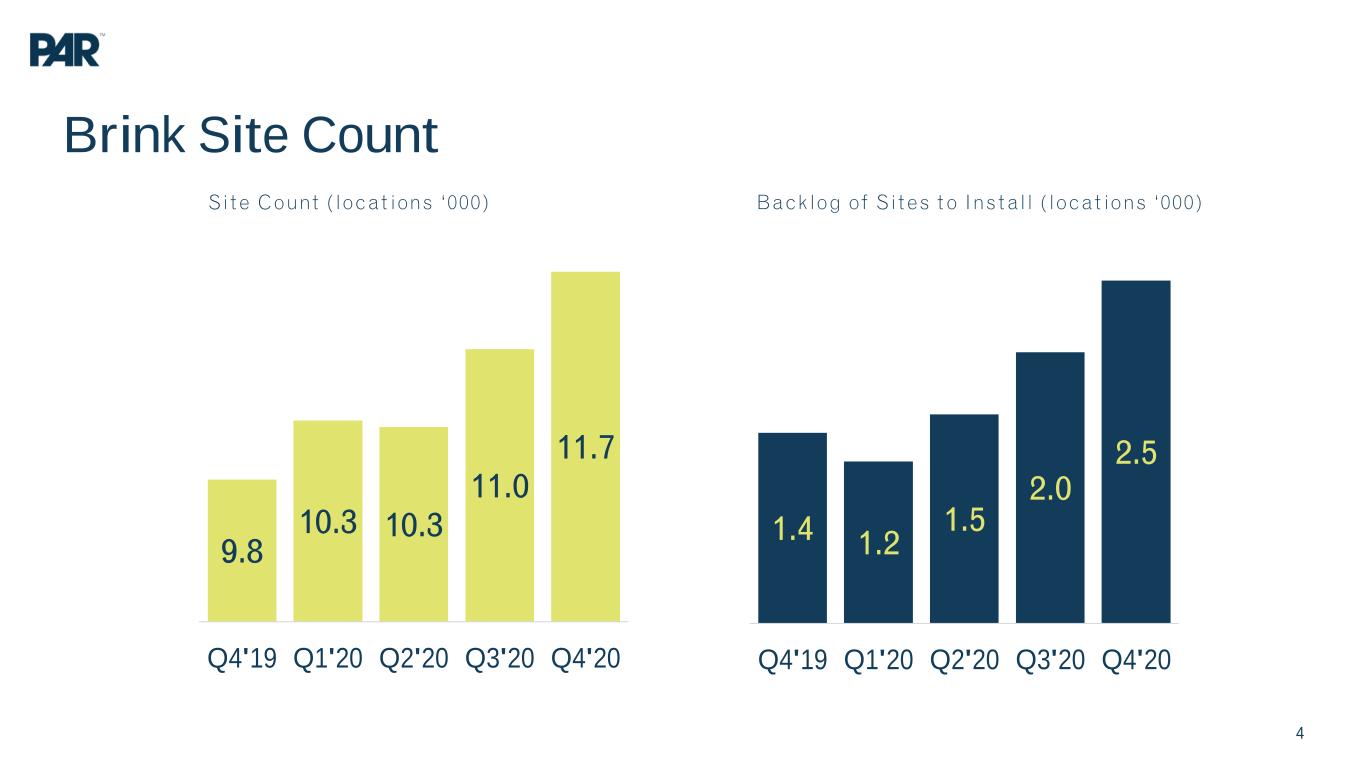
-- Brink backlog totaled 2,546 sites at the end of Q4 '20
-- Active Brink sites as of December 31st total 11,722 restaurants
Highlights of Restaurant Magic Product Line – Fourth Quarter 2020:
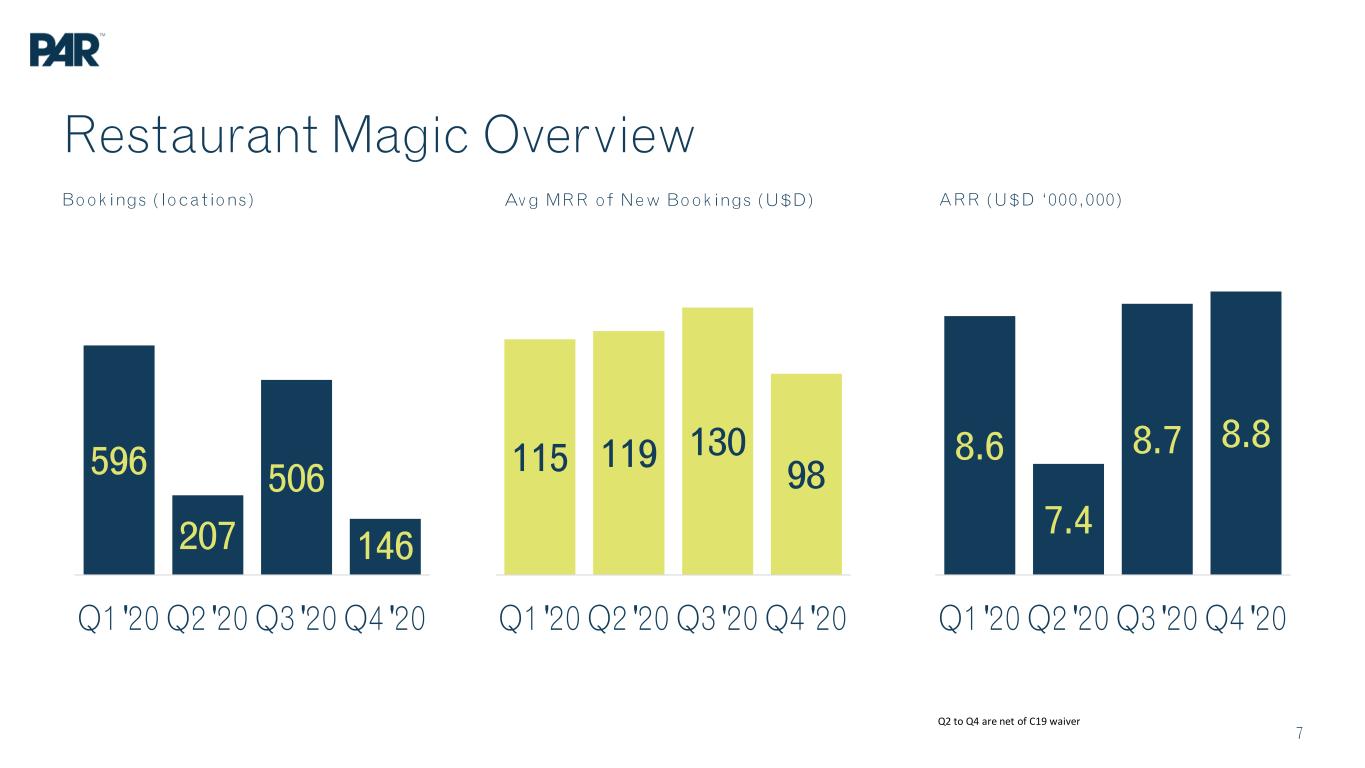
--Restaurant Magic ARR at end of Q4 ’20 totaled $8.8 million
--New store activations in Q4 '20 totaled 406 sites
--Restaurant Magic bookings in Q4 ’20 totaled 146 sites
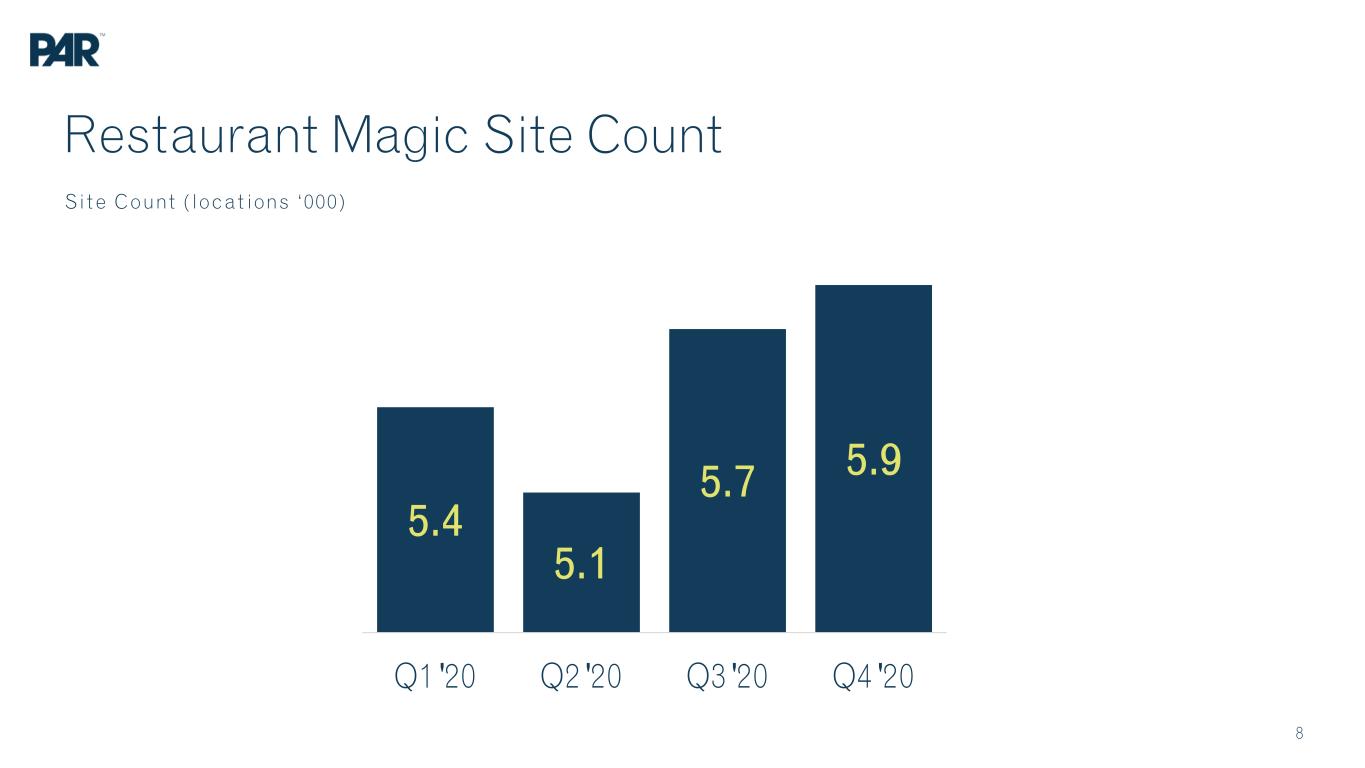
--Active Restaurant Magic sites as of December 31st total 5,892 restaurants
Conference Call.
There will be a conference call at 4:30 p.m. (Eastern) on March 15, 2021, during which the Company’s management will discuss the financial results for the fourth quarter and year ended December 31, 2020. To participate in the call, please call 844-419-5412, approximately 10 minutes in advance. No passcode is required to participate in the live call or to listen to the replay version. Investors will have the opportunity to listen to the conference call/event over the internet by visiting the Company’s website at https://www.partech.com/about-us/investor-relations/. Alternatively, listeners may access an archived version of the presentation call after 7:30 p.m. on March 15, 2021 through March 22, 2021 by dialing 855-859-2056 and using conference ID 2996764.
About PAR Technology Corporation.
PAR Technology Corporation through its wholly owned subsidiary ParTech, Inc., is a customer success-driven, global restaurant and retail technology company with over 100,000 restaurants in more than 110 countries using its point of sale hardware and software. ParTech’s Brink POS® integration ecosystem enables quick service, fast casual and table service restaurants to improve their operational efficiency by combining its cloud-based POS software with the world’s leading restaurant technology platforms. PAR Technology’s Government segment is a leader in providing computer-based system design, engineering and technical services to the Department of Defense and various other federal agencies. PAR Technology’s stock is traded on the New York Stock Exchange under the symbol PAR. For more information, visit www.partech.com or connect with PAR Technology on Facebook or Twitter.
Forward-Looking Statements.
This press release contains “forward-looking statements” within the meaning of Section 21E of the Securities Exchange Act of 1934, as amended, Section 27A of the Securities Act of 1933, as amended, and the Private Securities Litigation Reform Act of 1995. Forward-looking statements are not historical in nature, but rather are predictive of our future operations, financial condition, business strategies and prospects. Forward-looking statements are generally identified by words such as “anticipate,” “believe,” “belief,” “continue,” “could,” “expect,” “estimate,” “intend,” “may,” “opportunity,” “plan,” “should,” “will,” “would,” “will likely result,” and similar expressions. Forward-looking statements are based on current expectations and assumptions that are subject to a variety of risks and uncertainties, many of which are beyond our control, which could cause our actual results to differ materially from those expressed in or implied by forward-looking statements contained in this press release, including forward-looking statements relating to our expectations regarding the impact of the COVID-19 pandemic on our business, operations, financial condition, and financial results. Factors that could cause our actual results to differ materially from those expressed in or implied by forward-looking statements contained in this press release, include but are not limited to, those described in our filings with the Securities and Exchange Commission.
###
PAR TECHNOLOGY CORPORATION AND SUBSIDIARIES
CONSOLIDATED BALANCE SHEETS
(Unaudited, in thousands, except share and per share amounts)
| Assets | December 31, 2020 | December 31, 2019 | |||||||||
| Current assets: | |||||||||||
| Cash and cash equivalents | $ | 180,686 | $ | 28,036 | |||||||
| Accounts receivable – net | 42,980 | 41,774 | |||||||||
| Inventories – net | 21,638 | 19,326 | |||||||||
| Other current assets | 3,625 | 4,427 | |||||||||
| Total current assets | 248,929 | 93,563 | |||||||||
| Property, plant and equipment – net | 13,856 | 14,351 | |||||||||
| Goodwill | 41,214 | 41,386 | |||||||||
| Intangible assets – net | 33,121 | 32,948 | |||||||||
| Lease right-of-use assets | 2,569 | 3,017 | |||||||||
| Other assets | 4,060 | 4,347 | |||||||||
| Total Assets | $ | 343,749 | $ | 189,612 | |||||||
| Liabilities and Shareholders’ Equity | |||||||||||
| Current liabilities: | |||||||||||
| Current portion of long-term debt | $ | 666 | $ | 630 | |||||||
| Accounts payable | 12,791 | 16,385 | |||||||||
| Accrued salaries and benefits | 13,190 | 7,769 | |||||||||
| Accrued expenses | 2,606 | 3,176 | |||||||||
| Lease liabilities – current portion | 1,200 | 2,060 | |||||||||
| Customer deposits and deferred service revenue | 9,506 | 12,084 | |||||||||
| Total current liabilities | 39,959 | 42,104 | |||||||||
| Lease liabilities – net of current portion | 1,462 | 1,021 | |||||||||
| Deferred revenue – noncurrent | 3,082 | 3,916 | |||||||||
| Long-term debt | 105,844 | 62,414 | |||||||||
| Other long-term liabilities | 4,997 | 7,310 | |||||||||
| Total liabilities | 155,344 | 116,765 | |||||||||
| Commitments and contingencies | |||||||||||
| Shareholders’ Equity: | |||||||||||
| Preferred stock, $.02 par value, 1,000,000 shares authorized | — | — | |||||||||
Common stock, $.02 par value, 58,000,000 and 29,000,000 shares authorized; 22,982,955 and 18,360,205 shares issued, 21,917,357 and 16,629,177 outstanding at December 31, 2020 and December 31, 2019, respectively | 459 | 367 | |||||||||
| Additional paid in capital | 243,575 | 94,372 | |||||||||
| Accumulated deficit | (46,706) | (10,144) | |||||||||
| Accumulated other comprehensive loss | (3,936) | (5,368) | |||||||||
| Treasury stock, at cost, 1,065,598 and 1,731,028 shares at December 31, 2020 and December 31, 2019, respectively | (4,987) | (6,380) | |||||||||
| Total shareholders’ equity | 188,405 | 72,847 | |||||||||
| Total Liabilities and Shareholders’ Equity | $ | 343,749 | $ | 189,612 | |||||||
PAR TECHNOLOGY CORPORATION
CONSOLIDATED STATEMENTS OF OPERATIONS
(Unaudited, in thousands, except share and per share amounts)
| Three Months Ended December 31, | Year Ended December 31, | ||||||||||||||||||||||
| 2020 | 2019 | 2020 | 2019 | ||||||||||||||||||||
| Net revenues: | |||||||||||||||||||||||
| Product | $ | 21,791 | $ | 20,180 | $ | 73,228 | $ | 66,329 | |||||||||||||||
| Service | 18,332 | 15,464 | 69,284 | 56,978 | |||||||||||||||||||
| Contract | 18,393 | 17,279 | 71,274 | 63,925 | |||||||||||||||||||
| 58,516 | 52,923 | 213,786 | 187,232 | ||||||||||||||||||||
| Costs of sales: | |||||||||||||||||||||||
| Product | 18,005 | 16,235 | 58,887 | 51,189 | |||||||||||||||||||
| Service | 15,966 | 10,563 | 49,933 | 40,389 | |||||||||||||||||||
| Contract | 16,860 | 15,564 | 65,641 | 58,243 | |||||||||||||||||||
| 50,831 | 42,362 | 174,461 | 149,821 | ||||||||||||||||||||
| Gross margin | 7,685 | 10,561 | 39,325 | 37,411 | |||||||||||||||||||
| Operating expenses: | |||||||||||||||||||||||
| Selling, general and administrative | 13,607 | 10,061 | 46,196 | 38,068 | |||||||||||||||||||
| Research and development | 5,639 | 4,139 | 19,252 | 13,372 | |||||||||||||||||||
| Amortization of identifiable intangible assets | 643 | 156 | 1,163 | 156 | |||||||||||||||||||
| Adjustment to contingent consideration liability | (1,030) | — | (3,340) | — | |||||||||||||||||||
| 18,859 | 14,356 | 63,271 | 51,596 | ||||||||||||||||||||
| Operating loss | (11,174) | (3,795) | (23,946) | (14,185) | |||||||||||||||||||
| Other income (expense) – net | 1,457 | (89) | 808 | (449) | |||||||||||||||||||
| Interest expense, net | (1,969) | (1,593) | (8,287) | (4,571) | |||||||||||||||||||
| Loss on extinguishment debt | — | — | (8,123) | — | |||||||||||||||||||
| Loss before benefit from income taxes | (11,686) | (5,477) | (39,548) | (19,205) | |||||||||||||||||||
| Benefit from (provision for) income taxes | (1,279) | (354) | 2,986 | 3,634 | |||||||||||||||||||
| Net loss | $ | (12,965) | $ | (5,831) | $ | (36,562) | $ | (15,571) | |||||||||||||||
| Earnings per share (basic and diluted) | $ | (0.60) | $ | (0.35) | $ | (1.92) | $ | (0.96) | |||||||||||||||
| Weighted average shares outstanding (basic and diluted) | 21,610 | 16,570 | 19,014 | 16,223 | |||||||||||||||||||
PAR TECHNOLOGY CORPORATION
RECONCILIATION OF GAAP TO NON-GAAP FINANCIAL RESULTS
(Unaudited, in thousands, except per share and footnote amounts)
| For the Three Months Ended | For the Three Months Ended | |||||||||||||||||||||||||||||||||||||
| December 31, 2020 | December 31, 2019 | |||||||||||||||||||||||||||||||||||||
Reported basis (GAAP) | Adjustments | Comparable basis (Non-GAAP) | Reported basis (GAAP) | Adjustments | Comparable basis (Non-GAAP) | |||||||||||||||||||||||||||||||||
Net revenues | $ | 58,516 | — | $ | 58,516 | $ | 52,923 | — | $ | 52,923 | ||||||||||||||||||||||||||||
Operating loss | (11,174) | 2,803 | 1 | (8,371) | (3,795) | 1,160 | 4 | (2,635) | ||||||||||||||||||||||||||||||
Loss before benefit from (provision for) income taxes | (11,686) | 3,869 | 1, 2 | (7,817) | (5,477) | 2,061 | 4, 5 | (3,416) | ||||||||||||||||||||||||||||||
Net loss | (12,965) | 5,012 | 1, 2, 3 | (7,953) | (5,831) | 2,061 | 4, 5, 6 | (3,770) | ||||||||||||||||||||||||||||||
Loss per diluted share | $ | (0.60) | $ | (0.37) | $ | (0.35) | $ | (0.23) | ||||||||||||||||||||||||||||||
| 1 | Adjustment reflects stock-based compensation expense of $1.0 million; amortization expense of acquired identifiable intangible assets of $1.5 million; inventory disposal of $1.3 million related to the acquisition of assets of 3M Company's Drive-Thru Communications Systems business (the "3M Acquisition"); and adjustment to the fair value of contingent consideration related to the acquisition of AccSys LLC (the “Restaurant Magic Acquisition”) of $1.0 million. | ||||
| 2 | Adjustment reflects non-cash accretion of interest expense and amortization of issuance costs related to the Company's 4.5% Convertible Senior Notes due 2024 (the “2024 Notes”) and 2.875% Convertible Senior Notes due 2026 (the “2026 Notes”) of $1.1 million. | ||||
| 3 | Adjustment reflects the removal of Q4 income tax expense of $1.1 million that resulted from a change to the valuation allowance on our net deferred tax assets as a result of the partial retirement of the 2024 Notes. The above adjustments are not tax-effected for income tax expense (benefit) due to the full valuation allowance on all of our net deferred tax assets. | ||||
| 4 | Adjustments reflect stock-based compensation expense of $0.9 million; adjustments related to the SureCheck divestiture of $0.4 million; amortization expense of acquired identifiable intangible assets of $0.5 million; and, expenses related to the Company's continued cooperation with the Singapore authorities in connection with the findings of the completed internal investigation undertaken by the Company related to conduct at its China and Singapore offices (the “China/Singapore Investigation”) of $0.2 million. | ||||
| 5 | Adjustment reflects non-cash accretion of interest expense and amortization of issuance costs related to the 2024 Notes of $0.9 million. | ||||
| 6 | The above adjustments are not tax-effected for income tax due to the Company's full valuation allowance on all of our net deferred tax assets. | ||||
| For the Year Ended | For the Year Ended | |||||||||||||||||||||||||||||||||||||
| December 31, 2020 | December 31, 2019 | |||||||||||||||||||||||||||||||||||||
Reported basis (GAAP) | Adjustments | Comparable basis (Non-GAAP) | Reported basis (GAAP) | Adjustments | Comparable basis (Non-GAAP) | |||||||||||||||||||||||||||||||||
Net revenues | $ | 213,786 | $ | — | $ | 213,786 | $ | 187,232 | $ | — | $ | 187,232 | ||||||||||||||||||||||||||
Operating loss | (23,946) | 7,307 | 1 | (16,639) | (14,185) | 6,260 | 4 | (7,925) | ||||||||||||||||||||||||||||||
Loss before benefit from (provision for) income taxes | (39,548) | 19,785 | 1, 2 | (19,763) | (19,205) | 8,788 | 4, 5 | (10,417) | ||||||||||||||||||||||||||||||
Net loss | (36,562) | 16,520 | 1, 2, 3 | (20,042) | (15,571) | 4,723 | 4, 5, 6 | (10,848) | ||||||||||||||||||||||||||||||
Loss per diluted share | $ | (1.92) | $ | (1.05) | $ | (0.96) | $ | (0.67) | ||||||||||||||||||||||||||||||
| 1 | Adjustment reflects stock-based compensation expense of $4.3 million; amortization expense of acquired identifiable intangible assets of $4.6 million; inventory disposal of $1.3 million related to the 3M Acquisition; severance expense of $0.3 million; expenses related to the China/Singapore Investigation of $0.1 million; and, gain on reduction to the fair value of contingent consideration related to the Restaurant Magic Acquisition of $3.3 million. | ||||
| 2 | Adjustment reflects loss on extinguishment of debt related to the repurchase of approximately $66.3 million of the 2024 Notes of $8.1 million; and, non-cash accretion of interest expense and amortization of issuance costs related to the 2024 Notes and the 2026 Notes of $4.4 million. | ||||
| 3 | Adjustment reflects reduction to benefit from income tax of $3.3 million to reflect the deferred tax benefit impact of the 2026 Notes issuance and 2024 Notes partial retirement. The above adjustments are not tax-effected for income tax expense (benefit) due to the full valuation allowance on all of our net deferred tax assets. | ||||
| 4 | Adjustments reflect stock-based compensation expense of $2.7 million; expenses related to the SureCheck divestiture of $1.3 million; amortization expense of identifiable intangible assets of $1.2 million; severance expense of $0.5 million; and, expenses related to the China/Singapore Investigation of $0.6 million. | ||||
| 5 | Adjustment reflects non-cash accretion of interest expense and amortization of issuance costs related to the 2024 Notes of $2.5 million. | ||||
| 6 | Adjustment reflects reduction to benefit from income tax of $4.1 million to reflect the deferred tax benefit impact of the 2024 Notes issuance. The above adjustments are not tax-effected for income tax due to the Company's full valuation allowance on all of our net deferred tax assets. | ||||
About Non-GAAP Financial Measures
The Company reports its financial results in accordance with GAAP. However, non-GAAP adjusted financial measures, as set forth in the reconciliation table above, are provided because management uses these non-GAAP financial measures in evaluating the results of the Company's continuing operations and believes this information provides investors supplemental insight into underlying business trends and operating results. These non-GAAP financial measures are not based on any comprehensive set of accounting rules or principles and should not be considered a substitute for, or superior to, financial measures calculated in accordance with GAAP. In addition, these non-GAAP financial measures should be read in conjunction with the Company’s financial statements prepared in accordance with GAAP.
The Company's results of operations are impacted by certain non-recurring charges, including stock-based compensation, acquisition and divestiture related expenditures, expense related to the China/Singapore Investigation, and other non-recurring charges that may not be indicative of the Company’s financial performance. Management believes that adjusting its costs of sales, operating expenses, operating loss, net loss and diluted loss per share to remove non-recurring charges, provides a useful perspective with respect to the Company's operating results and provides supplemental information to both management and investors by removing items that are difficult to predict and are often unanticipated. While we believe that these non-GAAP financial measures provide useful supplemental information to investors, there are limitations associated with the use of these non-GAAP financial measures. Non-GAAP net loss is not a measure of financial performance or liquidity under GAAP and, accordingly, should not be considered as an alternative to net loss from operations or cash flow from operating activities as indicators of operating performance or liquidity. Also, these measures may not be comparable to similarly titled captions of other companies. The above tables provide reconciliations between net loss and non-GAAP net loss.