NEWS RELEASE
PAR PACIFIC HOLDINGS REPORTS SECOND QUARTER 2020 RESULTS
HOUSTON, August 10, 2020 - Par Pacific Holdings, Inc. (NYSE: PARR) (“Par Pacific” or the “Company”) today reported its financial results for the quarter ended June 30, 2020.
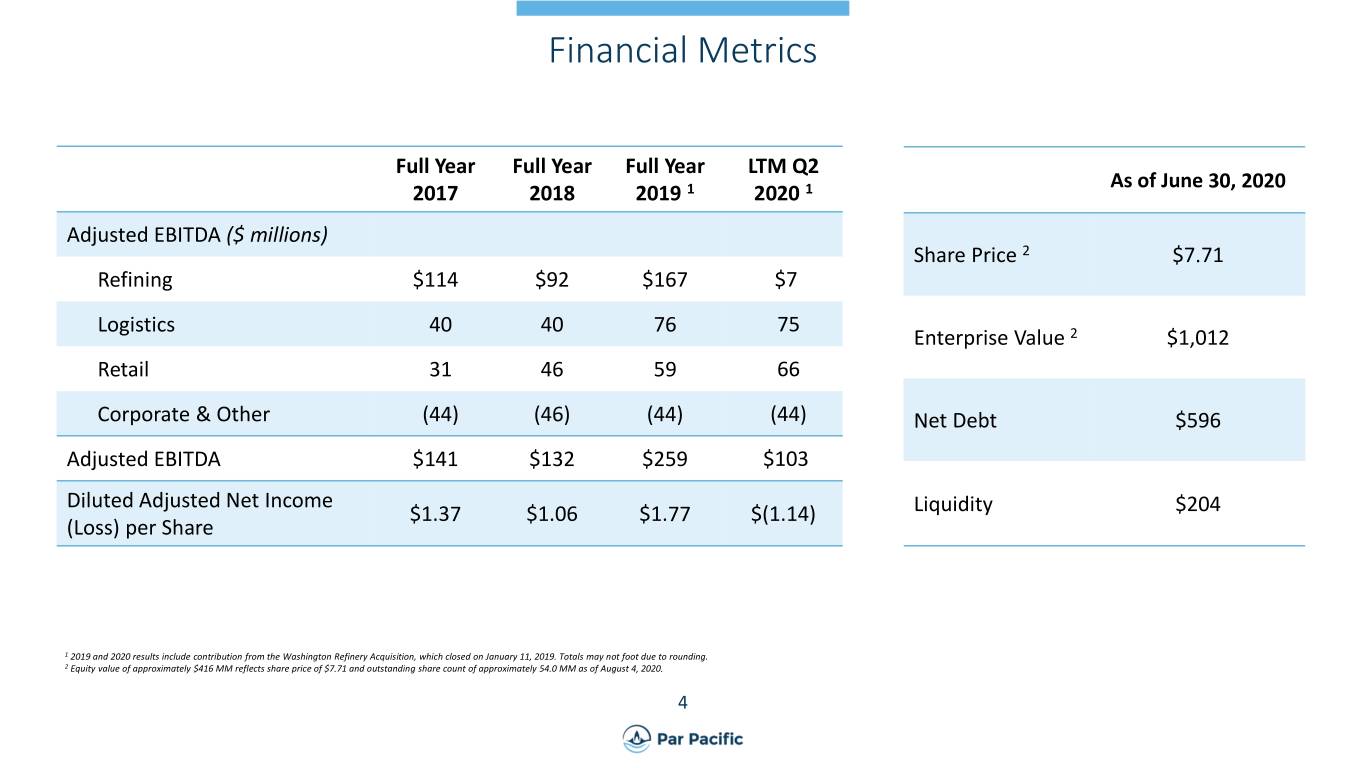
Par Pacific reported a net loss of $40.6 million, or $(0.76) per diluted share, for the quarter ended June 30, 2020, compared to net income of $28.2 million, or $0.56 per diluted share, for the same quarter in 2019. Second quarter 2020 Adjusted Net Loss was $90.8 million, compared to Adjusted Net Income of $22.4 million in the second quarter of 2019. Second quarter 2020 Adjusted EBITDA was $(50.3) million, compared to $68.5 million in the second quarter of 2019. A reconciliation of reported non-GAAP financial measures to their most directly comparable GAAP financial measures can be found in the tables accompanying this news release.
“We are pleased with the record results from our Retail operations, and the positive Adjusted EBITDA contribution from our Washington and Wyoming Refining & Logistics business units. However, Hawaii Refining & Logistics was extremely challenged by the pandemic,” said William Pate, President and Chief Executive Officer. “With the multiple actions that we have taken, we believe we are well-positioned to manage effectively during a lengthy pandemic and to thrive as economic activities resume.”
Refining
The Refining segment reported an operating loss of $36.8 million in the second quarter of 2020, compared to operating income of $33.2 million in the second quarter of 2019. Adjusted Gross Margin for the Refining segment was $(22.3) million in the second quarter of 2020, compared to $98.2 million in the second quarter of 2019.
Refining Adjusted EBITDA was $(71.7) million in the second quarter of 2020, compared to $42.8 million in the second quarter of 2019.
Hawaii
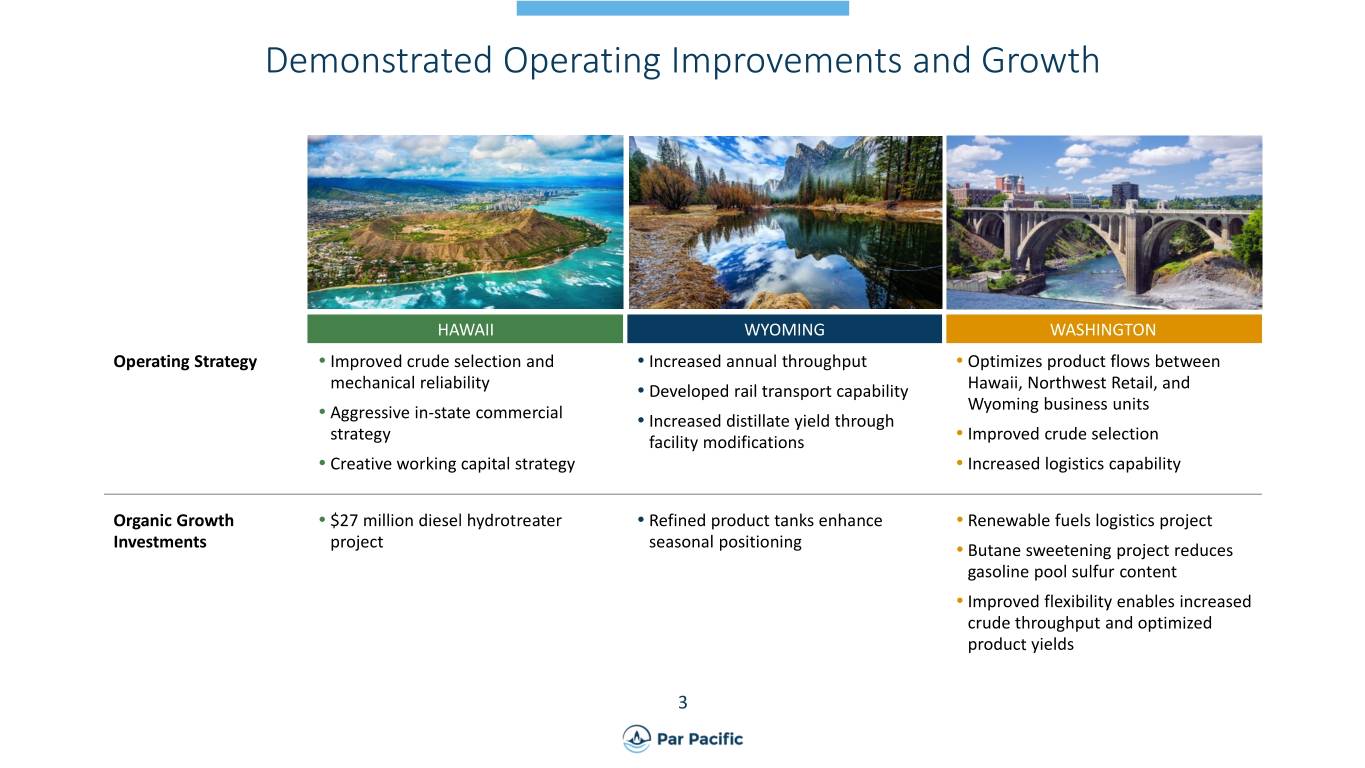
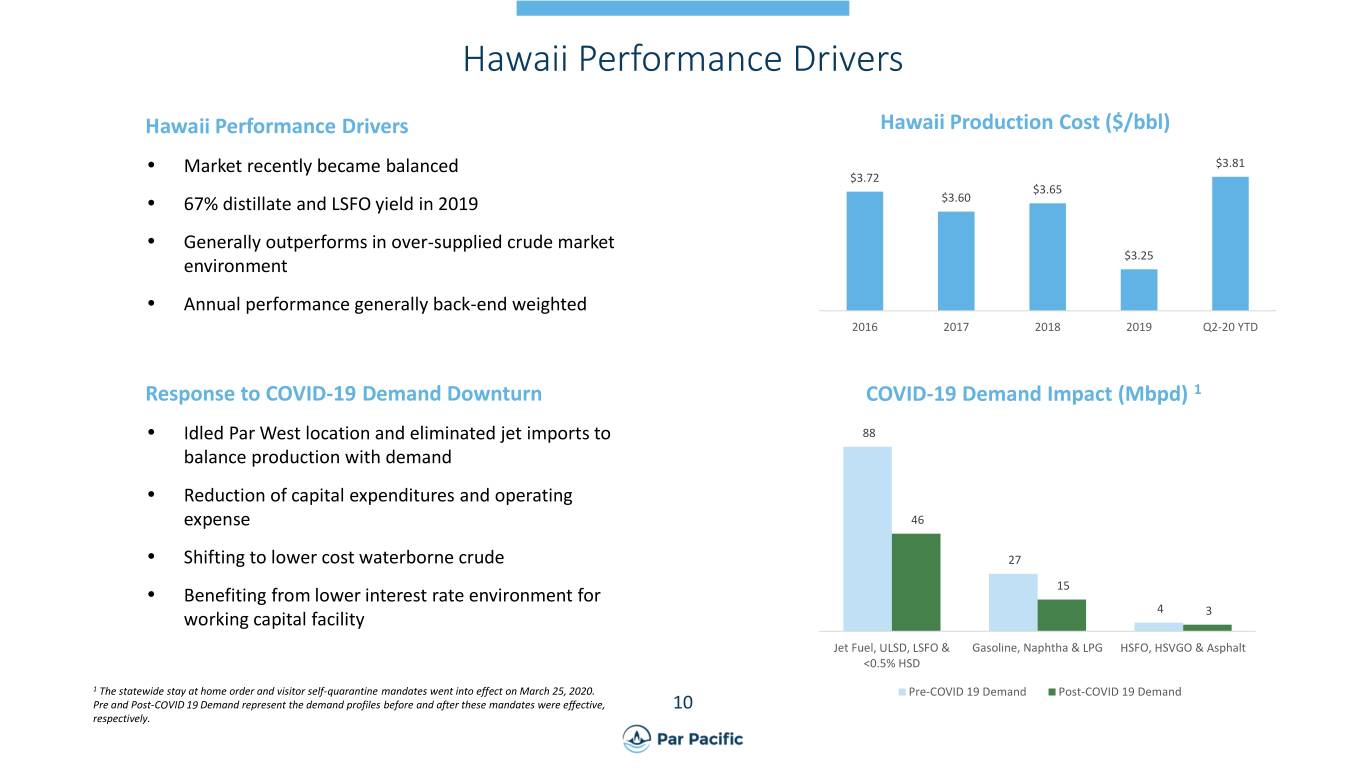
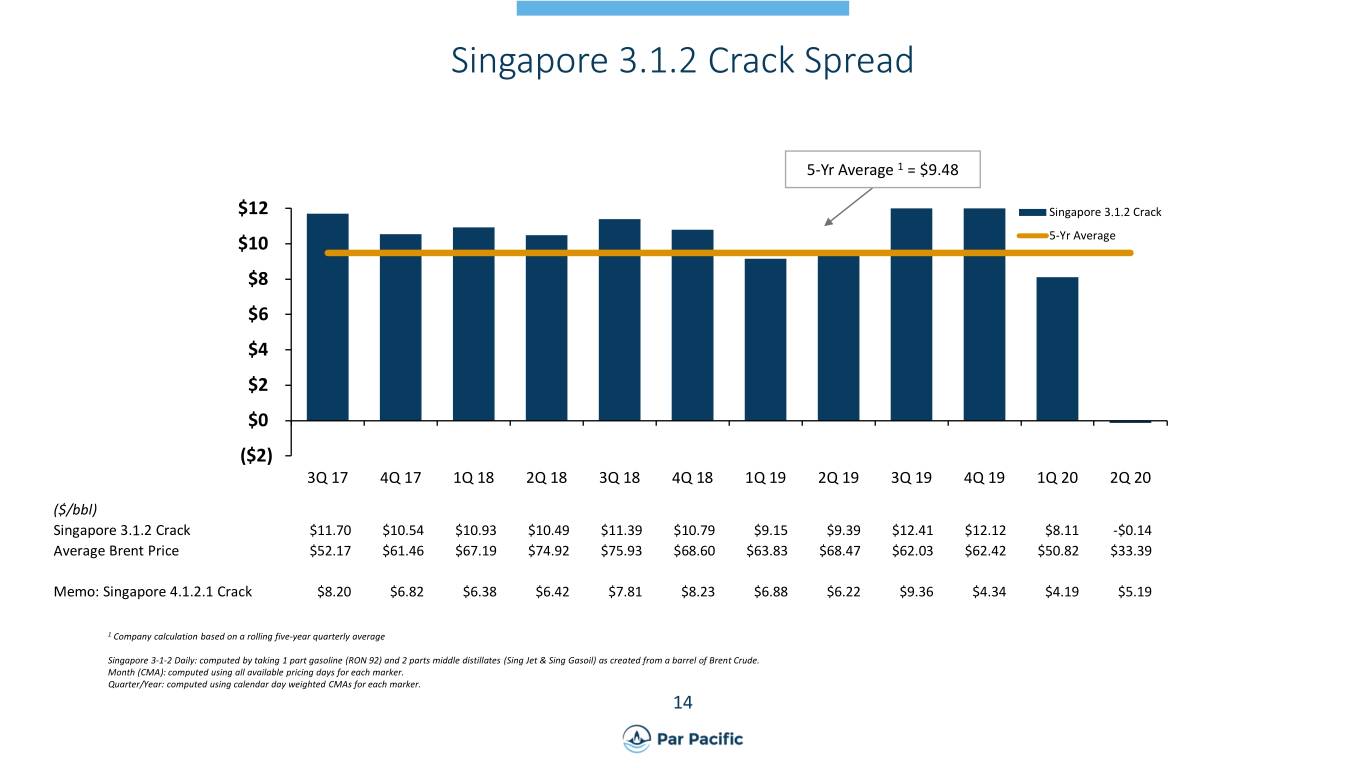
The 3-1-2 Singapore Crack Spread was $(0.14) per barrel in the second quarter of 2020, compared to $9.39 per barrel in the second quarter of 2019. The Hawaii refineries’ throughput in the second quarter of 2020 was a combined 67 thousand barrels per day (Mbpd), compared to 116 Mbpd for the same quarter in 2019. Production costs were $4.45 per throughput barrel in the second quarter of 2020, compared to $2.82 per throughput barrel in the same period in 2019.
Washington
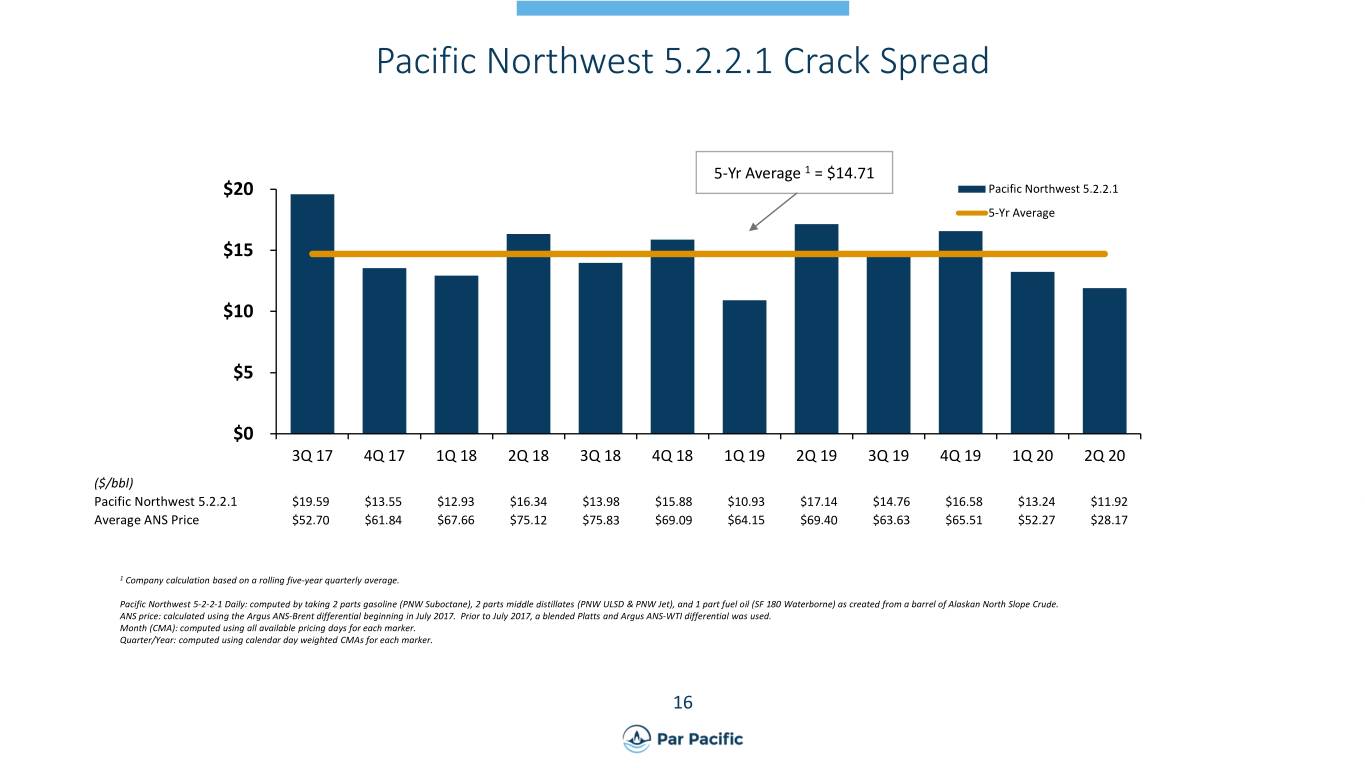
The Pacific Northwest 5-2-2-1 Index averaged $11.92 per barrel in the second quarter of 2020, compared to $17.14 per barrel in the second quarter of 2019. The Washington refinery’s throughput was 36 Mbpd in the second quarter of 2020, compared to 39 Mbpd in the second quarter of 2019. Production costs were $3.76 per throughput barrel in the second quarter of 2020, compared to $4.42 per throughput barrel in the same period in 2019.
1
Wyoming
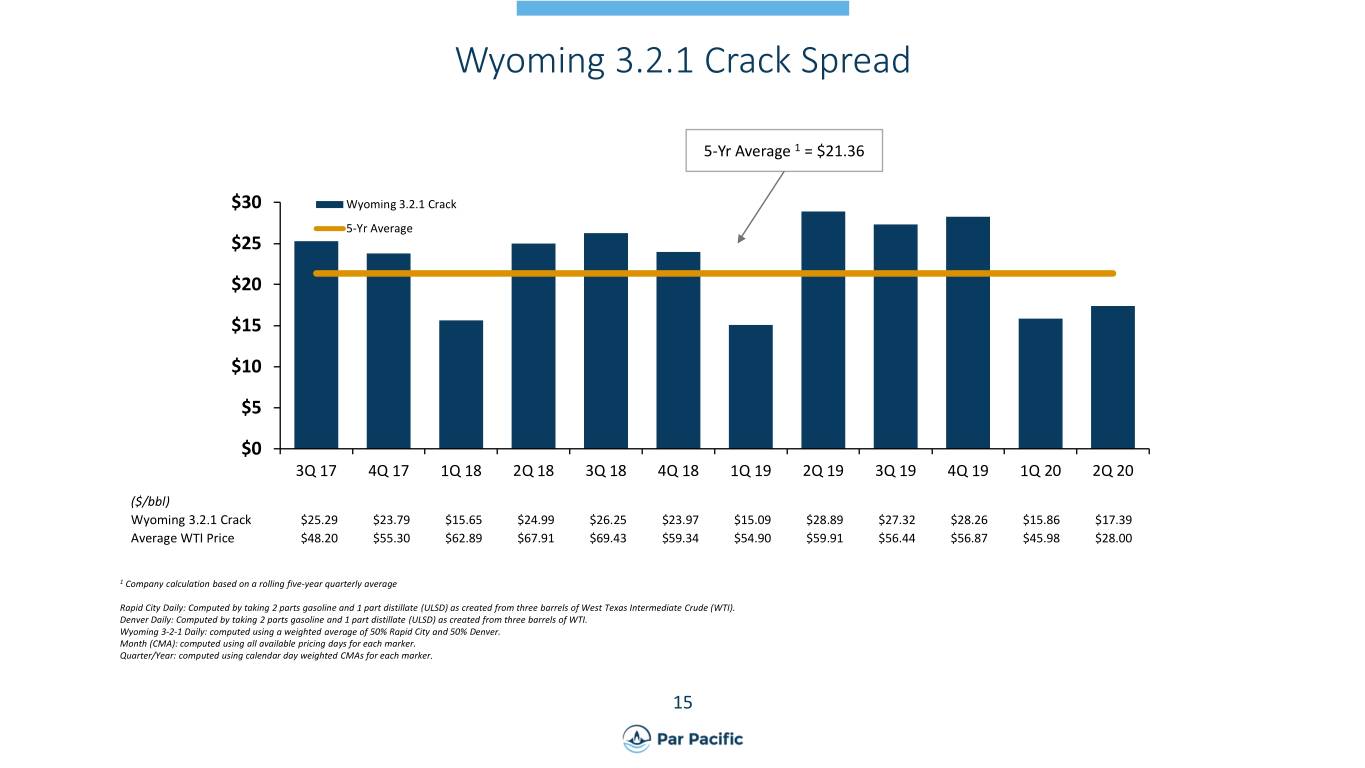
During the second quarter of 2020, the Wyoming 3-2-1 Index averaged $17.39 per barrel, compared to $28.89 per barrel in the second quarter of 2019. The Wyoming refinery’s throughput was 13 Mbpd in the second quarter of 2020, compared to 18 Mbpd in the second quarter of 2019. Production costs were $7.72 per throughput barrel in the second quarter of 2020, compared to $5.58 per throughput barrel in the same period in 2019.
The Wyoming refinery's Adjusted Gross Margin of $6.22 per barrel during the second quarter of 2020 reflects a FIFO (First in, First out) benefit of approximately $3.3 million, or $2.79 per barrel.
Retail
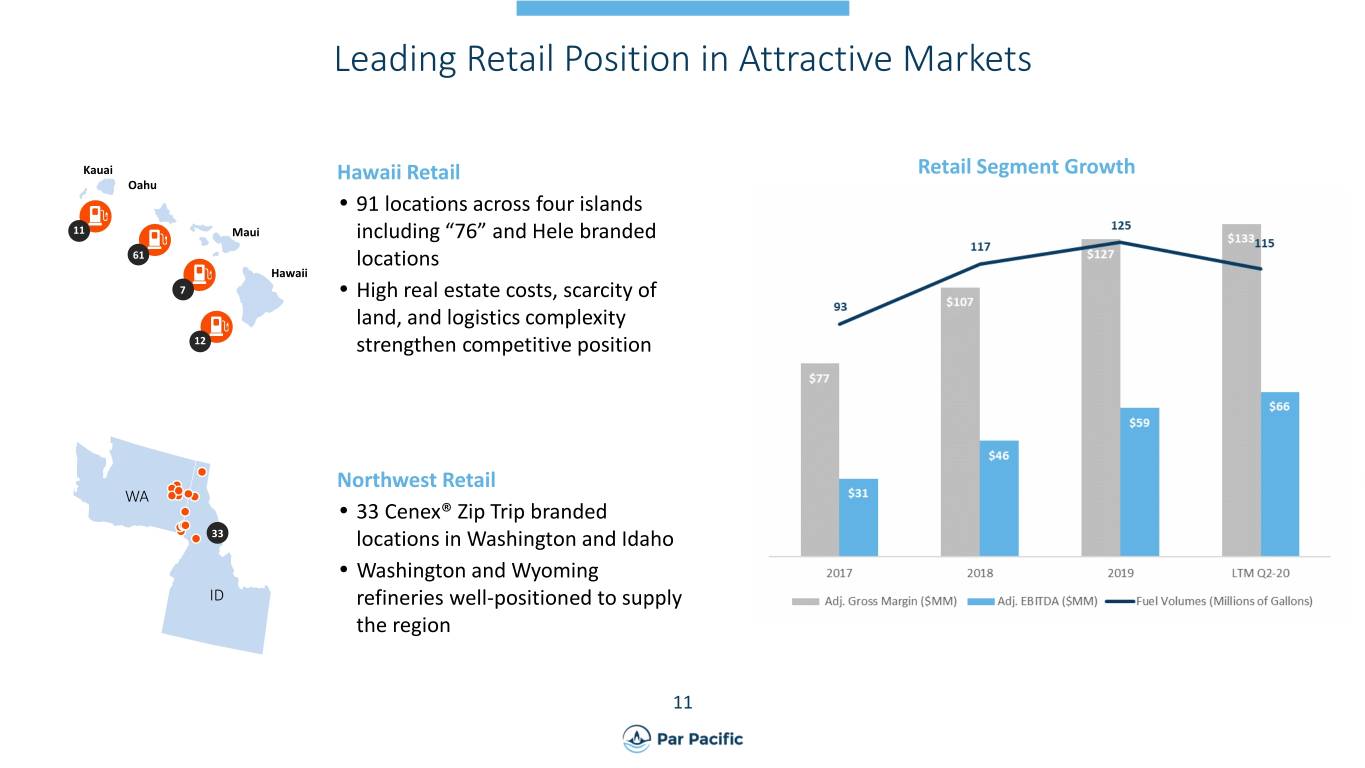
The Retail segment reported an operating income of $16.2 million in the second quarter of 2020, compared to $12.0 million in the second quarter of 2019. Adjusted Gross Margin for the Retail segment was $34.2 million in the second quarter of 2020 and $31.0 million in the same quarter of 2019.
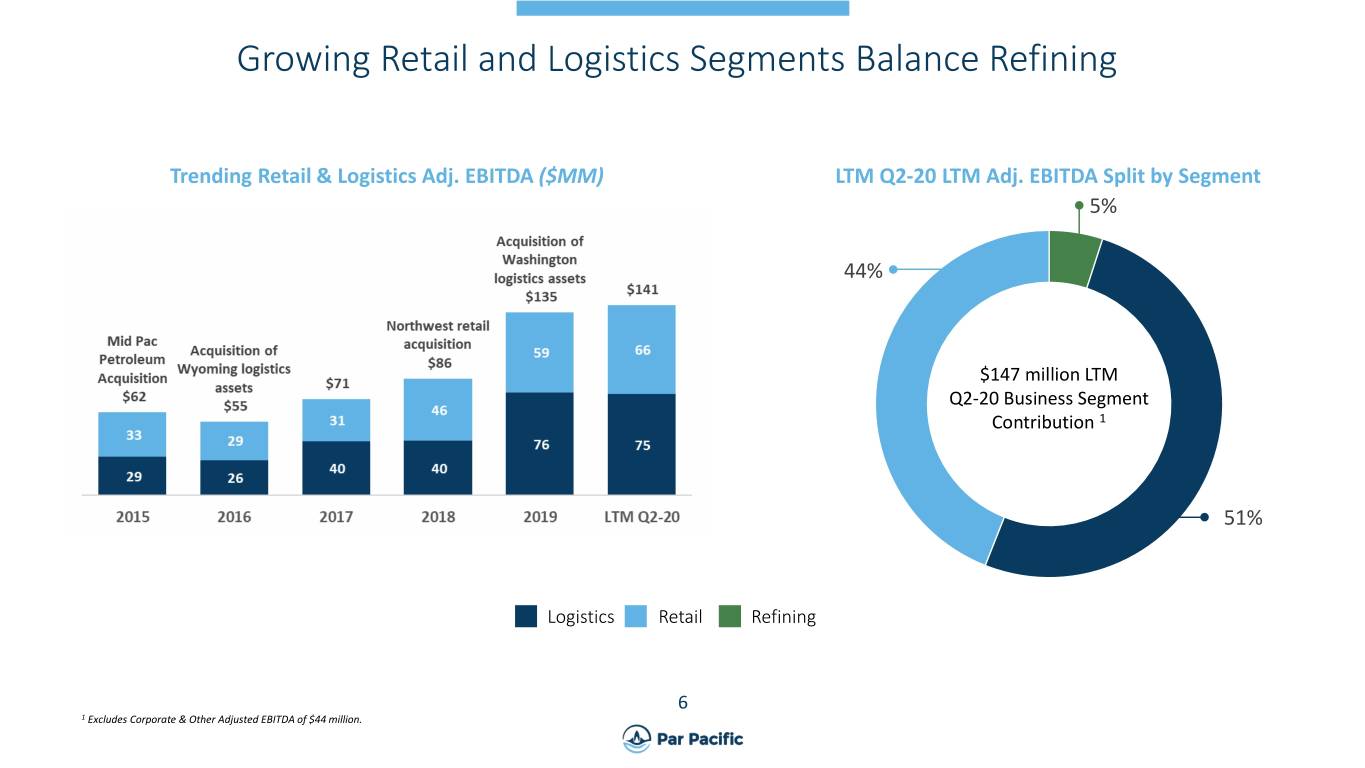
Retail Adjusted EBITDA was a record $18.8 million in the second quarter of 2020, compared to $14.6 million in the second quarter of 2019. The Retail segment reported sales volumes of 22.6 million gallons in the second quarter of 2020, compared to 31.8 million gallons in the same quarter of 2019.
Logistics
The Logistics segment reported operating income of $6.3 million in the second quarter of 2020, compared to $16.4 million in the second quarter of 2019. Adjusted Gross Margin for the Logistics segment was $14.5 million in the second quarter of 2020, compared to $23.4 million in the same quarter of 2019.
Logistics Adjusted EBITDA was $12.2 million in the second quarter of 2020, compared to $20.4 million in the second quarter of 2019.
Laramie Energy
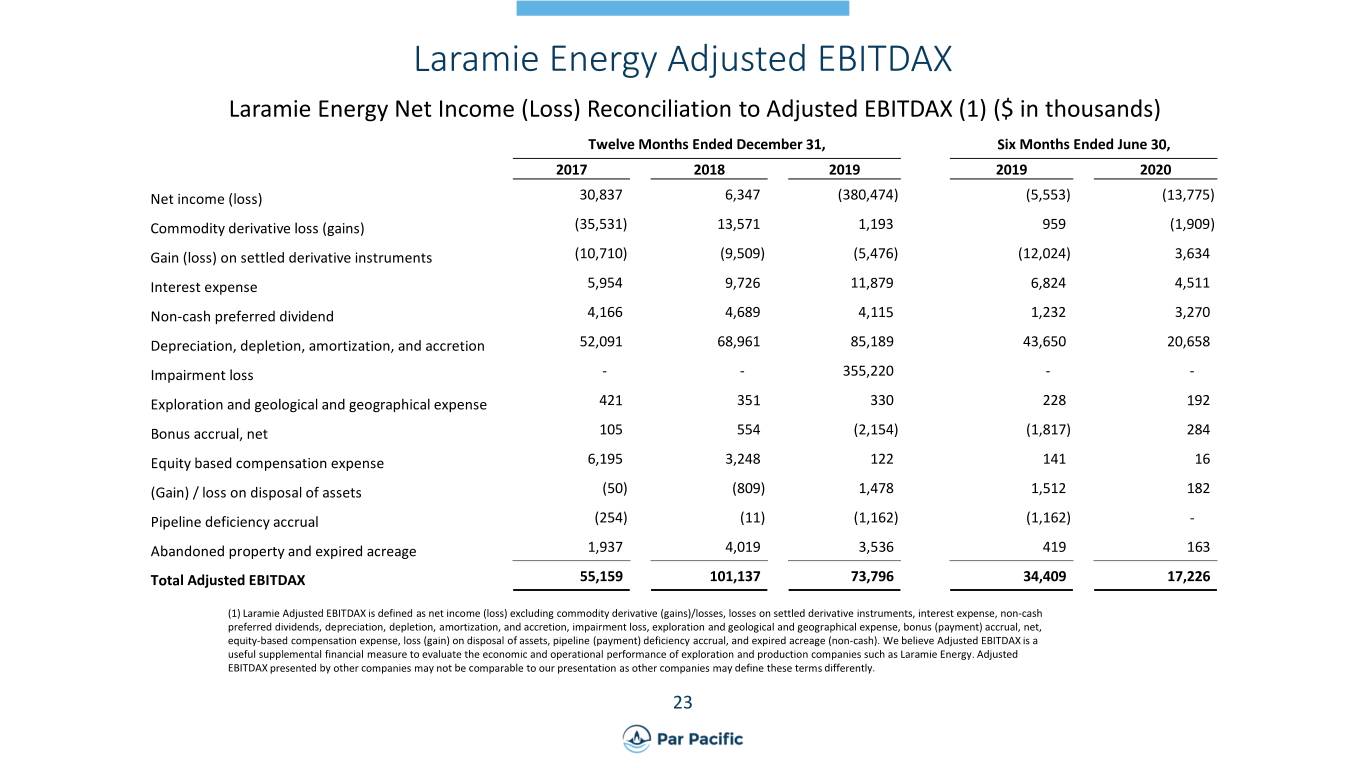
Equity losses from Laramie in the second quarter of 2020 were $1.9 million, compared to equity earnings of $0.5 million in the second quarter of 2019. Laramie’s total net loss was $14.3 million in the second quarter of 2020, compared to net loss of $2.6 million in the second quarter of 2019. Laramie’s total Adjusted EBITDAX was $5.4 million in the second quarter of 2020, compared to $14.2 million in the second quarter of 2019.
Liquidity
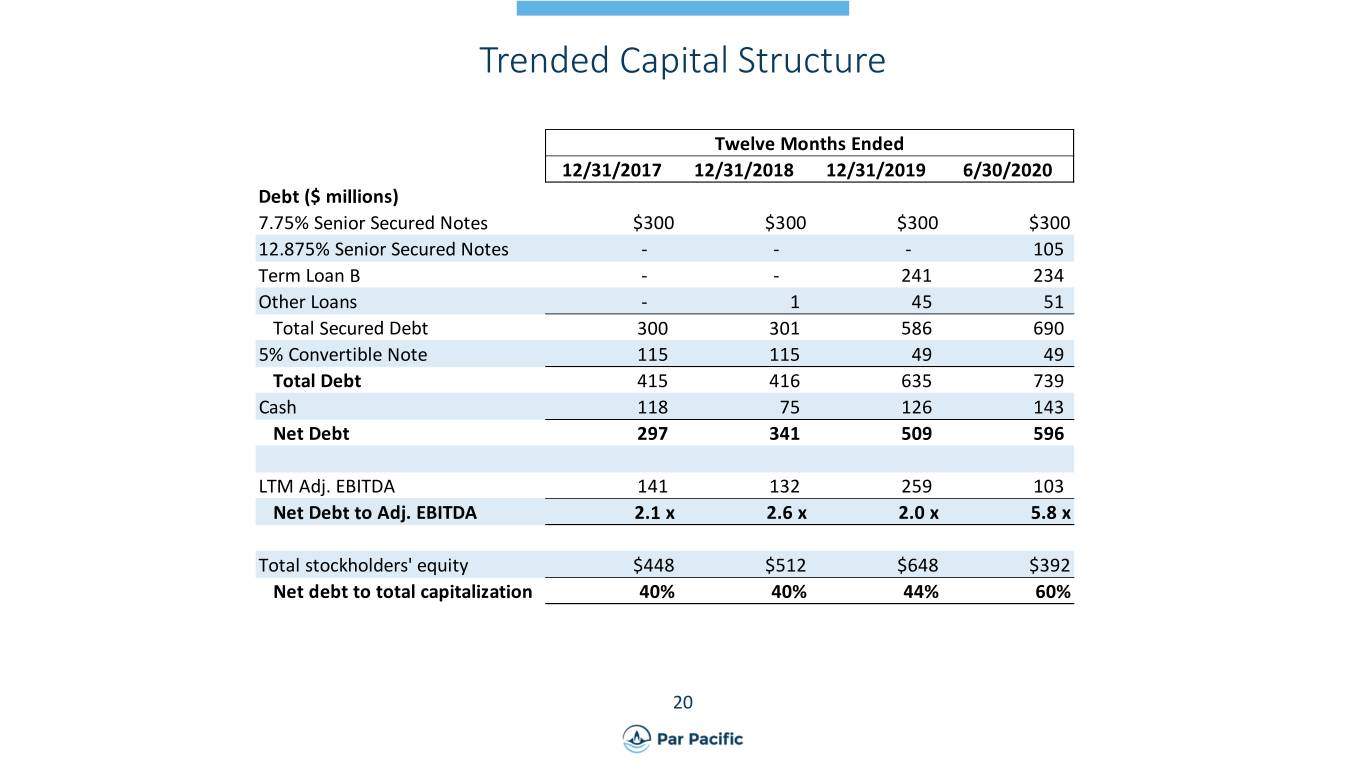
Net cash provided by operations totaled $19.3 million for the three months ended June 30, 2020, compared to $81.0 million for the three months ended June 30, 2019. Net cash used in investing activities totaled $15.2 million for the three months ended June 30, 2020, compared to $23.5 million for the three months ended June 30, 2019. Net cash provided by financing activities totaled $76.7 million for the three months ended June 30, 2020, compared to net cash used in financing activities of $9.9 million for the three months ended June 30, 2019. At June 30, 2020, Par Pacific’s cash balance totaled $142.9 million, long-term debt totaled $712.4 million, and total liquidity was $203.8 million.
2
Conference Call Information
A conference call is scheduled for Monday, August 10, 2020 at 9:00 a.m. Central Time (10:00 a.m. Eastern Time). To access the call, please dial 1-877-407-3982 inside the U.S. or 1-201-493-6780 outside of the U.S. and ask for the Par Pacific call. Please dial in at least 10 minutes early to register. The webcast may be accessed online through the Company’s website at http://www.parpacific.com on the Investor Relations page. A telephone replay will be available until August 24, 2020 and may be accessed by calling 1-844-512-2921 inside the U.S. or 1-412-317-6671 outside the U.S. and using the conference ID 13707235.
About Par Pacific
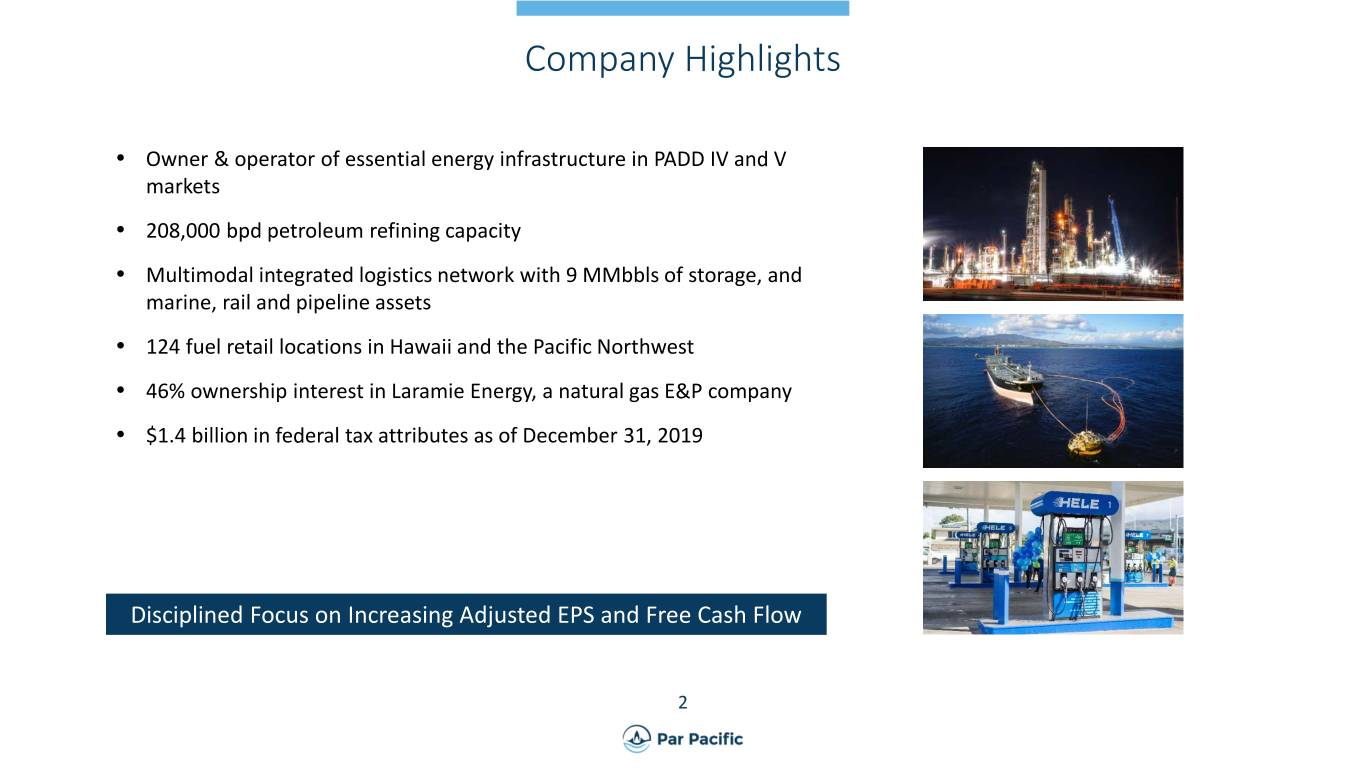
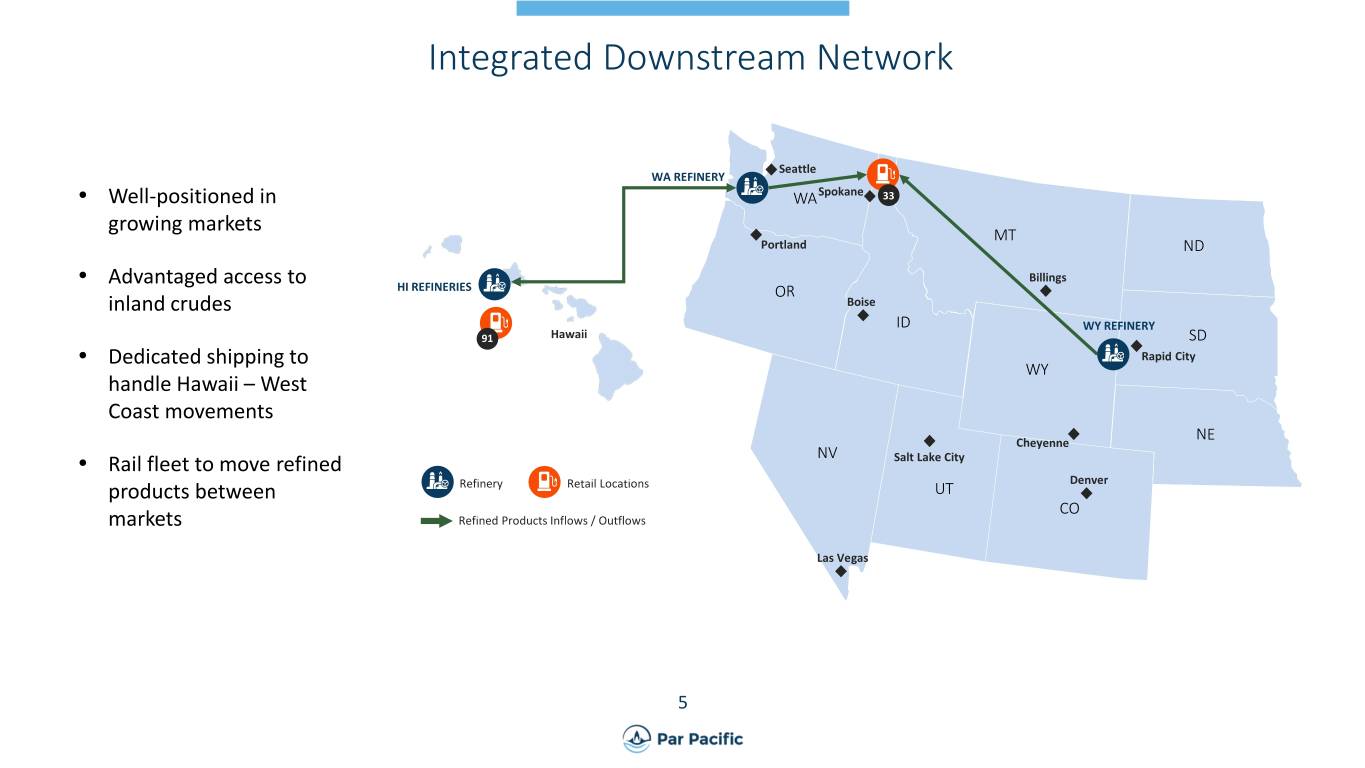
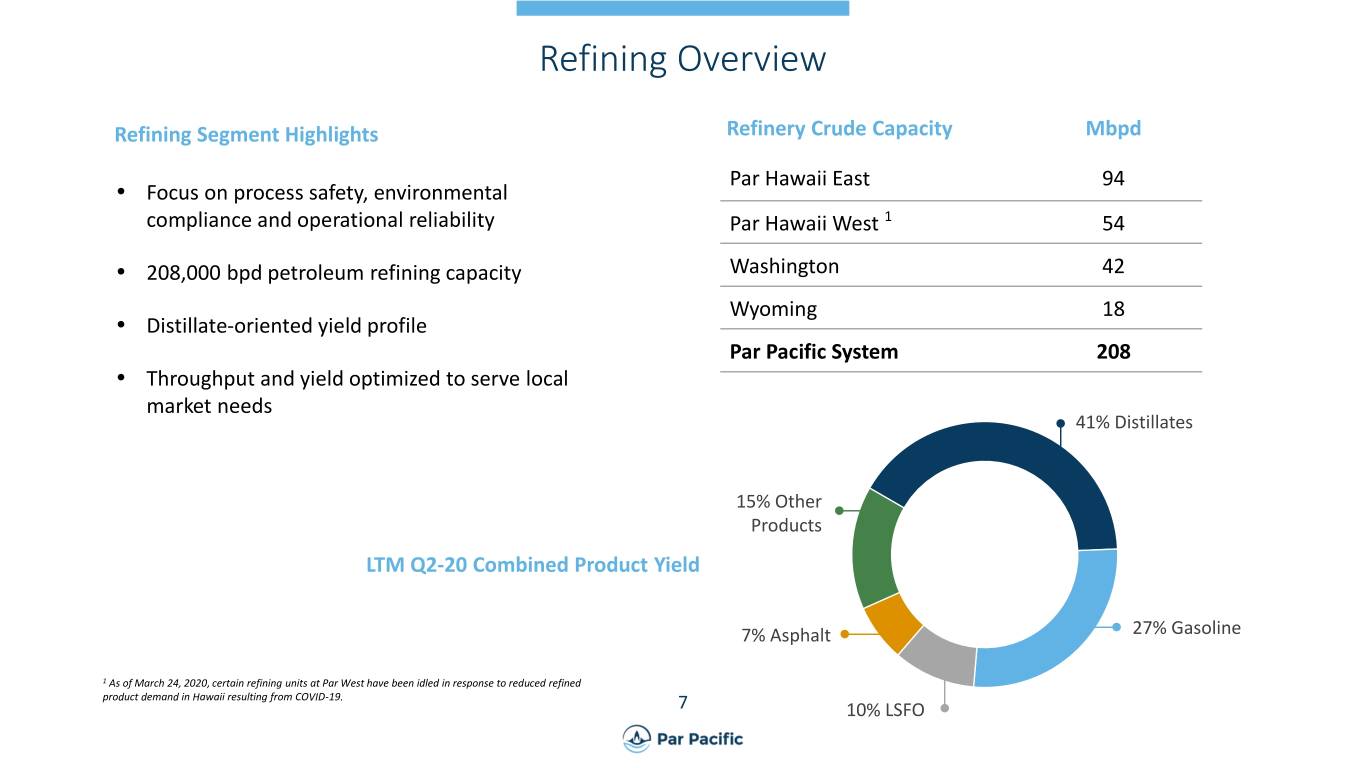
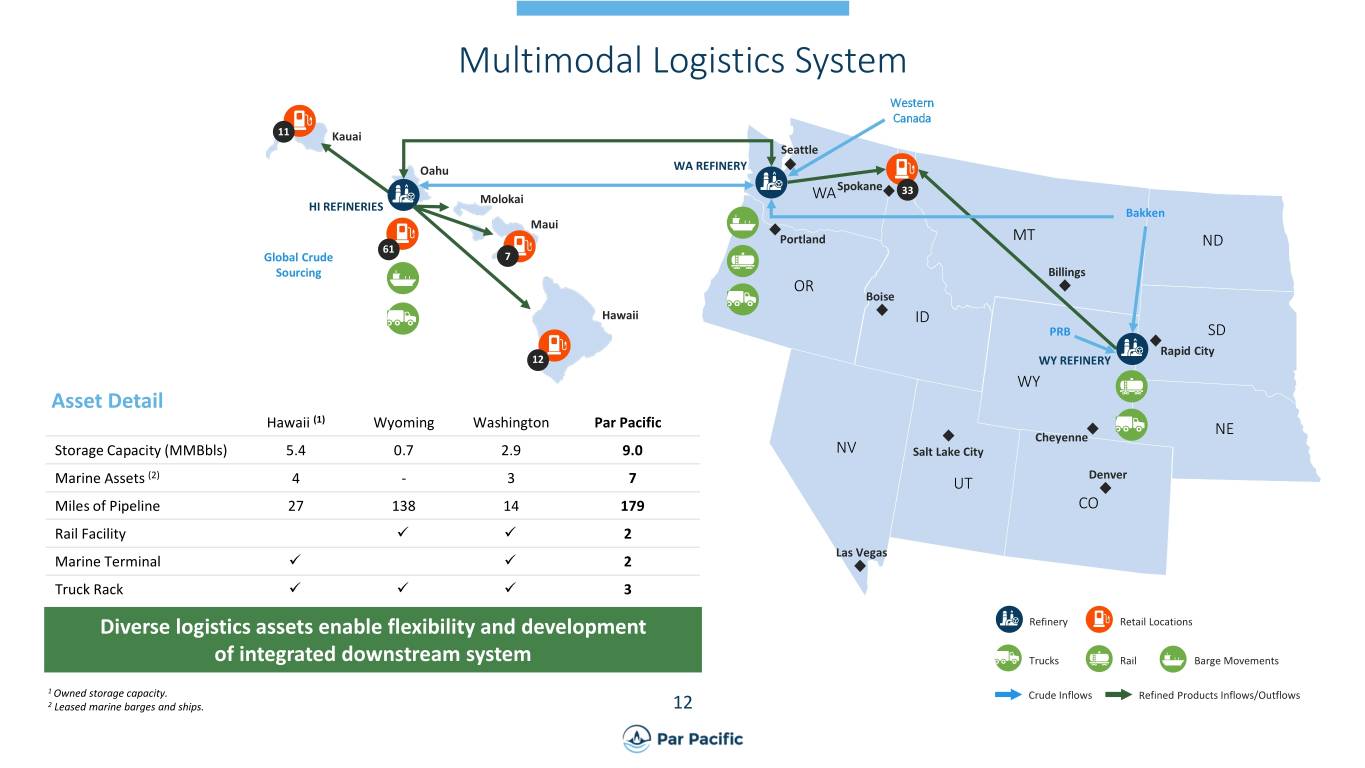
Par Pacific Holdings, Inc. (NYSE: PARR), headquartered in Houston, Texas, owns and operates market-leading energy, infrastructure, and retail businesses. Par Pacific’s strategy is to acquire and develop businesses in logistically complex markets. Par Pacific owns and operates one of the largest energy networks in Hawaii with 148,000 bpd of combined refining capacity, a logistics system supplying the major islands of the state and 91 retail locations. In the Pacific Northwest and the Rockies, Par Pacific owns and operates 60,000 bpd of combined refining capacity, related multimodal logistics systems, and 33 retail locations. Par Pacific also owns 46% of Laramie Energy, LLC, a natural gas production company with operations and assets concentrated in Western Colorado. More information is available at www.parpacific.com.
Forward-Looking Statements
This news release (and oral statements regarding the subject matter of this news release, including those made on the conference call and webcast announced herein) includes certain “forward-looking statements” within the meaning of Section 27A of the Securities Act of 1933, as amended, and Section 21E of the Securities Exchange Act of 1934, as amended, which are intended to qualify for the “safe harbor” from liability established by the Private Securities Litigation Reform Act of 1995. All statements other than statements of historical fact are forward-looking statements. Forward-looking statements include, without limitation, statements about: expected market conditions; expected refinery throughput; anticipated capital expenditures, including major maintenance costs, and their effect on our financial and operating results, including earnings per share and free cash flow; anticipated retail sales volumes and on-island sales; the anticipated financial and operational results of Laramie Energy, LLC; the amount of our discounted net cash flows and the impact of our NOL carryforwards thereon; our ability to identify, acquire and operate energy, related retailing and infrastructure companies with attractive competitive positions; the timing and expected results of certain development projects, including Par Pacific’s investment in an isomerization unit and diesel hydrotreater, as well as the impact of such investments on Par Pacific’s product mix and on-island sales; our expectations regarding the impact of COVID-19 on our business, including turnaround delay and an anticipated reduction in cash outlays, operating expenses, capital expenses and cost of sales; and other risks and uncertainties detailed in Par Pacific’s Annual Report on Form 10-K, Quarterly Reports on Form 10-Q and any other documents that Par Pacific files with the Securities and Exchange Commission (SEC). Additionally, forward looking statements are subject to certain risks, trends, and uncertainties, such as changes to financial condition and liquidity; the volatility of crude oil and refined product prices; operating disruptions at our refineries resulting from unplanned maintenance events or natural disasters; uncertainties inherent in estimating oil, natural gas and NGL reserves; environmental risks; and risks of political or regulatory changes. Par Pacific cannot provide assurances that the assumptions upon which these forward-looking statements are based will prove to have been correct. Should one of these risks materialize, or should underlying assumptions prove incorrect, actual results may vary materially from those expressed or implied in any forward-looking statements, and investors are cautioned not to place undue reliance on these forward-looking statements, which are current only as of this date. Additionally, significant uncertainties remain with respect to COVID-19 and its economic effects. Due to the unpredictable and unprecedented nature of the COVID-19 pandemic, we cannot identify all potential risks to, and impacts on, our business, including the ultimate adverse economic
3
impact to the Company’s results of operations, financial position and liquidity. However, the adverse impact of COVID-19 on the Company has been and will likely continue to be material. There can be no guarantee that the operational and financial measures the Company has taken, and may take in the future, will be fully effective. Par Pacific does not intend to update or revise any forward-looking statements made herein or any other forward-looking statements as a result of new information, future events or otherwise. The Company further expressly disclaims any written or oral statements made by a third party regarding the subject matter of this news release.
Contact:
Ashimi Patel
Manager, Investor Relations
(832) 916-3355
4
Condensed Consolidated Statements of Operations
(Unaudited)
(in thousands, except per share data)
Three Months Ended June 30, | Six Months Ended June 30, | ||||||||||||||
2020 | 2019 | 2020 | 2019 | ||||||||||||
Revenues | $ | 515,301 | $ | 1,409,409 | $ | 1,719,384 | $ | 2,600,744 | |||||||
Operating expenses | |||||||||||||||
Cost of revenues (excluding depreciation) | 441,278 | 1,251,842 | 1,651,489 | 2,312,574 | |||||||||||
Operating expense (excluding depreciation) | 67,027 | 74,830 | 140,418 | 148,504 | |||||||||||
Depreciation, depletion, and amortization | 22,128 | 21,919 | 43,411 | 42,876 | |||||||||||
Impairment expense | — | — | 67,922 | — | |||||||||||
General and administrative expense (excluding depreciation) | 10,221 | 11,379 | 22,005 | 23,044 | |||||||||||
Acquisition and integration costs | 90 | 818 | 755 | 3,702 | |||||||||||
Total operating expenses | 540,744 | 1,360,788 | 1,926,000 | 2,530,700 | |||||||||||
Operating income (loss) | (25,443 | ) | 48,621 | (206,616 | ) | 70,044 | |||||||||
Other income (expense) | |||||||||||||||
Interest expense and financing costs, net | (16,414 | ) | (20,278 | ) | (35,088 | ) | (38,988 | ) | |||||||
Debt extinguishment and commitment costs | — | (3,690 | ) | — | (9,186 | ) | |||||||||
Other income, net | 455 | 2,177 | 479 | 2,264 | |||||||||||
Change in value of common stock warrants | — | (957 | ) | 4,270 | (2,239 | ) | |||||||||
Equity earnings (losses) from Laramie Energy, LLC | (1,874 | ) | 491 | (46,905 | ) | 792 | |||||||||
Total other income (expense), net | (17,833 | ) | (22,257 | ) | (77,244 | ) | (47,357 | ) | |||||||
Income (loss) before income taxes | (43,276 | ) | 26,364 | (283,860 | ) | 22,687 | |||||||||
Income tax benefit (expense) | 2,716 | 1,805 | 20,963 | 66,574 | |||||||||||
Net income (loss) | $ | (40,560 | ) | $ | 28,169 | $ | (262,897 | ) | $ | 89,261 | |||||
Weighted-average shares outstanding | |||||||||||||||
Basic | 53,265 | 49,960 | 53,246 | 49,529 | |||||||||||
Diluted | 53,265 | 50,074 | 53,246 | 55,580 | |||||||||||
Income (loss) per share | |||||||||||||||
Basic | $ | (0.76 | ) | $ | 0.56 | $ | (4.94 | ) | $ | 1.78 | |||||
Diluted | $ | (0.76 | ) | $ | 0.56 | $ | (4.94 | ) | $ | 1.75 | |||||
Balance Sheet Data
(Unaudited)
(in thousands)
June 30, 2020 | December 31, 2019 | ||||||
Balance Sheet Data | |||||||
Cash and cash equivalents | $ | 142,869 | $ | 126,015 | |||
Working capital (1) | (171,184 | ) | (115,866 | ) | |||
Debt, including current portion | 712,446 | 611,931 | |||||
Total stockholders’ equity | 392,476 | 648,242 | |||||
________________________________________
(1) | Working capital is calculated as (i) total current assets, excluding cash and cash equivalents less (ii) total current liabilities, excluding current portion of long-term debt. Total current assets include inventories stated at the lower of cost or net realizable value. |
5
Operating Statistics
The following table summarizes key operational data:
Three Months Ended June 30, | Six Months Ended June 30, | ||||||||||||||
2020 | 2019 | 2020 | 2019 | ||||||||||||
Total Refining Segment | |||||||||||||||
Feedstocks Throughput (Mbpd) (1) | 115.5 | 172.9 | 133.5 | 167.6 | |||||||||||
Refined product sales volume (Mbpd) (1) | 119.3 | 176.4 | 149.5 | 171.1 | |||||||||||
Hawaii Refineries | |||||||||||||||
Combined Feedstocks Throughput (Mbpd) | 66.5 | 116.2 | 80.7 | 114.6 | |||||||||||
Par East Throughput (Mbpd) | 66.5 | 75.8 | 68.1 | 74.2 | |||||||||||
Par West Throughput (Mbpd) | — | 40.4 | 12.6 | 40.4 | |||||||||||
Yield (% of total throughput) | |||||||||||||||
Gasoline and gasoline blendstocks | 23.6 | % | 23.1 | % | 24.3 | % | 22.9 | % | |||||||
Distillates | 40.8 | % | 44.5 | % | 45.1 | % | 43.7 | % | |||||||
Fuel oils | 29.0 | % | 24.3 | % | 26.4 | % | 26.6 | % | |||||||
Other products | 2.9 | % | 5.2 | % | 0.2 | % | 3.5 | % | |||||||
Total yield | 96.3 | % | 97.1 | % | 96.0 | % | 96.7 | % | |||||||
Refined product sales volume (Mbpd) | |||||||||||||||
On-island sales volume | 69.1 | 113.5 | 94.3 | 110.2 | |||||||||||
Exports sales volume | — | 4.4 | — | 5.0 | |||||||||||
Total refined product sales volume | 69.1 | 117.9 | 94.3 | 115.2 | |||||||||||
Adjusted Gross Margin per bbl ($/throughput bbl) (2) | $ | (6.96 | ) | $ | 3.46 | $ | (2.73 | ) | $ | 3.60 | |||||
Production costs per bbl ($/throughput bbl) (3) | 4.45 | 2.82 | 3.81 | 2.82 | |||||||||||
DD&A per bbl ($/throughput bbl) | 0.48 | 0.43 | 0.39 | 0.43 | |||||||||||
Washington Refinery | |||||||||||||||
Feedstocks Throughput (Mbpd) (1) | 35.9 | 39.1 | 38.4 | 38.2 | |||||||||||
Yield (% of total throughput) | |||||||||||||||
Gasoline and gasoline blendstocks | 23.4 | % | 24.1 | % | 23.7 | % | 24.1 | % | |||||||
Distillate | 34.9 | % | 35.2 | % | 35.7 | % | 35.8 | % | |||||||
Asphalt | 19.2 | % | 18.8 | % | 18.8 | % | 17.6 | % | |||||||
Other products | 18.3 | % | 19.2 | % | 19.2 | % | 19.9 | % | |||||||
Total yield | 95.8 | % | 97.3 | % | 97.4 | % | 97.4 | % | |||||||
Refined product sales volume (Mbpd) (1) | 36.9 | 40.9 | 40.3 | 40.9 | |||||||||||
Adjusted Gross Margin per bbl ($/throughput bbl) (2) | $ | 3.78 | $ | 9.76 | $ | 7.06 | $ | 9.81 | |||||||
Production costs per bbl ($/throughput bbl) (3) | 3.76 | 4.42 | 3.57 | 4.63 | |||||||||||
DD&A per bbl ($/throughput bbl) | 1.49 | 1.50 | 1.46 | 1.67 | |||||||||||
Wyoming Refinery | |||||||||||||||
Feedstocks Throughput (Mbpd) | 13.1 | 17.6 | 14.4 | 16.9 | |||||||||||
Yield (% of total throughput) | |||||||||||||||
Gasoline and gasoline blendstocks | 45.7 | % | 48.0 | % | 48.6 | % | 50.2 | % | |||||||
Distillate | 47.8 | % | 45.5 | % | 46.1 | % | 43.7 | % | |||||||
Fuel oils | 2.1 | % | 1.6 | % | 1.8 | % | 1.7 | % | |||||||
Other products | 2.0 | % | 2.8 | % | 1.2 | % | 1.9 | % | |||||||
6
Three Months Ended June 30, | Six Months Ended June 30, | ||||||||||||||
2020 | 2019 | 2020 | 2019 | ||||||||||||
Wyoming Refinery (continued) | |||||||||||||||
Total yield | 97.6 | % | 97.9 | % | 97.7 | % | 97.5 | % | |||||||
Refined product sales volume (Mbpd) | 13.3 | 17.6 | 14.9 | 17.3 | |||||||||||
Adjusted Gross Margin per bbl ($/throughput bbl) (2) | $ | 6.22 | $ | 16.78 | $ | 2.39 | $ | 15.72 | |||||||
Production costs per bbl ($/throughput bbl) (3) | 7.72 | 5.58 | 7.06 | 6.59 | |||||||||||
DD&A per bbl ($/throughput bbl) | 4.13 | 2.97 | 3.73 | 2.82 | |||||||||||
Market Indices ($ per barrel) | |||||||||||||||
3-1-2 Singapore Crack Spread (4) | $ | (0.14 | ) | $ | 9.39 | $ | 3.99 | $ | 9.27 | ||||||
Pacific Northwest 5-2-2-1 Index (5) | 11.92 | 17.14 | 12.58 | 14.31 | |||||||||||
Wyoming 3-2-1 Index (6) | 17.39 | 28.89 | 16.62 | 22.03 | |||||||||||
Crude Prices | |||||||||||||||
Brent crude price | $ | 33.39 | $ | 68.47 | $ | 42.10 | $ | 66.16 | |||||||
WTI crude price | 28.00 | 59.91 | 36.99 | 57.42 | |||||||||||
ANS | 28.17 | 69.40 | 40.22 | 66.76 | |||||||||||
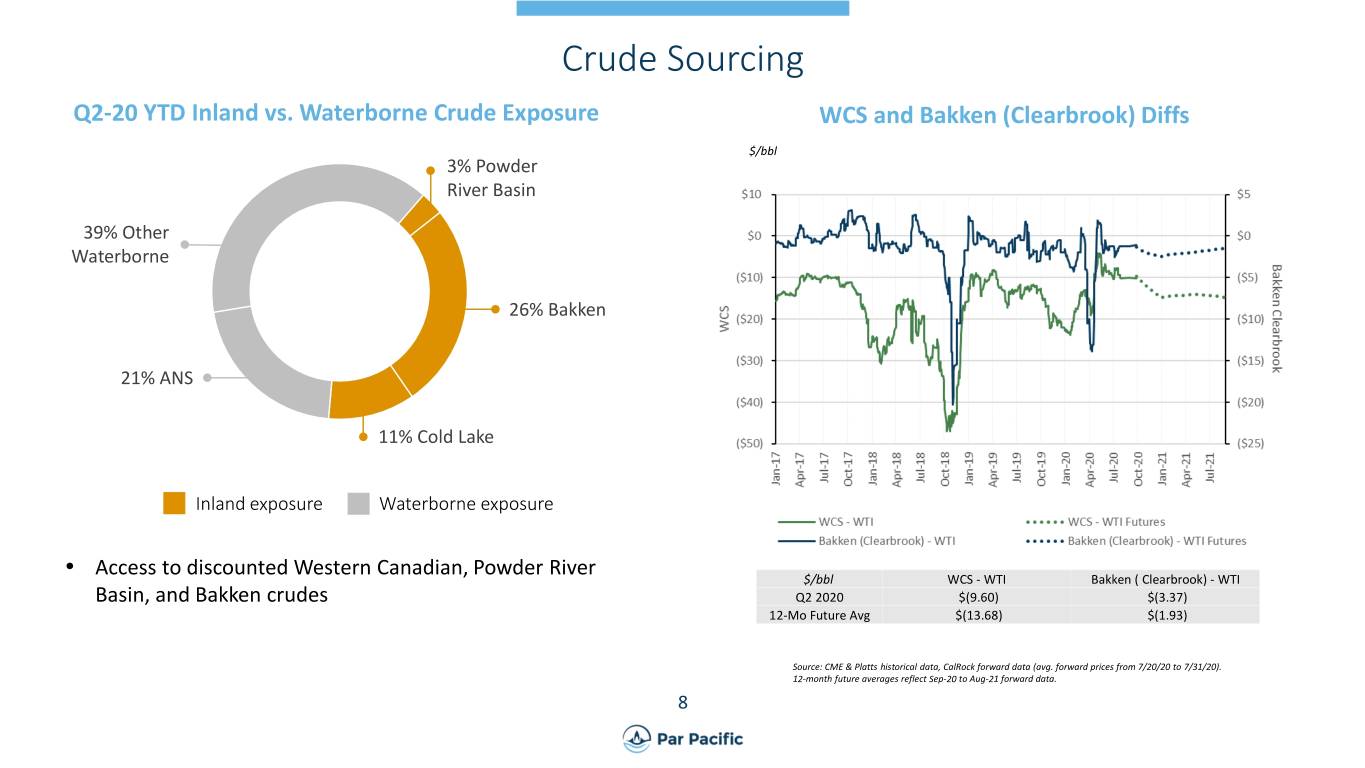
Bakken Clearbrook | 24.63 | 58.49 | 33.65 | 56.68 | |||||||||||
WCS Hardisty | 18.40 | 47.35 | 23.18 | 45.82 | |||||||||||
Brent M1-M3 | (2.19 | ) | 1.42 | (1.37 | ) | 0.75 | |||||||||
Retail Segment | |||||||||||||||
Retail sales volumes (thousands of gallons) | 22,586 | 31,810 | 51,027 | 61,544 | |||||||||||
________________________________________
(1) | Feedstocks throughput and sales volumes per day for the Washington refinery for the three and six months ended June 30, 2019 are calculated based on the 91 and 171-day periods for which we owned the Washington refinery in 2019, respectively. As such, the amounts for the total refining segment represent the sum of the Hawaii and Wyoming refineries’ throughput or sales volumes averaged over the three and six months ended June 30, 2019 plus the Washington refinery’s throughput or sales volumes averaged over the periods from April 1, 2019 to June 30, 2019 and January 11, 2019 to June 30, 2019, respectively. The 2020 amounts for the total refining segment represent the sum of the Hawaii, Washington, and Wyoming refineries’ throughput or sales volumes averaged over the three and six months ended June 30, 2020. |
(2) | We calculate Adjusted Gross Margin per barrel by dividing Adjusted Gross Margin by total refining throughput. Adjusted Gross Margin for our Washington refinery is determined under the last-in, first-out (“LIFO”) inventory costing method. Adjusted Gross Margin for our other refineries is determined under the under the first-in, first-out (“FIFO”) inventory costing method. Please see discussion of Adjusted Gross Margin below. |
(3) | Management uses production costs per barrel to evaluate performance and compare efficiency to other companies in the industry. There are a variety of ways to calculate production costs per barrel; different companies within the industry calculate it in different ways. We calculate production costs per barrel by dividing all direct production costs, which include the costs to run the refinery including personnel costs, repair and maintenance costs, insurance, utilities, and other miscellaneous costs, by total refining throughput. Our production costs are included in Operating expense (excluding depreciation) on our condensed consolidated statement of operations, which also includes costs related to our bulk marketing operations. |
(4) | After completing the acquisition of certain refining units from Island Energy Services on December 19, 2018, we began shifting our Hawaii production profile to supply the local utilities with low sulfur fuel oil and significantly reduced our high sulfur fuel oil yield. In 2020, following the implementation of IMO 2020, we established the 3-1-2 Singapore Crack Spread, or three barrels of Brent crude oil converted into one barrel of gasoline and two barrels of distillates (diesel and jet fuel), as a new benchmark for our Hawaii operations. By removing the high sulfur fuel oil reference in the index, we believe the 3-1-2 Singapore Crack Spread is the most representative market indicator of our current operations in Hawaii. |
(5) | We believe the Pacific Northwest 5-2-2-1 Index is the most representative market indicator for our operations in Tacoma, Washington. The Pacific Northwest 5-2-2-1 Index is computed by taking two parts gasoline (sub-octane), two parts middle distillates (ULSD and jet fuel), and one-part fuel oil as created from a barrel of Alaskan North Slope crude. The 2019 price |
7
for the three and six months ended June 30, 2019 represents the price averaged over the period from April 1, 2019 to June 30, 2019 and January 11, 2019 to June 30, 2019, respectively.
(6) | The profitability of our Wyoming refinery is heavily influenced by crack spreads in nearby markets. We believe the Wyoming 3-2-1 Index is the most representative market indicator for our operations in Wyoming. The Wyoming 3-2-1 Index is computed by taking two parts gasoline and one-part distillate (ULSD) as created from three barrels of West Texas Intermediate Crude Oil (“WTI”). Pricing is based 50% on applicable product pricing in Rapid City, South Dakota, and 50% on applicable product pricing in Denver, Colorado. |
Non-GAAP Performance Measures
Management uses certain financial measures to evaluate our operating performance that are considered non-GAAP financial measures. These measures should not be considered a substitute for, or superior to, measures of financial performance prepared in accordance with GAAP and our calculations thereof may not be comparable to similarly titled measures reported by other companies.
Adjusted Gross Margin
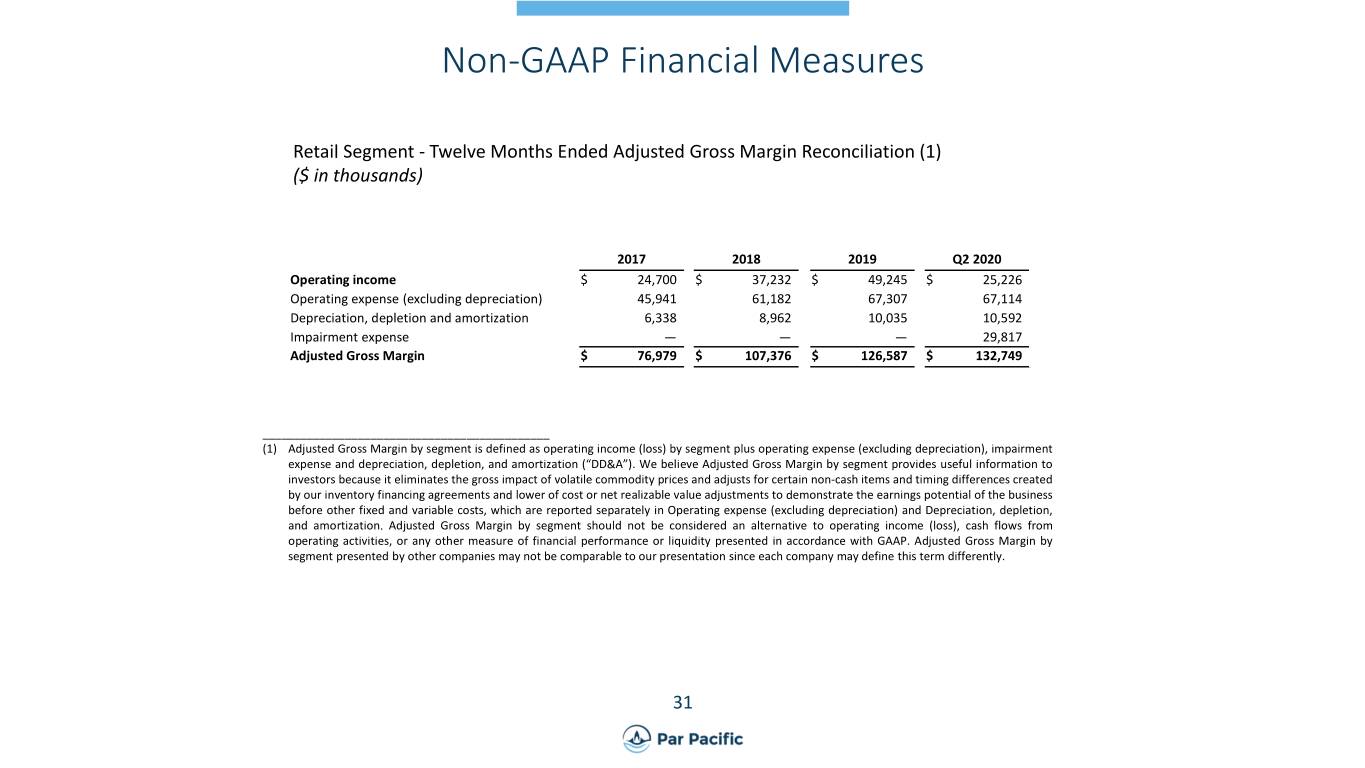
Adjusted Gross Margin is defined as (i) operating income (loss) plus operating expense (excluding depreciation); impairment expense; inventory valuation adjustment (which adjusts for timing differences to reflect the economics of our inventory financing agreements, including lower of cost or net realizable value adjustments, the impact of the embedded derivative repurchase and terminal obligations, and purchase price allocation adjustments); depreciation, depletion, and amortization (“DD&A”); Renewable Identification Numbers (“RINs”) loss (gain) in excess of net obligation (which represents the income statement effect of reflecting our RINs liability on a net basis); and unrealized loss (gain) on derivatives or (ii) revenues less cost of revenues (excluding depreciation) plus inventory valuation adjustment, unrealized loss (gain) on derivatives, and RINs loss (gain) in excess of net obligation. We define cost of revenues (excluding depreciation) as the hydrocarbon-related costs of inventory sold, transportation costs of delivering product to customers, crude oil consumed in the refining process, costs to satisfy our RINs and environmental credit obligations, and certain hydrocarbon fees and taxes. Cost of revenues (excluding depreciation) also includes the unrealized gain (loss) on derivatives and the inventory valuation adjustment that we exclude from Adjusted Gross Margin. Beginning in the second quarter of 2020, Adjusted Gross Margin also includes the contango gains and backwardation (losses) associated with our Washington inventory and intermediation obligation. Prior to the second quarter of 2020, contango gains and backwardation (losses) captured by our Washington intermediation agreement were excluded from Adjusted Net Income (as part of the inventory valuation adjustment). This change in our presentation was made to reflect the favorable or unfavorable impact of the market structure on the profitability of our Washington refinery consistent with the presentation of such impacts on our other refineries. We have recast the non-GAAP information for the three and six months ended June 30, 2019 to conform to the current period presentation.
Management believes Adjusted Gross Margin is an important measure of operating performance and uses Adjusted Gross Margin per barrel to evaluate operating performance and compare profitability to other companies in the industry and to industry benchmarks. Management believes Adjusted Gross Margin provides useful information to investors because it eliminates the gross impact of volatile commodity prices and adjusts for certain non-cash items and timing differences created by our inventory financing agreements and lower of cost or net realizable value adjustments to demonstrate the earnings of the business before other fixed and variable costs, which are reported separately in Operating expense (excluding depreciation) and Depreciation, depletion, and amortization.
Adjusted Gross Margin should not be considered an alternative to operating income (loss), cash flows from operating activities, or any other measure of financial performance or liquidity presented in accordance with GAAP. Adjusted Gross Margin presented by other companies may not be comparable to our presentation since each company may define this term differently as they may include other manufacturing costs and depreciation expense in cost of revenues.
The following tables present a reconciliation of Adjusted Gross Margin to the most directly comparable GAAP financial measure, operating income (loss), on a historical basis, for selected segments, for the periods indicated (in thousands):
8
Three months ended June 30, 2020 | Refining | Logistics | Retail | ||||||||
Operating income (loss) | $ | (36,757 | ) | $ | 6,303 | $ | 16,180 | ||||
Operating expense (excluding depreciation) | 49,385 | 2,247 | 15,395 | ||||||||
Depreciation, depletion, and amortization | 12,706 | 5,902 | 2,664 | ||||||||
Inventory valuation adjustment | (35,979 | ) | — | — | |||||||
RINs loss (gain) in excess of net obligation | 10,738 | — | — | ||||||||
Unrealized loss (gain) on derivatives | (22,431 | ) | — | — | |||||||
Adjusted Gross Margin (1) | $ | (22,338 | ) | $ | 14,452 | $ | 34,239 | ||||
Three months ended June 30, 2019 | Refining | Logistics | Retail | ||||||||
Operating income (loss) | $ | 33,185 | $ | 16,371 | $ | 12,026 | |||||
Operating expense (excluding depreciation) | 55,393 | 3,028 | 16,409 | ||||||||
Depreciation, depletion, and amortization | 14,613 | 3,989 | 2,532 | ||||||||
Inventory valuation adjustment | (22,102 | ) | — | — | |||||||
RINs loss (gain) in excess of net obligation | 2,713 | — | — | ||||||||
Unrealized loss (gain) on derivatives | 14,379 | — | — | ||||||||
Adjusted Gross Margin (1) | $ | 98,181 | $ | 23,388 | $ | 30,967 | |||||
Six Months Ended June 30, 2020 | Refining | Logistics | Retail | ||||||||
Operating income (loss) | $ | (205,327 | ) | $ | 25,079 | $ | (1,929 | ) | |||
Operating expense (excluding depreciation) | 101,629 | 6,518 | 32,271 | ||||||||
Depreciation, depletion, and amortization | 25,700 | 10,569 | 5,463 | ||||||||
Impairment expense | 38,105 | — | 29,817 | ||||||||
Inventory valuation adjustment | 39,345 | — | — | ||||||||
RINs loss (gain) in excess of net obligation | 17,340 | — | — | ||||||||
Unrealized loss (gain) on derivatives | 445 | — | — | ||||||||
Adjusted Gross Margin | $ | 17,237 | $ | 42,166 | $ | 65,622 | |||||
Six Months Ended June 30, 2019 | Refining | Logistics | Retail | ||||||||
Operating income | $ | 47,548 | $ | 28,790 | $ | 22,090 | |||||
Operating expense (excluding depreciation) | 110,648 | 5,392 | 32,464 | ||||||||
Depreciation, depletion, and amortization | 28,491 | 7,885 | 4,906 | ||||||||
Inventory valuation adjustment | (18,804 | ) | — | — | |||||||
RINs loss (gain) in excess of net obligation | (1,799 | ) | — | — | |||||||
Unrealized loss (gain) on derivatives | 20,677 | — | — | ||||||||
Adjusted Gross Margin (1) | $ | 186,761 | $ | 42,067 | $ | 59,460 | |||||
________________________________________
(1) | There were no impairment losses recorded in Operating income (loss) by segment for the three months ended June 30, 2020 and the three and six months ended June 30, 2019. |
Adjusted Net Income (Loss) and Adjusted EBITDA
Adjusted Net Income (Loss) is defined as Net income (loss) excluding changes in the value of contingent consideration and common stock warrants, acquisition and integration costs, unrealized (gain) loss on derivatives, debt extinguishment and commitment costs, increase in (release of) tax valuation allowance and other deferred tax items, inventory valuation adjustment, severance costs, impairment expense, (gain) loss on sale of assets, Par’s share of Laramie Energy’s unrealized loss (gain) on derivatives, RINs loss (gain) in excess of net obligation, and impairment expense associated with our investment in Laramie Energy and our share of Laramie Energy’s asset impairment losses in excess of our basis difference. As noted above, beginning in the second quarter of 2020, Adjusted Net Income (Loss) also includes the contango gains and backwardation (losses) associated with our Washington inventory and intermediation obligation. Prior to the second quarter of 2020, contango gains and backwardation (losses) captured by our Washington intermediation agreement were excluded from Adjusted Net Income (as part of the inventory valuation adjustment). This change in our presentation was made to reflect the favorable or unfavorable impact of the market structure on the profitability of our Washington refinery consistent with the presentation of such impacts on our other refineries. We have recast the non-GAAP information for the three and six months ended June 30, 2019 to conform to the current period presentation.
Adjusted EBITDA is Adjusted Net Income (Loss) excluding interest expense and financing costs, income taxes, DD&A, and equity losses (earnings) from Laramie Energy, excluding Par’s share of Laramie’s unrealized loss (gain) on derivatives, the impairment of Par’s investment, and our share of Laramie Energy’s asset impairment losses in excess of our basis difference.
9
We believe Adjusted Net Income (Loss) and Adjusted EBITDA are useful supplemental financial measures that allow investors to assess:
• | The financial performance of our assets without regard to financing methods, capital structure, or historical cost basis; |
• | The ability of our assets to generate cash to pay interest on our indebtedness; and |
• | Our operating performance and return on invested capital as compared to other companies without regard to financing methods and capital structure. |
Adjusted Net Income (Loss) and Adjusted EBITDA should not be considered in isolation, or as a substitute for, operating income (loss), net income (loss), cash flows provided by operating, investing, and financing activities, or other income or cash flow statement data prepared in accordance with GAAP. Adjusted Net Income (Loss) and Adjusted EBITDA presented by other companies may not be comparable to our presentation as other companies may define these terms differently.
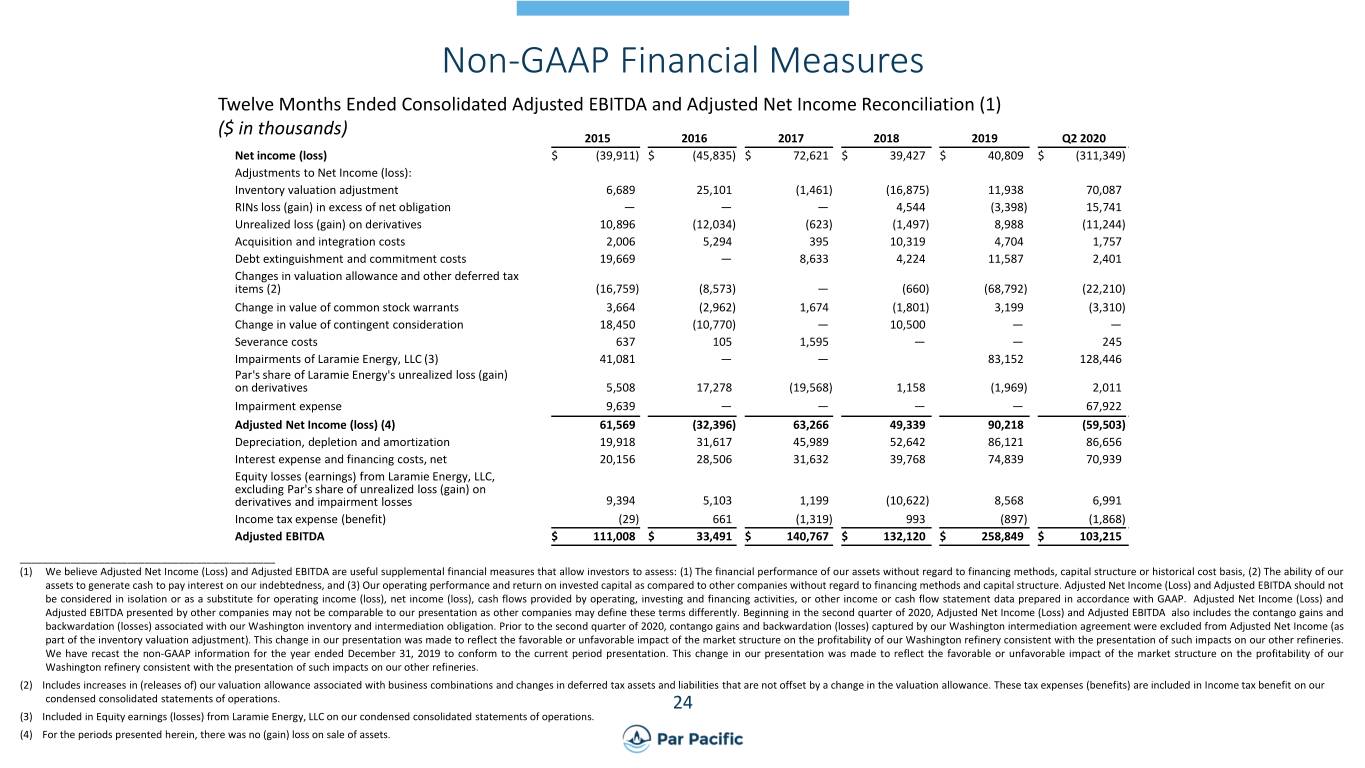
The following table presents a reconciliation of Adjusted Net Income (Loss) and Adjusted EBITDA to the most directly comparable GAAP financial measure, net income (loss), on a historical basis for the periods indicated (in thousands):
Three Months Ended June 30, | Six Months Ended June 30, | ||||||||||||||
2020 | 2019 | 2020 | 2019 | ||||||||||||
Net income (loss) | $ | (40,560 | ) | $ | 28,169 | $ | (262,897 | ) | $ | 89,261 | |||||
Inventory valuation adjustment | (35,979 | ) | (22,102 | ) | 39,345 | (18,804 | ) | ||||||||
RINs loss (gain) in excess of net obligation | 10,738 | 2,713 | 17,340 | (1,799 | ) | ||||||||||
Unrealized loss (gain) on derivatives | (22,431 | ) | 14,335 | 445 | 20,677 | ||||||||||
Acquisition and integration costs | 90 | 818 | 755 | 3,702 | |||||||||||
Debt extinguishment and commitment costs | — | 3,690 | — | 9,186 | |||||||||||
Changes in valuation allowance and other deferred tax items (1) | (2,714 | ) | (2,318 | ) | (21,087 | ) | (67,669 | ) | |||||||
Change in value of common stock warrants | — | 957 | (4,270 | ) | 2,239 | ||||||||||
Severance costs | 96 | — | 245 | — | |||||||||||
Impairment expense | — | — | 67,922 | — | |||||||||||
Impairment of Investment in Laramie Energy, LLC (2) | — | — | 45,294 | — | |||||||||||
Par’s share of Laramie Energy’s unrealized loss (gain) on derivatives (2) | — | (3,859 | ) | (1,110 | ) | (5,090 | ) | ||||||||
Adjusted Net Income (Loss) (3) | (90,760 | ) | 22,403 | (118,018 | ) | 31,703 | |||||||||
Depreciation, depletion, and amortization | 22,128 | 21,919 | 43,411 | 42,876 | |||||||||||
Interest expense and financing costs, net | 16,414 | 20,278 | 35,088 | 38,988 | |||||||||||
Equity losses (earnings) from Laramie Energy, LLC, excluding Par’s share of unrealized loss (gain) on derivatives and impairment losses | 1,874 | 3,368 | 2,721 | 4,298 | |||||||||||
Income tax expense (benefit) | (2 | ) | 513 | 124 | 1,095 | ||||||||||
Adjusted EBITDA | $ | (50,346 | ) | $ | 68,481 | $ | (36,674 | ) | $ | 118,960 | |||||
___________________________________
(1) | Includes increases in (releases of) our valuation allowance associated with business combinations and changes in deferred tax assets and liabilities that are not offset by a change in the valuation allowance. These tax expenses (benefits) are included in Income tax benefit on our consolidated statements of operations. |
(2) | Included in Equity earnings (losses) from Laramie Energy, LLC on our condensed consolidated statements of operations. |
(3) | For the three and six months ended June 30, 2020 and 2019, there was no (gain) loss on sale of assets or change in value of contingent consideration. |
10
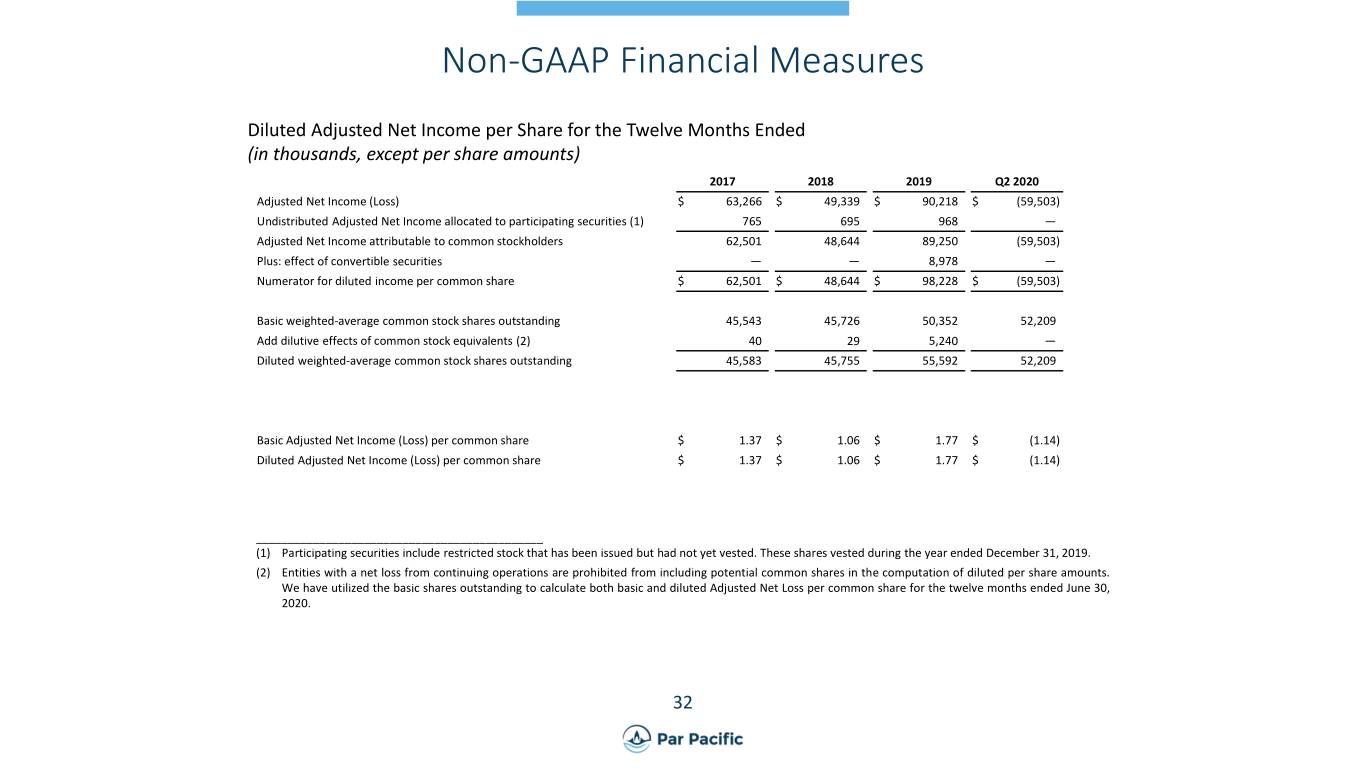
The following table sets forth the computation of basic and diluted Adjusted Net Income (Loss) per share (in thousands, except per share amounts):
Three Months Ended June 30, | Six Months Ended June 30, | ||||||||||||||
2020 | 2019 | 2020 | 2019 | ||||||||||||
Adjusted Net Income (loss) | $ | (90,760 | ) | $ | 22,403 | $ | (118,018 | ) | $ | 31,703 | |||||
Undistributed Adjusted Net Income allocated to participating securities (1) | — | 258 | — | 363 | |||||||||||
Adjusted Net Income attributable to common stockholders | (90,760 | ) | 22,145 | (118,018 | ) | 31,340 | |||||||||
Plus: effect of convertible securities | — | 2,452 | — | — | |||||||||||
Numerator for diluted income per common share | $ | (90,760 | ) | $ | 24,597 | $ | (118,018 | ) | $ | 31,340 | |||||
Basic weighted-average common stock shares outstanding | 53,265 | 49,960 | 53,246 | 49,529 | |||||||||||
Add dilutive effects of common stock equivalents (2) | — | 5,712 | — | 69 | |||||||||||
Diluted weighted-average common stock shares outstanding | 53,265 | 55,672 | 53,246 | 49,598 | |||||||||||
Basic Adjusted Net Income (loss) per common share | $ | (1.70 | ) | $ | 0.44 | $ | (2.22 | ) | $ | 0.63 | |||||
Diluted Adjusted Net Income (loss) per common share | $ | (1.70 | ) | $ | 0.44 | $ | (2.22 | ) | $ | 0.63 | |||||
________________________________________
(1) | Participating securities include restricted stock that has been issued but has not yet vested during the three and six months ended June 30, 2019. These shares vested during the year ended December 31, 2019. |
(2) | Entities with a net loss from continuing operations are prohibited from including potential common shares in the computation of diluted per share amounts. We have utilized the basic shares outstanding to calculate both basic and diluted Adjusted Net Loss per common share for the three and six months ended June 30, 2020. |
Adjusted EBITDA by Segment
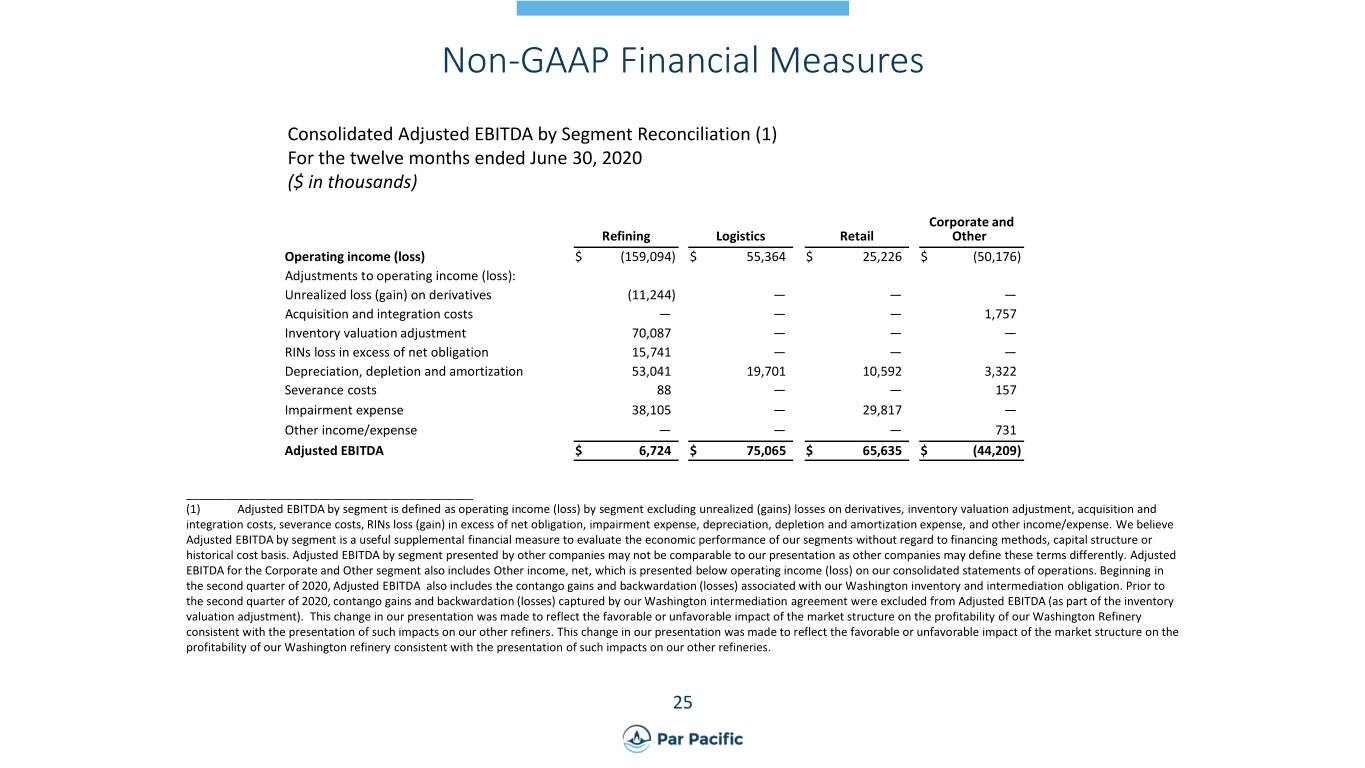
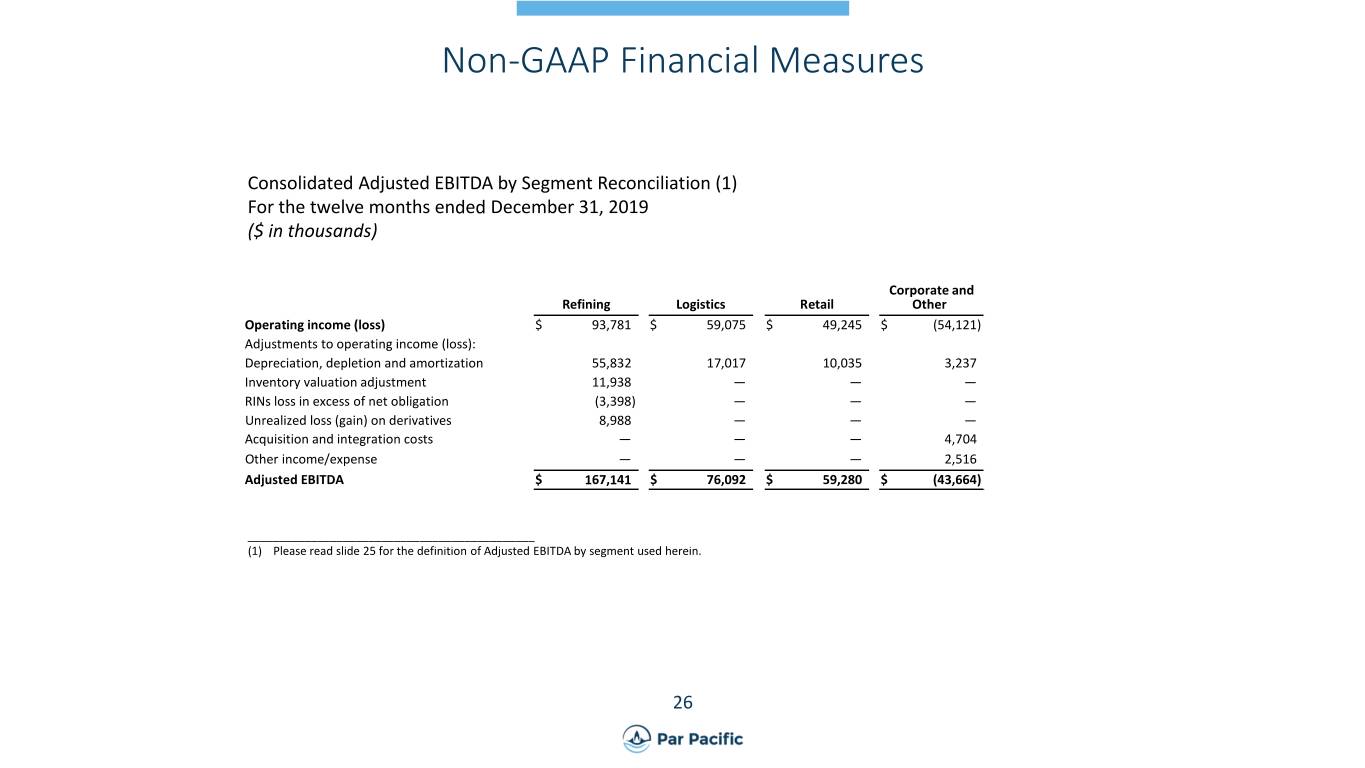
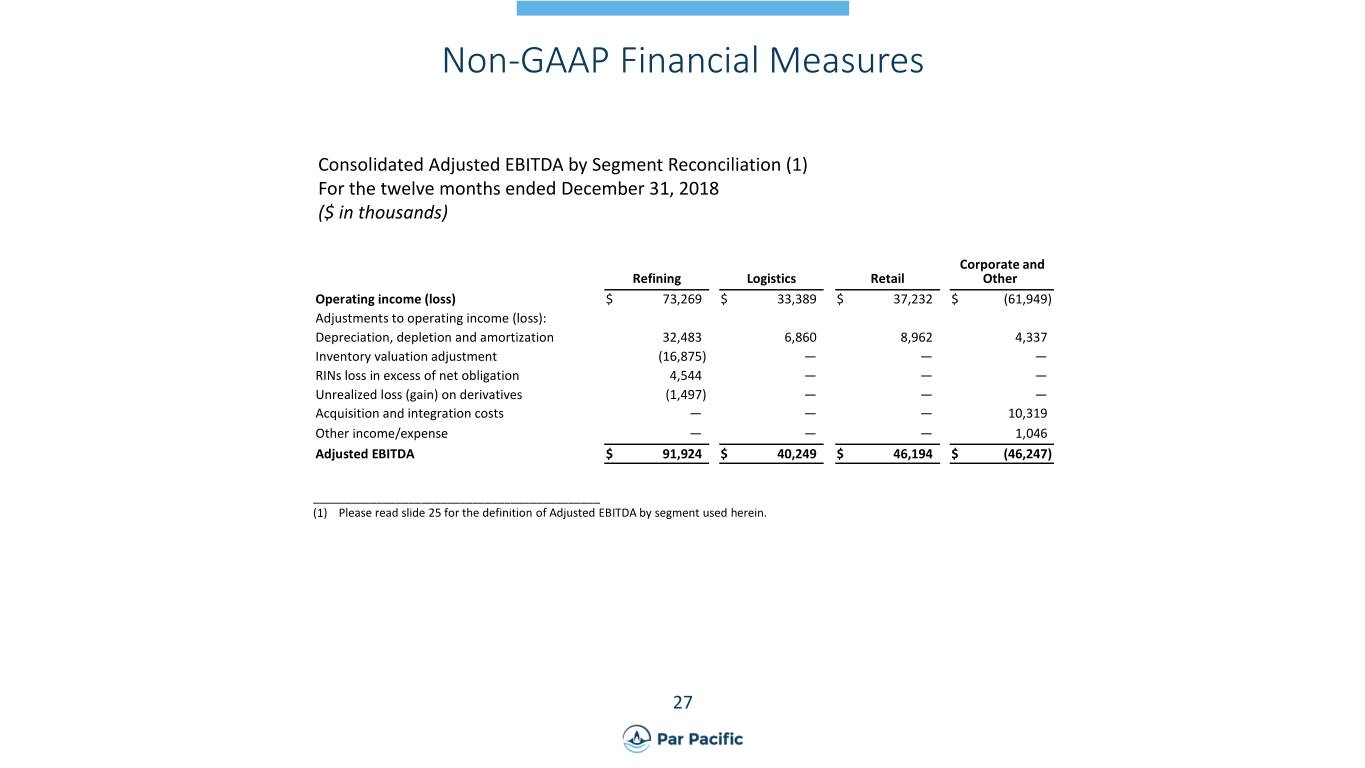
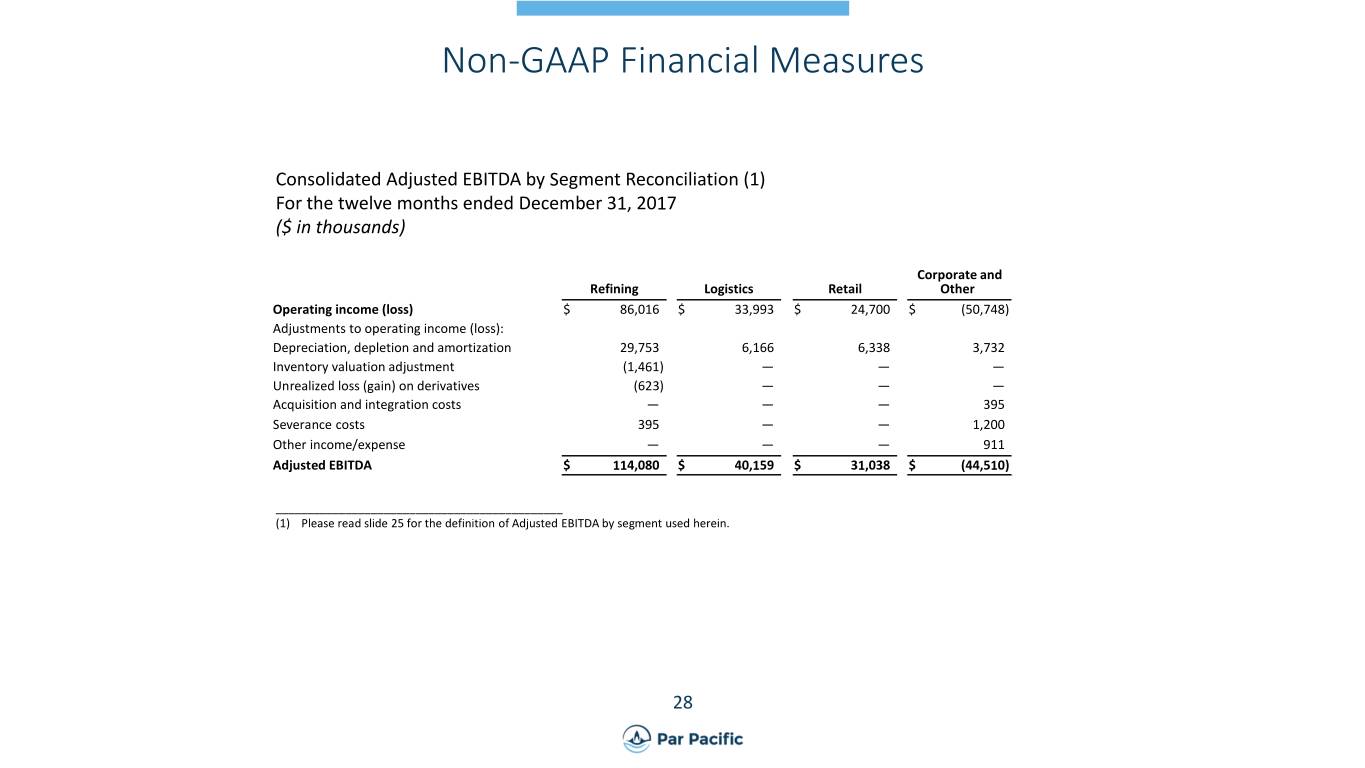
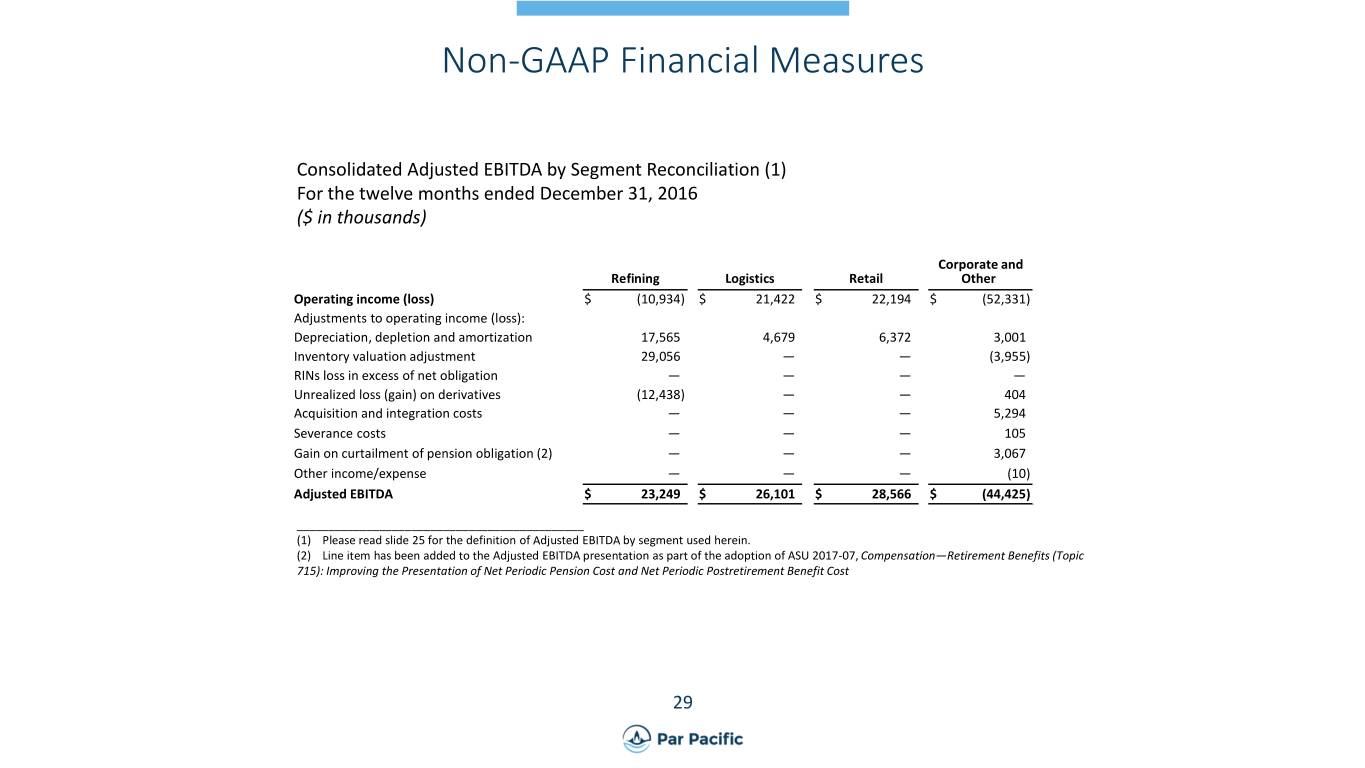
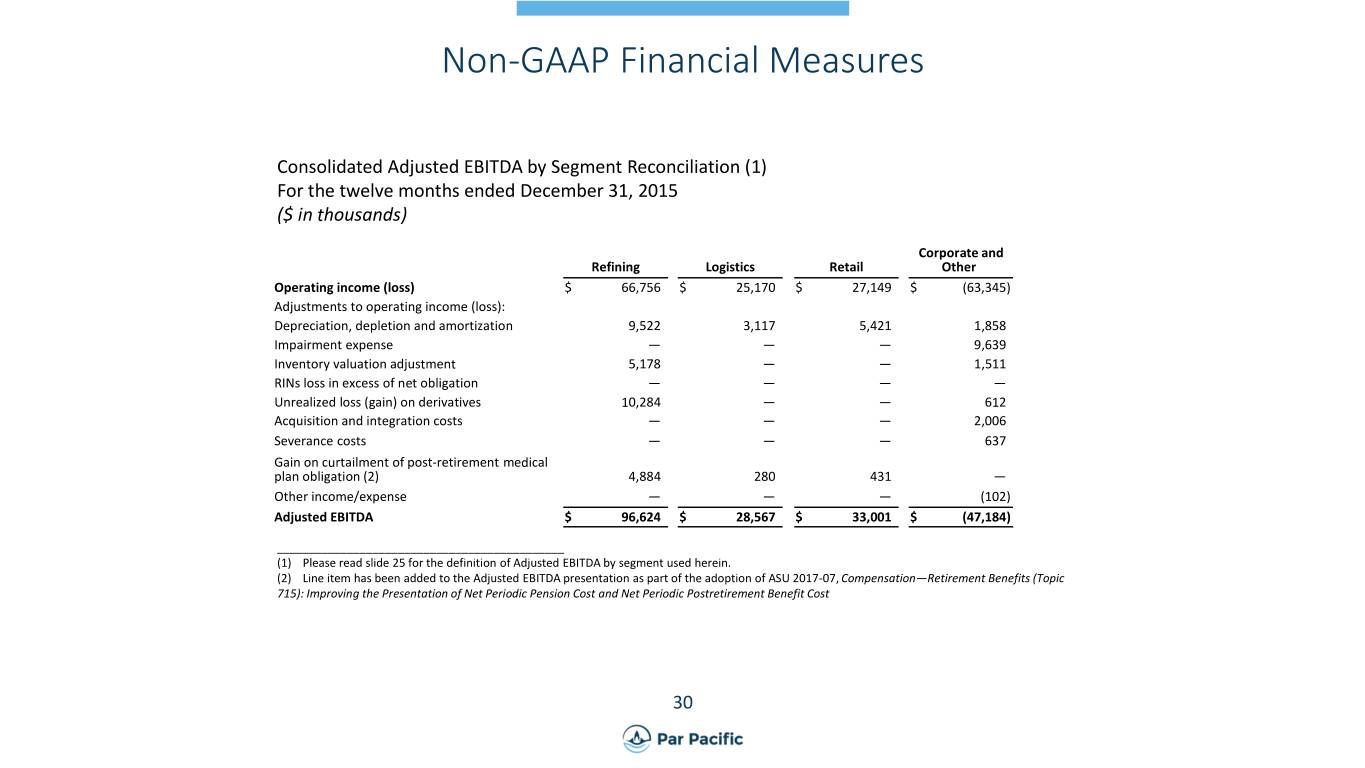
Adjusted EBITDA by segment is defined as Operating income (loss) by segment excluding depreciation, depletion, and amortization expense, inventory valuation adjustment, unrealized loss (gain) on derivatives, severance costs, impairment expense, acquisition and integration costs, other income/expense, and RINs loss (gain) in excess of net obligation. Adjusted EBITDA for the Corporate and Other segment also includes Other income, net, which is presented below operating income (loss) on our consolidated statements of operations. As noted above, beginning in the second quarter of 2020, Adjusted EBITDA by segment also includes the contango gains and backwardation (losses) associated with our Washington inventory and intermediation obligation. Prior to the second quarter of 2020, contango gains and backwardation (losses) captured by our Washington intermediation agreement were excluded from Adjusted EBITDA by segment (as part of the inventory valuation adjustment). We have recast the non-GAAP information for the three and six months ended June 30, 2019 to conform to the current period presentation.
We believe Adjusted EBITDA by segment is a useful supplemental financial measure to evaluate the economic performance of our segments without regard to financing methods, capital structure, or historical cost basis. The following table presents a reconciliation of Adjusted EBITDA to the most directly comparable GAAP financial measure, operating income (loss), on a historical basis, for selected segments, for the periods indicated (in thousands):
11
Three Months Ended June 30, 2020 | |||||||||||||||
Refining | Logistics | Retail | Corporate and Other | ||||||||||||
Operating income (loss) by segment | $ | (36,757 | ) | $ | 6,303 | $ | 16,180 | $ | (11,169 | ) | |||||
Depreciation, depletion, and amortization | 12,706 | 5,902 | 2,664 | 856 | |||||||||||
Inventory valuation adjustment | (35,979 | ) | — | — | — | ||||||||||
RINs loss (gain) in excess of net obligation | 10,738 | — | — | — | |||||||||||
Unrealized loss (gain) on derivatives | (22,431 | ) | — | — | — | ||||||||||
Acquisition and integration costs | — | — | — | 90 | |||||||||||
Severance costs | — | — | — | 96 | |||||||||||
Other income/expense | — | — | — | 455 | |||||||||||
Adjusted EBITDA (1) | $ | (71,723 | ) | $ | 12,205 | $ | 18,844 | $ | (9,672 | ) | |||||
Three Months Ended June 30, 2019 | |||||||||||||||
Refining | Logistics | Retail | Corporate and Other | ||||||||||||
Operating income (loss) by segment | $ | 33,185 | $ | 16,371 | $ | 12,026 | $ | (12,961 | ) | ||||||
Depreciation, depletion, and amortization | 14,613 | 3,989 | 2,532 | 785 | |||||||||||
Inventory valuation adjustment | (22,102 | ) | — | — | — | ||||||||||
RINs loss (gain) in excess of net obligation | 2,713 | — | — | — | |||||||||||
Unrealized loss (gain) on derivatives | 14,379 | — | — | (44 | ) | ||||||||||
Acquisition and integration costs | — | — | — | 818 | |||||||||||
Other income/expense | — | — | — | 2,177 | |||||||||||
Adjusted EBITDA (1) | $ | 42,788 | $ | 20,360 | $ | 14,558 | $ | (9,225 | ) | ||||||
Six Months Ended June 30, 2020 | |||||||||||||||
Refining | Logistics | Retail | Corporate and Other | ||||||||||||
Operating income (loss) by segment | $ | (205,327 | ) | $ | 25,079 | $ | (1,929 | ) | $ | (24,439 | ) | ||||
Depreciation, depletion and amortization | 25,700 | 10,569 | 5,463 | 1,679 | |||||||||||
Inventory valuation adjustment | 39,345 | — | — | — | |||||||||||
RINs loss (gain) in excess of net obligation | 17,340 | — | — | — | |||||||||||
Unrealized loss (gain) on derivatives | 445 | — | — | — | |||||||||||
Acquisition and integration costs | — | — | — | 755 | |||||||||||
Severance costs | 88 | — | — | 157 | |||||||||||
Impairment expense | 38,105 | — | 29,817 | — | |||||||||||
Other income/expense | — | — | — | 479 | |||||||||||
Adjusted EBITDA | $ | (84,304 | ) | $ | 35,648 | $ | 33,351 | $ | (21,369 | ) | |||||
12
Six Months Ended June 30, 2019 | |||||||||||||||
Refining | Logistics | Retail | Corporate and Other | ||||||||||||
Operating income (loss) by segment | $ | 47,548 | $ | 28,790 | $ | 22,090 | $ | (28,384 | ) | ||||||
Depreciation, depletion and amortization | 28,491 | 7,885 | 4,906 | 1,594 | |||||||||||
Inventory valuation adjustment | (18,804 | ) | — | — | — | ||||||||||
RINs loss (gain) in excess of net obligation | (1,799 | ) | — | — | — | ||||||||||
Unrealized loss (gain) on derivatives | 20,677 | — | — | — | |||||||||||
Acquisition and integration costs | — | — | — | 3,702 | |||||||||||
Other income/expense | — | — | — | 2,264 | |||||||||||
Adjusted EBITDA (1) | $ | 76,113 | $ | 36,675 | $ | 26,996 | $ | (20,824 | ) | ||||||
________________________________________
(1) | There were no impairment losses or severance costs recorded in Operating income (loss) by segment for the three and six months ended June 30, 2019. There were no impairment losses recorded in Operating income (loss) by segment for the three months ended June 30, 2020. |
Laramie Energy Adjusted EBITDAX
Adjusted EBITDAX is defined as net income (loss) excluding commodity derivative loss (gain), loss (gain) on settled derivative instruments, interest expense, non-cash preferred dividend, depreciation, depletion, amortization, and accretion, exploration and geological and geographical expense, bonus accrual, equity-based compensation expense, loss (gain) on disposal of assets, pipeline (payment) deficiency accrual, and expired acreage (non-cash). We believe Adjusted EBITDAX is a useful supplemental financial measure to evaluate the economic and operational performance of exploration and production companies such as Laramie Energy.
The following table presents a reconciliation of Laramie Energy’s Adjusted EBITDAX to the most directly comparable GAAP financial measure, net income (loss) for the periods indicated (in thousands):
Three Months Ended June 30, | Six Months Ended June 30, | ||||||||||||||
2020 | 2019 | 2020 | 2019 | ||||||||||||
Net income (loss) | $ | (14,349 | ) | $ | (2,570 | ) | $ | (13,775 | ) | $ | (5,553 | ) | |||
Commodity derivative loss (gain) | 1,542 | (11,390 | ) | (1,909 | ) | 959 | |||||||||
Gain (loss) on settled derivative instruments | 2,597 | 3,000 | 3,634 | (12,024 | ) | ||||||||||
Interest expense and loan fees | 2,217 | 3,832 | 4,511 | 6,824 | |||||||||||
Non-cash preferred dividend | 1,663 | (12 | ) | 3,270 | 1,232 | ||||||||||
Depreciation, depletion, amortization, and accretion | 10,714 | 21,661 | 20,658 | 43,650 | |||||||||||
Exploration and geological and geographical expense | 154 | 166 | 192 | 228 | |||||||||||
Bonus accrual | 675 | (2,554 | ) | 284 | (1,817 | ) | |||||||||
Equity-based compensation expense | 8 | 71 | 16 | 141 | |||||||||||
Loss (gain) on disposal of assets | 21 | 1,593 | 182 | 1,512 | |||||||||||
Pipeline (payment) deficiency accrual | — | — | — | (1,162 | ) | ||||||||||
Expired acreage (non-cash) | 126 | 397 | 163 | 419 | |||||||||||
Total Adjusted EBITDAX | $ | 5,368 | $ | 14,194 | $ | 17,226 | $ | 34,409 | |||||||
13