News Release
Patrick Industries, Inc. Reports Second Quarter 2022 Financial Results
Second Quarter 2022 Highlights (compared to Second Quarter 2021 unless otherwise noted)
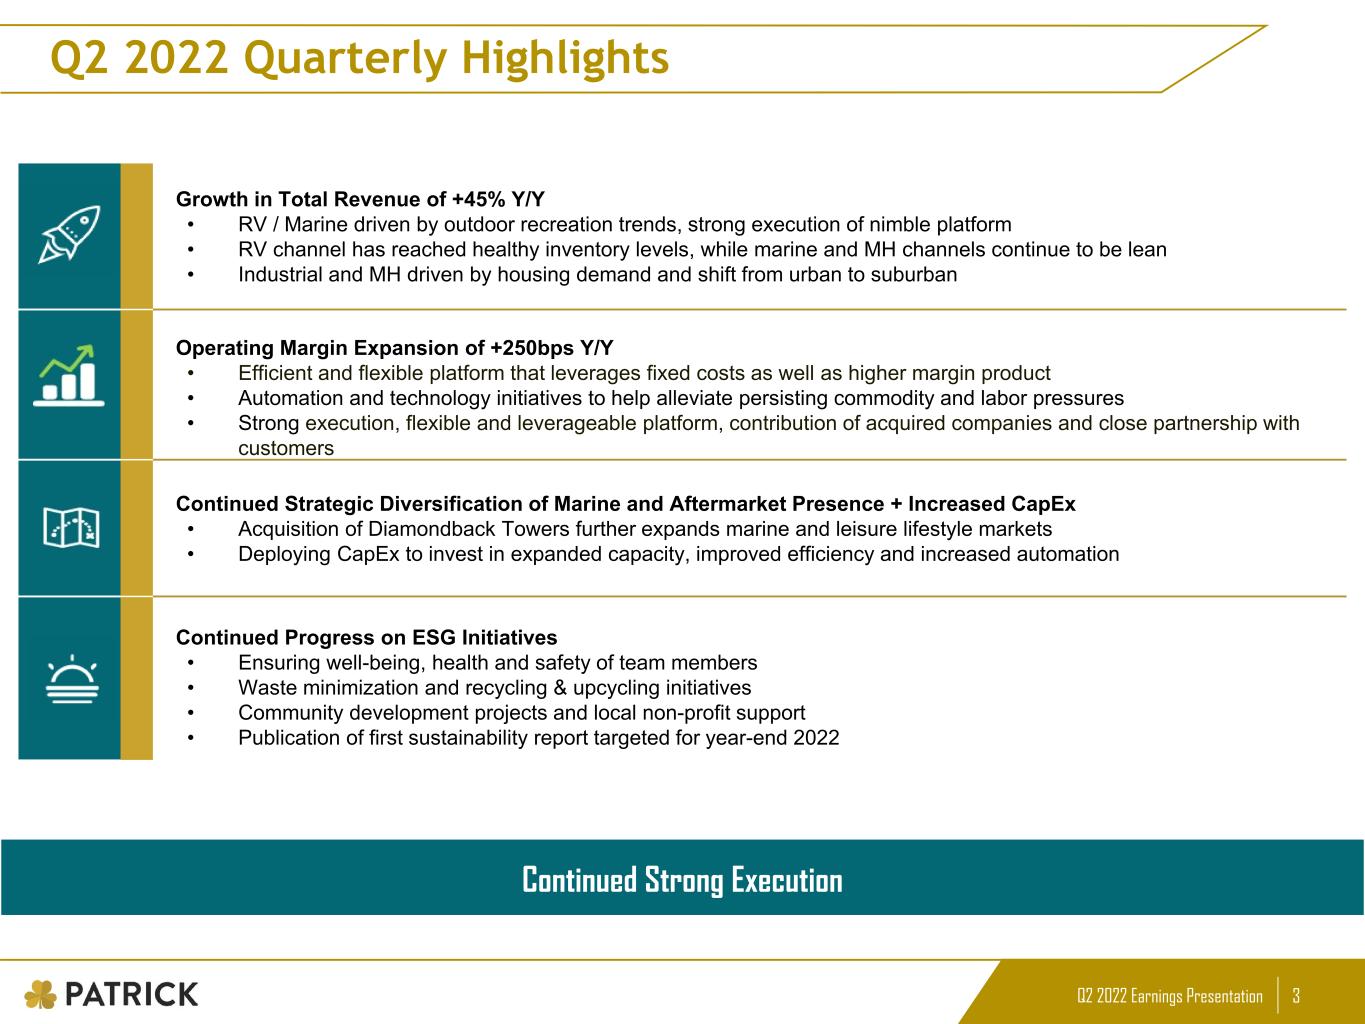
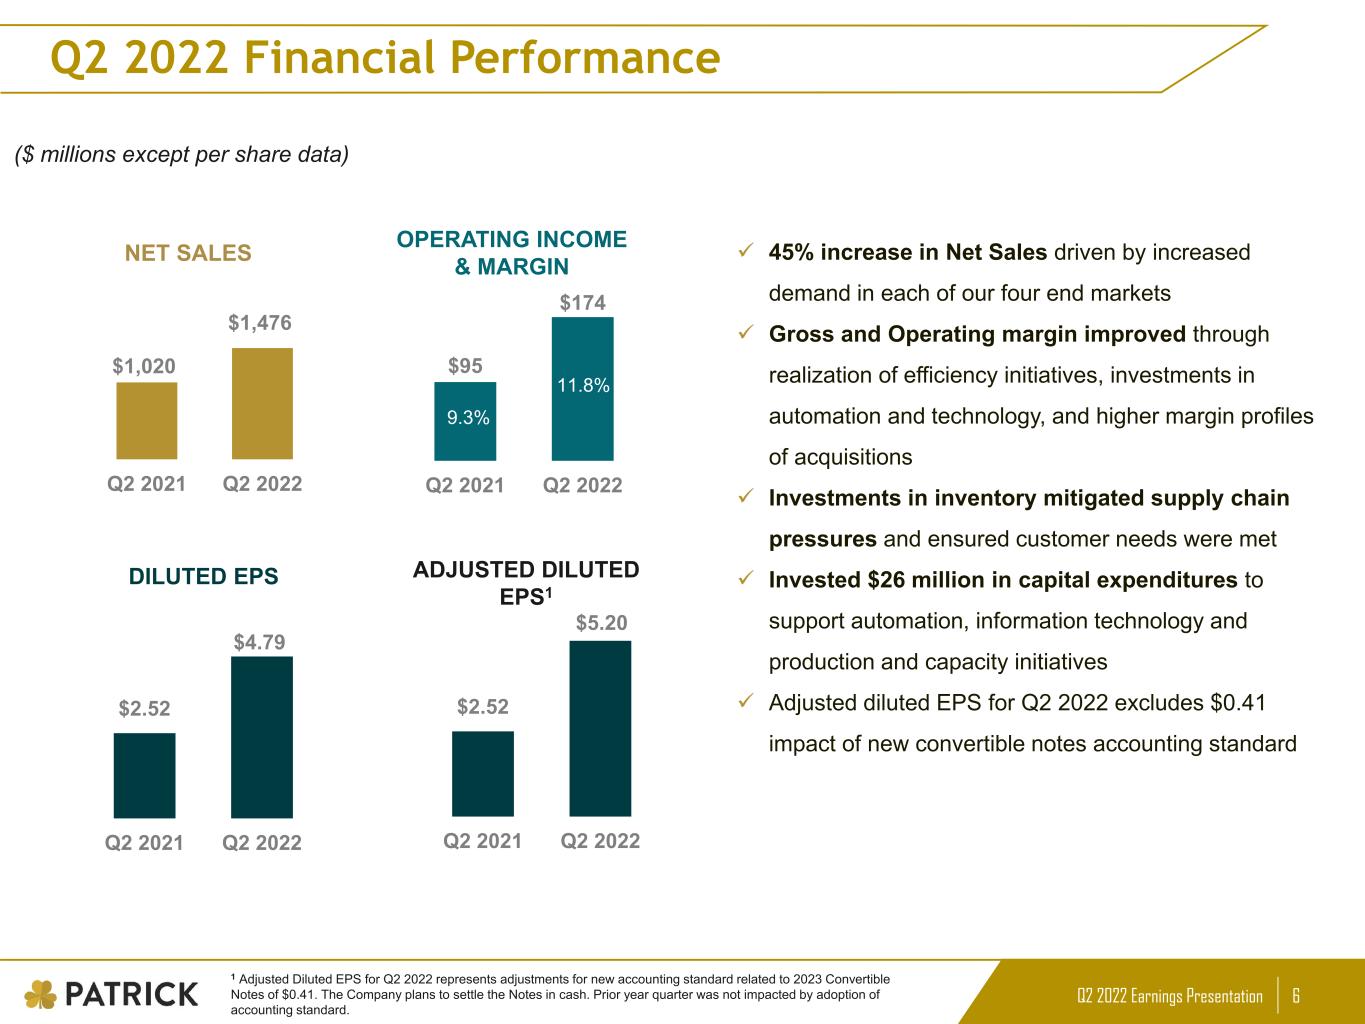
•Net sales of $1.5 billion increased 45%, reflecting contributions from all end markets and from 2021 and 2022 acquisitions
•Gross profit of $327 million increased 60%
•Gross margin of 22.2% increased 220 basis points
•Operating income of $174 million increased 83%
•Operating margin of 11.8% increased 250 basis points
•Net income of $117 million increased 98%
•Diluted earnings per share of $4.79 increased 90%, and includes a reduction for the impact of the accounting treatment for convertible notes and purchase accounting inventory step-up adjustments totaling $0.52 per share
•Operating cash flows of $97 million increased 242%
•Acquired Diamondback Towers
ELKHART, IN - July 28, 2022 - Patrick Industries, Inc. (NASDAQ: PATK), a leading component solutions provider for the Leisure Lifestyle and Housing markets today reported financial results for the second quarter ended June 26, 2022.
Net sales in the second quarter of 2022 increased $456 million, or 45%, to $1.5 billion from $1.0 billion in the second quarter of 2021. The increase reflects continued strong performance in our Leisure Lifestyle markets and our Housing end markets, market share gains, and the contribution of acquisitions completed in 2021 and 2022.
Operating income of $174 million increased $79 million, or 83%, from $95 million in the second quarter of 2021. Operating margin of 11.8% in the second quarter of 2022 increased 250 basis points compared to 9.3% in the same period a year ago. The operating margin improvement was driven principally by the realization of productivity improvements and labor efficiencies, increased throughput, leveraging certain fixed costs, the accretive margin profile of recent acquisitions, and returns from investments in human capital and innovation.
Net income increased 98% to $117 million, from $59 million in the second quarter of 2021. Diluted earnings per share of $4.79 increased 90%, compared to $2.52 for the second quarter of 2021. Second quarter 2022 diluted earnings per share includes $0.41 for the accounting treatment of convertible notes discussed below and an $0.11 reduction from purchase accounting inventory step-up adjustments.
In the first quarter of 2022, the Company adopted a new accounting standard that requires its 1.00% convertible notes due 2023 to be presented on an "if converted" basis in the calculation of diluted earnings per share. As a result of the adoption of this standard, the Company's second quarter 2022 diluted earnings per share was reduced by $0.41. Prior year results do not reflect the adoption of the new accounting standard. The Company does not intend to issue shares in settlement of 1.00% convertible notes due 2023 that may be converted by their holders.
"We are pleased with our second quarter performance as our team continued to work closely with our customers across all end markets to support their production requirements and align with their schedules," said Andy Nemeth, Chief Executive Officer. "We continued to leverage our investments in technology, automation, and human capital to meet customer needs while maintaining a nimble posture that supports our ability to flex rapidly with changing customer demand. While we have seen subsiding pressures in the supply
chain, our team continues to work tirelessly to ensure that we continue to be a priority option as a first-choice scalable solutions provider for our customers while maintaining our capacity and maneuverability."
Jeff Rodino, President, said, "In May, we welcomed Diamondback Towers into the Patrick family, which represents our continued strategic investment into the marine end market and related aftermarket and further solidifies our presence as the leading provider of ski and wake towers. Additionally, during the quarter, we saw the benefits of our investment of over $100 million in capital expenditures over the last 18 months, as our automation and technology initiatives are helping us leverage our labor resources to allow us to drive continued production efficiencies and strong returns."
Second Quarter 2022 Revenue by Market Sector (compared to Second Quarter 2021 unless otherwise noted)
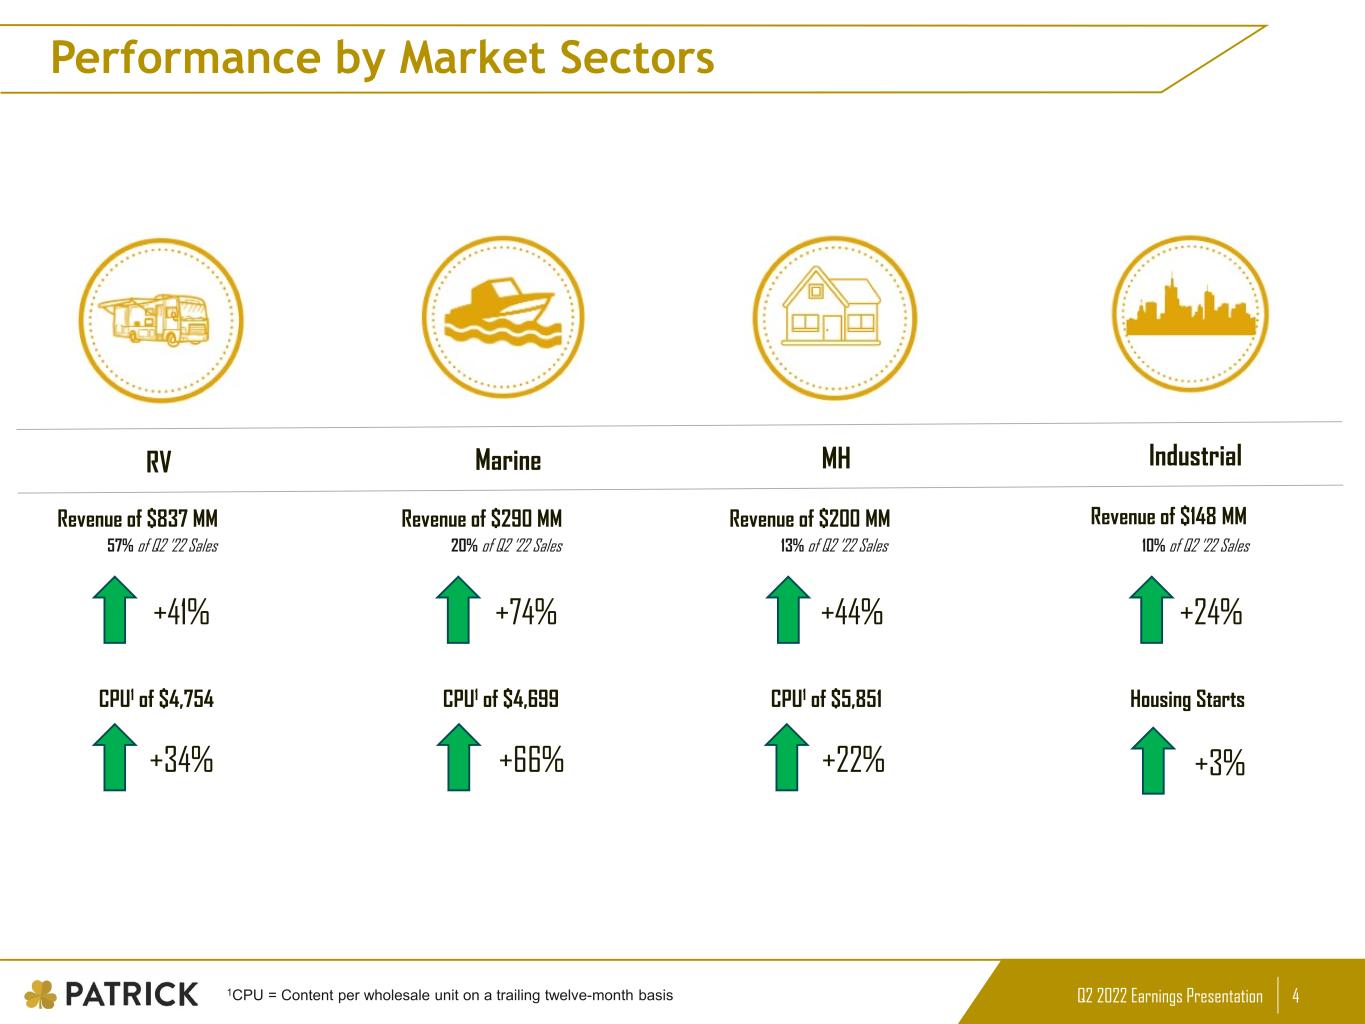
RV (57% of Revenue)
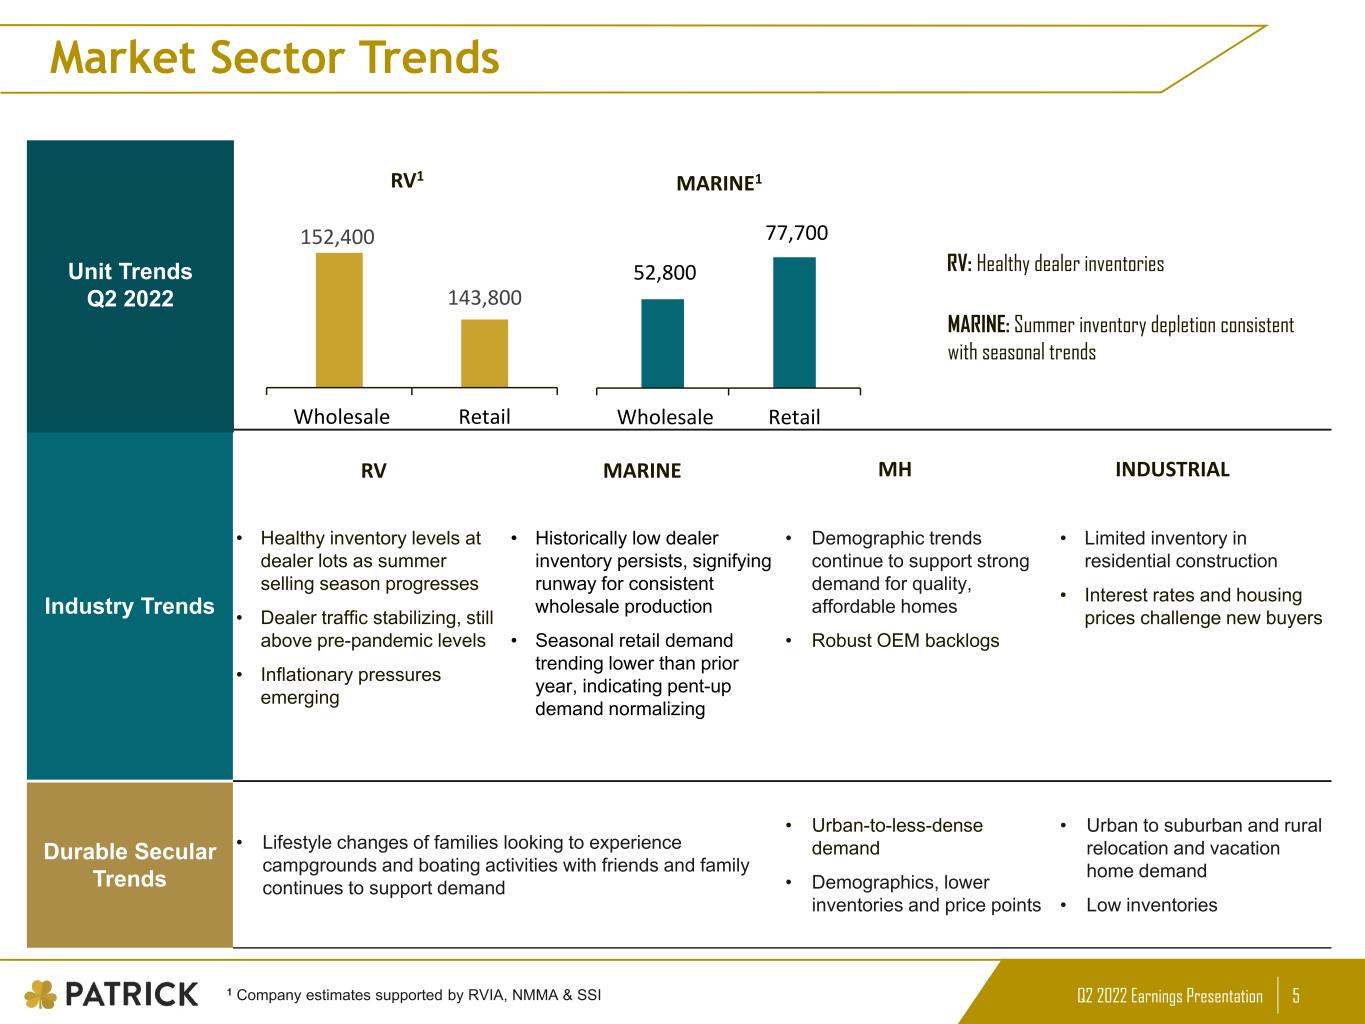
•Revenue of $837 million increased 41% while wholesale RV industry unit shipments remained relatively flat
•Content per wholesale RV unit (on a trailing twelve-month basis) increased 34% to $4,754
Marine (20% of Revenue)
•Revenue of $290 million increased 74% while estimated wholesale powerboat industry unit shipments increased 10%
•Estimated content per wholesale powerboat unit (on a trailing twelve-month basis) increased 66% to $4,699
Manufactured Housing ("MH") (13% of Revenue)
•Revenue of $200 million increased 44% while estimated wholesale MH industry unit shipments increased 14%
•Estimated content per wholesale MH unit (on a trailing twelve-month basis) increased 22% to $5,851
Industrial (10% of Revenue)
•Revenue of $148 million increased 24% while housing starts increased 3%
Balance Sheet, Cash Flow and Capital Allocation
Cash provided by operations for the second quarter of 2022 of $97 million increased 242% compared to $28 million in the second quarter of 2021, reflecting improved performance in all four end markets, partially offset by continued investment in working capital as we partnered with our customers to ensure that we met their requirements. Cash used in business acquisitions in the second quarter of 2022 totaled $19 million, primarily related to our acquisition of Diamondback Towers. Capital expenditures in the second quarter of 2022 totaled $26 million, compared to $12 million in the second quarter of 2021, reflecting continued investments in infrastructure and automation initiatives to better align resources for increased scalability and to support customer growth.
In alignment with our capital allocation strategy, we returned $24 million to shareholders in the second quarter of 2022, including $17 million through opportunistic repurchases of approximately 288,600 shares and $7 million of dividends.
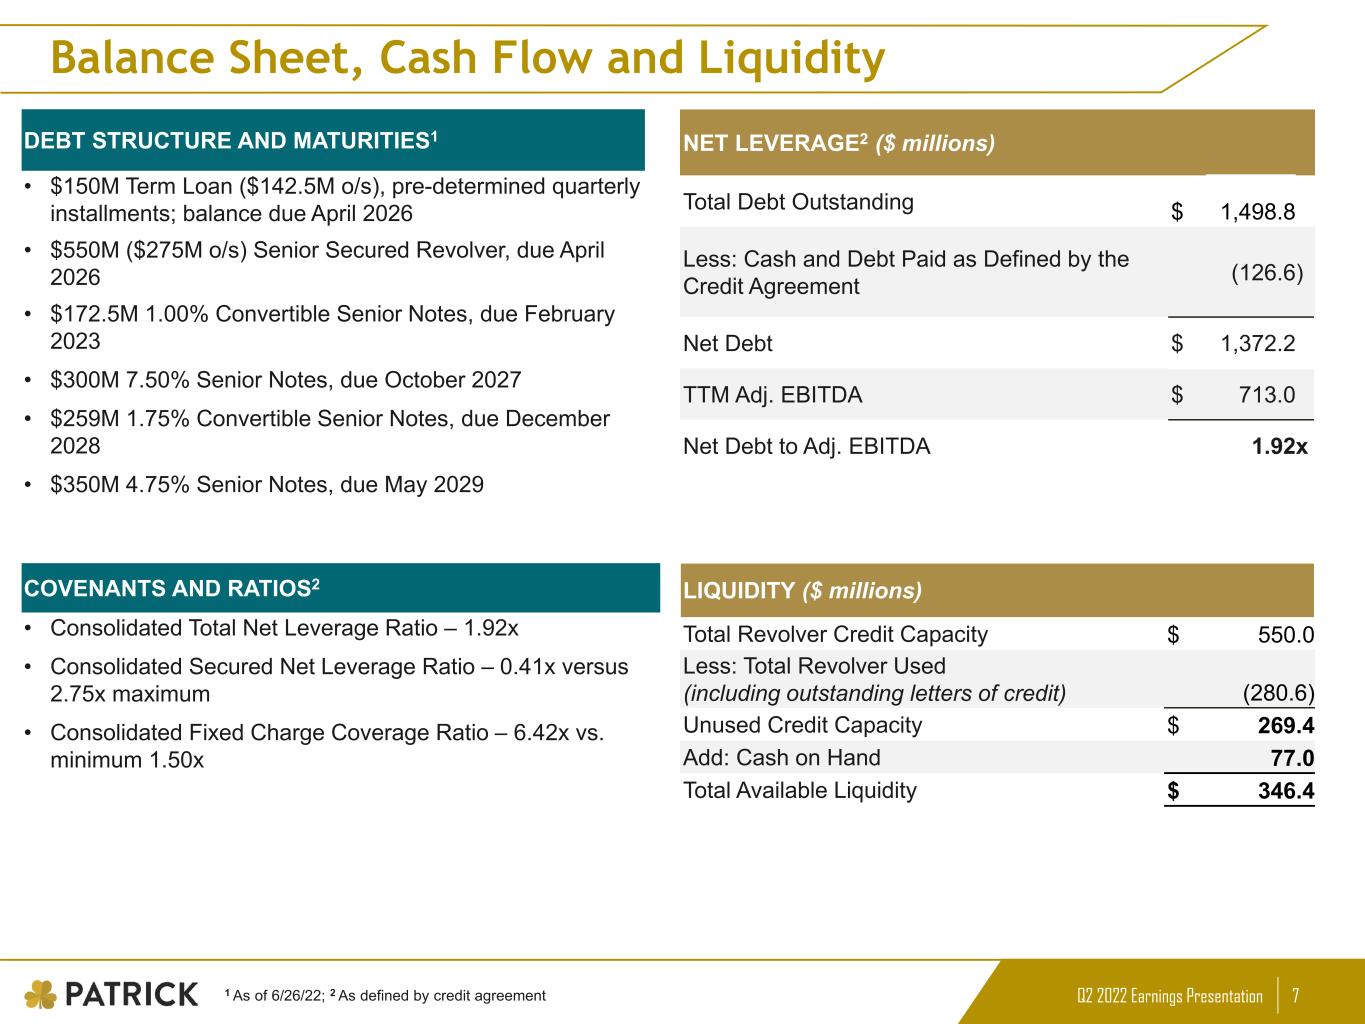
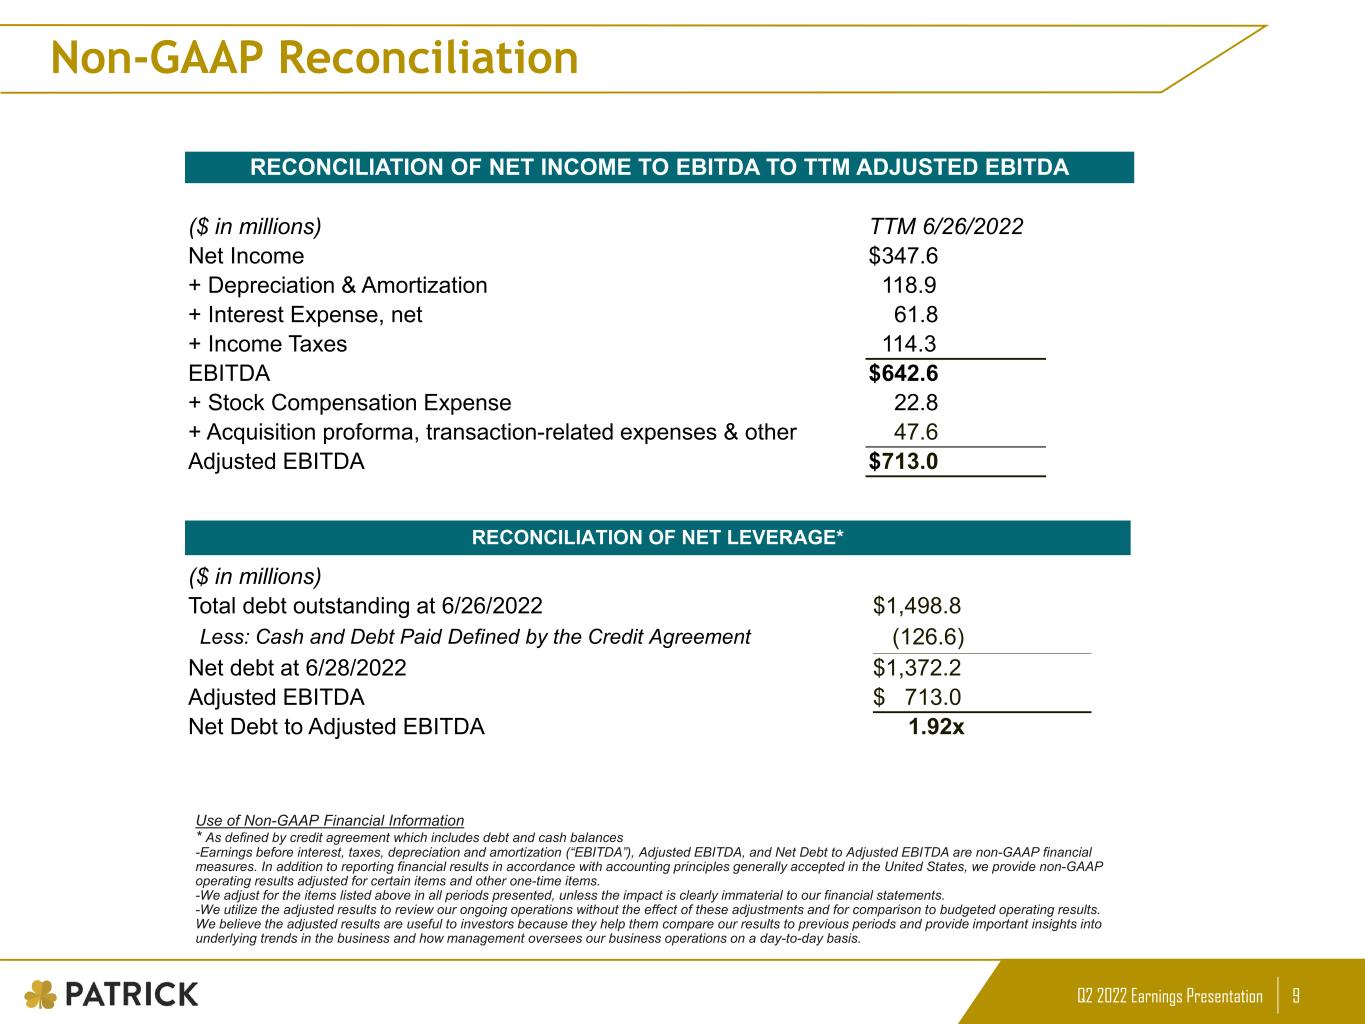
Our total debt at the end of the quarter was approximately $1.5 billion, resulting in a total net leverage ratio of 1.9x (as calculated in accordance with our credit agreement). Available liquidity, comprised of borrowing availability under our credit facility and cash on hand, was approximately $346 million.
2
Business Outlook and Summary
"Late in the second quarter we began to see a meaningful reduction in RV OEM wholesale unit production, signaling the start of a calibration of wholesale and retail RV unit shipments, which we believe reflects thoughtful discipline," continued Mr. Nemeth. "Our other markets, which represent 43% of our business, appear to have runway for continued strong results, supported by continued lean marine, MH, and housing inventories. We believe Patrick's diversified end markets, combined with our flexible and nimble operating model and highly variable cost structure, well position us to navigate through an uncertain macroeconomic environment. Additionally, our diligent focus on innovation, investments in infrastructure, and our disciplined capital allocation strategy are expected to continue to support our goal of delivering long-term value for our shareholders, team members, partners, and communities."
Conference Call Webcast
As previously announced, Patrick Industries will host an online webcast of its second quarter 2022 earnings conference call that can be accessed on the Company’s website, www.patrickind.com, under “For Investors,” on Thursday, July 28, 2022 at 10:00 a.m. Eastern time. In addition, a supplemental earnings presentation can be accessed on the Company’s website, www.patrickind.com under “For Investors.”
About Patrick Industries, Inc.
Patrick Industries (NASDAQ: PATK) is a leading component solutions provider for the RV, marine, manufactured housing and various industrial markets – including single and multi-family housing, hospitality, institutional and commercial markets. Founded in 1959, Patrick is based in Elkhart, Indiana, with over 12,000 employees across the United States.
Use of Financial Metrics
In addition to reporting financial results in accordance with U.S. GAAP, the Company also provides financial metrics, such as net leverage ratio, content per unit, net debt and available liquidity, which we believe are important measures of the Company's business performance. These metrics should not be considered alternatives to U.S. GAAP. Our computations of net leverage ratio, content per unit, net debt and available liquidity may differ from similarly titled measures used by others. We calculate net debt by subtracting cash and cash equivalents from the gross value of debt outstanding. RV wholesale unit shipments are provided by the RV Industry Association. Marine wholesale unit shipments are provided by the National Marine Manufacturers Association. MH wholesale unit shipments are provided by the Manufactured Housing Institute. Housing starts are provided by the U.S. Census Bureau. You should not consider these metrics in isolation or as substitutes for an analysis of our results as reported under U.S. GAAP.
Cautionary Statement Regarding Forward-Looking Statements
This press release contains certain statements related to future results, our intentions, beliefs and expectations or predictions for the future, which are forward-looking statements as that term is defined in the Private Securities Litigation Reform Act of 1995. These forward-looking statements involve a number of risks and uncertainties that could cause actual results to differ materially from either historical or anticipated results depending on a variety of factors. Potential factors that could impact results include: the impact of the continuing financial and operational uncertainty due to the COVID-19 pandemic, including its impact on the overall economy, our sales, customers, operations, team members, suppliers, and the countries where we have operations or from which we source products and raw materials, such as China; adverse economic and business conditions, including cyclicality and seasonality in the industries we sell our products; the deterioration of the financial condition of our customers or suppliers; the ability to adjust our production schedules up or down quickly in response to rapid changes in demand; the loss of a significant customer; changes in consumer preferences; pricing pressures due to competition; conditions in the credit market limiting the ability of consumers and wholesale customers to obtain retail and wholesale financing for RVs, manufactured homes, and marine products; the imposition of restrictions and taxes on imports of raw
3
materials and components used in our products; information technology performance and security; any increased cost or limited availability of certain raw materials; the impact of governmental and environmental regulations, and our inability to comply with them; our level of indebtedness; the ability to remain in compliance with our credit agreement covenants; the availability and costs of labor and production facilities and the impact of labor shortages; inventory levels of retailers and manufacturers; the ability to generate cash flow or obtain financing to fund growth; future growth rates in the Company's core businesses; realization and impact of efficiency improvements and cost reductions; the successful integration of acquisitions and other growth initiatives; increases in interest rates and oil and gasoline prices; the ability to retain key executive and management personnel; the disruption of business resulting from natural disasters or other unforeseen events, and adverse weather conditions impacting retail sales.
There can be no assurance that any forward-looking statement will be realized or that actual results will not be significantly different from that set forth in such forward-looking statement. Information about certain risks that could affect our business and cause actual results to differ from those expressed or implied in the forward-looking statements are contained in the section entitled “Risk Factors” in the Company’s Annual Report on Form 10-K for the year ended December 31, 2021, and in the Company's Forms 10-Q for subsequent quarterly periods, which are filed with the Securities and Exchange Commission (“SEC”) and are available on the SEC’s website at www.sec.gov. Each forward-looking statement speaks only as of the date of this press release, and we undertake no obligation to update any forward-looking statement to reflect events or circumstances occurring after the date on which it is made.
Contact:
Julie Ann Kotowski
Investor Relations
574.294.7511
4
| PATRICK INDUSTRIES, INC. | |||||||||||||||||||||||
| CONDENSED CONSOLIDATED STATEMENTS OF INCOME (Unaudited) | |||||||||||||||||||||||
| Second Quarter Ended | Six Months Ended | ||||||||||||||||||||||
| (thousands except per share data) | June 26, 2022 | June 27, 2021 | June 26, 2022 | June 27, 2021 | |||||||||||||||||||
| NET SALES | $ | 1,475,693 | $ | 1,019,953 | $ | 2,817,868 | $ | 1,870,436 | |||||||||||||||
| Cost of goods sold | 1,148,589 | 815,476 | 2,195,419 | 1,504,427 | |||||||||||||||||||
| GROSS PROFIT | 327,104 | 204,477 | 622,449 | 366,009 | |||||||||||||||||||
| Operating Expenses: | |||||||||||||||||||||||
| Warehouse and delivery | 44,047 | 34,815 | 85,216 | 64,728 | |||||||||||||||||||
| Selling, general and administrative | 90,485 | 60,365 | 166,045 | 111,597 | |||||||||||||||||||
| Amortization of intangible assets | 18,545 | 14,031 | 35,406 | 25,937 | |||||||||||||||||||
| Total operating expenses | 153,077 | 109,211 | 286,667 | 202,262 | |||||||||||||||||||
| OPERATING INCOME | 174,027 | 95,266 | 335,782 | 163,747 | |||||||||||||||||||
| Interest expense, net | 14,802 | 14,580 | 29,688 | 25,759 | |||||||||||||||||||
| Income before income taxes | 159,225 | 80,686 | 306,094 | 137,988 | |||||||||||||||||||
| Income taxes | 42,701 | 21,701 | 76,897 | 31,490 | |||||||||||||||||||
| NET INCOME | $ | 116,524 | $ | 58,985 | $ | 229,197 | $ | 106,498 | |||||||||||||||
| BASIC NET INCOME PER COMMON SHARE | $ | 5.24 | $ | 2.57 | $ | 10.25 | $ | 4.66 | |||||||||||||||
| DILUTED NET INCOME PER COMMON SHARE | $ | 4.79 | $ | 2.52 | $ | 9.33 | $ | 4.56 | |||||||||||||||
| Weighted average shares outstanding - Basic | 22,230 | 22,948 | 22,369 | 22,844 | |||||||||||||||||||
| Weighted average shares outstanding - Diluted | 24,444 | 23,435 | 24,655 | 23,360 | |||||||||||||||||||
5
| PATRICK INDUSTRIES, INC. | |||||||||||
| CONDENSED CONSOLIDATED BALANCE SHEETS (Unaudited) | |||||||||||
| As of | |||||||||||
| (thousands) | June 26, 2022 | December 31, 2021 | |||||||||
| ASSETS | |||||||||||
| Current Assets | |||||||||||
| Cash and cash equivalents | $ | 77,025 | $ | 122,849 | |||||||
| Trade receivables, net | 355,352 | 172,392 | |||||||||
| Inventories | 738,908 | 614,356 | |||||||||
| Prepaid expenses and other | 52,087 | 64,478 | |||||||||
| Total current assets | 1,223,372 | 974,075 | |||||||||
| Property, plant and equipment, net | 339,624 | 319,493 | |||||||||
| Operating lease right-of-use assets | 165,631 | 158,183 | |||||||||
| Goodwill and intangible assets, net | 1,289,075 | 1,191,833 | |||||||||
| Other non-current assets | 7,129 | 7,147 | |||||||||
| TOTAL ASSETS | $ | 3,024,831 | $ | 2,650,731 | |||||||
| LIABILITIES AND SHAREHOLDERS’ EQUITY | |||||||||||
| Current Liabilities | |||||||||||
| Current maturities of long-term debt | $ | 7,500 | $ | 7,500 | |||||||
| Current operating lease liabilities | 43,211 | 40,301 | |||||||||
| Accounts payable | 219,315 | 203,537 | |||||||||
| Accrued liabilities | 203,385 | 181,439 | |||||||||
| Total current liabilities | 473,411 | 432,777 | |||||||||
| Long-term debt, less current maturities, net | 1,474,743 | 1,278,989 | |||||||||
| Long-term operating lease liabilities | 125,198 | 120,161 | |||||||||
| Deferred tax liabilities, net | 40,515 | 36,453 | |||||||||
| Other long-term liabilities | 13,374 | 14,794 | |||||||||
| TOTAL LIABILITIES | 2,127,241 | 1,883,174 | |||||||||
| TOTAL SHAREHOLDERS’ EQUITY | 897,590 | 767,557 | |||||||||
| TOTAL LIABILITIES AND SHAREHOLDERS’ EQUITY | $ | 3,024,831 | $ | 2,650,731 | |||||||
6
PATRICK INDUSTRIES, INC.
CONDENSED CONSOLIDATED STATEMENTS OF CASH FLOWS (Unaudited)
| Six Months Ended | |||||||||||
| (thousands) | |||||||||||
| June 26, 2022 | June 27, 2021 | ||||||||||
| CASH FLOWS FROM OPERATING ACTIVITIES | |||||||||||
| Net income | $ | 229,197 | $ | 106,498 | |||||||
| Depreciation and amortization | 62,975 | 48,715 | |||||||||
| Stock-based compensation expense | 10,244 | 10,336 | |||||||||
| Amortization of convertible notes debt discount | 924 | 3,643 | |||||||||
| Other adjustments to reconcile net income to net cash provided by operating activities | (1,355) | 10,426 | |||||||||
| Change in operating assets and liabilities, net of acquisitions of businesses | (227,689) | (100,873) | |||||||||
| Net cash provided by operating activities | 74,296 | 78,745 | |||||||||
| CASH FLOWS FROM INVESTING ACTIVITIES | |||||||||||
| Capital expenditures | (44,467) | (26,345) | |||||||||
| Business acquisitions and other investing activities | (143,093) | (254,548) | |||||||||
| Net cash used in investing activities | (187,560) | (280,893) | |||||||||
| NET CASH FLOWS PROVIDED BY FINANCING ACTIVITIES | 67,440 | 215,783 | |||||||||
| Increase (decrease) in cash and cash equivalents | (45,824) | 13,635 | |||||||||
| Cash and cash equivalents at beginning of year | 122,849 | 44,767 | |||||||||
| Cash and cash equivalents at end of period | $ | 77,025 | $ | 58,402 | |||||||
7
PATRICK INDUSTRIES, INC.
Net Income Per Common Share
The table below illustrates the calculation for diluted share count which shows the dilutive impact of the adoption of ASU 2020-06 on our 1.00% convertible notes due 2023 as mentioned above:
| Second Quarter Ended | Six Months Ended | |||||||||||||||||||||||||
| (thousands except per share data) | June 26, 2022 | June 27, 2021 | June 26, 2022 | June 27, 2021 | ||||||||||||||||||||||
| Numerator: | ||||||||||||||||||||||||||
| Net income for basic per share calculation | $ | 116,524 | $ | 58,985 | $ | 229,197 | $ | 106,498 | ||||||||||||||||||
| Effect of interest on potentially dilutive convertible notes, net of tax | 481 | — | 939 | — | ||||||||||||||||||||||
| Net income for dilutive per share calculation | $ | 117,005 | $ | 58,985 | $ | 230,136 | $ | 106,498 | ||||||||||||||||||
| Denominator: | ||||||||||||||||||||||||||
| Weighted average common shares outstanding - basic | 22,230 | 22,948 | 22,369 | 22,844 | ||||||||||||||||||||||
| Weighted average impact of potentially dilutive convertible notes | 2,052 | — | 2,047 | — | ||||||||||||||||||||||
| Weighted average impact of potentially dilutive securities | 162 | 487 | 239 | 516 | ||||||||||||||||||||||
| Weighted average common shares outstanding - diluted | 24,444 | 23,435 | 24,655 | 23,360 | ||||||||||||||||||||||
| Net income per common share: | ||||||||||||||||||||||||||
| Basic net income per common share | $ | 5.24 | $ | 2.57 | $ | 10.25 | $ | 4.66 | ||||||||||||||||||
| Diluted net income per common share | $ | 4.79 | $ | 2.52 | $ | 9.33 | $ | 4.56 | ||||||||||||||||||
8