
Patrick Industries, Inc. Reports Third Quarter 2020 Financial Results
Third Quarter 2020 Highlights (all metrics compared to Third Quarter 2019 unless otherwise noted)
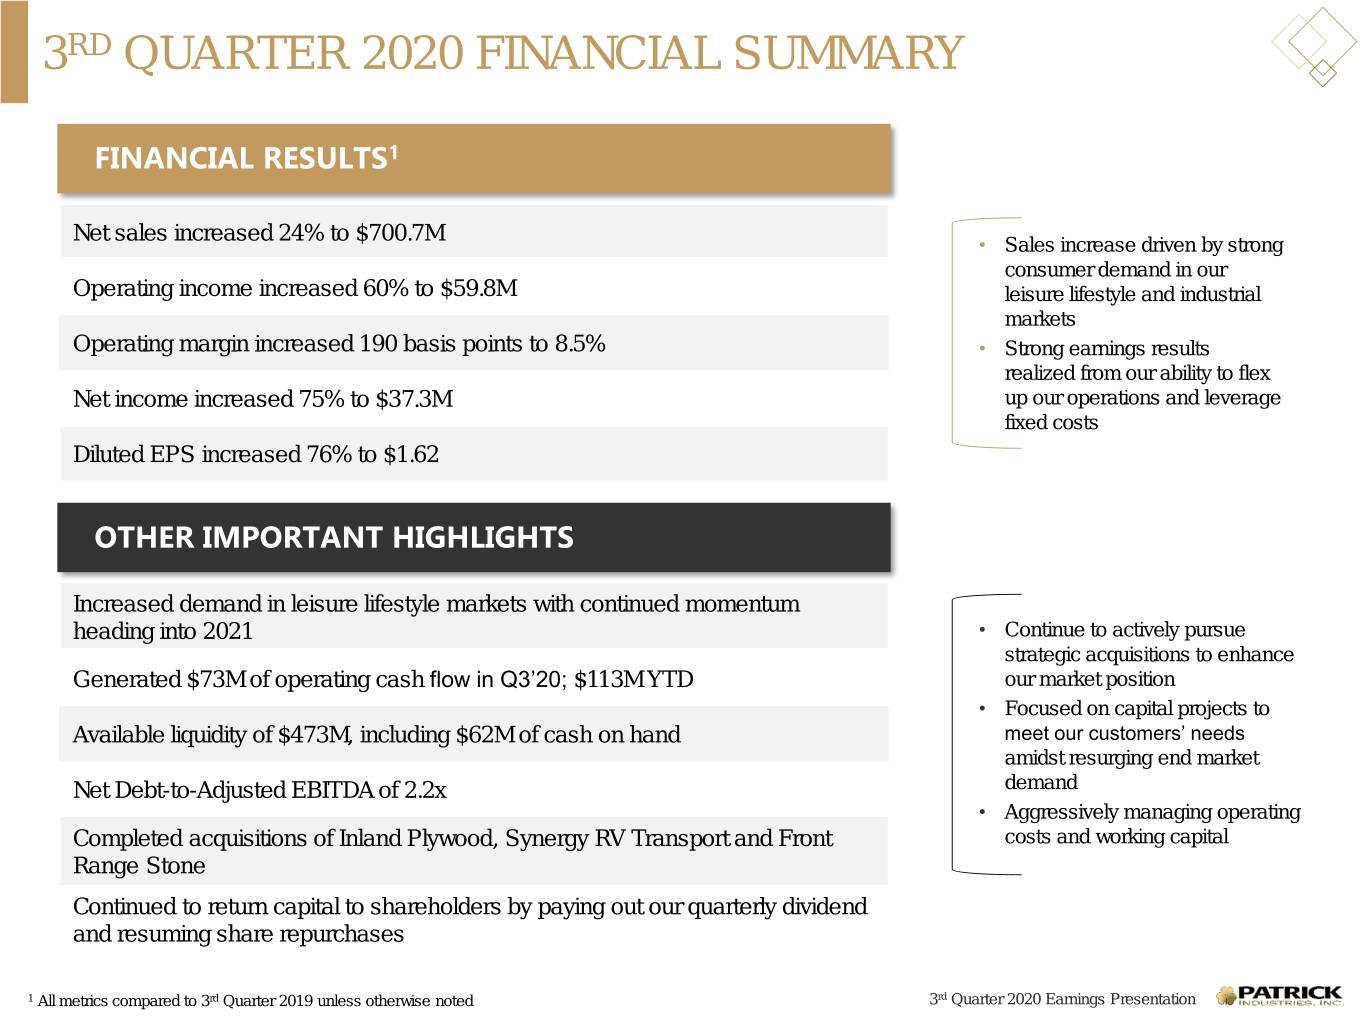
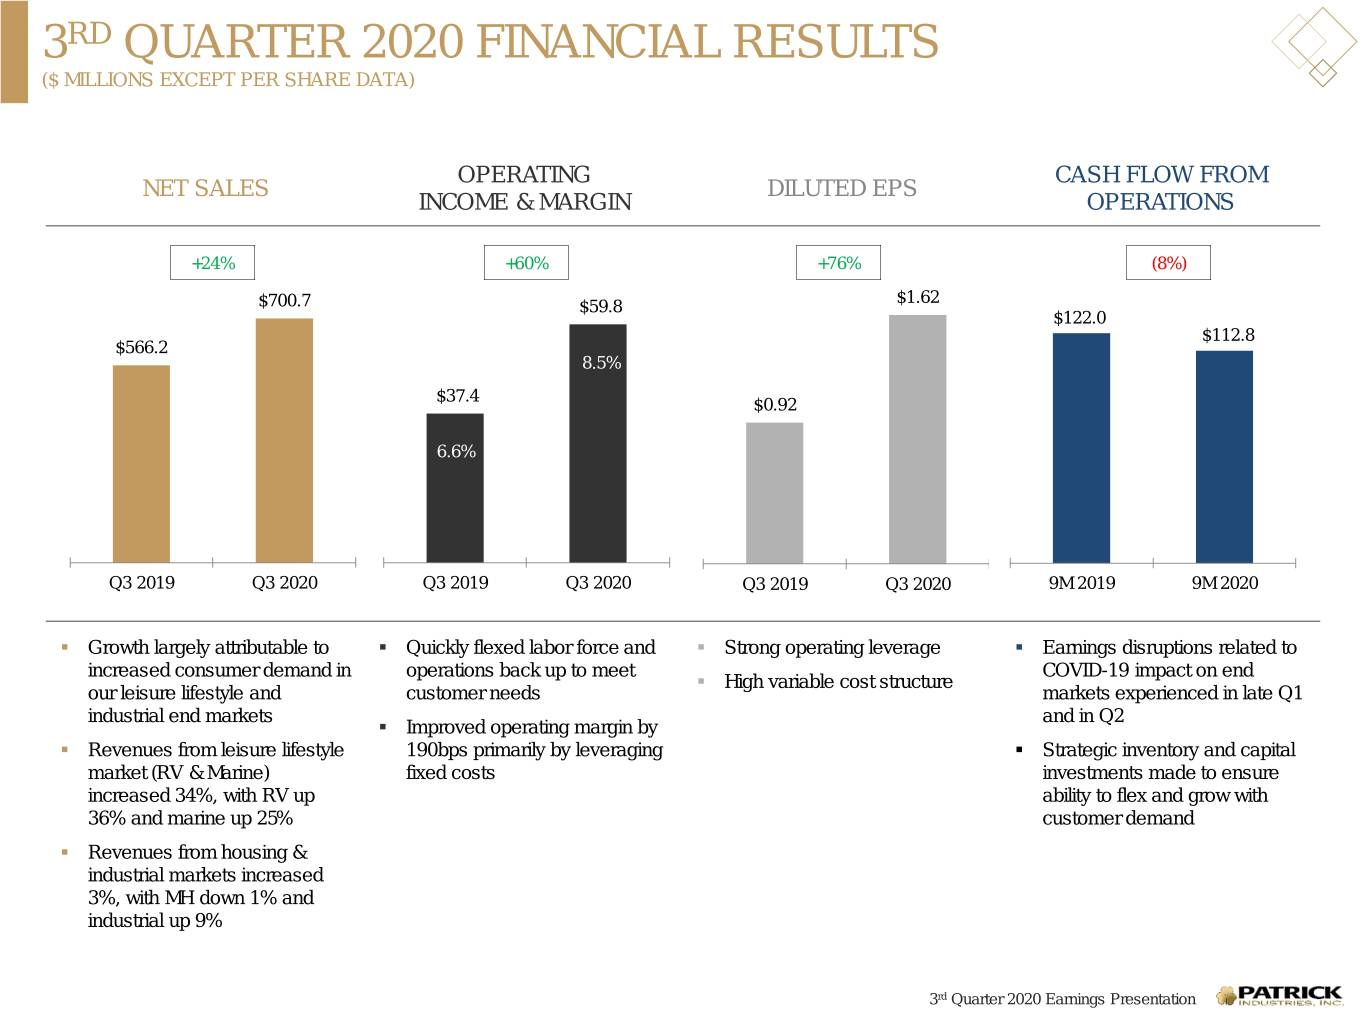
•Net sales of $700.7 million increased 24% with strong demand in RV, marine and industrial markets
•Operating income of $59.8 million increased 60%
•Net income of $37.3 million increased 75%
•Diluted EPS of $1.62 increased 76%
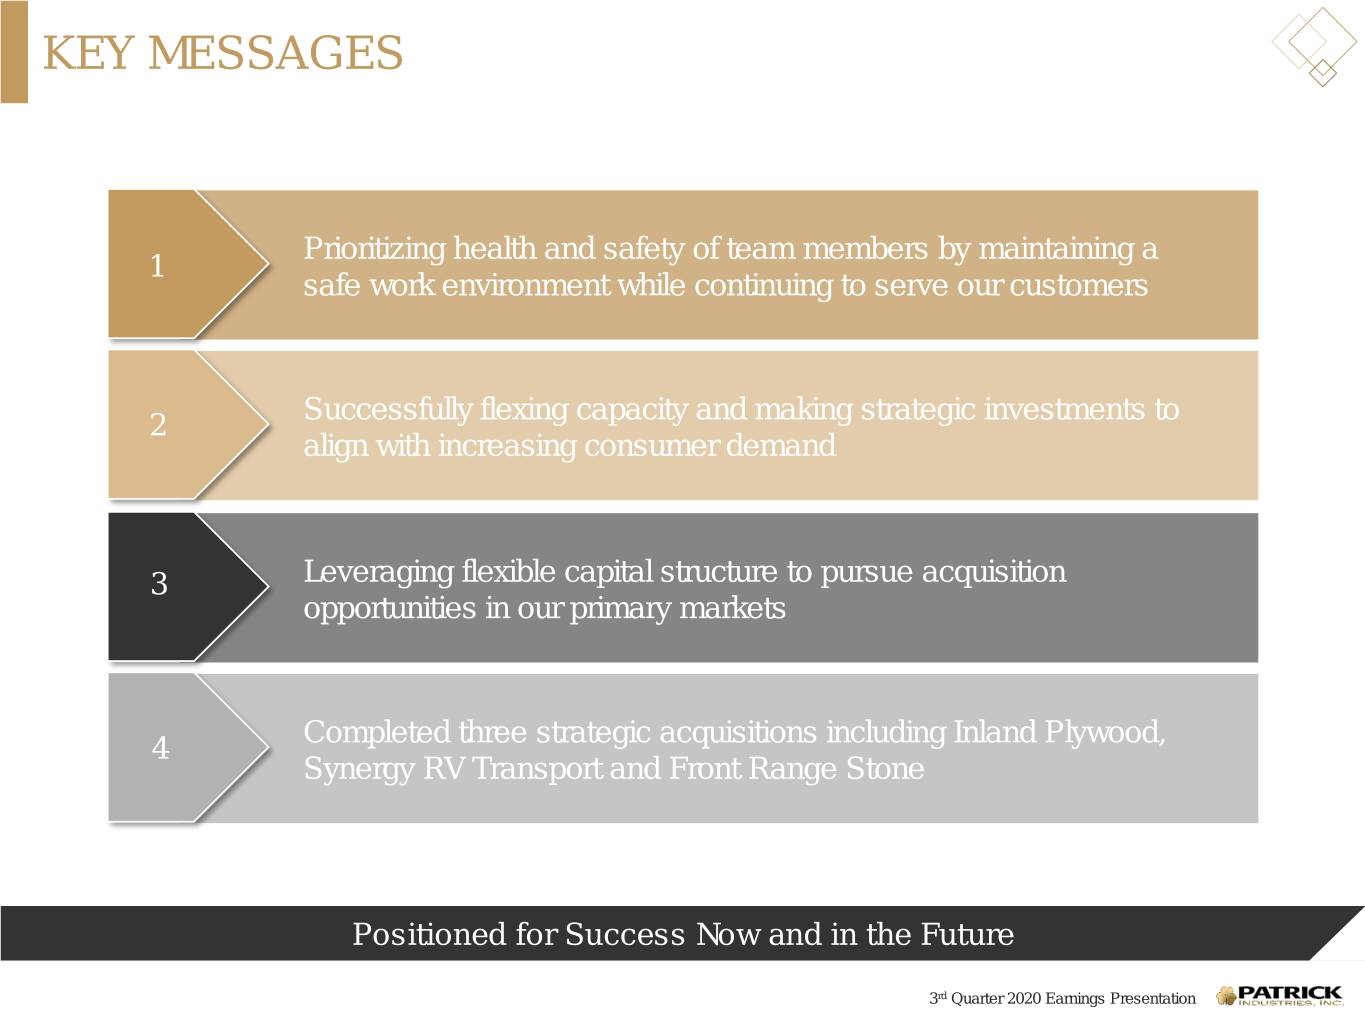
•Strategic acquisitions of Inland Plywood, Synergy RV Transport and Front Range Stone
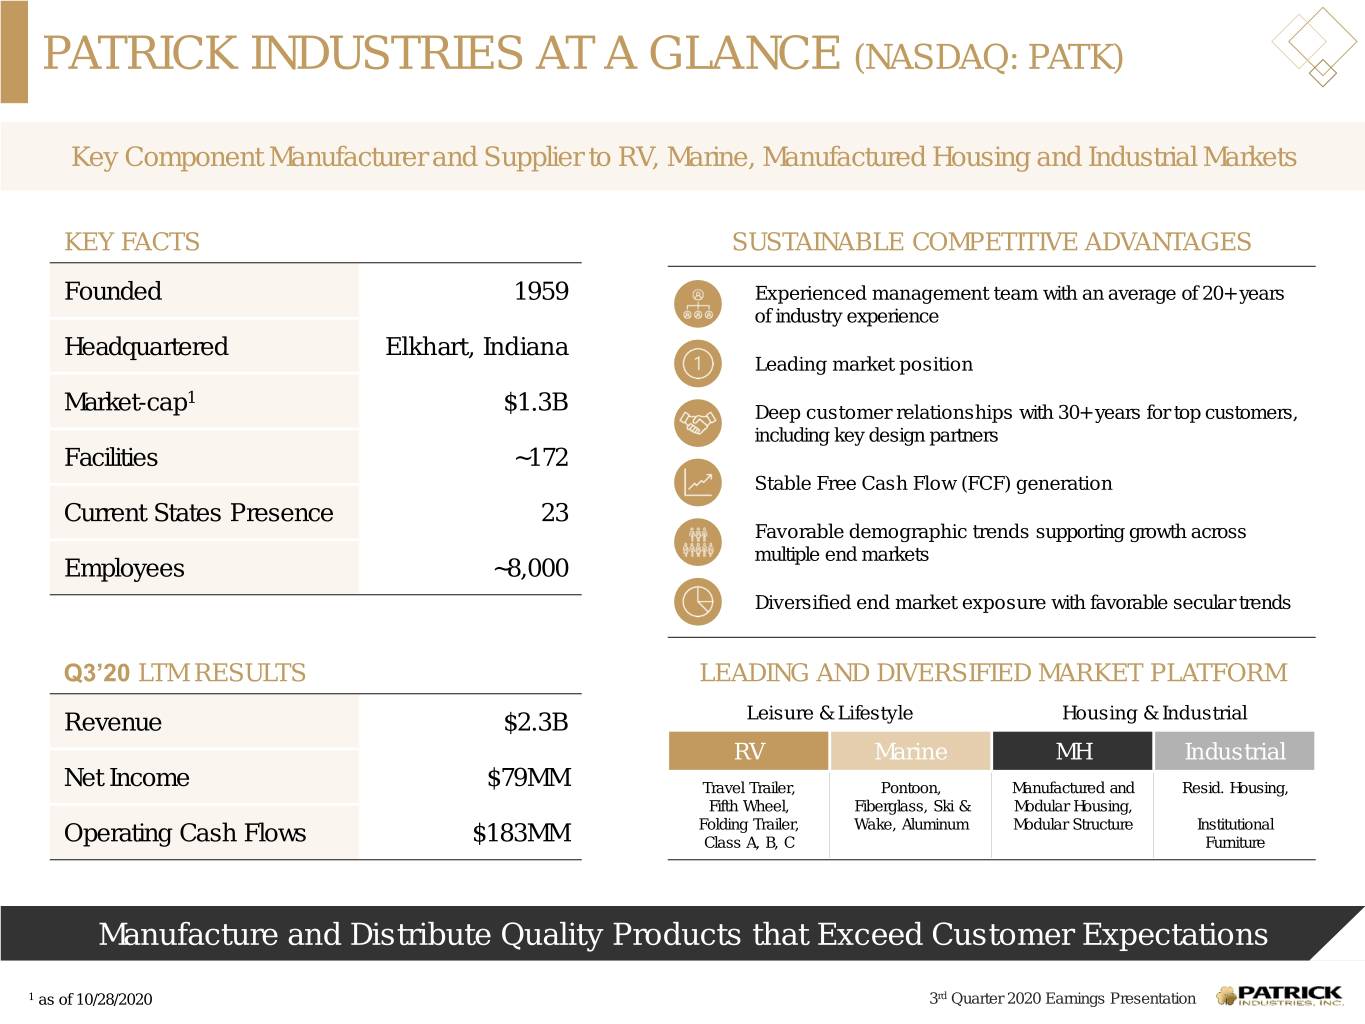
ELKHART, IN - October 29, 2020 - Patrick Industries, Inc. (NASDAQ: PATK), a major manufacturer and distributor of component and building products for the recreational vehicle (“RV”), marine, manufactured housing (“MH”), and industrial markets, today reported financial results for the third quarter ended September 27, 2020.
Net sales in the third quarter of 2020 increased $134.5 million, or 24%, to $700.7 million from $566.2 million in the third quarter of 2019. The consolidated net sales increase in the third quarter of 2020 was attributed to sales increases in our RV, marine and industrial markets.
Operating income increased $22.4 million, or 60%, to $59.8 million in the third quarter of 2020 from $37.4 million in 2019. As a percentage of net sales, operating income was 8.5% in the third quarter of 2020 versus 6.6% in the same period in 2019.
Net income increased $16.0 million, or 75%, to $37.3 million in the third quarter of 2020 compared to $21.3 million in the third quarter of 2019. Net income per diluted share increased $0.70, or 76%, to $1.62 for the third quarter of 2020 compared to $0.92 for the third quarter of 2019.
Net sales in the first nine months of 2020 decreased $73.6 million, or 4%, to $1,714.0 million from $1,787.6 million in the first nine months of 2019. Operating income decreased $7.3 million, or 6%, to $111.2 million in the first nine months of 2020 from $118.5 million in 2019. As a percentage of net sales, operating income was 6.5% in the first nine months of 2020 versus 6.6% in the same period in 2019. Net income for the first nine months of 2020 was $59.2 million compared to net income of $69.6 million for the first nine months of 2019, and net income per diluted share for the first nine months of 2020 was $2.57 compared to $2.99 for the first nine months of 2019. Year-to-date operating results include the impact of industry and statewide shutdowns implemented in response to COVID-19 late in the first quarter of 2020 and through early May 2020.
"Our leisure lifestyle markets continued to rebound in the third quarter with a continuation of positive secular trends and tailwinds in on-the-road domestic travel and outdoor activities," said Andy Nemeth, President and Chief Executive Officer. "Strong demand in our RV, marine and industrial markets resulted in improved profitability as we leveraged our fixed cost structure, despite direct labor inefficiencies due to the significant snap back in production levels which have exceeded pre-pandemic levels. The strategic acquisitions we completed in the third quarter of Inland Plywood, Synergy RV Transport and Front Range Stone capitalize on recent momentum, support customer growth and expand our product offerings in our end markets."
Third Quarter 2020 Revenue by Market Sector (all metrics compared to Third Quarter 2019 unless otherwise noted)
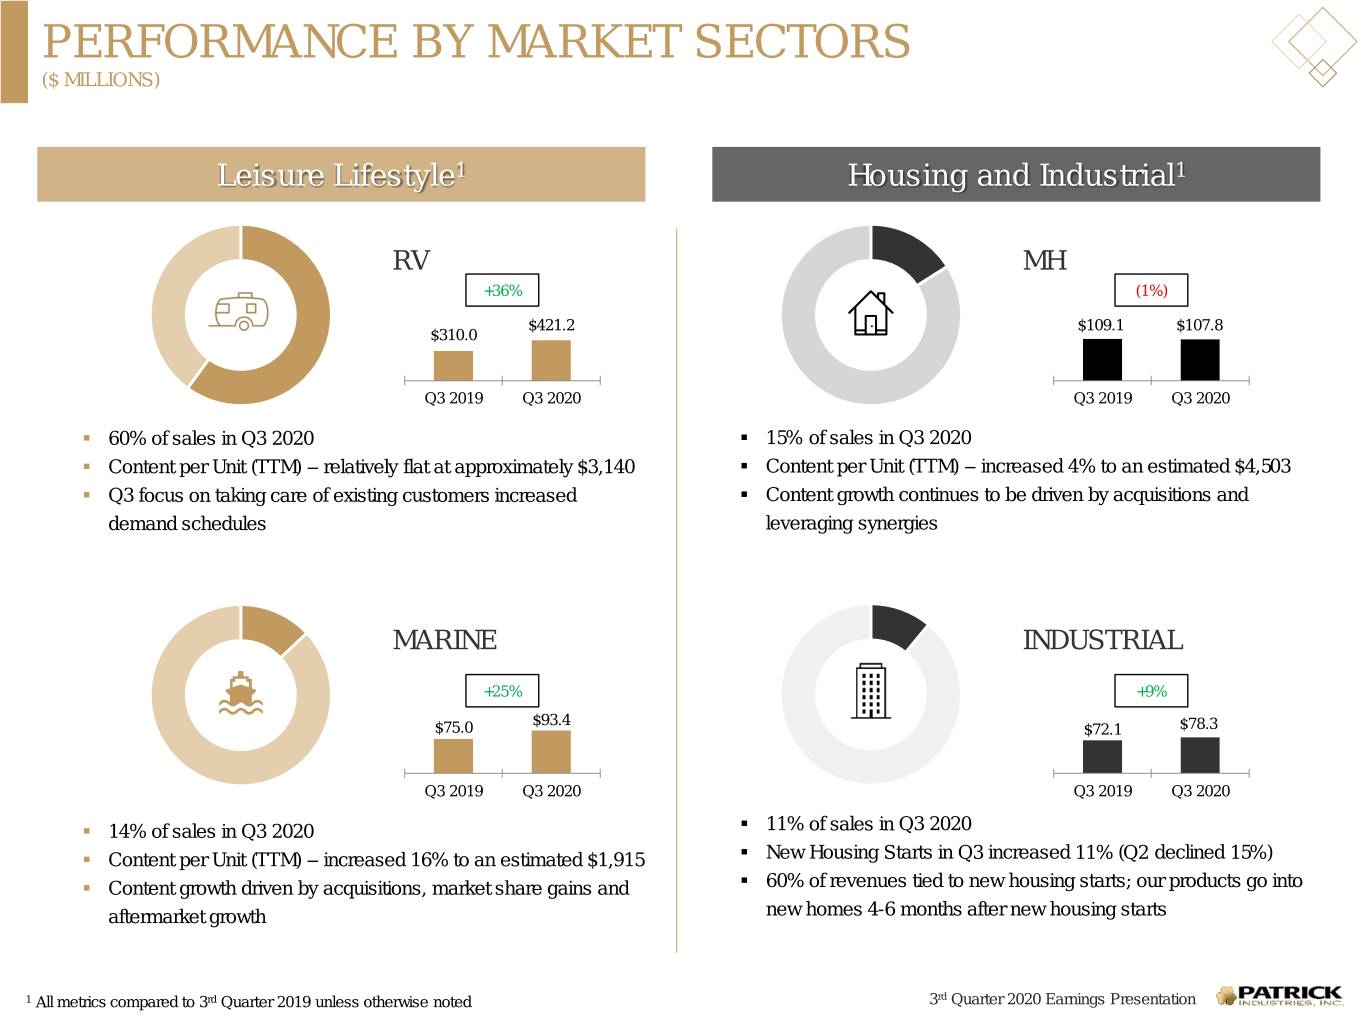
RV (60% Revenue)
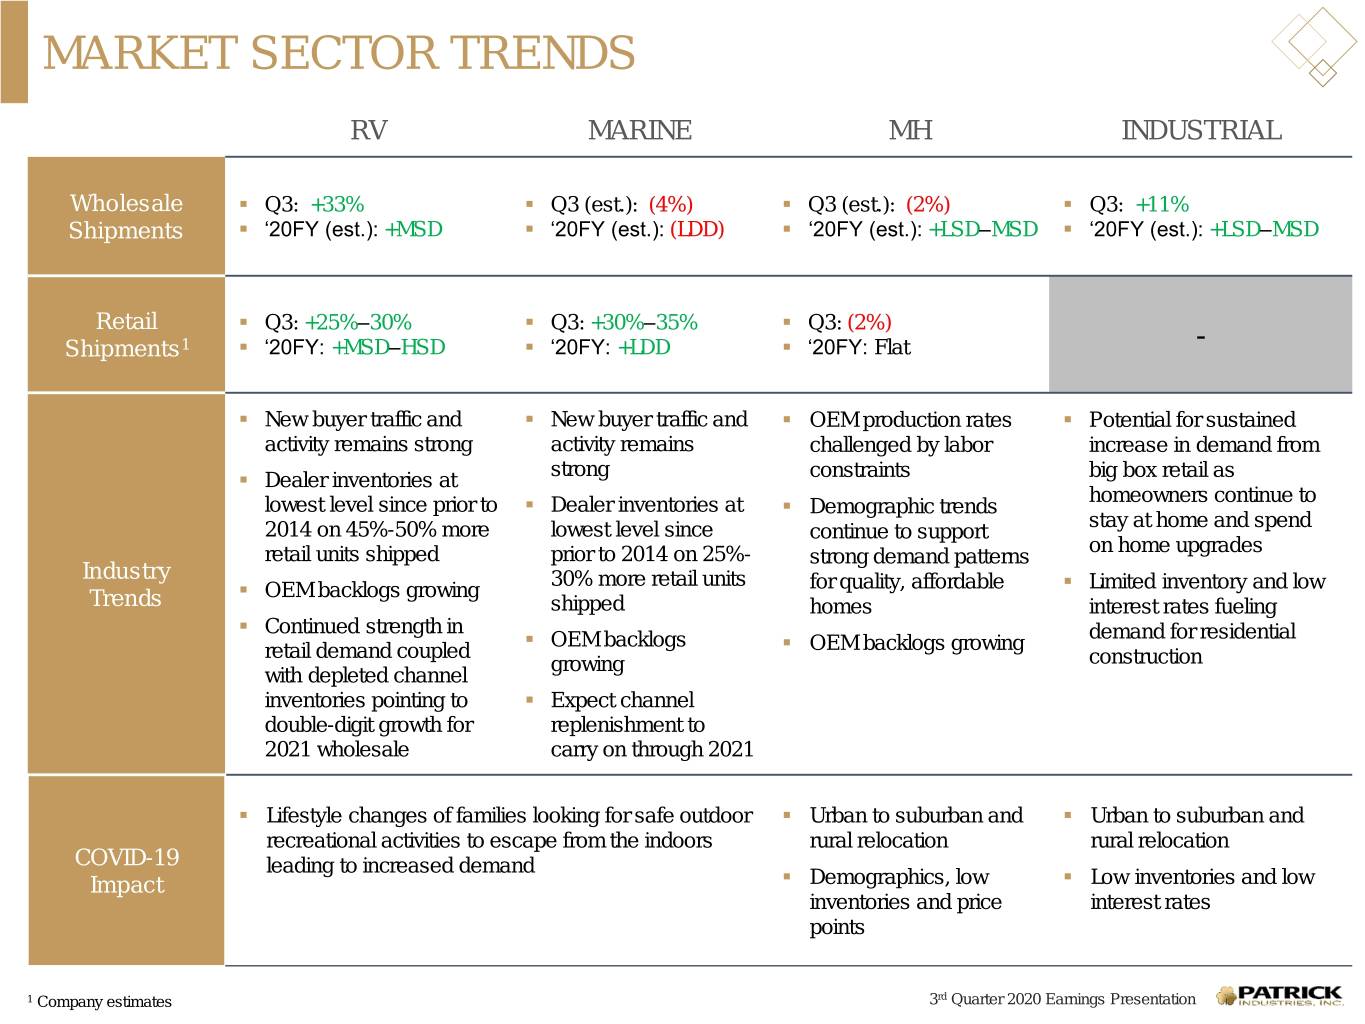
•Revenue of $421.2 million increased 36% while wholesale RV unit shipments increased 33%
•Content per wholesale RV unit (on a trailing twelve-month basis) was relatively flat at approximately $3,140
Marine (14% Revenue)
•Revenue of $93.4 million increased 25% while estimated wholesale powerboat shipments decreased 4%
•Estimated content per wholesale powerboat unit (on a trailing twelve-month basis) increased 16% to $1,915
MH (15% Revenue)
•Revenue of $107.8 million decreased 1% while estimated wholesale MH unit shipments decreased 2%
•Estimated content per wholesale MH unit (on a trailing twelve-month basis) increased 4% to $4,503
Industrial (11% Revenue)
•Revenue of $78.3 million increased 9% while housing starts increased 11%
"Outdoor recreation has and continues to see, a significant increase in popularity as a result of the COVID-19 environment," said Mr. Nemeth. "Our leisure lifestyle markets–RV and marine–provide ideal outlets for multiple generations of friends and family to spend quality time together in both the COVID-19 and post COVID-19 environment. Our industrial market has benefited from an increase in housing starts and home improvement activity, and our MH market, while affected by short-term labor constraints, has recovered from COVID-19 disruptions with increasing backlogs."
COVID-19 Business Impact
As previously disclosed, the Company suspended operations at certain of its facilities from late March 2020 through early May 2020 as a result of production shutdowns by certain OEM customers in response to the COVID-19 pandemic. The Company successfully implemented CDC, state and local safety best practices at its facilities as we began to increase production levels in early May, and we continue to provide a healthy and safe environment for our team members as they work to safely accommodate increased demand in our end markets.
Balance Sheet, Cash Flow and Capital Allocation
Operating cash flow for the third quarter of 2020 was $73.4 million, an increase of 160%, from $28.2 million in the third quarter of 2019. Operating cash flows of $112.8 million for the nine months ended September 27, 2020 decreased 8% compared to the prior year, primarily reflecting the impact to net income related to COVID-19 business disruptions that largely affected second quarter 2020 operating results. The Company invested $99.2 million in business acquisitions in the third quarter of 2020 to expand its product offerings and geographic presence in the RV, marine and industrial end markets, with year-to-date investments in business acquisitions totaling $124.0 million. Capital expenditures in the third quarter of 2020 totaled $10.9 million, an increase of 168%, compared to $4.0 million in the third quarter of 2019. The increase in capital spending is facilitating strategic capacity expansion in certain of our facilities in response to, and in anticipation of, increased demand in our end markets that began in the latter half of the second quarter of 2020, and is
2
currently expected to continue into and through 2021. The Company currently expects capital expenditures to total approximately $35 million for full year 2020.
In alignment with our dividend policy and capital allocation strategy, the Company returned $5.7 million to shareholders in the third quarter of 2020 in the form of dividends, with year-to-date dividends totaling $17.3 million, and resumed share repurchases with 88,950 shares repurchased in the amount of $4.7 million during the third quarter of 2020 and 545,105 shares repurchased year-to-date in the amount of $20.3 million.
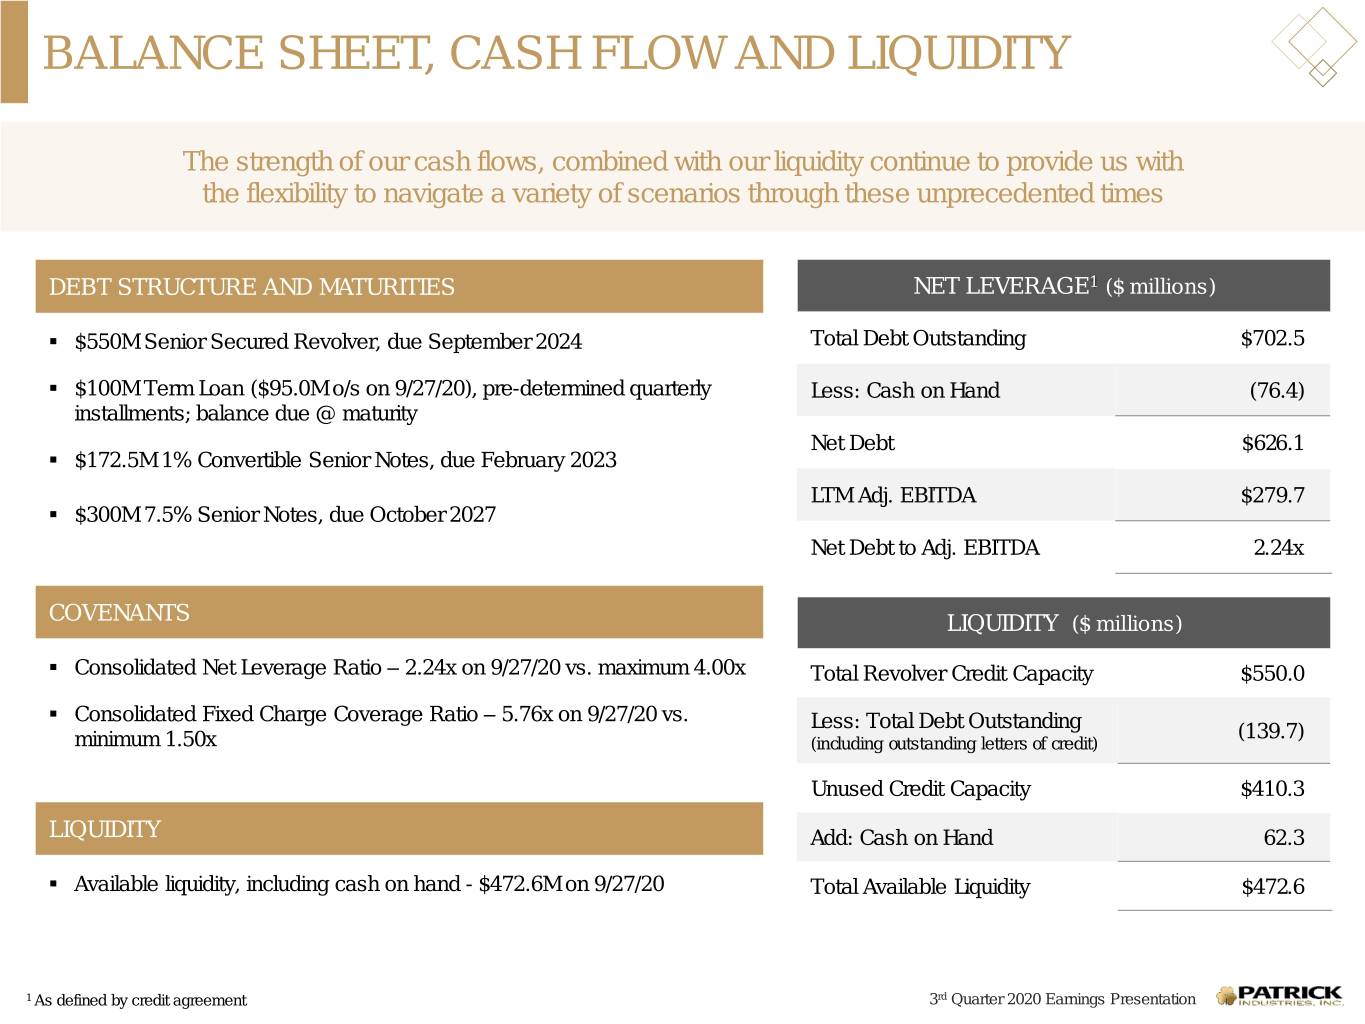
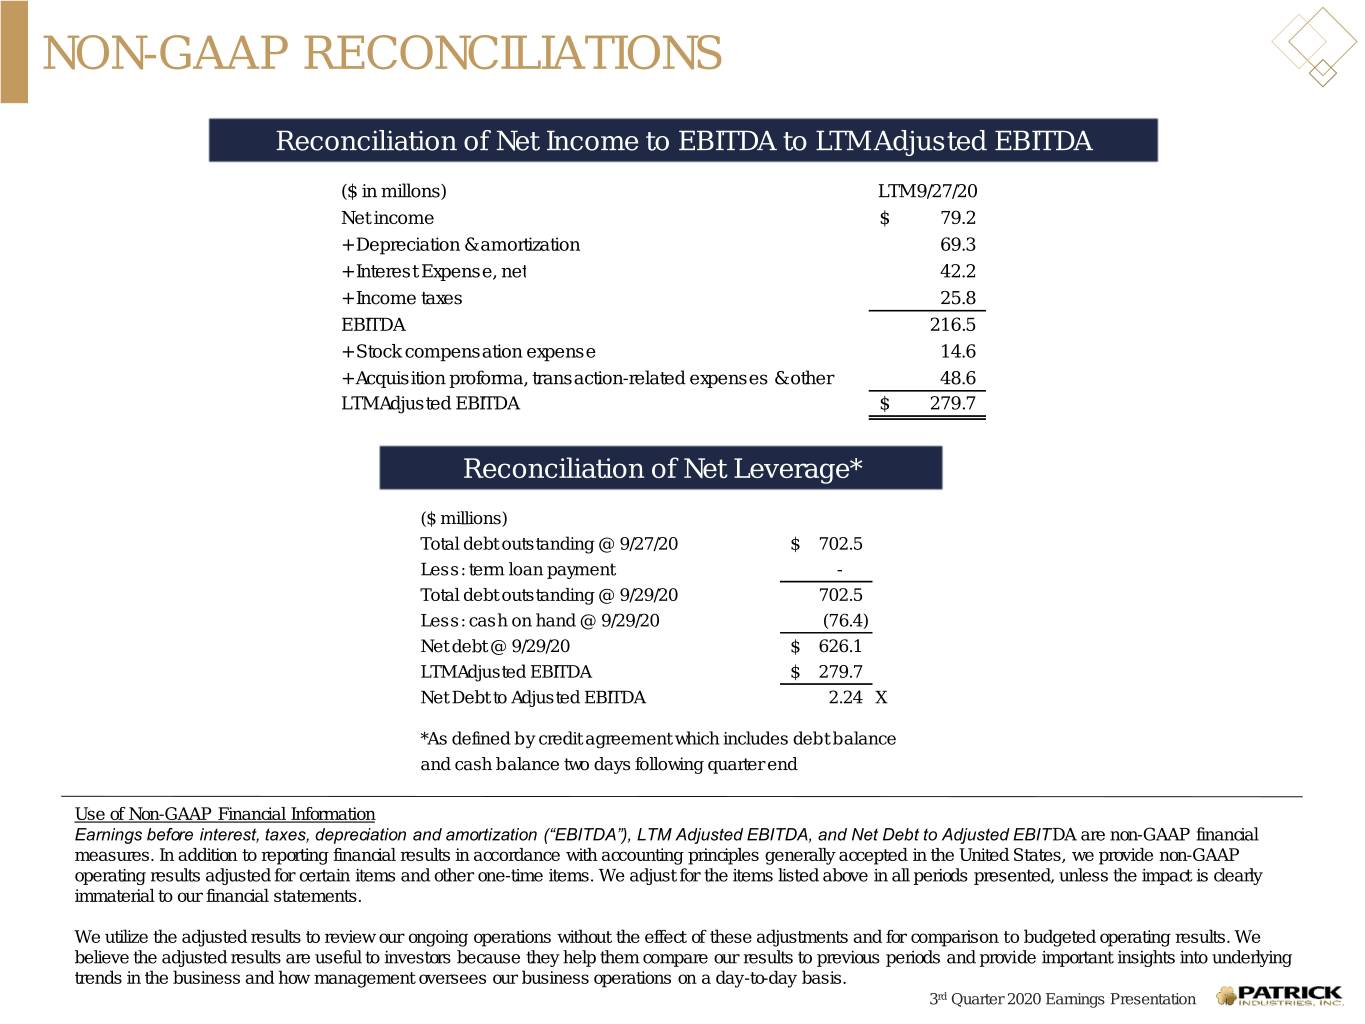
The Company’s net debt at the end of the quarter was approximately $640 million, resulting in a net leverage ratio of 2.2x (as calculated in accordance with our credit agreement). Available liquidity, comprised of borrowing availability under the Company’s credit facility and $62.3 million of cash on hand, was approximately $473 million, with no major debt maturities until 2023.
Business Outlook
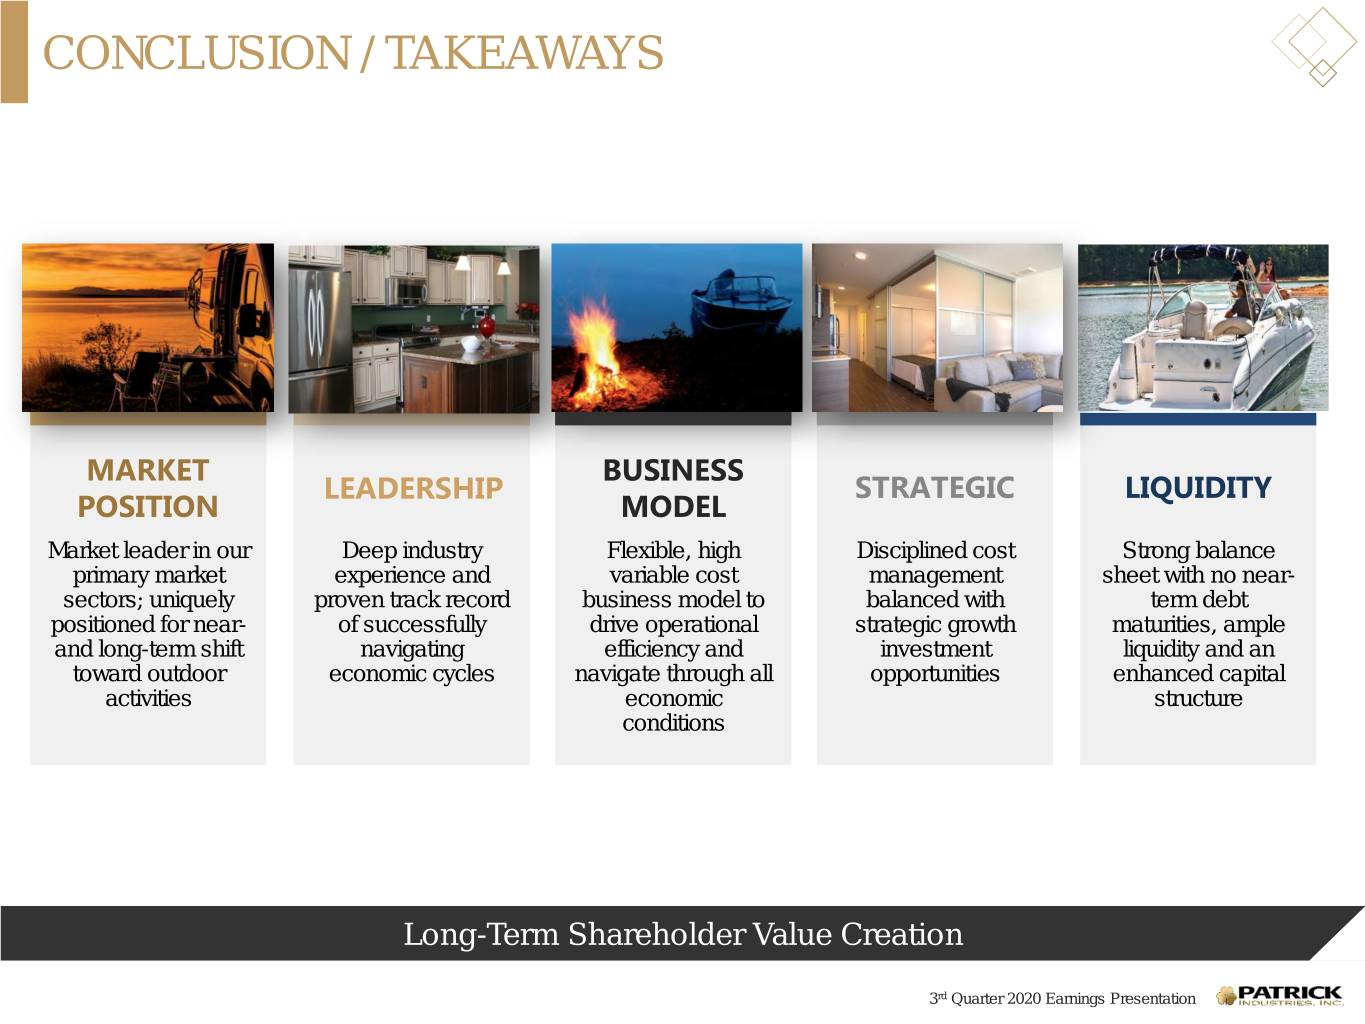
"Momentum in our RV and marine sectors is expected to remain strong, and our housing and industrial markets are experiencing tailwinds with low interest rates, an increase in home improvement activity, and urban to suburban and rural relocation trends," said Mr. Nemeth. “We have strategically and aggressively pulled forward certain capital expenditure initiatives to ensure that we are in the best position possible with continued available capacity to support and grow with our customers for the 2021 model season and beyond. Our strong cash flows and liquidity allow us to invest in our businesses, continue to deploy strategic capital, and capitalize on growth opportunities as they arise in support of expansion necessary to serve our primary end markets over the long-term."
Conference Call Webcast
As previously announced, Patrick Industries will host an online webcast of its third quarter 2020 earnings conference call that can be accessed on the Company’s website, www.patrickind.com, under “Investor Relations,” on Thursday, October 29, 2020 at 10:00 a.m. Eastern time. In addition, a supplemental earnings presentation can be accessed on the Company’s website, www.patrickind.com under “Investor Relations - Presentations.”
About Patrick Industries, Inc.
Patrick Industries, Inc. is a major manufacturer and distributor of component products and building products serving the recreational vehicle, marine, manufactured housing, residential housing, high-rise, hospitality, kitchen cabinet, office and household furniture, fixtures and commercial furnishings, and other industrial markets and operates coast-to-coast in various locations throughout the United States and in Canada, China and the Netherlands. Patrick’s major manufactured products include decorative vinyl and paper laminated panels, countertops, fabricated aluminum products, wrapped profile mouldings, slide-out trim and fascia, cabinet doors and components, hardwood furniture, fiberglass bath fixtures and tile systems, thermoformed shower surrounds, specialty bath and closet building products, fiberglass and plastic helm systems and component products, wiring and wire harnesses, boat covers, towers, tops and frames, electrical systems components including instrument and dash panels, softwoods lumber, interior passage doors, air handling products, RV painting, slotwall panels and components, aluminum fuel tanks, and CNC molds and composite parts and other products. The Company also distributes drywall and drywall finishing products, electronics and audio systems components, wiring, electrical and plumbing products, appliances, cement siding, raw and processed lumber, FRP products, interior passage doors, roofing products, tile, laminate and ceramic flooring, shower doors, furniture, fireplaces and surrounds, interior and exterior lighting products, and other miscellaneous products, in addition to providing transportation and logistics services.
3
Use of Financial Metrics
In addition to reporting financial results in accordance with U.S. GAAP, the Company also provides financial metrics, such as net leverage ratio, RV content per unit, estimated marine and MH content per unit, net debt and available liquidity, which we believe are important measures of the Company's business performance. These metrics should not be considered alternatives to U.S. GAAP. Our computations of net leverage ratio, content per unit, net debt and available liquidity may differ from similarly titled measures used by others. You should not consider these metrics in isolation or as substitutes for an analysis of our results as reported under U.S. GAAP. Beginning in the third quarter of 2020, we calculate marine content per unit based on estimated wholesale powerboat unit shipments, which we believe better represents the relationship between our sales and marine OEM production, rather than based on estimated retail powerboat unit sales.
Cautionary Statement Regarding Forward-Looking Statements
This press release contains certain statements related to future results, our intentions, beliefs and expectations or predictions for the future, which are forward-looking statements as that term is defined in the Private Securities Litigation Reform Act of 1995. These forward-looking statements involve a number of risks and uncertainties that could cause actual results to differ materially from either historical or anticipated results depending on a variety of factors. Potential factors that could impact results include: the impact of the continuing financial and operational uncertainty due to the COVID-19 pandemic, including its impact on the overall economy, our sales, customers, operations, team members, suppliers, and the countries where we have operations or from which we source products and raw materials, such as China; adverse economic and business conditions, including cyclicality and seasonality in the industries we sell our products; the deterioration of the financial condition of our customers or suppliers; the ability to adjust our production schedules up or down quickly in response to rapid changes in demand; the loss of a significant customer; changes in consumer preferences; pricing pressures due to competition; conditions in the credit market limiting the ability of consumers and wholesale customers to obtain retail and wholesale financing for RVs, manufactured homes, and marine products; the imposition of restrictions and taxes on imports of raw materials and components used in our products; information technology performance and security; any increased cost or limited availability of certain raw materials; the impact of governmental and environmental regulations, and our inability to comply with them; our level of indebtedness; the ability to remain in compliance with our credit agreement covenants; the availability and costs of labor and production facilities and the impact of labor shortages; inventory levels of retailers and manufacturers; the ability to generate cash flow or obtain financing to fund growth; future growth rates in the Company's core businesses; realization and impact of efficiency improvements and cost reductions; the successful integration of acquisitions and other growth initiatives; increases in interest rates and oil and gasoline prices; the ability to retain key executive and management personnel; the disruption of business resulting from natural disasters or other unforeseen events, and adverse weather conditions impacting retail sales.
There can be no assurance that any forward-looking statement will be realized or that actual results will not be significantly different from that set forth in such forward-looking statement. Information about certain risks that could affect our business and cause actual results to differ from those expressed or implied in the forward-looking statements are contained in the section entitled “Risk Factors” in the Company’s Annual Report on Form 10-K for the year ended December 31, 2019, and in the Company's Forms 10-Q for subsequent quarterly periods, which are filed with the Securities and Exchange Commission (“SEC”) and are available on the SEC’s website at www.sec.gov. Each forward-looking statement speaks only as of the date of this press release, and we undertake no obligation to update any forward-looking statement to reflect events or circumstances occurring after the date on which it is made.
Contact:
Julie Ann Kotowski
Investor Relations
574.294.7511
4
| PATRICK INDUSTRIES, INC. | |||||||||||||||||||||||
| CONDENSED CONSOLIDATED STATEMENTS OF INCOME (Unaudited) | |||||||||||||||||||||||
| Third Quarter Ended | Nine Months Ended | ||||||||||||||||||||||
| (thousands except per share data) | September 27, 2020 | September 29, 2019 | September 27, 2020 | September 29, 2019 | |||||||||||||||||||
| NET SALES | $ | 700,707 | $ | 566,186 | $ | 1,713,984 | $ | 1,787,622 | |||||||||||||||
| Cost of goods sold | 567,210 | 461,851 | 1,397,285 | 1,464,078 | |||||||||||||||||||
| GROSS PROFIT | 133,497 | 104,335 | 316,699 | 323,544 | |||||||||||||||||||
| Operating Expenses: | |||||||||||||||||||||||
| Warehouse and delivery | 25,263 | 23,917 | 70,204 | 74,228 | |||||||||||||||||||
| Selling, general and administrative | 38,184 | 33,817 | 105,681 | 104,403 | |||||||||||||||||||
| Amortization of intangible assets | 10,221 | 9,191 | 29,600 | 26,448 | |||||||||||||||||||
| Total operating expenses | 73,668 | 66,925 | 205,485 | 205,079 | |||||||||||||||||||
| OPERATING INCOME | 59,829 | 37,410 | 111,214 | 118,465 | |||||||||||||||||||
| Interest expense, net | 10,507 | 8,603 | 31,820 | 26,222 | |||||||||||||||||||
| Income before income taxes | 49,322 | 28,807 | 79,394 | 92,243 | |||||||||||||||||||
| Income taxes | 11,986 | 7,490 | 20,157 | 22,661 | |||||||||||||||||||
| NET INCOME | $ | 37,336 | $ | 21,317 | $ | 59,237 | $ | 69,582 | |||||||||||||||
| BASIC NET INCOME PER COMMON SHARE | $ | 1.65 | $ | 0.92 | $ | 2.60 | $ | 3.02 | |||||||||||||||
| DILUTED NET INCOME PER COMMON SHARE | $ | 1.62 | $ | 0.92 | $ | 2.57 | $ | 2.99 | |||||||||||||||
| Weighted average shares outstanding - Basic | 22,674 | 23,076 | 22,784 | 23,073 | |||||||||||||||||||
| Weighted average shares outstanding - Diluted | 23,072 | 23,273 | 23,088 | 23,279 | |||||||||||||||||||
5
| PATRICK INDUSTRIES, INC. | |||||||||||
| CONDENSED CONSOLIDATED STATEMENTS OF FINANCIAL POSITION (Unaudited) | |||||||||||
| As of | |||||||||||
| (thousands) | September 27, 2020 | December 31, 2019 | |||||||||
| ASSETS | |||||||||||
| Current Assets | |||||||||||
| Cash and cash equivalents | $ | 62,347 | $ | 139,390 | |||||||
| Trade receivables, net | 175,533 | 87,536 | |||||||||
| Inventories | 281,374 | 253,870 | |||||||||
| Prepaid expenses and other | 12,580 | 36,038 | |||||||||
| Total current assets | 531,834 | 516,834 | |||||||||
| Property, plant and equipment, net | 197,415 | 180,849 | |||||||||
| Operating lease right-of-use assets | 105,410 | 93,546 | |||||||||
| Goodwill and intangible assets, net | 737,352 | 676,363 | |||||||||
| Deferred financing costs, net | 2,544 | 2,978 | |||||||||
| Other non-current assets | 384 | 423 | |||||||||
| TOTAL ASSETS | $ | 1,574,939 | $ | 1,470,993 | |||||||
| LIABILITIES AND SHAREHOLDERS’ EQUITY | |||||||||||
| Current Liabilities | |||||||||||
| Current maturities of long-term debt | $ | 5,000 | $ | 5,000 | |||||||
| Current operating lease liabilities | 29,565 | 27,694 | |||||||||
| Accounts payable | 117,088 | 96,208 | |||||||||
| Accrued liabilities | 101,296 | 58,033 | |||||||||
| Total current liabilities | 252,949 | 186,935 | |||||||||
| Long-term debt, less current maturities, net | 673,852 | 670,354 | |||||||||
| Long-term operating lease liabilities | 76,873 | 66,467 | |||||||||
| Deferred tax liabilities, net | 26,100 | 27,284 | |||||||||
| Other long-term liabilities | 19,336 | 22,472 | |||||||||
| TOTAL LIABILITIES | 1,049,110 | 973,512 | |||||||||
| SHAREHOLDERS’ EQUITY | |||||||||||
| Common stock | 177,308 | 172,662 | |||||||||
| Additional paid-in-capital | 24,440 | 25,014 | |||||||||
| Accumulated other comprehensive loss | (7,243) | (5,698) | |||||||||
| Retained earnings | 331,324 | 305,503 | |||||||||
| TOTAL SHAREHOLDERS’ EQUITY | 525,829 | 497,481 | |||||||||
| TOTAL LIABILITIES AND SHAREHOLDERS’ EQUITY | $ | 1,574,939 | $ | 1,470,993 | |||||||
6
PATRICK INDUSTRIES, INC.
CONDENSED CONSOLIDATED STATEMENTS OF CASH FLOWS (Unaudited)
| Nine Months Ended | |||||||||||
| (thousands) | September 27, | September 29, | |||||||||
| 2020 | 2019 | ||||||||||
| CASH FLOWS FROM OPERATING ACTIVITIES | |||||||||||
Net income | $ | 59,237 | $ | 69,582 | |||||||
Depreciation and amortization | 52,955 | 46,449 | |||||||||
Stock-based compensation expense | 11,177 | 12,039 | |||||||||
Amortization of convertible notes debt discount | 5,302 | 5,123 | |||||||||
Other adjustments to reconcile net income to net cash provided by operating activities | (536) | (559) | |||||||||
| Change in operating assets and liabilities, net of acquisitions of businesses | (15,377) | (10,601) | |||||||||
Net cash provided by operating activities | 112,758 | 122,033 | |||||||||
| CASH FLOWS FROM INVESTING ACTIVITIES | |||||||||||
Capital expenditures | (22,159) | (22,227) | |||||||||
| Business acquisitions and other investing activities | (123,265) | (17,841) | |||||||||
Net cash used in investing activities | (145,424) | (40,068) | |||||||||
| NET CASH FLOWS (USED IN) PROVIDED BY FINANCING ACTIVITIES | (44,377) | 27,852 | |||||||||
Increase (decrease) in cash and cash equivalents | (77,043) | 109,817 | |||||||||
| Cash and cash equivalents at beginning of period | 139,390 | 6,895 | |||||||||
| Cash and cash equivalents at end of period | $ | 62,347 | $ | 116,712 | |||||||
7