News Release
Patrick Industries, Inc. Reports Third Quarter 2021 Financial Results
Third Quarter 2021 Highlights (compared to Third Quarter 2020 unless otherwise noted)
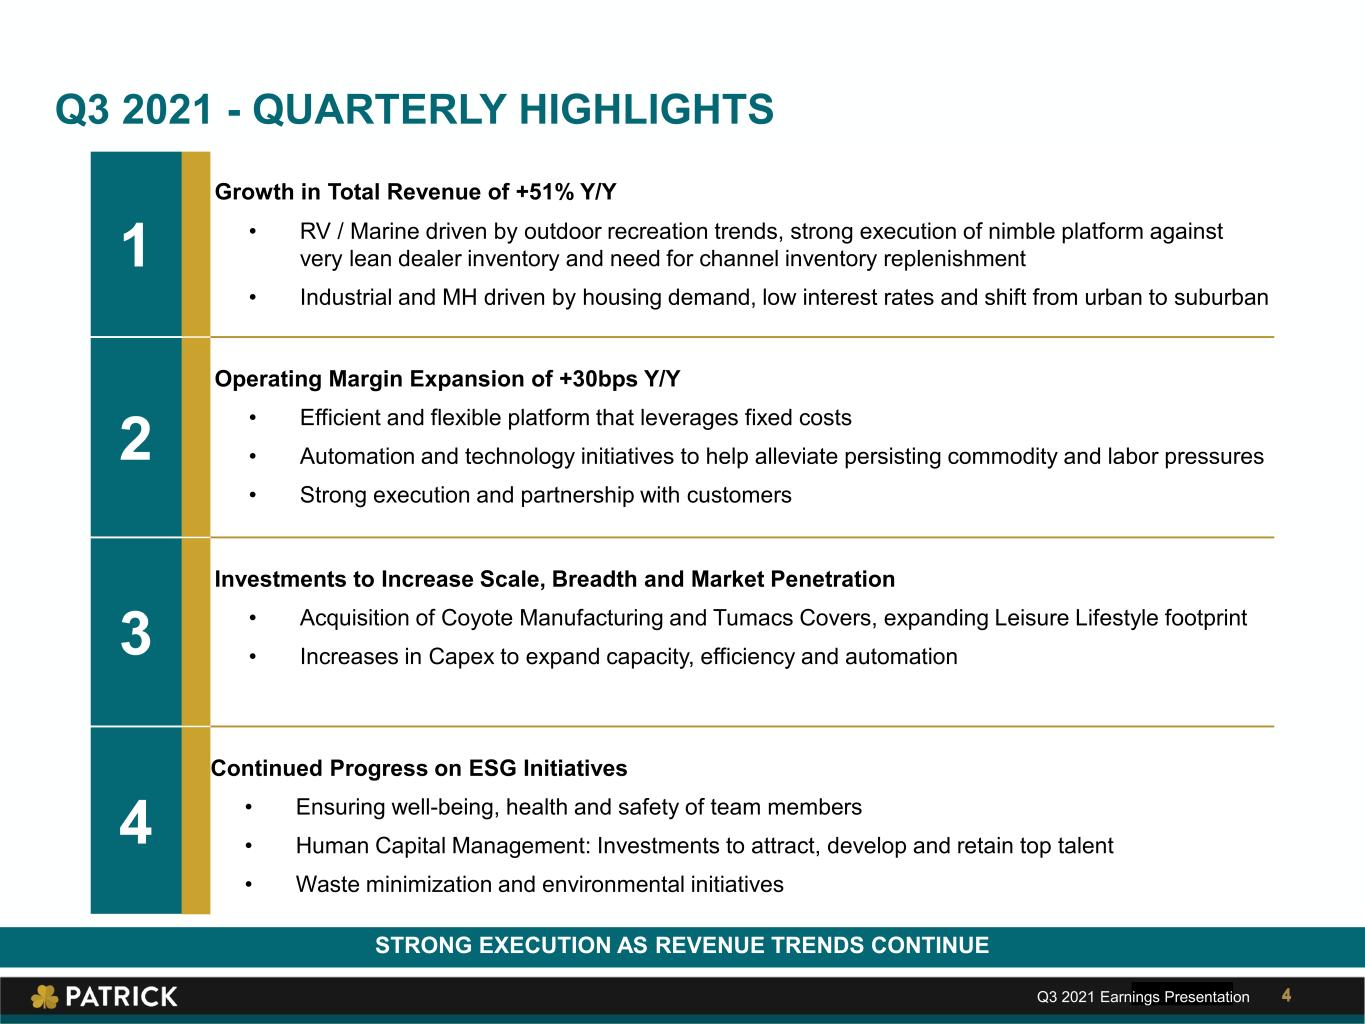
•Net sales of $1.1 billion increased 51%, reflecting momentum in all end markets
•Operating income of $93.3 million increased 56%
•Operating margin of 8.8% increased 30 basis points
•Net income of $57.4 million increased 54%
•Diluted earnings per share of $2.45 increased 51%
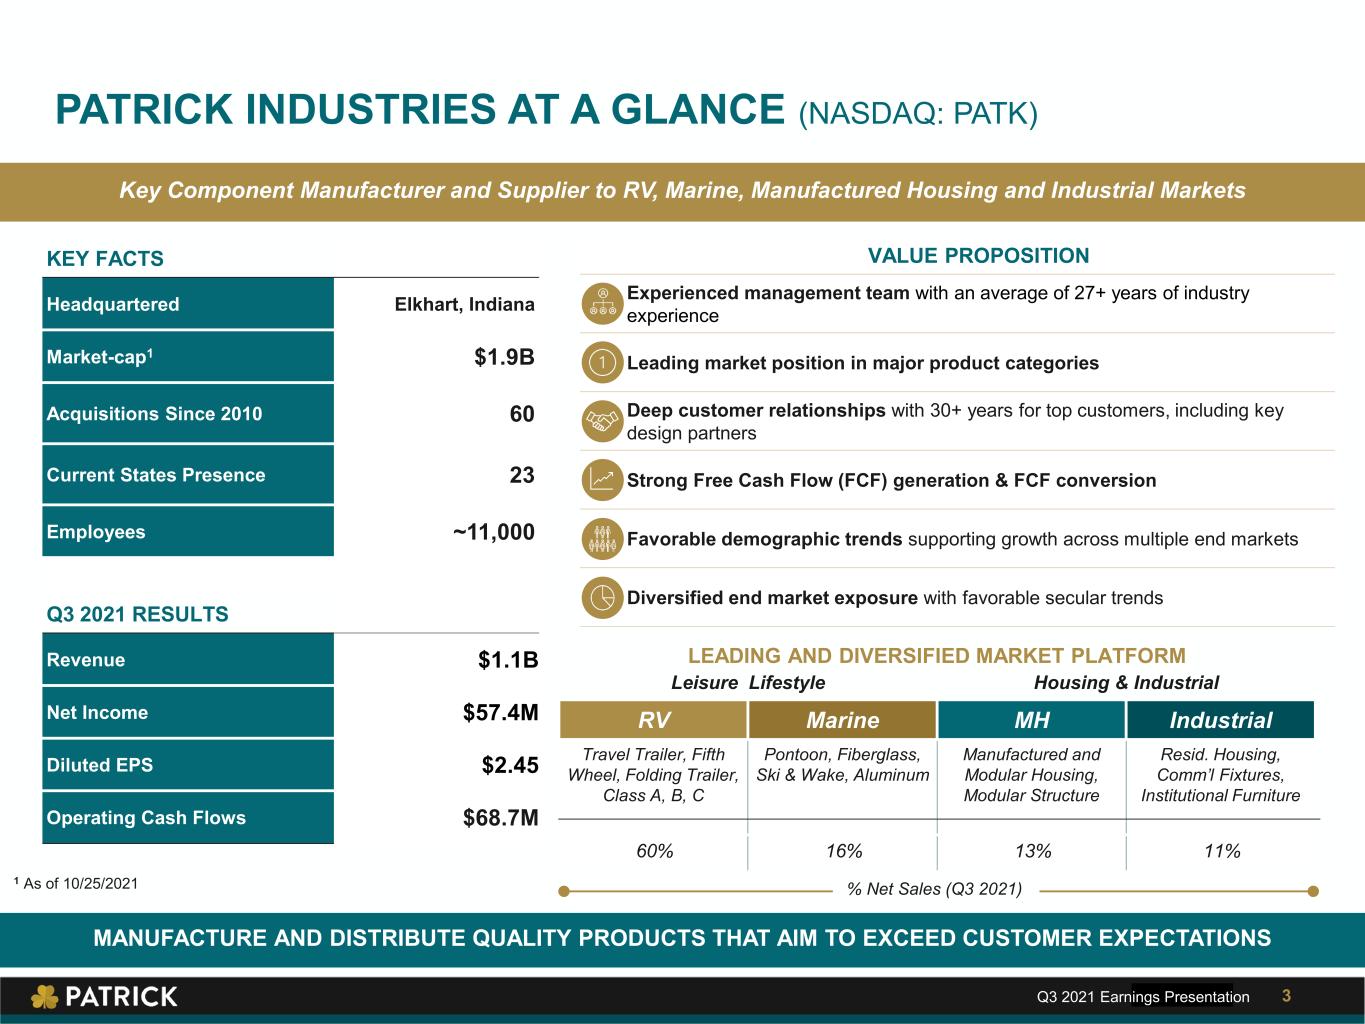
•Operating cash flows of $68.7 million
•Acquisitions of Coyote Manufacturing and Tumacs Covers
ELKHART, IN - October 28, 2021 - Patrick Industries, Inc. (NASDAQ: PATK), a leading component solutions provider for the RV, marine, manufactured housing ("MH") and industrial markets today reported financial results for the third quarter ended September 26, 2021.
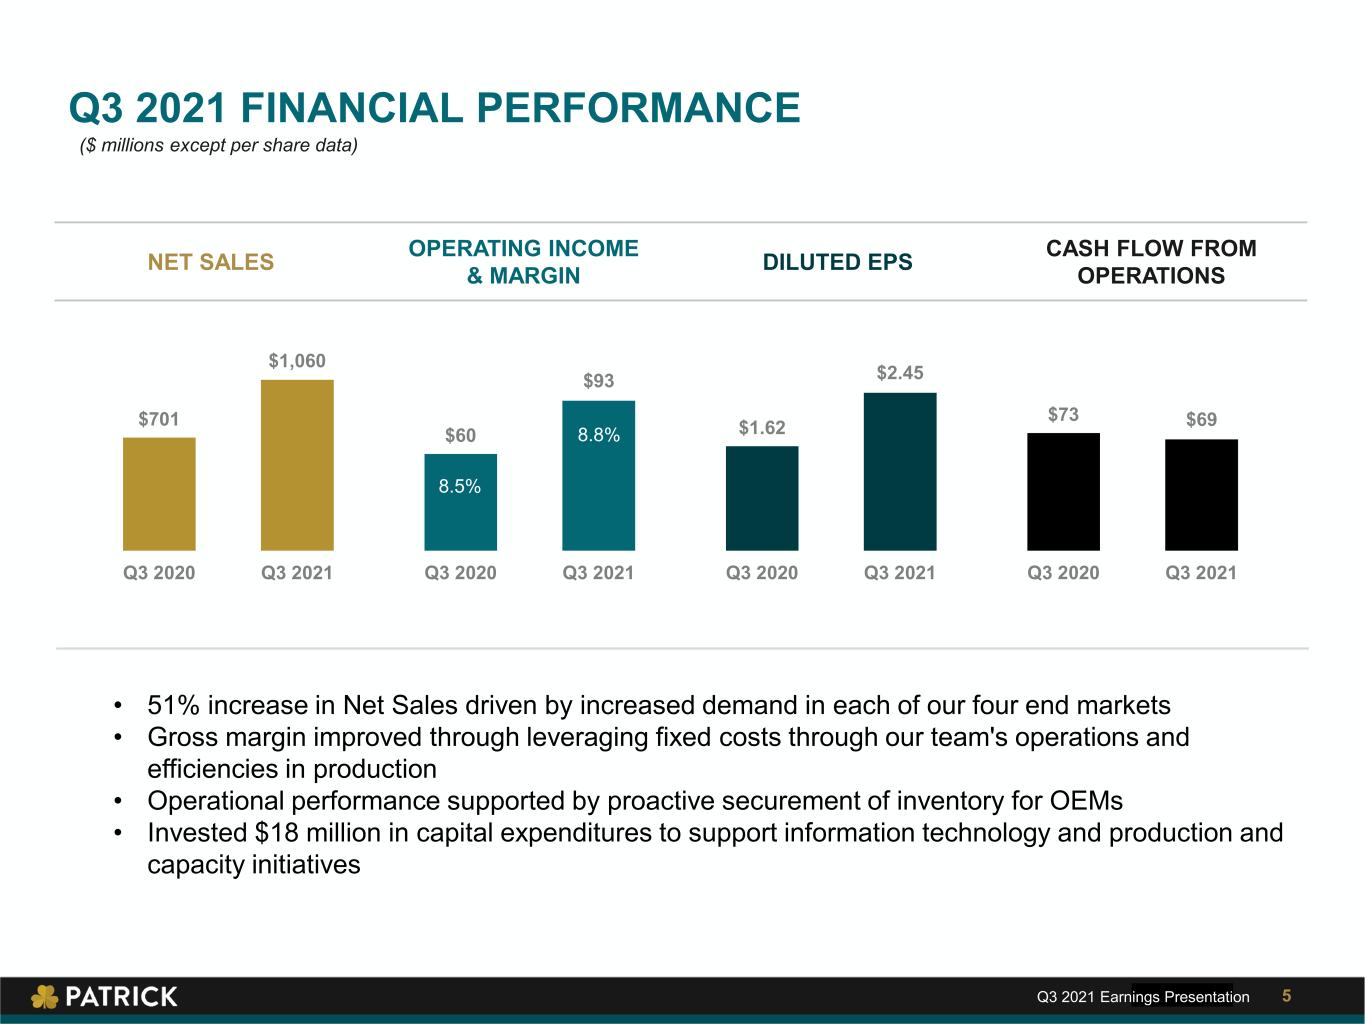
Net sales in the third quarter of 2021 increased $359.5 million, or 51%, to $1.1 billion from $700.7 million in the third quarter of 2020. The increase reflects continued strong performance in our RV and marine leisure lifestyle markets as well as the MH and industrial end markets.
Operating income of $93.3 million increased $33.5 million, or 56%, from $59.8 million in the third quarter of 2020. Operating margin of 8.8% in the third quarter of 2021 increased 30 basis points compared to 8.5% in the same period a year ago.
Net income was $57.4 million, an increase of 54% compared to $37.3 million in the third quarter of 2020. Diluted earnings per share was $2.45, an increase of 51% for the third quarter of 2021 compared to $1.62 for the third quarter of 2020.
"Market conditions across our platform continue to reflect strong trends and expectations while providing good visibility into 2022," said Andy Nemeth, Chief Executive Officer. "The talent, resilience, and creative initiatives of our team members, in combination with the partnership of our customers, helped us to successfully navigate an incredibly complex and dynamic supply chain environment. Retail demand for leisure lifestyle products remains high, and has resulted in decreasing dealer inventories and increasing OEM backlogs despite record industry production levels. At the same time, our sales to the housing and industrial markets continue to benefit from low dealer inventories, attractive financing rates and robust home improvement and remodel activity."
Jeff Rodino, President, said, "During the quarter, we welcomed the Coyote Manufacturing and Tumacs Covers teams into the Patrick family, a continuation of our strategic expansion of our marine portfolio and custom marine solutions capabilities. Additionally, our focus on human capital is translating into investments in our people and the tools they need to create solutions and innovations for our customers, while at the same time we continue to invest in cultural initiatives that support the ongoing development of our team members."
Third Quarter 2021 Revenue by Market Sector (compared to Third Quarter 2020 unless otherwise noted)
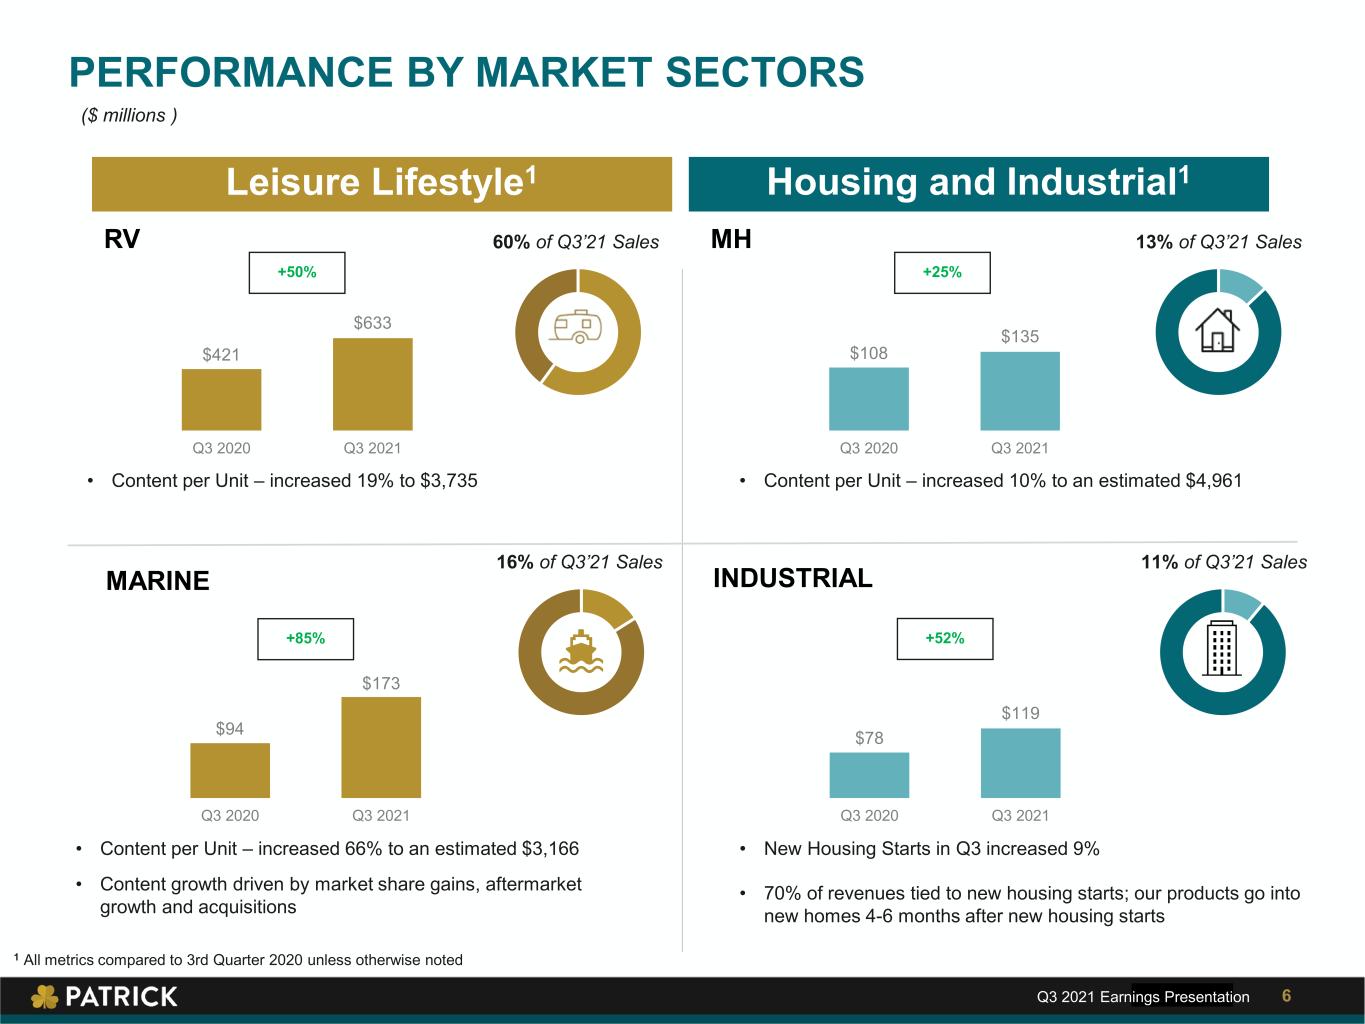
RV (60% of Revenue)
•Revenue of $633.2 million increased 50% while wholesale RV industry unit shipments increased 23%
•Content per wholesale RV unit (on a trailing twelve-month basis) increased 19% to $3,735
Marine (16% of Revenue)
•Revenue of $173.1 million increased 85% while estimated wholesale powerboat industry unit shipments increased 15%
•Estimated content per wholesale powerboat unit (on a trailing twelve-month basis) increased 66% to $3,166
MH (13% of Revenue)
•Revenue of $134.6 million increased 25% while estimated wholesale MH industry unit shipments increased 9%
•Estimated content per wholesale MH unit (on a trailing twelve-month basis) increased 10% to $4,961
Industrial (11% of Revenue)
•Revenue of $119.3 million increased 52% while housing starts increased 9%
Balance Sheet, Cash Flow and Capital Allocation
Operating cash flow for the third quarter of 2021 of $68.7 million decreased 6% compared to $73.4 million in the third quarter of 2020, reflecting continued resource utilization and strategic investment in inventory in support of strong business activity and customer supply needs. Business acquisitions in the third quarter of 2021 totaled $43.5 million, including the previously announced acquisitions of Coyote Manufacturing, a leading designer, fabricator and manufacturer of a variety of steel and aluminum products primarily for the marine OEM market, and Tumacs Covers, a leading manufacturer of custom designed boat covers, canvas frames, and bimini tops, primarily serving marine OEMs and dealers. Capital expenditures in the third quarter of 2021 totaled $17.8 million, compared to $10.9 million in the third quarter of 2020, reflecting continued forward-looking investments in infrastructure and automation initiatives to better align resources for increased scalability and to support customer growth.
In alignment with our capital allocation strategy, we returned $16.8 million to shareholders in the third quarter of 2021, including $10.4 million through opportunistic repurchases of 129,000 shares and $6.4 million of dividends.
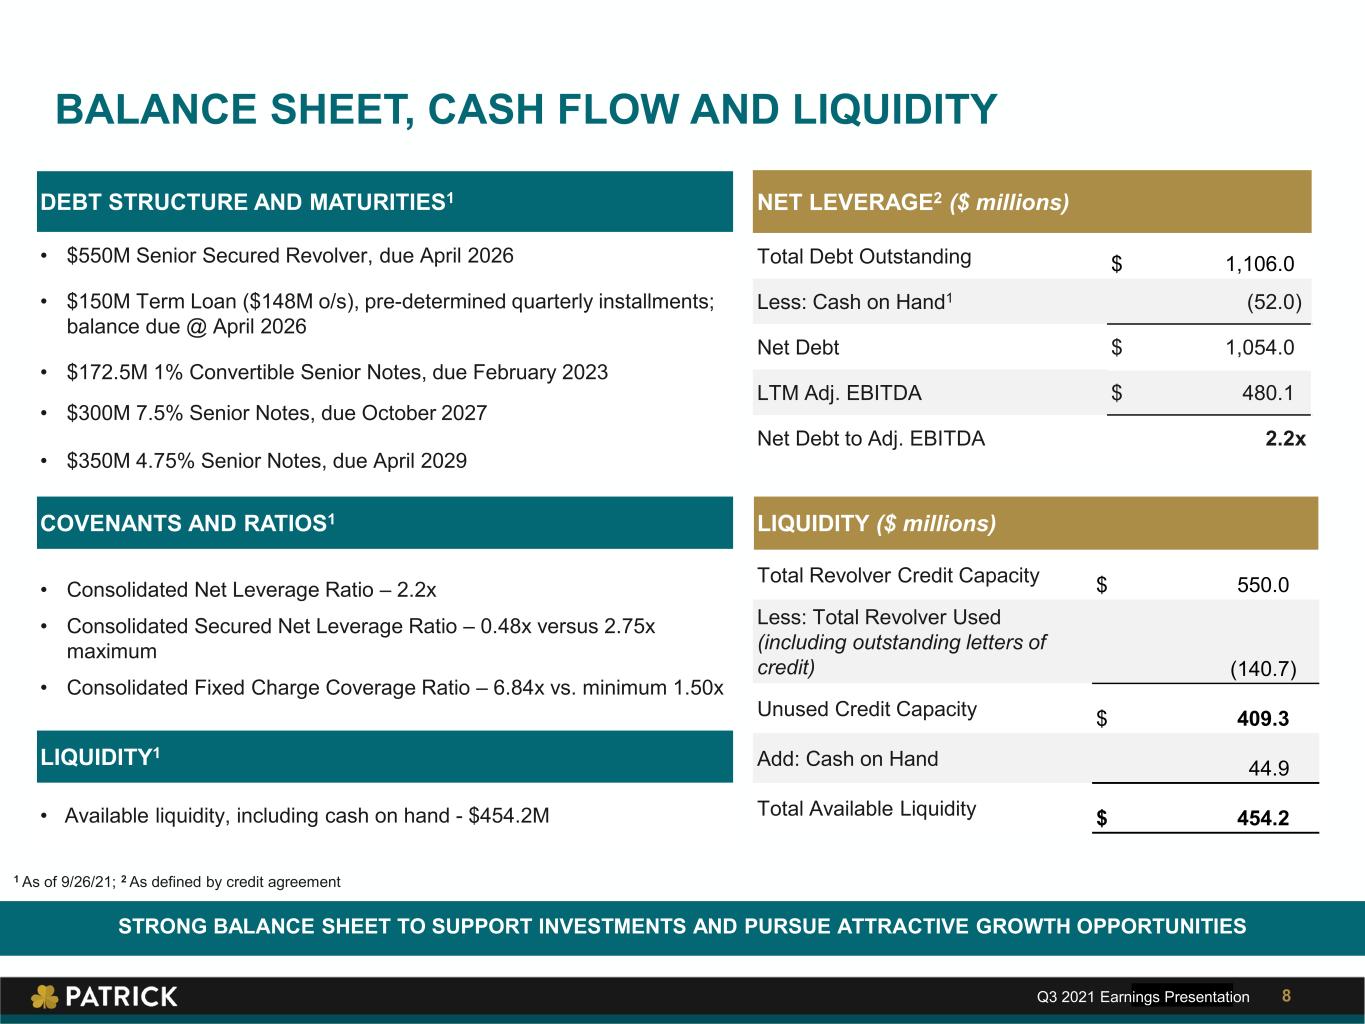
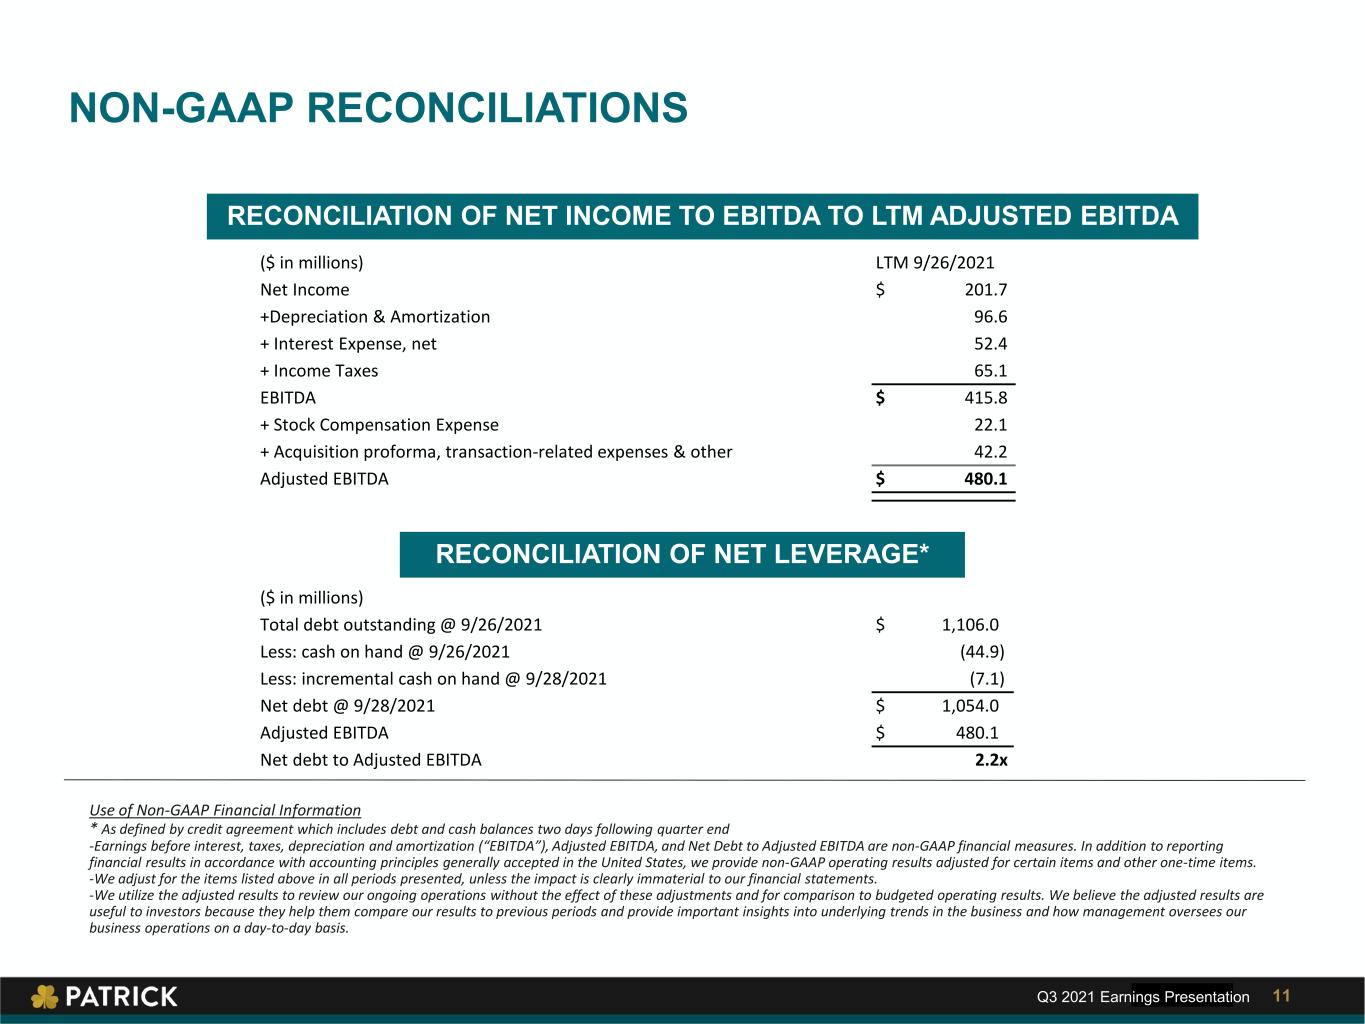
Our net debt at the end of the quarter was approximately $1.1 billion, resulting in a net leverage ratio of 2.2x (as calculated in accordance with our credit agreement). Available liquidity, comprised of borrowing availability under our credit facility and cash on hand, was approximately $454 million.
Business Outlook and Summary
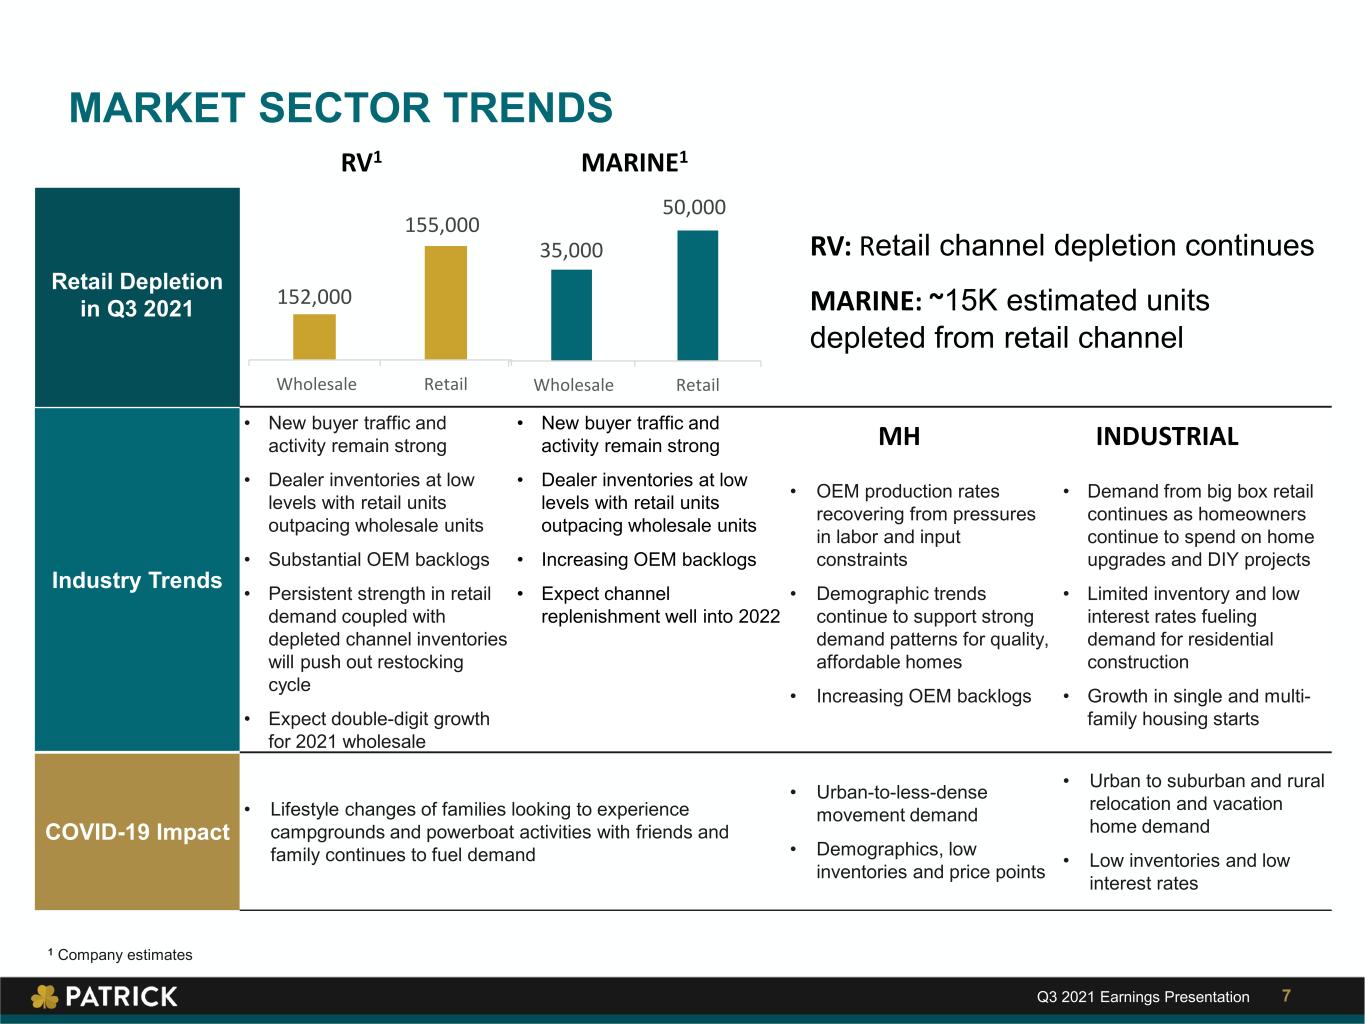
"Retail and wholesale demand patterns and projections continue to point towards an extension of the RV, marine and MH dealer inventory replenishment cycle and the resulting OEM production requirements well into 2022, and likely into 2023," said Mr. Nemeth. "We are heavily focused on automation and innovation opportunities and initiatives across our platform as we plan for fiscal 2022 and beyond to enhance and drive scalability, flexibility, efficiencies, and continuous improvement. Additionally, ongoing supply chain initiatives,
2
supported by our strong liquidity and investments in technology, systems, and human capital, will continue to provide the opportunity to serve our customers as they flex their production models and work to replenish heavily depleted dealer lots and reduce record backlogs. We continue to maintain a patient, disciplined, and focused capital allocation strategy to further drive long-term value for our customers, shareholders, team members, partners, and the communities in which we operate."
Conference Call Webcast
As previously announced, Patrick Industries will host an online webcast of its third quarter 2021 earnings conference call that can be accessed on the Company’s website, www.patrickind.com, under “For Investors,” on Thursday, October 28, 2021 at 10:00 a.m. Eastern time. In addition, a supplemental earnings presentation can be accessed on the Company’s website, www.patrickind.com under “For Investors.”
About Patrick Industries, Inc.
Patrick Industries (NASDAQ: PATK) is a leading component solutions provider for the RV, marine, manufactured housing and various industrial markets – including single and multi-family housing, hospitality, institutional and commercial markets. Founded in 1959, Patrick is based in Elkhart, Indiana, with over 11,000 employees and 160 businesses across the United States.
Use of Financial Metrics
In addition to reporting financial results in accordance with U.S. GAAP, the Company also provides financial metrics, such as net leverage ratio, content per unit, net debt and available liquidity, which we believe are important measures of the Company's business performance. These metrics should not be considered alternatives to U.S. GAAP. Our computations of net leverage ratio, content per unit, net debt and available liquidity may differ from similarly titled measures used by others. We calculate net debt by subtracting cash and cash equivalents from the gross value of debt outstanding. RV wholesale unit shipments are provided by the RV Industry Association. Marine wholesale unit shipments are provided by the National Marine Manufacturers Association. MH wholesale unit shipments are provided by the Manufactured Housing Institute. Housing starts are provided by the U.S. Census Bureau. You should not consider these metrics in isolation or as substitutes for an analysis of our results as reported under U.S. GAAP.
Cautionary Statement Regarding Forward-Looking Statements
This press release contains certain statements related to future results, our intentions, beliefs and expectations or predictions for the future, which are forward-looking statements as that term is defined in the Private Securities Litigation Reform Act of 1995. These forward-looking statements involve a number of risks and uncertainties that could cause actual results to differ materially from either historical or anticipated results depending on a variety of factors. Potential factors that could impact results include: the impact of the continuing financial and operational uncertainty due to the COVID-19 pandemic, including its impact on the overall economy, our sales, customers, operations, team members, suppliers, and the countries where we have operations or from which we source products and raw materials, such as China; adverse economic and business conditions, including cyclicality and seasonality in the industries we sell our products; the deterioration of the financial condition of our customers or suppliers; the ability to adjust our production schedules up or down quickly in response to rapid changes in demand; the loss of a significant customer; changes in consumer preferences; pricing pressures due to competition; conditions in the credit market limiting the ability of consumers and wholesale customers to obtain retail and wholesale financing for RVs, manufactured homes, and marine products; the imposition of restrictions and taxes on imports of raw materials and components used in our products; information technology performance and security; any increased cost or limited availability of certain raw materials; the impact of governmental and environmental regulations, and our inability to comply with them; our level of indebtedness; the ability to remain in compliance with our credit agreement covenants; the availability and costs of labor and production facilities and the impact of labor shortages; inventory levels of retailers and manufacturers; the ability to generate cash flow or obtain financing to fund growth; future growth rates in the Company's core businesses; realization and impact of efficiency improvements and cost reductions; the successful integration of acquisitions and other
3
growth initiatives; increases in interest rates and oil and gasoline prices; the ability to retain key executive and management personnel; the disruption of business resulting from natural disasters or other unforeseen events, and adverse weather conditions impacting retail sales.
There can be no assurance that any forward-looking statement will be realized or that actual results will not be significantly different from that set forth in such forward-looking statement. Information about certain risks that could affect our business and cause actual results to differ from those expressed or implied in the forward-looking statements are contained in the section entitled “Risk Factors” in the Company’s Annual Report on Form 10-K for the year ended December 31, 2020, and in the Company's Forms 10-Q for subsequent quarterly periods, which are filed with the Securities and Exchange Commission (“SEC”) and are available on the SEC’s website at www.sec.gov. Each forward-looking statement speaks only as of the date of this press release, and we undertake no obligation to update any forward-looking statement to reflect events or circumstances occurring after the date on which it is made.
Contact:
Julie Ann Kotowski
Investor Relations
574.294.7511
4
| PATRICK INDUSTRIES, INC. | |||||||||||||||||||||||
| CONDENSED CONSOLIDATED STATEMENTS OF INCOME (Unaudited) | |||||||||||||||||||||||
| Third Quarter Ended | Nine Months Ended | ||||||||||||||||||||||
| (thousands except per share data) | September 26, 2021 | September 27, 2020 | September 26, 2021 | September 27, 2020 | |||||||||||||||||||
| NET SALES | $ | 1,060,177 | $ | 700,707 | $ | 2,930,613 | $ | 1,713,984 | |||||||||||||||
| Cost of goods sold | 852,016 | 567,210 | 2,356,443 | 1,397,285 | |||||||||||||||||||
| GROSS PROFIT | 208,161 | 133,497 | 574,170 | 316,699 | |||||||||||||||||||
| Operating Expenses: | |||||||||||||||||||||||
| Warehouse and delivery | 35,885 | 25,263 | 100,613 | 70,204 | |||||||||||||||||||
| Selling, general and administrative | 64,245 | 38,184 | 175,842 | 105,681 | |||||||||||||||||||
| Amortization of intangible assets | 14,758 | 10,221 | 40,695 | 29,600 | |||||||||||||||||||
| Total operating expenses | 114,888 | 73,668 | 317,150 | 205,485 | |||||||||||||||||||
| OPERATING INCOME | 93,273 | 59,829 | 257,020 | 111,214 | |||||||||||||||||||
| Interest expense, net | 15,436 | 10,507 | 41,195 | 31,820 | |||||||||||||||||||
| Income before income taxes | 77,837 | 49,322 | 215,825 | 79,394 | |||||||||||||||||||
| Income taxes | 20,440 | 11,986 | 51,930 | 20,157 | |||||||||||||||||||
| NET INCOME | $ | 57,397 | $ | 37,336 | $ | 163,895 | $ | 59,237 | |||||||||||||||
| BASIC NET INCOME PER COMMON SHARE | $ | 2.52 | $ | 1.65 | $ | 7.18 | $ | 2.60 | |||||||||||||||
| DILUTED NET INCOME PER COMMON SHARE | $ | 2.45 | $ | 1.62 | $ | 7.01 | $ | 2.57 | |||||||||||||||
| Weighted average shares outstanding - Basic | 22,789 | 22,674 | 22,826 | 22,784 | |||||||||||||||||||
| Weighted average shares outstanding - Diluted | 23,403 | 23,072 | 23,375 | 23,088 | |||||||||||||||||||
5
| PATRICK INDUSTRIES, INC. | |||||||||||
| CONDENSED CONSOLIDATED STATEMENTS OF FINANCIAL POSITION (Unaudited) | |||||||||||
| As of | |||||||||||
| (thousands) | September 26, 2021 | December 31, 2020 | |||||||||
| ASSETS | |||||||||||
| Current Assets | |||||||||||
| Cash and cash equivalents | $ | 44,882 | $ | 44,767 | |||||||
| Trade receivables, net | 292,932 | 132,505 | |||||||||
| Inventories | 485,766 | 312,809 | |||||||||
| Prepaid expenses and other | 39,205 | 37,982 | |||||||||
| Total current assets | 862,785 | 528,063 | |||||||||
| Property, plant and equipment, net | 309,170 | 251,493 | |||||||||
| Operating lease right-of-use assets | 142,719 | 117,816 | |||||||||
| Goodwill and intangible assets, net | 1,036,995 | 852,076 | |||||||||
| Other non-current assets | 6,789 | 3,987 | |||||||||
| TOTAL ASSETS | $ | 2,358,458 | $ | 1,753,435 | |||||||
| LIABILITIES AND SHAREHOLDERS’ EQUITY | |||||||||||
| Current Liabilities | |||||||||||
| Current maturities of long-term debt | $ | 7,500 | $ | 7,500 | |||||||
| Current operating lease liabilities | 36,955 | 30,901 | |||||||||
| Accounts payable | 219,153 | 105,786 | |||||||||
| Accrued liabilities | 145,865 | 83,202 | |||||||||
| Total current liabilities | 409,473 | 227,389 | |||||||||
| Long-term debt, less current maturities, net | 1,077,664 | 810,907 | |||||||||
| Long-term operating lease liabilities | 107,753 | 88,175 | |||||||||
| Deferred tax liabilities, net | 49,344 | 39,516 | |||||||||
| Other long-term liabilities | 22,176 | 28,007 | |||||||||
| TOTAL LIABILITIES | 1,666,410 | 1,193,994 | |||||||||
| SHAREHOLDERS’ EQUITY | |||||||||||
| Common stock | 195,402 | 180,892 | |||||||||
| Additional paid-in-capital | 23,981 | 24,387 | |||||||||
| Accumulated other comprehensive loss | (3,024) | (6,052) | |||||||||
| Retained earnings | 475,689 | 360,214 | |||||||||
| TOTAL SHAREHOLDERS’ EQUITY | 692,048 | 559,441 | |||||||||
| TOTAL LIABILITIES AND SHAREHOLDERS’ EQUITY | $ | 2,358,458 | $ | 1,753,435 | |||||||
6
PATRICK INDUSTRIES, INC.
CONDENSED CONSOLIDATED STATEMENTS OF CASH FLOWS (Unaudited)
| Nine Months Ended | |||||||||||
| (thousands) | September 26, | September 27, | |||||||||
| 2021 | 2020 | ||||||||||
| CASH FLOWS FROM OPERATING ACTIVITIES | |||||||||||
| Net income | $ | 163,895 | $ | 59,237 | |||||||
| Depreciation and amortization | 76,298 | 52,955 | |||||||||
| Stock-based compensation expense | 17,307 | 11,177 | |||||||||
| Amortization of convertible notes debt discount | 5,528 | 5,302 | |||||||||
| Other adjustments to reconcile net income to net cash provided by operating activities | 8,184 | (536) | |||||||||
| Change in operating assets and liabilities, net of acquisitions of businesses | (123,795) | (15,377) | |||||||||
| Net cash provided by operating activities | 147,417 | 112,758 | |||||||||
| CASH FLOWS FROM INVESTING ACTIVITIES | |||||||||||
| Capital expenditures | (44,155) | (22,159) | |||||||||
| Business acquisitions and other investing activities | (299,561) | (123,265) | |||||||||
| Net cash used in investing activities | (343,716) | (145,424) | |||||||||
| NET CASH FLOWS PROVIDED BY (USED IN) FINANCING ACTIVITIES | 196,414 | (44,377) | |||||||||
| Increase (decrease) in cash and cash equivalents | 115 | (77,043) | |||||||||
| Cash and cash equivalents at beginning of year | 44,767 | 139,390 | |||||||||
| Cash and cash equivalents at end of period | $ | 44,882 | $ | 62,347 | |||||||
7