
March 2023 Investor Presentation 1 Investor Presentation March 2023
March 2023 Investor Presentation 2 FORWARD LOOKING STATEMENTS This presentation contains certain statements related to future results, our intentions, beliefs and expectations or predictions for the future which are forward-looking statements as that term is defined in the Private Securities Litigation Reform Act of 1995. These forward-looking statements involve a number of risks and uncertainties that could cause actual results to differ materially from either historical or anticipated results depending on a variety of factors. These risks and uncertainties include, but are not limited to, the impact of the continuing financial and operational uncertainty due to the COVID-19 pandemic, including its impact on the overall economy, our sales, customers, operations, team members and suppliers. Further information concerning the Company and its business, including factors that potentially could materially affect the Company’s financial results, is contained in the Company’s filings with the Securities and Exchange Commission. This presentation includes market and industry data, forecasts and valuations that have been obtained from independent consultant reports, publicly available information, various industry publications and other published industry sources. Although we believe these sources are reliable, we have not independently verified the information and cannot make any representation as to the accuracy or completeness of such information. We disclaim any obligation or undertaking to disseminate any updates or revisions to any forward-looking statements contained in this presentation or to reflect any change in our expectations after the date of this presentation or any change in events, conditions or circumstances on which any statement is based. Use of Non-GAAP Financial Measures This presentation contains non-GAAP financial measures. These measures, the purposes for which management uses them, why management believes they are useful to investors, and a reconciliation to the most directly comparable GAAP financial measures can be found in the Appendix of this presentation. All references to profit measures and earnings per share on a comparable basis exclude items that affect comparability.
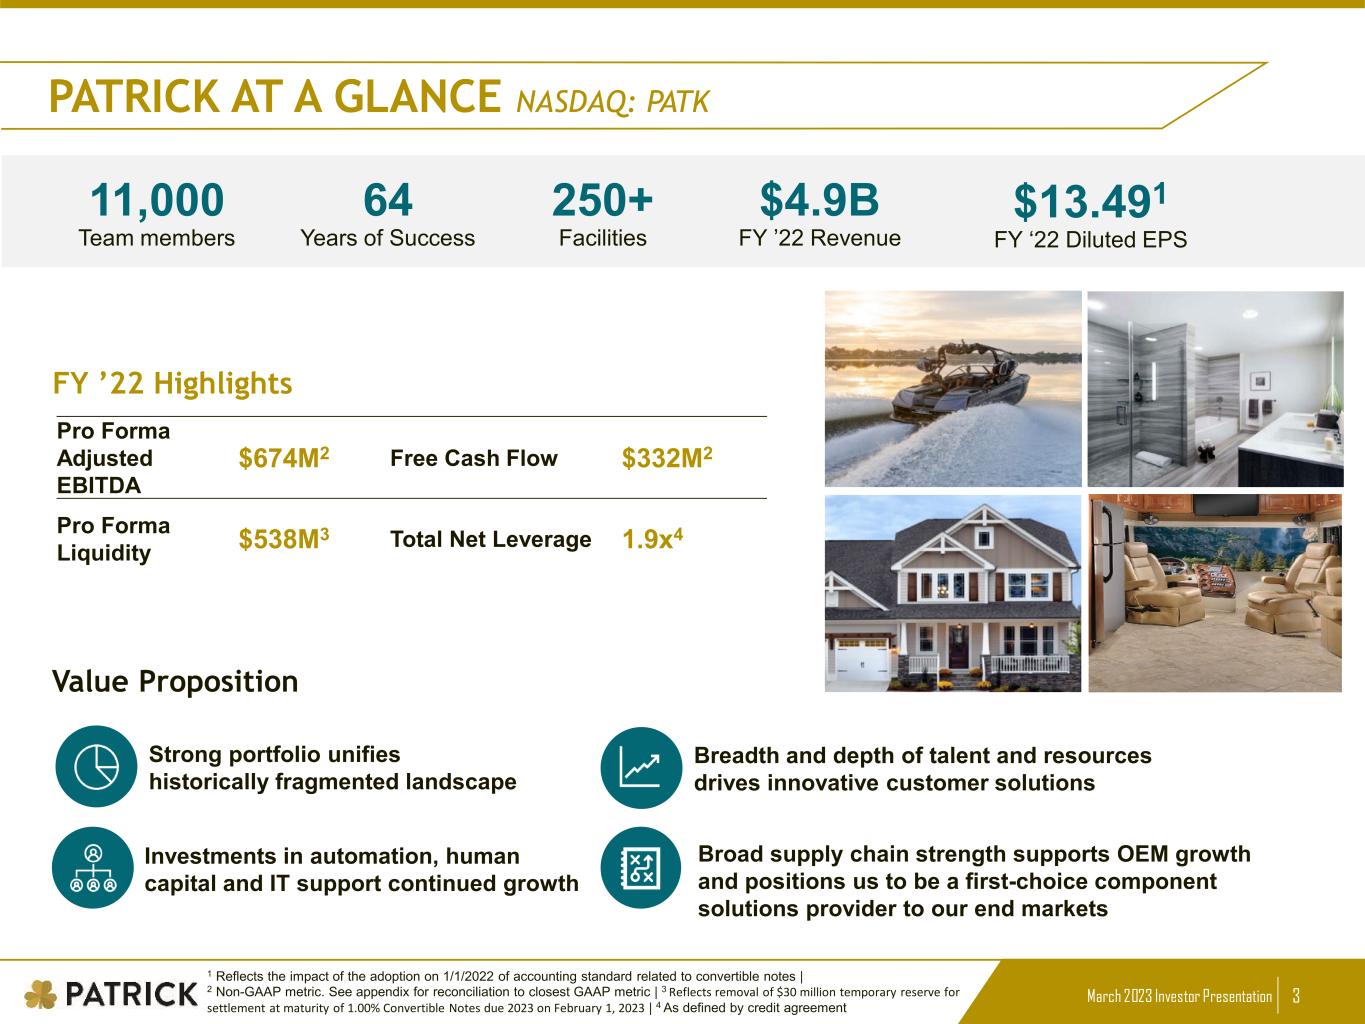
March 2023 Investor Presentation 3 FY ’22 Highlights Team members 11,000 Years of Success 64 Facilities 250+ FY ’22 Revenue $4.9B Pro Forma Adjusted EBITDA $674M2 Free Cash Flow $332M2 Pro Forma Liquidity $538M3 Total Net Leverage 1.9x4 Strong portfolio unifies historically fragmented landscape Investments in automation, human capital and IT support continued growth Breadth and depth of talent and resources drives innovative customer solutions Broad supply chain strength supports OEM growth and positions us to be a first-choice component solutions provider to our end markets Value Proposition PATRICK AT A GLANCE NASDAQ: PATK 1 Reflects the impact of the adoption on 1/1/2022 of accounting standard related to convertible notes | 2 Non-GAAP metric. See appendix for reconciliation to closest GAAP metric | 3 Reflects removal of $30 million temporary reserve for settlement at maturity of 1.00% Convertible Notes due 2023 on February 1, 2023 | 4 As defined by credit agreement FY ‘22 Diluted EPS $13.491

March 2023 Investor Presentation 4 LEADERSHIP WITH DEEP INDUSTRY EXPERIENCE Andy Nemeth CEO Jeff Rodino President Jake Petkovich CFO Kip Ellis COO 31 years Industry experience 29 years Industry experience 27 years Industry experience 26 years Industry experience 100+ years of industry experience spanning across multiple economic cycles Management team is adaptable and experienced during economic changes and industry trends Proven ability to manage at scale with approximately 11,000 employees in over 250 facilities across 23 states
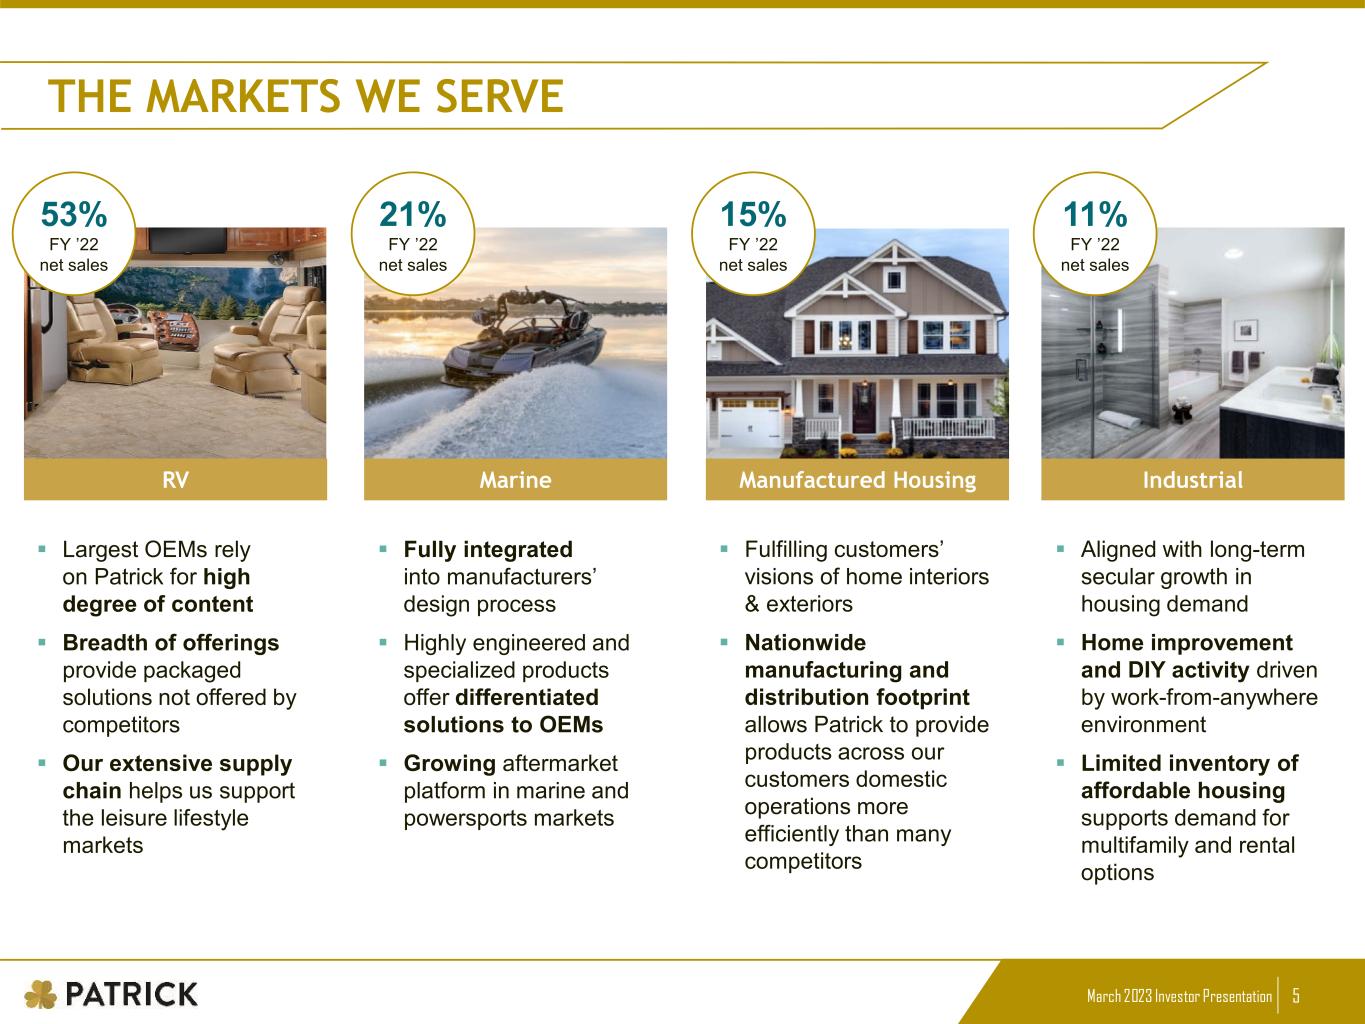
March 2023 Investor Presentation 5 Fulfilling customers’ visions of home interiors & exteriors Nationwide manufacturing and distribution footprint allows Patrick to provide products across our customers domestic operations more efficiently than many competitors Aligned with long-term secular growth in housing demand Home improvement and DIY activity driven by work-from-anywhere environment Limited inventory of affordable housing supports demand for multifamily and rental options Largest OEMs rely on Patrick for high degree of content Breadth of offerings provide packaged solutions not offered by competitors Our extensive supply chain helps us support the leisure lifestyle markets Fully integrated into manufacturers’ design process Highly engineered and specialized products offer differentiated solutions to OEMs Growing aftermarket platform in marine and powersports markets 53% FY ’22 net sales RV Marine 21% FY ’22 net sales Manufactured Housing 15% FY ’22 net sales Industrial 11% FY ’22 net sales THE MARKETS WE SERVE
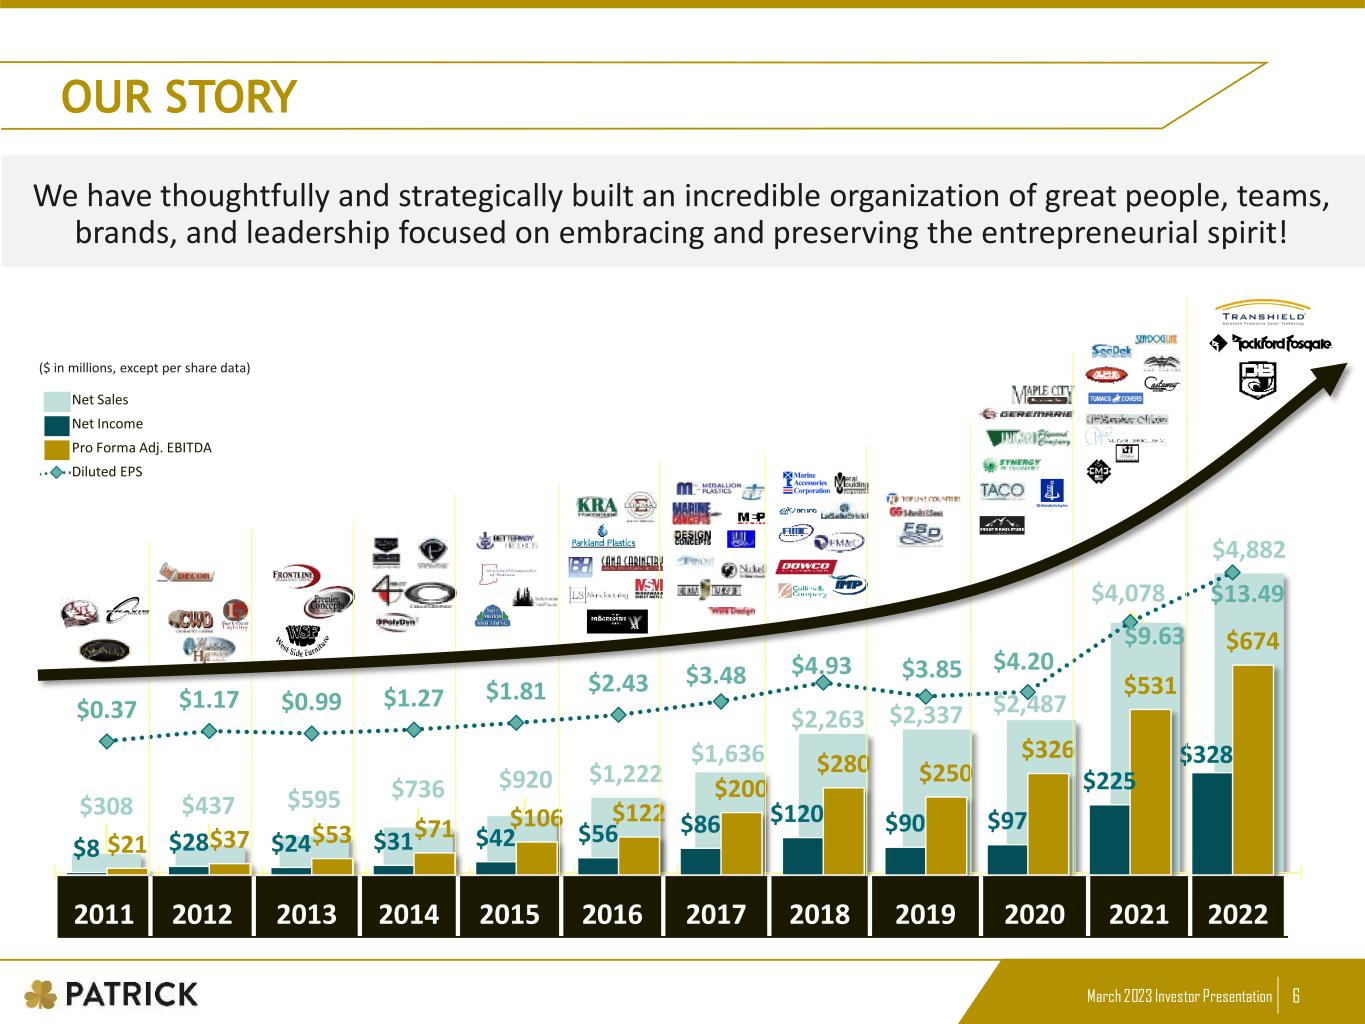
March 2023 Investor Presentation 6 $308 $437 $595 $736 $920 $1,222 $1,636 $2,263 $2,337 $2,487 $4,078 $4,882 2011 2012 2013 2014 2015 2016 2017 2018 2019 2020 2021 LTM $8 $28 $24 $31 $42 $56 $86 $120 $90 $97 $225 $328 $21 $37 $53 $71 $106 $122 $200 $280 $250 $326 $531 $674 $0.37 $1.17 $0.99 $1.27 $1.81 $2.43 $3.48 $4.93 $3.85 $4.20 $9.63 $13.49 2014 2015 2016 2017 2018 2019 2020 2021 2022 OUR STORY We have thoughtfully and strategically built an incredible organization of great people, teams, brands, and leadership focused on embracing and preserving the entrepreneurial spirit! Net Sales Net Income Pro Forma Adj. EBITDA Diluted EPS ($ in millions, except per share data) 2011 2012 2013 2014 2015 2016 2017 2018 2019 2020 2021 2022
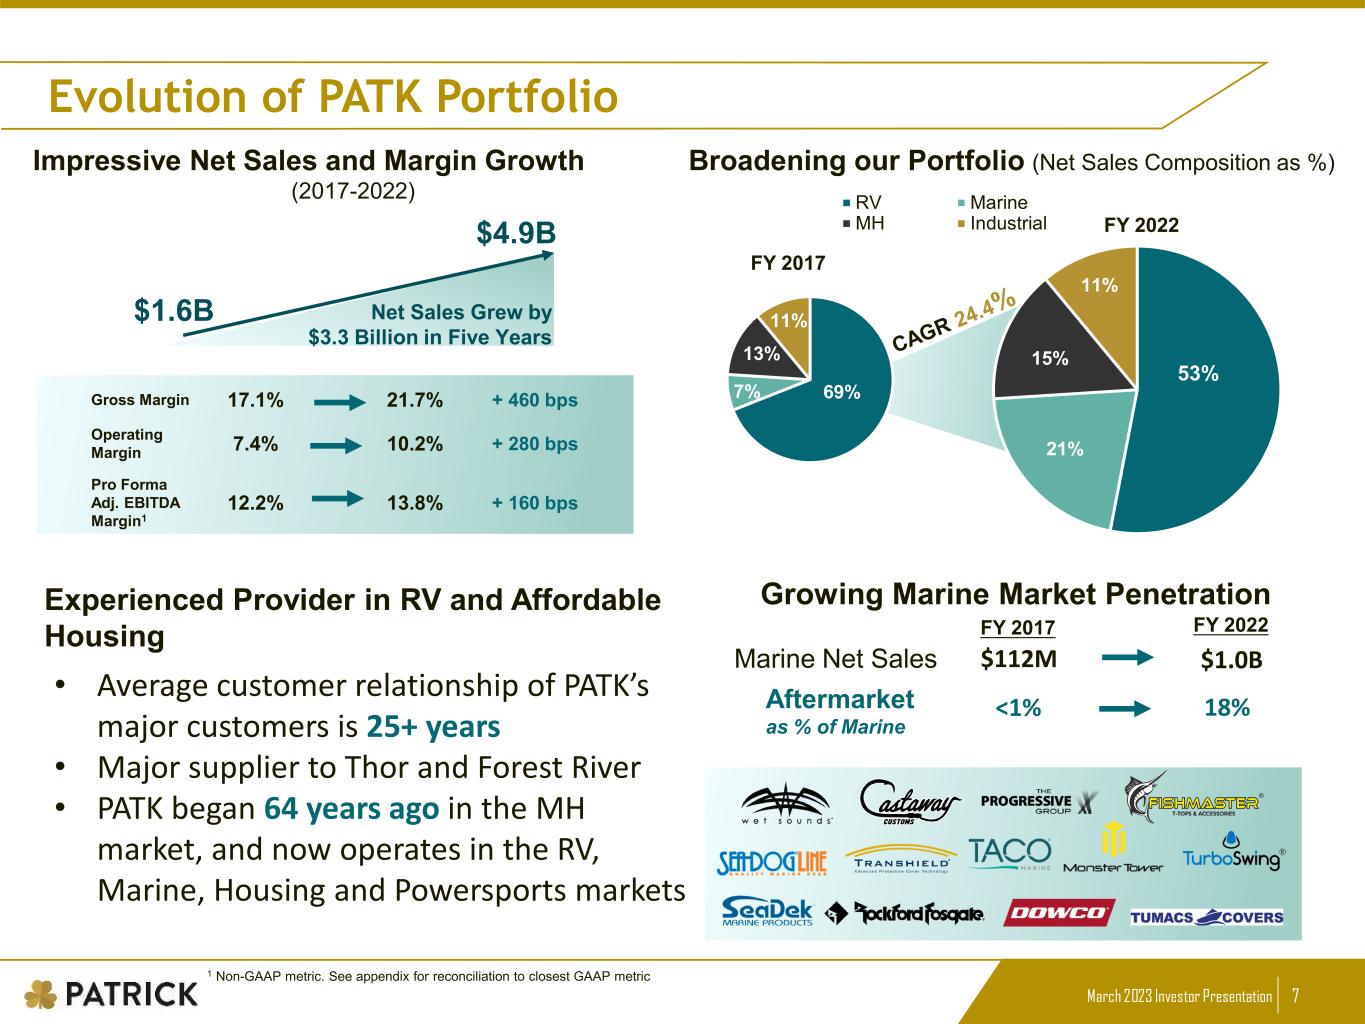
March 2023 Investor Presentation 7 53% 21% 15% 11% RV Marine MH Industrial$4.9B Net Sales Grew by $3.3 Billion in Five Years $1.6B Evolution of PATK Portfolio Broadening our Portfolio (Net Sales Composition as %) FY 2022 Growing Marine Market Penetration Impressive Net Sales and Margin Growth (2017-2022) Experienced Provider in RV and Affordable Housing Gross Margin 17.1% 21.7% + 460 bps Operating Margin 7.4% 10.2% + 280 bps Pro Forma Adj. EBITDA Margin1 12.2% 13.8% + 160 bps FY 2017 69%7% 13% 11% <1% 18% Marine Net Sales Aftermarket as % of Marine $112M $1.0B • Average customer relationship of PATK’s major customers is 25+ years • Major supplier to Thor and Forest River • PATK began 64 years ago in the MH market, and now operates in the RV, Marine, Housing and Powersports markets FY 2017 FY 2022 1 Non-GAAP metric. See appendix for reconciliation to closest GAAP metric
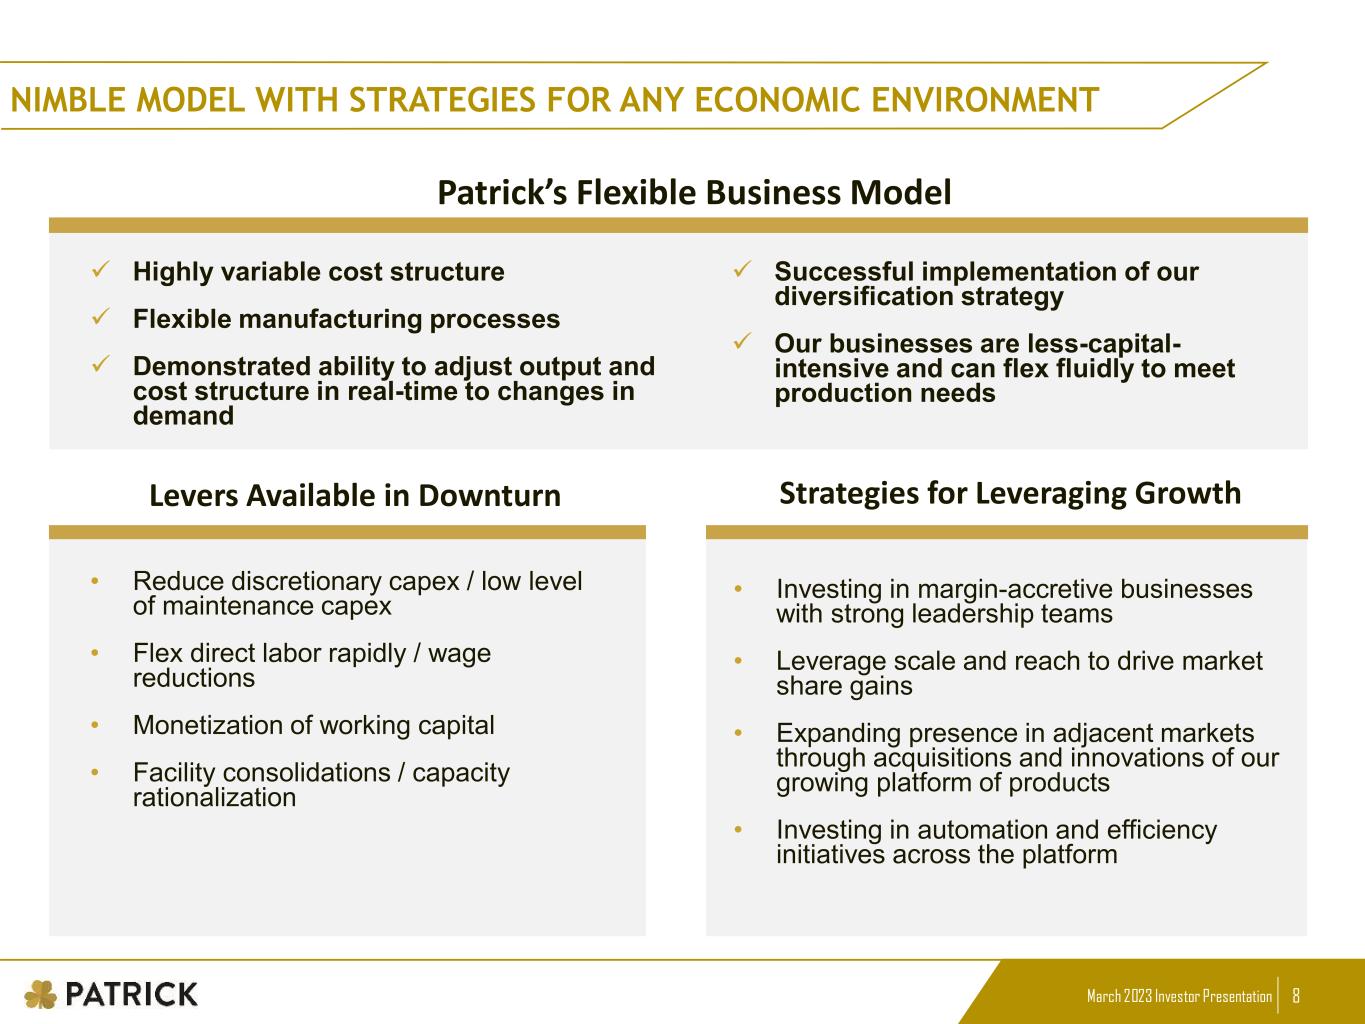
March 2023 Investor Presentation 8 NIMBLE MODEL WITH STRATEGIES FOR ANY ECONOMIC ENVIRONMENT Patrick’s Flexible Business Model Highly variable cost structure Flexible manufacturing processes Demonstrated ability to adjust output and cost structure in real-time to changes in demand Successful implementation of our diversification strategy Our businesses are less-capital- intensive and can flex fluidly to meet production needs • Reduce discretionary capex / low level of maintenance capex • Flex direct labor rapidly / wage reductions • Monetization of working capital • Facility consolidations / capacity rationalization Levers Available in Downturn Strategies for Leveraging Growth • Investing in margin-accretive businesses with strong leadership teams • Leverage scale and reach to drive market share gains • Expanding presence in adjacent markets through acquisitions and innovations of our growing platform of products • Investing in automation and efficiency initiatives across the platform
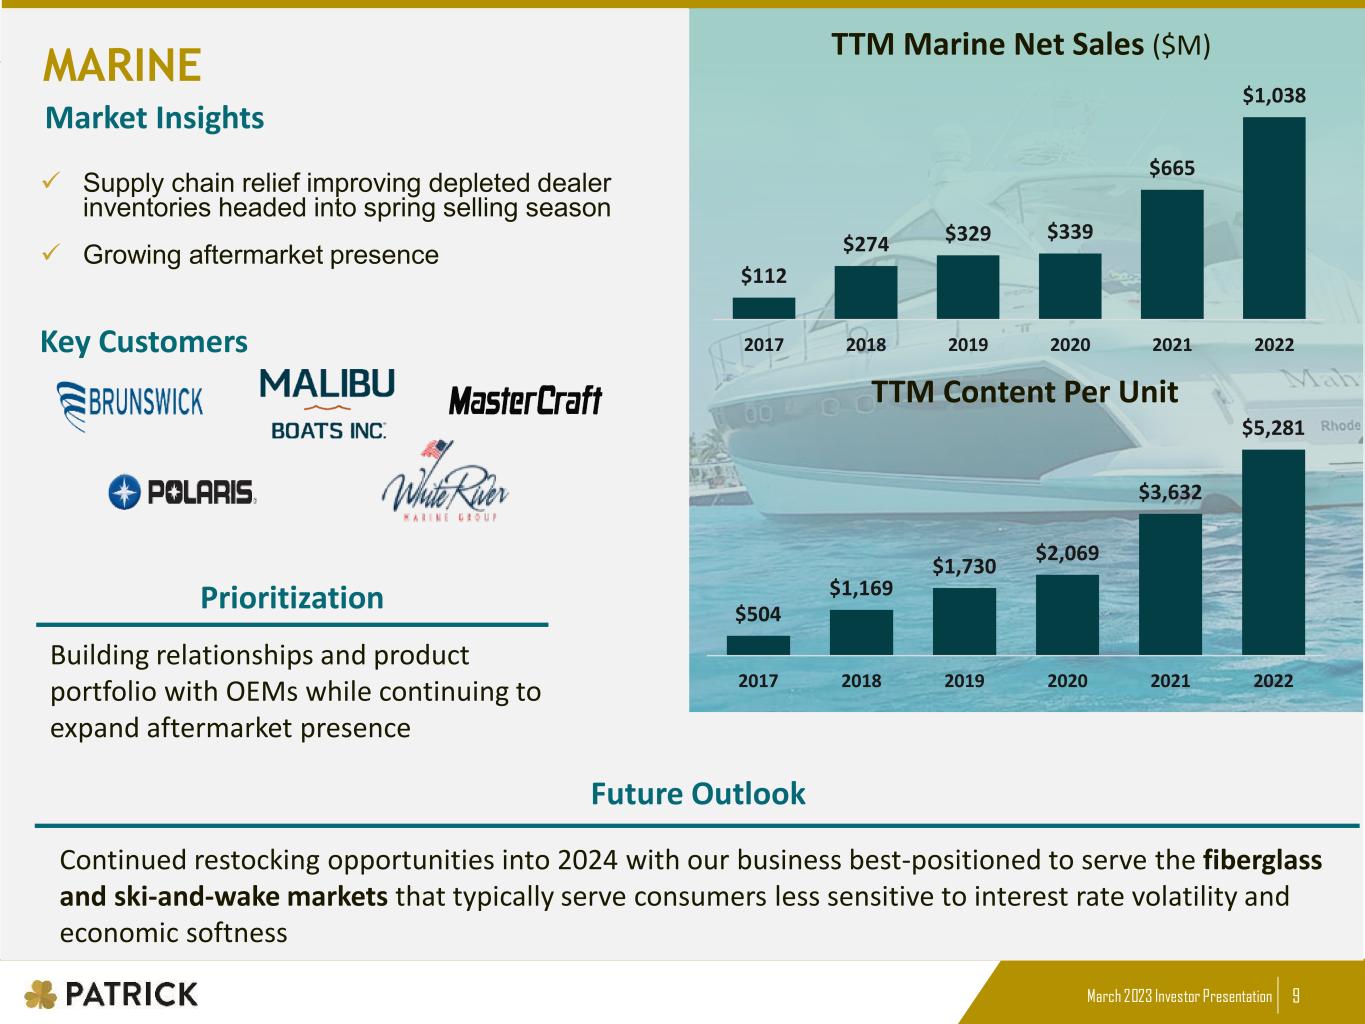
March 2023 Investor Presentation 9 MARINE TTM Marine Net Sales ($M) TTM Content Per Unit MARINE arket Insights Supply chain relief improving depleted dealer inventories headed into spring selling season Growing aftermarket presence Key Customers Prioritization Building relationships and product portfolio with OEMs while continuing to expand aftermarket presence $112 $274 $329 $339 $665 $1,038 2017 2018 2019 2020 2021 2022 $504 $1,169 $1,730 $2,069 $3,632 $5,281 2017 2018 2019 2020 2021 2022 Future Outlook Continued restocking opportunities into 2024 with our business best-positioned to serve the fiberglass and ski-and-wake markets that typically serve consumers less sensitive to interest rate volatility and economic softness
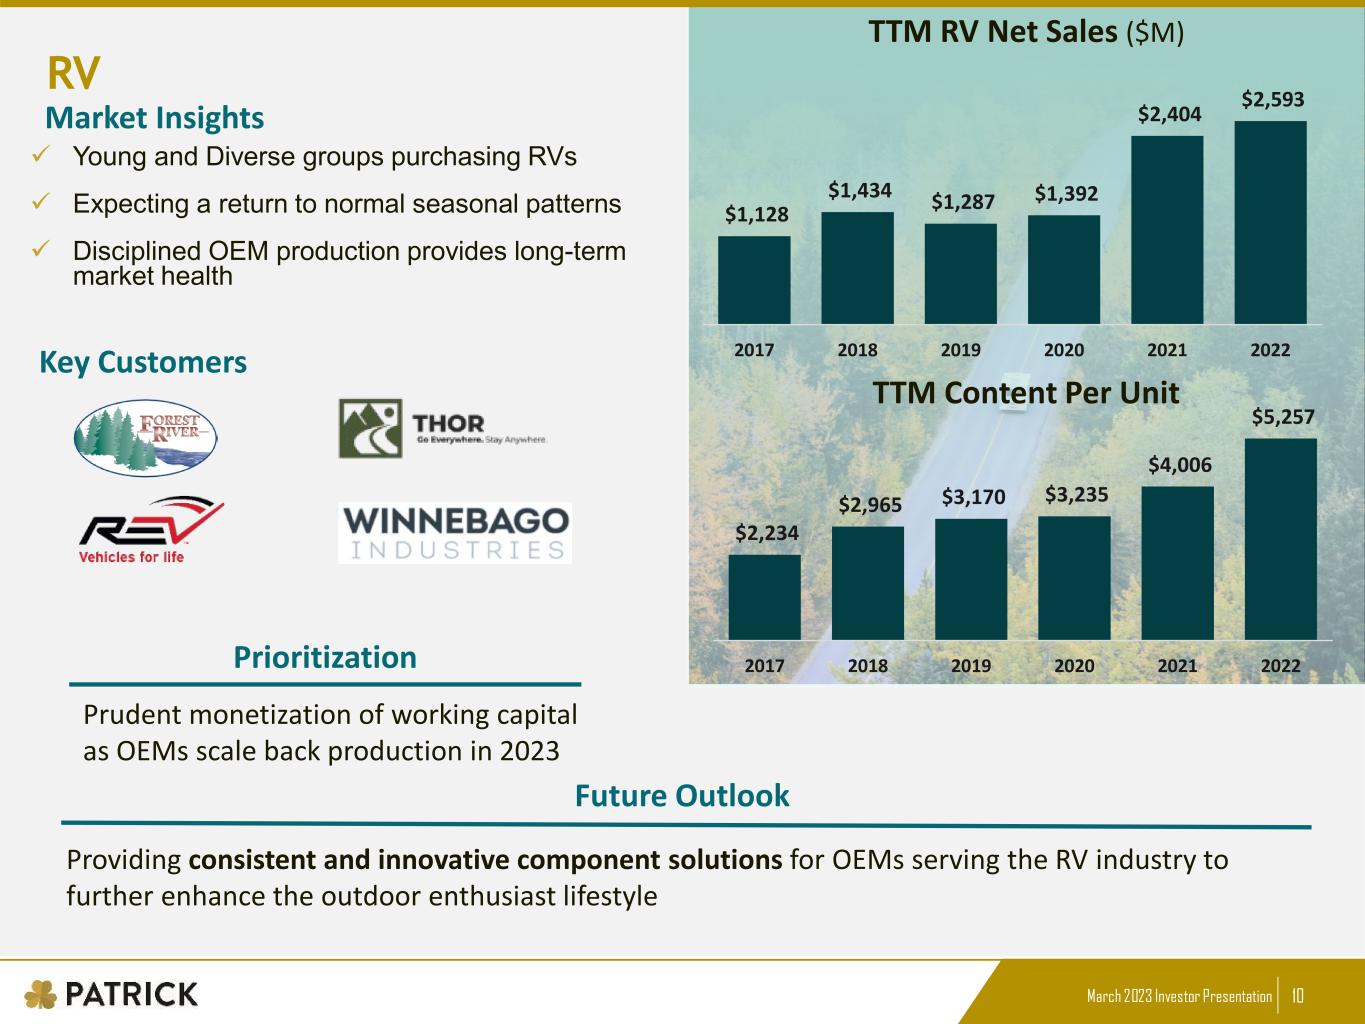
March 2023 Investor Presentation 10 MARINE RV arket Insights Key Customers Prioritization Future Outlook Young and Diverse groups purchasing RVs Expecting a return to normal seasonal patterns Disciplined OEM production provides long-term market health Providing consistent and innovative component solutions for OEMs serving the RV industry to further enhance the outdoor enthusiast lifestyle Prudent monetization of working capital as OEMs scale back production in 2023 TTM RV Net Sales ($M) TTM Content Per Unit $1,128 $1,434 $1,287 $1,392 $2,404 $2,593 2017 2018 2019 2020 2021 2022 $2,234 $2,965 $3,170 $3,235 $4,006 $5,257 2017 2018 2019 2020 2021 2022
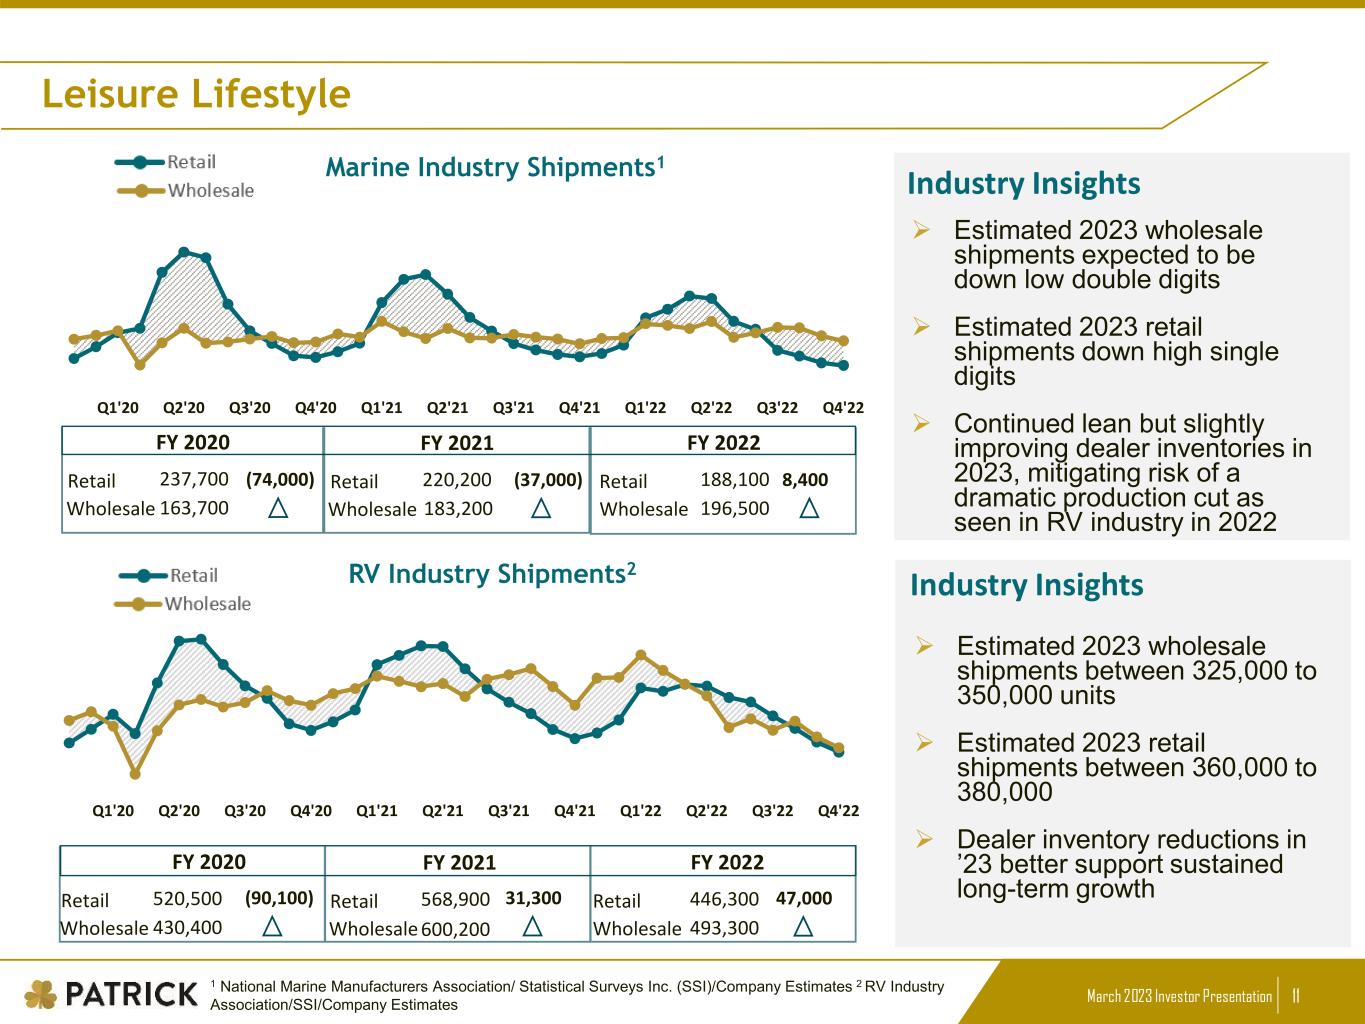
March 2023 Investor Presentation 11 493,300 Leisure Lifestyle Retail Wholesale 237,700 FY 2020 163,700 1 National Marine Manufacturers Association/ Statistical Surveys Inc. (SSI)/Company Estimates 2 RV Industry Association/SSI/Company Estimates FY 2021 Marine Industry Shipments1 RV Industry Shipments2 (74,000) Retail Wholesale 220,200 183,200 Q1'20 Q2'20 Q3'20 Q4'20 Q1'21 Q2'21 Q3'21 Q4'21 Q1'22 Q2'22 Q3'22 Q4'22 Industry Insights Estimated 2023 wholesale shipments expected to be down low double digits Estimated 2023 retail shipments down high single digits Continued lean but slightly improving dealer inventories in 2023, mitigating risk of a dramatic production cut as seen in RV industry in 2022 Industry Insights Estimated 2023 wholesale shipments between 325,000 to 350,000 units Estimated 2023 retail shipments between 360,000 to 380,000 Dealer inventory reductions in ’23 better support sustained long-term growth FY 2022 Retail Wholesale 188,100 196,500 Q1'20 Q2'20 Q3'20 Q4'20 Q1'21 Q2'21 Q3'21 Q4'21 Q1'22 Q2'22 Q3'22 Q4'22 Retail Wholesale 520,500 FY 2020 430,400 FY 2021 Retail Wholesale 568,900 600,200 FY 2022 Retail Wholesale 446,300 (37,000) 8,400 (90,100) 31,300 47,000
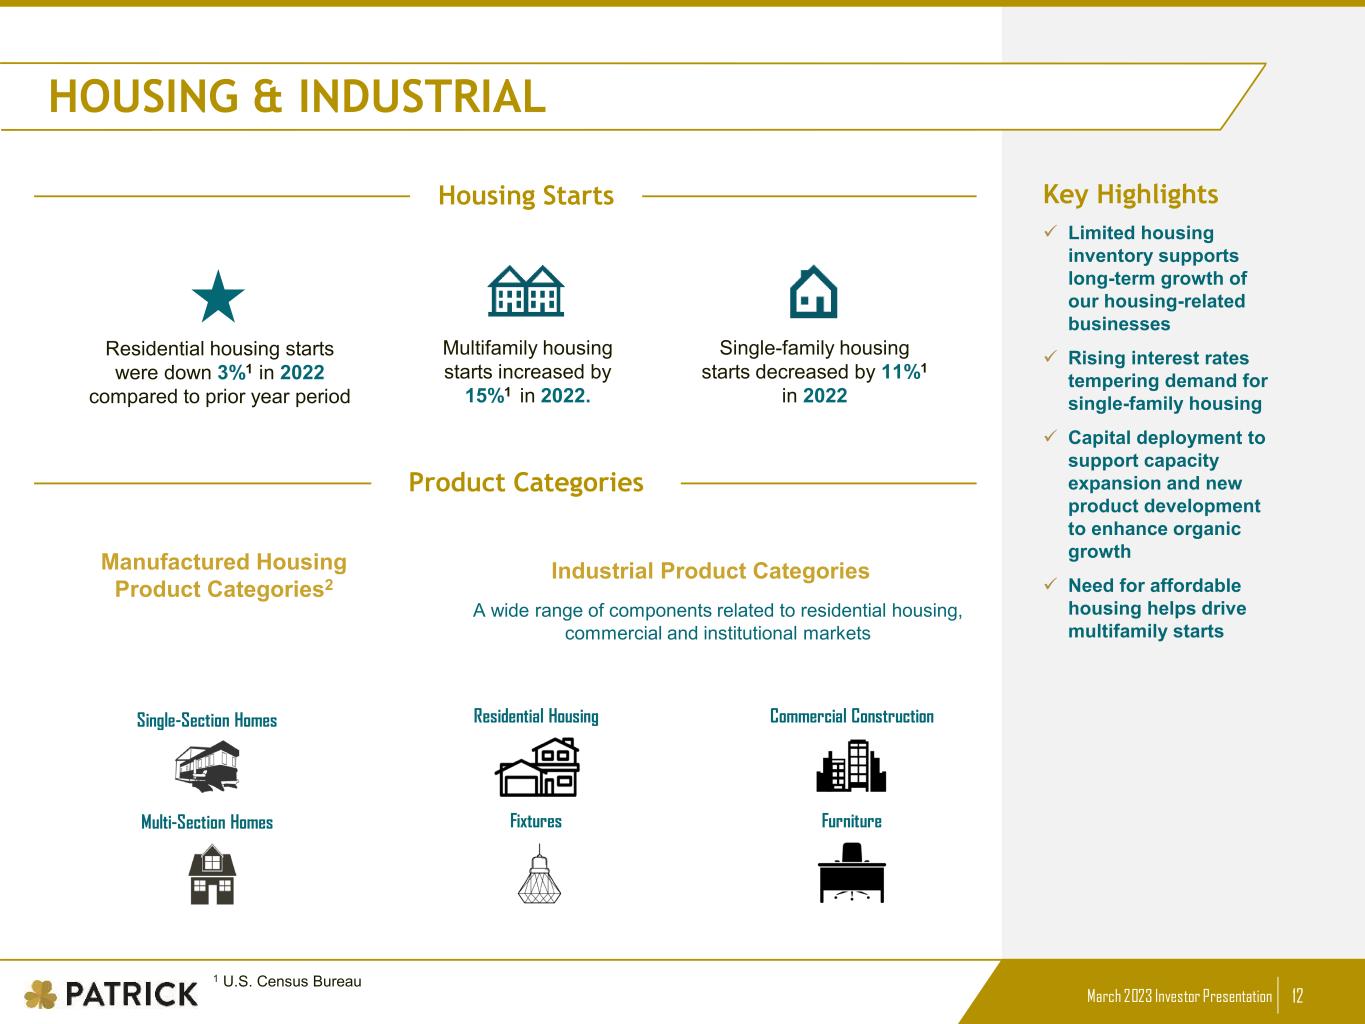
March 2023 Investor Presentation 12 Key Highlights Limited housing inventory supports long-term growth of our housing-related businesses Rising interest rates tempering demand for single-family housing Capital deployment to support capacity expansion and new product development to enhance organic growth Need for affordable housing helps drive multifamily starts Residential Housing Commercial Construction Fixtures Furniture Single-Section Homes Multi-Section Homes Residential housing starts were down 3%1 in 2022 compared to prior year period Multifamily housing starts increased by 15%1 in 2022. Single-family housing starts decreased by 11%1 in 2022 Housing Starts Product Categories Manufactured Housing Product Categories2 Industrial Product Categories A wide range of components related to residential housing, commercial and institutional markets 1 U.S. Census Bureau HOUSING & INDUSTRIAL
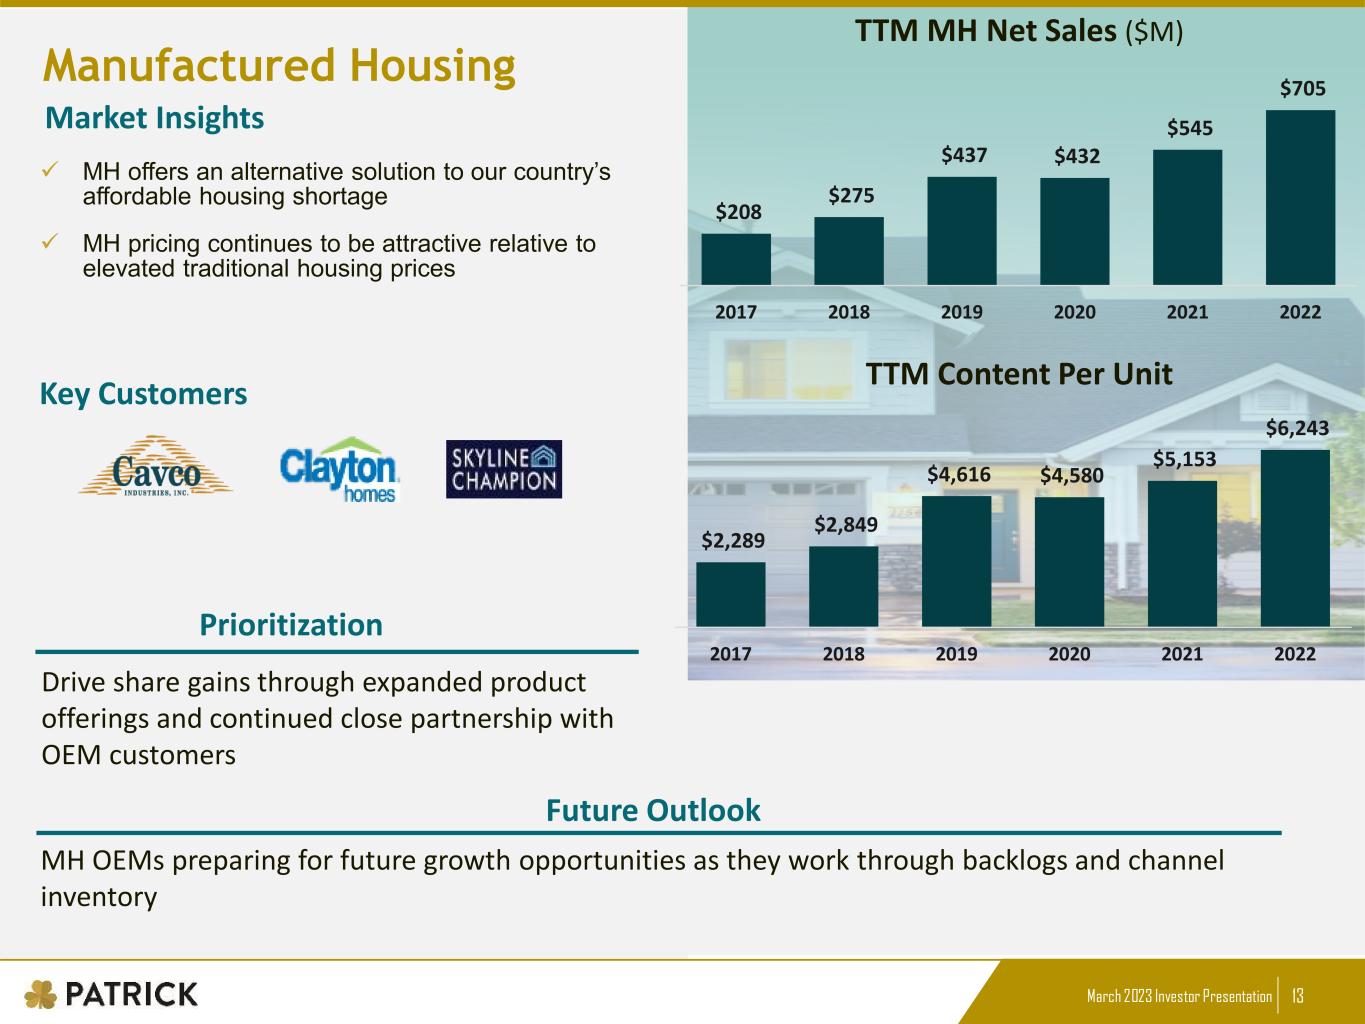
March 2023 Investor Presentation 13 MARINE Manufactured Housing arket Insights Key Customers Prioritization Future Outlook TTM MH Net Sales ($M) MH offers an alternative solution to our country’s affordable housing shortage MH pricing continues to be attractive relative to elevated traditional housing prices $208 $275 $437 $432 $545 $705 2017 2018 2019 2020 2021 2022 TTM Content Per Unit MH OEMs preparing for future growth opportunities as they work through backlogs and channel inventory Drive share gains through expanded product offerings and continued close partnership with OEM customers $2,289 $2,849 $4,616 $4,580 $5,153 $6,243 2017 2018 2019 2020 2021 2022
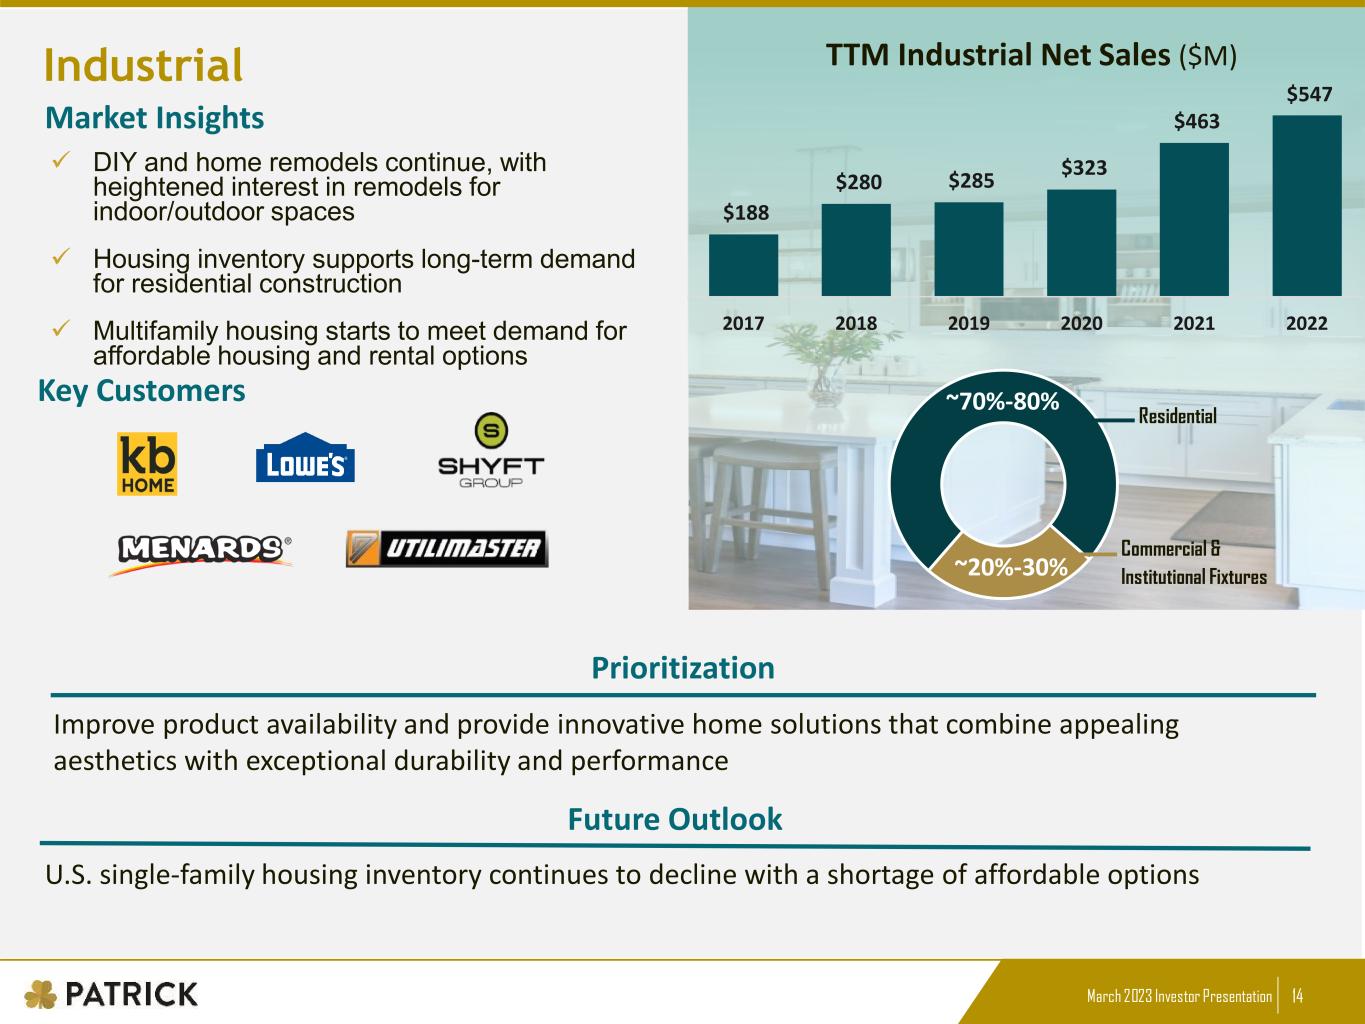
March 2023 Investor Presentation 14 MARINE Industrial arket Insights Key Customers Prioritization Future Outlook TTM Industrial Net Sales ($M) DIY and home remodels continue, with heightened interest in remodels for indoor/outdoor spaces Housing inventory supports long-term demand for residential construction Multifamily housing starts to meet demand for affordable housing and rental options ~70%-80% ~20%-30% Commercial & Institutional Fixtures Residential $188 $280 $285 $323 $463 $547 2017 2018 2019 2020 2021 2022 U.S. single-family housing inventory continues to decline with a shortage of affordable options Improve product availability and provide innovative home solutions that combine appealing aesthetics with exceptional durability and performance
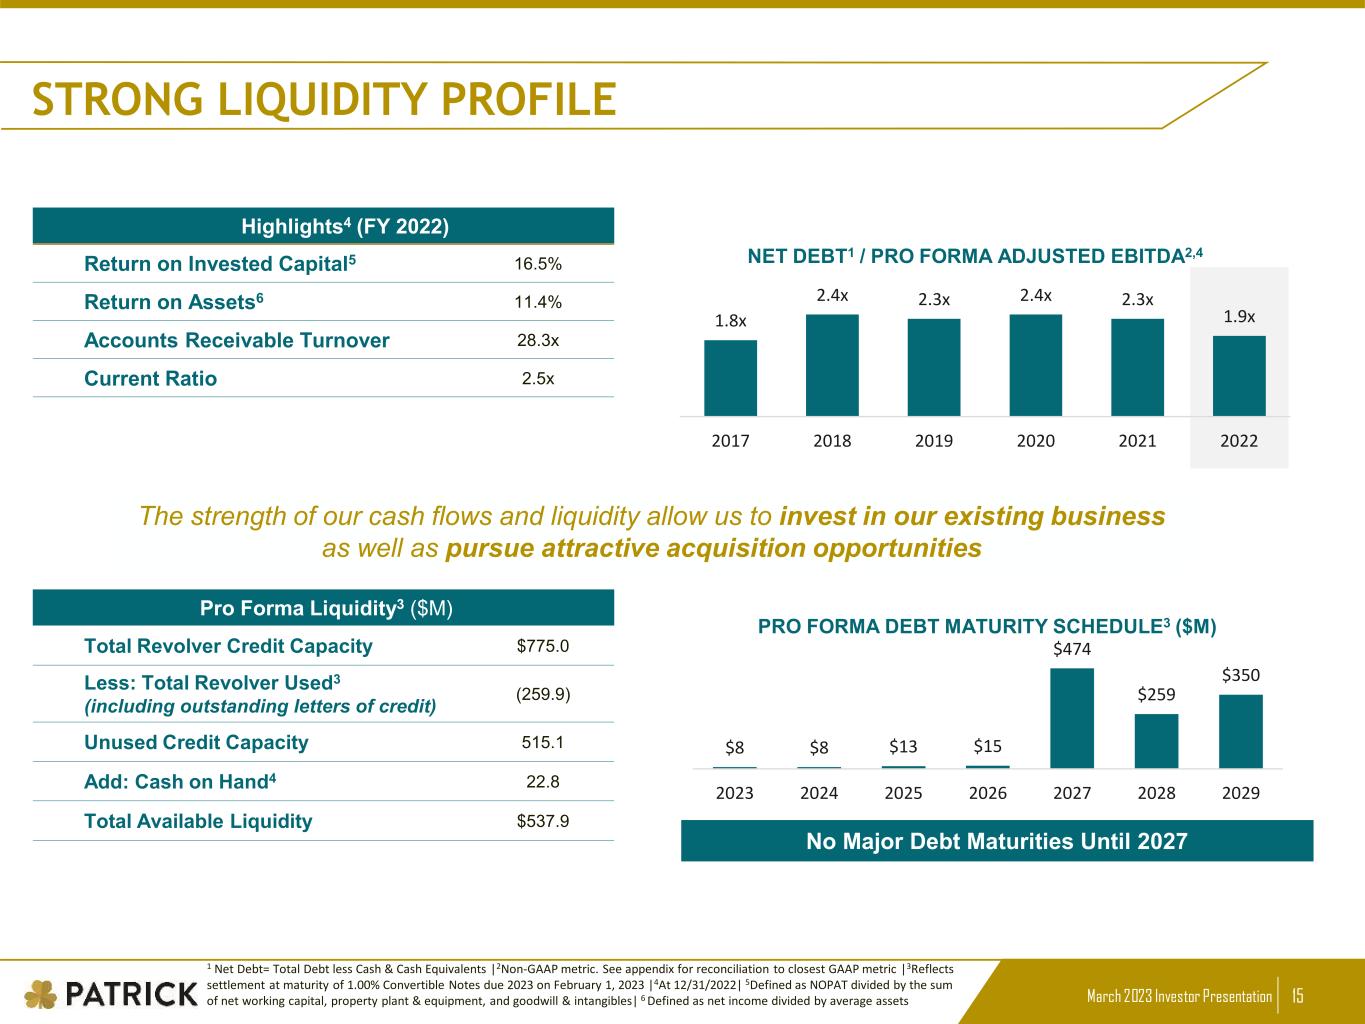
March 2023 Investor Presentation 15 STRONG LIQUIDITY PROFILE Pro Forma Liquidity3 ($M) Total Revolver Credit Capacity $775.0 Less: Total Revolver Used3 (including outstanding letters of credit) (259.9) Unused Credit Capacity 515.1 Add: Cash on Hand4 22.8 Total Available Liquidity $537.9 Highlights4 (FY 2022) Return on Invested Capital5 16.5% Return on Assets6 11.4% Accounts Receivable Turnover 28.3x Current Ratio 2.5x The strength of our cash flows and liquidity allow us to invest in our existing business as well as pursue attractive acquisition opportunities NET DEBT1 / PRO FORMA ADJUSTED EBITDA2,4 1.8x 2.4x 2.3x 2.4x 2.3x 1.9x 2017 2018 2019 2020 2021 2022 No Major Debt Maturities Until 2027 $8 $8 $13 $15 $474 $259 $350 2023 2024 2025 2026 2027 2028 2029 PRO FORMA DEBT MATURITY SCHEDULE3 ($M) 1 Net Debt= Total Debt less Cash & Cash Equivalents |2Non-GAAP metric. See appendix for reconciliation to closest GAAP metric |3Reflects settlement at maturity of 1.00% Convertible Notes due 2023 on February 1, 2023 |4At 12/31/2022| 5Defined as NOPAT divided by the sum of net working capital, property plant & equipment, and goodwill & intangibles| 6 Defined as net income divided by average assets
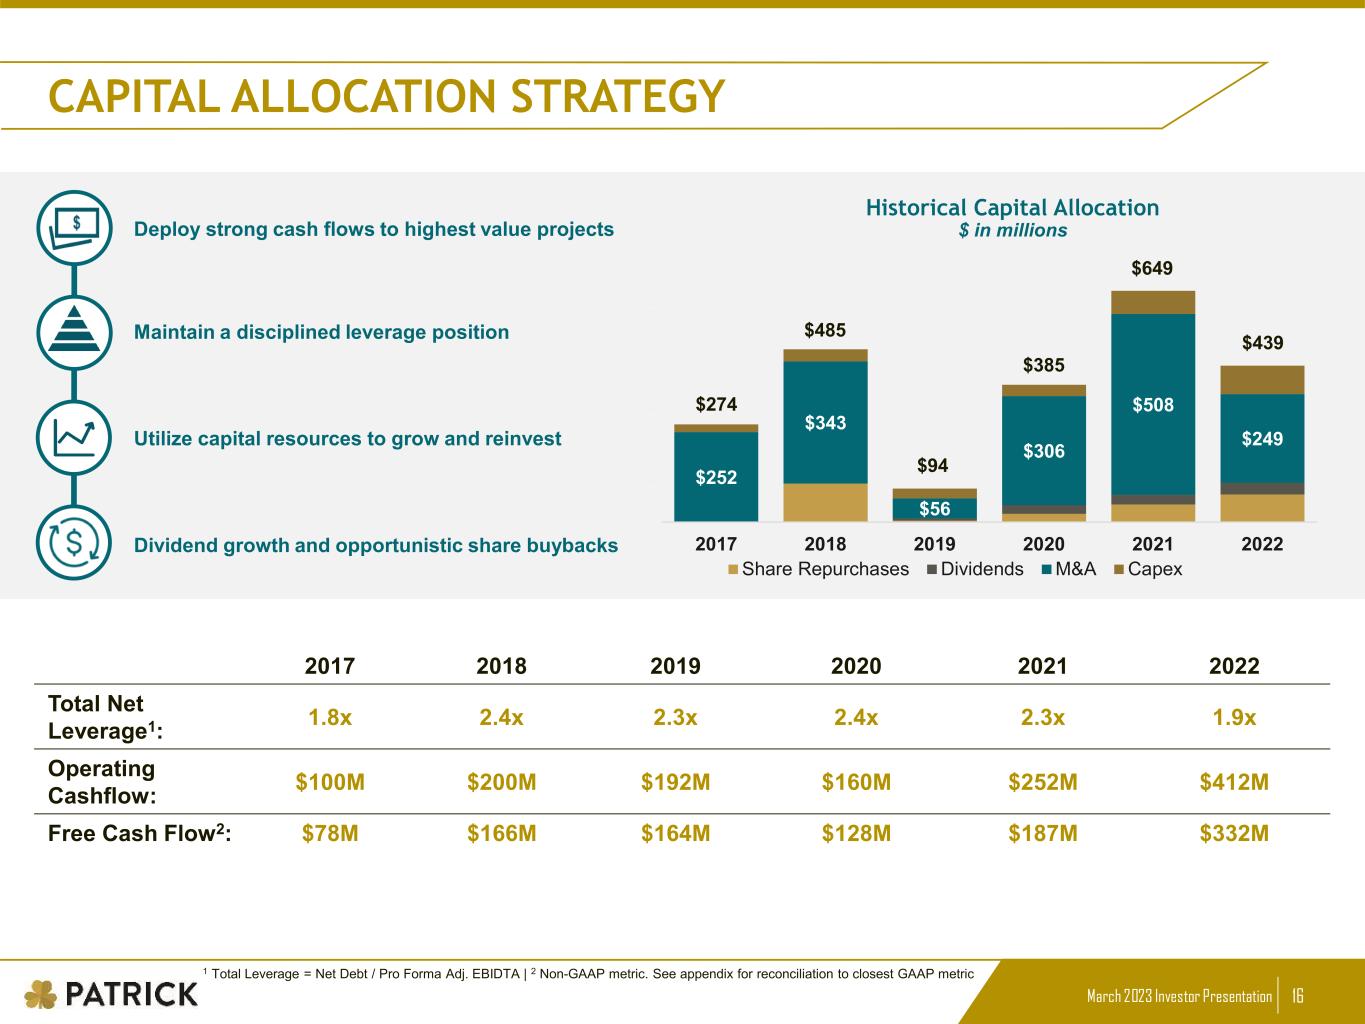
March 2023 Investor Presentation 16 Historical Capital Allocation $ in millionsDeploy strong cash flows to highest value projects Maintain a disciplined leverage position Utilize capital resources to grow and reinvest Dividend growth and opportunistic share buybacks $252 $343 $56 $306 $508 $249 $0 $100 $200 $300 $400 $500 $600 $700 2017 2018 2019 2020 2021 2022 Share Repurchases Dividends M&A Capex $274 $485 $94 $385 $649 Total $439 CAPITAL ALLOCATION STRATEGY 1 Total Leverage = Net Debt / Pro Forma Adj. EBIDTA | 2 Non-GAAP metric. See appendix for reconciliation to closest GAAP metric 2017 2018 2019 2020 2021 2022 Total Net Leverage1: 1.8x 2.4x 2.3x 2.4x 2.3x 1.9x Operating Cashflow: $100M $200M $192M $160M $252M $412M Free Cash Flow2: $78M $166M $164M $128M $187M $332M
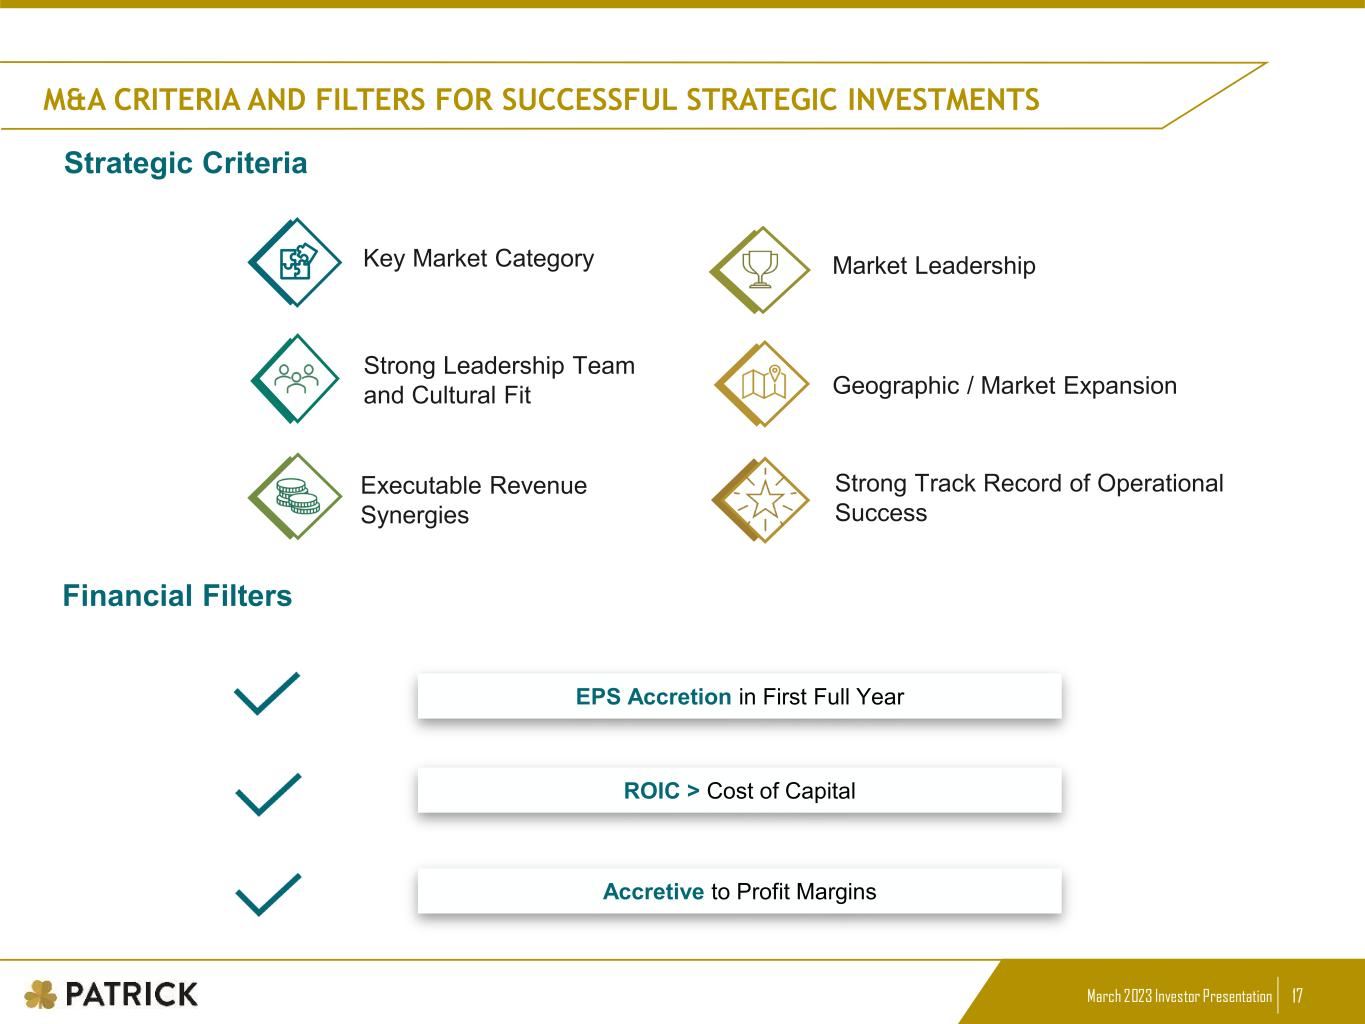
March 2023 Investor Presentation 17 Strong Leadership Team and Cultural Fit Executable Revenue Synergies Geographic / Market Expansion Market Leadership EPS Accretion in First Full Year ROIC > Cost of Capital Accretive to Profit Margins Strategic Criteria Key Market Category Financial Filters Strong Track Record of Operational Success M&A CRITERIA AND FILTERS FOR SUCCESSFUL STRATEGIC INVESTMENTS
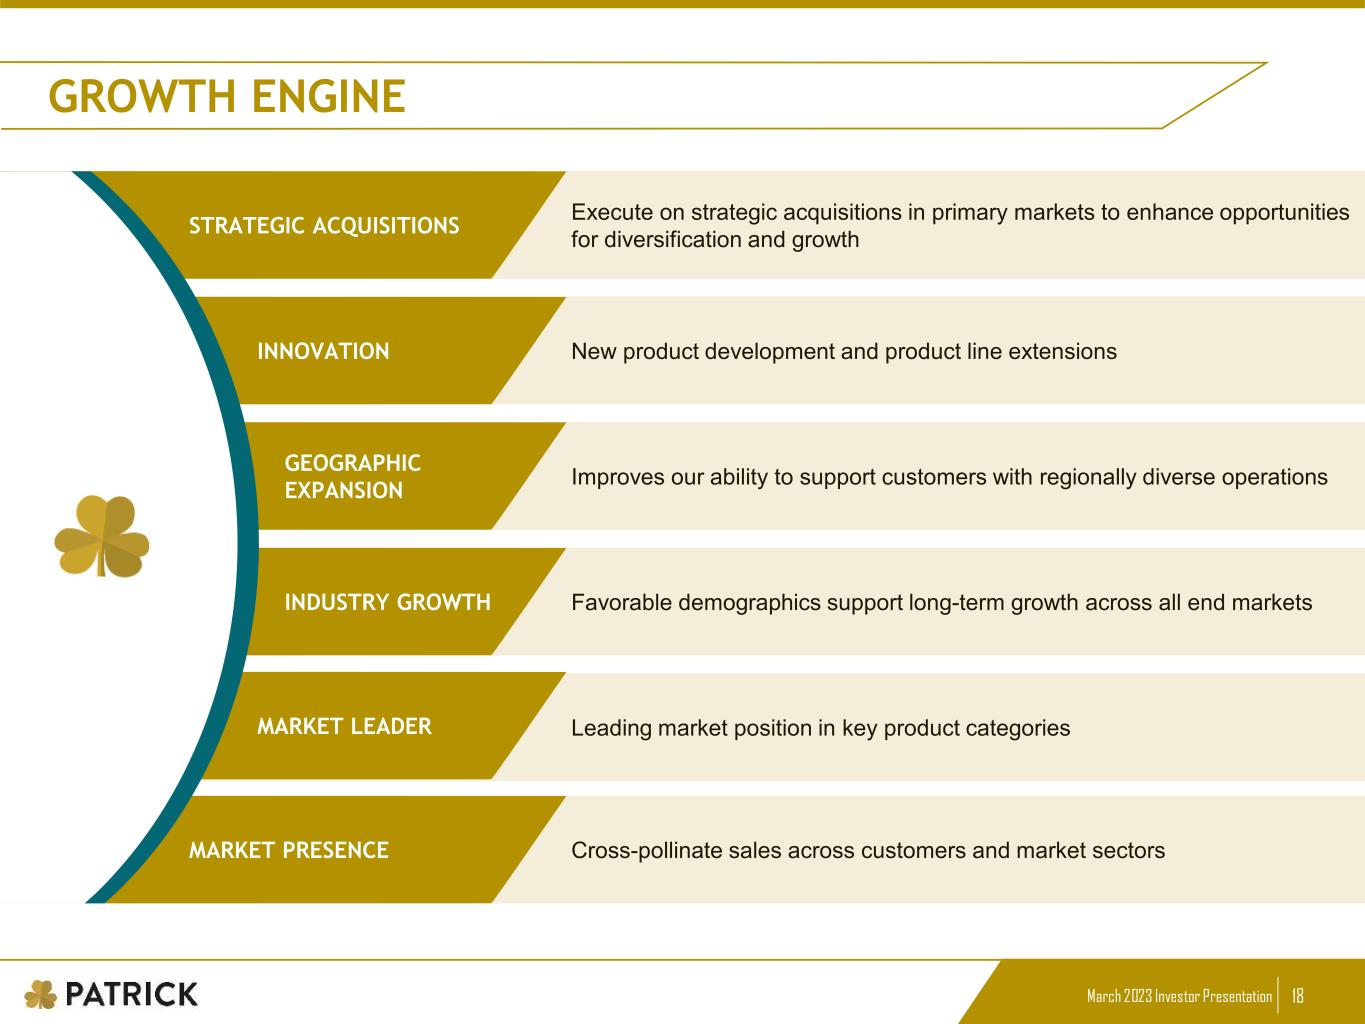
March 2023 Investor Presentation 18 Cross-pollinate sales across customers and market sectors Leading market position in key product categories Favorable demographics support long-term growth across all end markets Improves our ability to support customers with regionally diverse operations New product development and product line extensions Execute on strategic acquisitions in primary markets to enhance opportunities for diversification and growthSTRATEGIC ACQUISITIONS INNOVATION GEOGRAPHIC EXPANSION INDUSTRY GROWTH MARKET LEADER MARKET PRESENCE GROWTH ENGINE
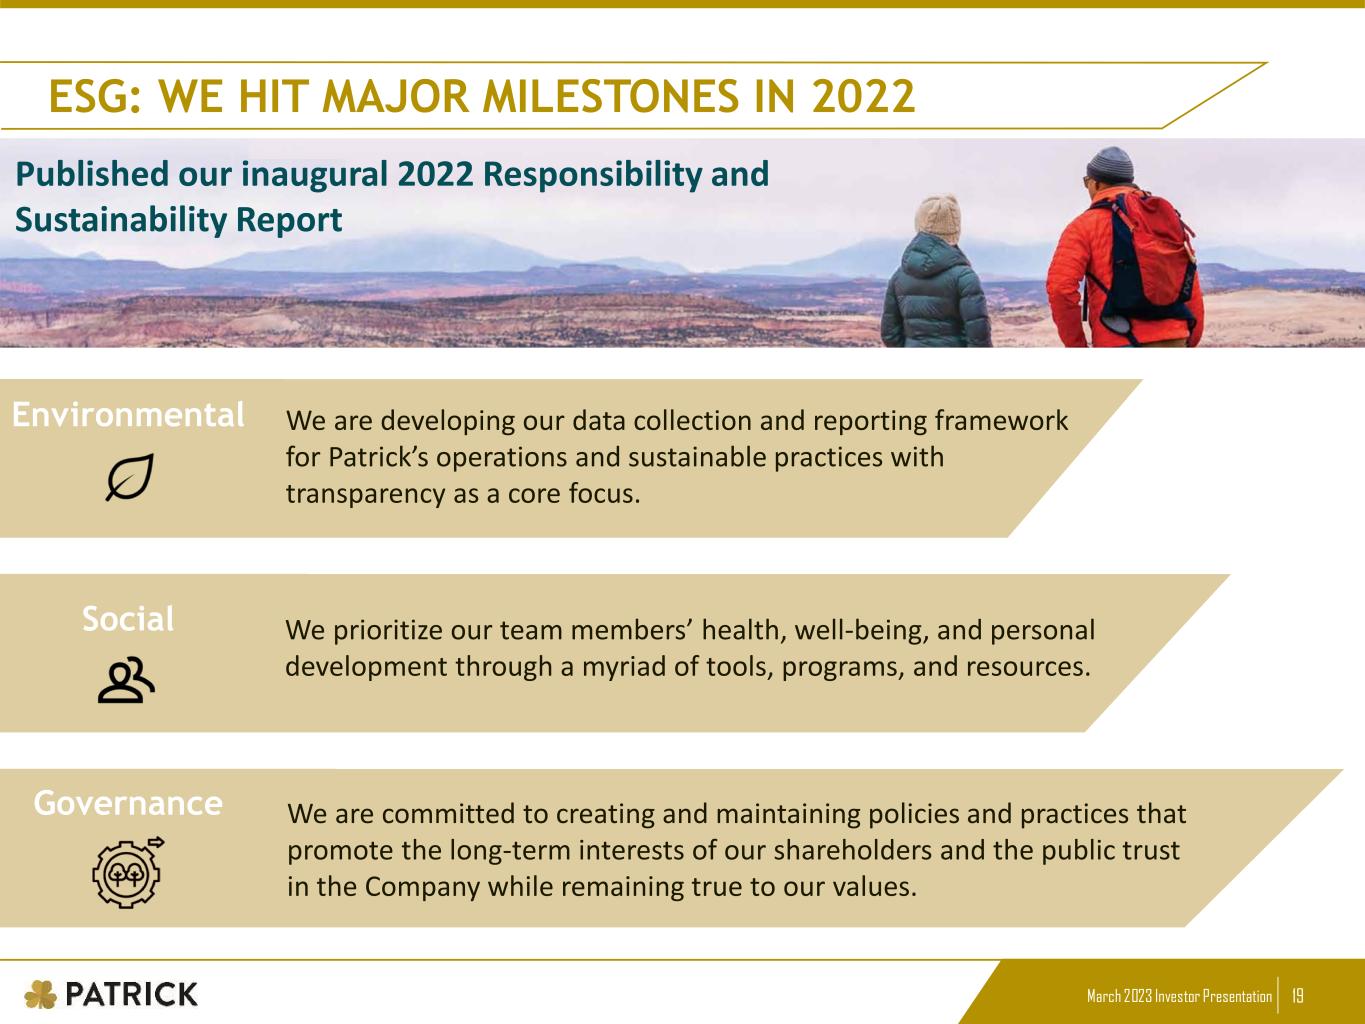
March 2023 Investor Presentation 19 ESG: WE HIT MAJOR MILESTONES IN 2022 Published our inaugural 2022 Responsibility and Sustainability Report Governance Environmental Social We are developing our data collection and reporting framework for Patrick’s operations and sustainable practices with transparency as a core focus. We prioritize our team members’ health, well-being, and personal development through a myriad of tools, programs, and resources. We are committed to creating and maintaining policies and practices that promote the long-term interests of our shareholders and the public trust in the Company while remaining true to our values.

March 2023 Investor Presentation 20 Appendix
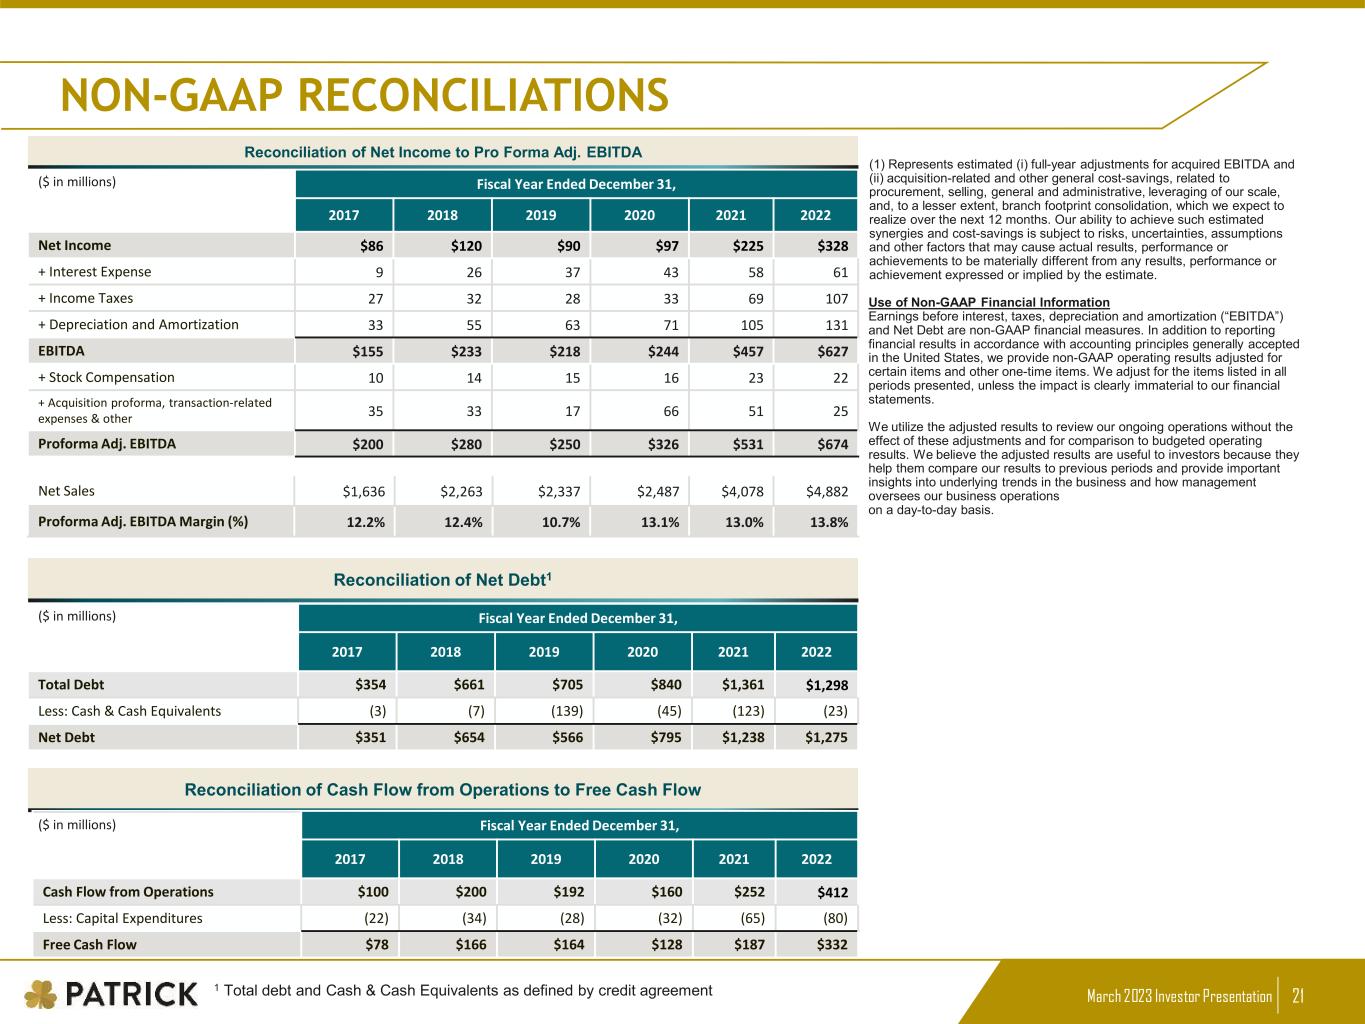
March 2023 Investor Presentation 21 NON-GAAP RECONCILIATIONS Reconciliation of Net Income to Pro Forma Adj. EBITDA Net Sales $1,636 $2,263 $2,337 $2,487 $4,078 $4,882 Proforma Adj. EBITDA Margin (%) 12.2% 12.4% 10.7% 13.1% 13.0% 13.8% Fiscal Year Ended December 31, 2017 2018 2019 2020 2021 2022 Net Income $86 $120 $90 $97 $225 $328 + Interest Expense 9 26 37 43 58 61 + Income Taxes 27 32 28 33 69 107 + Depreciation and Amortization 33 55 63 71 105 131 EBITDA $155 $233 $218 $244 $457 $627 + Stock Compensation 10 14 15 16 23 22 + Acquisition proforma, transaction-related expenses & other 35 33 17 66 51 25 Proforma Adj. EBITDA $200 $280 $250 $326 $531 $674 ($ in millions) (1) Represents estimated (i) full-year adjustments for acquired EBITDA and (ii) acquisition-related and other general cost-savings, related to procurement, selling, general and administrative, leveraging of our scale, and, to a lesser extent, branch footprint consolidation, which we expect to realize over the next 12 months. Our ability to achieve such estimated synergies and cost-savings is subject to risks, uncertainties, assumptions and other factors that may cause actual results, performance or achievements to be materially different from any results, performance or achievement expressed or implied by the estimate. Use of Non-GAAP Financial Information Earnings before interest, taxes, depreciation and amortization (“EBITDA”) and Net Debt are non-GAAP financial measures. In addition to reporting financial results in accordance with accounting principles generally accepted in the United States, we provide non-GAAP operating results adjusted for certain items and other one-time items. We adjust for the items listed in all periods presented, unless the impact is clearly immaterial to our financial statements. We utilize the adjusted results to review our ongoing operations without the effect of these adjustments and for comparison to budgeted operating results. We believe the adjusted results are useful to investors because they help them compare our results to previous periods and provide important insights into underlying trends in the business and how management oversees our business operations on a day-to-day basis. Fiscal Year Ended December 31, 2017 2018 2019 2020 2021 2022 Total Debt $354 $661 $705 $840 $1,361 $1,298 Less: Cash & Cash Equivalents (3) (7) (139) (45) (123) (23) Net Debt $351 $654 $566 $795 $1,238 $1,275 Reconciliation of Net Debt1 ($ in millions) 1 Total debt and Cash & Cash Equivalents as defined by credit agreement Reconciliation of Cash Flow from Operations to Free Cash Flow Fiscal Year Ended December 31, 2017 2018 2019 2020 2021 2022 Cash Flow from Operations $100 $200 $192 $160 $252 $412 Less: Capital Expenditures (22) (34) (28) (32) (65) (80) Free Cash Flow $78 $166 $164 $128 $187 $332 ($ in millions)
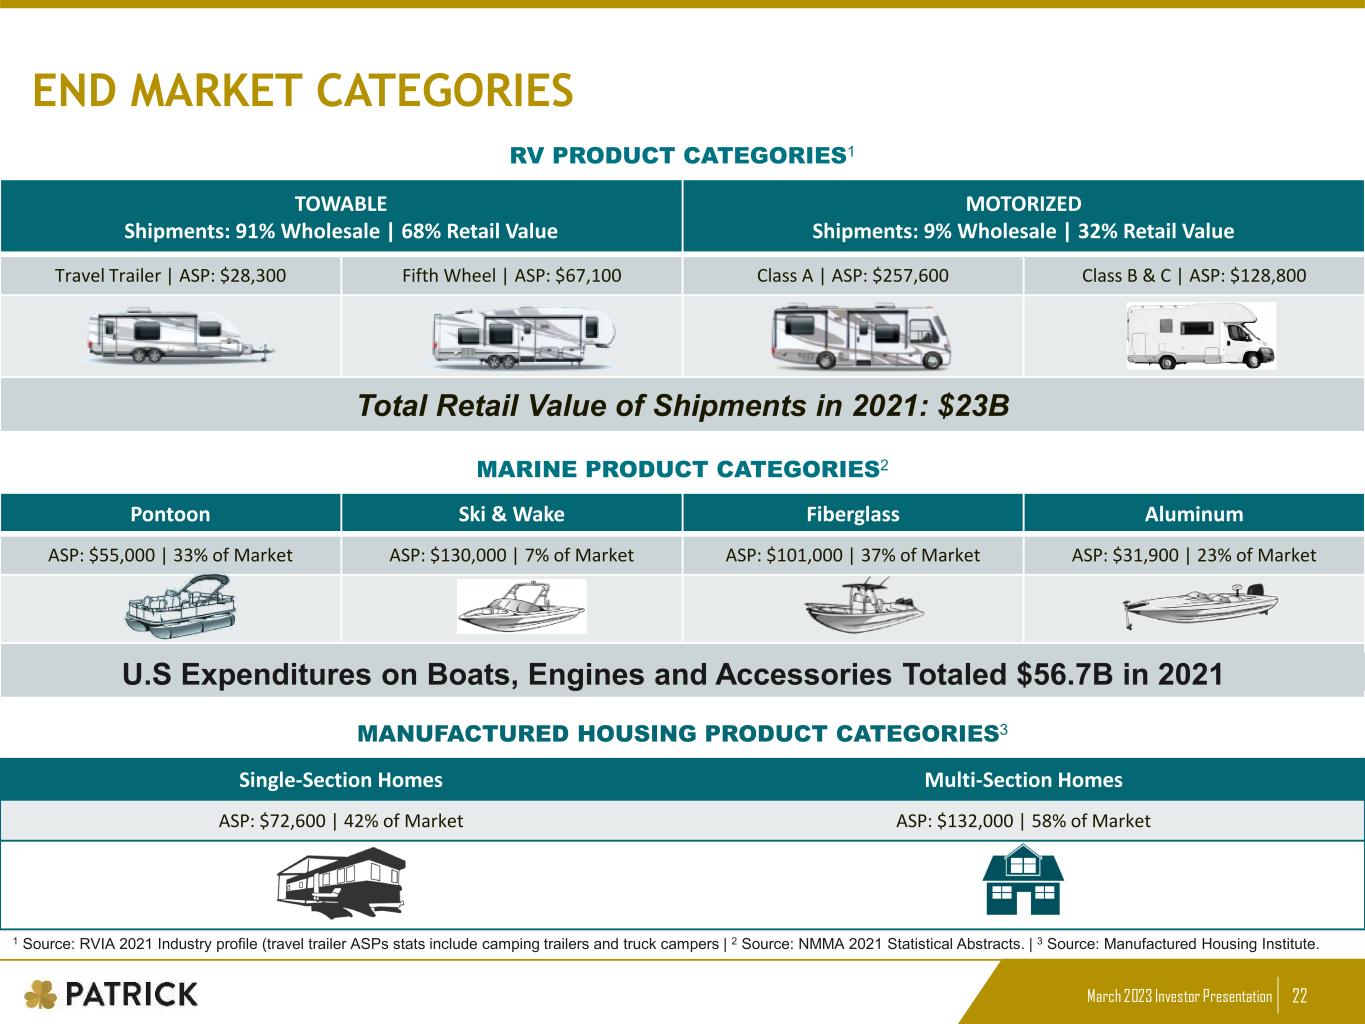
March 2023 Investor Presentation 22 END MARKET CATEGORIES Single-Section Homes Multi-Section Homes ASP: $72,600 | 42% of Market ASP: $132,000 | 58% of Market TOWABLE Shipments: 91% Wholesale | 68% Retail Value MOTORIZED Shipments: 9% Wholesale | 32% Retail Value Travel Trailer | ASP: $28,300 Fifth Wheel | ASP: $67,100 Class A | ASP: $257,600 Class B & C | ASP: $128,800 Total Retail Value of Shipments in 2021: $23B RV PRODUCT CATEGORIES1 Pontoon Ski & Wake Fiberglass Aluminum ASP: $55,000 | 33% of Market ASP: $130,000 | 7% of Market ASP: $101,000 | 37% of Market ASP: $31,900 | 23% of Market U.S Expenditures on Boats, Engines, and Accessories Totaled $xxB in 2019 MARINE PRODUCT CATEGORIES2 MANUFACTURED HOUSING PRODUCT CATEGORIES3 1 Source: RVIA 2021 Industry profile (travel trailer ASPs stats include camping trailers and truck campers | 2 Source: NMMA 2021 Statistical Abstracts. | 3 Source: Manufactured Housing Institute. U.S Expenditures on Boats, Engines and Accessories Totaled $56.7 21
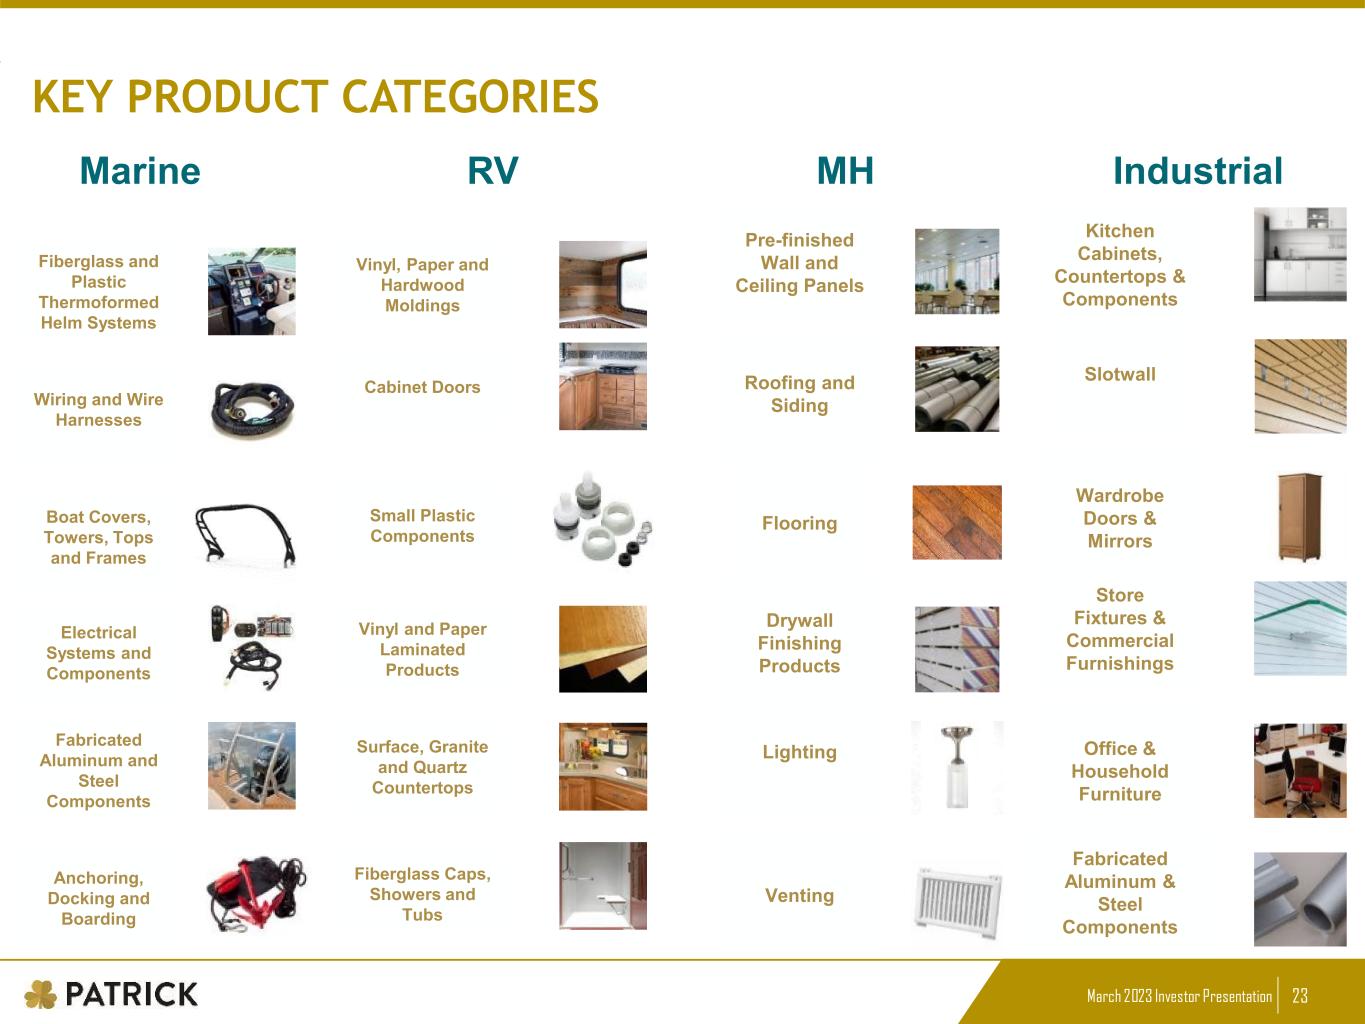
March 2023 Investor Presentation 23 KEY PRODUCT CATEGORIES Fiberglass and Plastic Thermoformed Helm Systems Wiring and Wire Harnesses Electrical Systems and Components Fabricated Aluminum and Steel Components Boat Covers, Towers, Tops and Frames Anchoring, Docking and Boarding Vinyl and Paper Laminated Products Surface, Granite and Quartz Countertops Vinyl, Paper and Hardwood Moldings Fiberglass Caps, Showers and Tubs Cabinet Doors Small Plastic Components Pre-finished Wall and Ceiling Panels Drywall Finishing Products Flooring Roofing and Siding Venting Lighting Kitchen Cabinets, Countertops & Components Office & Household Furniture Wardrobe Doors & Mirrors Store Fixtures & Commercial Furnishings Slotwall Fabricated Aluminum & Steel Components Marine RV MH Industrial
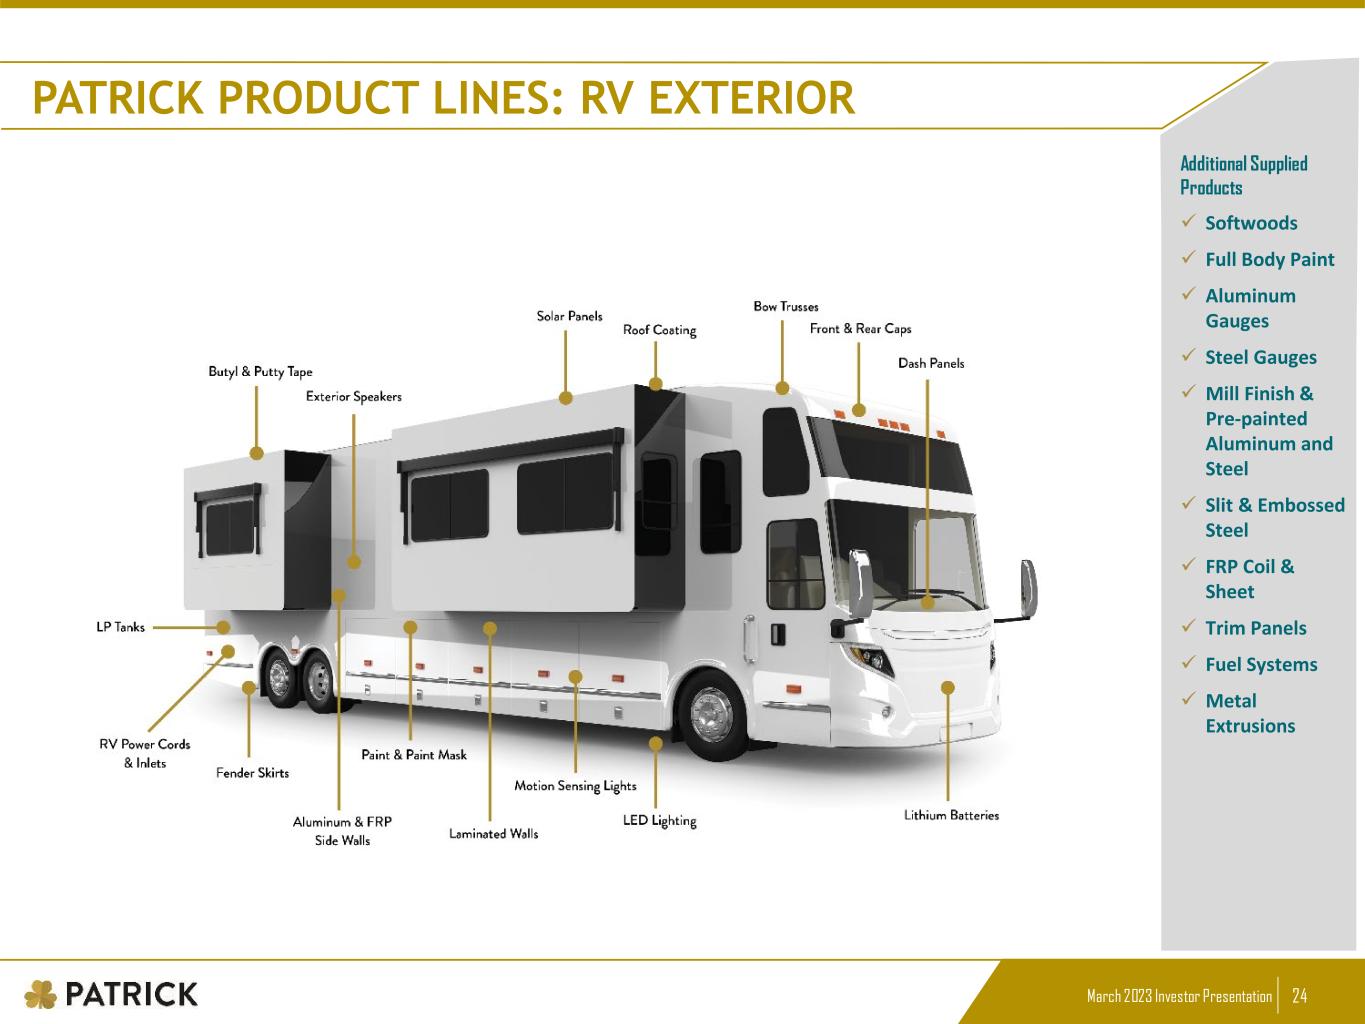
March 2023 Investor Presentation 24 PATRICK PRODUCT LINES: RV EXTERIOR Additional Supplied Products Softwoods Full Body Paint Aluminum Gauges Steel Gauges Mill Finish & Pre-painted Aluminum and Steel Slit & Embossed Steel FRP Coil & Sheet Trim Panels Fuel Systems Metal Extrusions
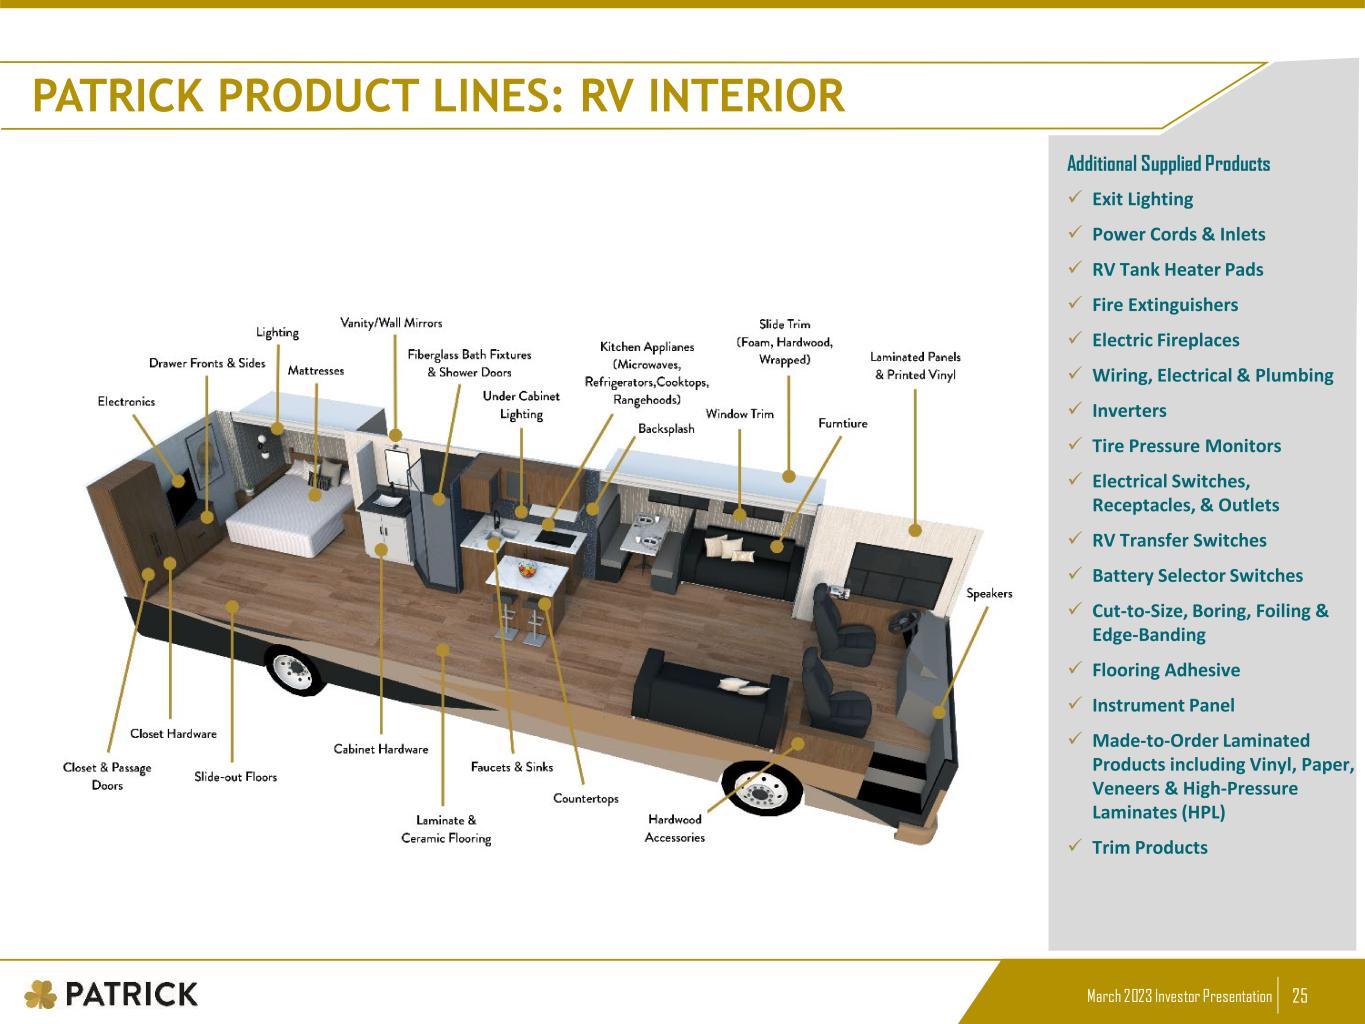
March 2023 Investor Presentation 25 PATRICK PRODUCT LINES: RV INTERIOR Additional Supplied Products Exit Lighting Power Cords & Inlets RV Tank Heater Pads Fire Extinguishers Electric Fireplaces Wiring, Electrical & Plumbing Inverters Tire Pressure Monitors Electrical Switches, Receptacles, & Outlets RV Transfer Switches Battery Selector Switches Cut-to-Size, Boring, Foiling & Edge-Banding Flooring Adhesive Instrument Panel Made-to-Order Laminated Products including Vinyl, Paper, Veneers & High-Pressure Laminates (HPL) Trim Products
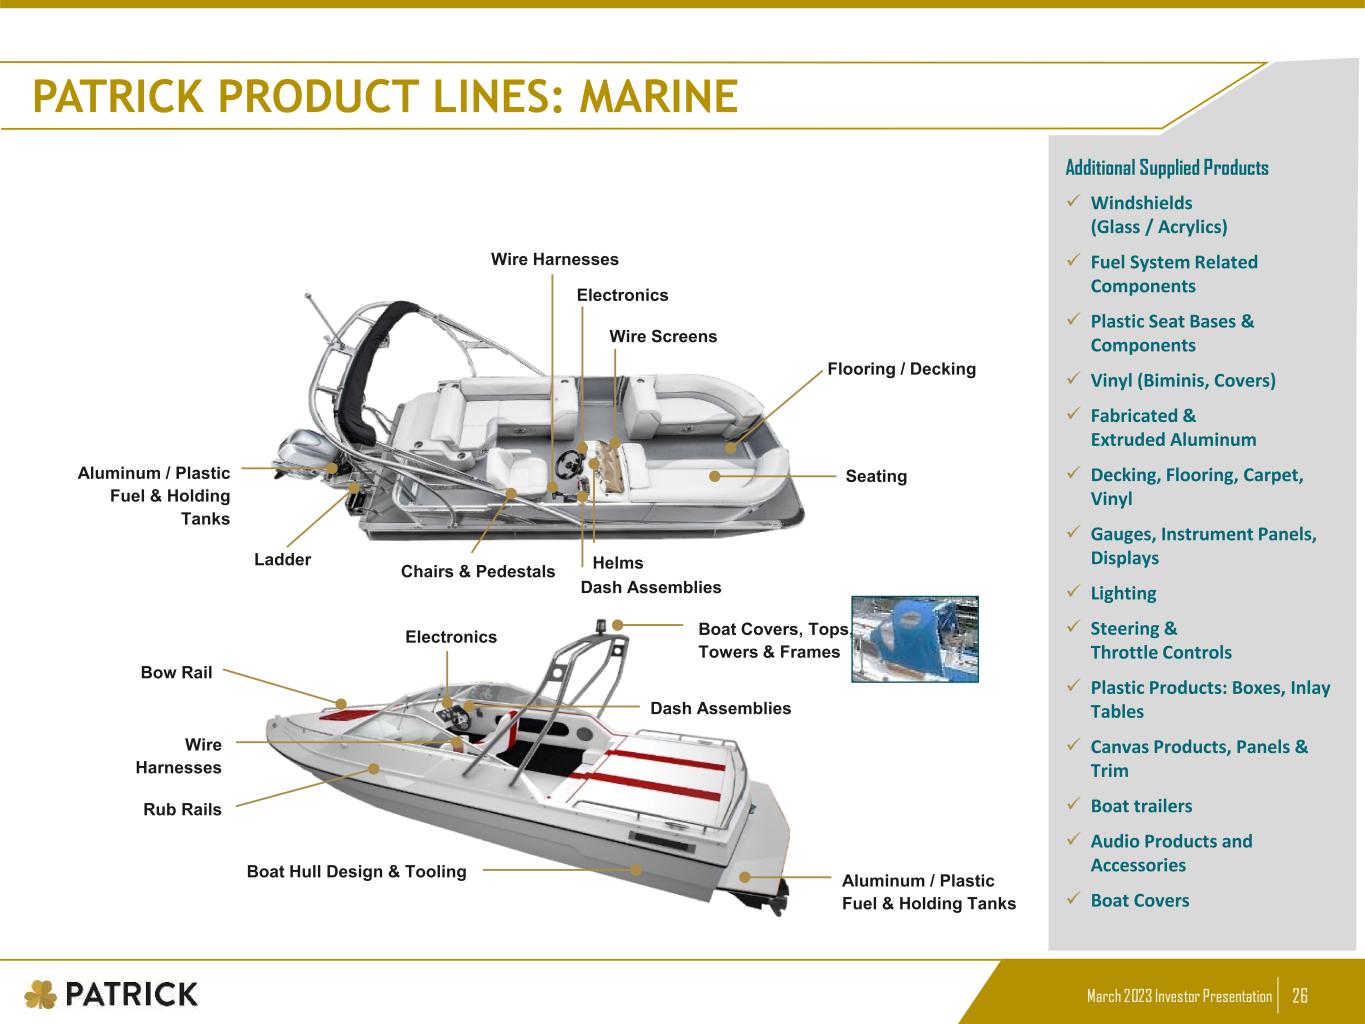
March 2023 Investor Presentation 26 PATRICK PRODUCT LINES: MARINE Additional Supplied Products Softwoods Full Body Paint Aluminum Gauges Steel Gauges Mill Finish & Pre-painted Aluminum and Steel Slit & Embossed Steel FRP Coil & Sheet Trim Panels Fuel Systems Metal Extrusions Aluminum / Plastic Fuel & Holding Tanks Wire Harnesses Electronics Dash Assemblies Wire Screens Helms Aluminum / Plastic Fuel & Holding Tanks Boat Hull Design & Tooling Wire Harnesses Dash Assemblies Electronics Boat Covers, Tops, Towers & Frames Ladder Chairs & Pedestals Rub Rails Bow Rail Flooring / Decking Seating Additional Supplied Products Windshields (Glass / Acrylics) Fuel System Related Components Plastic Seat Bases & Components Vinyl (Biminis, Covers) Fabricated & Extruded Aluminum Decking, Flooring, Carpet, Vinyl Gauges, Instrument Panels, Displays Lighting Steering & Throttle Controls Plastic Products: Boxes, Inlay Tables Canvas Products, Panels & Trim Boat trailers Audio Products and Accessories Boat Covers
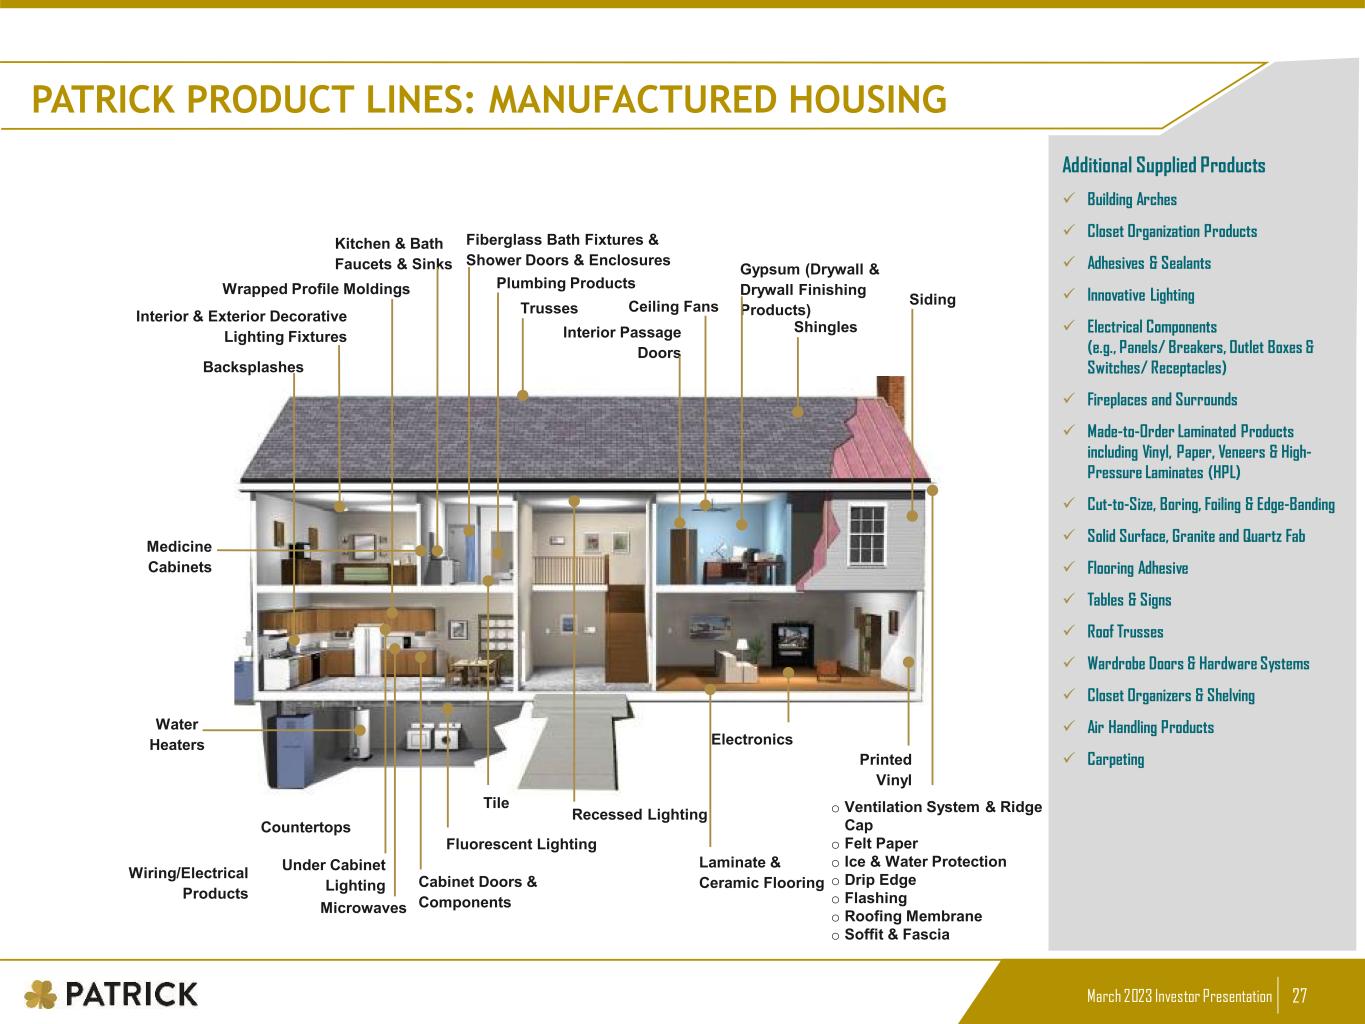
March 2023 Investor Presentation 27 PATRICK PRODUCT LINES: MANUFACTURED HOUSING Additional Supplied Products Softwoods Full Body Paint Aluminum Gauges Steel Gauges Mill Finish & Pre-painted Aluminum and Steel Slit & Embossed Steel FRP Coil & Sheet Trim Panels Fuel Systems Metal Extrusions Interior Passage Doors Kitchen & Bath Faucets & Sinks Gypsum (Drywall & Drywall Finishing Products) Laminate & Ceramic Flooring Fiberglass Bath Fixtures & Shower Doors & Enclosures Cabinet Doors & ComponentsMicrowaves Countertops Electronics Siding Shingles o Ventilation System & Ridge Cap o Felt Paper o Ice & Water Protection o Drip Edge o Flashing o Roofing Membrane o Soffit & Fascia Wrapped Profile Moldings Plumbing Products Backsplashes Recessed Lighting Fluorescent Lighting Wiring/Electrical Products Ceiling Fans Medicine Cabinets Under Cabinet Lighting Tile Printed Vinyl TrussesInterior & Exterior Decorative Lighting Fixtures Water Heaters Additional Supplied Products Building Arches Closet Organization Products Adhesives & Sealants Innovative Lighting Electrical Components (e.g., Panels/ Breakers, Outlet Boxes & Switches/ Receptacles) Fireplaces and Surrounds Made-to-Order Laminated Products including Vinyl, Paper, Veneers & High- Pressure Laminates (HPL) Cut-to-Size, Boring, Foiling & Edge-Banding Solid Surface, Granite and Quartz Fab Flooring Adhesive Tables & Signs Roof Trusses Wardrobe Doors & Hardware Systems Closet Organizers & Shelving Air Handling Products Carpeting

March 2023 Investor Presentation 28 www.patrickind.com