0000276720false00002767202025-01-082025-01-08

UNITED STATES

SECURITIES AND EXCHANGE COMMISSION

Washington, D.C. 20549

FORM 8-K

CURRENT REPORT

Pursuant to Section 13 or 15(d) of the Securities Exchange Act of 1934

Date of Report (Date of earliest event reported): January 8, 2025

PURE CYCLE CORPORATION

(Exact name of registrant as specified in its charter)

Colorado

(State or other jurisdiction of incorporation)

0-8814


84-0705083

(Commission File Number)

(IRS Employer Identification No.)

34501 East Quincy Avenue, Building 1, Suite D, Watkins, CO 80137

(Address of principal executive offices) (Zip Code)

Registrant’s telephone, including area code

(303) 292-3456

N/A

(Former name or former address, if changed since last report.)

Securities registered pursuant to Section 12(b) of the Act:

Common Stock 1/3 of $.01 par value

PCYO

The NASDAQ Stock Market

(Title of each class)

(Trading Symbol(s))

(Name of each exchange on which registered)

Check the appropriate box below if the Form 8-K filing is intended to simultaneously satisfy the filing obligation of the registrant under any of the following provisions (see General Instruction A.2. below):

Written communications pursuant to Rule 425 under the Securities Act (17 CFR 230.425)

Soliciting material pursuant to Rule 14a-12 under the Exchange Act (17 CFR 240.14a-12)

Pre-commencement communications pursuant to Rule 14d-2(b) under the Exchange Act (17 CFR 240.14d-2(b))

Pre-commencement communications pursuant to Rule 13e-4(c) under the Exchange Act (17 CFR 240.13e-4(c))

Indicate by check mark whether the registrant is an emerging growth Registrant as defined in Rule 405 of the Securities Act of 1933 (§ 230.405 of this chapter) or Rule 12b-2 of the Securities Exchange Act of 1934 (§ 240.12b-2 of this chapter).

Emerging growth Registrant

If an emerging growth Registrant, indicate by check mark if the registrant has elected not to use the extended transition period for complying with any new or revised financial accounting standards provided pursuant to Section 13(a) of the Exchange Act. 

This current report on Form 8-K is filed by Pure Cycle Corporation (Registrant), a Colorado corporation, in connection with the matters described herein

Item 2.02 Results of Operations and Financial Condition.


On January 8, 2025, the Registrant issued a press release announcing its financial results for the three months ended November 30, 2024. A copy of the press release is furnished as Exhibit 99.1 hereto, and in incorporated herein by reference.

In accordance with General Instruction B.2 of Form 8-K, the press release furnished as Exhibit 99.1 to this current report on Form 8-K shall not be deemed “filed” for the purposes of Section 18 of the Securities Exchange Act of 1934, as amended, or otherwise subject to the liabilities of that section, nor shall such information or exhibit be deemed incorporated by reference into any filing under the Securities Act of 1933 or Securities Exchange Act of 1934, except as shall be expressly set forth by specific reference in any such filing.

Item 7.01Regulation FD Disclosure

On January 9, 2025, the Registrant presented and posted on its website a presentation summarizing Pure Cycle’s operations and financial results (Earnings Presentation). The Earnings Presentation is furnished as Exhibit 99.2 to this Form 8-K and is incorporated herein by reference.

The information contained in the Earnings Presentation is summary information and should be read in conjunction with Pure Cycle’s filings with the Securities and Exchange Commission and other public announcements that Pure Cycle may make by press release or otherwise from time to time. The Earnings Presentation will be posted in the Investor Relations section of Pure Cycle’s website, www.purecyclewater.com.

The information contained in this Item 7.01 of Form 8-K, including the accompanying Exhibit 99.2 is being furnished, and shall not be deemed to be “filed” for purposes of Section 18 of the Securities Exchange Act of 1934, as amended (Exchange Act), or otherwise subject to the liabilities of that section. The information contained in the presentation shall not be incorporated by reference into any filing under the Securities Act of 1933, as amended, or the Exchange Act, whether made before or after the date hereof, except as shall be expressly set forth by specific reference in such a filing.

Item 9.01Financial Statements and Exhibits.

(d)Exhibits

Exhibit No.


Description

99.1

Press Release dated January 8, 2025, announcing earnings for the three months ended November 30, 2024

99.2

Three months ended November 30, 2024 earnings presentation

104

Cover Page Interactive Data File (the cover page XBRL tags are embedded in the inline XBRL document)

SIGNATURE

Pursuant to the requirements of the Securities Exchange Act of 1934, as amended, the Registrant has duly caused this report to be signed on its behalf by the undersigned hereunto duly authorized.

Date: January 10, 2025

Vice


PURE CYCLE CORPORATION

By:

/s/ Marc S. Spezialy

Marc S. Spezialy

Vice President and Chief Financial Officer

Exhibit 99.1

Graphic

Pure Cycle Announces Financial Results

For the Three Months Ended November 30, 2024

DENVER, CO / ACCESSWIRE / January 8, 2025 – Pure Cycle Corporation (NASDAQ Capital Market: PCYO) announced its financial results for the three months ended November 30, 2024.  Pure Cycle reported $3.9 million of net income for the three months ended November 30, 2024, which is a 91% increase compared to 2023, and marks our twenty-second consecutive fiscal quarter with positive net income.  Pure Cycle reported $0.16 of earnings per fully diluted common share for the three months ended November 30, 2024, which is up from $0.09 in 2023, a 78% increase. Development at the Sky Ranch Master Planned Community continues to progress, and as of November 30, 2024, all homes are complete in Phase 2A, and we are finishing our warranty work.  Our national homebuilder partners have begun construction in Phase 2B, as we finalize landscaping in this phase. We are actively developing Phase 2C, with utility work nearly 60% complete, and we anticipate delivering finished lots with home construction expected to begin late summer of 2025.  Finally, we are well underway with grading work in Phase 2D and expect to complete these lots by the end of calendar year 2025.  Pure Cycle continues to drive income from our resource rich asset base and in the three months ended November 30, 2024, we reported an increase in our royalty revenues from our oil and gas mineral interest at Sky Ranch, where an additional six wells were completed in 2024 that began producing during the quarter.

Q1 2025 Highlights

ØRevenues for the three months ended November 30, 2024 and 2023 of $5.8 million and $5.4 million (a 7% increase), which drove pre-tax income of $5.2 million and $2.8 million (a 86% increase);
ØNet income for the three months ended November 30, 2024 and 2023 of $3.9 million and $2.1 million (a 91% increase);
ØRoyalty income for the three months ended November 30, 2024 and 2023 of $2.8 million and less than $0.1 million;
ØEBITDA for the three months ended November 30, 2024 and 2023 of $5.8 million and $3.4 million (a 71% increase) (see table below for reconciliation of net income to EBITDA);
ØCash & cash equivalents totaled $19.0 million as of November 30, 2024;
ØFor the three months ended November 30, 2024 and 2023, we delivered 301 and 623 acre-feet of water.


Net Income to EBITDA Reconciliation

We continue our profitability as shown in the table below:

Three Months Ended

(In thousands)


November 30, 2024


November 30, 2023

Net Income

$

3,937

$

2,065

Add back:

Interest expense, net

109

108

Taxes

1,271

737

Depreciation / amortization

526

510

EBITDA

$

5,843

$

3,420

Earnings per common share - basic and diluted

Basic

$

0.16

$

0.09

Diluted

$

0.16

$

0.09

Weighted average common shares outstanding:

Basic

24,071,907

24,078,544

Diluted

24,157,347

24,153,662

“Our Q1 results are in line with our expectations for fiscal 2025 and we expect to see another record year for revenues and earnings for our Company,” commented Mark Harding, CEO of Pure Cycle.  “We continue to execute on our land development business, delivering lots to our home builder customers as well as expanding our utility customer base and our rental homes each year.  We continue to look to reinvest in new land positions to continue our successes as a leading Master Planned Developer in the Denver metropolitan area,” continued Mr. Harding.

Q1 2025 Financial Summary

Revenues

For the three months ended November 30, 2024, and 2023, we reported total revenue of $5.8 million and $5.4 million with $3.1 million and $3.3 million being generated in our water and wastewater resource development segment, $2.6 million and $2.0 million generated by our land development segment, and $0.1 million and $0.1 million reported in our single-family rental business.

For the three months ended November 30, 2024, and 2023, we sold 38 and 15 water or water and wastewater taps for $1.5 million and $0.6 million. As of November 30, 2024, we have sold 812 water and wastewater taps at Sky Ranch in Phases 1, 2A, 2B and 2C. Based on current prices and engineering estimates, we believe Phase 2 of Sky Ranch will produce approximately $18 million in water and wastewater tap fee revenue and cash over the next three years.

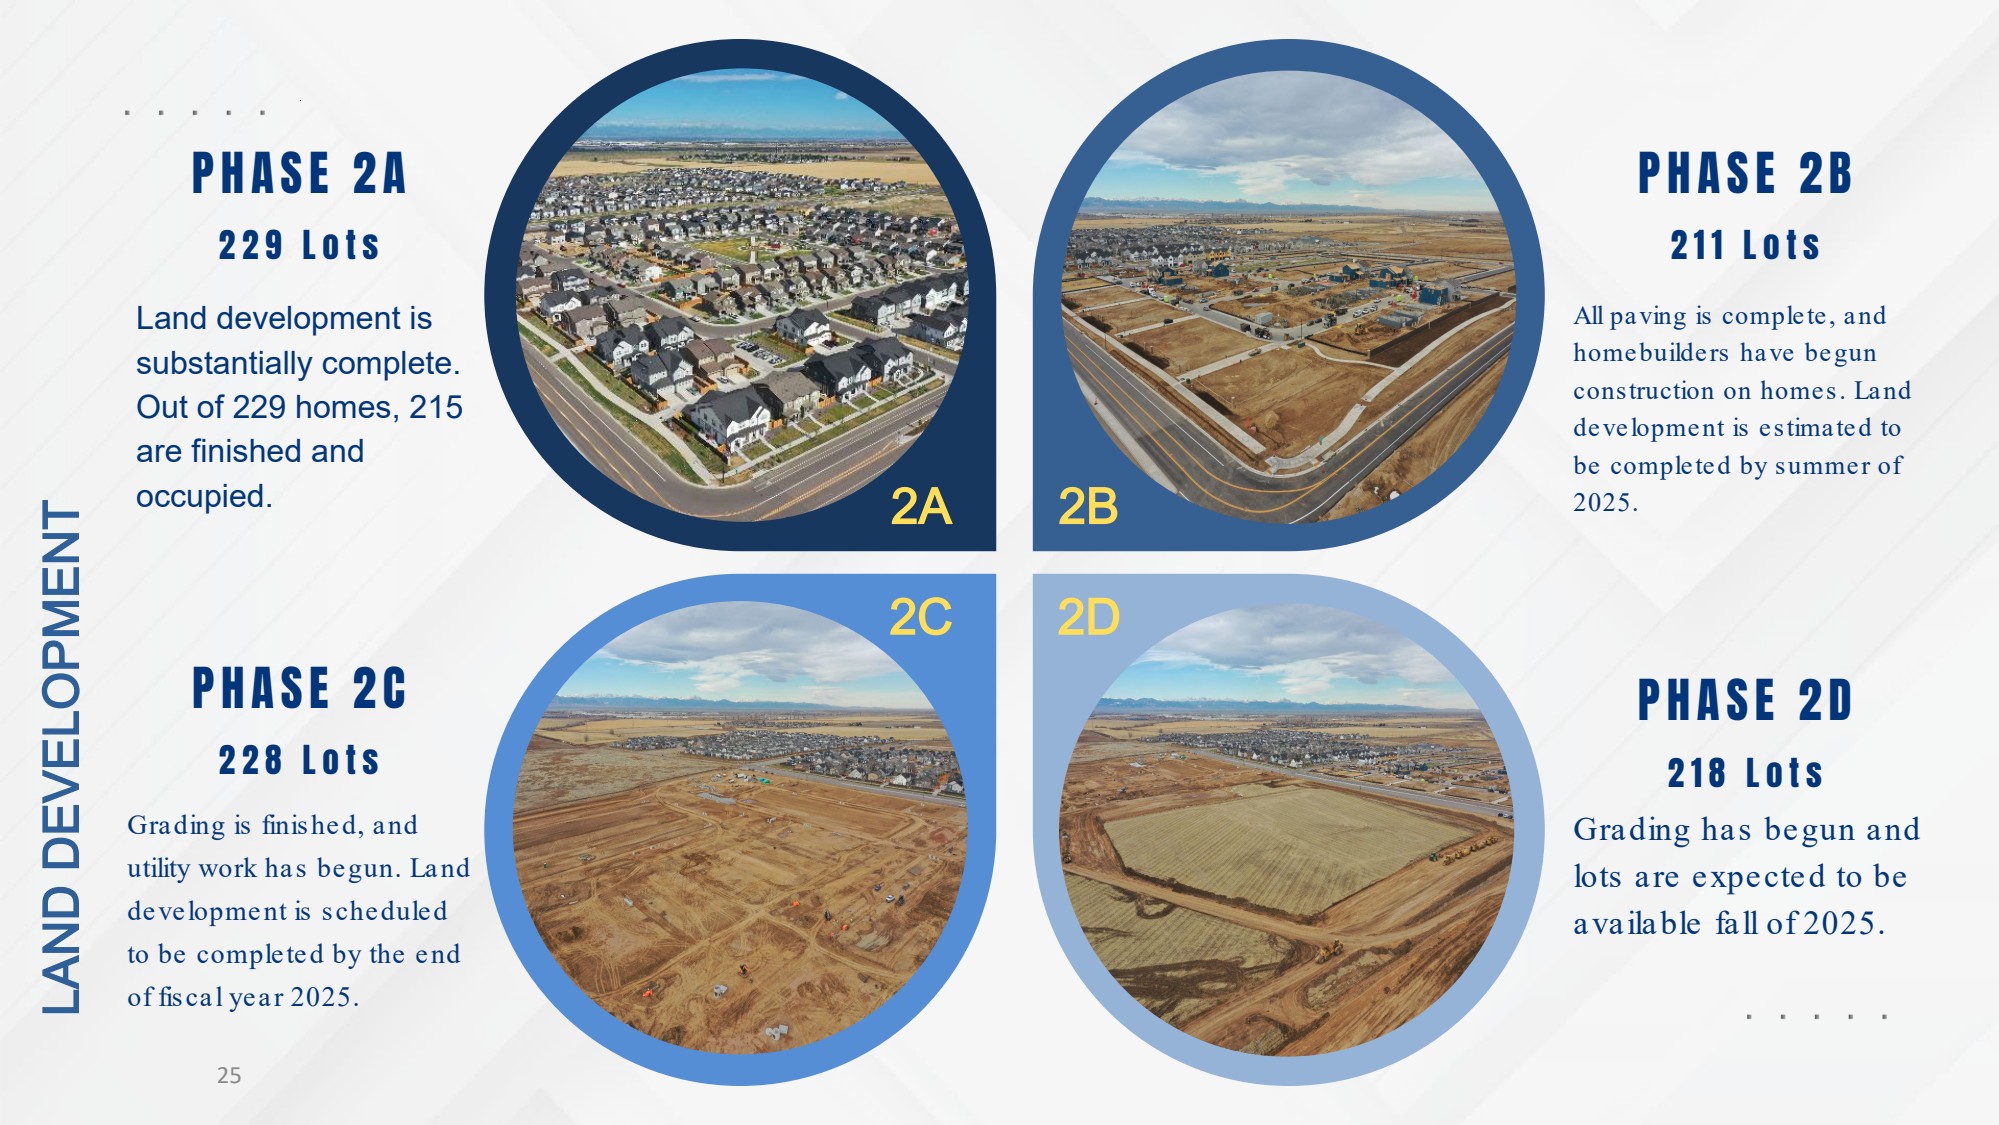
As of November 30, 2024, the first development phase (509 lots) is complete and the second development phase (886 lots) is being developed in four subphases, referred to as Phase 2A (229 lots), Phase 2B (211 lots), Phase 2C (228 lots) and Phase 2D (218 lots). As of November 30, 2024, Phase 2A is nearly 100% complete, Phase 2B is approximately 97% complete, and Phase 2C is approximately 41% complete. Phases 2A and 2B are substantially completed with some landscaping and warranty items remaining. Phase 2C is expected to be complete by the end of Pure Cycle’s fiscal 2025, and Phase 2D began construction in December of 2024.

2


As of November 30, 2024, the single-family rental business had 14 homes built and rented in Sky Ranch and 17 additional homes under contract to build in Phase 2B starting in the spring of 2025. As noted in the prior quarters, due to the overwhelming demand for rental homes at Sky Ranch, we expect to have a total of 98 homes in Phases 1 and 2 with the ability to add more than 200 homes as Sky Ranch builds out.

"Sky Ranch continues to take shape as Pure Cycle progresses its development plans, driven by strong demand for entry-level housing in our market. This momentum is expected to continue in the coming year with concurrent development across multiple subphases," stated Marc Spezialy, CFO of Pure Cycle. "To date, we have delivered 949 finished lots to homebuilders in Sky Ranch, while retaining 31 lots for our single-family rental segment. Construction is currently underway on 228 lots in Phase 2C, with finished lot deliveries scheduled for fiscal 2025. Additionally, we commenced development on an additional 218 lots in Phase 2D in December 2024, with deliveries anticipated in fiscal 2026," concluded Mr. Spezialy.  

Working Capital

We reported working capital (current assets less current liabilities) of $20.3 million as of November 30, 2024, with $19.0 million of cash and cash equivalents.

Q1 2025 Operational Summary

Water and Wastewater Resource Development

Water deliveries decreased for the three months ended November 30, 2024, to 301 acre-feet delivered as compared to 623 acre-feet delivered for 2023. The decrease was due to a decrease in water sold to oil and gas operations, which is not part of our recurring water revenue to residential customers. Oil and gas operations are highly variable and dependent on oil prices, demand for gas, and the timing of development of other leases in our service areas. Our current expectation is for continued strong demand for oil and gas water sales for the coming years. As Sky Ranch continues to develop, we anticipate continued growth in our residential water and wastewater service revenues. Water and wastewater tap sales increased in 2024 to $1.5 million compared to $0.6 million in 2023, primarily due to the timing of development activities in Phase 2B.

Land Development

Lot sales revenue increased to $2.3 million for the three months ended November 30, 2024 compared to $1.9 million in 2023. Increases during the period are primarily due to our accelerated development activities with three ongoing phases in our Sky Ranch Master Planned Community. Because lot sale revenue is recognized as construction progresses, revenue will fluctuate due to timing of construction activities.

Single Family Rentals

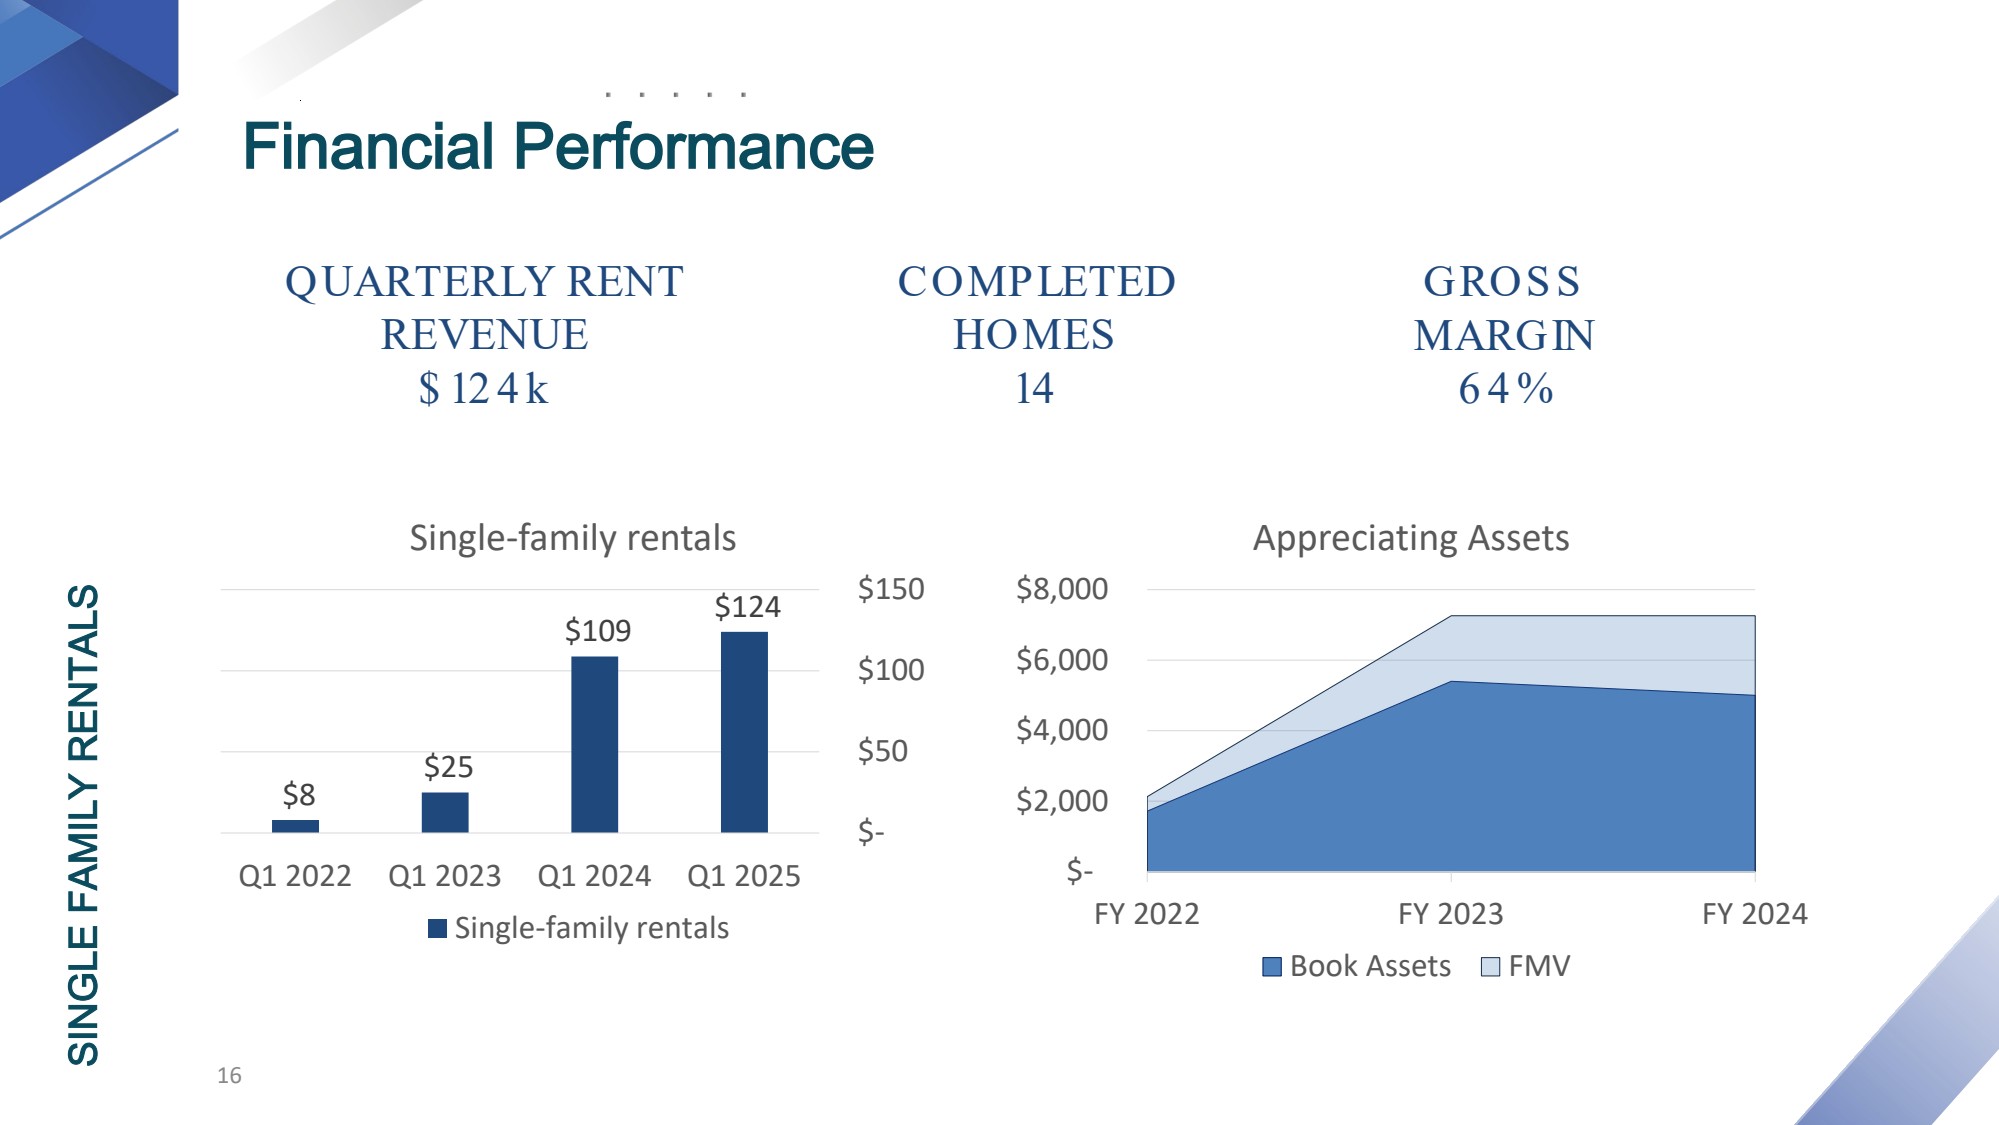
Rental income for the three months ended November 30, 2024 and 2023 was consistent at $0.1 million as both period represented the 14 completed homes in our portfolio.  An additional 17 homes are under contract to be built in Phase 2B starting in the spring of 2025.

Earnings Presentation Information

Pure Cycle will host an earnings presentation on Thursday January 9, 2025, at 8:30AM Eastern (6:30AM Mountain) to discuss the financial results and answer questions. For an interactive experience, including the ability to ask questions and view the slide presentation, please register and join the event via the link below. Call in access will be in listen-only mode. See below for event details. Additionally, we will post a detailed slide presentation on our website, which will provide an overview of Pure Cycle and present summary financial results and can be accessed at www.purecyclewater.com.

When:8:30AM Eastern (6:30AM Mountain) on January 9, 2025

Event link:https://www.purecyclewater.com/Q12025

Call in number:872-240-8702 (access code: 434346205#)

Replay:https://www.purecyclewater.com/investors/news-events/ir-calendar

3


Other Important Information

4


The table below presents our consolidated results of operations for the three months ended November 30, 2024 and 2023 (unaudited):

Three Months Ended

(In thousands, except share information)


November 30, 2024


November 30, 2023

Revenues:


Metered water usage from:

Municipal customers

$

230

$

202

Commercial customers


1,014


2,132

Wastewater treatment fees


89


86

Water and wastewater tap fees


1,466


581

Lot sales


2,319


1,896

Project management fees

253

100

Single-family rentals

124

109

Special facility projects and other


257


280

Total revenues


5,752


5,386

Cost of revenues:

Water service operations


483


553

Wastewater service operations


179


159

Land development construction costs


575


688

Project management costs


85


79

Single-family rental costs


68


57

Depletion and depreciation


371


362

Other


325


146

Total cost of revenues


2,086


2,044

General and administrative expenses


1,792


1,438

Depreciation


155


148

Operating income


1,719


1,756

Other income (expense):

Interest income - related party

484

724

Interest income - Investments

248

308

Oil and gas royalty income, net

2,807

34

Oil and gas lease income, net

18

Other, net

59

70

Interest expense, net

(109)

(108)

Income from operations before income taxes


5,208


2,802

Income tax expense


(1,271)


(737)

Net income

$

3,937

$

2,065

Earnings per common share - basic and diluted

Basic

$

0.16

$

0.09

Diluted

$

0.16

$

0.09

Weighted average common shares outstanding:

Basic


24,071,907

24,078,544

Diluted


24,157,347

24,153,662

5


The following table presents our consolidated financial position as of November 30, 2024 (unaudited) and August 31, 2024 (audited):

(In thousands, except shares)

November 30, 2024


August 31, 2024

ASSETS:

(unaudited)

Current assets:


Cash and cash equivalents

$

19,031

$

22,113

Trade accounts receivable, net


4,993


1,472

Prepaid expenses and other assets


460


530

Land under development

3,718

3,647

Reimbursable public improvements and project management fees

10,100

Total current assets


28,202


37,862

Restricted cash

5,336

3,245

Investments in water and water systems, net


63,773


60,486

Construction in progress

2,584

3,161

Single-family rental units

5,003

5,059

Land and mineral rights:


Held for development

5,993


3,683

Held for investment purposes

451


451

Other assets


1,365


1,164

Notes receivable – related parties, including accrued interest


Reimbursable public improvements and project management fees

35,580

30,864

Other

1,247

1,221

Operating leases - right of use assets


154


158

Total assets

$

149,688

$

147,354

LIABILITIES:

Current liabilities:

Accounts payable

$

2,230

$

1,948

Accrued liabilities

1,181

1,514

Accrued liabilities – related parties


1,091


2,208

Income taxes payable

2,712

1,442

Deferred lot sales revenue


537


2,173

Debt, current portion

161

64

Total current liabilities


7,912


9,349

Debt, less current portion

6,719


6,821

Deferred tax liability, net


1,395


1,395

Lease obligations - operating leases, less current portion


75


87

Total liabilities


16,101


17,652

Commitments and contingencies

SHAREHOLDERS’ EQUITY:

Series B preferred shares: par value $0.001 per share, 25 million authorized;
432,513 issued and outstanding (liquidation preference of $432,513)


Common shares: par value 1/3 of $.01 per share, 40.0 million authorized;
24,076,909 and 24,063,894 outstanding, respectively


80


80

Additional paid-in capital


175,181


175,125

Accumulated deficit


(41,674)


(45,503)

Total shareholders’ equity


133,587


129,702

Total liabilities and shareholders’ equity

$

149,688

$

147,354

6


Company Information

Pure Cycle continues to grow and strengthen its operations, grow its balance sheet, and drive recurring revenues. We operate in three distinct business segments, each of which complements the other. At our core, we are an innovative and vertically integrated wholesale water and wastewater service provider. In 2017, we launched our land development segment which develops master planned communities on land we own and to which we provide water and wastewater services. In 2021, we launched our newest line of business, the rental of single-family homes located at Sky Ranch, which provides long-term recurring revenues, furthers our land development operations, and adds more customers to our water resource segment.

Additional information, including our recent press releases and SEC filings, is available at www.purecyclewater.com, or you may contact our President, Mark W. Harding, or our CFO, Marc Spezialy, at 303-292-3456 or [email protected].

Forward-Looking Statements

This press release contains forward-looking statements within the meaning of Section 27A of the Securities Act of 1933, as amended, and Section 21E of the Securities Exchange Act of 1934, as amended. Forward-looking statements are all statements, other than statements of historical facts, included in this press release that address activities, events or developments that we expect or anticipate will or may occur in the future, such as statements about the following: the completion, delivery and success of our rental units; timing of development at Sky Ranch, including timing of delivery of finished lots; future water and wastewater tap sales and revenues; timing of future home construction by our home builder customers; the strength of the Sky Ranch market, including the demand for entry-level and rental homes; and forecasts about our future sales of water to oil and gas operators, our sales of lots, and our expected financial results. The words "anticipate," "likely," "may," "should," "could," "will," "believe," "estimate," "expect," "plan," "intend," "potential" and similar expressions are intended to identify forward-looking statements. Investors are cautioned that forward-looking statements are inherently uncertain and involve risks and uncertainties that could cause actual results to differ materially. Factors that could cause actual results to differ from projected results include, without limitation: home mortgage interest rates, inflation, and other factors impacting the housing market and home sales; the risk factors discussed in Part I, Item 1A of our most recent Annual Report on Form 10-K for the fiscal year ended August 31, 2024; and those factors discussed from time to time in our press releases, public statement and documents filed or furnished with the U.S. Securities and Exchange Commission. Except as required by law, we disclaim any obligation to update publicly any forward-looking statements, whether because of new information, future events or otherwise.

SOURCE: Pure Cycle Corporation

7

GRAPHIC

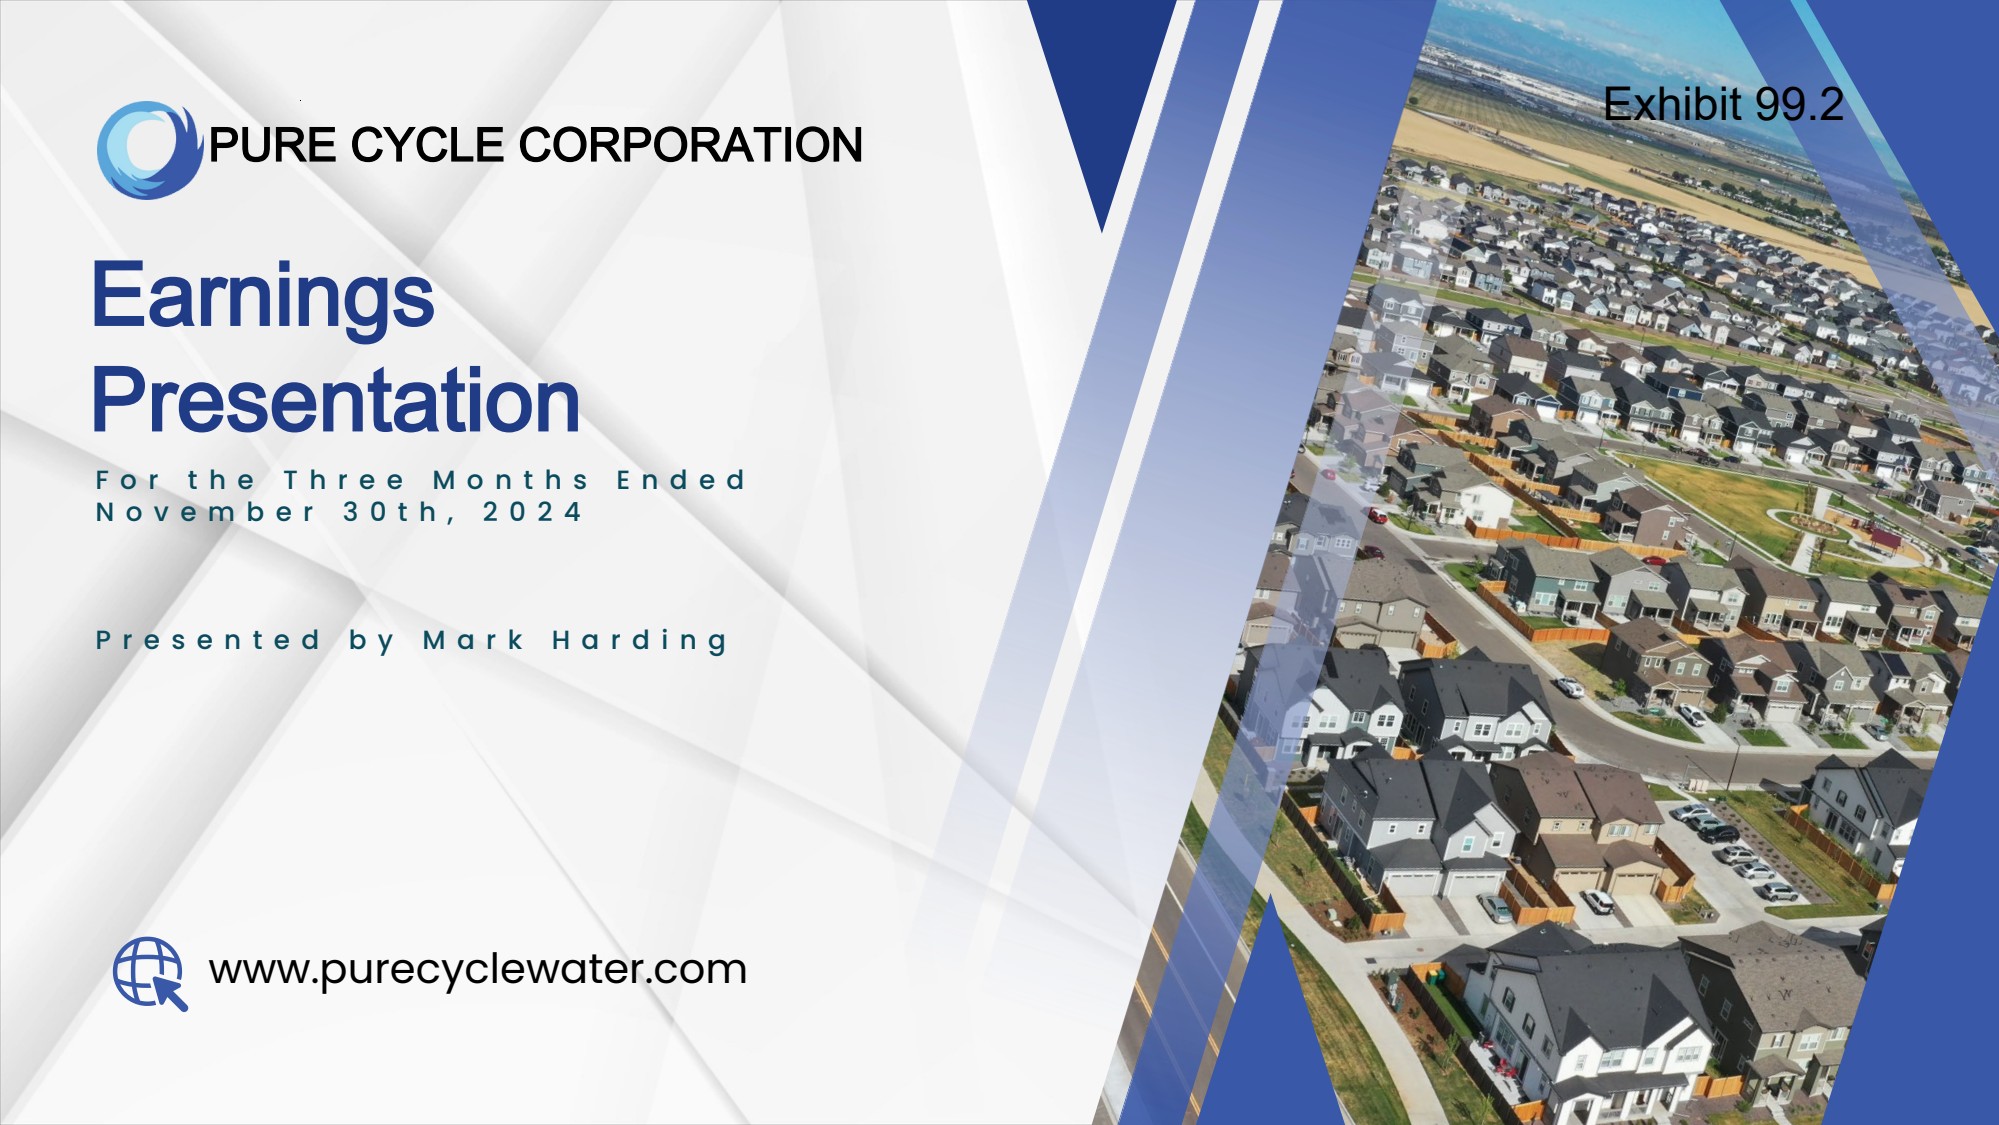
Earnings Presentation PURE CYCLE CORPORATION For the Three Months Ended November 30th, 2024 Presented by Mark Harding www.purecyclewater.com Exhibit 99.2

GRAPHIC

Statements that are not historical facts contained or incorporated by reference in this presentation are “forward-looking statements” (“FLS”) within the meaning of the Private Securities Litigation Reform Act of 1995, Section 27A of the Securities Act of 1933 and Section 21C of the Securities Exchange Act of 1934 as amended. FLS involve risks and uncertainties that could cause actual results to differ from projected results. The words “anticipate,” “believe,” “estimate,” “expect,” “plan,” “intend” and similar expressions, as they relate to us, are intended to identify FLS. Such statements reflect our current views with respect to future events and are subject to certain risks, uncertainties and assumptions. We are not able to predict all factors that may affect future results. We cannot assure you that any of our expectations will be realized. Our actual results could differ materially from those discussed in or implied by these forward-looking statements. Factors that may cause actual results to differ materially from those contemplated by such FLS include, without limitation: the risk factors discussed in our most recent Annual Report on Form 10-K; the timing of new home construction and other development in the areas where we may sell our water, which in turn may be impacted by credit availability; population growth; employment rates; general economic conditions; the market price of water; changes in customer consumption patterns; changes in applicable statutory and regulatory requirements; changes in governmental policies and procedures; uncertainties in the estimation of water available under decrees; uncertainties in the estimation of costs of delivery of water and treatment of wastewater; uncertainties in the estimation of the service life of our systems; uncertainties in the estimation of costs of construction projects; uncertainties in the amount and timing of reimbursable public improvement payments: uncertainty in the single family home rental market and our ability to rent homes in a timely manner or at the amount we project; the strength and financial resources of our competitors; our ability to find and retain skilled personnel; climatic and weather conditions, including flood, droughts and freezing conditions; labor relations; availability and cost of labor, material and equipment; delays in anticipated permit and construction dates; environmental risks and regulations; our ability to raise capital; our ability to negotiate contracts with new customers; and uncertainties in water court rulings; and other factors discussed from time to time in our press releases, public statements and documents filed or furnished with the SEC.​Forward-Looking Statements Forward-Looking Statements 2

GRAPHIC

3 Leadership Team MARK W. HARDING President, CEO, and Director Mark is an exceptional leader who has significantly shaped Pure Cycle's success. Under his 35 year tenure, the company has successfully acquired over $130 million in water and land interests. His vision and strategic acumen have been instrumental in the company's growth and impact. MARC SPEZIALY VP, CFO, Principal Accounting Officer, Principal Financial Officer Marc brings over 20 years of financial expertise. He manages our financial operations and single -family rentals. Marc obtained his bachelor's degree in Accounting and Finance from the University of San Francisco and is a licensed Certified Public Accountant. RACHELLE BEAUDRY Head of Marketing SCOTT LEHMAN Vice President, Engineering Scott brings four decades of experience as a Professional Engineer (PE) to the role. His expertise encompasses planning, design, construction, and operation of water and wastewater systems. With educational foundations from the University of Colorado and Stanford University, he plays a pivotal role in shaping our strategies and operations in this vital sector. DIRK LASHNITS Vice President, Land Development Dirk is a seasoned leader with a Civil Engineering background and over two decades of local land development experience. He skillfully guides land development, entitlements, and construction, playing a vital role in advancing corporate objectives, risk management, and project success.

GRAPHIC

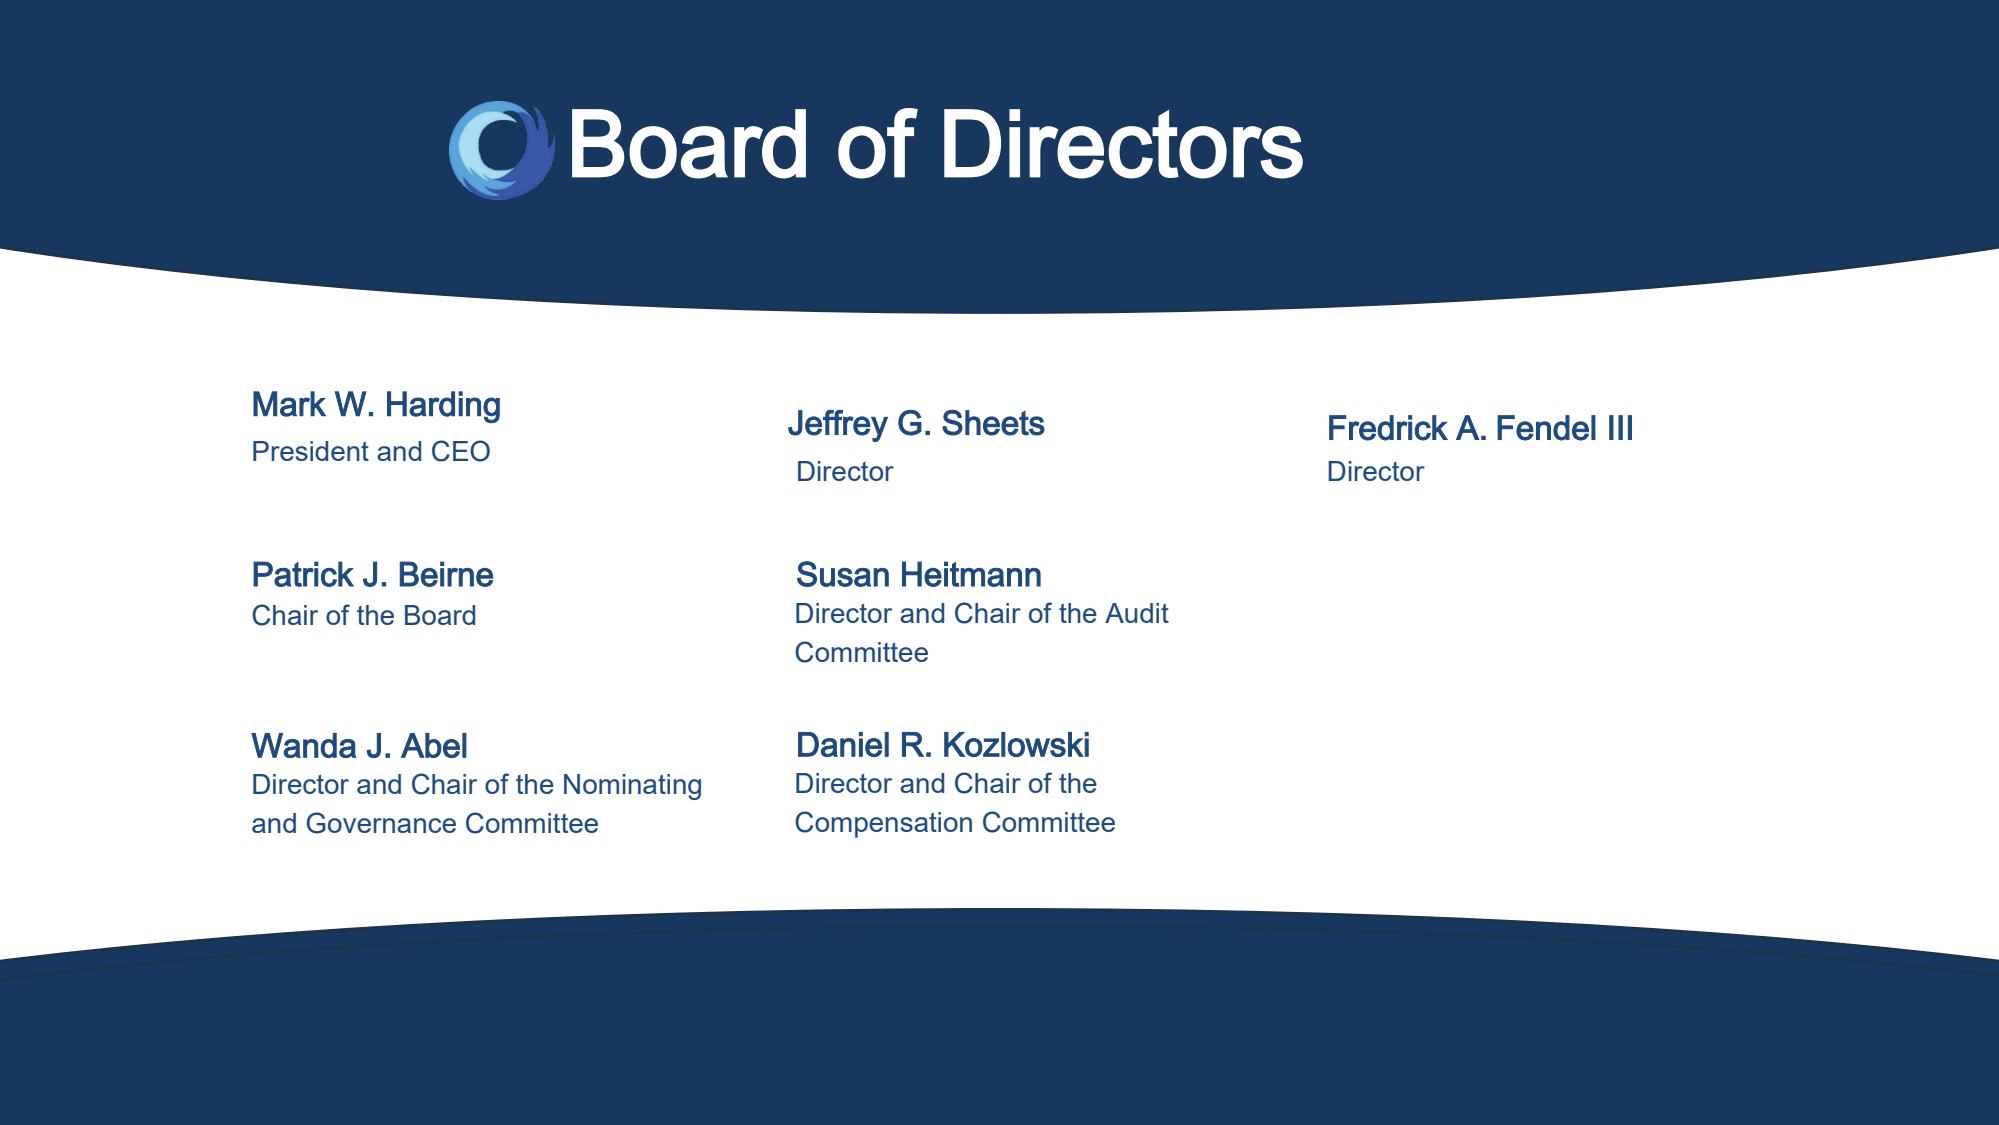
4 Management team Board of Directors Mark W. Harding Patrick J. Beirne Susan Heitmann Jeffrey G. Sheets Wanda J. Abel Daniel R. Kozlowski Fredrick A. Fendel III President and CEO Chair of the Board Director and Chair of the Audit Committee Director Director Director and Chair of the Compensation Committee Director and Chair of the Nominating and Governance Committee

GRAPHIC

LS FINANCIALS PURE CYCLE CORPORATION 5

GRAPHIC

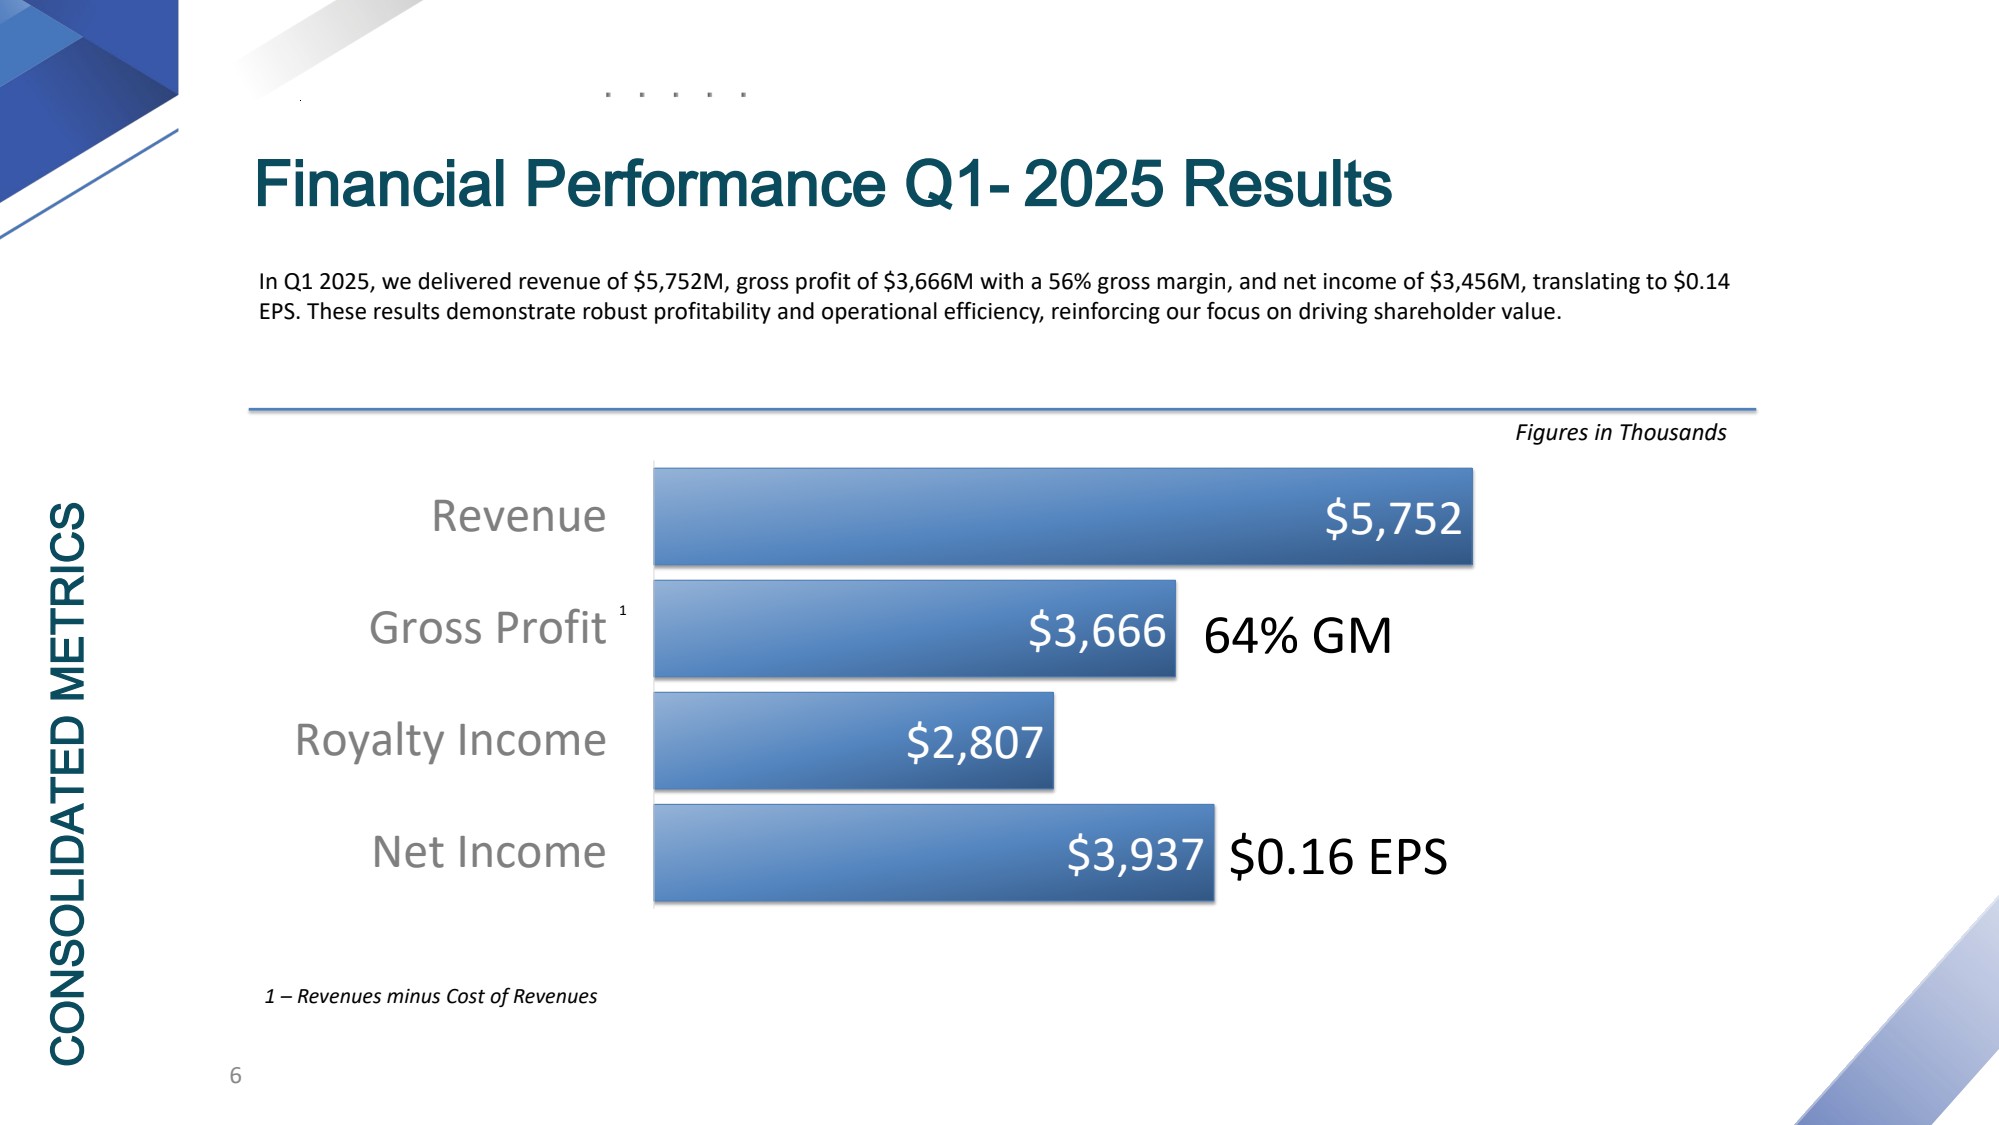
Financial Performance Q1- 2025 Results CONSOLIDATED METRICS In Q1 2025, we delivered revenue of $5,752M, gross profit of $3,666M with a 56% gross margin, and net income of $3,456M, translating to $0.14 EPS. These results demonstrate robust profitability and operational efficiency, reinforcing our focus on driving shareholder value. 6 $3,937 $2,807 $3,666 $5,752 Net Income Royalty Income Gross Profit Revenue $0.16 EPS 1 64% GM Figures in Thousands 1 – Revenues minus Cost of Revenues

GRAPHIC

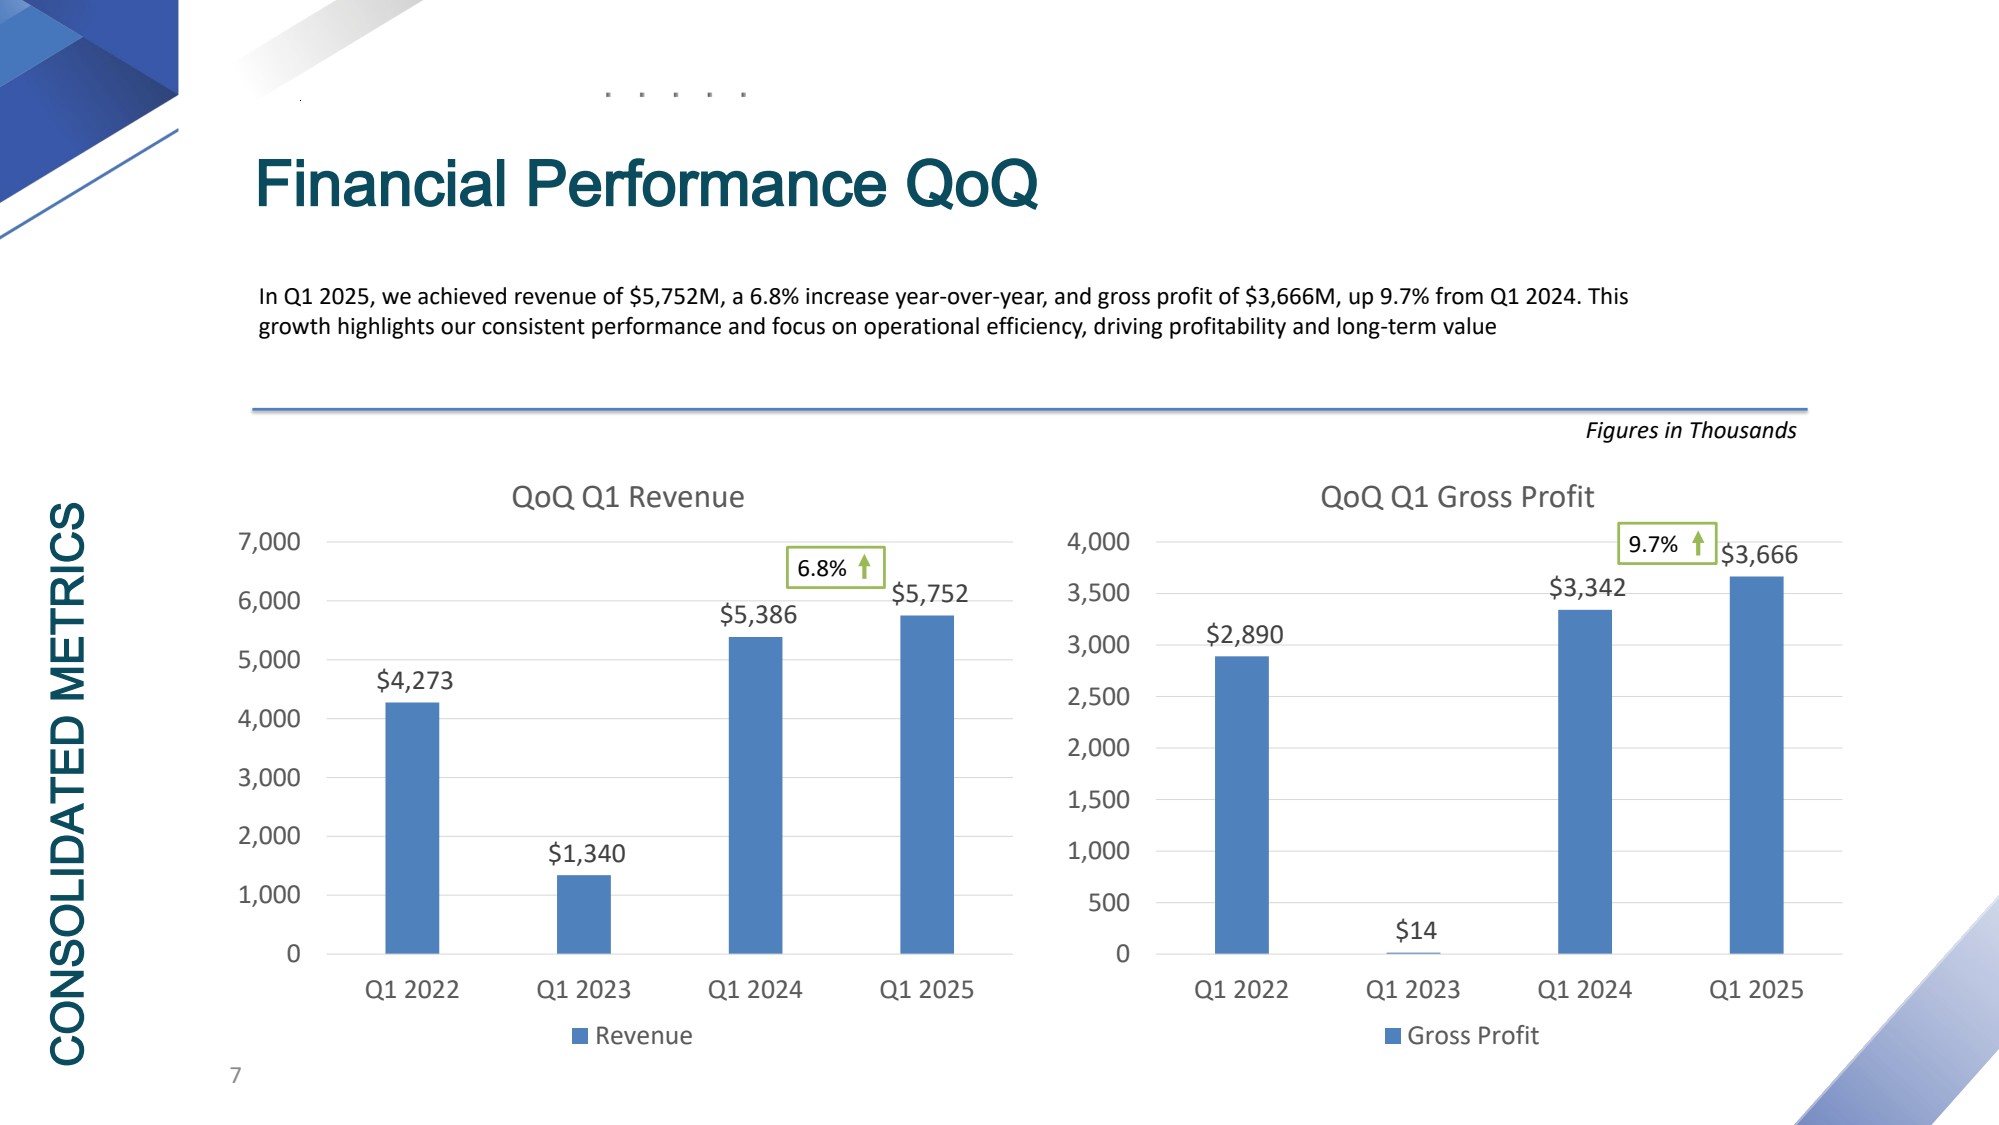
Financial Performance QoQ CONSOLIDATED METRICS In Q1 2025, we achieved revenue of $5,752M, a 6.8% increase year-over-year, and gross profit of $3,666M, up 9.7% from Q1 2024. This growth highlights our consistent performance and focus on operational efficiency, driving profitability and long-term value 7 $4,273 $1,340 $5,386 $5,752 0 1,000 2,000 3,000 4,000 5,000 6,000 7,000 Q1 2022 Q1 2023 Q1 2024 Q1 2025 QoQ Q1 Revenue Revenue $2,890 $14 $3,342 $3,666 0 500 1,000 1,500 2,000 2,500 3,000 3,500 4,000 Q1 2022 Q1 2023 Q1 2024 Q1 2025 QoQ Q1 Gross Profit Gross Profit Figures in Thousands 6.8% 9.7%
GRAPHIC

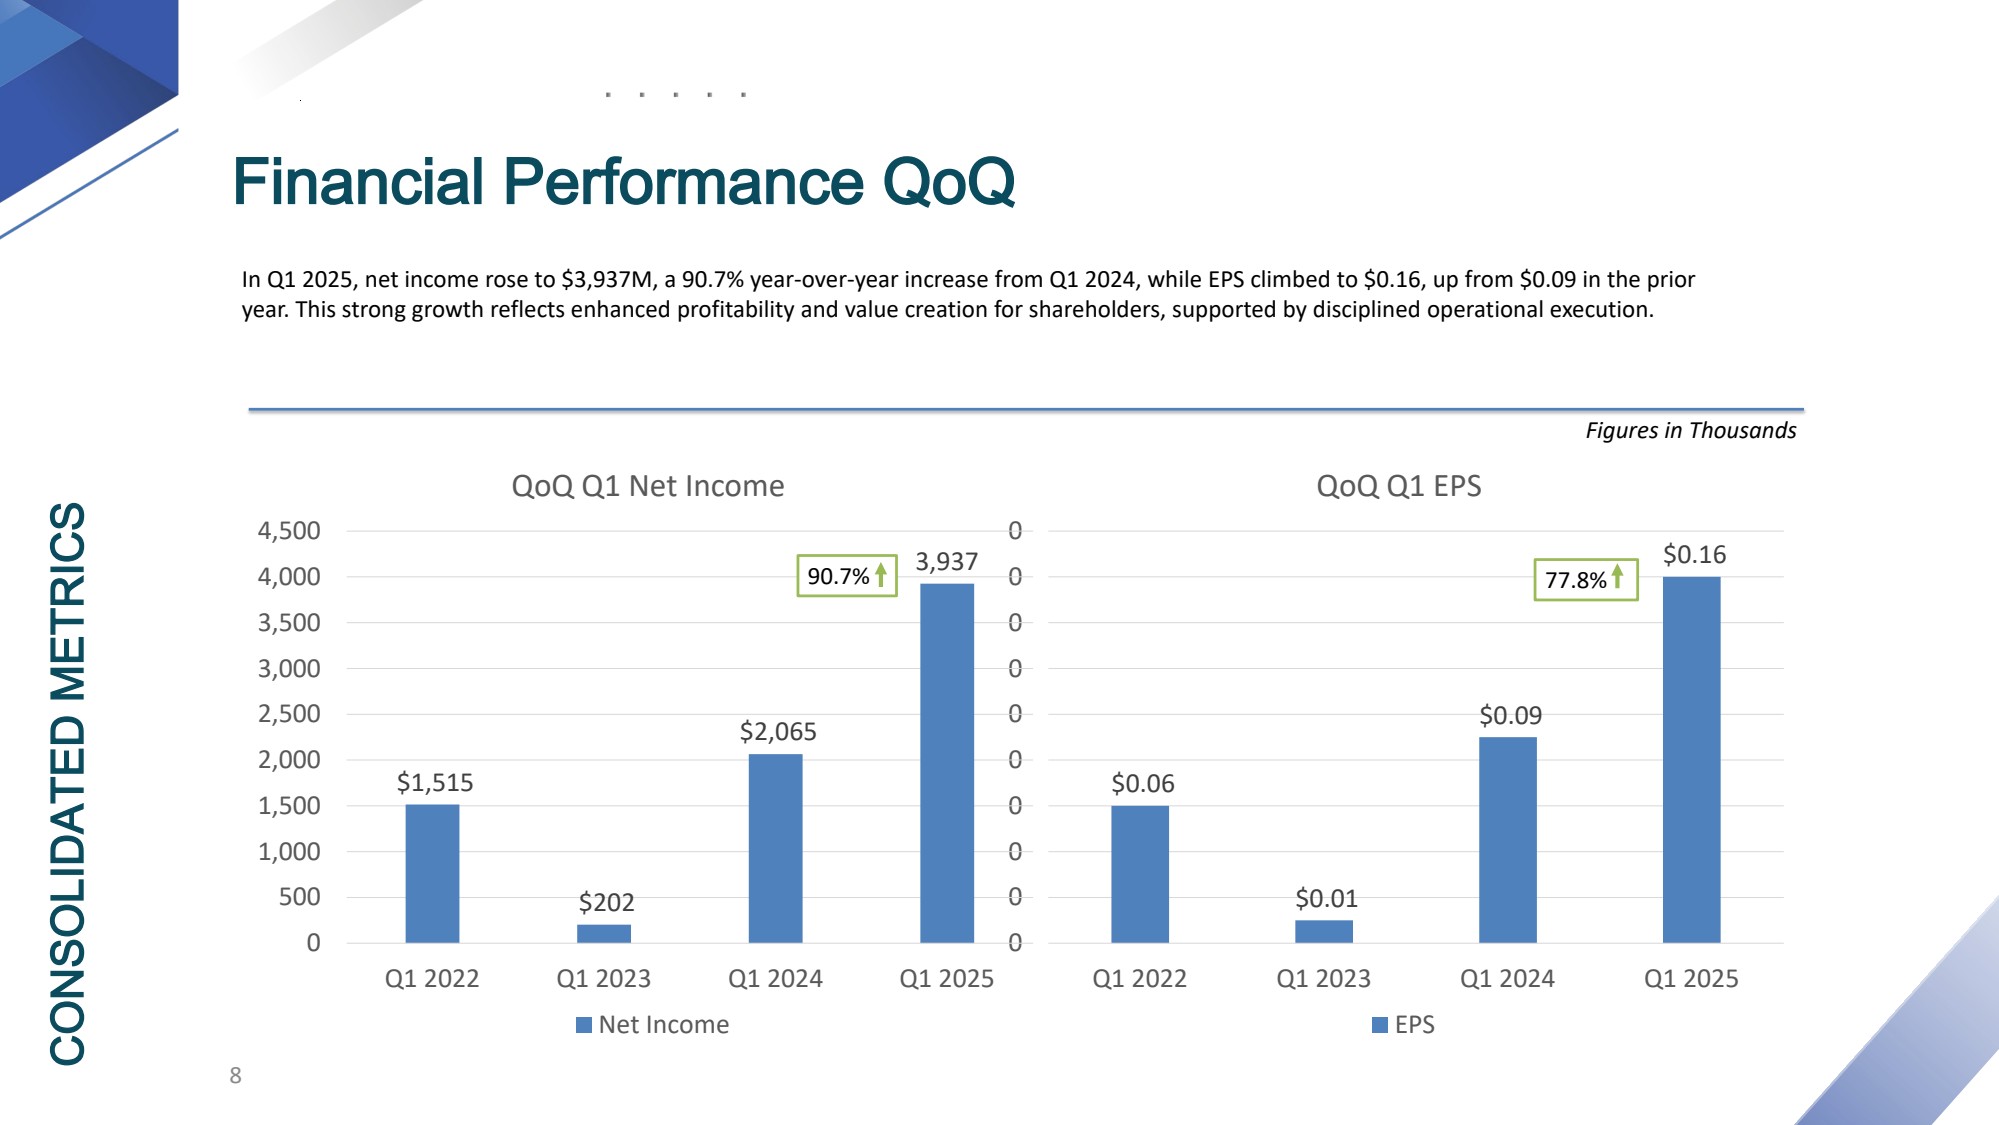
$0.06 $0.01 $0.09 $0.16 0 0 0 0 0 0 0 0 0 0 Q1 2022 Q1 2023 Q1 2024 Q1 2025 QoQ Q1 EPS EPS 77.8% $1,515 $202 $2,065 3,937 0 500 1,000 1,500 2,000 2,500 3,000 3,500 4,000 4,500 Q1 2022 Q1 2023 Q1 2024 Q1 2025 QoQ Q1 Net Income Net Income 90.7% Financial Performance QoQ CONSOLIDATED METRICS In Q1 2025, net income rose to $3,937M, a 90.7% year-over-year increase from Q1 2024, while EPS climbed to $0.16, up from $0.09 in the prior year. This strong growth reflects enhanced profitability and value creation for shareholders, supported by disciplined operational execution. 8 Figures in Thousands
GRAPHIC

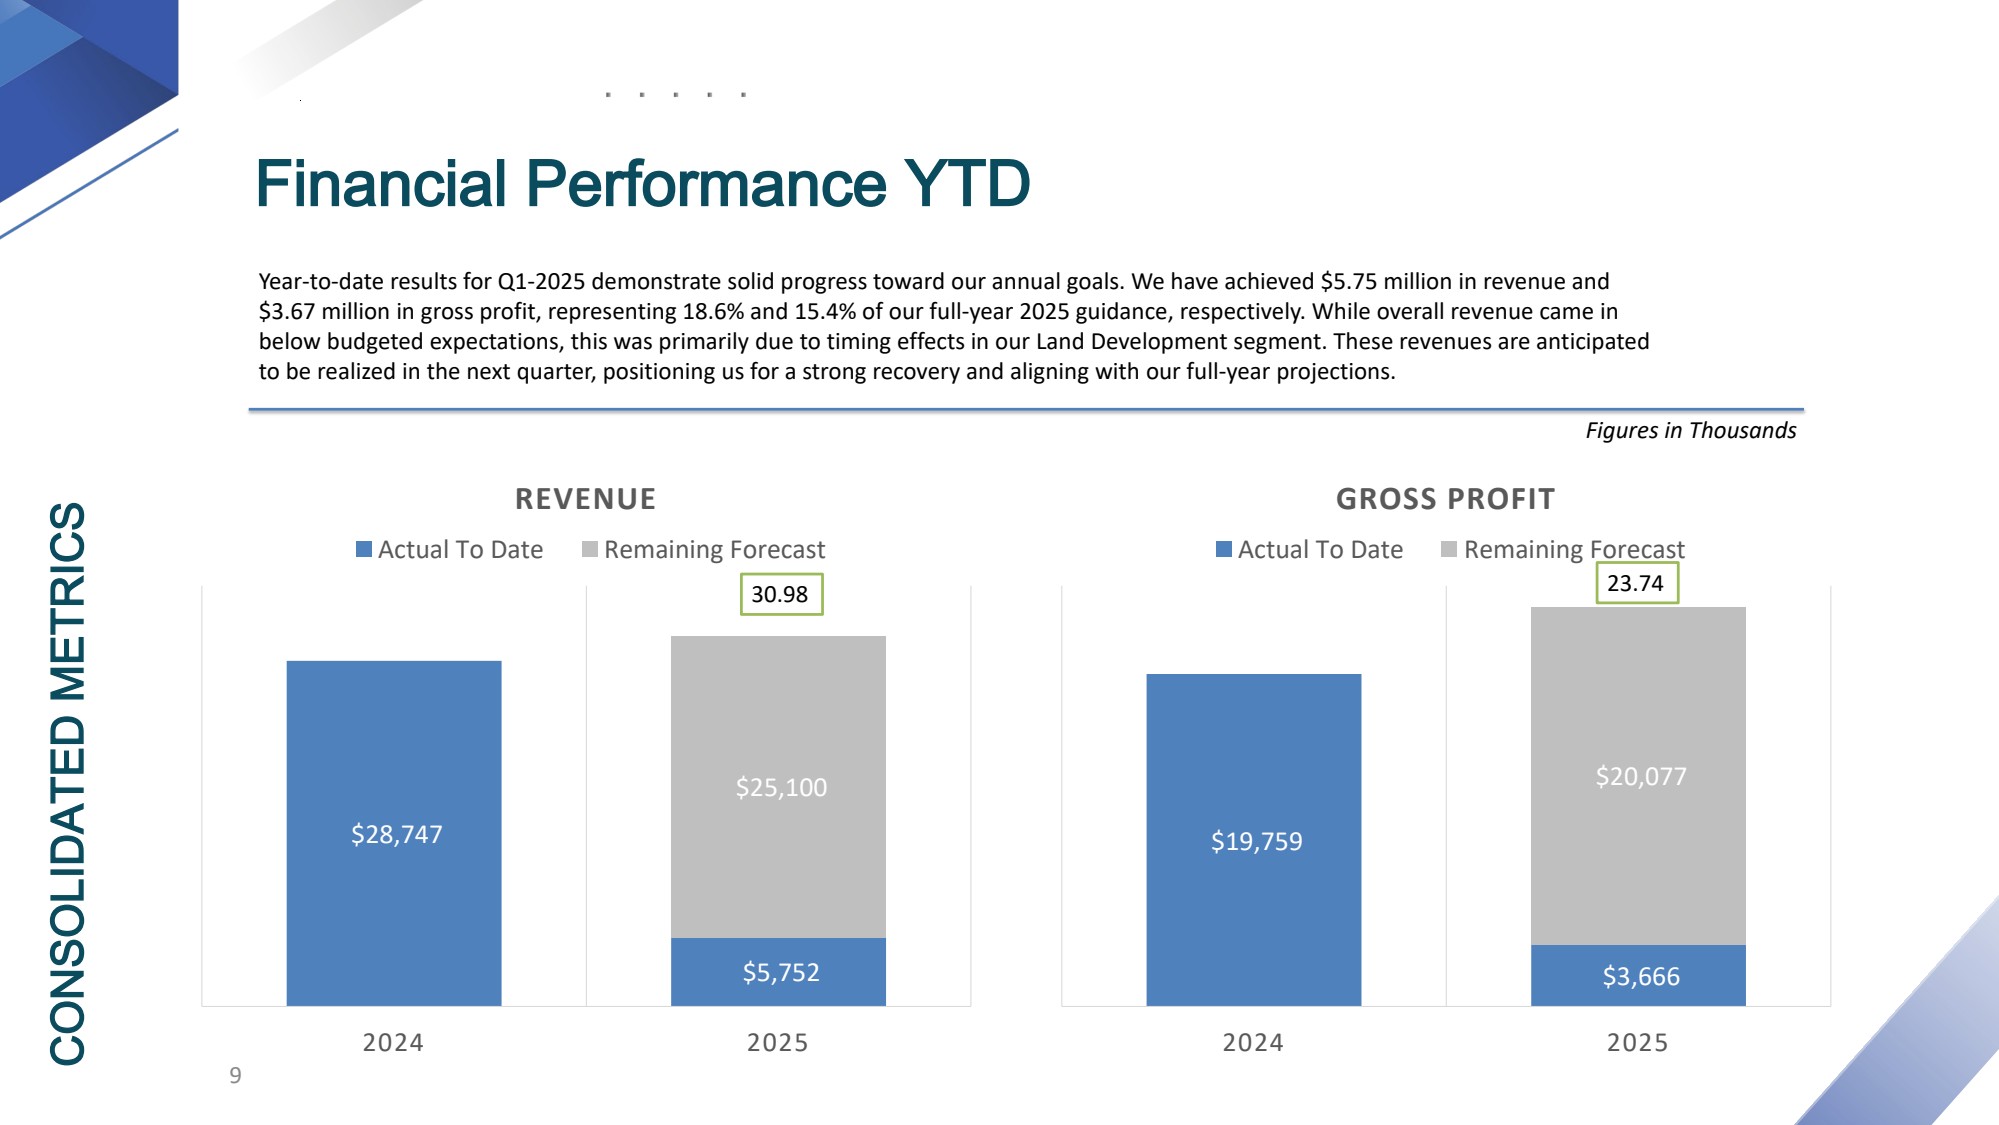
Financial Performance YTD CONSOLIDATED METRICS Year-to-date results for Q1-2025 demonstrate solid progress toward our annual goals. We have achieved $5.75 million in revenue and $3.67 million in gross profit, representing 18.6% and 15.4% of our full-year 2025 guidance, respectively. While overall revenue came in below budgeted expectations, this was primarily due to timing effects in our Land Development segment. These revenues are anticipated to be realized in the next quarter, positioning us for a strong recovery and aligning with our full-year projections. 9 Figures in Thousands $28,747 $5,752 $25,100 2024 2025 REVENUE Actual To Date Remaining Forecast 30.98 $19,759 $3,666 $20,077 2024 2025 GROSS PROFIT Actual To Date Remaining Forecast 23.74

GRAPHIC

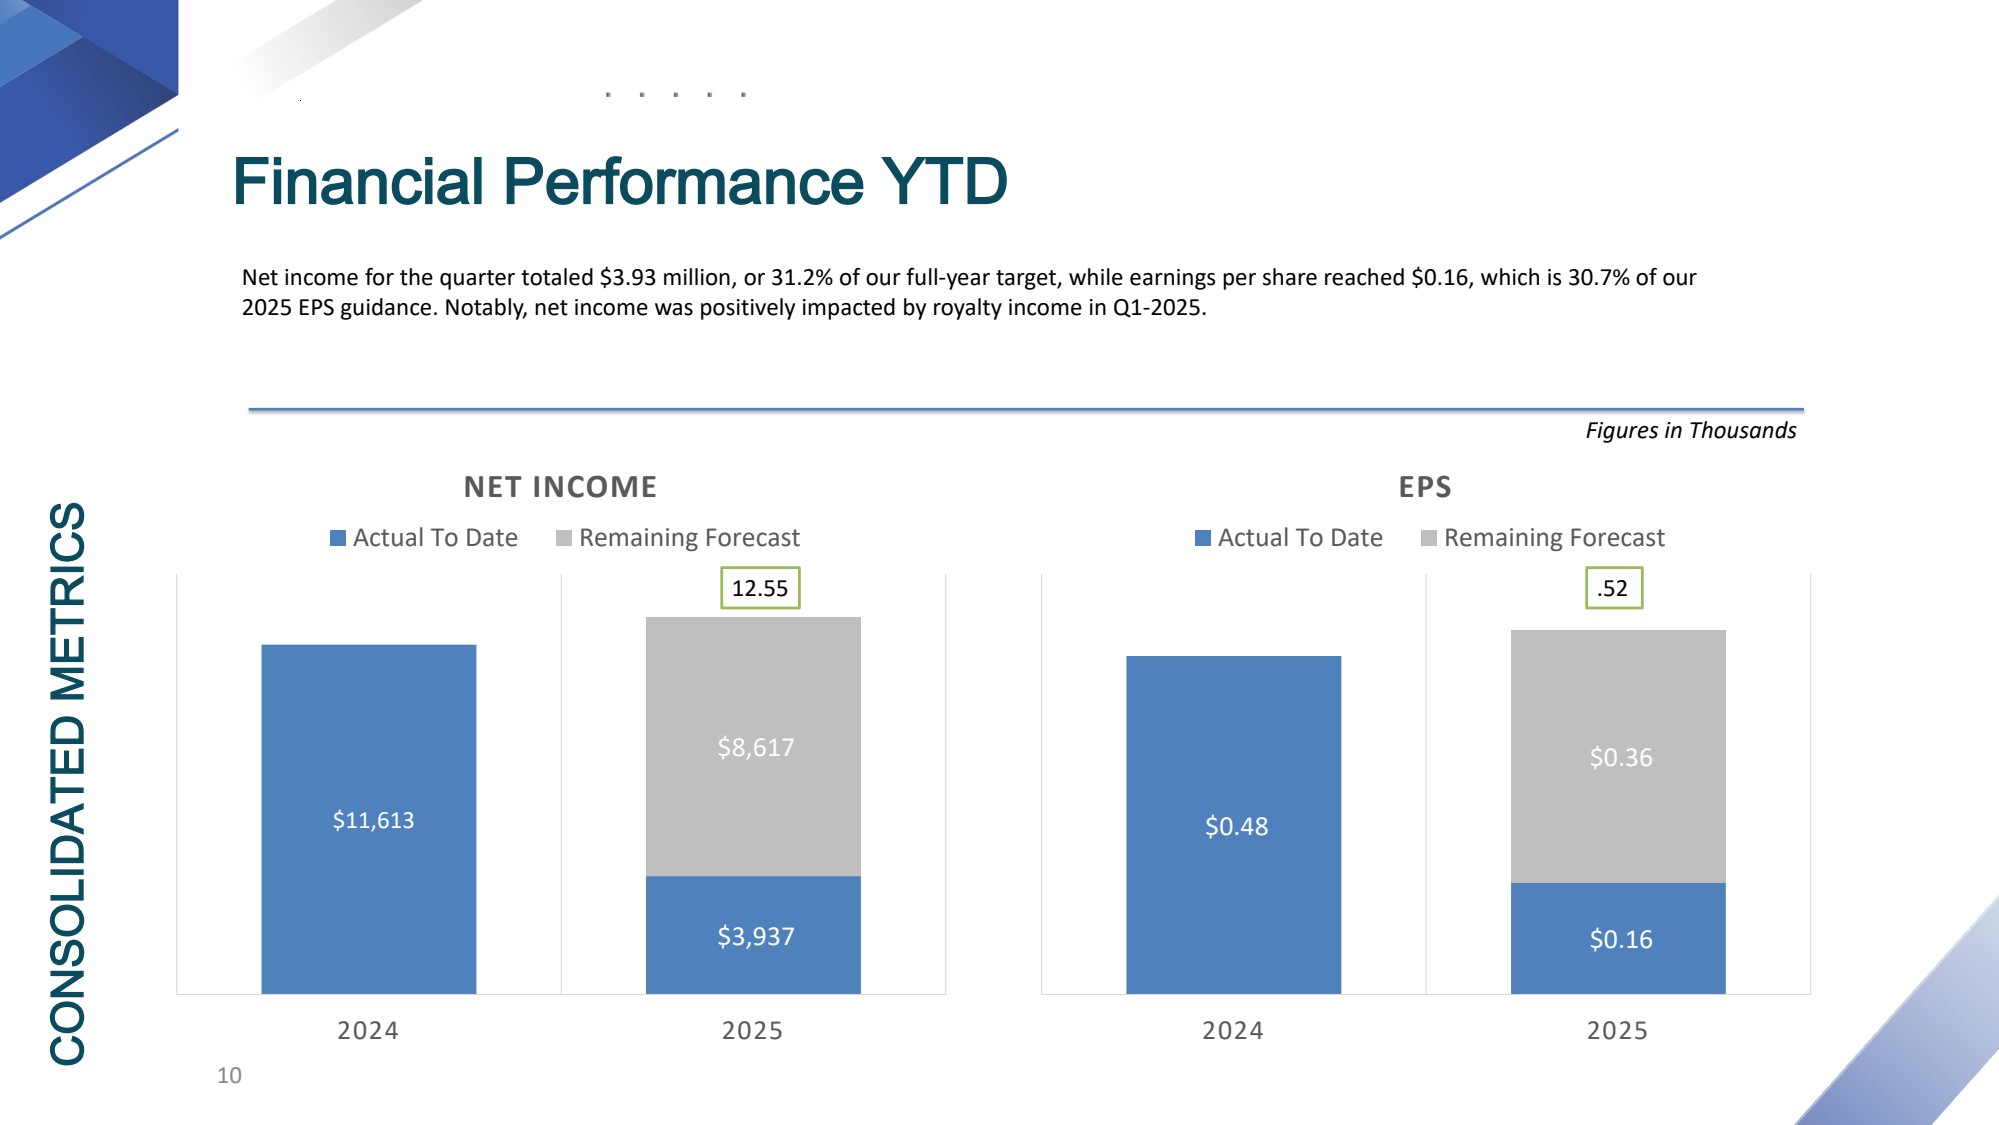
Financial Performance YTD CONSOLIDATED METRICS Net income for the quarter totaled $3.93 million, or 31.2% of our full-year target, while earnings per share reached $0.16, which is 30.7% of our 2025 EPS guidance. Notably, net income was positively impacted by royalty income in Q1-2025. 10 $11,637 $3,937 $8,617 2024 2025 NET INCOME Actual To Date Remaining Forecast 12.55 $0.48 $0.16 $0.36 2024 2025 EPS Actual To Date Remaining Forecast .52 Figures in Thousands $11,613

GRAPHIC

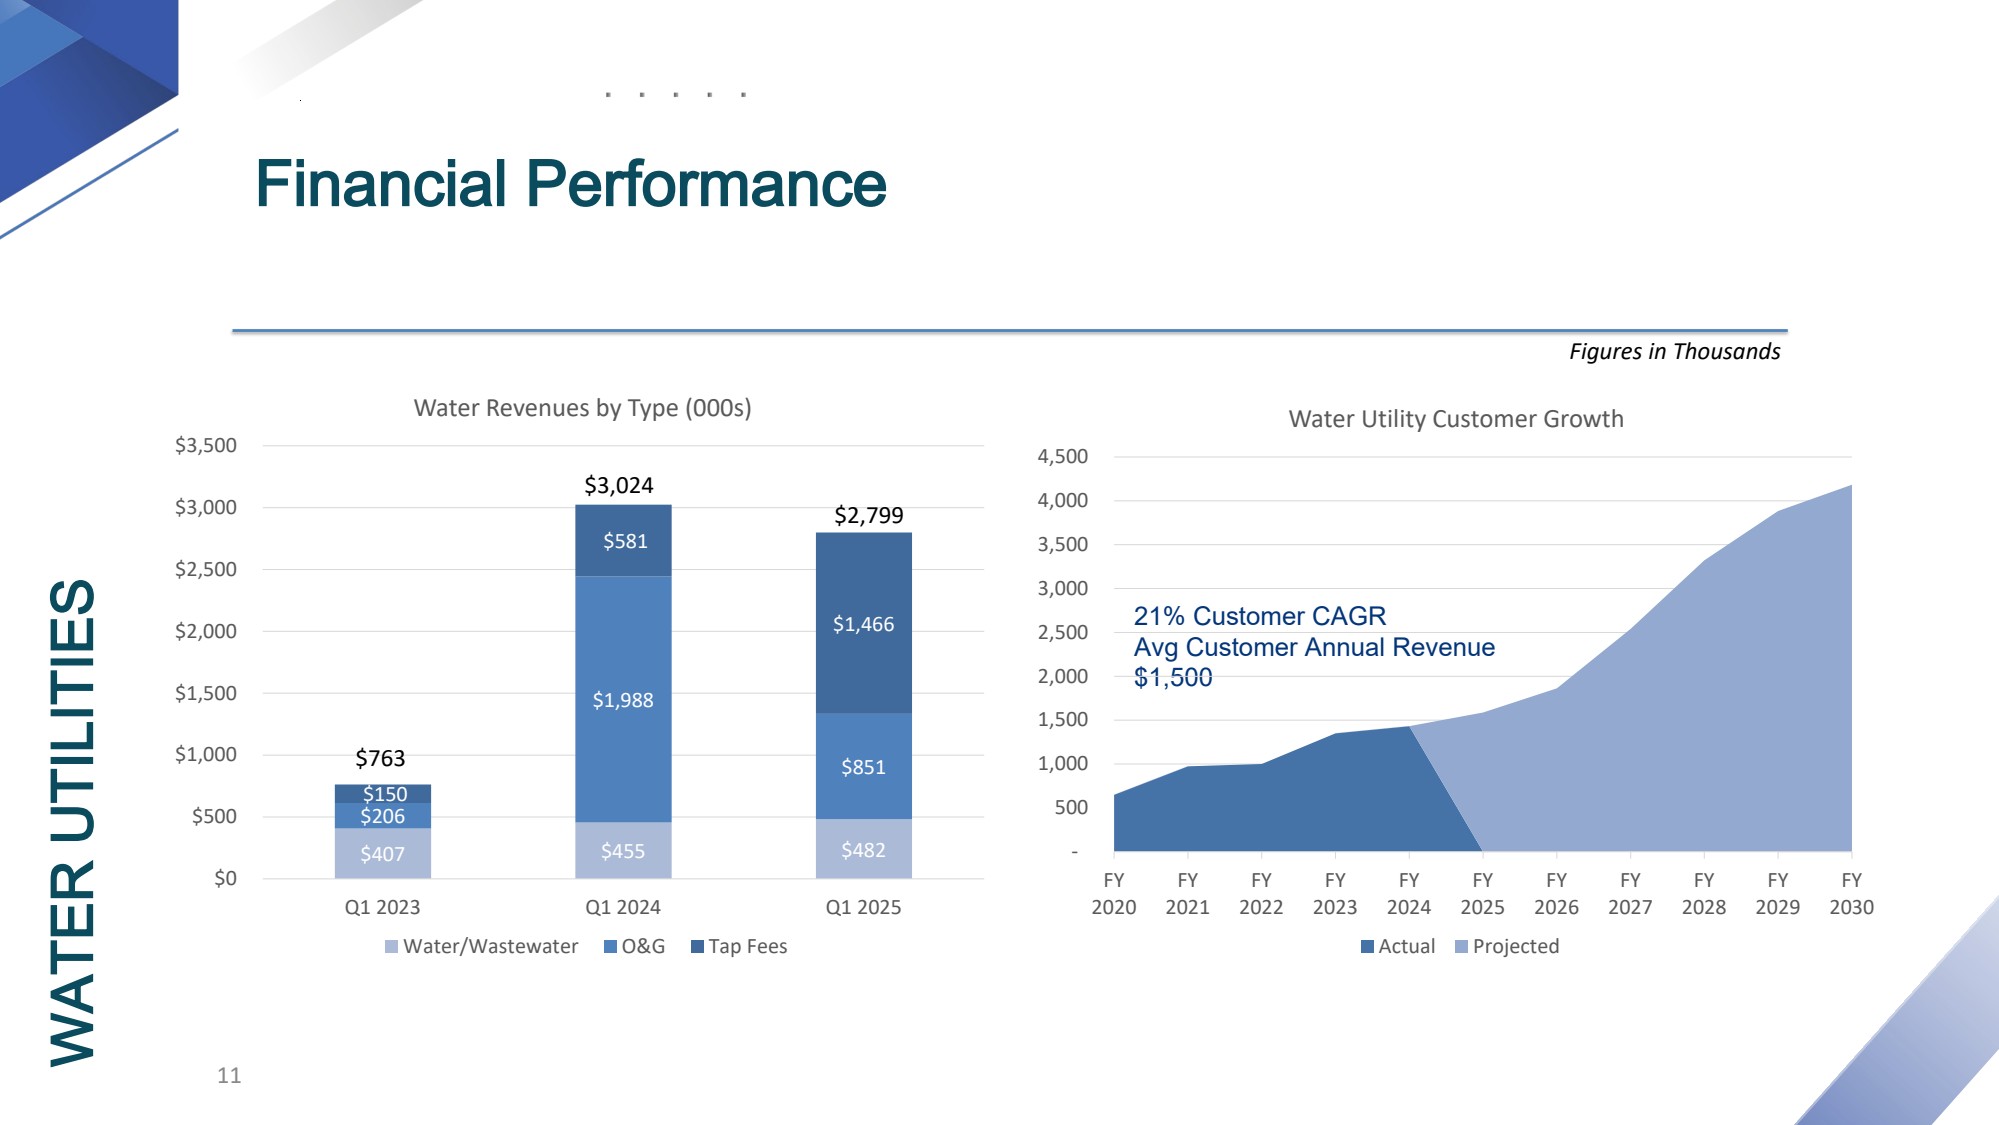
Financial Performance WATER UTILITIES 21% Customer CAGR Avg Customer Annual Revenue $1,500 $407 $455 $482 $206 $1,988 $851 $150 $581 $1,466 $0 $500 $1,000 $1,500 $2,000 $2,500 $3,000 $3,500 Q1 2023 Q1 2024 Q1 2025 Water Revenues by Type (000s) Water/Wastewater O&G Tap Fees - 500 1,000 1,500 2,000 2,500 3,000 3,500 4,000 4,500 FY 2020 FY 2021 FY 2022 FY 2023 FY 2024 FY 2025 FY 2026 FY 2027 FY 2028 FY 2029 FY 2030 Water Utility Customer Growth Actual Projected 11 $763 $3,024 $2,799 Figures in Thousands

GRAPHIC

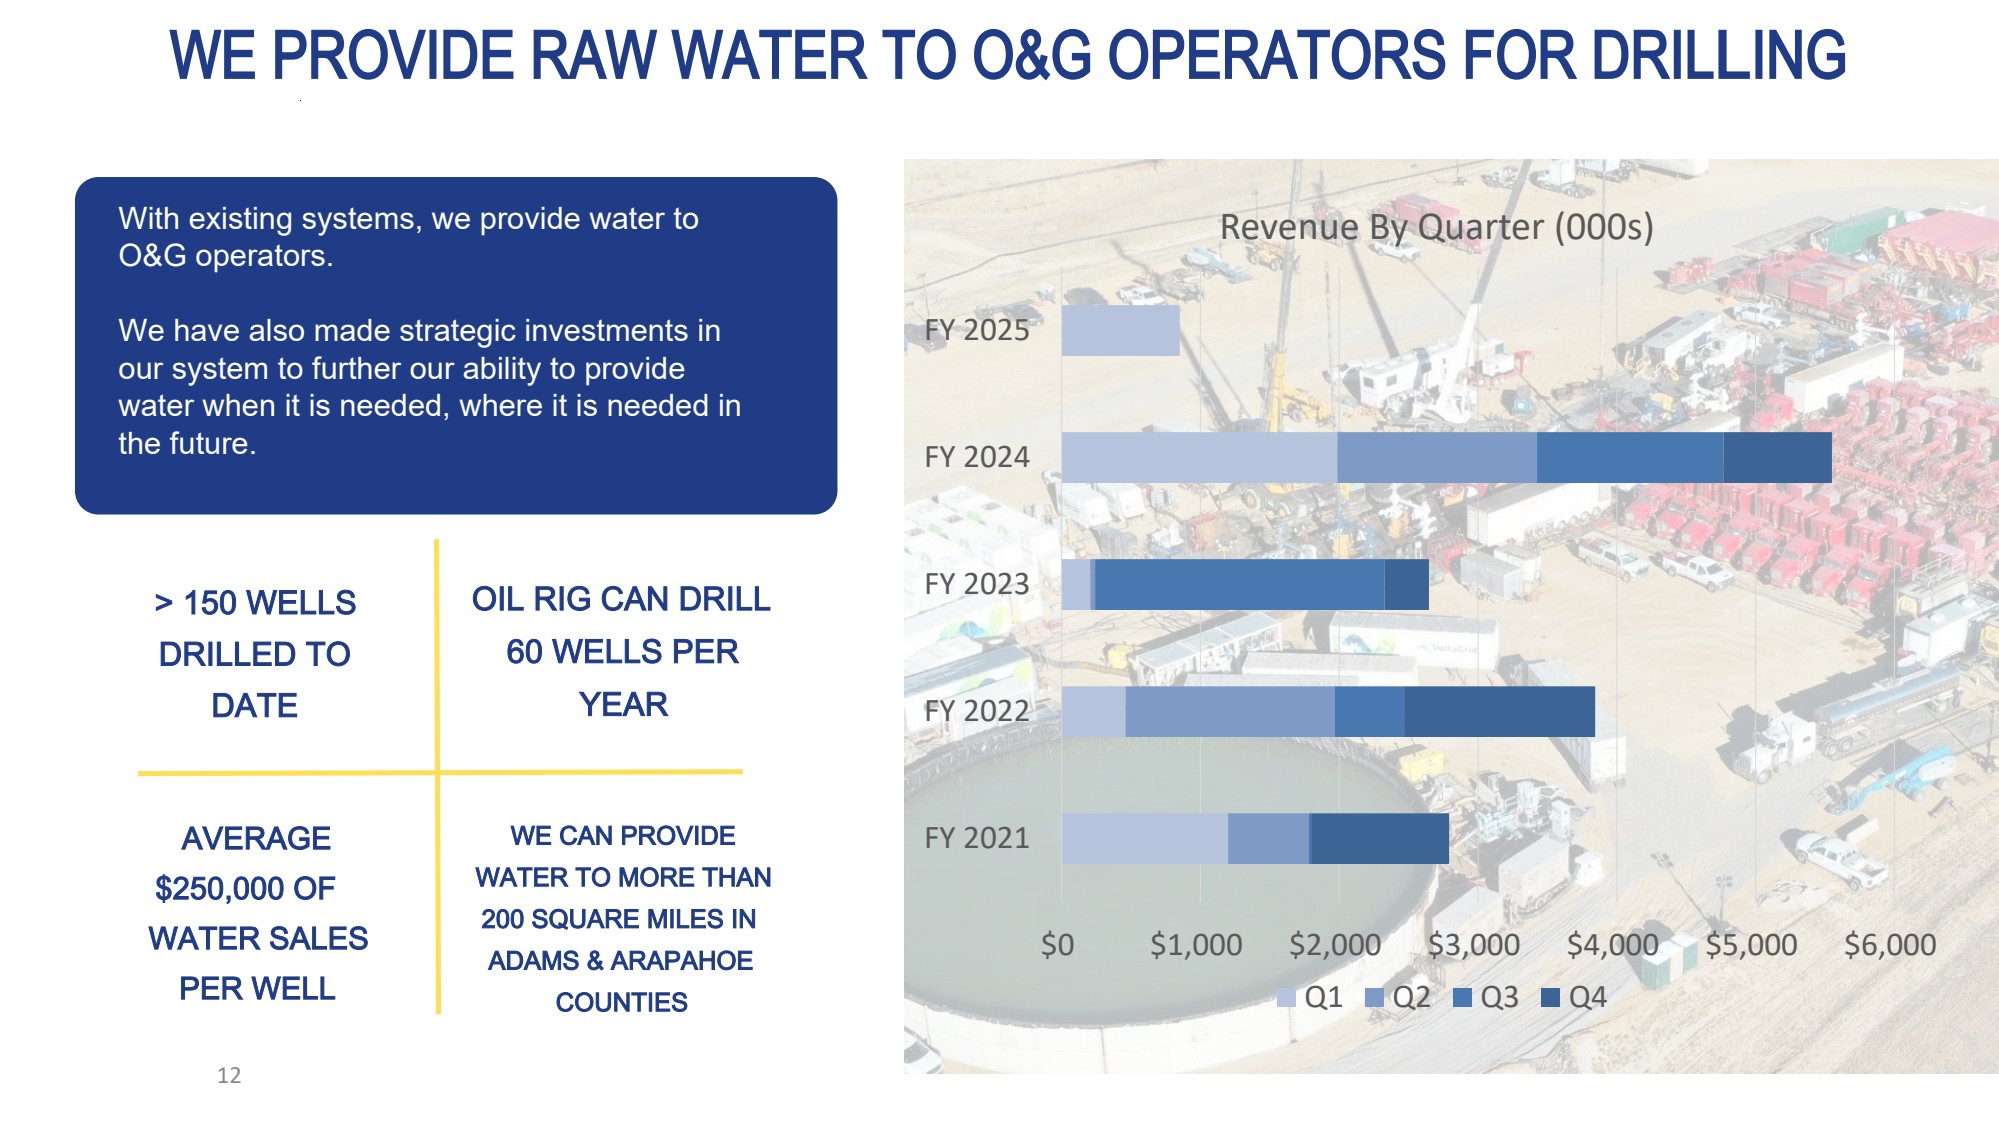
> 150 WELLS DRILLED TO DATE AVERAGE $250,000 OF WATER SALES PER WELL OIL RIG CAN DRILL 60 WELLS PER YEAR WE CAN PROVIDE WATER TO MORE THAN 200 SQUARE MILES IN ADAMS & ARAPAHOE COUNTIES With existing systems, we provide water to O&G operators. We have also made strategic investments in our system to further our ability to provide water when it is needed, where it is needed in the future. WE PROVIDE RAW WATER TO O&G OPERATORS FOR DRILLING $0 $1,000 $2,000 $3,000 $4,000 $5,000 $6,000 FY 2021 FY 2022 FY 2023 FY 2024 FY 2025 Revenue By Quarter (000s) Q1 Q2 Q3 Q4 12

GRAPHIC

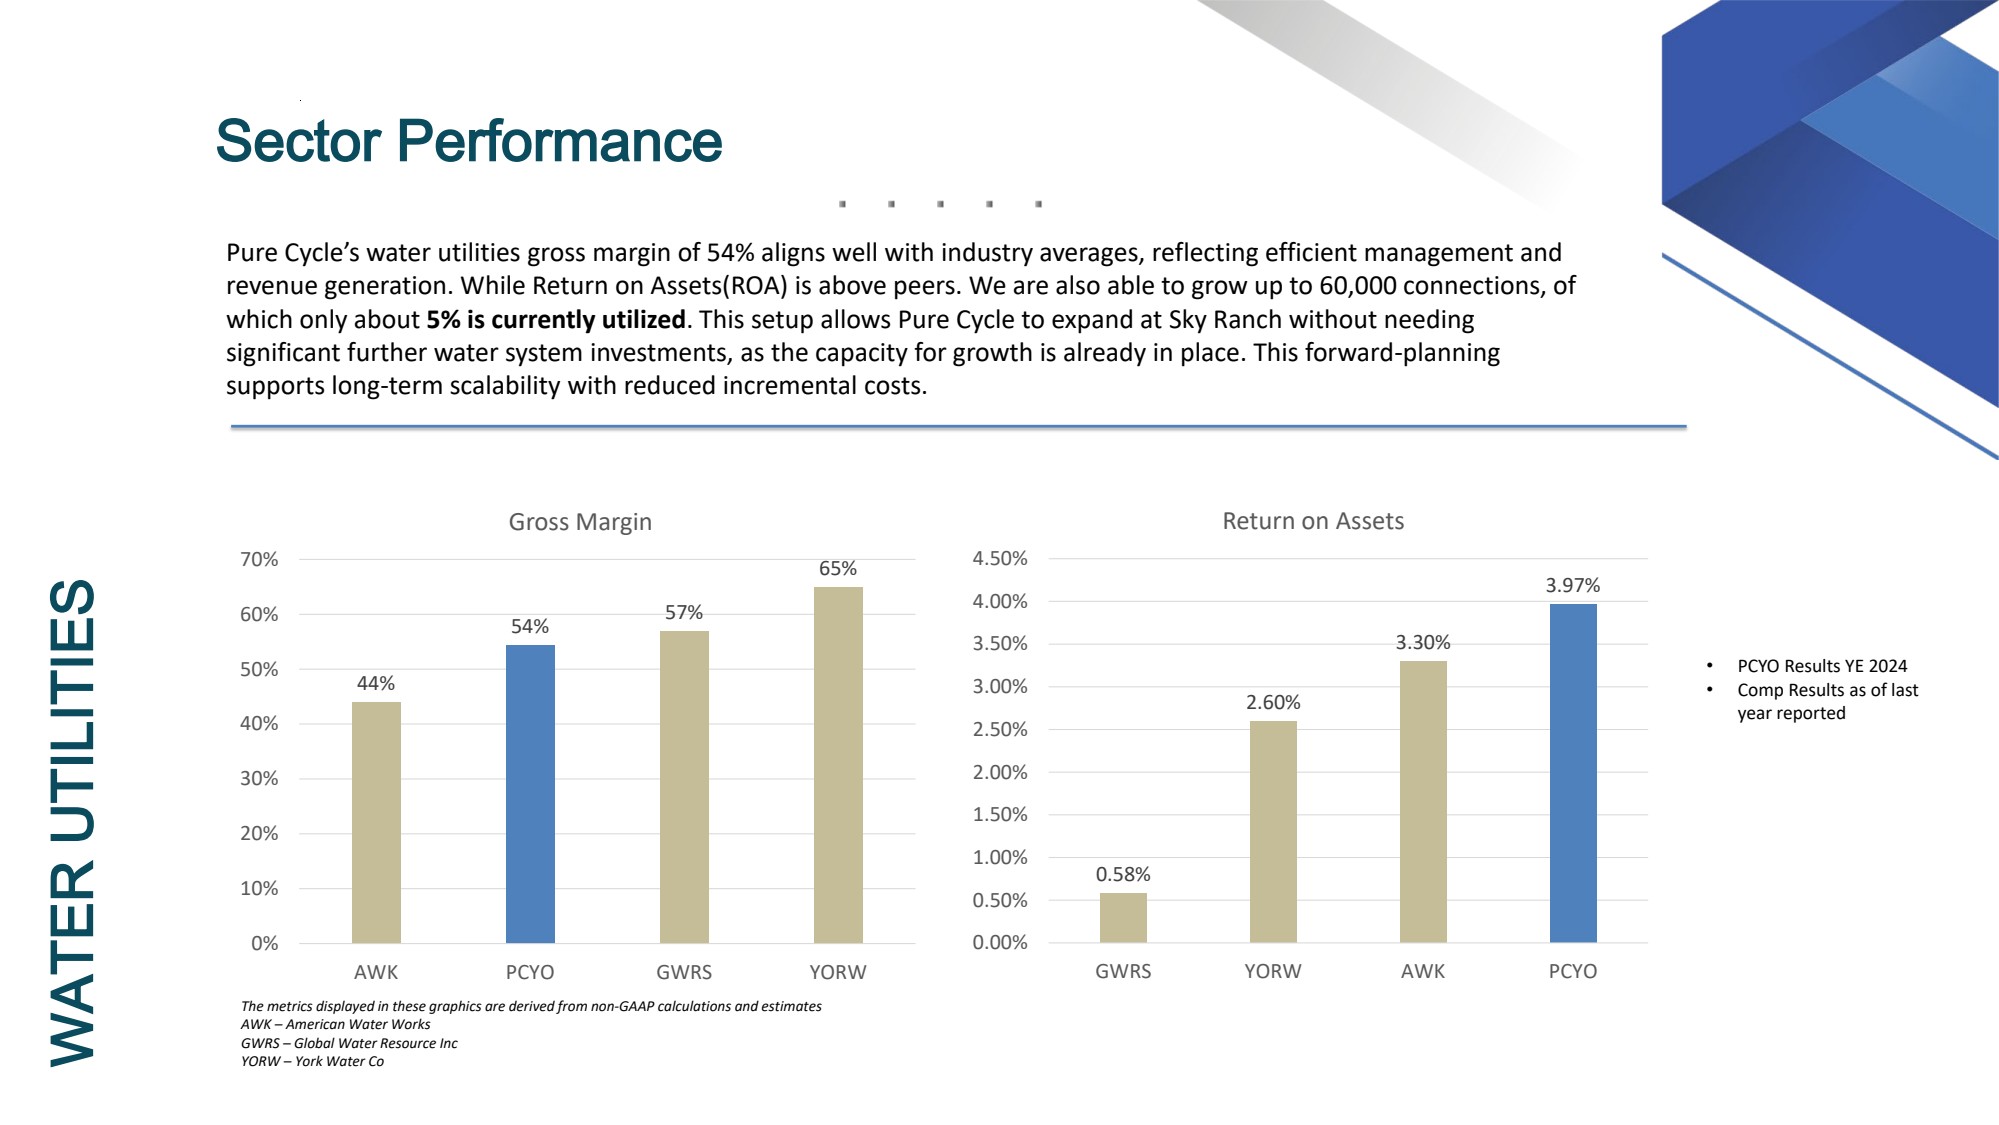
Sector Performance WATER UTILITIES Pure Cycle’s water utilities gross margin of 54% aligns well with industry averages, reflecting efficient management and revenue generation. While Return on Assets(ROA) is above peers. We are also able to grow up to 60,000 connections, of which only about 5% is currently utilized. This setup allows Pure Cycle to expand at Sky Ranch without needing significant further water system investments, as the capacity for growth is already in place. This forward-planning supports long-term scalability with reduced incremental costs. The metrics displayed in these graphics are derived from non-GAAP calculations and estimates AWK – American Water Works GWRS – Global Water Resource Inc YORW – York Water Co • PCYO Results YE 2024 • Comp Results as of last year reported 0.58% 2.60% 3.30% 3.97% 0.00% 0.50% 1.00% 1.50% 2.00% 2.50% 3.00% 3.50% 4.00% 4.50% GWRS YORW AWK PCYO Return on Assets 44% 54% 57% 65% 0% 10% 20% 30% 40% 50% 60% 70% AWK PCYO GWRS YORW Gross Margin

GRAPHIC

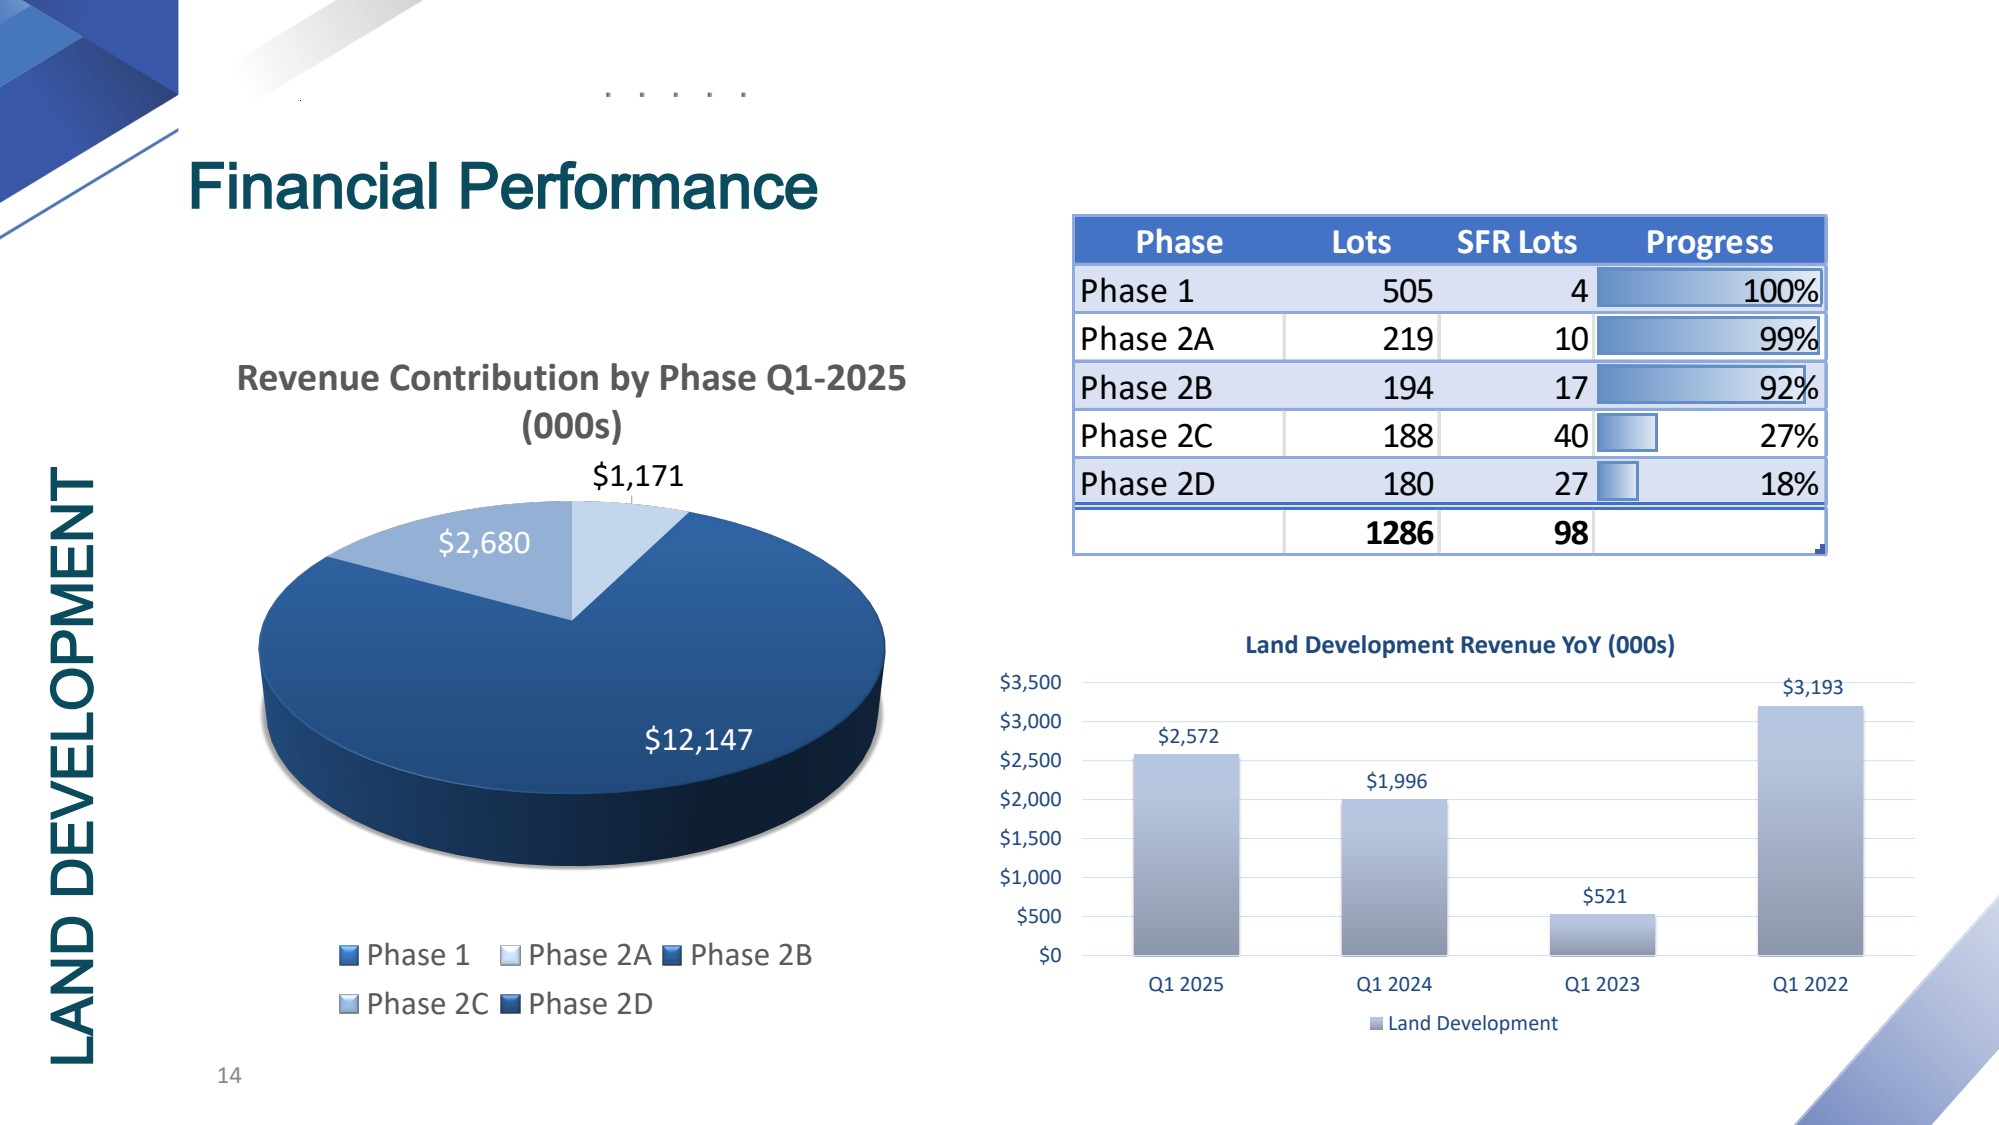
Financial Performance LAND DEVELOPMENT $1,171 $12,147 $2,680 Revenue Contribution by Phase Q1-2025 (000s) Phase 1 Phase 2A Phase 2B Phase 2C Phase 2D $2,572 $1,996 $521 $3,193 $0 $500 $1,000 $1,500 $2,000 $2,500 $3,000 $3,500 Q1 2025 Q1 2024 Q1 2023 Q1 2022 Land Development Revenue YoY (000s) Land Development 14 Phase Lots SFR Lots Progress Phase 1 505 4 100% Phase 2A 219 10 99% Phase 2B 194 17 92% Phase 2C 188 40 27% Phase 2D 180 27 18% 1286 98

GRAPHIC

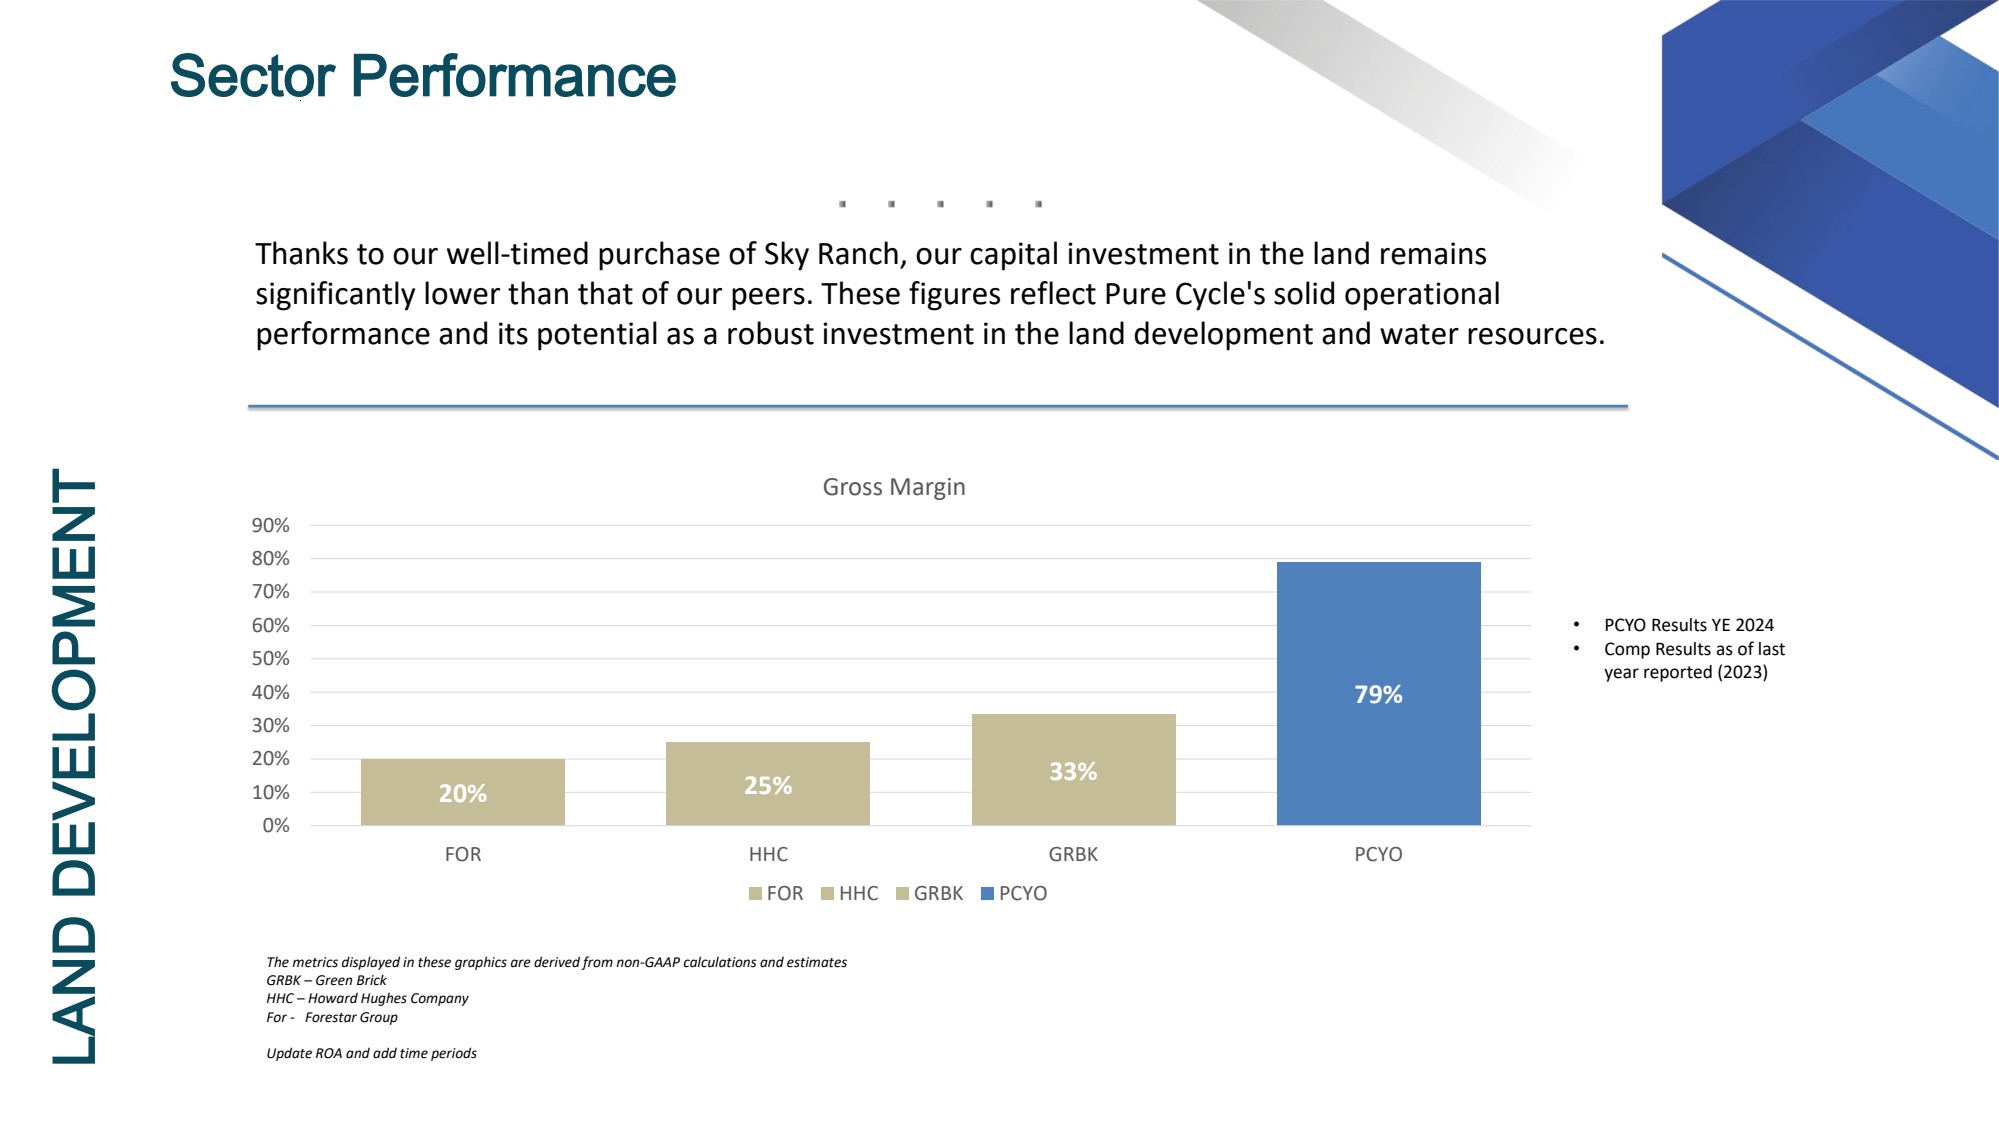
Sector Performance LAND DEVELOPMENT Thanks to our well-timed purchase of Sky Ranch, our capital investment in the land remains significantly lower than that of our peers. These figures reflect Pure Cycle's solid operational performance and its potential as a robust investment in the land development and water resources. The metrics displayed in these graphics are derived from non-GAAP calculations and estimates GRBK – Green Brick HHC – Howard Hughes Company For - Forestar Group Update ROA and add time periods • PCYO Results YE 2024 • Comp Results as of last year reported (2023) 20% 25% 33% 79% 0% 10% 20% 30% 40% 50% 60% 70% 80% 90% FOR HHC GRBK PCYO Gross Margin FOR HHC GRBK PCYO

GRAPHIC

Financial Performance SINGLE FAMILY RENTALS QUARTERLY RENT REVENUE $ 12 4 k COMPLETED HOMES 14 GROSS MARGIN 64% $- $2,000 $4,000 $6,000 $8,000 FY 2022 FY 2023 FY 2024 Appreciating Assets Book Assets FMV 16 $124 $109 $25 $8 $- $50 $100 $150 Q1 2022 Q1 2023 Q1 2024 Q1 2025 Single-family rentals Single-family rentals

GRAPHIC

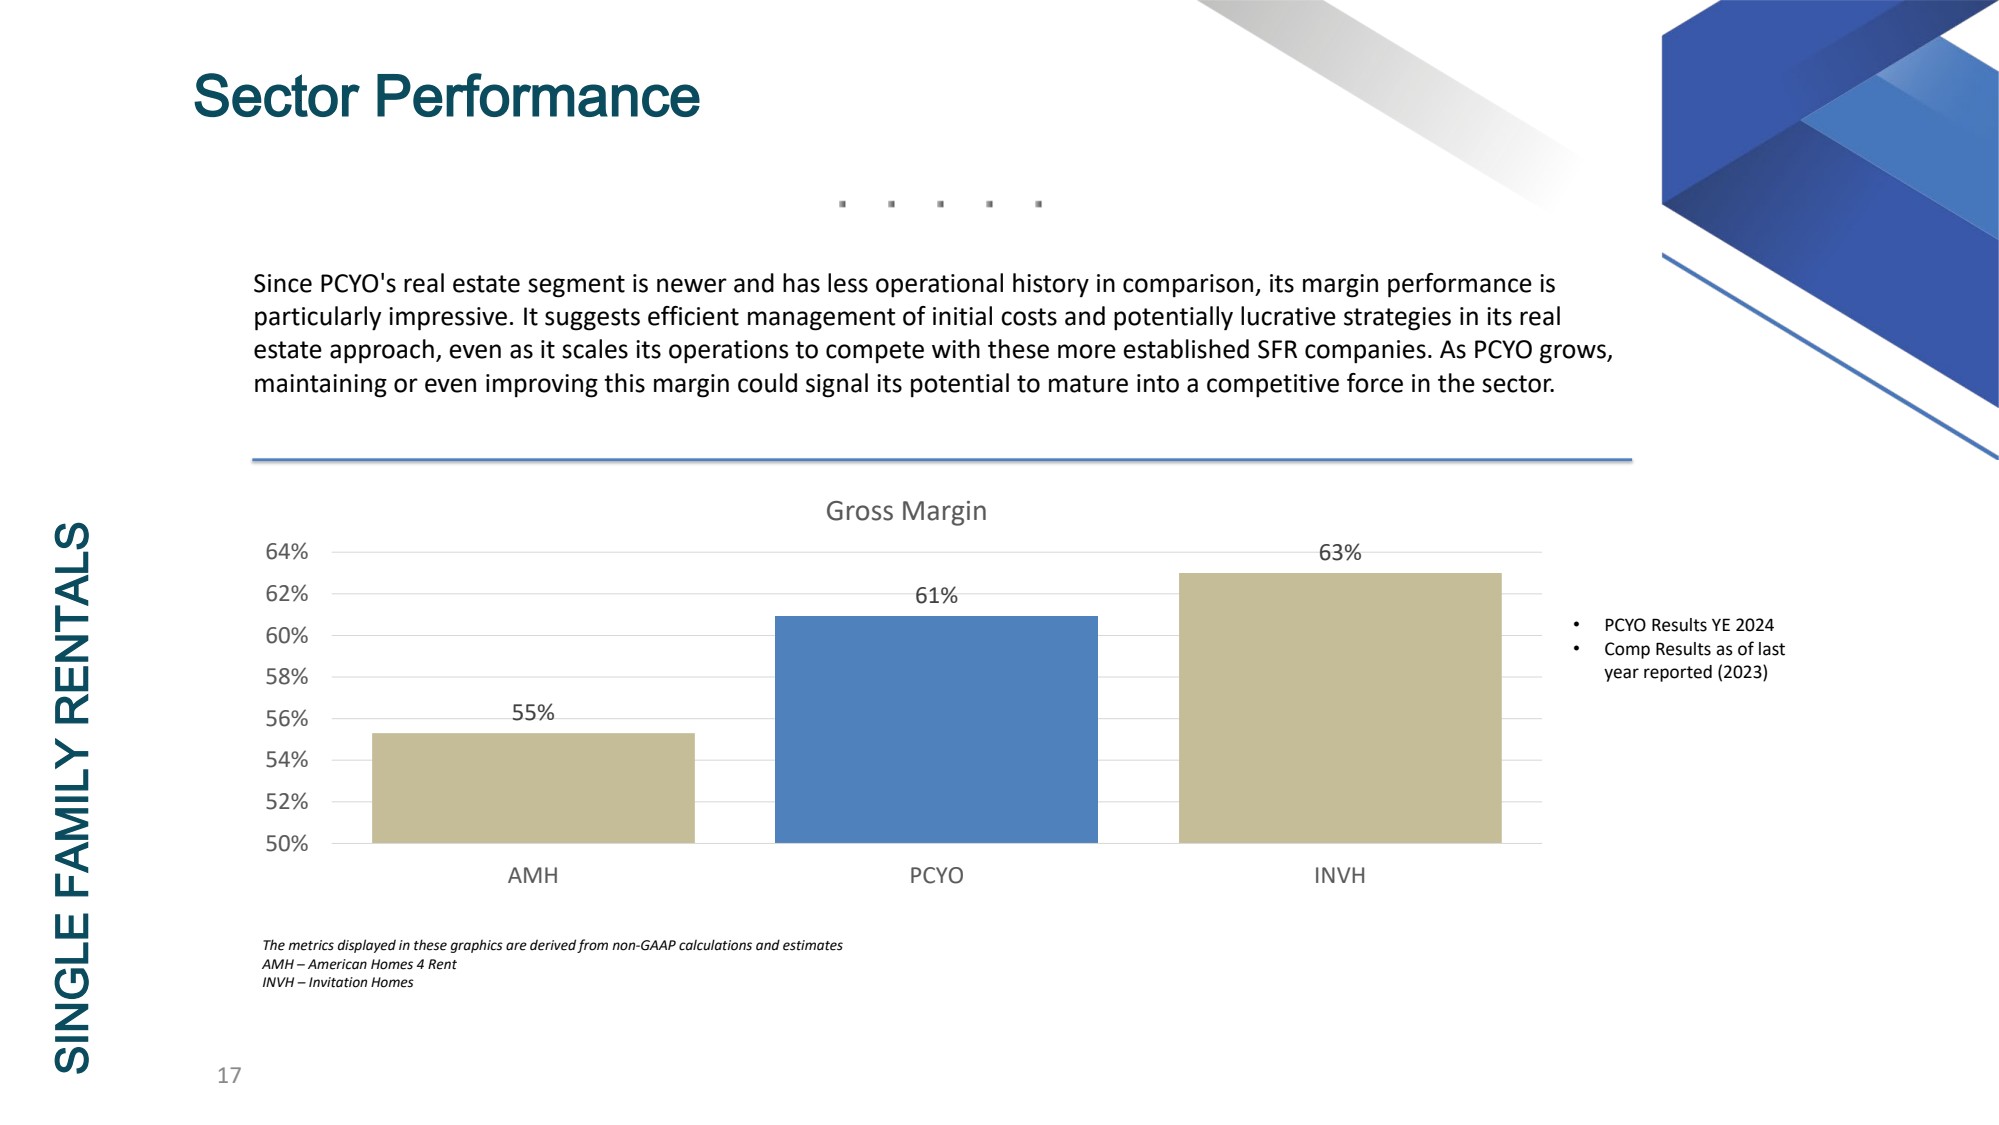
Sector Performance SINGLE FAMILY RENTALS Since PCYO's real estate segment is newer and has less operational history in comparison, its margin performance is particularly impressive. It suggests efficient management of initial costs and potentially lucrative strategies in its real estate approach, even as it scales its operations to compete with these more established SFR companies. As PCYO grows, maintaining or even improving this margin could signal its potential to mature into a competitive force in the sector. The metrics displayed in these graphics are derived from non-GAAP calculations and estimates AMH – American Homes 4 Rent INVH – Invitation Homes • PCYO Results YE 2024 • Comp Results as of last year reported (2023) 17 55% 61% 63% 50% 52% 54% 56% 58% 60% 62% 64% AMH PCYO INVH Gross Margin

GRAPHIC

ER OVERVIEW LA PURE CYCLE CORPORATION 18

GRAPHIC

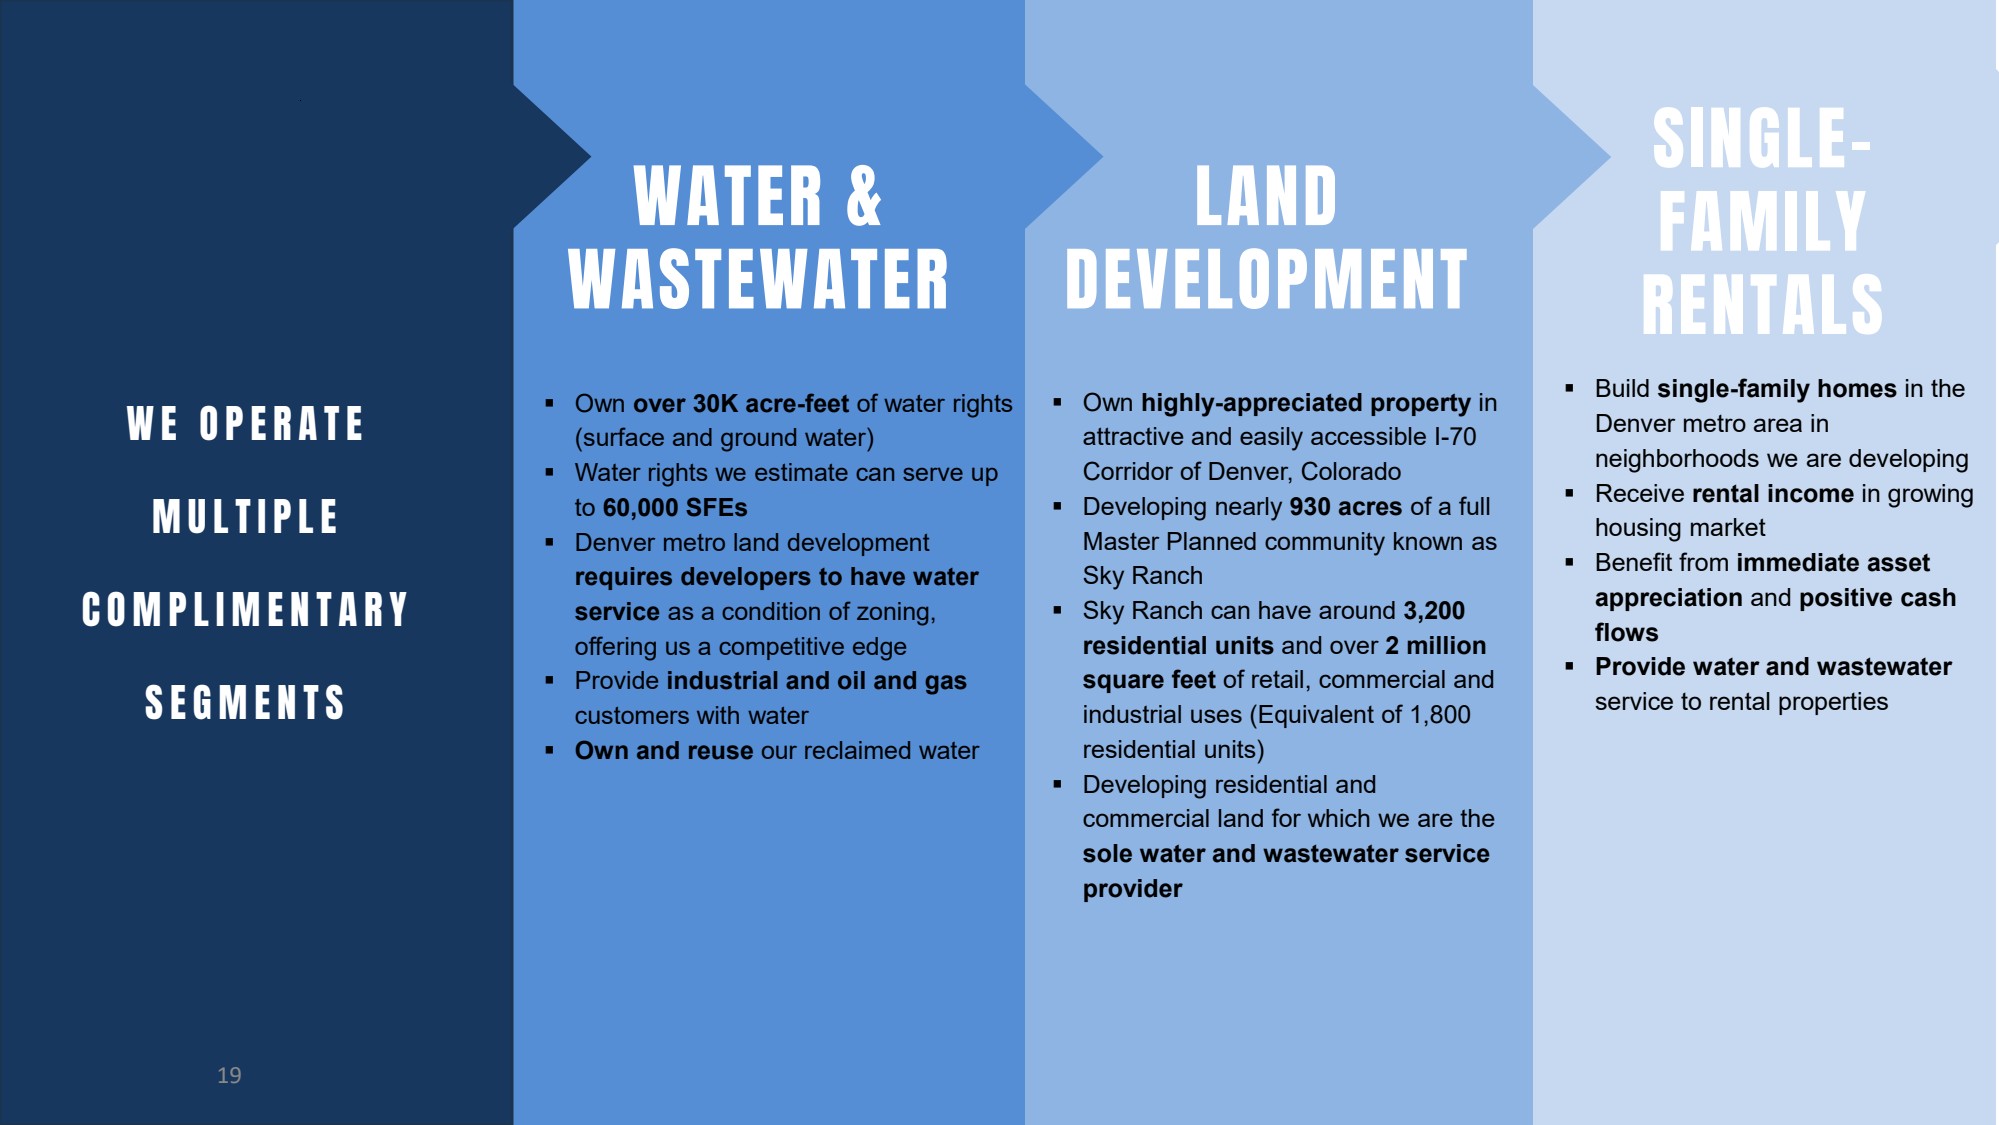
 Build single-family homes in the Denver metro area in neighborhoods we are developing  Receive rental income in growing housing market  Benefit from immediate asset appreciation and positive cash flows  Provide water and wastewater service to rental properties SINGLE-FAMILY RENTALS  Own highly-appreciated property in attractive and easily accessible I-70 Corridor of Denver, Colorado  Developing nearly 930 acres of a full Master Planned community known as Sky Ranch  Sky Ranch can have around 3,200 residential units and over 2 million square feet of retail, commercial and industrial uses (Equivalent of 1,800 residential units)  Developing residential and commercial land for which we are the sole water and wastewater service provider LAND DEVELOPMENT  Own over 30K acre-feet of water rights (surface and ground water)  Water rights we estimate can serve up to 60,000 SFEs  Denver metro land development requires developers to have water service as a condition of zoning, offering us a competitive edge  Provide industrial and oil and gas customers with water  Own and reuse our reclaimed water WATER & WASTEWATER WE OPERATE MULTIPLE COMPLIMENTAR Y S EGMENTS 19

GRAPHIC

EW WATER LA PURE CYCLE CORPORATION 20

GRAPHIC

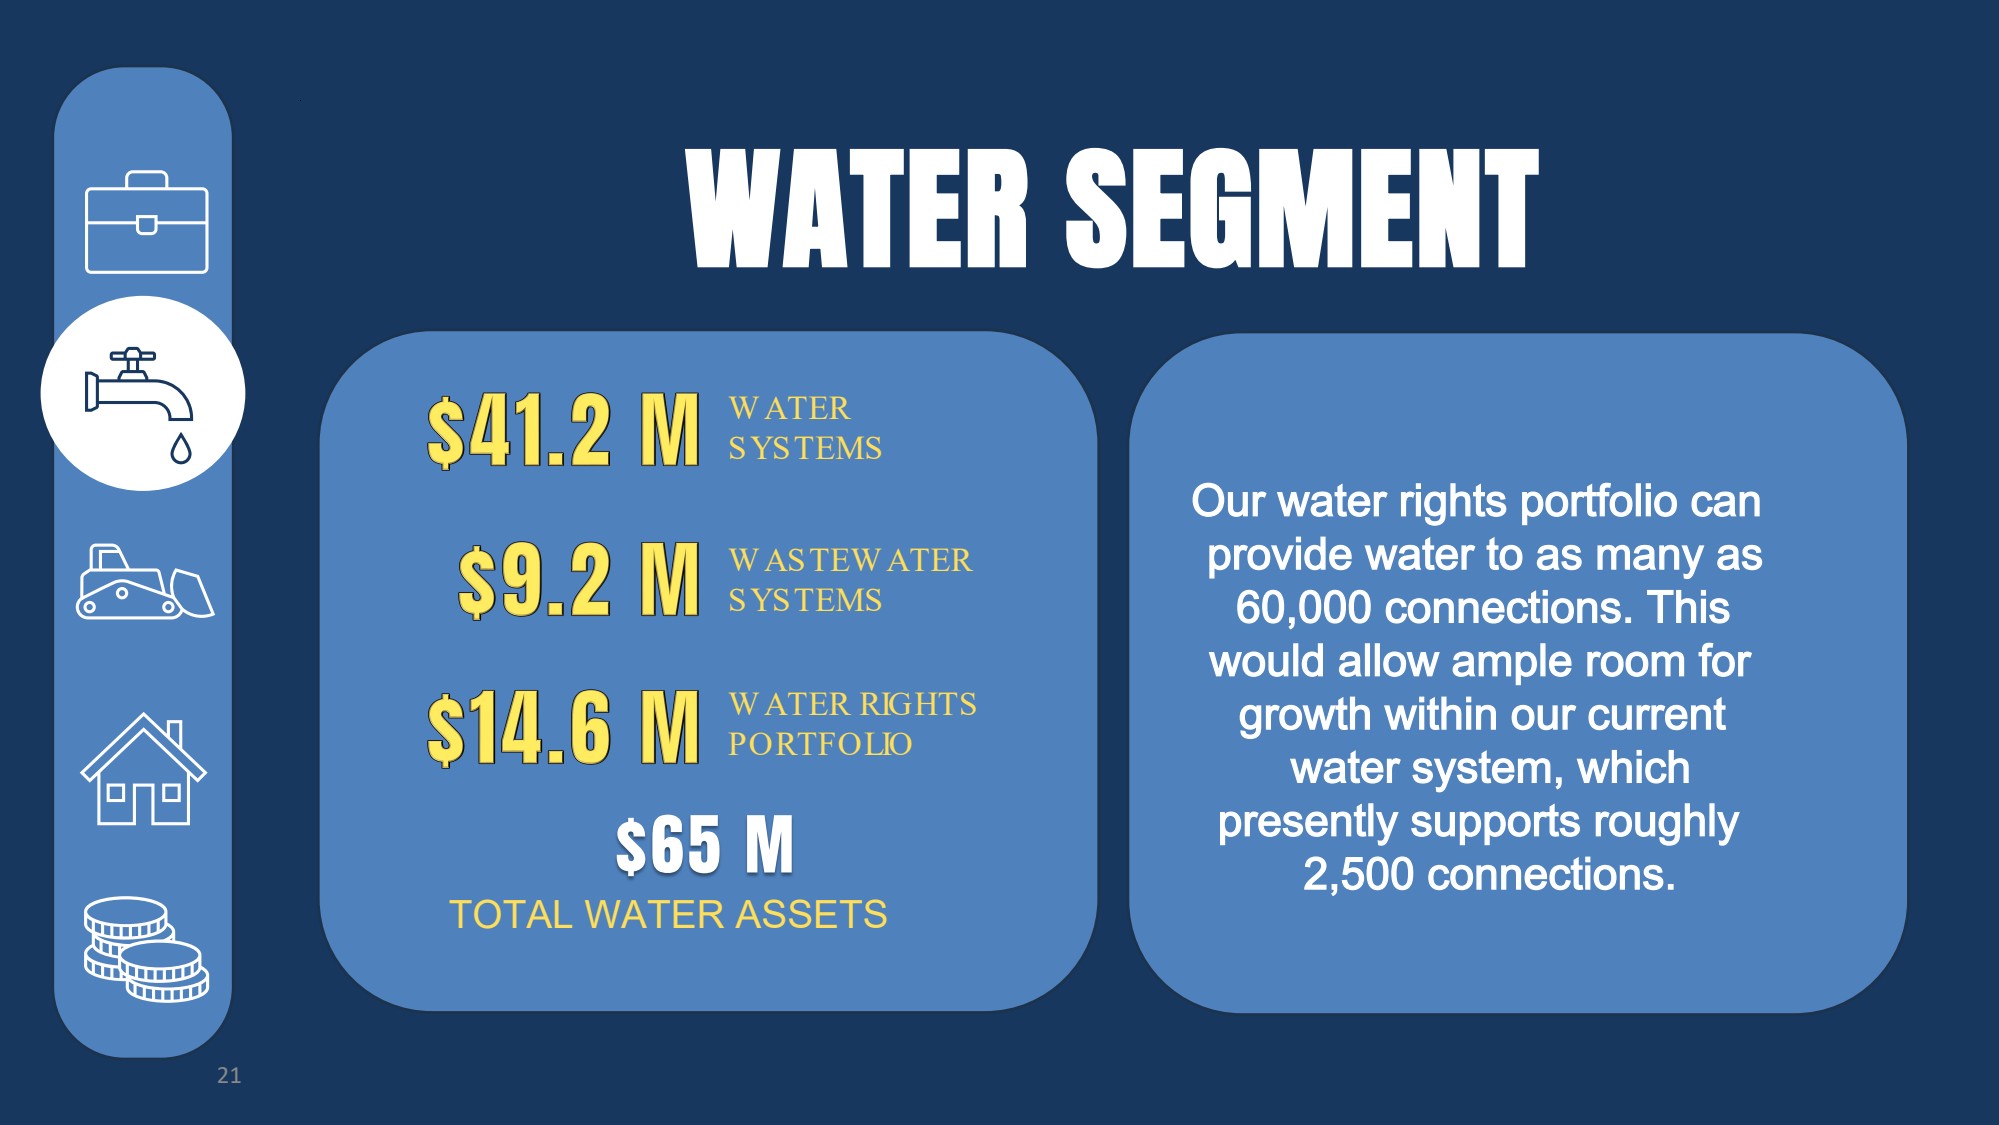
WATER SEGMENT $65 M TOTAL WATER ASSETS Our water rights portfolio can provide water to as many as 60,000 connections. This would allow ample room for growth within our current water system, which presently supports roughly 2,500 connections. W ATER SYSTEMS W ASTEW ATER SYSTEMS W ATER RIGHTS PORTFOLIO 21

GRAPHIC

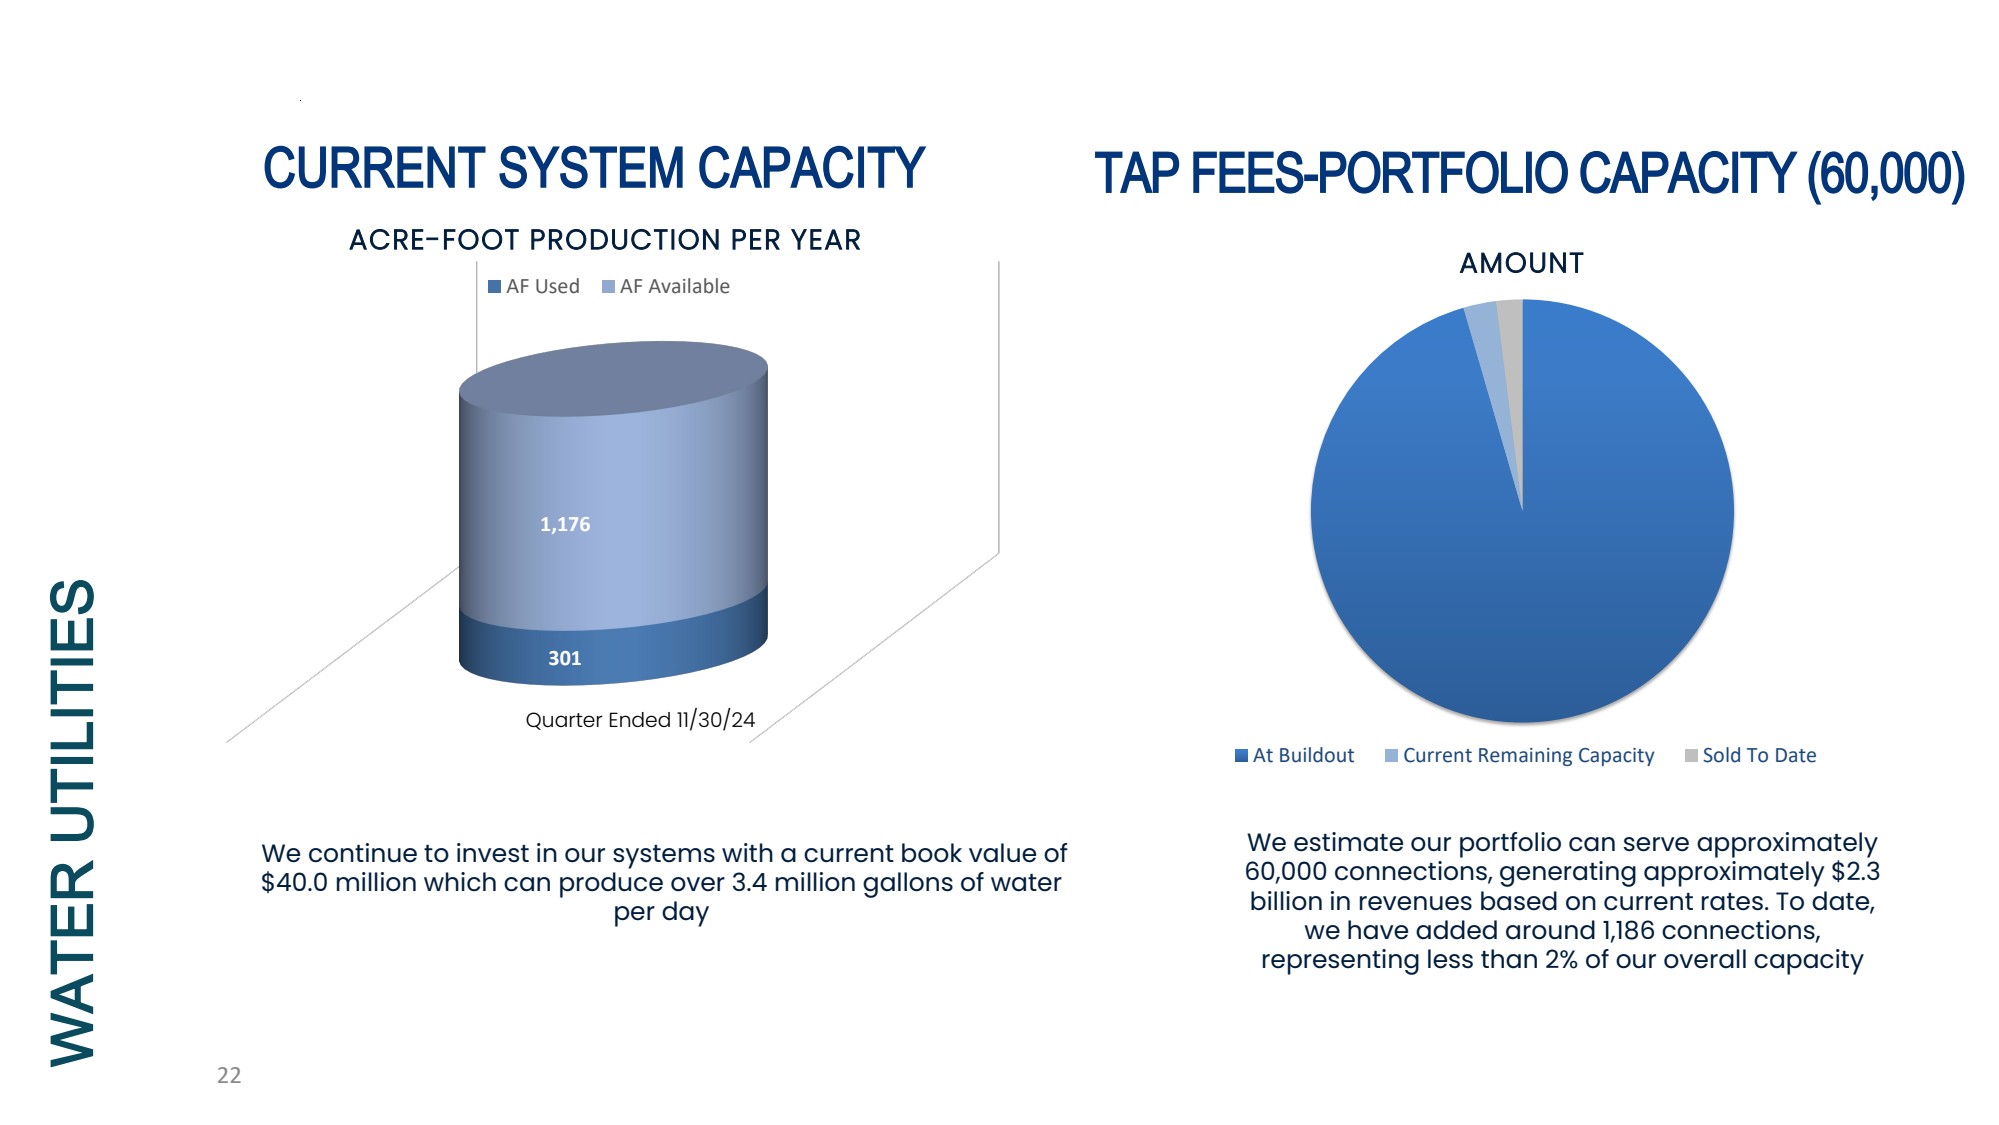
WATER UTILITIES We continue to invest in our systems with a current book value of $40.0 million which can produce over 3.4 million gallons of water per day Quarter Ended 11/30/24 We estimate our portfolio can serve approximately 60,000 connections, generating approximately $2.3 billion in revenues based on current rates. To date, we have added around 1,186 connections, representing less than 2% of our overall capacity CURRENT SYSTEM CAPACITY TAP FEES-PORTFOLIO CAPACITY (60,000) AMOUNT At Buildout Current Remaining Capacity Sold To Date 301 1,176 ACRE-FOOT PRODUCTION PER YEAR AF Used AF Available 22

GRAPHIC

R LAND DEV RE PURE CYCLE CORPORATION 23

GRAPHIC

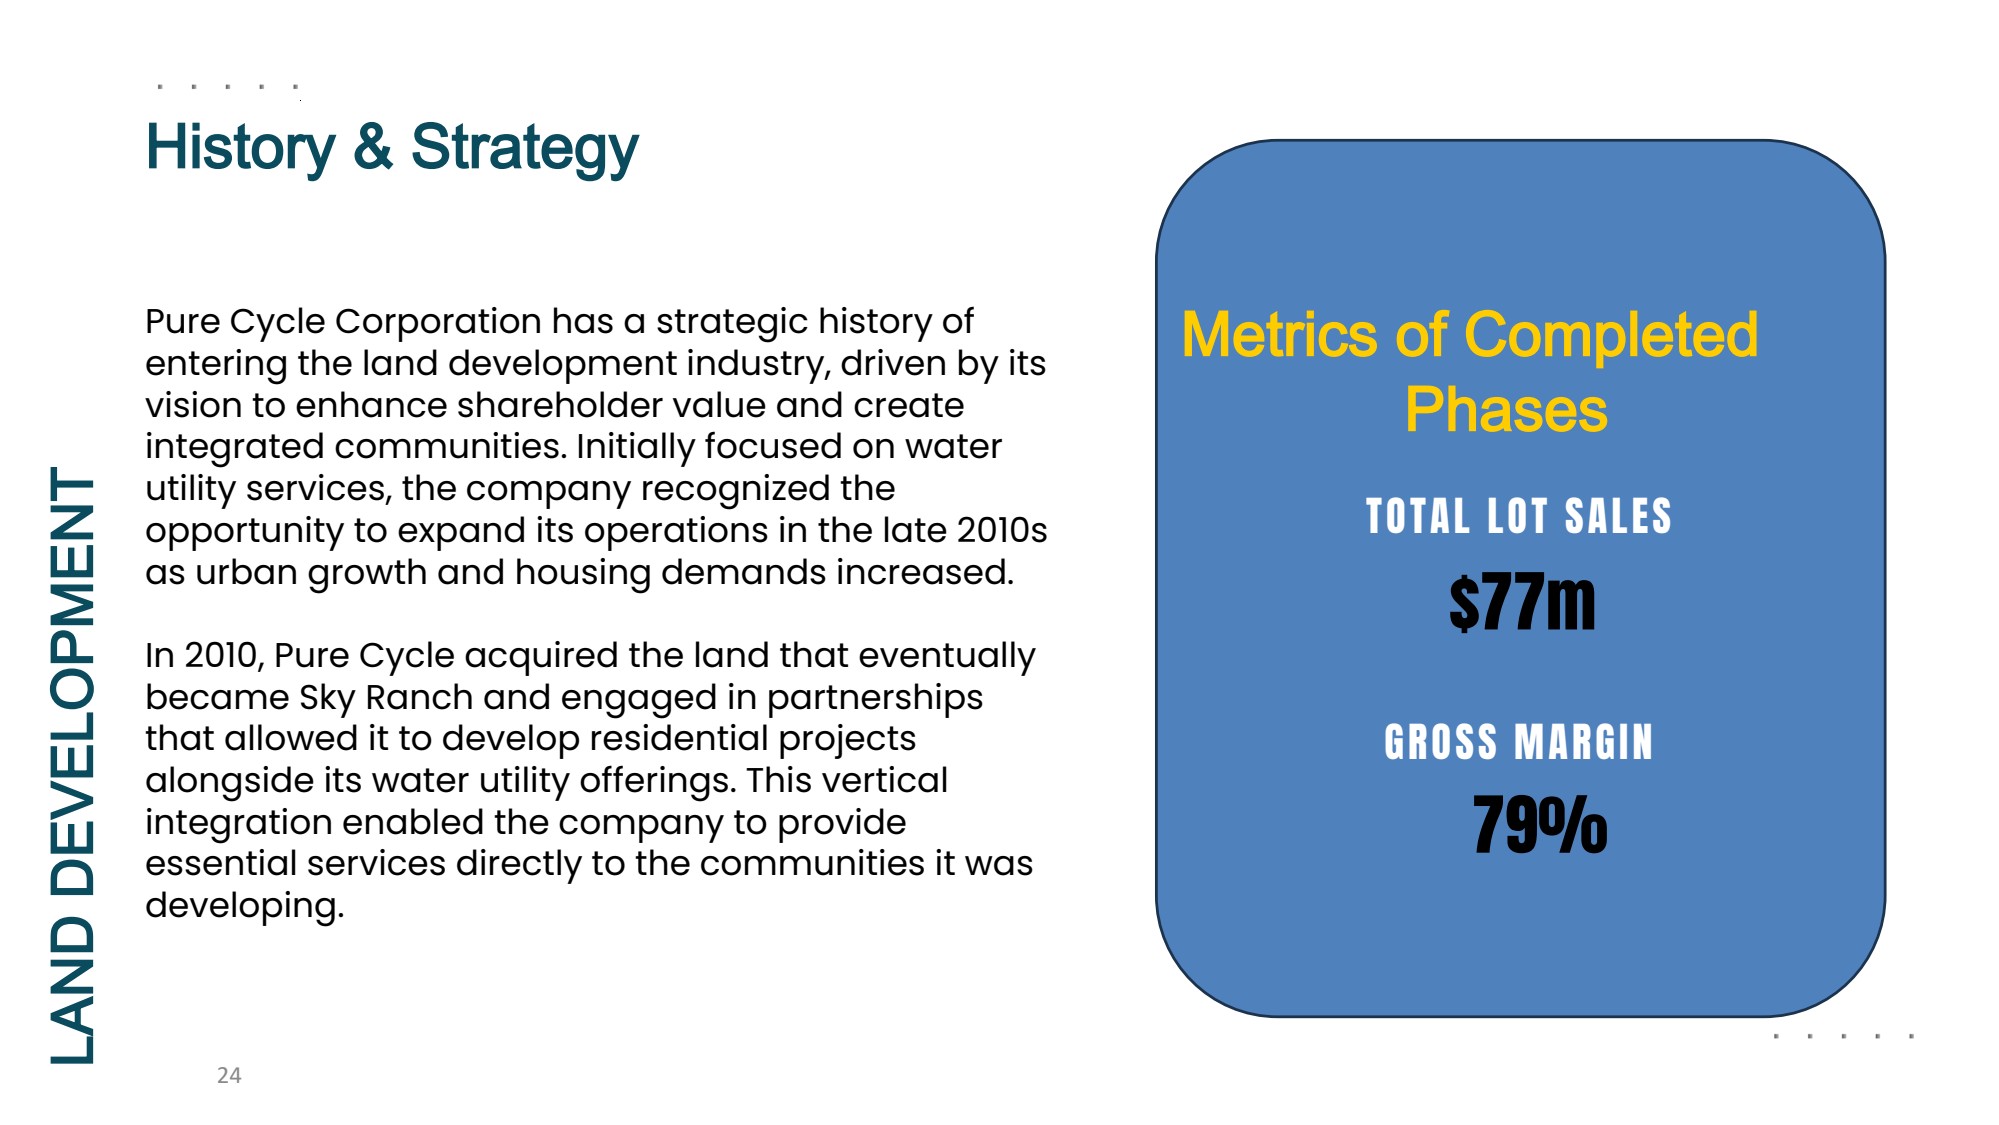
History & Strategy Pure Cycle Corporation has a strategic history of entering the land development industry, driven by its vision to enhance shareholder value and create integrated communities. Initially focused on water utility services, the company recognized the opportunity to expand its operations in the late 2010s as urban growth and housing demands increased. In 2010, Pure Cycle acquired the land that eventually became Sky Ranch and engaged in partnerships that allowed it to develop residential projects alongside its water utility offerings. This vertical integration enabled the company to provide essential services directly to the communities it was developing. Metrics of Completed Phases LAND DEVELOPMENT TOTAL LOT SALES $77m GROSS MARGIN 79% 24

GRAPHIC

2A Land development is substantially complete. Out of 229 homes, 215 are finished and occupied. PHASE 2A 229 Lots 2B All paving is complete, and homebuilders have begun construction on homes. Land development is estimated to be completed by summer of 2025. PHASE 2B 211 Lots 2C Grading is finished, and utility work has begun. Land development is scheduled to be completed by the end of fiscal year 2025. PHASE 2C 228 Lots 2D Grading has begun and lots are expected to be available fall of 2025. PHASE 2D 218 Lots LAND DEVELOPMENT 25

GRAPHIC

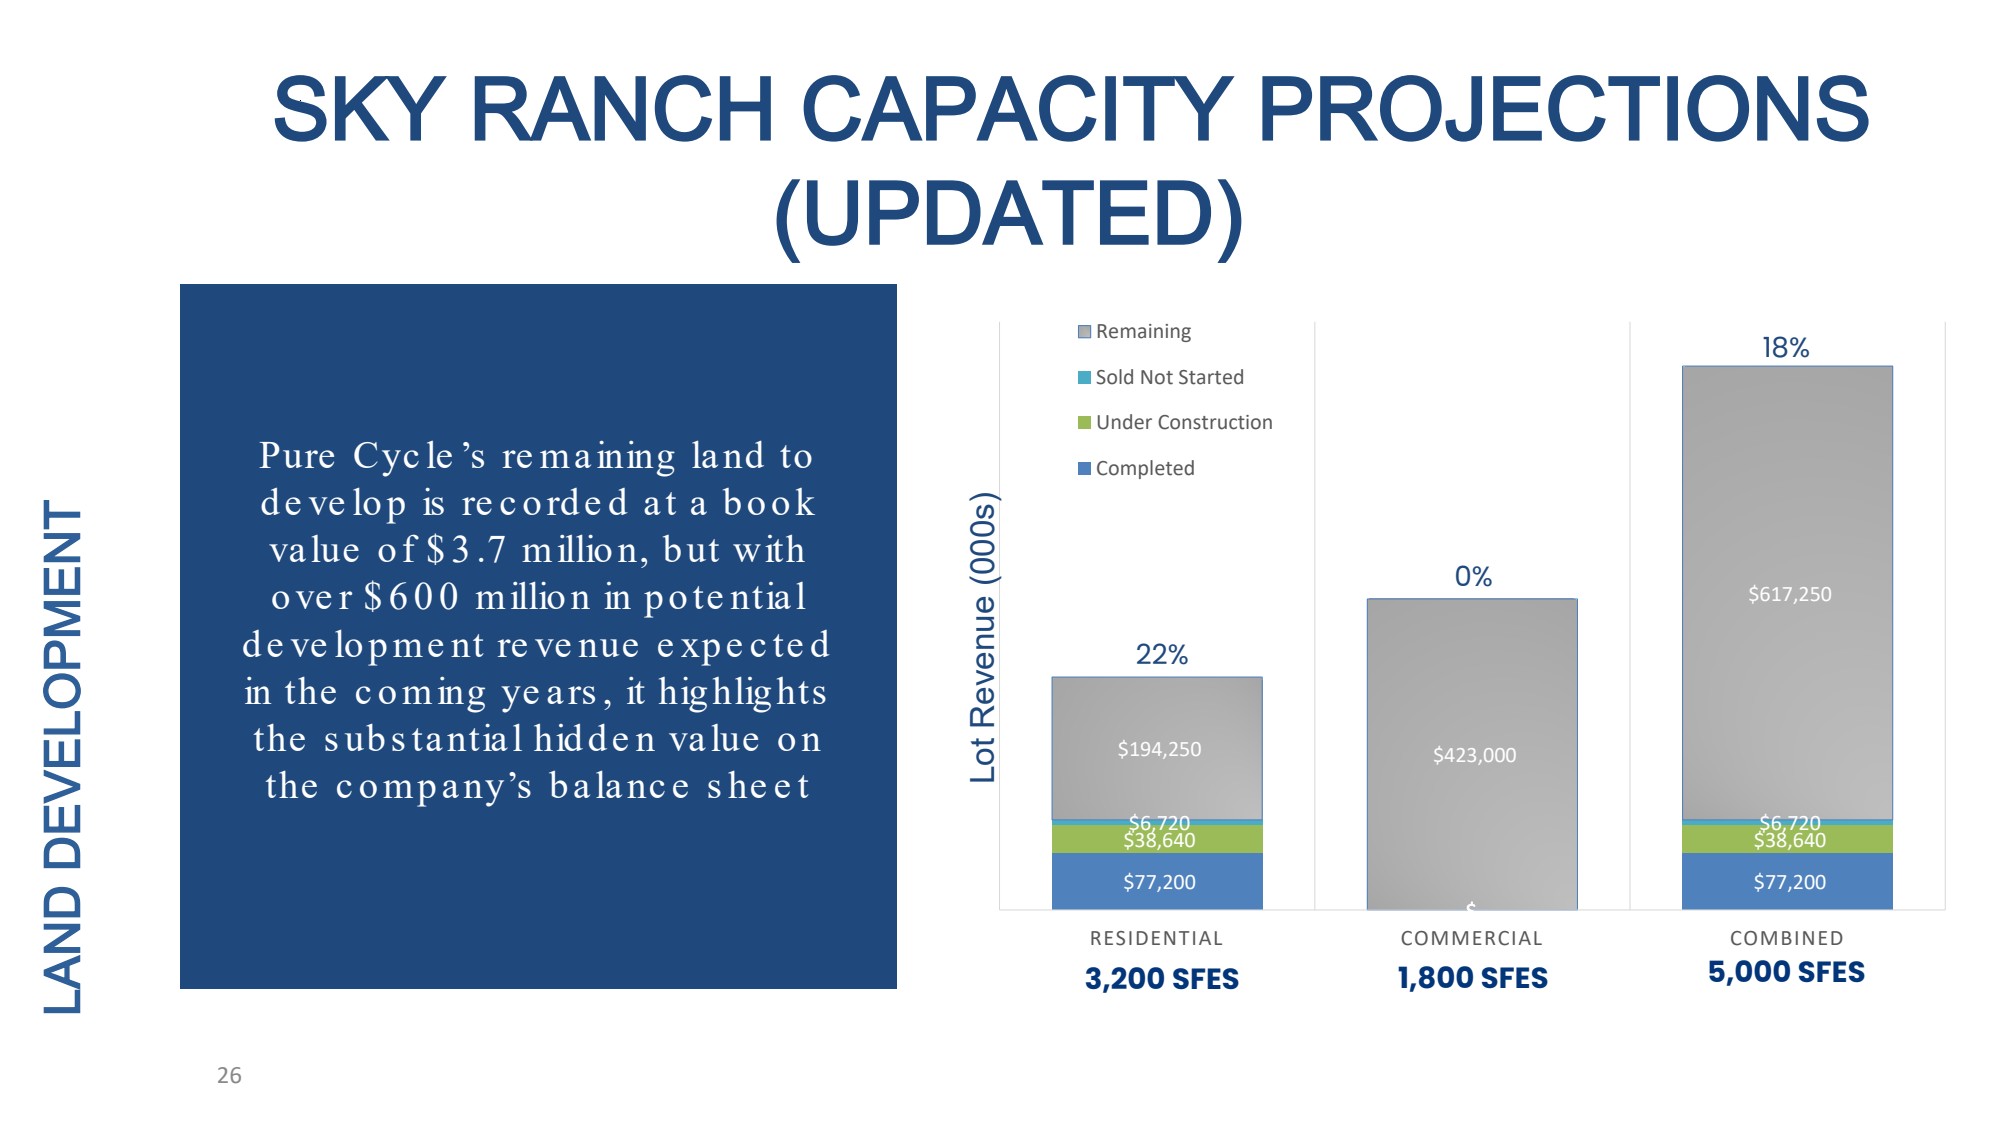
$77,200 $- $77,200 $38,640 $38,640 $6,720 $6,720 $194,250 $423,000 $617,250 RESIDENTIAL COMMERCIAL COMBINED Remaining Sold Not Started Under Construction Completed LAND DEVELOPMENT SKY RANCH CAPACITY PROJECTIONS (UPDATED) Lot Revenue (000s) 3,200 SFES 1,800 SFES 5,000 SFES Pure Cyc le ’s re maining land to de ve lo p is re c o rde d at a bo o k value o f $ 3 .7 millio n, but with o ve r $ 6 0 0 millio n in po te ntial de ve lo pme nt re ve nue e xpe c te d in the c o ming ye ars , it highlights the s ubs tantial hidde n value o n the c o mpany’s balanc e s he e t 22% 0% 18% 26

GRAPHIC

EV RENTALS FIN PURE CYCLE CORPORATION 27

GRAPHIC

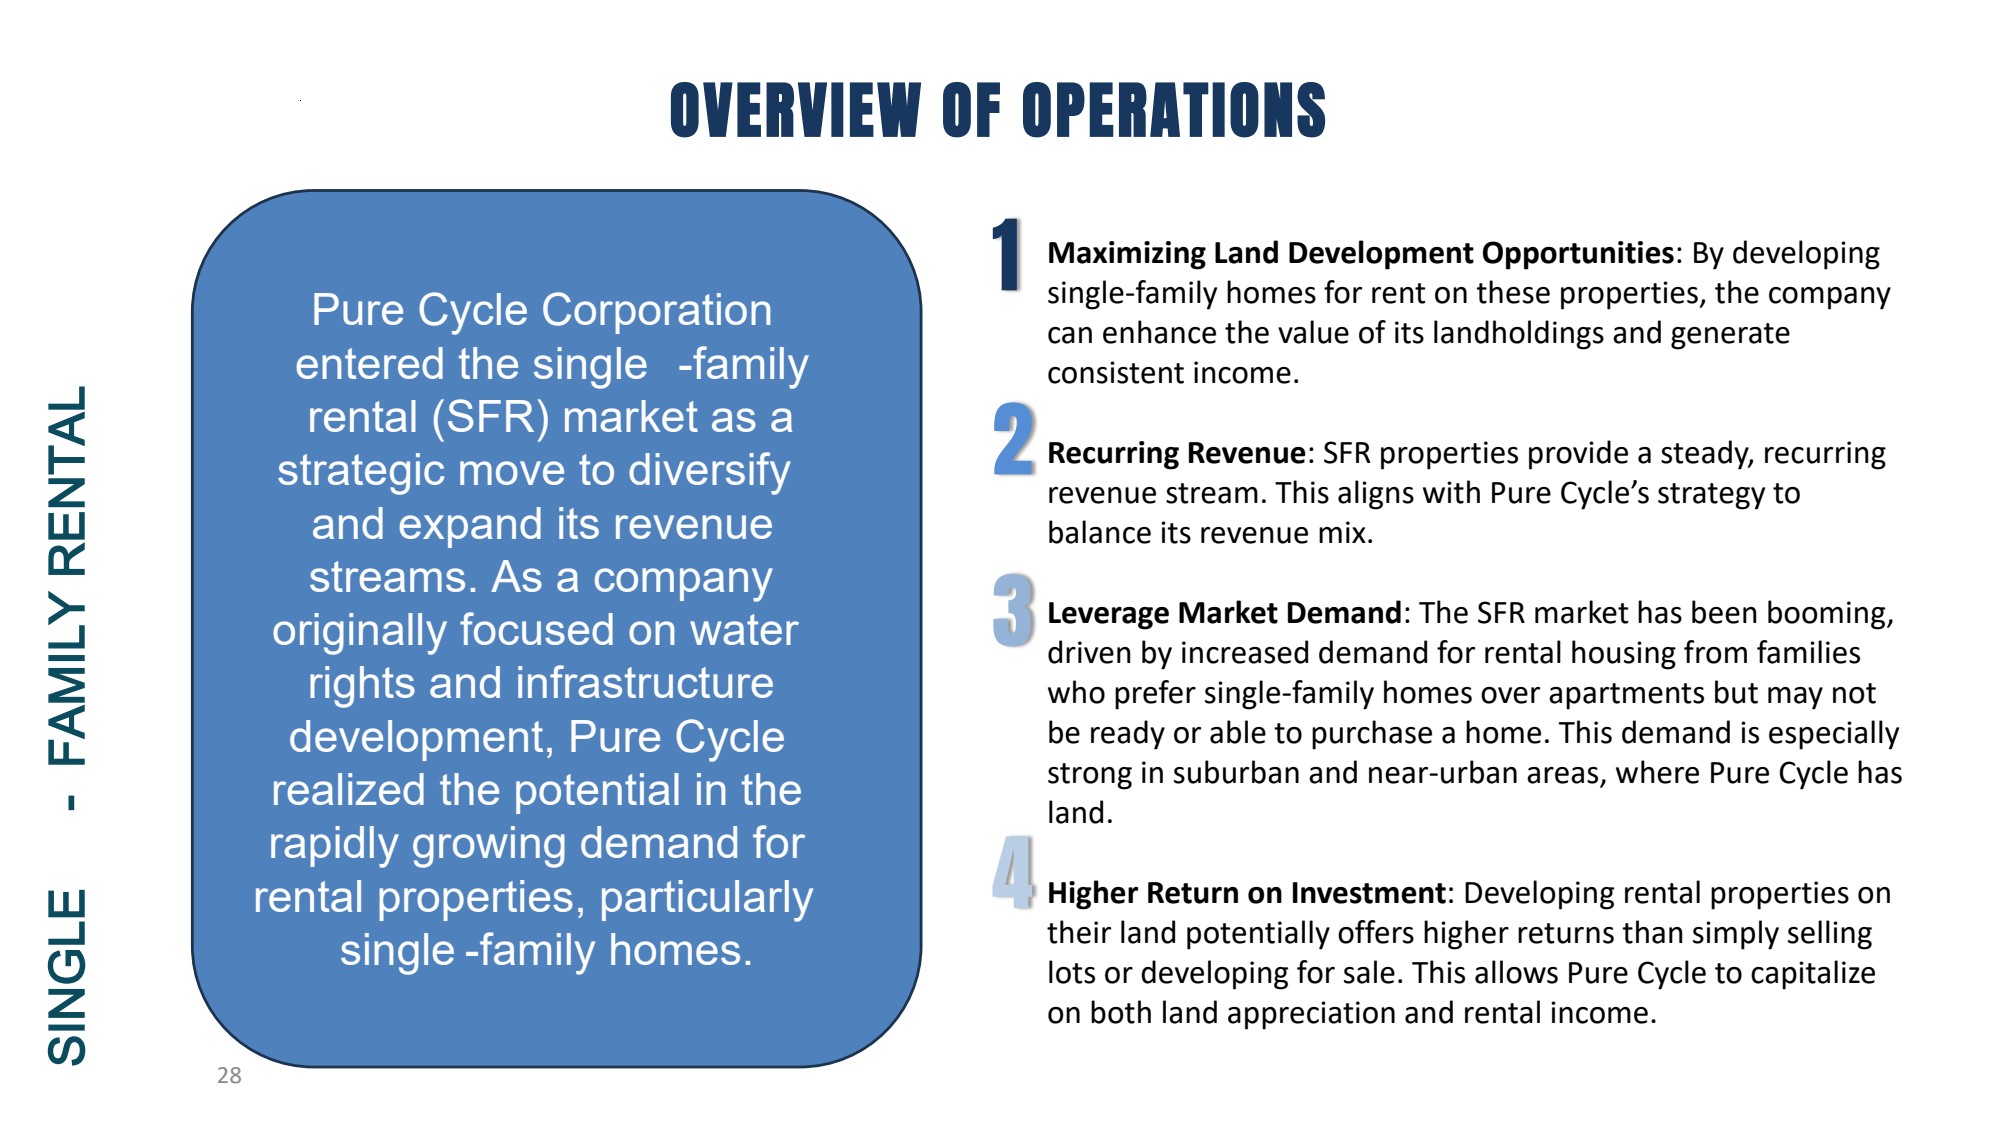
OVERVIEW OF OPERATIONS SINGLE - FAMILY RENTAL Maximizing Land Development Opportunities: By developing single-family homes for rent on these properties, the company can enhance the value of its landholdings and generate consistent income. Recurring Revenue: SFR properties provide a steady, recurring revenue stream. This aligns with Pure Cycle’s strategy to balance its revenue mix. Leverage Market Demand: The SFR market has been booming, driven by increased demand for rental housing from families who prefer single-family homes over apartments but may not be ready or able to purchase a home. This demand is especially strong in suburban and near-urban areas, where Pure Cycle has land. Higher Return on Investment: Developing rental properties on their land potentially offers higher returns than simply selling lots or developing for sale. This allows Pure Cycle to capitalize on both land appreciation and rental income. Pure Cycle Corporation entered the single -family rental (SFR) market as a strategic move to diversify and expand its revenue streams. As a company originally focused on water rights and infrastructure development, Pure Cycle realized the potential in the rapidly growing demand for rental properties, particularly single -family homes. 2 1 3 4 28

GRAPHIC

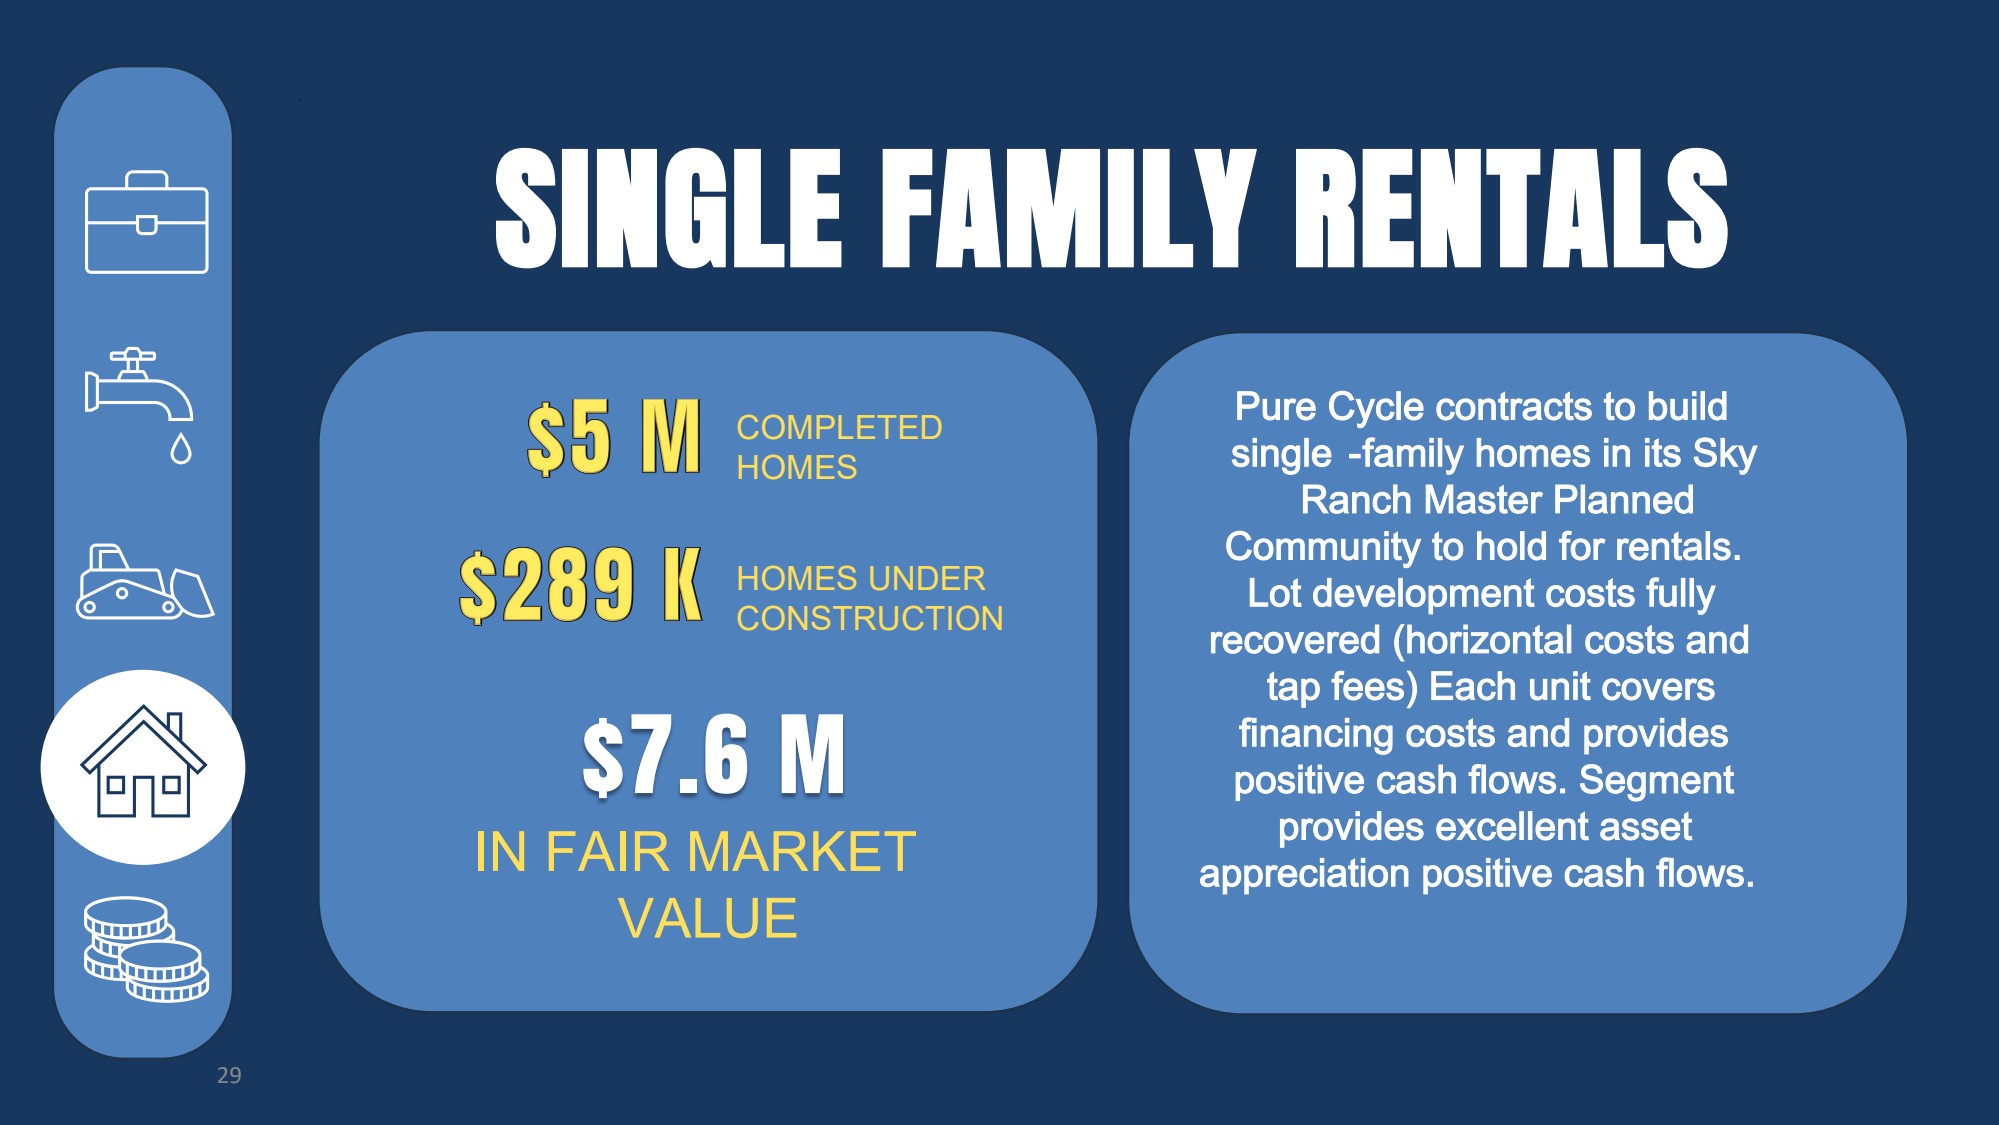
SINGLE FAMILY RENTALS Pure Cycle contracts to build single -family homes in its Sky Ranch Master Planned Community to hold for rentals. Lot development costs fully recovered (horizontal costs and tap fees) Each unit covers financing costs and provides positive cash flows. Segment provides excellent asset appreciation positive cash flows. $7.6 M IN FAIR MARKET VALUE COMPLETED HOMES HOMES UNDER CONSTRUCTION 29

GRAPHIC

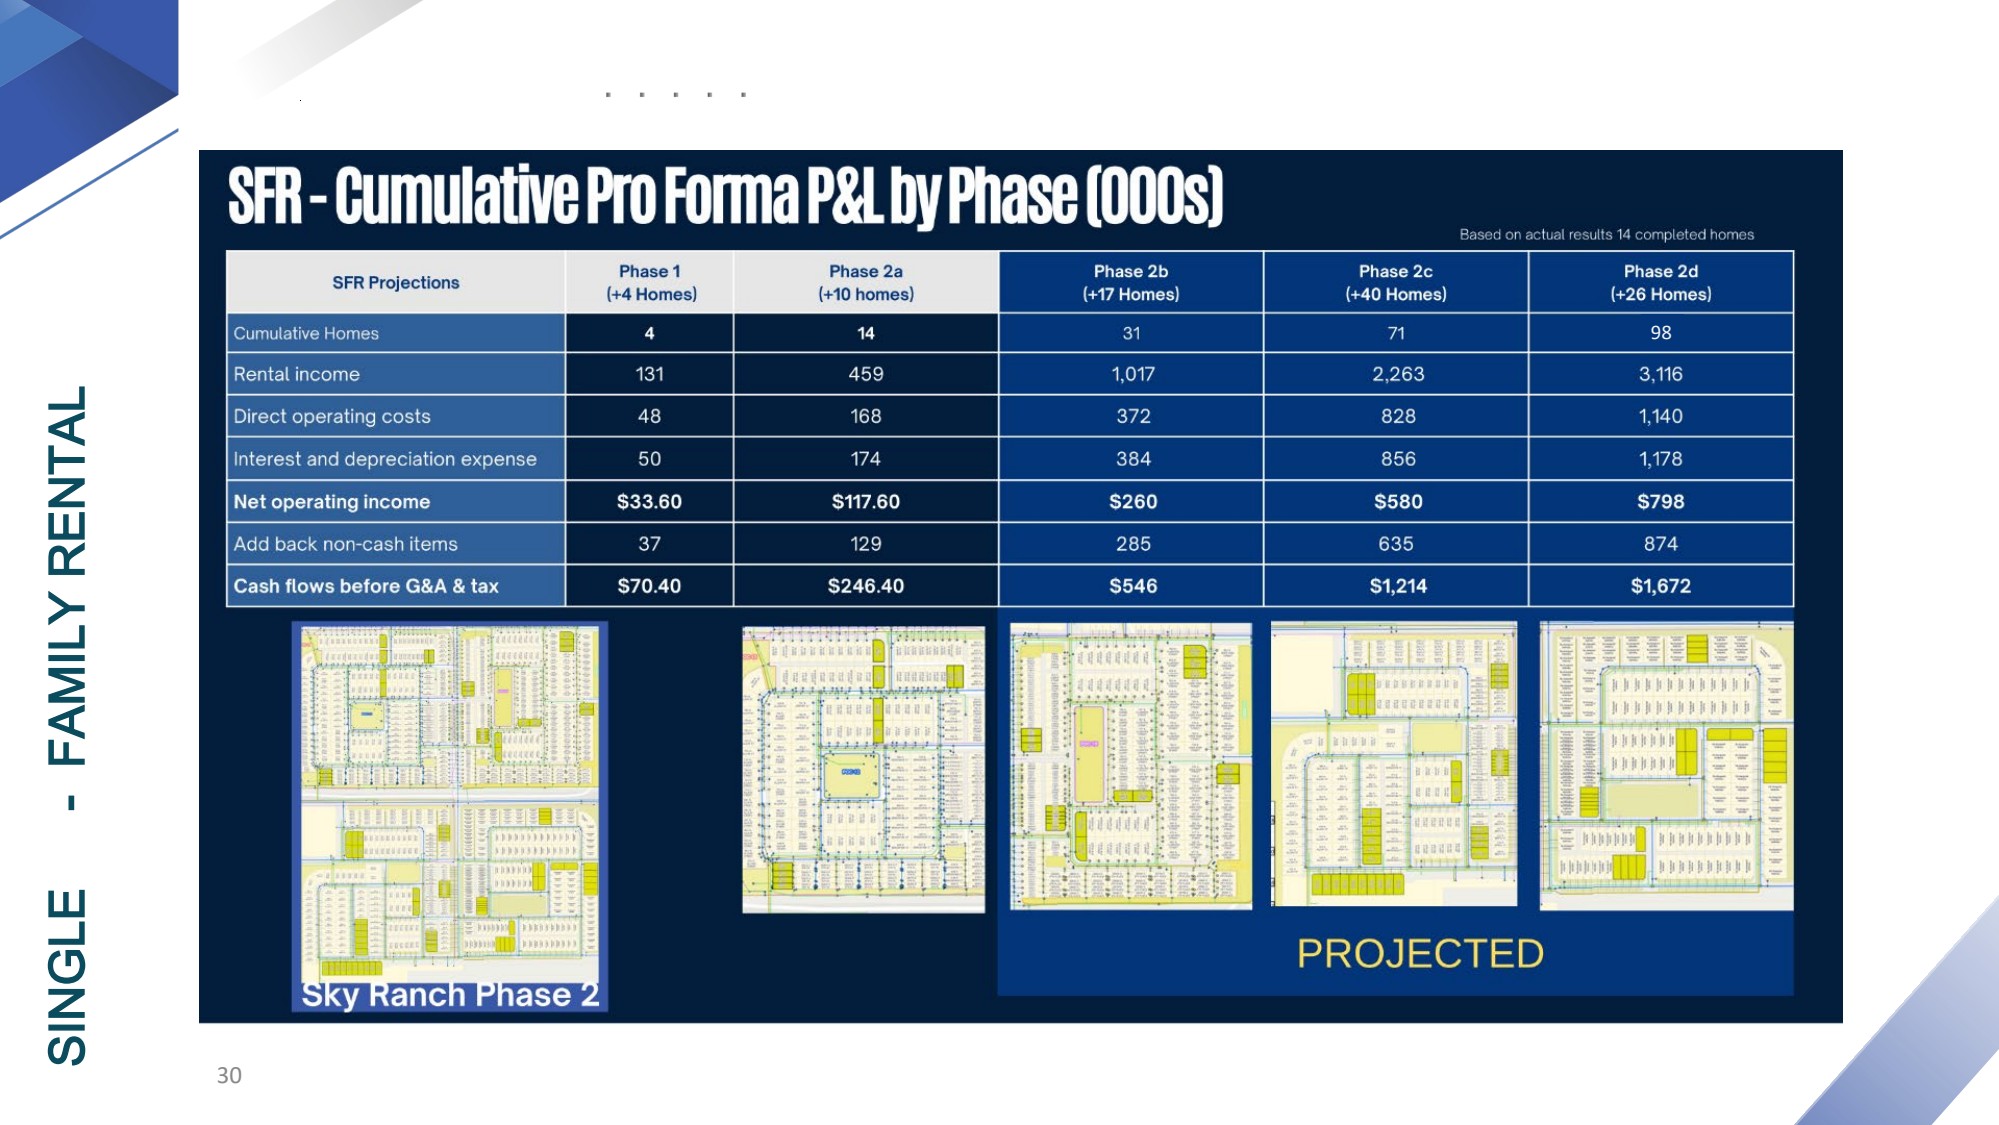
Financial Performance SINGLE - FAMILY RENTAL 30 98

GRAPHIC

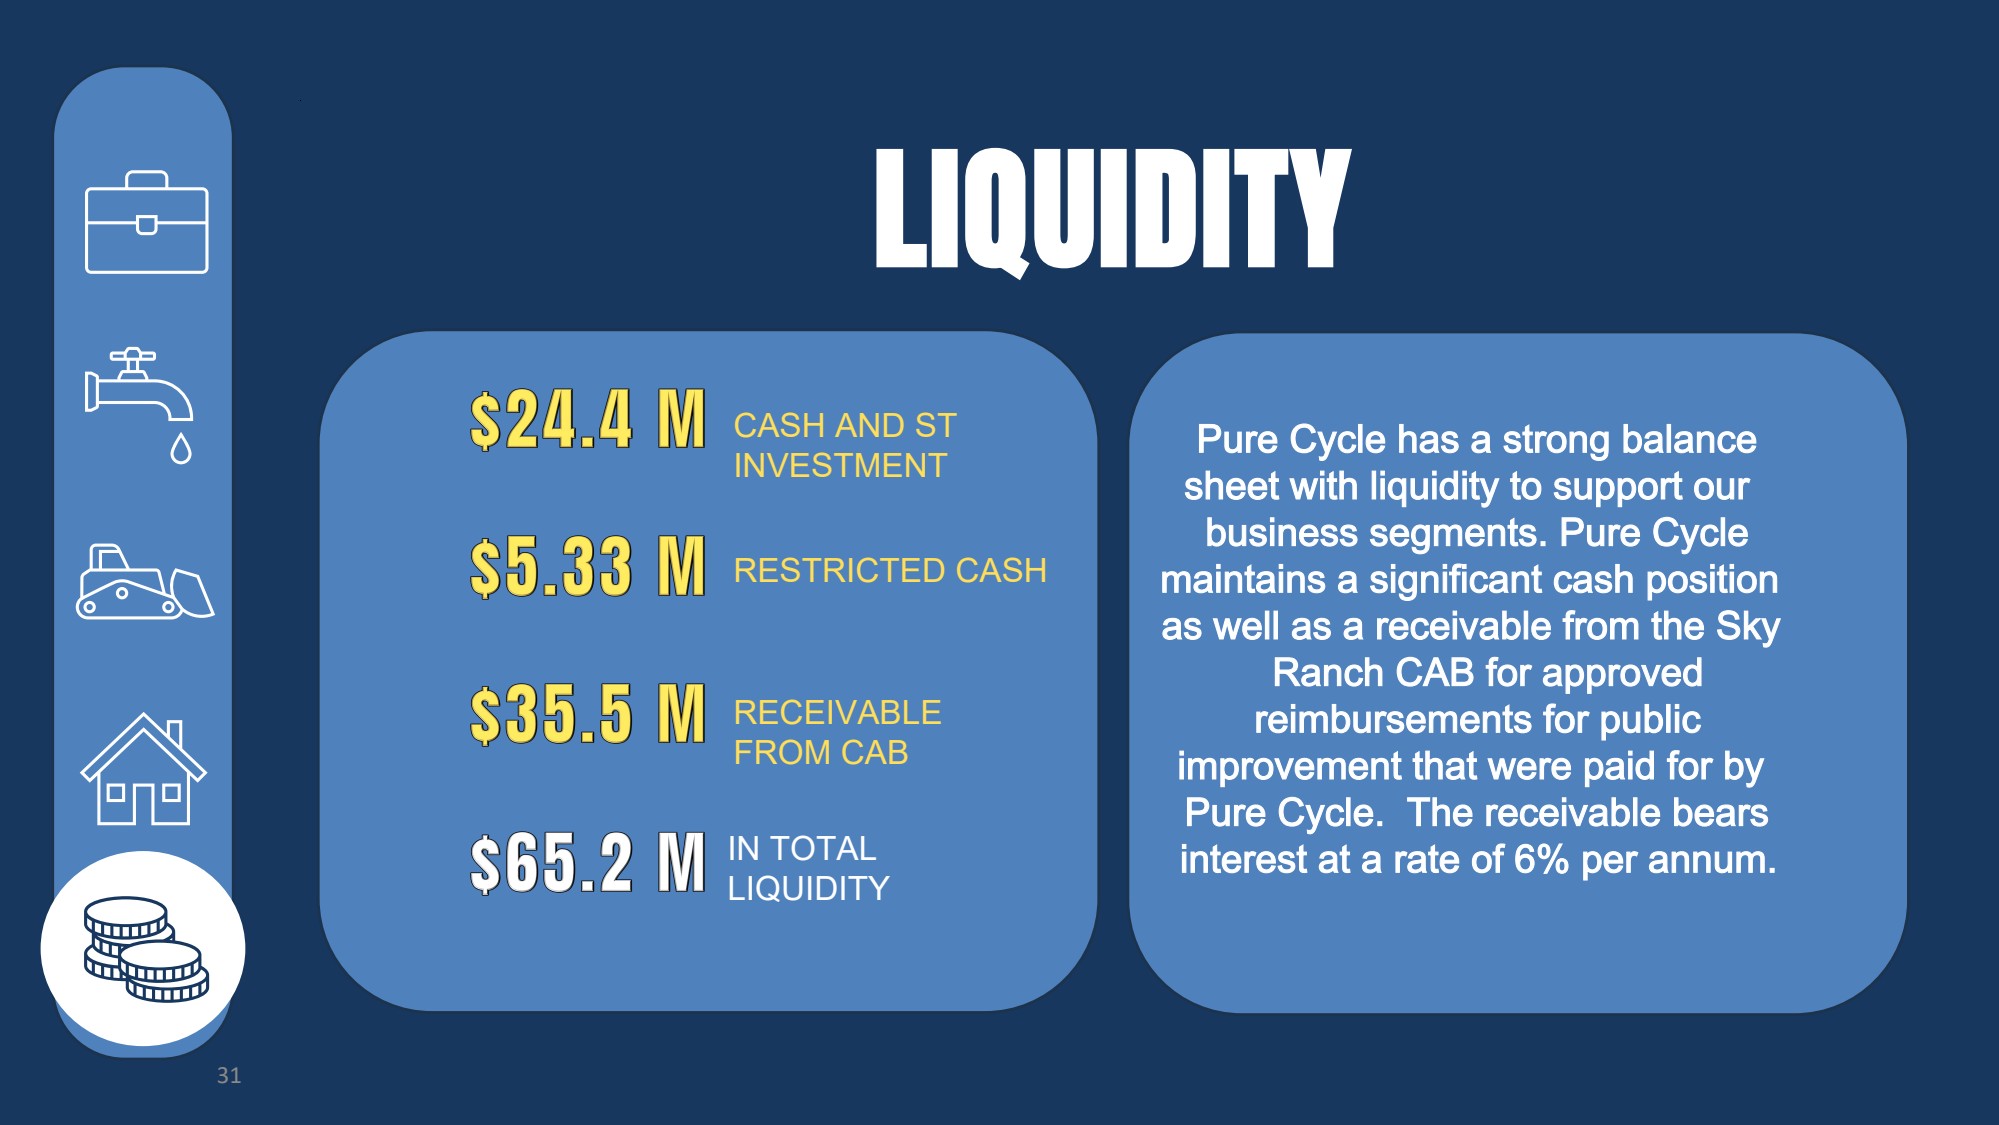
LIQUIDITY Pure Cycle has a strong balance sheet with liquidity to support our business segments. Pure Cycle maintains a significant cash position as well as a receivable from the Sky Ranch CAB for approved reimbursements for public improvement that were paid for by Pure Cycle. The receivable bears interest at a rate of 6% per annum. CASH AND ST INVESTMENT RESTRICTED CASH RECEIVABLE FROM CAB IN TOTAL LIQUIDITY 31

GRAPHIC

EW OUTLOOK LA PURE CYCLE CORPORATION 32

GRAPHIC

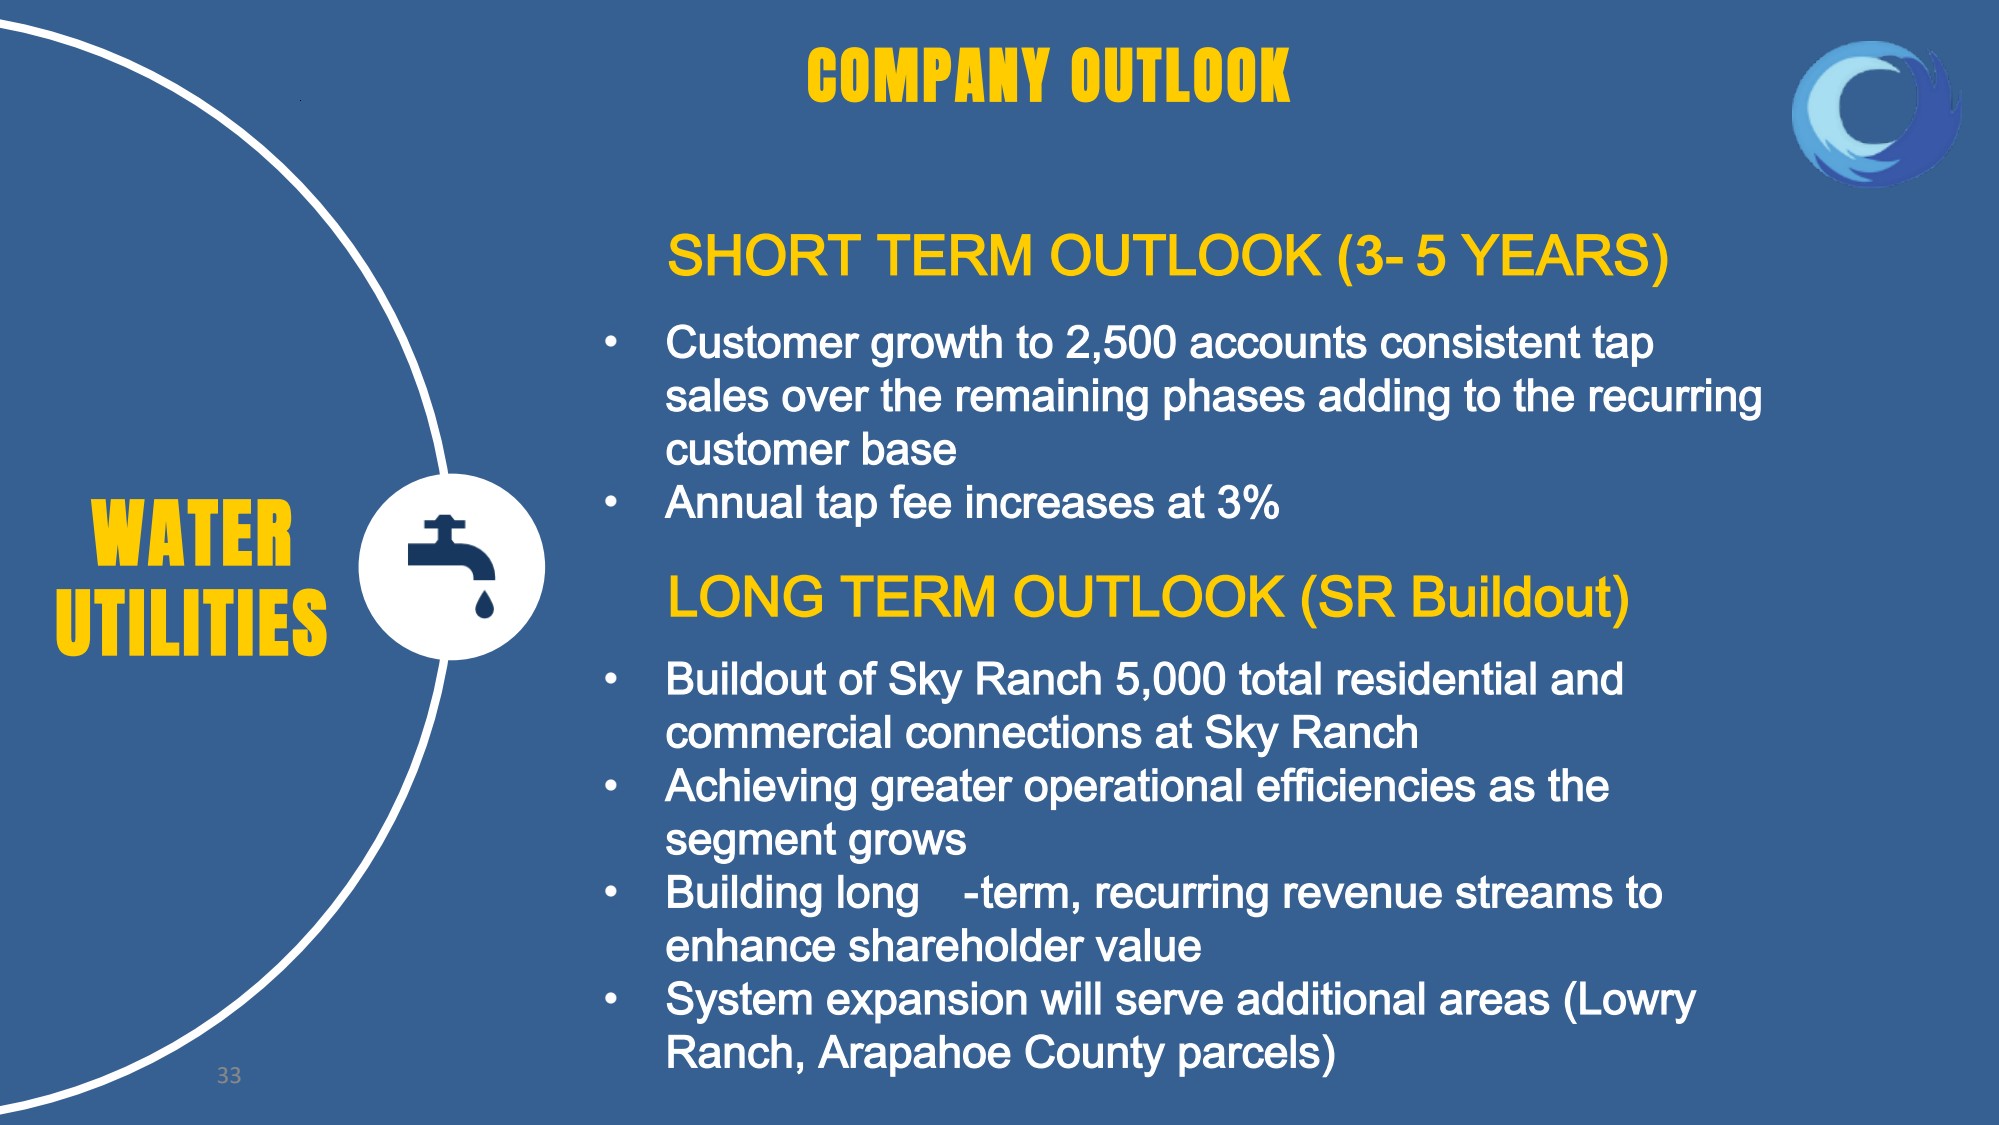
COMPANY OUTLOOK SHORT TERM OUTLOOK (3- 5 YEARS) • Customer growth to 2,500 accounts consistent tap sales over the remaining phases adding to the recurring customer base • Annual tap fee increases at 3% WATER UTILITIES • Buildout of Sky Ranch 5,000 total residential and commercial connections at Sky Ranch • Achieving greater operational efficiencies as the segment grows • Building long -term, recurring revenue streams to enhance shareholder value • System expansion will serve additional areas (Lowry Ranch, Arapahoe County parcels) LONG TERM OUTLOOK (SR Buildout) 33

GRAPHIC

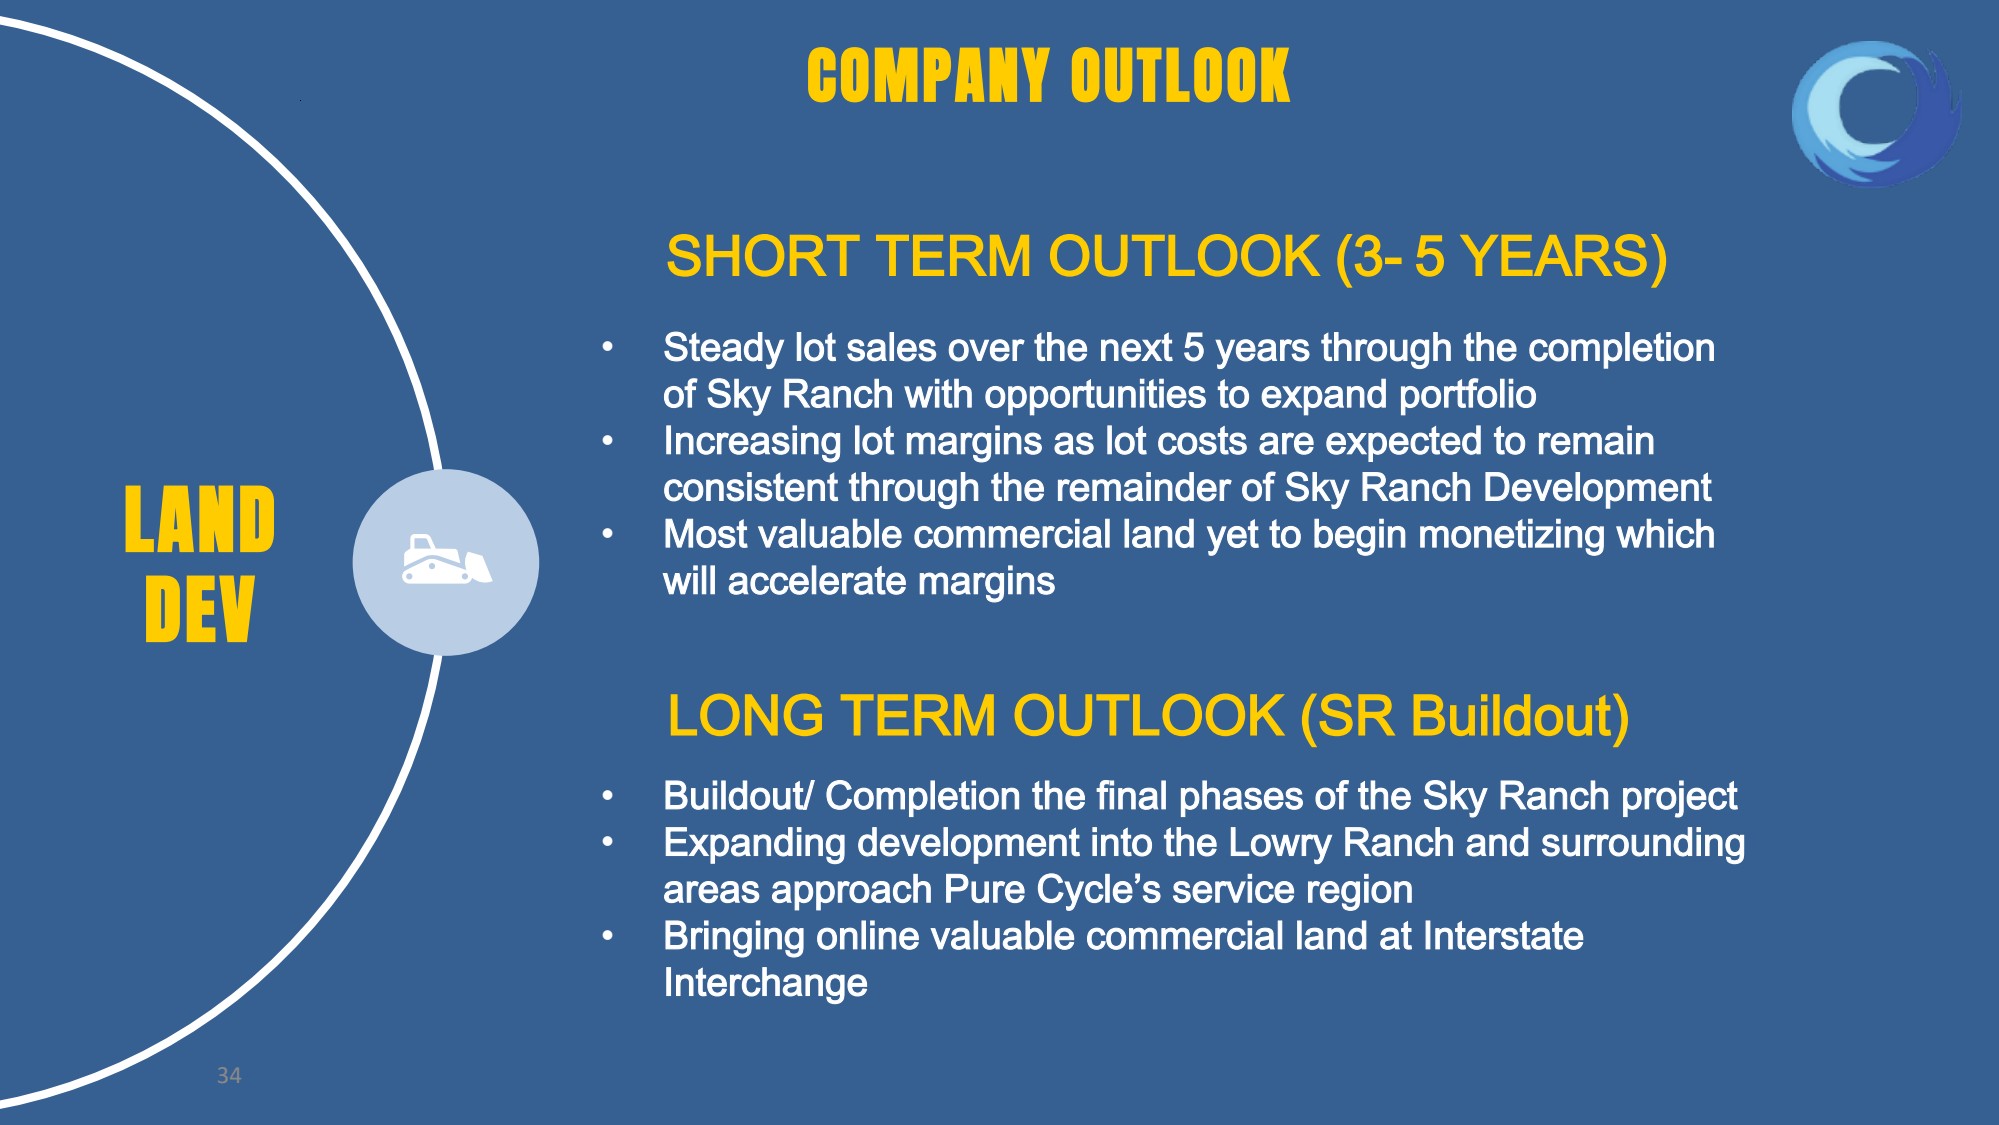
COMPANY OUTLOOK • Steady lot sales over the next 5 years through the completion of Sky Ranch with opportunities to expand portfolio • Increasing lot margins as lot costs are expected to remain consistent through the remainder of Sky Ranch Development • Most valuable commercial land yet to begin monetizing which will accelerate margins LAND DEV SHORT TERM OUTLOOK (3- 5 YEARS) LONG TERM OUTLOOK (SR Buildout) • Buildout/ Completion the final phases of the Sky Ranch project • Expanding development into the Lowry Ranch and surrounding areas approach Pure Cycle’s service region • Bringing online valuable commercial land at Interstate Interchange 34

GRAPHIC

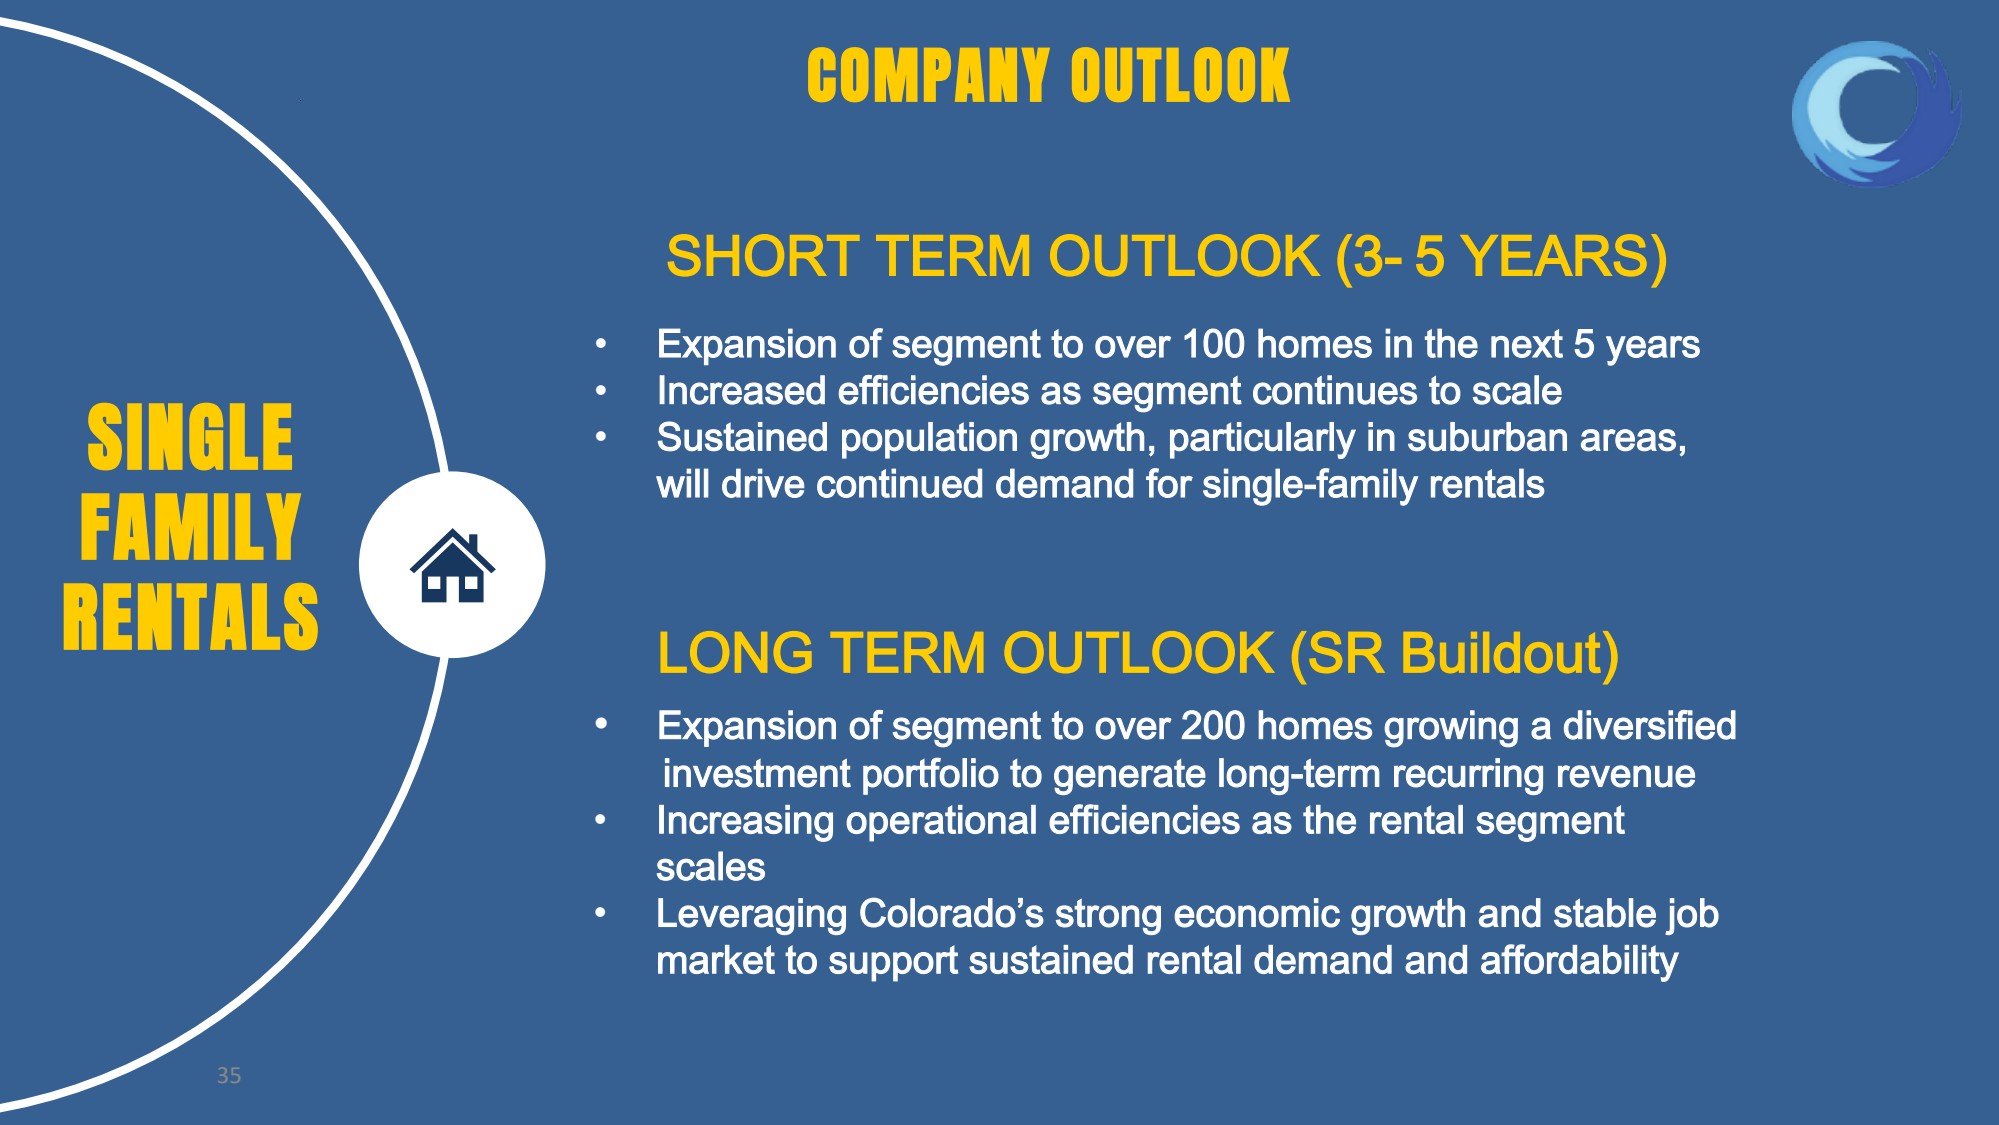
COMPANY OUTLOOK • Expansion of segment to over 100 homes in the next 5 years • Increased efficiencies as segment continues to scale • Sustained population growth, particularly in suburban areas, will drive continued demand for single-family rentals SINGLE FAMILY RENTALS SHORT TERM OUTLOOK (3- 5 YEARS) LONG TERM OUTLOOK (SR Buildout) • Expansion of segment to over 200 homes growing a diversified investment portfolio to generate long-term recurring revenue • Increasing operational efficiencies as the rental segment scales • Leveraging Colorado’s strong economic growth and stable job market to support sustained rental demand and affordability 35

GRAPHIC

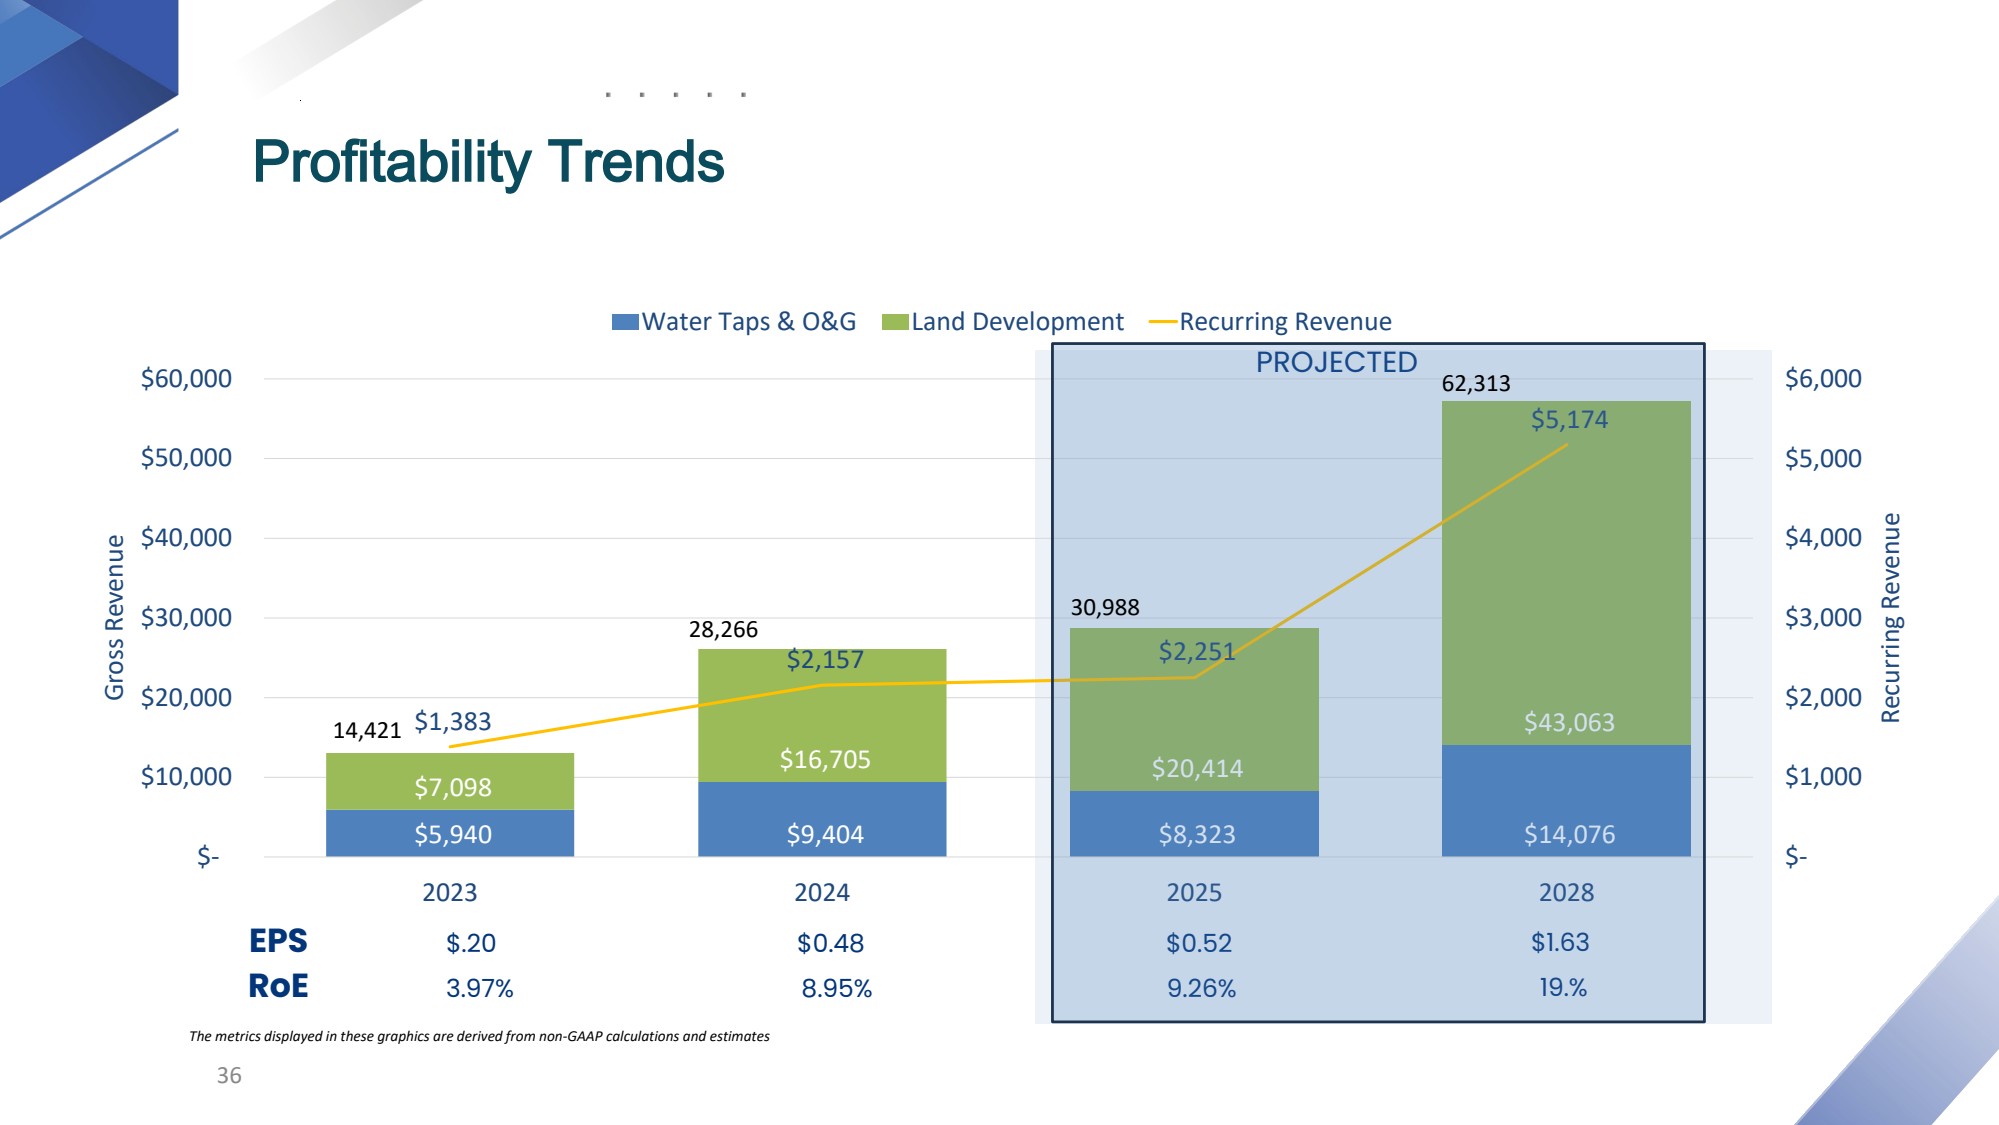
$5,940 $9,404 $8,323 $14,076 $7,098 $16,705 $20,414 $1,383 $43,063 $2,157 $2,251 $5,174 $- $1,000 $2,000 $3,000 $4,000 $5,000 $6,000 $- $10,000 $20,000 $30,000 $40,000 $50,000 $60,000 2023 2024 2025 2028 Recurring Revenue Gross Revenue Water Taps & O&G Land Development Recurring Revenue 36 $.20 $0.48 $0.52 $1.63 3.97% 8.95% 9.26% 19.% EPS RoE Profitability Trends The metrics displayed in these graphics are derived from non-GAAP calculations and estimates PROJECTED 14,421 28,266 30,988 62,313

GRAPHIC

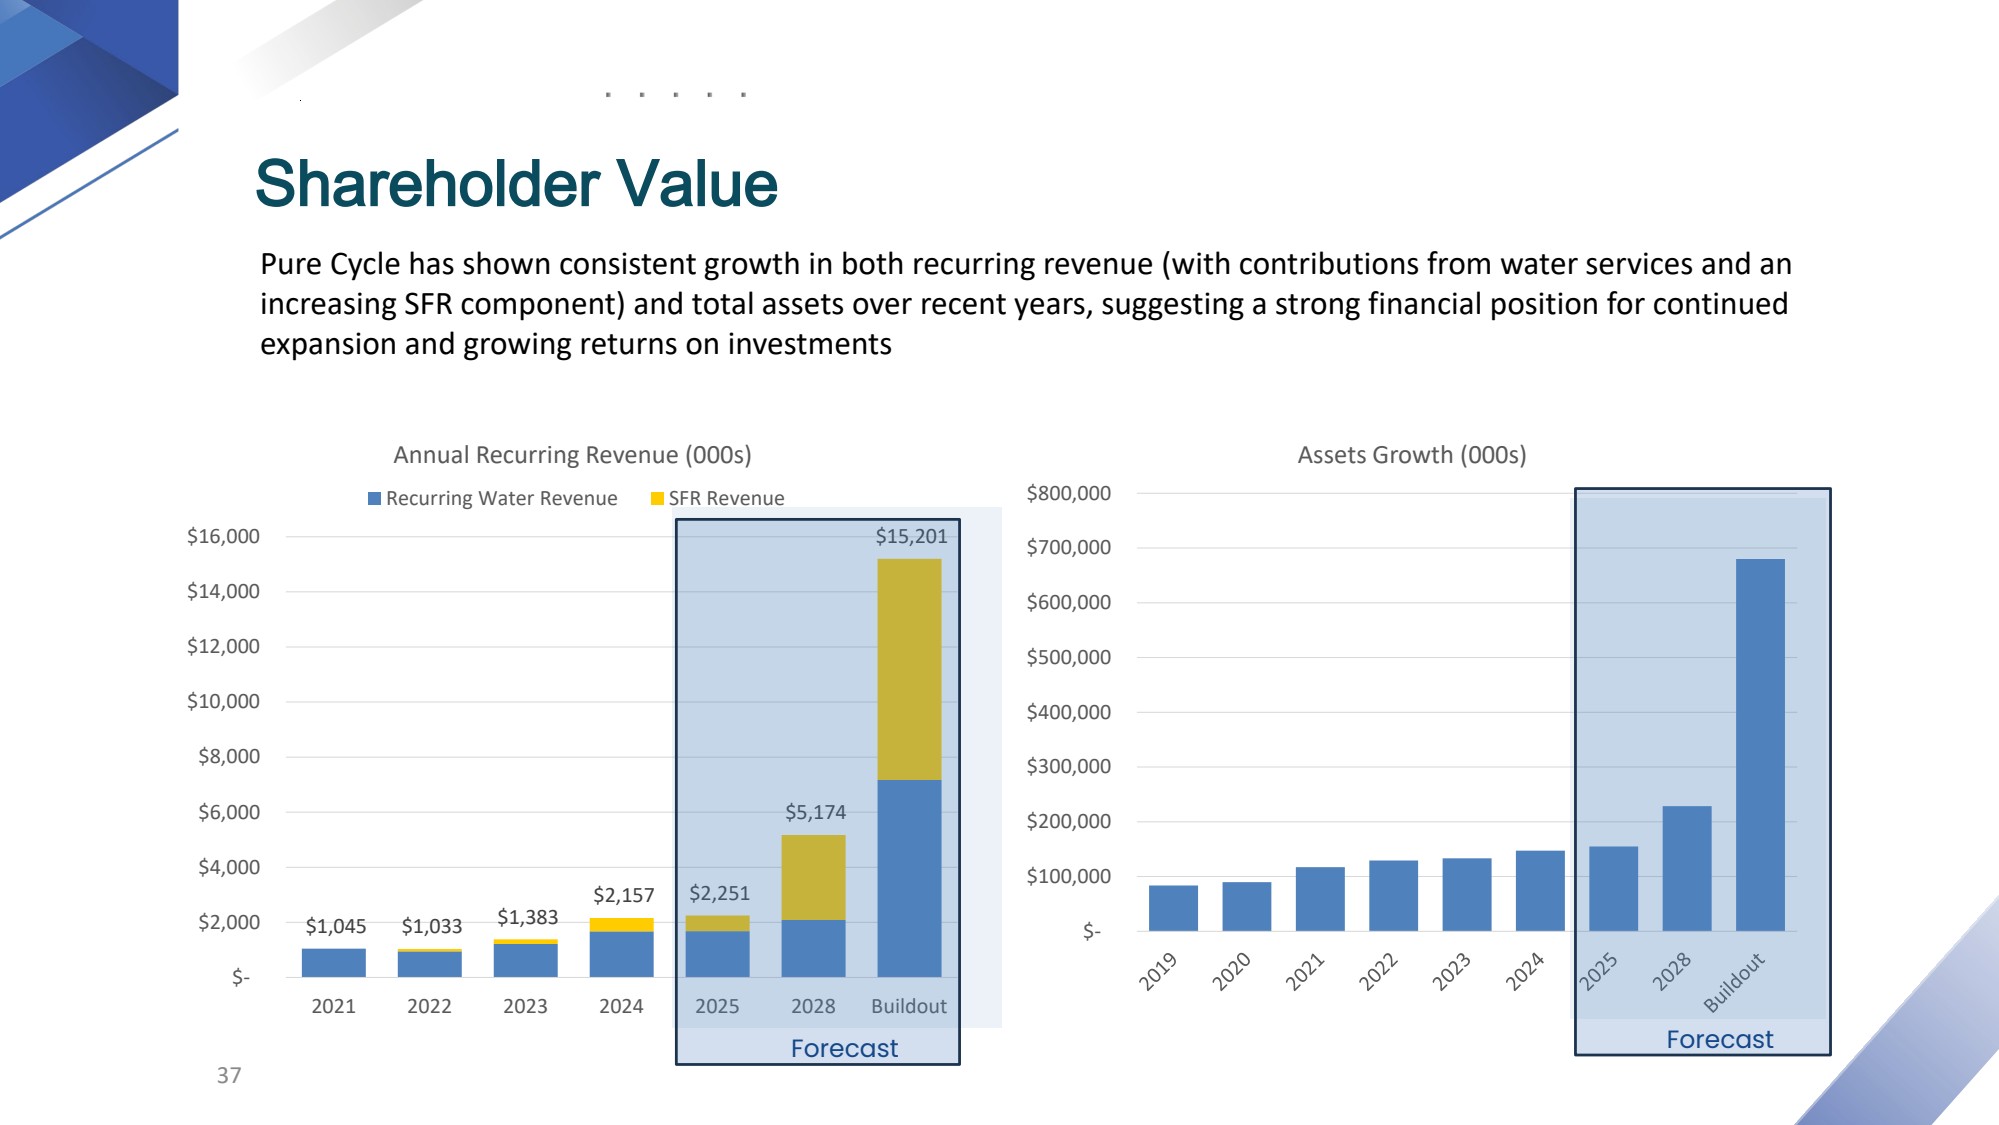
Shareholder Value Pure Cycle has shown consistent growth in both recurring revenue (with contributions from water services and an increasing SFR component) and total assets over recent years, suggesting a strong financial position for continued expansion and growing returns on investments 37 $1,045 $1,033 $1,383 $2,157 $2,251 $5,174 $15,201 $- $2,000 $4,000 $6,000 $8,000 $10,000 $12,000 $14,000 $16,000 2021 2022 2023 2024 2025 2028 Buildout Annual Recurring Revenue (000s) Recurring Water Revenue SFR Revenue $- $100,000 $200,000 $300,000 $400,000 $500,000 $600,000 $700,000 $800,000 Assets Growth (000s) Forecast Forecast

GRAPHIC

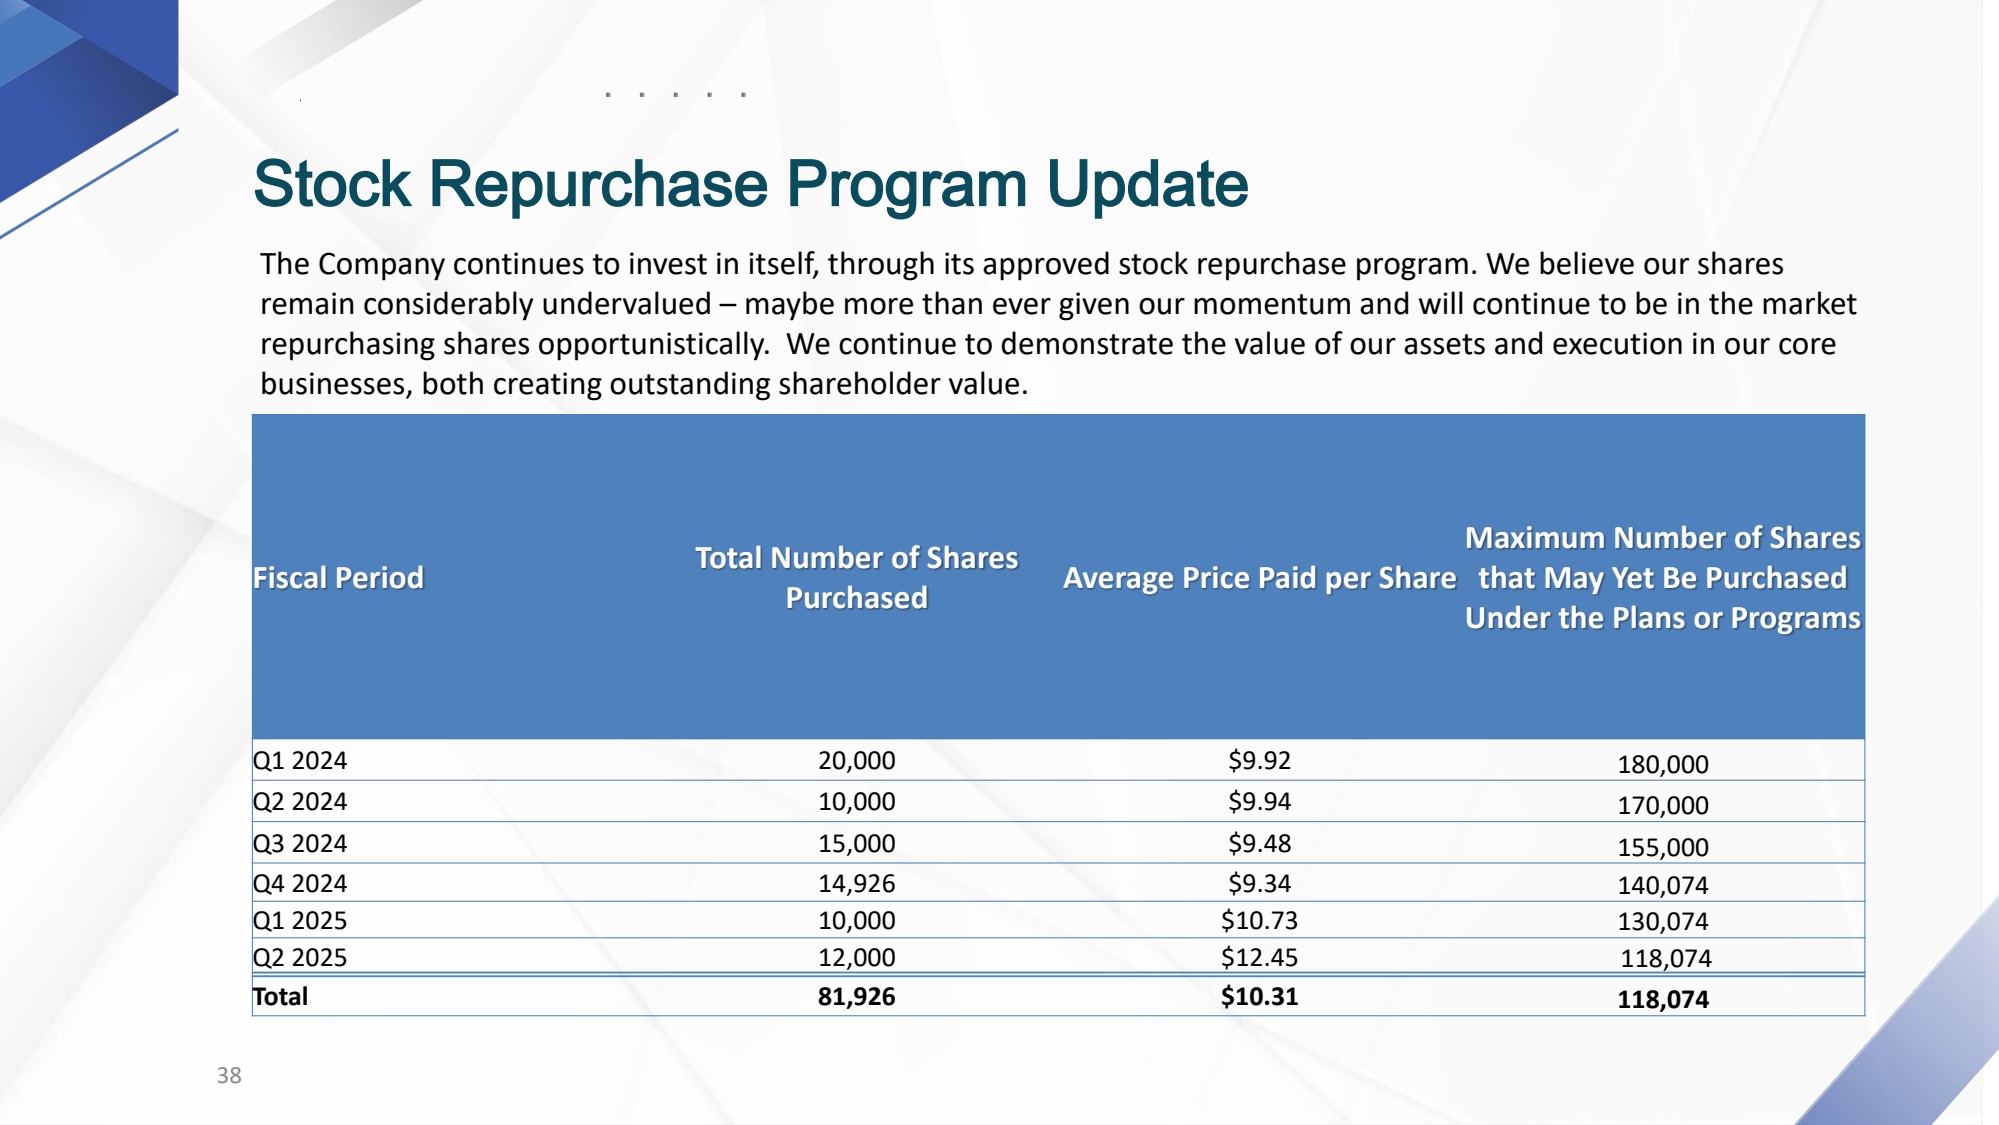
38 Stock Repurchase Program Update The Company continues to invest in itself, through its approved stock repurchase program. We believe our shares remain considerably undervalued – maybe more than ever given our momentum and will continue to be in the market repurchasing shares opportunistically. We continue to demonstrate the value of our assets and execution in our core businesses, both creating outstanding shareholder value. Fiscal Period Total Number of Shares Purchased Average Price Paid per Share Maximum Number of Shares that May Yet Be Purchased Under the Plans or Programs Q1 2024 20,000 $9.92 180,000 Q2 2024 10,000 $9.94 170,000 Q3 2024 15,000 $9.48 155,000 Q4 2024 14,926 $9.34 140,074 Q1 2025 10,000 $10.73 130,074 Q2 2025 12,000 $12.45 118,074 Total 81,926 $10.31 118,074

GRAPHIC

Earnings Presentation Q&A PURE CYCLE CORPORATION www.purecyclewater.com