Form 8-K
falsefalsefalse000078878400000810330001158659 0000788784 2020-05-04 2020-05-04 0000788784 pseg:PublicServiceElectricAndGasCompanyMember 2020-05-04 2020-05-04 0000788784 pseg:PsegPowerLlcMember 2020-05-04 2020-05-04 0000788784 us-gaap:CommonStockMember 2020-05-04 2020-05-04 0000788784 pseg:FirstAndRefundingMortgageBondsNinePointTwoFivePercentSeriesCcDueTwoThousandTwentyOneMember pseg:PublicServiceElectricAndGasCompanyMember 2020-05-04 2020-05-04 0000788784 pseg:FirstAndRefundingMortgageBondsEightPercentDueTwoThousandThirtySevenMember pseg:PublicServiceElectricAndGasCompanyMember 2020-05-04 2020-05-04 0000788784 pseg:FirstAndRefundingMortgageBondsFivePercentDueTwoThousandThirtySevenMember pseg:PublicServiceElectricAndGasCompanyMember 2020-05-04 2020-05-04 0000788784 pseg:SeniorNotesEightPointSixTwoFivePercentDueTwoThousandThirtyOneMember pseg:PsegPowerLlcMember 2020-05-04 2020-05-04
 
 
UNITED STATES
SECURITIES AND EXCHANGE COMMISSION
Washington, D.C. 20549
 
FORM 8-K
 
CURRENT REPORT
Pursuant to Section 13 or 15(d)
of the Securities Exchange Act of 1934
Date of Report (Date of earliest event reported) May 4, 2020
 
Public Service Enterprise Group Incorporated
(Exact name of registrant as specified in its charter)
 
New Jersey
 
001-09120
 
22-2625848
(State or other jurisdiction
of incorporation)
 
(Commission
File Number)
 
(I.R.S. Employer
Identification Number)
80 Park Plaza
Newark, New Jersey 07102
(Address of principal executive offices) (Zip Code)
973
430-7000
(Registrant’s telephone number, including area code)
 
Public Service Electric and Gas Company
(Exact name of registrant as specified in its charter)
 
New Jersey
 
001-00973
 
22-1212800
(State or other jurisdiction
of incorporation)
 
(Commission
File Number)
 
(I.R.S. Employer
Identification Number)
80 Park Plaza
Newark, New Jersey 07102
(Address of principal executive offices) (Zip Code)
973
430-7000
(Registrant’s telephone number, including area code)
 
PSEG Power LLC
(Exact name of registrant as specified in its charter)
 
Delaware
 
001-34232
 
22-3663480
(State or other jurisdiction
of incorporation)
 
(Commission
File Number)
 
(I.R.S. Employer
Identification Number)
80 Park Plaza
Newark, New Jersey 07102
(Address of principal executive offices) (Zip Code)
973 430-7000
(Registrant’s telephone number, including area code)
 
Check the appropriate box below if the Form
8-K
filing is intended to simultaneously satisfy the filing obligation of the registrant under any of the following provisions (see General Instruction A.2. below):
Written communications pursuant to Rule 425 under the Securities Act (17 CFR 230.425)
Soliciting material pursuant to Rule
14a-12
under the Exchange Act (17 CFR
240.14a-12)
Pre-commencement
communications pursuant to Rule
14d-2(b)
under the Exchange Act (17 CFR
240.14d-2(b))
Pre-commencement
communications pursuant to Rule
13e-4(c)
under the Exchange Act (17 CFR
240.13e-4(c))
Securities registered pursuant to Section 12(b) of the Act:
Title of Each Class
 
Trading
Symbol(s)
 
Name of Each Exchange
On Which Registered
Public Service Enterprise Group Incorporated
 
 
Common Stock without par value
 
PEG
 
New York Stock Exchange
         
Public Service Electric and Gas Company
 
 
9.25% First and Refunding Mortgage Bonds, Series CC, due 2021
 
PEG21
 
New York Stock Exchange
8.00% First and Refunding Mortgage Bonds, due 2037
 
PEG37D
 
New York Stock Exchange
5.00% First and Refunding Mortgage Bonds, due 2037
 
PEG37J
 
New York Stock Exchange
         
PSEG Power LLC
 
 
8.625% Senior Notes, due 2031
 
PEG31
 
New York Stock Exchange
Indicate by check mark whether any of the registrants is an emerging growth company as defined in Rule 405 of the Securities Act of 1933 (§230.405 of this chapter) or Rule
12b-2
of the Securities Exchange Act of 1934 (§
240.12b-2
of this chapter).
Emerging growth company  
If an emerging growth company, indicate by check mark if such registrant has elected not to use the extended transition period for
complying with any new or revised financial accounting standards provided pursuant to Section 13(a) of the Exchange Act  


The information contained in Item 2.02. Results of Operations and Financial Condition in this Form
8-K
is furnished solely for Public Service Enterprise Group Incorporated (PSEG). The information contained in Item 7.01 Regulation FD Disclosure in this combined Form
8-K
is separately furnished, as noted, by PSEG, Public Service Electric and Gas Company (PSE&G) and PSEG Power LLC (PSEG Power). Information contained herein relating to any individual company is provided by such company on its own behalf and in connection with its respective Form
8-K.
PSE&G and PSEG Power each makes representations only as to itself and makes no other representations whatsoever as to any other company. The materials furnished as Exhibits 99 and 99.1 are available on the pseg.com website under the investor tab, or at http://investor.pseg.com.
Item 2.02
Results of Operations and Financial Condition
PSEG
On May 4, 2020, PSEG announced financial results for the three months ended March 31, 2020. A copy of the earnings release dated May 4, 2020 is furnished as Exhibit 99 to this Form
8-K.
Item 7.01
Regulation FD Disclosure
PSEG, PSE&G and PSEG Power
On May 4, 2020, PSEG conducted an earnings call regarding its results for the three months ended March 31, 2020. A copy of the slideshow presentation used during the earnings call is furnished as Exhibit 99.1 to this Form
8-K.
Item 9.01
Financial Statements and Exhibits
 
Exhibit 99


Exhibit 99.1


Exhibit 104
   
Cover Page Interactive Data File (embedded within the Inline XBRL document).
2

SIGNATURE
Pursuant to the requirements of the Securities Exchange Act of 1934, the registrant has duly caused this report to be signed on its behalf by the undersigned thereunto duly authorized. The signature of the undersigned company shall be deemed to relate only to matters having reference to such company and any subsidiaries thereof.
PUBLIC SERVICE ENTERPRISE GROUP INCORPORATED
(Registrant)
         
 
By:
 
/s/ Rose M. Chernick
 
 
ROSE M. CHERNICK
 
 
Vice President and Controller
 
 
(Principal Accounting Officer)
Date: May 4, 2020
SIGNATURE
Pursuant to the requirements of the Securities Exchange Act of 1934, the registrant has duly caused this report to be signed on its behalf by the undersigned thereunto duly authorized. The signature of the undersigned company shall be deemed to relate only to matters having reference to such company and any subsidiaries thereof.
PUBLIC SERVICE ELECTRIC AND GAS COMPANY
(Registrant)
     
By:
 
/s/ Rose M. Chernick
 
ROSE M. CHERNICK
 
Vice President and Controller
 
(Principal Accounting Officer)
Date: May 4, 2020
SIGNATURE
Pursuant to the requirements of the Securities Exchange Act of 1934, the registrant has duly caused this report to be signed on its behalf by the undersigned thereunto duly authorized. The signature of the undersigned company shall be deemed to relate only to matters having reference to such company and any subsidiaries thereof.
 
PSEG POWER LLC
 
(Registrant)
     
By:
 
/s/ Rose M. Chernick
 
ROSE M. CHERNICK
 
Vice President and Controller
 
(Principal Accounting Officer)
Date: May 4, 2020
3

EXHIBIT 99


LOGO    

Public Service Enterprise Group

80 Park Plaza

Newark, NJ 07102


CONTACTS      
Investor Relations:       Media Relations:
Carlotta Chan       Marijke Shugrue
973-430-6565       973-430-5924
[email protected]       [email protected]

PSEG ANNOUNCES 2020 FIRST QUARTER RESULTS

$0.88 PER SHARE OF NET INCOME

NON-GAAP OPERATING EARNINGS OF $1.03 PER SHARE

Re-Affirms Non-GAAP 2020 Operating Earnings Guidance of $3.30 - $3.50 Per Share

(May 4, 2020 – Newark, NJ) Public Service Enterprise Group (NYSE: PEG) reported Net Income for the first quarter of 2020 of $448 million, or $0.88 per share as compared to Net Income of $700 million, or $1.38 per share, in the first quarter of 2019. Non-GAAP Operating Earnings for the first quarter of 2020 were $520 million, or $1.03 per share, compared to non-GAAP Operating Earnings for the first quarter of 2019 of $547 million, or $1.08 per share. Non-GAAP results for the first quarter exclude items shown in Attachments 7 and 8.

“PSEG’s first and foremost responsibility has always been to provide safe and reliable delivery of electric and gas service to our 3.7 million customers in NJ and on Long Island,” said Ralph Izzo, chairman, president and chief executive officer. “These essential services have never been more important to our daily lives as most of us remain at home to stop the spread of the ongoing coronavirus (COVID-19) pandemic. Eight weeks ago, PSEG activated its pandemic response plan to enact new work practices, employee and customer safety protocols, and expand community outreach in light of the national emergency that began earlier this year. Our pandemic response plans were updated in 2019, and now are being extremely well executed by our dedicated workforce to maintain the high service quality our customers depend upon.”

“The safety of our employees and our customers has guided PSEG’s comprehensive response to COVID-19. We have updated our procedures to practice physical distancing and ensure proper personal protective equipment (PPE) is worn by all employees in the field and at our worksites. All of our employees who can work remotely are now doing so, including most of our customer service associates who have transitioned to home-based communications.”

“In this time of immense community hardship, we have pledged our support to New Jersey’s health-care professionals and first responders with donations of 50,000 N95 masks and 200,000 pairs of gloves to help replenish PPE resources for our front line heroes. The PSEG Foundation made a $2.5 million commitment to provide grants to regional food banks and health and social services organizations aimed at addressing and supporting those suffering from the medical, social and economic impacts of COVID-19.”


1


“Due to the temporary closure of most businesses, schools, and government buildings, the PSE&G service territory experienced a decline of approximately 5% to 7% in electric load from the end of March through April, and we anticipate this reduction may extend through the second quarter and possibly longer. The COVID-19 related reduction in demand appeared late in the quarter but added to the negative effects of the second warmest first quarter recorded in New Jersey. However, PSEG has managed through these challenges, continuing our investment program at PSE&G, providing New Jersey with zero carbon emission power from our nuclear facilities, and ensuring efficient cost management across our businesses.”

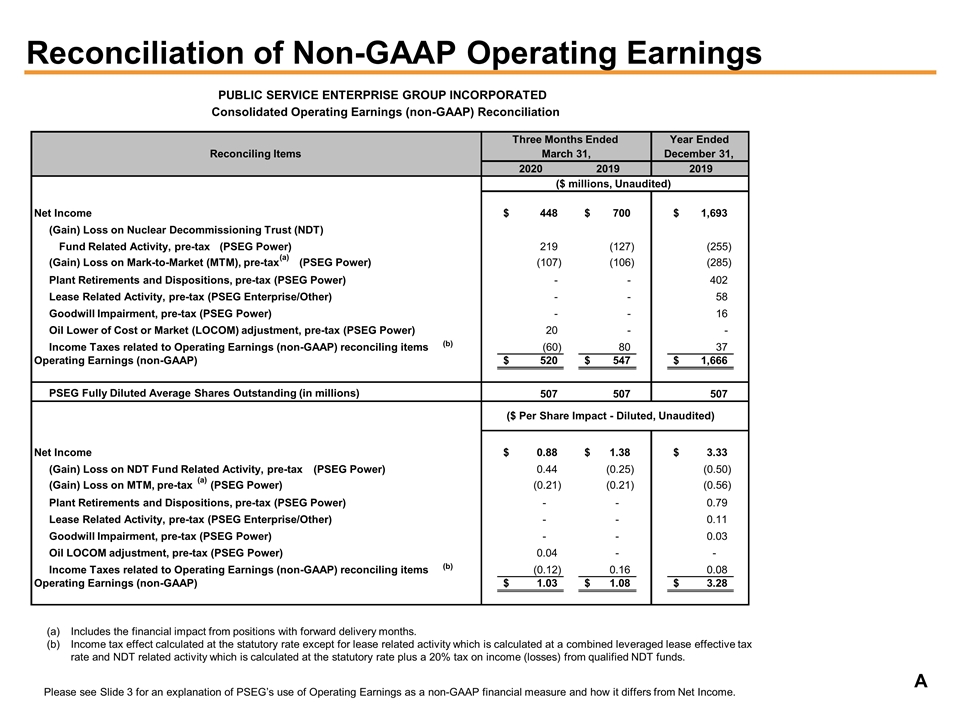
The following table provides a reconciliation of PSEG’s Net Income to non-GAAP Operating Earnings for the first quarter. See Attachments 7 and 8 for a complete list of items excluded from Net Income in the determination of non-GAAP Operating Earnings.

PSEG CONSOLIDATED RESULTS (unaudited)

First Quarter Comparative Results

2020 and 2019


Income

($ millions)


Diluted Earnings

Per Share

 
             2020             2019             2020                      2019          

Net Income

   $ 448     $ 700     $ 0.88      $ 1.38  

Reconciling Items

     72       (153     0.15        (0.30


Non-GAAP Operating Earnings

   $ 520     $ 547     $ 1.03      $ 1.08  


           Avg. Shares     507M      507M  

Ralph Izzo added, “We are re-affirming non-GAAP Operating Earnings guidance for full-year 2020 of $3.30 - $3.50 per share. This affirmation assumes normal weather and plant operations for the remainder of the year. The extremely mild weather in the quarter and the associated weakness in market demand, as well as impacts of COVID-19, will require maintaining solid operations and strong cost control at both PSE&G and PSEG Power, especially during the important third quarter cooling season. We remain committed to executing our five-year, $12 to $16 billion capital plan without the need to issue equity. We have also improved our net liquidity position, ending March with approximately $4 billion of available liquidity.”

“As we deal with the effects of COVID-19, PSEG continues to acknowledge the impact of climate change on our operations, our service territory and on our customers’ lives. We recently issued our inaugural Climate Report following the framework established by the Task Force on Climate-related Financial Disclosures (TCFD). The Climate Report also details our support for the preservation of nuclear generation, implementation of energy efficiency to curb greenhouse gas emissions, and advocacy for effective climate policies.”

“PSEG remains on track as we work to advance our regulatory and policy priorities in the coming months. PSE&G updated several of its Clean Energy Future (CEF) filings in April and the New Jersey Board of Public Utilities (BPU) has kept pace on their reviews of several key dockets concerning Energy Efficiency, Energy Cloud, and Electric Vehicles and Energy Storage. As we address new challenges the COVID-19 pandemic has placed on our operations, we remain focused on our long-term business strategy of building a sustainable, financially sound energy infrastructure company.”


2


The following table outlines PSEG’s expectations for non-GAAP Operating Earnings in 2020 by subsidiary:

2020 Non-GAAP Operating Earnings Guidance

($ millions, except EPS)


     2020E

PSE&G

   $1,310 - $1,370

PSEG Power

   $345 - $435

PSEG Enterprise/Other

   ($5)


Non-GAAP Operating Earnings

   $1,675 - $1,775


Non-GAAP Operating EPS

   $3.30 - $3.50


E = Estimate


Results and Outlook by Operating Subsidiary

PSE&G

Public Service Electric & Gas

First Quarter 2020 and 2019 Comparative Results

($ millions, except EPS)


PSE&G

   1Q 2020      1Q 2019      Q/Q Change  

Net Income

   $ 440      $ 403      $ 37  

Earnings Per Share

   $ 0.87      $ 0.79      $ 0.08  

PSE&G reported Net Income of $440 million ($0.87 per share) for the first quarter of 2020 compared with Net Income of $403 million ($0.79 per share) for the first quarter of 2019.

PSE&G’s first quarter results were driven by revenue growth from ongoing capital investment programs which more than offset the impact of unfavorable winter weather on electric and gas demand. Growth in transmission rate base, which added $0.06 per share to first quarter net income, includes approximately $0.02 per share of items that will reverse over the second and third quarters of 2020 due to timing of expenses and 2019 true-ups.

Gas margin, which includes the recovery of investments made under the second phase of the Gas System Modernization Program (GSMP II), as well as higher weather-normalized gas sales margins, improved quarter-over-quarter Net Income comparisons by $0.04.

Winter weather, as measured by heating degree days, was 19% warmer than normal and 19% warmer than first-quarter 2019. The negative impact of unfavorable weather on gas margin quarter-over-quarter was largely offset by the gas weather-normalization clause. However, the decline in electric sales and revenue as a result of the large difference in weather reduced quarter-over-quarter earnings comparisons by $0.02 per share.

For the trailing 12-months ended March 31, weather-normalized electric and weather-normalized firm gas sales were each down by approximately 1%, led by declines in Commercial and


3


Industrial usage. Residential sales were flat with customer growth just below 1% offset by increases in energy efficiency and solar net metering.

PSE&G’s capital program remains on schedule. PSE&G invested approximately $0.6 billion in the first quarter as part of its planned 2020 capital investment program of $2.7 billion in infrastructure upgrades to its transmission and distribution facilities.

In March, PSE&G alerted residential customers and the New Jersey Board of Public Utilities (BPU) that it would temporarily suspend all non-safety related service shut-offs for non-payment. In April, PSE&G updated its CEF-Energy Cloud proposal to replace existing electric meters with smart meters, or AMI, under the BPU’s Infrastructure Investment Program and received a procedural schedule outlining key dates in the proceeding. The BPU has also set a procedural schedule for the CEF-Electric Vehicle and Energy Storage filing, with a similar calendar to CEF-Energy Cloud, both of which have evidentiary hearings scheduled near the end of 2020, absent an earlier settlement among the parties to the case.

PSE&G’s forecast of Net Income for 2020 is unchanged at $1,310 million - $1,370 million.

PSEG Power

First Quarter 2020 and 2019 Comparative Results

($ millions, except EPS)


PSEG Power

   1Q 2020      1Q 2019      Q/Q Change  

Net Income

   $ 13      $ 296      $ (283

Earnings Per Share (EPS)

   $ 0.02      $ 0.59      $ (0.57

Non-GAAP Operating Earnings

   $ 85      $ 143      $ (58

Non-GAAP EPS

   $ 0.17      $ 0.29      $ (0.12

Non-GAAP Adjusted EBITDA

   $ 201      $ 304      $ (103

PSEG Power reported Net Income of $13 million ($0.02 per share) for the first quarter of 2020, non-GAAP Operating Earnings of $85 million ($0.17 per share), and non-GAAP Adjusted EBITDA of $201 million. A pre-tax write-down of $20 million to reflect a lower of cost or market adjustment to oil inventory was recognized in the first quarter of 2020 and excluded from the non-GAAP measures of Operating Earnings and Adjusted EBITDA.

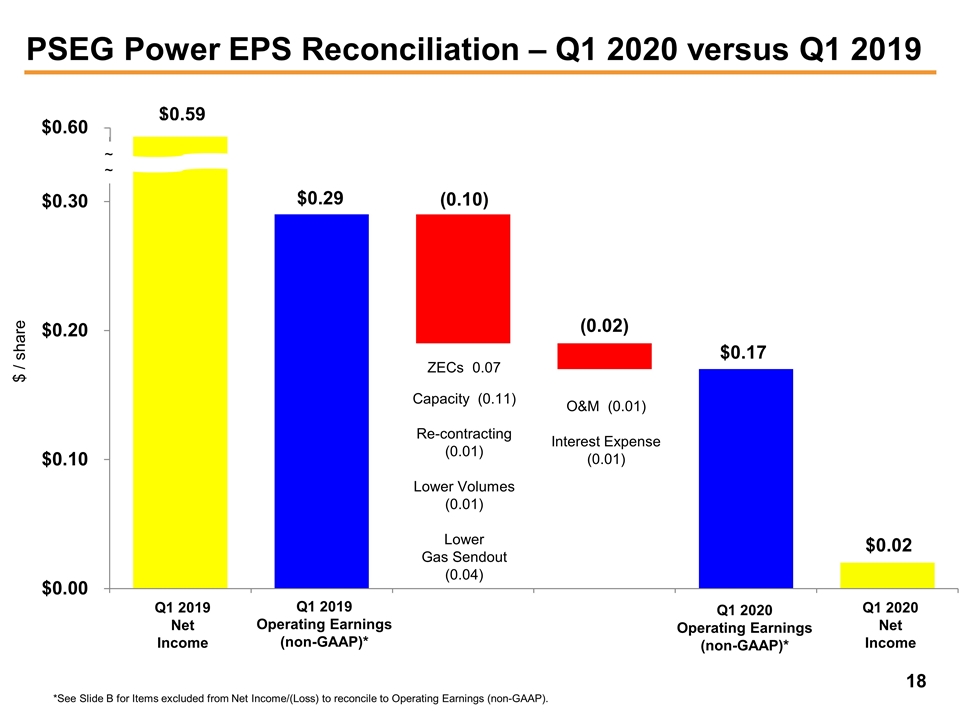
PSEG Power’s first quarter results were negatively affected by extremely mild winter weather conditions compared to first quarter 2019. A scheduled decline in PJM capacity revenue reduced non-GAAP Operating Earnings comparisons by $0.11 per share compared with Q1 2019. The addition of ZECs to first-quarter results added $0.07 per share. Lower generation output for the quarter reduced comparisons by $0.01 per share. Re-contracting reduced results by $0.01 per share, reflecting an approximate $1 per MWh decline in the average hedge price versus the year-ago quarter. The weather-related decline in total gas send-out to commercial and industrial customers reduced results by $0.04 per share. Higher O&M expense from an unplanned outage at Salem Unit 1 lowered results by $0.01 per share. Higher interest expense lowered comparisons by $0.01 per share versus the year-ago quarter.


4


Total generation output declined by 6.5% to total 13.2 TWh, reflecting the sale of the Keystone and Conemaugh units last fall. PSEG Power’s CCGT fleet produced 5.1 TWh of output, up 16%, reflecting the addition of Bridgeport Harbor 5 which was placed into operation in June 2019. The nuclear fleet operated at a capacity factor of 94.9% for the first quarter, producing 8 TWh representing 61% of total generation. Higher output from Hope Creek and Salem Unit 2 partly offset a month-long repair outage at Salem unit 1, resulting in a 2% decrease in nuclear output for the quarter.

PSEG Power continues to forecast output for 2020 of 50 - 52 TWh. For the remainder of 2020 Power has hedged approximately 95% - 100% of production at an average price of $36 per MWh. For 2021, Power has hedged 55% - 60% of forecast production of 50 – 52 TWh at an average price of $35 per MWh. Power is also forecasting output for 2022 of 50 – 52 TWh. Approximately 25% - 30% of Power’s output in 2022 is hedged at an average price of $35 per MWh.

The forecast of PSEG Power’s non-GAAP Operating Earnings for 2020 remains unchanged at $345 million - $435 million as does our estimate of non-GAAP Adjusted EBITDA of $950 million - $1,050 million. Adjusted EBITDA for Q1 2020 includes expenses of $35 million related to the purchase of NJ tax credits as part of the 2019 NJ Technology Tax Benefit Transfer Program. The benefit from the program’s tax credits is included in the income tax expense line item and more than offsets the expenses incurred for the purchase. The net benefit for the quarter is $5 million. There were no similar tax credit transactions in Q1 2019.

PSEG Enterprise/Other

PSEG Enterprise/Other reported a Net Loss of $5 million, $(0.01) per share, for the first quarter of 2020 compared to Net Income of $1 million, $0.00 per share, for the first quarter of 2019. The Net Loss for the first quarter of 2020 reflects higher interest and tax expenses at the Parent, partially offset by ongoing contributions from PSEG Long Island.

For 2020, the forecast for PSEG Enterprise/Other remains unchanged at a Net Loss of $5 million.

###

Public Service Enterprise Group Inc. (PSEG) (NYSE: PEG) is a publicly traded diversified energy company with approximately 13,000 employees. Headquartered in Newark, N.J., PSEG’s principal operating subsidiaries are: Public Service Electric and Gas Co. (PSE&G), PSEG Power and PSEG Long Island. PSEG is a Fortune 500 company included in the S&P 500 Index and has been named to the Dow Jones Sustainability Index for North America for 12 consecutive years (https://corporate.pseg.com).

Non-GAAP Financial Measures

Management uses non-GAAP Operating Earnings in its internal analysis, and in communications with investors and analysts, as a consistent measure for comparing PSEG’s financial performance to previous financial results. Non-GAAP Operating Earnings exclude the impact of returns (losses) associated with the Nuclear Decommissioning Trust (NDT), Mark-to-Market (MTM) accounting and material one-time items such as the revaluation of deferred tax liabilities.

Management believes the presentation of non-GAAP Adjusted EBITDA for PSEG Power is useful to investors and other users of our financial statements in evaluating operating performance because it provides them with an additional tool to compare business performance across companies and across periods. Management also believes that non-GAAP Adjusted EBITDA is widely used by investors to measure operating performance without regard to items such as income tax expense, interest expense and depreciation and amortization, which can vary substantially from company to company depending upon, among other things, the book value of assets, capital structure and whether assets were constructed or acquired. Non-GAAP Adjusted EBITDA also allows investors and other users to assess the underlying financial performance of our fleet before management’s


5


decision to deploy capital. Non-GAAP Adjusted EBITDA excludes the same items as our non-GAAP Operating Earnings measure as well as income tax expense, interest expense and depreciation and amortization.

See Attachments 7 and 8 for a complete list of items excluded from Net Income in the determination of non-GAAP Operating Earnings and non-GAAP Adjusted EBITDA. The presentation of non-GAAP Operating Earnings and non-GAAP Adjusted EBITDA is intended to complement, and should not be considered an alternative to the presentation of Net Income, which is an indicator of financial performance determined in accordance with GAAP. In addition, non-GAAP Operating Earnings and non-GAAP Adjusted EBITDA as presented in this release may not be comparable to similarly titled measures used by other companies.

Due to the forward looking nature of non-GAAP Operating Earnings and non-GAAP Adjusted EBITDA guidance, PSEG is unable to reconcile these non-GAAP financial measures to the most directly comparable GAAP financial measure. Management is unable to project certain reconciling items, in particular MTM and NDT gains (losses), for future periods due to market volatility.

Forward-Looking Statements

Certain of the matters discussed in this release about our and our subsidiaries’ future performance, including, without limitation, future revenues, earnings, strategies, prospects, consequences and all other statements that are not purely historical constitute “forward-looking statements” within the meaning of the Private Securities Litigation Reform Act of 1995. Such forward-looking statements are subject to risks and uncertainties, which could cause actual results to differ materially from those anticipated. Such statements are based on management’s beliefs as well as assumptions made by and information currently available to management. When used herein, the words “anticipate,” “intend,” “estimate,” “believe,” “expect,” “plan,” “should,” “hypothetical,” “potential,” “forecast,” “project,” variations of such words and similar expressions are intended to identify forward-looking statements. Factors that may cause actual results to differ are often presented with the forward-looking statements themselves. Other factors that could cause actual results to differ materially from those contemplated in any forward-looking statements made by us herein are discussed in filings we make with the United States Securities and Exchange Commission (SEC), including our Annual Report on Form 10-K and subsequent reports on Form 10-Q and Form 8-K. These factors include, but are not limited to:


fluctuations in wholesale power and natural gas markets, including the potential impacts on the economic viability of our generation units;


our ability to obtain adequate fuel supply;


market risks impacting the operation of our generating stations;


increases in competition in wholesale energy and capacity markets;


changes in technology related to energy generation, distribution and consumption and customer usage patterns;


economic downturns;


third-party credit risk relating to our sale of generation output and purchase of fuel;


adverse performance of our nuclear decommissioning and defined benefit plan trust fund investments and changes in funding requirements;


the impact of changes in state and federal legislation and regulations on our business, including PSE&G’s ability to recover costs and earn returns on authorized investments;


PSE&G’s proposed investment programs may not be fully approved by regulators and its capital investment may be lower than planned;


the impact on our New Jersey nuclear plants if such plants are not awarded Zero Emission Certificates (ZEC) in future periods, there is an adverse change in the amount of future ZEC payments, the ZEC program is overturned or modified through legal proceedings or if adverse changes are made to the capacity market construct;


adverse changes in energy industry laws, policies and regulations, including market structures and transmission planning;


the impact of state and federal actions aimed at combating climate change on our natural gas assets;


risks associated with our ownership and operation of nuclear facilities, including regulatory risks, such as compliance with the Atomic Energy Act and trade control, environmental and other regulations, as well as financial, environmental and health and safety risks;


changes in federal and state environmental regulations and enforcement;


delays in receipt of, or an inability to receive, necessary licenses and permits;


the impact of any future rate proceedings;


adverse outcomes of any legal, regulatory or other proceeding, settlement, investigation or claim applicable to us and/or the energy industry;


changes in tax laws and regulations;


the impact of our holding company structure on our ability to meet our corporate funding needs, service debt and pay dividends;


lack of growth or slower growth in the number of customers or changes in customer demand;


any inability of PSEG Power to meet its commitments under forward sale obligations;


reliance on transmission facilities that we do not own or control and the impact on our ability to maintain adequate transmission capacity;


any inability to successfully develop, obtain regulatory approval for, or construct generation, transmission and distribution projects;


any equipment failures, accidents, severe weather events or other incidents, including pandemics such as the ongoing coronavirus pandemic, that may impact our ability to provide safe and reliable service to our customers;


our inability to exercise control over the operations of generation facilities in which we do not maintain a controlling interest;


any inability to recover the carrying amount of our long-lived assets and leveraged leases;


6


any inability to maintain sufficient liquidity;


any inability to realize anticipated tax benefits or retain tax credits;


challenges associated with recruitment and/or retention of key executives and a qualified workforce;


the impact of our covenants in our debt instruments on our operations;


the impact of the ongoing coronavirus pandemic; and


the impact of acts of war, terrorism, cybersecurity attacks or intrusions.

All of the forward-looking statements made in this release are qualified by these cautionary statements and we cannot assure you that the results or developments anticipated by management will be realized or even if realized, will have the expected consequences to, or effects on, us or our business, prospects, financial condition, results of operations or cash flows. Readers are cautioned not to place undue reliance on these forward-looking statements in making any investment decision. Forward-looking statements made in this release apply only as of the date of this release. While we may elect to update forward-looking statements from time to time, we specifically disclaim any obligation to do so, even in light of new information or future events, unless otherwise required by applicable securities laws.

The forward-looking statements contained in this release are intended to qualify for the safe harbor provisions of Section 27A of the Securities Act of 1933, as amended, and Section 21E of the Securities Exchange Act of 1934, as amended.


From time to time, PSEG, PSE&G and PSEG Power release important information via postings on their corporate website at https://investor.pseg.com. Investors and other interested parties are encouraged to visit the corporate website to review new postings. The “Email Alerts” link at https://investor.pseg.com may be used to enroll to receive automatic email alerts regarding new postings.


7


Attachment 1

PUBLIC SERVICE ENTERPRISE GROUP INCORPORATED

Consolidating Statements of Operations

(Unaudited, $ millions, except per share data)


     Three Months Ended March 31, 2020  
     PSEG     PSEG Enterprise/
Other (a)
    PSE&G     PSEG
Power
 

OPERATING REVENUES

   $ 2,781     $ (322   $ 1,883     $ 1,220  

OPERATING EXPENSES


Energy Costs

     906       (478     708       676  

Operation and Maintenance

     754       127       386       241  

Depreciation and Amortization

     324       8       222       94  


Total Operating Expenses

     1,984       (343     1,316       1,011  

OPERATING INCOME

     797       21       567       209  

Income from Equity Method Investments

     3       —         —         3  

Net Gains (Losses) on Trust Investments

     (221     (1     —         (220

Other Income (Deductions)

     4       —         27       (23

Net Non-Operating Pension and OPEB Credits (Costs)

     62       3       51       8  

Interest Expense

     (153     (23     (96     (34


INCOME (LOSS) BEFORE INCOME TAXES

     492       —         549       (57

Income Tax Benefit (Expense)

     (44     (5     (109     70  


NET INCOME (LOSS)

   $ 448     $ (5   $ 440     $ 13  


Reconciling Items Excluded from Net Income (Loss) (b)

     72       —         —         72  


OPERATING EARNINGS (non-GAAP)

   $ 520     $ (5   $ 440     $ 85  


Earnings Per Share


NET INCOME (LOSS)

   $ 0.88     $ (0.01   $ 0.87     $ 0.02  


Reconciling Items Excluded from Net Income (Loss) (b)

     0.15       —         —         0.15  


OPERATING EARNINGS (non-GAAP)

   $ 1.03     $ (0.01   $ 0.87     $ 0.17  


     Three Months Ended March 31, 2019  
     PSEG     PSEG Enterprise/
Other (a)
    PSE&G     PSEG
Power
 

OPERATING REVENUES

   $ 2,980     $ (468   $ 2,032     $ 1,416  

OPERATING EXPENSES


Energy Costs

     1,124       (609     947       786  

Operation and Maintenance

     756       113       408       235  

Depreciation and Amortization

     314       8       212       94  


Total Operating Expenses

     2,194       (488     1,567       1,115  


OPERATING INCOME

     786       20       465       301  

Income from Equity Method Investments

     2       —         —         2  

Net Gains (Losses) on Trust Investments

     128       1       1       126  

Other Income (Deductions)

     33       1       19       13  

Net Non-Operating Pension and OPEB Credits (Costs)

     33       —         30       3  

Interest Expense

     (133     (21     (87     (25


INCOME BEFORE INCOME TAXES

     849       1       428       420  

Income Tax Expense

     (149     —         (25     (124


NET INCOME

   $ 700     $ 1     $ 403     $ 296  


Reconciling Items Excluded from Net Income (b)

     (153     —         —         (153


OPERATING EARNINGS (non-GAAP)

   $ 547     $ 1     $ 403     $ 143  


Earnings Per Share


NET INCOME

   $ 1.38     $ —       $ 0.79     $ 0.59  


Reconciling Items Excluded from Net Income(b)

     (0.30     —         —         (0.30


OPERATING EARNINGS (non-GAAP)

   $ 1.08     $ —       $ 0.79     $ 0.29  


(a)

Includes activities at Energy Holdings, PSEG Long Island and the Parent as well as intercompany eliminations.     

(b)

See Attachments 7 and 8 for details of items excluded from Net Income to compute Operating Earnings (non-GAAP).


Attachment 2

PUBLIC SERVICE ENTERPRISE GROUP INCORPORATED

Capitalization Schedule

(Unaudited, $ millions)


     March 31,
2020
    December 31,
2019
 

DEBT


Commercial Paper and Loans

   $ 1,062     $ 1,115  

Long-Term Debt*

     15,705       15,108  


Total Debt

     16,767       16,223  

STOCKHOLDERS’ EQUITY


Common Stock

     4,994       5,003  

Treasury Stock

     (868     (831

Retained Earnings

     11,604       11,406  

Accumulated Other Comprehensive Loss

     (481     (489


Total Stockholders’ Equity

     15,249       15,089  


Total Capitalization

   $ 32,016     $ 31,312  


*

Includes current portion of Long-Term Debt


Attachment 3

PUBLIC SERVICE ENTERPRISE GROUP INCORPORATED

CONDENSED CONSOLIDATED STATEMENTS OF CASH FLOWS

(Unaudited, $ millions)


     Three Months Ended March 31,  
     2020     2019  

CASH FLOWS FROM OPERATING ACTIVITIES


Net Income

   $ 448     $ 700  

Adjustments to Reconcile Net Income to Net Cash Flows From Operating Activities

     705       518  


NET CASH PROVIDED BY (USED IN) OPERATING ACTIVITIES

     1,153       1,218  


NET CASH PROVIDED BY (USED IN) INVESTING ACTIVITIES

     (724     (816


NET CASH PROVIDED BY (USED IN) FINANCING ACTIVITIES

     237       (505


Net Change in Cash, Cash Equivalents and Restricted Cash

     666       (103

Cash, Cash Equivalents and Restricted Cash at Beginning of Period

     176       199  


Cash, Cash Equivalents and Restricted Cash at End of Period

   $ 842     $ 96  


3


Attachment 4

PUBLIC SERVICE ELECTRIC & GAS COMPANY

Retail Sales

(Unaudited)

March 31, 2020

Electric Sales


     Three Months      Change vs.  

Sales (millions kWh)

   Ended      2019  

Residential

     2,877        (7 %) 

Commercial & Industrial

     6,464        (4 %) 

Other

     99        2


Total

     9,440        (5 %) 


Gas Sold and Transported


Sales (millions therms)*

   Three Months
Ended
     Change vs.
2019
 

Firm Sales


Residential Sales

     627        (17 %) 

Commercial & Industrial

     412        (18 %) 


Total Firm Sales

     1,039        (17 %) 


Non-Firm Sales


Commercial & Industrial

     193        (44 %) 


Total Non-Firm Sales

     193     


Total Sales

     1,232        (23 %) 


*

CSG rate included in non-firm sales


Weather Data


Degree Days - Actual

     2,077        (19 %) 

Degree Days - Normal

     2,552     


Attachment 5

PSEG POWER LLC

Generation Measures(1)

(Unaudited)


     GWhr Breakdown
Three Months Ended
March 31,
 
     2020     2019  

Nuclear - NJ

     5,102       5,309  

Nuclear - PA

     2,933       2,907  


Total Nuclear

     8,035       8,216  

Fossil - Natural Gas - NJ

     1,981       2,496  

Fossil - Natural Gas - NY

     1,023       909  

Fossil - Natural Gas - MD

     1,194       1,048  

Fossil - Natural Gas - CT

     952       (6


Total Natural Gas(2)

     5,150       4,447  

Fossil - Coal

     (7     1,431  


     13,178       14,094  


     % Generation by Fuel Type
Three Months Ended
March 31,
 
     2020     2019  

Nuclear - NJ

     39     38

Nuclear - PA

     22     20


Total Nuclear

     61     58

Fossil - Natural Gas - NJ

     15     18

Fossil - Natural Gas - NY

     8     7

Fossil - Natural Gas - MD

     9     7

Fossil - Natural Gas - CT

     7     0


Total Natural Gas(2)

     39     32

Fossil - Coal

     0     10


     100     100


(1) 

Excludes Solar, Kalaeloa and pumped storage.

(2) 

Includes several units that are dual fuel for oil.


Attachment 6

PUBLIC SERVICE ENTERPRISE GROUP INCORPORATED

Statistical Measures

(Unaudited)


     Three Months Ended March 31,  
     2020     2019  

Weighted Average Common Shares Outstanding (millions)


Basic

     504       504  

Diluted

     507       507  

Stock Price at End of Period

   $ 44.91     $ 59.41  

Dividends Paid per Share of Common Stock

   $ 0.49     $ 0.47  

Dividend Yield

     4.4     3.2

Book Value per Common Share

   $ 30.28     $ 29.41  

Market Price as a Percent of Book Value

     148     202


Attachment 7

PUBLIC SERVICE ENTERPRISE GROUP INCORPORATED

Consolidated Operating Earnings (non-GAAP) Reconciliation


Reconciling Items    Three Months Ended March 31,  
     2020     2019  
     ($ millions, Unaudited)  

Net Income

   $ 448     $ 700  

(Gain) Loss on Nuclear Decommissioning Trust (NDT) Fund Related Activity, pre-tax (PSEG Power)

     219       (127

(Gain) Loss on Mark-to-Market (MTM), pre-tax (a) (PSEG Power)

     (107     (106

Oil Lower of Cost or Market (LOCOM) adjustment, pre-tax (PSEG Power)

     20       —    

Income Taxes related to Operating Earnings (non-GAAP) reconciling items(b)

     (60     80  


Operating Earnings (non-GAAP)

   $ 520     $ 547  


PSEG Fully Diluted Average Shares Outstanding (in millions)

     507       507  
     ($ Per Share Impact -Diluted, Unaudited)  

Net Income

   $ 0.88     $ 1.38  

(Gain) Loss on NDT Fund Related Activity, pre-tax (PSEG Power)

     0.44       (0.25

(Gain) Loss on MTM, pre-tax (a) (PSEG Power)

     (0.21     (0.21

Oil LOCOM adjustment, pre-tax (PSEG Power)

     0.04       —    

Income Taxes related to Operating Earnings (non-GAAP) reconciling items(b)

     (0.12     0.16  


Operating Earnings (non-GAAP)

   $ 1.03     $ 1.08  


(a)

Includes the financial impact from positions with forward delivery months.

(b)

Income tax effect calculated at the statutory rate except for NDT related activity which is calculated at the statutory rate plus a 20% tax on income (losses) from qualified NDT funds.


Attachment 8

PSEG Power Operating Earnings (non-GAAP) and Adjusted EBITDA (non-GAAP) Reconciliation


Reconciling Items    Three Months Ended March 31,  
     2020     2019  
     ($ millions, Unaudited)  

Net Income

   $ 13     $ 296  

(Gain) Loss on NDT Fund Related Activity, pre-tax

     219       (127

(Gain) Loss on MTM, pre-tax (a)

     (107     (106

Oil LOCOM adjustment, pre-tax

     20       —    

Income Taxes related to Operating Earnings (non-GAAP) reconciling items(b)

     (60     80  


Operating Earnings (non-GAAP)

   $ 85     $ 143  

Depreciation and Amortization, pre-tax (c)

     93       93  

Interest Expense, pre-tax (c) (d)

     33       24  

Income Taxes (c)

     (10     44  


Adjusted EBITDA (non-GAAP)

   $ 201     $ 304  


PSEG Fully Diluted Average Shares Outstanding (in millions)

     507       507  


(a)

Includes the financial impact from positions with forward delivery months.

(b)

Income tax effect calculated at the statutory rate except for NDT related activity which is calculated at the statutory rate plus a 20% tax on income (losses) from qualified NDT funds.

(c)

Excludes amounts related to Operating Earnings (non-GAAP) reconciling items.

(d)

Net of capitalized interest.

Slide 1

Public Service Enterprise Group PSEG Earnings Conference Call 1st Quarter 2020 May 4, 2020 EXHIBIT 99.1


Slide 2

Certain of the matters discussed in this presentation about our and our subsidiaries’ future performance, including, without limitation, future revenues, earnings, strategies, prospects, consequences and all other statements that are not purely historical constitute “forward-looking statements” within the meaning of the Private Securities Litigation Reform Act of 1995. Such forward-looking statements are subject to risks and uncertainties, which could cause actual results to differ materially from those anticipated. Such statements are based on management’s beliefs as well as assumptions made by and information currently available to management. When used herein, the words “anticipate,” “intend,” “estimate,” “believe,” “expect,” “plan,” “should,” “hypothetical,” “potential,” “forecast,” “project,” variations of such words and similar expressions are intended to identify forward-looking statements. Factors that may cause actual results to differ are often presented with the forward-looking statements themselves. Other factors that could cause actual results to differ materially from those contemplated in any forward-looking statements made by us herein are discussed in filings we make with the United States Securities and Exchange Commission (SEC), including our Annual Report on Form 10-K and subsequent reports on Form 10-Q and Form 8-K. These factors include, but are not limited to: fluctuations in wholesale power and natural gas markets, including the potential impacts on the economic viability of our generation units; our ability to obtain adequate fuel supply; market risks impacting the operation of our generating stations; increases in competition in wholesale energy and capacity markets; changes in technology related to energy generation, distribution and consumption and customer usage patterns; economic downturns; third-party credit risk relating to our sale of generation output and purchase of fuel; adverse performance of our nuclear decommissioning and defined benefit plan trust fund investments and changes in funding requirements; the impact of changes in state and federal legislation and regulations on our business, including PSE&G’s ability to recover costs and earn returns on authorized investments; PSE&G’s proposed investment programs may not be fully approved by regulators and its capital investment may be lower than planned; the impact on our New Jersey nuclear plants if such plants are not awarded Zero Emission Certificates (ZEC) in future periods, there is an adverse change in the amount of future ZEC payments, the ZEC program is overturned or modified through legal proceedings or if adverse changes are made to the capacity market construct; adverse changes in energy industry laws, policies and regulations, including market structures and transmission planning; the impact of state and federal actions aimed at combating climate change on our natural gas assets; risks associated with our ownership and operation of nuclear facilities, including regulatory risks, such as compliance with the Atomic Energy Act and trade control, environmental and other regulations, as well as financial, environmental and health and safety risks; changes in federal and state environmental regulations and enforcement; delays in receipt of, or an inability to receive, necessary licenses and permits; the impact of any future rate proceedings; adverse outcomes of any legal, regulatory or other proceeding, settlement, investigation or claim applicable to us and/or the energy industry; changes in tax laws and regulations; the impact of our holding company structure on our ability to meet our corporate funding needs, service debt and pay dividends; lack of growth or slower growth in the number of customers or changes in customer demand; any inability of PSEG Power to meet its commitments under forward sale obligations; reliance on transmission facilities that we do not own or control and the impact on our ability to maintain adequate transmission capacity; any inability to successfully develop, obtain regulatory approval for, or construct generation, transmission and distribution projects; any equipment failures, accidents, severe weather events or other incidents, including pandemics such as the ongoing coronavirus pandemic, that may impact our ability to provide safe and reliable service to our customers; our inability to exercise control over the operations of generation facilities in which we do not maintain a controlling interest; any inability to recover the carrying amount of our long-lived assets and leveraged leases; any inability to maintain sufficient liquidity; any inability to realize anticipated tax benefits or retain tax credits; challenges associated with recruitment and/or retention of key executives and a qualified workforce; the impact of our covenants in our debt instruments on our operations; the impact of the ongoing coronavirus pandemic; and the impact of acts of war, terrorism, cybersecurity attacks or intrusions. All of the forward-looking statements made in this presentation are qualified by these cautionary statements and we cannot assure you that the results or developments anticipated by management will be realized or even if realized, will have the expected consequences to, or effects on, us or our business, prospects, financial condition, results of operations or cash flows. Readers are cautioned not to place undue reliance on these forward-looking statements in making any investment decision. Forward-looking statements made in this presentation apply only as of the date of this presentation. While we may elect to update forward-looking statements from time to time, we specifically disclaim any obligation to do so, even in light of new information or future events, unless otherwise required by applicable securities laws. The forward-looking statements contained in this presentation are intended to qualify for the safe harbor provisions of Section 27A of the Securities Act of 1933, as amended, and Section 21E of the Securities Exchange Act of 1934, as amended. Forward-Looking Statements


Slide 3

PSEG presents Operating Earnings and Adjusted Earnings Before Interest, Taxes, Depreciation and Amortization (EBITDA) in addition to its Net Income reported in accordance with accounting principles generally accepted in the United States (GAAP). Operating Earnings and Adjusted EBITDA are non-GAAP financial measures that differ from Net Income. Non-GAAP Operating Earnings exclude the impact of returns (losses) associated with the Nuclear Decommissioning Trust (NDT), Mark-to-Market (MTM) accounting and material one-time items. Non-GAAP Adjusted EBITDA excludes the same items as our non-GAAP Operating Earnings measure as well as income tax expense, interest expense and depreciation and amortization. The last two slides in this presentation (Slides A and B) include a list of items excluded from Net Income/(Loss) to reconcile to non-GAAP Operating Earnings and non-GAAP Adjusted EBITDA with a reference to those slides included on each of the slides where the non-GAAP information appears. Management uses non-GAAP Operating Earnings in its internal analysis, and in communications with investors and analysts, as a consistent measure for comparing PSEG’s financial performance to previous financial results. Management believes non-GAAP Adjusted EBITDA is useful to investors and other users of our financial statements in evaluating operating performance because it provides them with an additional tool to compare business performance across companies and across periods. Management also believes that non-GAAP Adjusted EBITDA is widely used by investors to measure operating performance without regard to items such as income tax expense, interest expense and depreciation and amortization, which can vary substantially from company to company depending upon, among other things, the book value of assets, capital structure and whether assets were constructed or acquired. Non-GAAP Adjusted EBITDA also allows investors and other users to assess the underlying financial performance of our fleet before management’s decision to deploy capital. The presentation of non-GAAP Operating Earnings and non-GAAP Adjusted EBITDA is intended to complement, and should not be considered an alternative to, the presentation of Net Income/(Loss), which is an indicator of financial performance determined in accordance with GAAP. In addition, non-GAAP Operating Earnings and non-GAAP Adjusted EBITDA as presented in this release may not be comparable to similarly titled measures used by other companies. Due to the forward looking nature of non-GAAP Operating Earnings and non-GAAP Adjusted EBITDA guidance, PSEG is unable to reconcile these non-GAAP financial measures to the most directly comparable GAAP financial measure. Management is unable to project certain reconciling items, in particular MTM and NDT gains (losses), for future periods due to market volatility. GAAP Disclaimer These materials and other financial releases can be found on the PSEG website at https://investor.pseg.com. From time to time, PSEG, PSE&G and PSEG Power release important information via postings on their corporate website at https://investor.pseg.com. Investors and other interested parties are encouraged to visit the corporate website to review new postings. The “Email Alerts” link at https://investor.pseg.com may be used to enroll to receive automatic email alerts regarding new postings.


Slide 4

PSEG Q1 2020 Review Ralph Izzo Chairman, President and Chief Executive Officer


Slide 5

PSEG Q1 2020 First Quarter Highlights Net Income per share of $0.88 in Q1 2020 vs. $1.38 in Q1 2019 Non-GAAP Operating Earnings* per share of $1.03 in Q1 2020 vs. $1.08 in Q1 2019 PSE&G results benefited from ongoing investment in utility infrastructure PSEG Power results impacted by lower capacity revenues, unfavorable weather and a Salem 1 outage, partly offset by Zero Emission Certificate (ZEC) revenues Operational Excellence Prioritizing safe and reliable operations across PSE&G, PSEG Power and PSEG LI with updated screening procedures to ensure customer and employee health and safety Nuclear operations achieved a capacity factor of 95% in the first quarter Disciplined Capital Investment PSEG to invest $2.9 billion in 2020: $2.7 billion at PSE&G comprised primarily of reliability investments in Transmission and Distribution including the second phases of Energy Strong and the GSMP Procedural schedules set for $1 billion of Clean Energy Future (CEF) filings: $0.6 billion CEF– Energy Cloud – Automated Metering Infrastructure (EC/AMI), $0.3 billion CEF – Electric Vehicles (EVs) and $0.1 billion CEF – Energy Storage (ES) NJ Board of Public Utilities (NJBPU) schedule of CEF – Energy Efficiency (EE) decision in September 2020; Investment in existing programs extended by $111 million GSMP=Gas System Modernization Program *See Slides A and B for Items excluded from Net Income/(Loss) to reconcile to Operating Earnings (non-GAAP).


Slide 6

PSEG Resiliency: COVID-19 Response PSEG Response to COVID-19 Work continues in NJ with capital plan largely intact, given essential nature of businesses Activated pandemic response plan and senior-level, cross-functional team; dedicated workforce maintaining high service quality during recent storms Voluntarily suspended shut-offs of electric and gas service to residential customers for non-payment Donated 50,000 N95 masks to NJ’s largest healthcare system and 200,000 pairs of gloves to NJ health care organizations in need PSEG Foundation announced commitment of $2.5 million to regional food banks, medical and community organizations, including a $1 million donation to the NJ Pandemic Relief Fund PSE&G and PSEG-LI assisting with electricity provisioning for emergency medical facilities construction PSEG Operations Employees operating effectively with latest COVID-19 health and safety protocols; PPE for all field associates Construction crews continuing work on essential projects to replace and upgrade critical energy infrastructure Salem 2 nuclear refueling outage on schedule; de-scoped non-critical work Most customer service associates converted to home-based communications; improvements seen in response times and customer satisfaction PSE&G temporarily suspended certain non-critical repair work inside customer homes and businesses Annual Meeting of Stockholders held as a virtual meeting only and broadcast on website


Slide 7

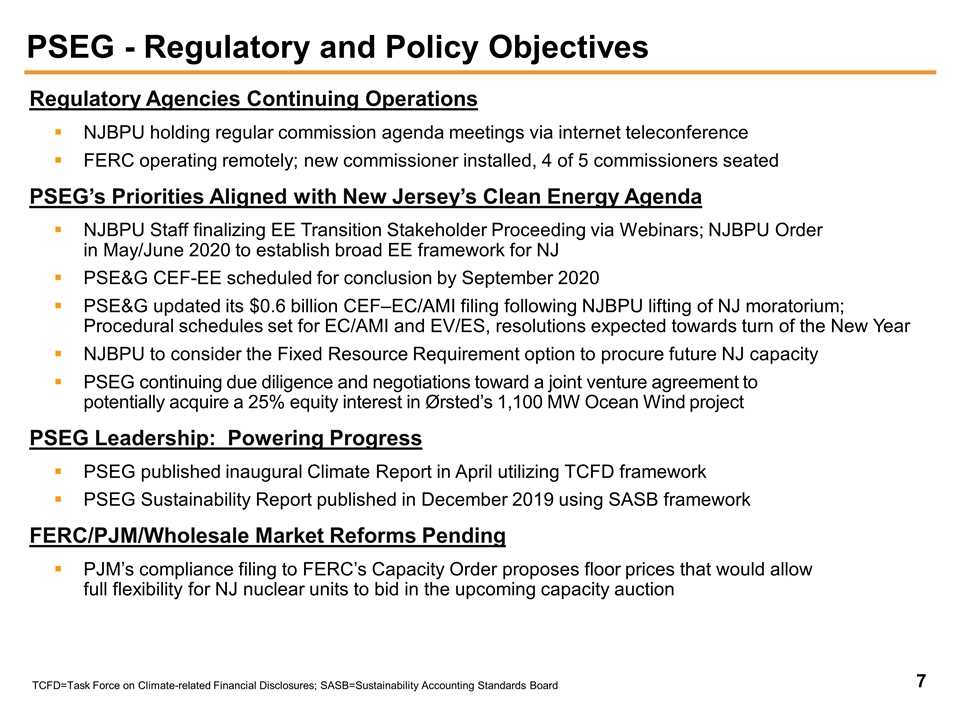
PSEG - Regulatory and Policy Objectives Regulatory Agencies Continuing Operations NJBPU holding regular commission agenda meetings via internet teleconference FERC operating remotely; new commissioner installed, 4 of 5 commissioners seated PSEG’s Priorities Aligned with New Jersey’s Clean Energy Agenda NJBPU Staff finalizing EE Transition Stakeholder Proceeding via Webinars; NJBPU Order in May/June 2020 to establish broad EE framework for NJ PSE&G CEF-EE scheduled for conclusion by September 2020 PSE&G updated its $0.6 billion CEF–EC/AMI filing following NJBPU lifting of NJ moratorium; Procedural schedules set for EC/AMI and EV/ES, resolutions expected towards turn of the New Year NJBPU to consider the Fixed Resource Requirement option to procure future NJ capacity PSEG continuing due diligence and negotiations toward a joint venture agreement to potentially acquire a 25% equity interest in Ørsted’s 1,100 MW Ocean Wind project PSEG Leadership: Powering Progress PSEG published inaugural Climate Report in April utilizing TCFD framework PSEG Sustainability Report published in December 2019 using SASB framework FERC/PJM/Wholesale Market Reforms Pending PJM’s compliance filing to FERC’s Capacity Order proposes floor prices that would allow full flexibility for NJ nuclear units to bid in the upcoming capacity auction TCFD=Task Force on Climate-related Financial Disclosures; SASB=Sustainability Accounting Standards Board


Slide 8

Drivers in 2020 include rate base growth, Q1 weather headwinds, potential margin impacts of COVID-19 on sales and load, and cost control Non-GAAP Operating Earnings* Contribution by Subsidiary 2019 Actual and 2020E Guidance *See Slides A and B for Items excluded from Net Income/(Loss) to reconcile to Operating Earnings (non-GAAP). **Based on the mid-point of 2020 non-GAAP Operating Earnings guidance of $3.30 - $3.50 per share. E = Estimate. $3.30 - $3.50E PSEG – Re-affirming 2020 Guidance


Slide 9

PSEG Q1 2020 Operating Company Review Dan Cregg EVP and Chief Financial Officer


Slide 10

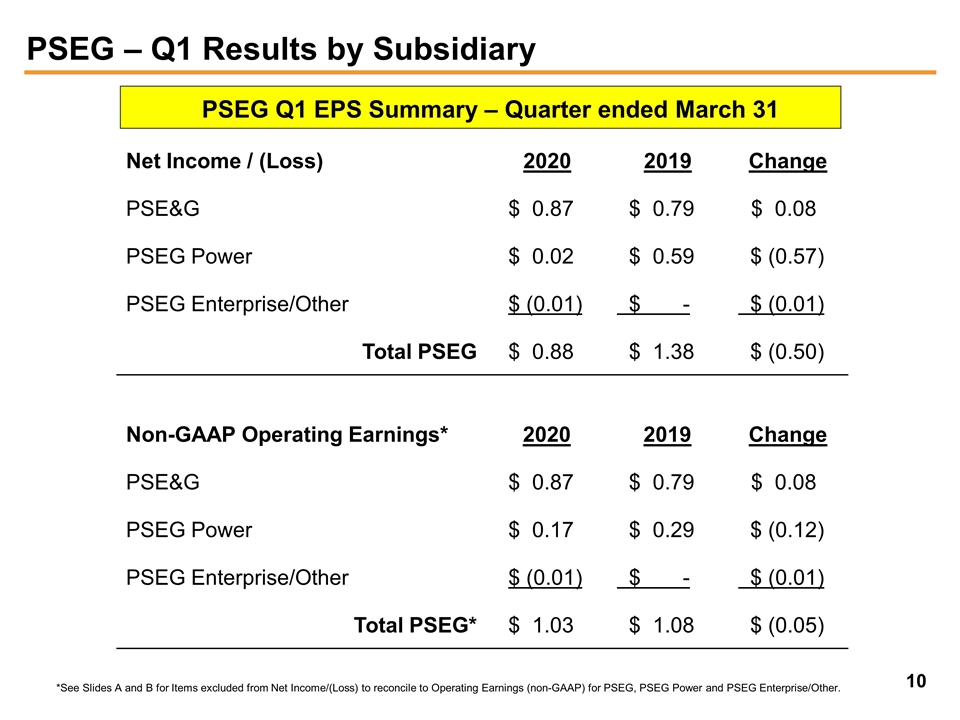
PSEG – Q1 Results by Subsidiary Net Income / (Loss) 2020 2019 Change PSE&G $ 0.87 $ 0.79 $ 0.08 PSEG Power $ 0.02 $ 0.59 $ (0.57) PSEG Enterprise/Other $ (0.01) $ - $ (0.01) Total PSEG $ 0.88 $ 1.38 $ (0.50) Non-GAAP Operating Earnings* 2020 2019 Change PSE&G $ 0.87 $ 0.79 $ 0.08 PSEG Power $ 0.17 $ 0.29 $ (0.12) PSEG Enterprise/Other $ (0.01) $ - $ (0.01) Total PSEG* $ 1.03 $ 1.08 $ (0.05) *See Slides A and B for Items excluded from Net Income/(Loss) to reconcile to Operating Earnings (non-GAAP) for PSEG, PSEG Power and PSEG Enterprise/Other. PSEG Q1 EPS Summary – Quarter ended March 31


Slide 11

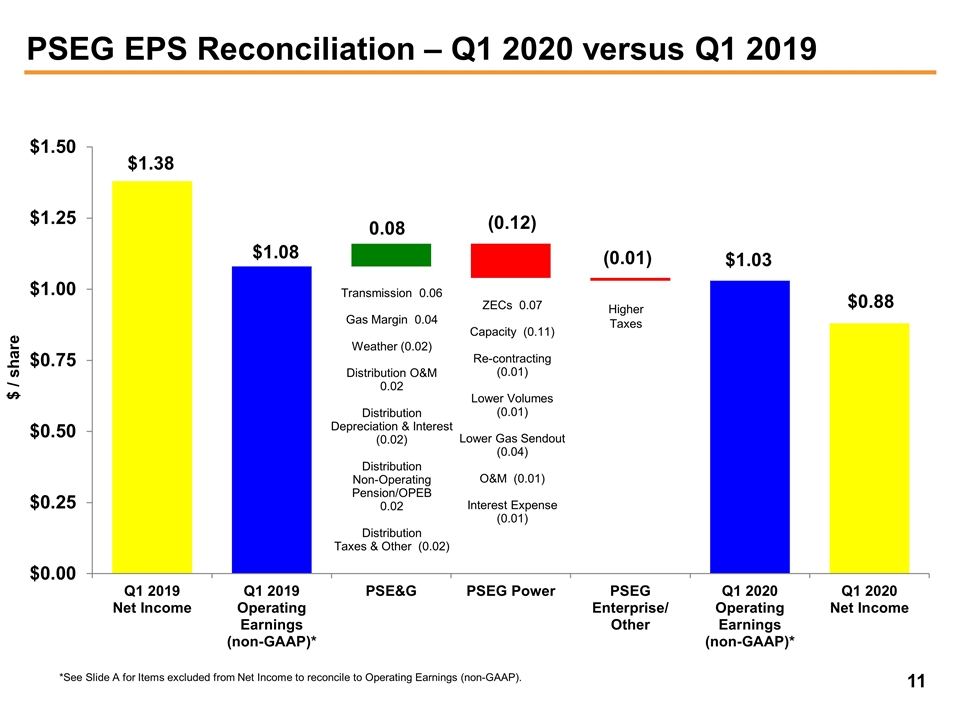
$ / share PSEG EPS Reconciliation – Q1 2020 versus Q1 2019 ZECs 0.07 Capacity (0.11) Re-contracting (0.01) Lower Volumes (0.01) Lower Gas Sendout (0.04) O&M (0.01) Interest Expense (0.01) Transmission 0.06 Gas Margin 0.04 Weather (0.02) Distribution O&M 0.02 Distribution Depreciation & Interest (0.02) Distribution Non-Operating Pension/OPEB 0.02 Distribution Taxes & Other (0.02) Higher Taxes *See Slide A for Items excluded from Net Income to reconcile to Operating Earnings (non-GAAP).


Slide 12

PSE&G Q1 2020 Review


Slide 13

$ / share PSE&G EPS Reconciliation – Q1 2020versus Q1 2019 Transmission 0.06 Gas Margin 0.04 Weather (0.02) Distribution O&M 0.02 Distribution Depreciation & Interest (0.02) Distribution Non-Operating Pension/OPEB 0.02 Distribution Taxes & Other (0.02)


Slide 14

PSE&G – Q1 Weather Summary Q1 2020 vs. Q1 2019 vs. Normal Monthly Heating Degree Days (HDD) Q1 2020 winter weather, as defined by heating degree days, was ~19% warmer than Q1 2019 and ~19% warmer than normal Heating Degree Days


Slide 15

PSE&G T&D Margin Allocation Note: Distribution Margin is Weather Normalized and Comprised of Fixed (Flat Monthly Service Charge) + Variable Volume (Residential, Electric Small Commercial & Industrial, Gas C&I) + Peak Demand (Electric C&I, Large Gas C&I). E=ESTIMATE Transmission and Residential segments of Distribution expected to contribute 75% of total PSE&G margin Transmission is fixed with no variable/ volume risk Distribution margin is ~60% Residential Significant portion of remaining margin comprised of fixed versus variable Near-term COVID-19 Distribution impacts expected to ↑ Residential margins and ↓ C&I margins Variable margin is lowest during the current shoulder season period Electric bad debt expense recovered through the societal benefits clause Weather normalization clause for Gas Distribution PSE&G 2020E Margin Illustration


Slide 16

PSE&G – Q1 Highlights New FERC formula rate implemented January 1 Procedural schedules for CEF-EC/AMI and CEF-EV/ES set; resolutions expected towards turn of the New Year FERC’s NOPR on transmission incentives supports continued incentives for projects and an expanded incentive for participation in regional transmission organizations Operations Regulatory and Market Environment PSE&G invested ~$0.6 billion in Q1, on track to spend $2.7 billion in 2020 on reliability investments in T&D PSE&G’s Q1 2020 earnings increased by $0.08 per share, or ~10%, over Q1 2019 PSE&G issued $300 million of 10-yr MTNs at 2.45% and $300 million of 30-yr MTNs at 3.15% PSE&G 2020 earnings guidance re-affirmed at $1,310 million to $1,370 million Financial For the trailing 12 months ended March 31, weather-normalized electric and gas sales were each ~1% lower Residential customer growth continues to be just under 1% per year PSE&G temporarily suspended certain non-critical repair work inside customer homes and businesses NOPR=Notice of Proposed Rulemaking; MTN=Medium-Term Note


Slide 17

PSEG Power Q1 2020 Review


Slide 18

PSEG Power EPS Reconciliation – Q1 2020 versus Q1 2019 Q1 2019 Net Income Q1 2019 Operating Earnings (non-GAAP)* Q1 2020 Net Income Q1 2020 Operating Earnings (non-GAAP)* ZECs 0.07 Capacity (0.11) Re-contracting (0.01) Lower Volumes (0.01) Lower Gas Sendout (0.04) O&M (0.01) Interest Expense (0.01) *See Slide B for Items excluded from Net Income/(Loss) to reconcile to Operating Earnings (non-GAAP). $ / share $0.60


Slide 19

PSEG Power – Q1 Generation Measures Total Nuclear Total Coal**** Natural Gas & Oil *Excludes Solar, Kalaeloa and pumped storage. **Excludes peaking and steam generation. ***Includes Oil Fuel Costs of $4 million and $1 million in 2019 and 2020, respectively. ****PSEG Power completed the sale of its ownership interests in Keystone and Conemaugh generation, labeled as PA Coal in the Capacity Factor table, in September 2019. PSEG Power – Generation (GWh)* 14,094 13,178 PSEG Power – Capacity Factors (%)* Quarter ended March 31 ($ millions) 2019 2020 Gas*** $ 157 $ 103 Coal 32 - Total Fossil 189 103 Nuclear 47 47 Total Fuel Cost $ 236 $ 150 Total Generation (GWh)* 14,094 13,178 $ / MWh 16.74 11.38 PSEG Power – Fuel Costs* Quarter ended March 31 2019 2020 Combined Cycle** 43.5% 44.9% Coal PA 82.0% N/A CT 8.0% 0.0% Nuclear 98.0% 94.9% (7)


Slide 20

PSEG Power – Gross Margin Performance ZEC revenue earned for full first quarter, slightly impacted by Salem 1 outage Lower PJM capacity prices vs Q1 2019; Lower ISO-NE capacity prices partly offset by addition of BH5 Sale of Keystone and Conemaugh in prior year reduced capacity revenue and volumes Q1 2020 was significantly warmer than Q1 2019; heating degree days lower by ~19% Regional Performance Region Q1 Gross Margin ($M) Q1 2020 Performance PJM $347 Lower capacity revenues, re-contracting at lower market prices, lower volumes from sale of Keystone and Conemaugh, lower demand due to weather and weaker spark spreads and slightly improved basis partially offset by ZEC revenues New England $42 Lower market prices partially offset by higher volume from new CCGT generation New York $8 Lower market prices partially offset by higher demand PSEG Power Gross Margin ($/MWh) Quarter ended March 31


Slide 21

Hedging Update Contracted Energy* *Volumes reflect management’s view of hedge percentages and prices as of March 31, 2020 and reflect revenues of full requirement load deals based on contract price including renewable energy credits, ancillary and transmission components but excluding capacity. Hedges include positions with MTM accounting treatment and options. Apr - Dec 2020 2021 2022 Nuclear Volume TWh 22 31 30 % Hedged 100% 95-100% 40-45% Price $/MWh $36 $35 $35 Combined Cycle Volume TWh 15-17 19-21 20-22 % Hedged 90-95% 0% 0% Price $/MWh $36 $ - $ - Total Volume TWh 37-39 50-52 50-52 % Hedged 95-100% 55-60% 25-30% Price $/MWh $36 $35 $35


Slide 22

PSEG Power – Q1 Highlights Q1 total output down 6% vs Q1 2019 primarily due to sale of Keystone and Conemaugh Nuclear fleet achieved a capacity factor of 95% in Q1, producing 8.0 TWh; nuclear output down 2% vs Q1 2019 due to Salem 1 outage CCGT fleet capacity factor of 45% in Q1, producing 5.1 TWh; new units operated at average capacity factor of 81% Operations Regulatory and Market Environment Financial NJ nuclear units retain full flexibility to bid into the upcoming capacity auction based on proposed PJM compliance filing floor prices New Jersey re-joined the Regional Greenhouse Gas Initiative effective January 1, 2020; Affected generating units must purchase one allowance for every ton of CO2 emitted PSEG Power agreed to sell its ownership interests in Yards Creek pumped storage generation facility; anticipated to close second half of 2020 PSEG Power’s total debt as a percentage of capitalization was 32% at March 31 PSEG Power retired $406 million of Senior Notes at maturity on April 15 PSEG Power’s 2020 guidance for non-GAAP Operating Earnings re-affirmed at $345 million to $435 million; non-GAAP Adjusted EBITDA guidance re-affirmed at $950 million to $1,050 million* *Adjusted EBITDA for Q1 2020 includes pre-tax expenses of $35 million related to the purchase of NJ tax credits as part of the 2019 NJ Technology Tax Benefit Transfer Program. The benefit from the program's tax credits is included in the income tax expense line item and more than offsets the expenses incurred for the purchase. The net benefit for the quarter is $5 million. There were no similar tax credit transactions in Q1 2019.


Slide 23

PSEG


Slide 24

PSEG Financial Highlights Re-affirming 2020 non-GAAP Operating Earnings guidance of $3.30 - $3.50 per share reflecting rate base growth; Q1 weather headwinds; potential margin impacts of COVID-19 on sales and load; and cost control Business mix anticipates PSE&G contribution approaches 80% of Operating Earnings in 2020 PSEG’s 5-year capital spending forecast of $12 billion - $16 billion, with over 90% directed at PSE&G, expected to produce 6.5% - 8% compound annual growth in rate base over 2020 - 2024 Over 70% of PSEG Power’s 2020 gross margin secured via energy hedges, capacity revenues, ZECs and ancillary services payments Increased 2020 indicative annual common dividend by $0.08 to $1.96 per share Financial position remains strong: Cash from PSEG Power and increasing cash from operations at PSE&G fund 2020 - 2024 capital spending program and support opportunity for dividend growth without the need to issue equity PSEG debt as a percentage of capitalization was 52% at March 31 PSEG entered into three 364-day term loan agreements in March and April totaling $800 million PSEG, PSEG Power and PSE&G extended $4 billion of credit facilities through March 2024 PSEG credit measures remain solid


Slide 25

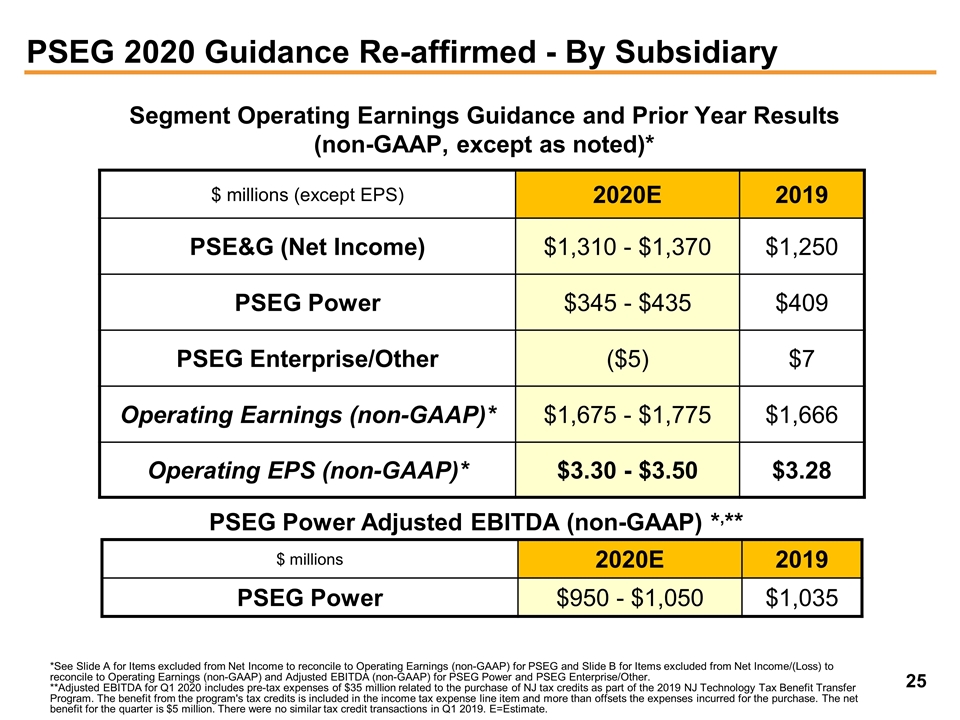
PSEG 2020 Guidance Re-affirmed - By Subsidiary $ millions (except EPS) 2020E 2019 PSE&G (Net Income) $1,310 - $1,370 $1,250 PSEG Power $345 - $435 $409 PSEG Enterprise/Other ($5) $7 Operating Earnings (non-GAAP)* $1,675 - $1,775 $1,666 Operating EPS (non-GAAP)* $3.30 - $3.50 $3.28 Segment Operating Earnings Guidance and Prior Year Results (non-GAAP, except as noted)* $ millions 2020E 2019 PSEG Power $950 - $1,050 $1,035 PSEG Power Adjusted EBITDA (non-GAAP) *,** *See Slide A for Items excluded from Net Income to reconcile to Operating Earnings (non-GAAP) for PSEG and Slide B for Items excluded from Net Income/(Loss) to reconcile to Operating Earnings (non-GAAP) and Adjusted EBITDA (non-GAAP) for PSEG Power and PSEG Enterprise/Other. **Adjusted EBITDA for Q1 2020 includes pre-tax expenses of $35 million related to the purchase of NJ tax credits as part of the 2019 NJ Technology Tax Benefit Transfer Program. The benefit from the program's tax credits is included in the income tax expense line item and more than offsets the expenses incurred for the purchase. The net benefit for the quarter is $5 million. There were no similar tax credit transactions in Q1 2019. E=Estimate.


Slide 26

PSEG Liquidity as of March 31, 2020


Slide 27

Reconciliation of Non-GAAP Operating Earnings Please see Slide 3 for an explanation of PSEG’s use of Operating Earnings as a non-GAAP financial measure and how it differs from Net Income. Includes the financial impact from positions with forward delivery months. Income tax effect calculated at the statutory rate except for lease related activity which is calculated at a combined leveraged lease effective tax rate and NDT related activity which is calculated at the statutory rate plus a 20% tax on income (losses) from qualified NDT funds. A 2020 2019 2019 Net Income 448 $ 700 $ 1,693 $ (Gain) Loss on Nuclear Decommissioning Trust (NDT) Fund Related Activity, pre-tax (PSEG Power) 219 (127) (255) (Gain) Loss on Mark-to-Market (MTM), pre-tax (a) (PSEG Power) (107) (106) (285) Plant Retirements and Dispositions, pre-tax (PSEG Power) - - 402 Lease Related Activity, pre-tax (PSEG Enterprise/Other) - - 58 Goodwill Impairment, pre-tax (PSEG Power) - - 16 Oil Lower of Cost or Market (LOCOM) adjustment, pre-tax (PSEG Power) 20 - - Income Taxes related to Operating Earnings (non-GAAP) reconciling items (b) (60) 80 37 Operating Earnings (non-GAAP) 520 $ 547 $ 1,666 $ PSEG Fully Diluted Average Shares Outstanding (in millions) 507 507 507 Net Income 0.88 $ 1.38 $ 3.33 $ (Gain) Loss on NDT Fund Related Activity, pre-tax (PSEG Power) 0.44 (0.25) (0.50) (Gain) Loss on MTM, pre-tax (a) (PSEG Power) (0.21) (0.21) (0.56) Plant Retirements and Dispositions, pre-tax (PSEG Power) - - 0.79 Lease Related Activity, pre-tax (PSEG Enterprise/Other) - - 0.11 Goodwill Impairment, pre-tax (PSEG Power) - - 0.03 Oil LOCOM adjustment, pre-tax (PSEG Power) 0.04 - - Income Taxes related to Operating Earnings (non-GAAP) reconciling items (b) (0.12) 0.16 0.08 Operating Earnings (non-GAAP) 1.03 $ 1.08 $ 3.28 $ PUBLIC SERVICE ENTERPRISE GROUP INCORPORATED Consolidated Operating Earnings (non-GAAP) Reconciliation Reconciling Items Three Months Ended Year Ended ($ millions, Unaudited) ($ Per Share Impact - Diluted, Unaudited) March 31, December 31,


Slide 28

Reconciliation of Non-GAAP Operating Earnings and Non-GAAP Adjusted EBITDA Please see Slide 3 for an explanation of PSEG’s use of Operating Earnings and Adjusted EBITDA as non-GAAP financial measures and how they differ from Net Income/(Loss). Includes the financial impact from positions with forward delivery months. Income tax effect calculated at the statutory rate except for NDT related activity which is calculated at the statutory rate plus a 20% tax on income (losses) from qualified NDT funds. Excludes amounts related to Operating Earnings (non-GAAP) reconciling items. Net of capitalized interest. B Income tax effect calculated at a combined leveraged lease effective tax rate.