EXHIBIT 99
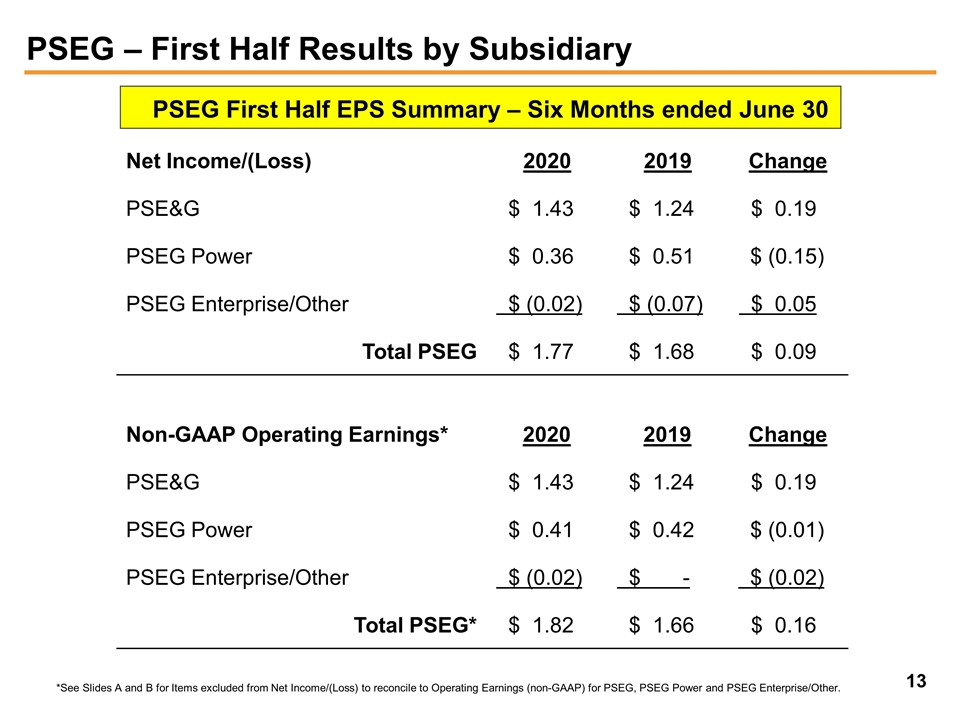
| Investor Relations | Public Service Enterprise Group 80 Park Plaza, T4 Newark, NJ 07102 |

|
| CONTACT: | ||||
| Investor Relations | Media Relations | |||
| [email protected] | [email protected] | |||
| 973-430-6565 | 973-430-6564 |
PSEG ANNOUNCES 2020 SECOND QUARTER RESULTS
$0.89 PER SHARE OF NET INCOME
NON-GAAP OPERATING EARNINGS OF $0.79 PER SHARE
Re-Affirms Non-GAAP Operating Earnings Guidance at $3.30 - $3.50 Per Share
Exploring Strategic Alternatives for PSEG Power’s Non-Nuclear Fleet
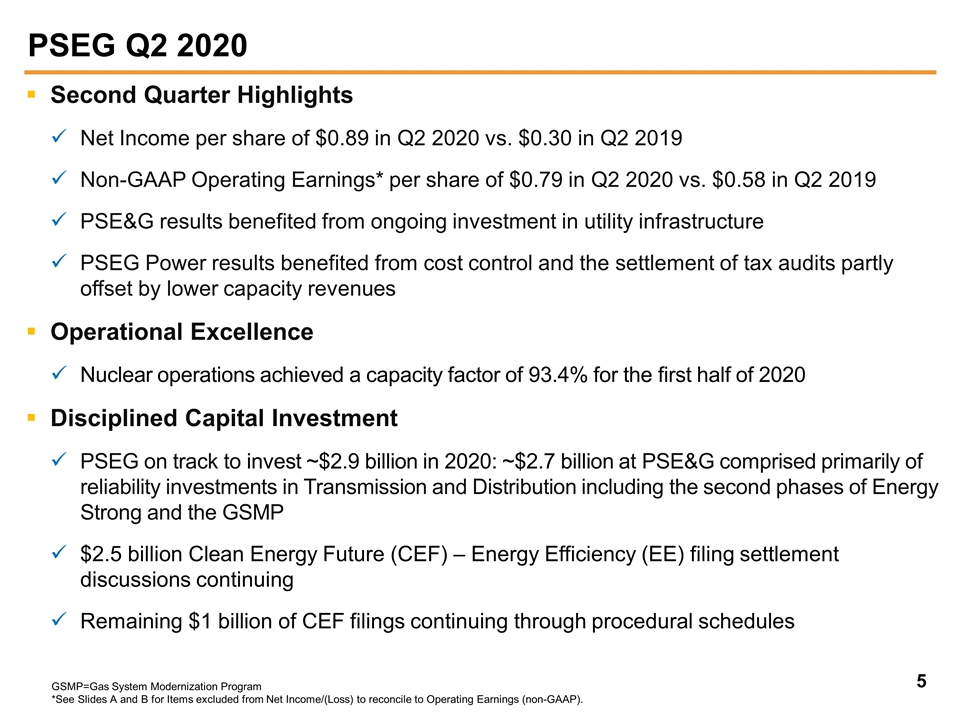
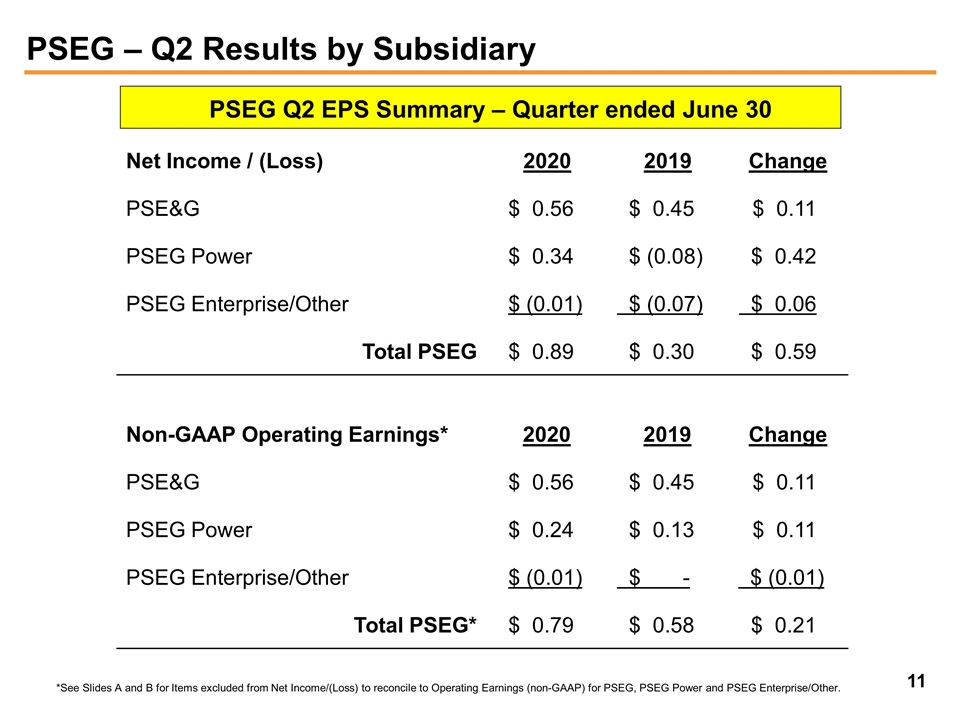
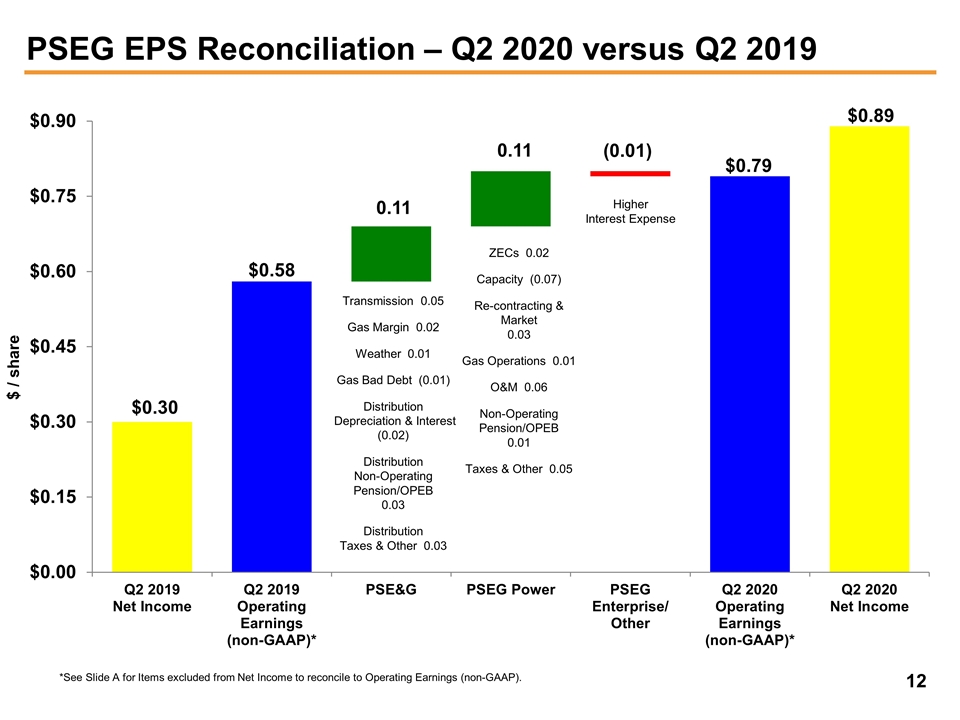
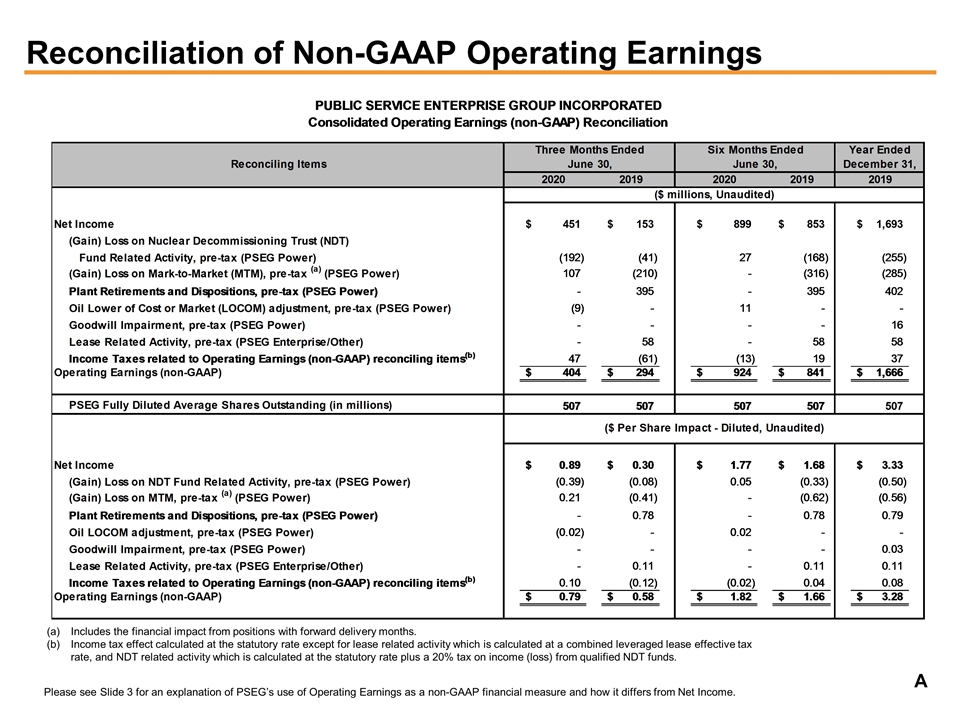
(July 31, 2020 – Newark, NJ) Public Service Enterprise Group (NYSE: PEG) reported Net Income for the second quarter of 2020 of $451 million, or $0.89 per share, compared to Net Income of $153 million, or $0.30 per share, in the second quarter of 2019. Non-GAAP Operating Earnings for the second quarter of 2020 were $404 million, or $0.79 per share, compared to non-GAAP Operating Earnings for the second quarter of 2019 of $294 million, or $0.58 per share. Non-GAAP results for the second quarter exclude items shown in Attachments 8 and 9.
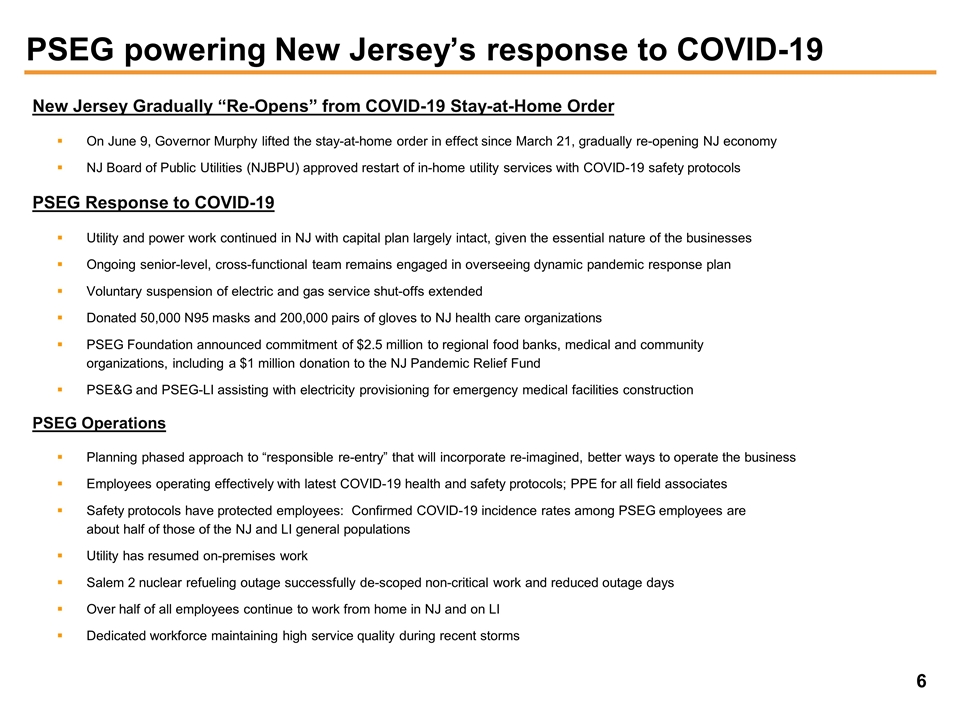
Ralph Izzo, chairman, president and chief executive officer commented, “We are pleased to report solid operating and financial results at both businesses. Our employees continue to effectively respond to the challenges and requirements of providing essential utility and power services under extraordinary conditions. The state-wide, mandated closure of most businesses, schools and government buildings contributed to a decline of approximately 7% in weather normalized electric sales for the second quarter. New Jersey continues to gradually re-open businesses and activities, and effective containment of COVID-19 should expand commercial activity, and energy usage, in the months ahead. Our utility field crews are at full force and construction work continues on pace to meet our capital expenditure targets on our reliability, resiliency and infrastructure programs. In May, PSE&G also resumed on-premises customer work using personal protective equipment, customer contact screening, and physical distancing to ensure customer and employee safety. Our associates who are able to work remotely continue to do so, and we are continuing to assess when we will begin a phased return to work.”
The following table provides a reconciliation of PSEG’s Net Income to non-GAAP Operating Earnings for the second quarter. See Attachments 8 and 9 for a complete list of items excluded from Net Income in the determination of non-GAAP Operating Earnings.
1
PSEG CONSOLIDATED RESULTS (unaudited)
Second Quarter Comparative Results
2020 and 2019
| Income ($ millions) |
Diluted Earnings Per Share |
|||||||||||||||
| 2020 | 2019 | 2020 | 2019 | |||||||||||||
| Net Income |
$ | 451 | $ | 153 | $ | 0.89 | $ | 0.30 | ||||||||
| Reconciling Items |
(47 | ) | 141 | (0.10 | ) | 0.28 | ||||||||||
|
|
|
|
|
|
|
|
|
|||||||||
| Non-GAAP Operating Earnings |
$ | 404 | $ | 294 | $ | 0.79 | $ | 0.58 | ||||||||
|
|
|
|
|
|
|
|
|
|||||||||
| Avg. Shares | 507M | 507M | ||||||||||||||
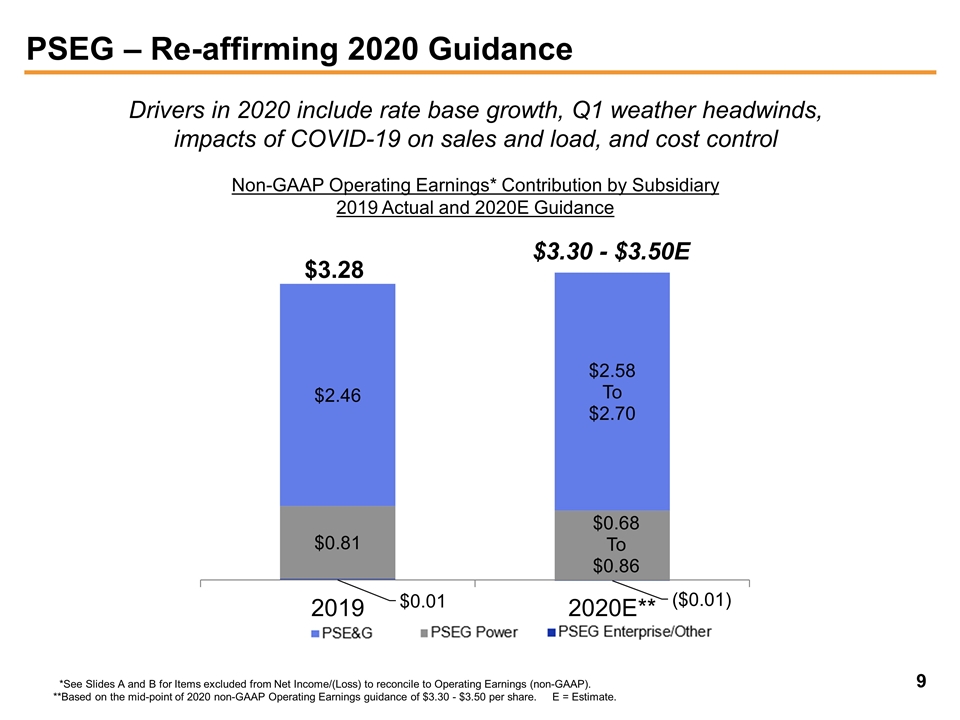
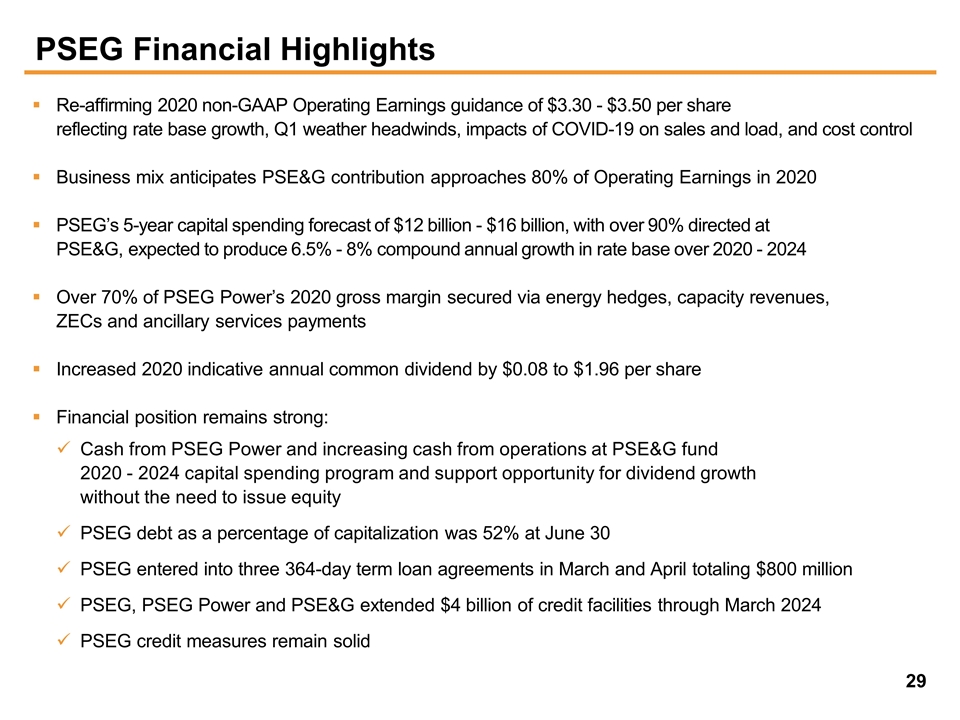
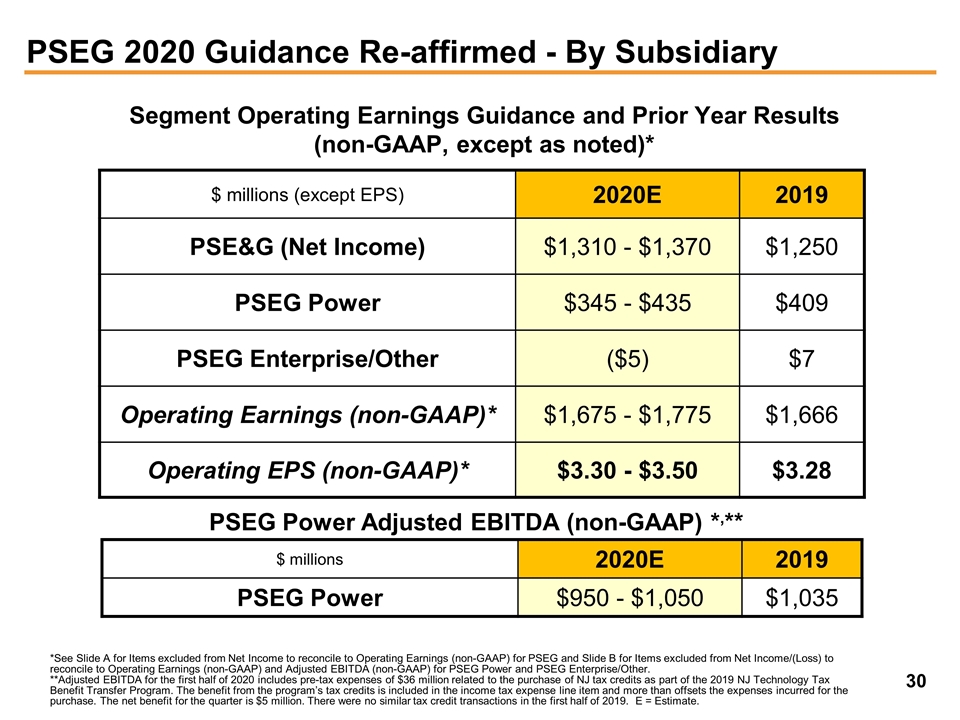
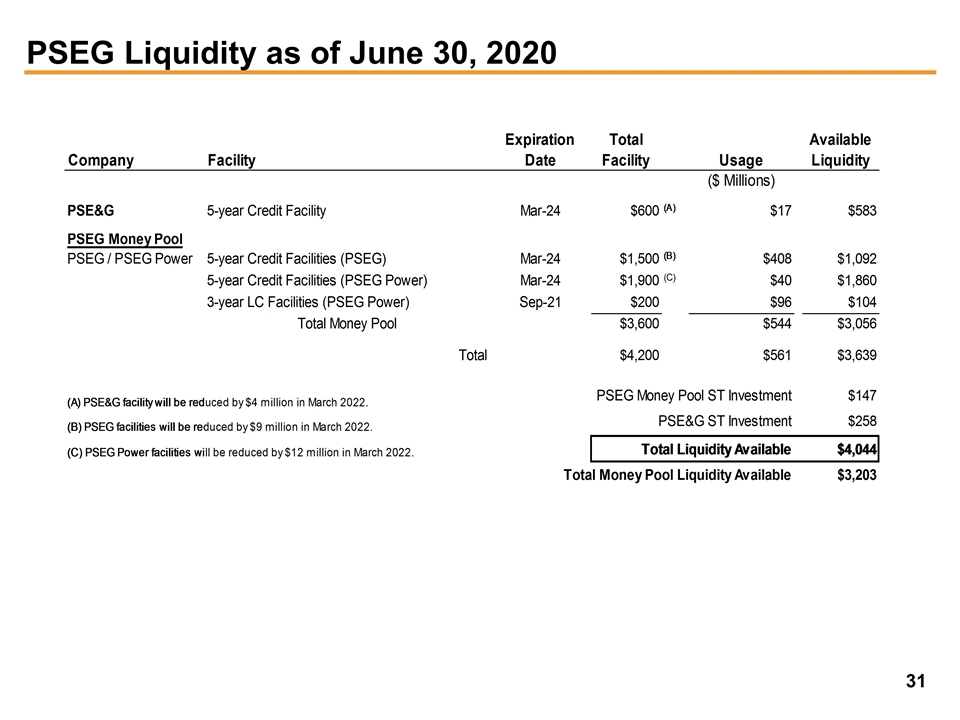
Ralph Izzo added, “We are re-affirming PSEG’s non-GAAP Operating Earnings guidance for full-year 2020 of $3.30 - $3.50 per share based on our results through the first-half of the year and our confidence that we can effectively manage costs across our businesses, continue executing our investment program at PSE&G, and provide New Jersey with reliable and zero carbon sources of electricity. Weather cooperated in the second quarter and thus far, the summer has tracked above normal. PSEG Power has effectively minimized scheduled maintenance and outage costs while remaining in compliance with safety requirements. We are on-track to execute on our five-year, $12 billion to $16 billion capital plan without the need to issue new equity, and our net liquidity position at June 30 remains ample at $4 billion.”
The following table outlines PSEG’s expectations for non-GAAP Operating Earnings in 2020 by subsidiary:
2020 Non-GAAP Operating Earnings Guidance
($ millions, except EPS)
| 2020E | ||
| PSE&G |
$1,310 - $1,370 | |
| PSEG Power |
$345 - $435 | |
| PSEG Enterprise/Other |
($5) | |
| Non-GAAP Operating Earnings |
$1,675 - $1,775 | |
| Non-GAAP Operating EPS |
$3.30 - $3.50 | |
| E = Estimate | ||
“Earlier this morning, we also announced that PSEG is exploring strategic alternatives for PSEG Power’s non-nuclear generating fleet. Our intent is to accelerate the transformation of PSEG into a primarily regulated electric and gas utility – a plan we have been executing successfully for over a decade. PSEG will explore how a potential separation of the non-nuclear assets could reduce overall business risk and earnings volatility, improve our credit profile, and enhance an already compelling ESG position driven by pending clean energy investments, methane reduction, and zero carbon generation,” Izzo said. “We believe PSE&G is among the best utilities in the country and that our valuation should align with that profile.”
2
PSEG intends to retain ownership of PSEG Power’s existing nuclear fleet. The nuclear fleet is a necessary component in enabling New Jersey to meet its long-term carbon reduction goals, and also helps to satisfy the state’s capacity obligations for resource adequacy with a cost-effective source of zero-carbon electricity.
While the company is in the preliminary stage of this evaluation, the marketing of a potential transaction in one or a series of steps, anticipated to launch in the fourth quarter, is expected to be completed sometime in 2021.
Given the relatively small part of PSEG that the non-nuclear business represents, this decision will not have an impact on the company’s current shareholder dividend policy, which will continue to be subject to approval by the PSEG Board of Directors. PSEG will manage this process taking into account the interests of its diverse stakeholders, including our 13,000 valued employees. Any decision regarding the non-nuclear assets will not impact PSE&G or PSEG Long Island customers, operations or tariffs and would be subject to customary regulatory approvals.
Results and Outlook by Operating Subsidiary
Public Service Electric & Gas
Second Quarter 2020 and 2019 Comparative Results
($ millions, except EPS)
| PSE&G |
2Q 2020 | 2Q 2019 | Q/Q Change | |||||||||
| Net Income |
$ | 283 | $ | 227 | $ | 56 | ||||||
| Earnings Per Share |
$ | 0.56 | $ | 0.45 | $ | 0.11 | ||||||
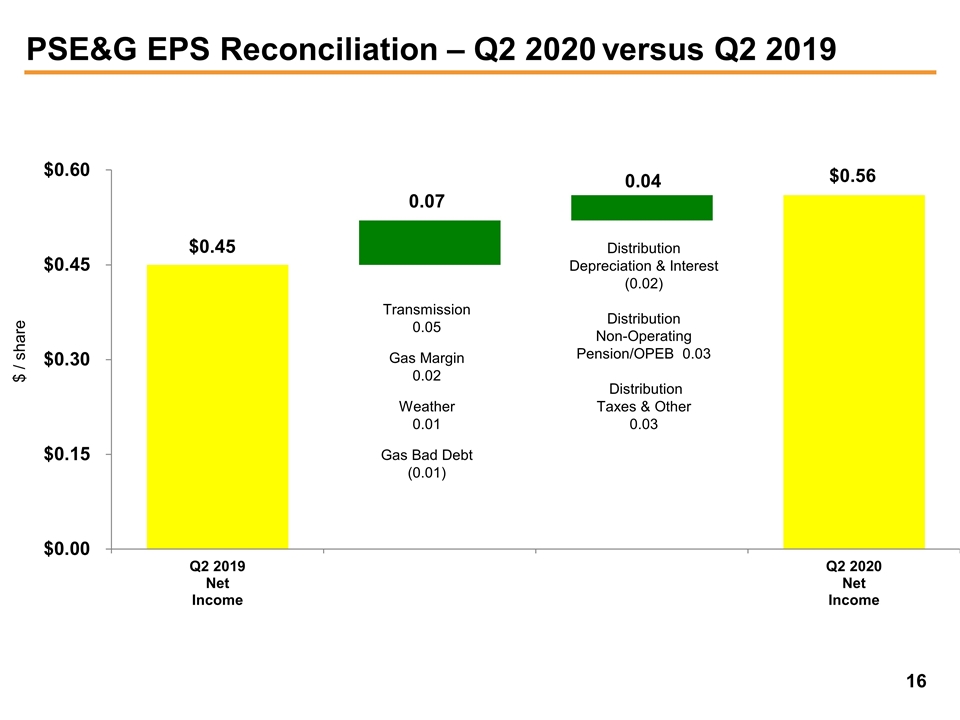
PSE&G reported Net Income of $283 million ($0.56 per share) for the second quarter of 2020 compared with Net Income of $227 million ($0.45 per share) for the second quarter 2019.
PSE&G’s second quarter results were driven by revenue growth from ongoing capital investment programs. Growth in transmission rate base added $0.05 per share to second quarter Net Income, which included approximately $0.02 per share related to 2019 true-ups and lower pension expense. Gas margin was $0.02 per share favorable, driven by Gas System Modernization Program II investments and weather normalized volumes. Favorable weather added $0.01 per share over the year-earlier quarter. While electric bad debt expense is recovered through the Societal Benefits Clause, gas-related bad debt expense in excess of the amount included in rates reduced earnings by $0.01 per share compared to second quarter 2019, reflecting higher uncollectibles related to COVID-19. Distribution related depreciation and interest expense each lowered Net Income by $0.01 per share. Non-operating pension expense was $0.03 per share favorable compared with second quarter 2019. Lastly, flow through taxes and other items were $0.03 favorable compared to second quarter 2019 driven by the timing of taxes and the settlement of federal audits for the 2011-2016 tax years.
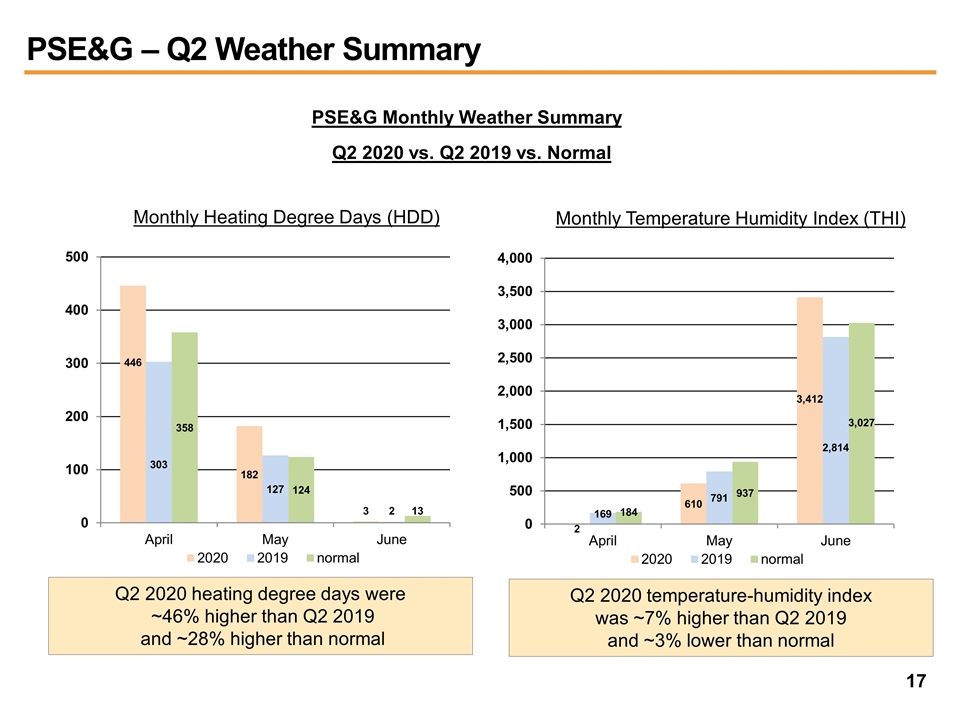
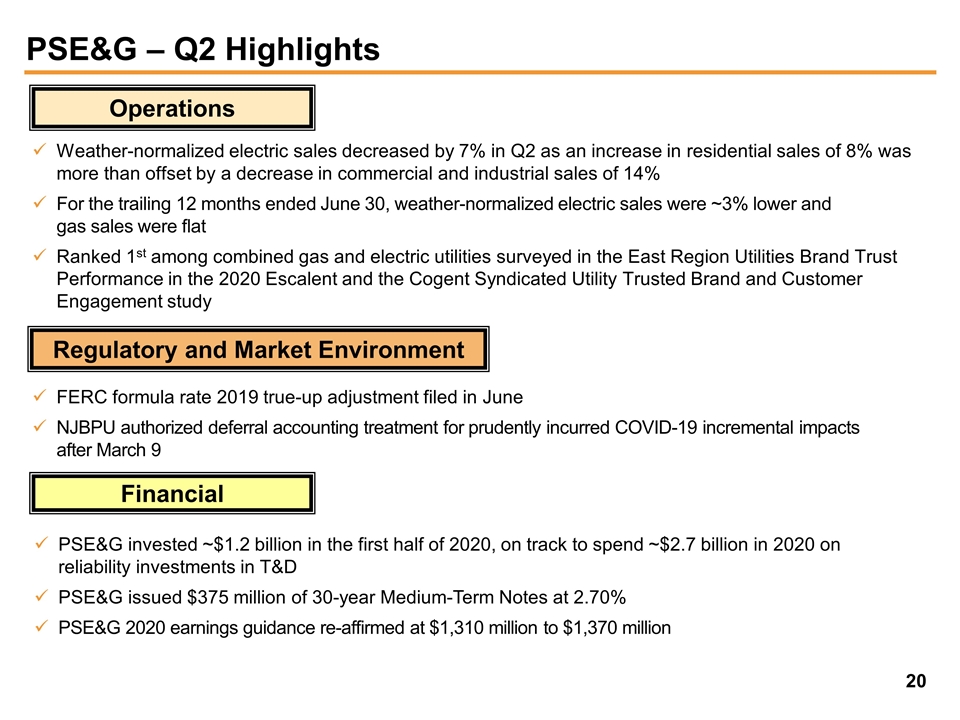
Weather for Q2 2020 was favorable compared with the second quarter of 2019. Early summer weather was below normal but 7% warmer than second quarter 2019. For the second quarter, weather normalized electric sales declined by approximately 7%, with residential loads up 8% but more than offset by commercial and industrial sales that were approximately 14% lower in
3
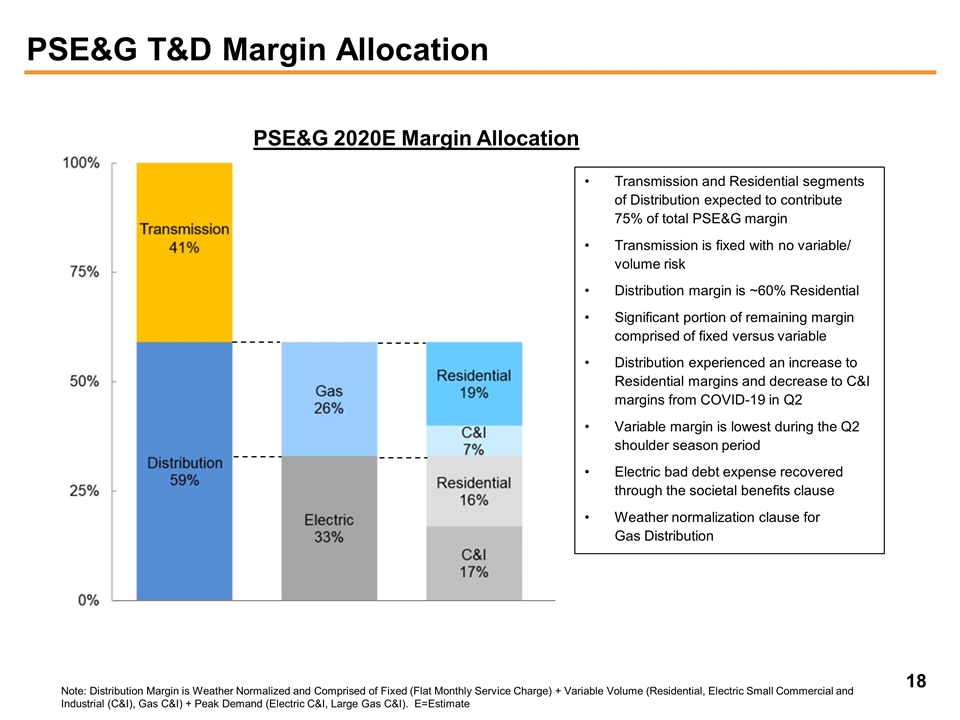
the quarter. Note that a majority of residential margin is driven by volume, while commercial and industrial margins are driven by demands. For the year to date period, the net impact of higher residential volume has partially offset the lower commercial and industrial demands. On a trailing 12-month basis, weather normalized electric sales were down by approximately 3% and gas sales were flat, with residential electric and gas usage up by over 2%.
PSE&G’s capital program remains on schedule. PSE&G invested approximately $600 million in the second quarter and $1.2 billion through June as part of its 2020 capital investment program of approximately $2.7 billion in electric and gas infrastructure upgrades to its transmission and distribution facilities to maintain reliability and increase resiliency. We continue to forecast over 90% of PSEG’s planned capital investment will be directed to the utility over the 2020-2024 timeframe.
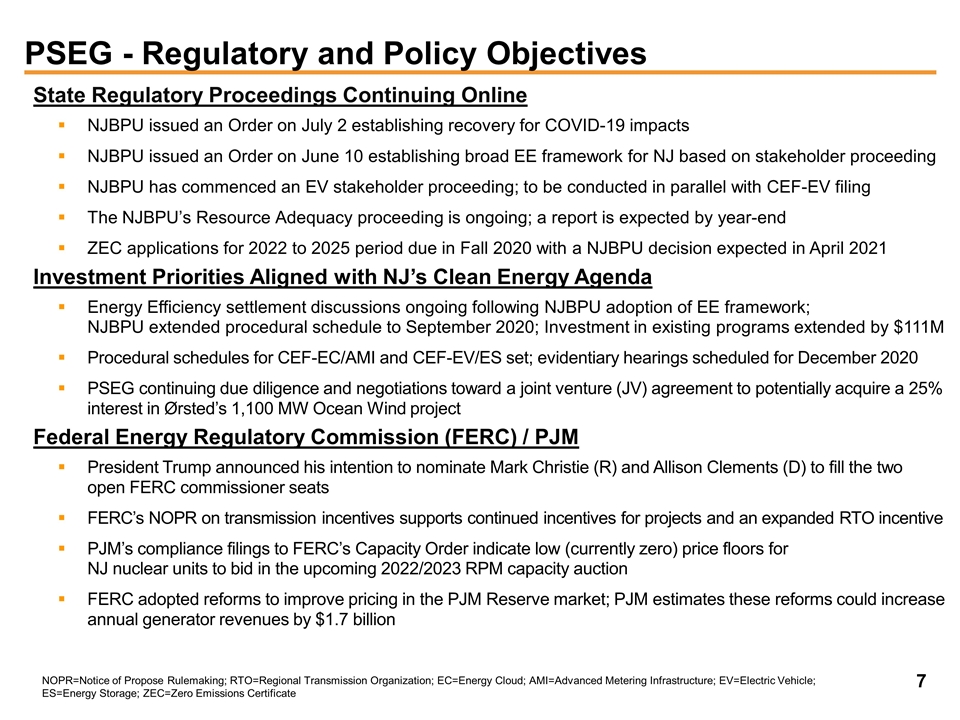
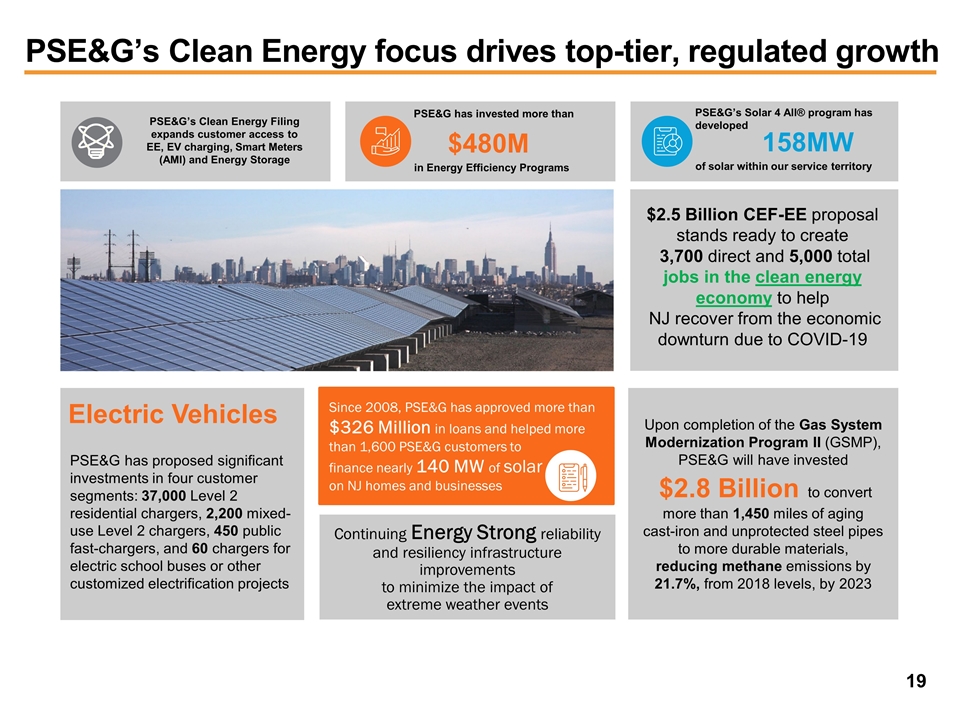
PSE&G is continuing to hold settlement discussions with the New Jersey Board of Public Utilities (BPU) on its six-year, $2.5 billion Clean Energy Future-Energy Efficiency (CEF-EE) filing. In June, the BPU adopted a framework to implement the expansion of energy efficiency throughout the state. The framework establishes the utilities as administrators for the programs that will achieve the majority of the energy savings. PSE&G’s CEF-EE filing is designed to achieve the objectives of the framework and help the state achieve its energy savings targets, which were raised in the BPU’s final framework to annual savings of 2.15% for electric and 1.1% for gas to be achieved over a five-year timeframe from program implementation.
PSE&G has continued the temporary suspension of non-safety related service shut-offs that began in March. Earlier this month, the BPU authorized utilities in the state to defer prudently incurred incremental costs related to COVID-19 from March 9, 2020 through September 30, 2021, or later. PSE&G will file its first quarterly report to the BPU on August 3, outlining its COVID related costs and offsets for the period ended June 30. PSE&G is evaluating the order and expects to record a deferral in the third quarter of 2020.
PSE&G’s forecast of Net Income for 2020 is unchanged at $1,310 million - $1,370 million.
PSEG Power
Second Quarter 2020 and 2019 Comparative Results
($ millions, except EPS)
| PSEG Power |
2Q 2020 | 2Q 2019 | Q/Q Change | |||||||||
| Net Income (Loss) |
$ | 170 | $ | (40 | ) | $ | 210 | |||||
| Earnings (Loss) Per Share (EPS) |
$ | 0.34 | $ | (0.08 | ) | $ | 0.42 | |||||
| Non-GAAP Operating Earnings |
$ | 123 | $ | 69 | $ | 54 | ||||||
| Non-GAAP EPS |
$ | 0.24 | $ | 0.13 | $ | 0.11 | ||||||
| Non-GAAP Adjusted EBITDA |
$ | 258 | $ | 211 | $ | 47 | ||||||
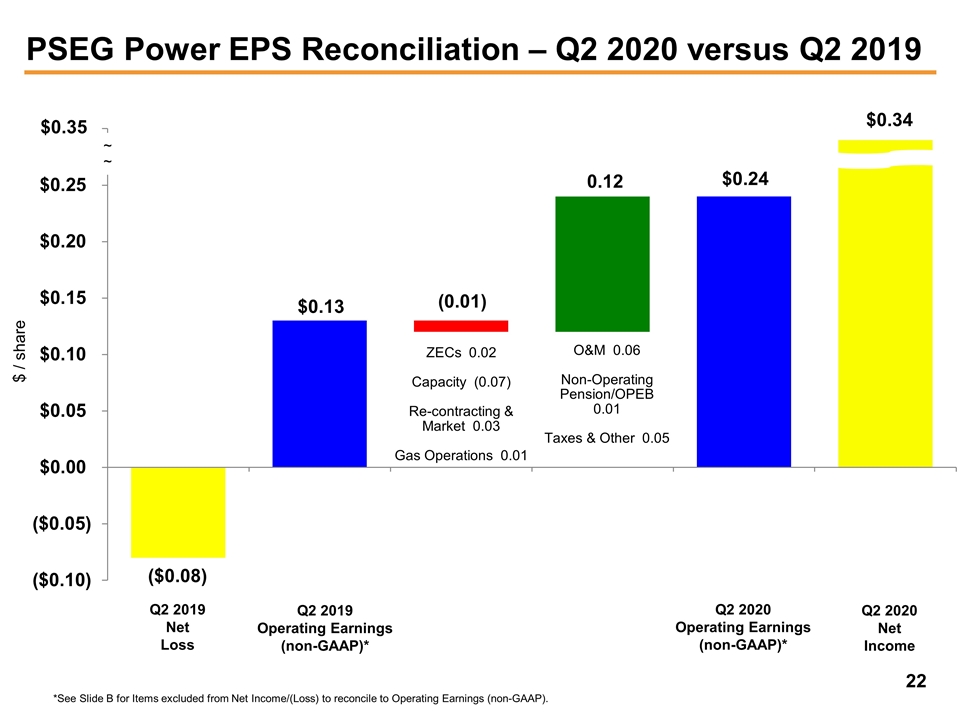
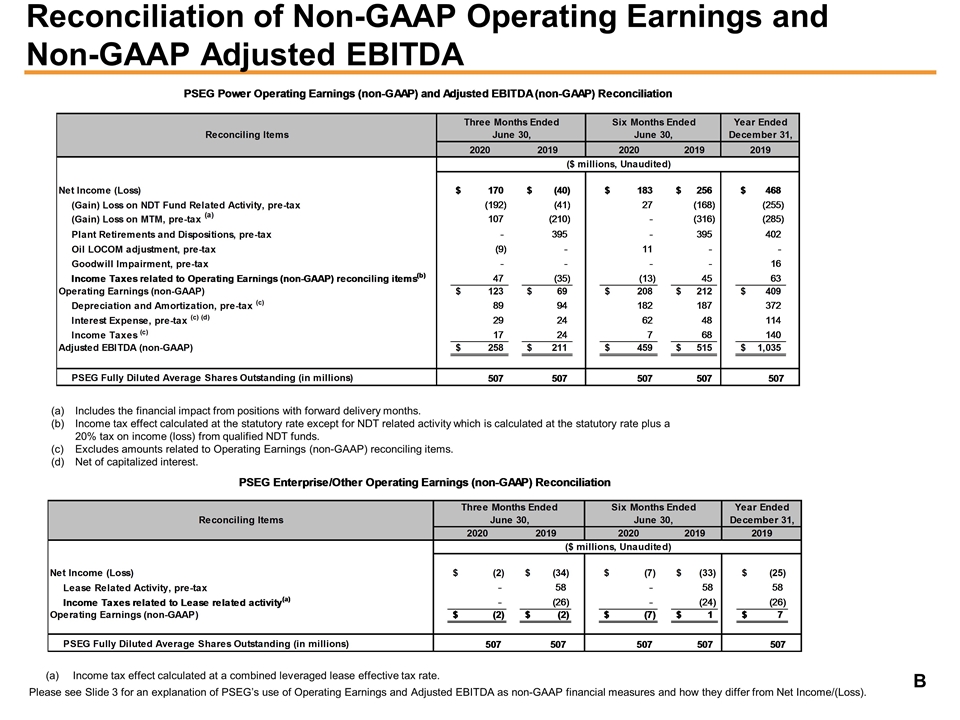
PSEG Power reported Net Income of $170 million ($0.34 per share) for the second quarter of 2020, non-GAAP Operating Earnings of $123 million ($0.24 per share), and non-GAAP Adjusted EBITDA of $258 million. A pre-tax adjustment of $9 million was made to reflect a partial reversal of a lower of cost or market write-down to oil inventory made in the first quarter, and is
4
excluded from the non-GAAP measures of Operating Earnings and Adjusted EBITDA.
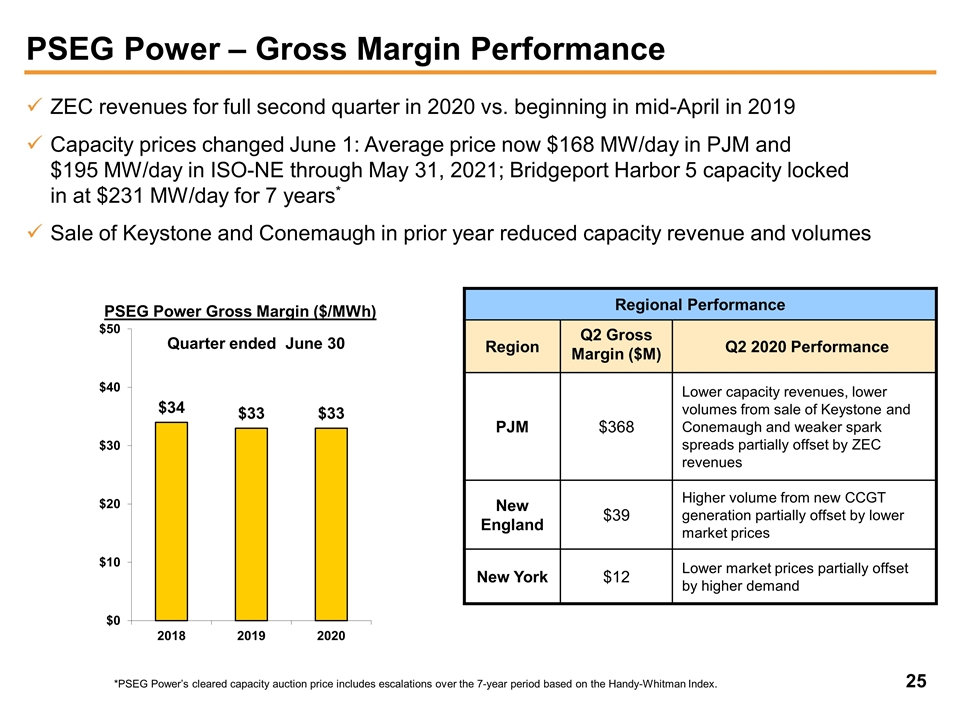
PSEG Power’s second quarter non-GAAP Operating Earnings were positively affected by several items that produced results $0.11 per share higher than the year-ago quarter. A June 1st scheduled increase in PJM capacity revenue moderated non-GAAP Operating Earnings comparisons to a decline of $0.07 per share compared with Q2 2019. The addition of ZECs to second-quarter results added $0.02 per share. The net impact of generation volumes was flat when new capacity additions at Bridgeport Harbor 5 are offset by the volume loss from the sale of Keystone and Conemaugh last fall. Re-contracting and market impacts lifted results by $0.03 per share, reflecting seasonal shape of hedging activity and lower cost to serve versus the year-ago quarter. Gas operations improved by $0.01 per share over the prior year quarter. Lower O&M expense was a favorable $0.06 per share comparison over last year’s second quarter reflecting lower costs from the planned Salem 2 refueling outage in April versus the absence of last year’s Salem Unit 1 extended outage, the absence of costs at Keystone and Conemaugh, and lower Fossil outage and maintenance expenses. Lower non-operating pension expense added $0.01 per share versus the year-ago quarter. Taxes and other items were $0.05 favorable compared to second-quarter 2019 driven by the settlement of federal audits for the 2011-2016 tax years.
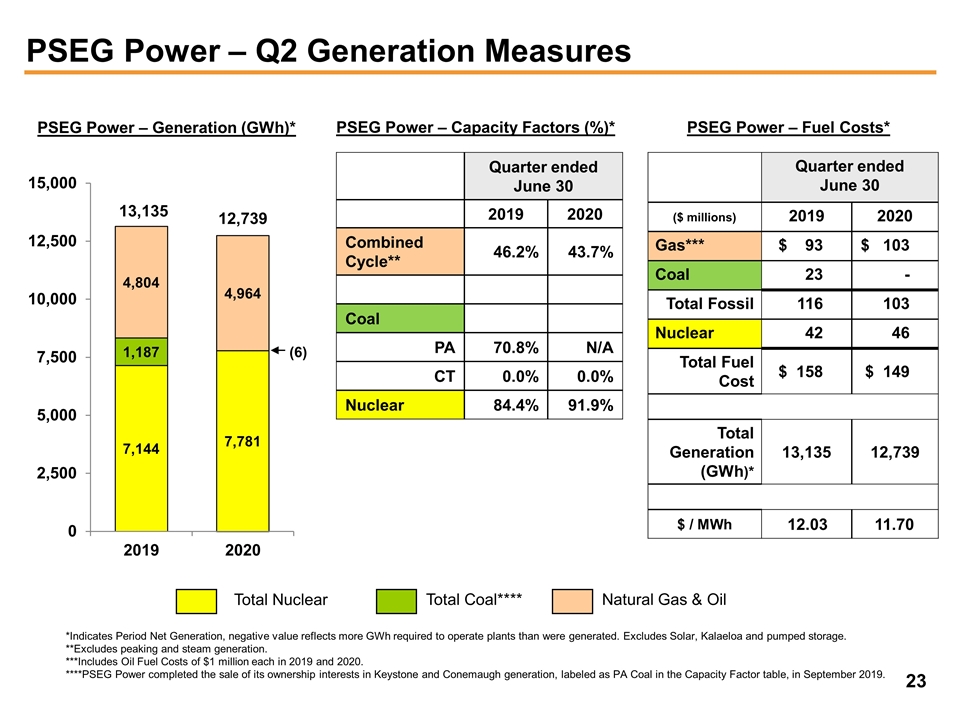
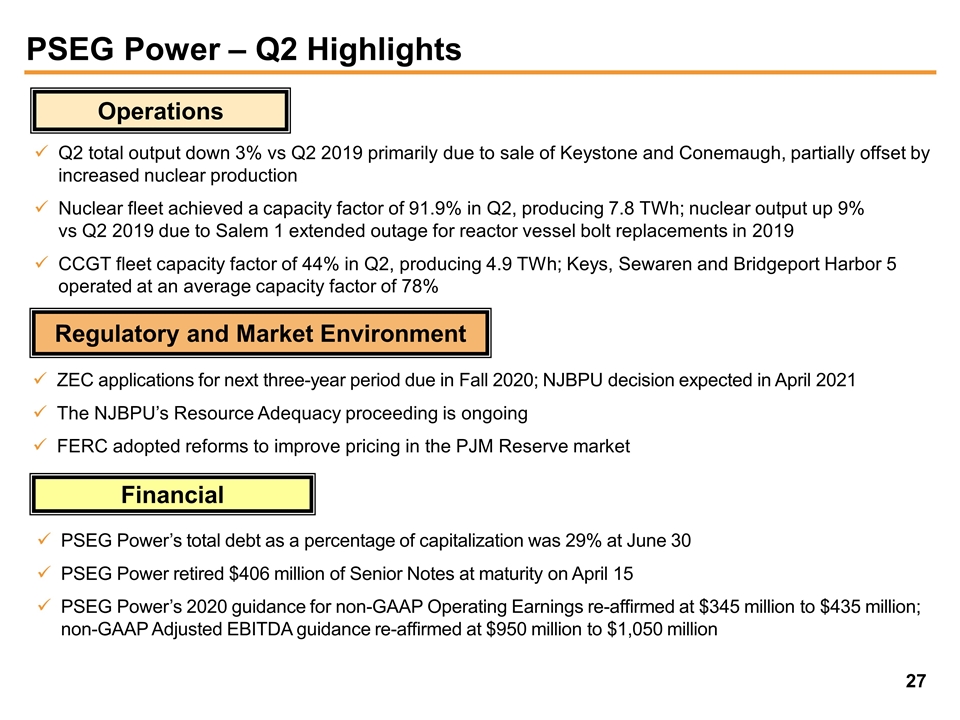
Total generation output declined by 3% to total 12.7 TWh in the second quarter of 2020, reflecting the sale of the Keystone and Conemaugh units last fall. PSEG Power’s CCGT fleet produced 4.9 TWh of output, up 3%, reflecting the addition of Bridgeport Harbor 5 which was placed into operation in June 2019. The nuclear fleet operated at a capacity factor of 91.9% for the quarter, producing 7.8 TWh, up 9% over Q2 2019, and representing 61% of total generation. This quarter’s higher nuclear output reflects the absence of the extended Salem Unit 1 outage in Q2 2019 related to repair of reactor vessel bolts.
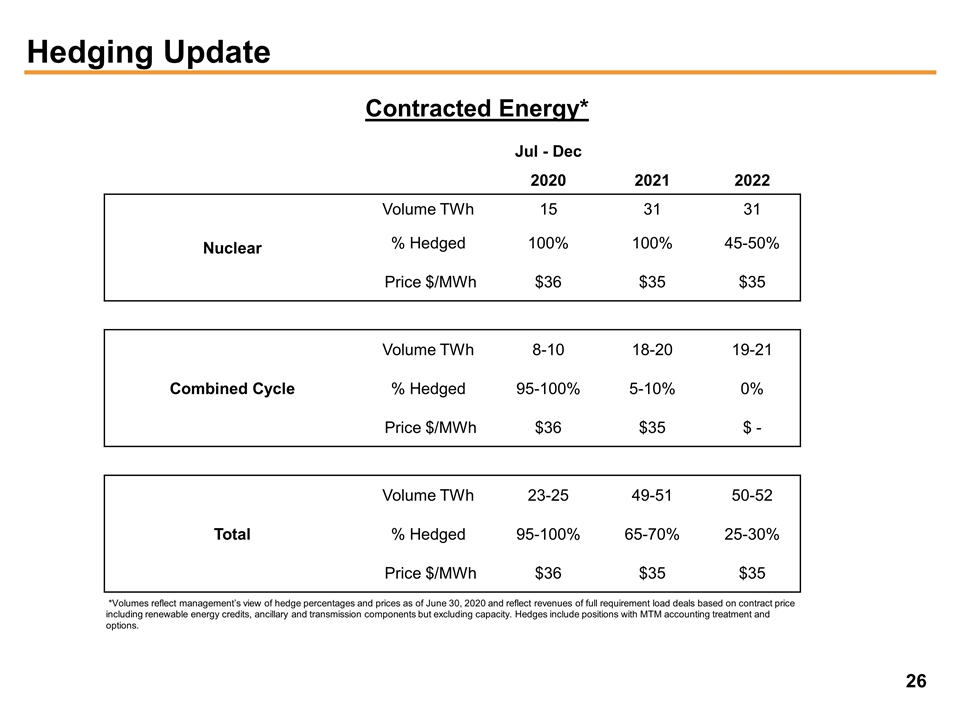
PSEG Power continues to forecast output for 2020 of 50 - 52 TWh. For the remainder of 2020 Power has hedged approximately 95% - 100% of production at an average price of $36 per MWh. For 2021, Power has hedged 65% - 70% of forecast production of 49 – 51 TWh at an average price of $35 per MWh. Power is also forecasting output for 2022 of 50 – 52 TWh. Approximately 25% – 30% of Power’s output in 2022 is hedged at an average price of $35 per MWh.
The forecast of PSEG Power’s non-GAAP Operating Earnings for 2020 remains unchanged at $345 million - $435 million as does our estimate of non-GAAP Adjusted EBITDA of $950 million - $1,050 million.
PSEG Enterprise/Other
PSEG Enterprise/Other reported a Net Loss of $2 million ($0.01 per share) for the second quarter of 2020 compared to a Net Loss of $34 million ($0.07 per share) for the second quarter of 2019. Non-GAAP Operating Loss for the second quarter of 2020 was $2 million ($0.01 per share) which was flat compared to non-GAAP Operating Loss for the second quarter of 2019. The Net Loss for the second quarter of 2020 reflects higher interest at the Parent partially offset by ongoing contributions from PSEG Long Island.
The forecast for PSEG Enterprise/Other for 2020 remains unchanged at a Net Loss of $5 million.
5
###
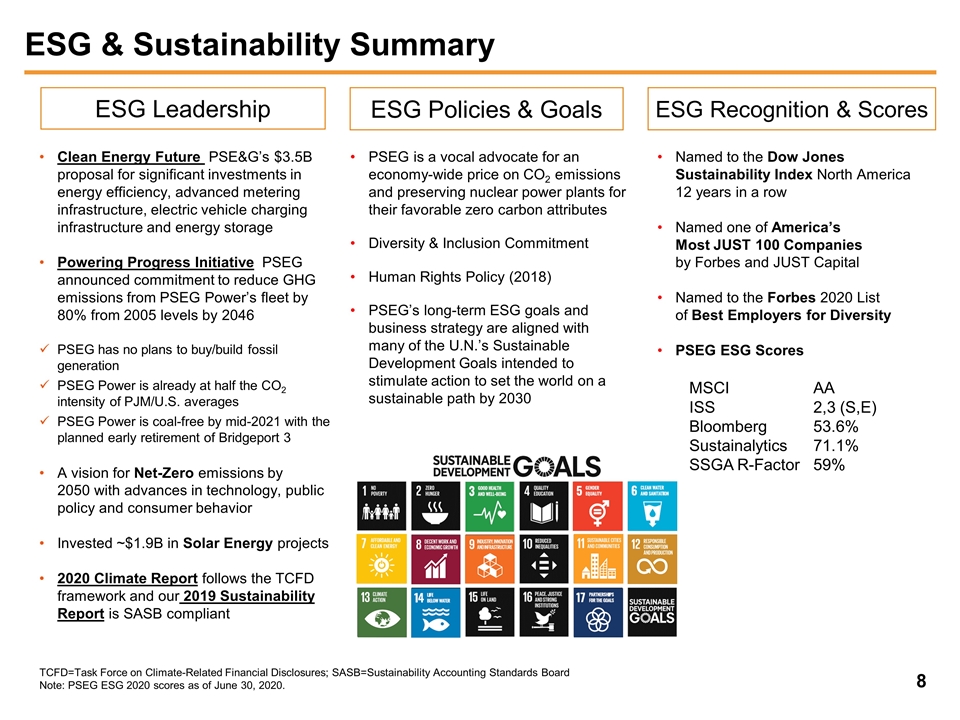
Public Service Enterprise Group Inc. (PSEG) (NYSE: PEG) is a publicly traded diversified energy company with approximately 13,000 employees. Headquartered in Newark, N.J., PSEG’s principal operating subsidiaries are: Public Service Electric and Gas Co. (PSE&G), PSEG Power and PSEG Long Island. PSEG is a Fortune 500 company included in the S&P 500 Index and has been named to the Dow Jones Sustainability Index for North America for 12 consecutive years (https://corporate.pseg.com).
From time to time, PSEG, PSE&G and PSEG Power release important information via postings on their corporate website at https://investor.pseg.com. Investors and other interested parties are encouraged to visit the corporate website to review new postings. The “Email Alerts” link at https://investor.pseg.com may be used to enroll to receive automatic email alerts regarding new postings.
Non-GAAP Financial Measures
Management uses non-GAAP Operating Earnings in its internal analysis, and in communications with investors and analysts, as a consistent measure for comparing PSEG’s financial performance to previous financial results. Non-GAAP Operating Earnings exclude the impact of returns (losses) associated with the Nuclear Decommissioning Trust (NDT), Mark-to-Market (MTM) accounting and material one-time items.
Management believes the presentation of non-GAAP Adjusted EBITDA for PSEG Power is useful to investors and other users of our financial statements in evaluating operating performance because it provides them with an additional tool to compare business performance across companies and across periods. Management also believes that non-GAAP Adjusted EBITDA is widely used by investors to measure operating performance without regard to items such as income tax expense, interest expense and depreciation and amortization, which can vary substantially from company to company depending upon, among other things, the book value of assets, capital structure and whether assets were constructed or acquired. Non-GAAP Adjusted EBITDA also allows investors and other users to assess the underlying financial performance of our fleet before management’s decision to deploy capital. Non-GAAP Adjusted EBITDA excludes the same items as our non-GAAP Operating Earnings measure as well as income tax expense, interest expense and depreciation and amortization.
See Attachments 8 and 9 for a complete list of items excluded from Net Income in the determination of non-GAAP Operating Earnings and non-GAAP Adjusted EBITDA. The presentation of non-GAAP Operating Earnings and non-GAAP Adjusted EBITDA is intended to complement, and should not be considered an alternative to the presentation of Net Income, which is an indicator of financial performance determined in accordance with GAAP. In addition, non-GAAP Operating Earnings and non-GAAP Adjusted EBITDA as presented in this release may not be comparable to similarly titled measures used by other companies.
Due to the forward looking nature of non-GAAP Operating Earnings and non-GAAP Adjusted EBITDA guidance, PSEG is unable to reconcile these non-GAAP financial measures to the most directly comparable GAAP financial measure. Management is unable to project certain reconciling items, in particular MTM and NDT gains (losses), for future periods due to market volatility.
Forward-Looking Statements
Certain of the matters discussed in this release about our and our subsidiaries’ future performance, including, without limitation, future revenues, earnings, strategies, prospects, consequences and all other statements that are not purely historical constitute “forward-looking statements” within the meaning of the Private Securities Litigation Reform Act of 1995. Such forward-looking statements are subject to risks and uncertainties, which could cause actual results to differ materially from those anticipated. Such statements are based on management’s beliefs as well as assumptions made by and information currently available to management. When used herein, the words “anticipate,” “intend,” “estimate,” “believe,” “expect,” “plan,” “should,” “hypothetical,” “potential,” “forecast,” “project,” variations of such words and similar expressions are intended to identify forward-looking statements. Factors that may cause actual results to differ are often presented with the forward-looking statements themselves. Other factors that could cause actual results to differ materially from those contemplated in any forward-looking statements made by us herein are discussed in filings we make with the United States Securities and Exchange Commission (SEC), including our Annual Report on Form 10-K and subsequent reports on Form 10-Q and Form 8-K. These factors include, but are not limited to:
6
Forward-Looking Statements - Continued
| • | fluctuations in wholesale power and natural gas markets, including the potential impacts on the economic viability of our generation units; |
| • | our ability to obtain adequate fuel supply; |
| • | market risks impacting the operation of our generating stations; |
| • | increases in competition in wholesale energy and capacity markets; |
| • | changes in technology related to energy generation, distribution and consumption and customer usage patterns; |
| • | economic downturns; |
| • | third-party credit risk relating to our sale of generation output and purchase of fuel; |
| • | adverse performance of our nuclear decommissioning and defined benefit plan trust fund investments and changes in funding requirements; |
| • | the impact of changes in state and federal legislation and regulations on our business, including PSE&G’s ability to recover costs and earn returns on authorized investments; |
| • | PSE&G’s proposed investment programs may not be fully approved by regulators and its capital investment may be lower than planned; |
| • | the impact on our New Jersey nuclear plants if such plants are not awarded Zero Emission Certificates (ZEC) in future periods, there is an adverse change in the amount of future ZEC payments, the ZEC program is overturned or modified through legal proceedings or if adverse changes are made to the capacity market construct; |
| • | adverse changes in energy industry laws, policies and regulations, including market structures and transmission planning; |
| • | the impact of state and federal actions aimed at combating climate change on our natural gas assets; |
| • | risks associated with our ownership and operation of nuclear facilities, including regulatory risks, such as compliance with the Atomic Energy Act and trade control, environmental and other regulations, as well as financial, environmental and health and safety risks; |
| • | changes in federal and state environmental regulations and enforcement; |
| • | delays in receipt of, or an inability to receive, necessary licenses and permits; |
| • | the impact of any future rate proceedings; |
| • | adverse outcomes of any legal, regulatory or other proceeding, settlement, investigation or claim applicable to us and/or the energy industry; |
| • | changes in tax laws and regulations; |
| • | the impact of our holding company structure on our ability to meet our corporate funding needs, service debt and pay dividends; |
| • | lack of growth or slower growth in the number of customers or changes in customer demand; |
| • | any inability of PSEG Power to meet its commitments under forward sale obligations; |
| • | reliance on transmission facilities that we do not own or control and the impact on our ability to maintain adequate transmission capacity; |
| • | any inability to successfully develop, obtain regulatory approval for, or construct generation, transmission and distribution projects; |
| • | any equipment failures, accidents, severe weather events or other incidents, including pandemics such as the ongoing coronavirus pandemic, that may impact our ability to provide safe and reliable service to our customers; |
| • | our inability to exercise control over the operations of generation facilities in which we do not maintain a controlling interest; |
| • | any inability to recover the carrying amount of our long-lived assets and leveraged leases; |
| • | any inability to maintain sufficient liquidity; |
| • | any inability to realize anticipated tax benefits or retain tax credits; |
| • | challenges associated with recruitment and/or retention of key executives and a qualified workforce; |
| • | the impact of our covenants in our debt instruments on our operations; |
| • | the impact of the ongoing coronavirus pandemic; |
| • | the impact of acts of war, terrorism, cybersecurity attacks or intrusions; and |
| • | failure to sell or otherwise dispose of all or a portion of PSEG Power’s non-nuclear generating fleet on terms that are favorable to us, or at all, or any delay of such transaction or transactions due to market conditions, the failure to satisfy conditions to closing or otherwise. |
All of the forward-looking statements made in this release are qualified by these cautionary statements and we cannot assure you that the results or developments anticipated by management will be realized or even if realized, will have the expected consequences to, or effects on, us or our business, prospects, financial condition, results of operations or cash flows. Readers are cautioned not to place undue reliance on these forward-looking statements in making any investment decision. Forward-looking statements made in this release apply only as of the date of this release. While we may elect to update forward-looking statements from time to time, we specifically disclaim any obligation to do so, even in light of new information or future events, unless otherwise required by applicable securities laws.
The forward-looking statements contained in this release are intended to qualify for the safe harbor provisions of Section 27A of the Securities Act of 1933, as amended, and Section 21E of the Securities Exchange Act of 1934, as amended.
7
Attachment 1
PUBLIC SERVICE ENTERPRISE GROUP INCORPORATED
Consolidating Statements of Operations
(Unaudited, $ millions, except per share data)
| Three Months Ended June 30, 2020 | ||||||||||||||||
| PSEG | PSEG Enterprise/ Other (a) |
PSE&G | PSEG Power |
|||||||||||||
| OPERATING REVENUES |
$ | 2,050 | $ | (89 | ) | $ | 1,456 | $ | 683 | |||||||
| OPERATING EXPENSES |
||||||||||||||||
| Energy Costs |
595 | (238 | ) | 510 | 323 | |||||||||||
| Operation and Maintenance |
733 | 128 | 380 | 225 | ||||||||||||
| Depreciation and Amortization |
315 | 7 | 217 | 91 | ||||||||||||
|
|
|
|
|
|
|
|
|
|||||||||
| Total Operating Expenses |
1,643 | (103 | ) | 1,107 | 639 | |||||||||||
| OPERATING INCOME |
407 | 14 | 349 | 44 | ||||||||||||
| Income from Equity Method Investments |
3 | — | — | 3 | ||||||||||||
| Net Gains (Losses) on Trust Investments |
201 | 4 | 1 | 196 | ||||||||||||
| Other Income (Deductions) |
38 | — | 26 | 12 | ||||||||||||
| Net Non-Operating Pension and OPEB Credits (Costs) |
62 | 1 | 52 | 9 | ||||||||||||
| Interest Expense |
(151 | ) | (23 | ) | (98 | ) | (30 | ) | ||||||||
|
|
|
|
|
|
|
|
|
|||||||||
| INCOME (LOSS) BEFORE INCOME TAXES |
560 | (4 | ) | 330 | 234 | |||||||||||
| Income Tax Benefit (Expense) |
(109 | ) | 2 | (47 | ) | (64 | ) | |||||||||
|
|
|
|
|
|
|
|
|
|||||||||
| NET INCOME (LOSS) |
$ | 451 | $ | (2 | ) | $ | 283 | $ | 170 | |||||||
|
|
|
|
|
|
|
|
|
|||||||||
| Reconciling Items Excluded from Net Income (Loss)(b) |
(47 | ) | — | — | (47 | ) | ||||||||||
|
|
|
|
|
|
|
|
|
|||||||||
| OPERATING EARNINGS (non-GAAP) |
$ | 404 | $ | (2 | ) | $ | 283 | $ | 123 | |||||||
|
|
|
|
|
|
|
|
|
|||||||||
| Earnings Per Share |
||||||||||||||||
| NET INCOME (LOSS) |
$ | 0.89 | $ | (0.01 | ) | $ | 0.56 | $ | 0.34 | |||||||
|
|
|
|
|
|
|
|
|
|||||||||
| Reconciling Items Excluded from Net Income (Loss)(b) |
(0.10 | ) | — | — | (0.10 | ) | ||||||||||
|
|
|
|
|
|
|
|
|
|||||||||
| OPERATING EARNINGS (non-GAAP) |
$ | 0.79 | $ | (0.01 | ) | $ | 0.56 | $ | 0.24 | |||||||
|
|
|
|
|
|
|
|
|
|||||||||
| Three Months Ended June 30, 2019 | ||||||||||||||||
| PSEG | PSEG Enterprise/ Other (a) |
PSE&G | PSEG Power |
|||||||||||||
| OPERATING REVENUES |
$ | 2,316 | $ | (149 | ) | $ | 1,382 | $ | 1,083 | |||||||
| OPERATING EXPENSES |
||||||||||||||||
| Energy Costs |
704 | (236 | ) | 529 | 411 | |||||||||||
| Operation and Maintenance |
750 | 113 | 369 | 268 | ||||||||||||
| Depreciation and Amortization |
307 | 10 | 202 | 95 | ||||||||||||
| Loss on Asset Dispositions |
395 | — | — | 395 | ||||||||||||
|
|
|
|
|
|
|
|
|
|||||||||
| Total Operating Expenses |
2,156 | (113 | ) | 1,100 | 1,169 | |||||||||||
|
|
|
|
|
|
|
|
|
|||||||||
| OPERATING INCOME |
160 | (36 | ) | 282 | (86 | ) | ||||||||||
| Income from Equity Method Investments |
5 | — | — | 5 | ||||||||||||
| Net Gains (Losses) on Trust Investments |
39 | 1 | — | 38 | ||||||||||||
| Other Income (Deductions) |
33 | (1 | ) | 19 | 15 | |||||||||||
| Net Non-Operating Pension and OPEB Credits (Costs) |
33 | 1 | 29 | 3 | ||||||||||||
| Interest Expense |
(137 | ) | (22 | ) | (89 | ) | (26 | ) | ||||||||
|
|
|
|
|
|
|
|
|
|||||||||
| INCOME (LOSS) BEFORE INCOME TAXES |
133 | (57 | ) | 241 | (51 | ) | ||||||||||
| Income Tax Benefit (Expense) |
20 | 23 | (14 | ) | 11 | |||||||||||
|
|
|
|
|
|
|
|
|
|||||||||
| NET INCOME (LOSS) |
$ | 153 | $ | (34 | ) | $ | 227 | $ | (40 | ) | ||||||
|
|
|
|
|
|
|
|
|
|||||||||
| Reconciling Items Excluded from Net Income (Loss)(b) |
141 | 32 | — | 109 | ||||||||||||
|
|
|
|
|
|
|
|
|
|||||||||
| OPERATING EARNINGS (non-GAAP) |
$ | 294 | $ | (2 | ) | $ | 227 | $ | 69 | |||||||
|
|
|
|
|
|
|
|
|
|||||||||
| Earnings Per Share |
||||||||||||||||
| NET INCOME (LOSS) |
$ | 0.30 | $ | (0.07 | ) | $ | 0.45 | $ | (0.08 | ) | ||||||
|
|
|
|
|
|
|
|
|
|||||||||
| Reconciling Items Excluded from Net Income (Loss)(b) |
0.28 | 0.07 | — | 0.21 | ||||||||||||
|
|
|
|
|
|
|
|
|
|||||||||
| OPERATING EARNINGS (non-GAAP) |
$ | 0.58 | $ | — | $ | 0.45 | $ | 0.13 | ||||||||
|
|
|
|
|
|
|
|
|
|||||||||
| (a) | Includes activities at Energy Holdings, PSEG Long Island and the Parent as well as intercompany eliminations. |
| (b) | See Attachments 8 and 9 for details of items excluded from Net Income/(Loss) to compute Operating Earnings (non-GAAP). |
Attachment 2
PUBLIC SERVICE ENTERPRISE GROUP INCORPORATED
Consolidating Statements of Operations
(Unaudited, $ millions, except per share data)
| Six Months Ended June 30, 2020 | ||||||||||||||||
| PSEG | PSEG Enterprise/ Other (a) |
PSE&G | PSEG Power |
|||||||||||||
| OPERATING REVENUES |
$ | 4,831 | $ | (411 | ) | $ | 3,339 | $ | 1,903 | |||||||
| OPERATING EXPENSES |
||||||||||||||||
| Energy Costs |
1,501 | (716 | ) | 1,218 | 999 | |||||||||||
| Operation and Maintenance |
1,487 | 255 | 766 | 466 | ||||||||||||
| Depreciation and Amortization |
639 | 15 | 439 | 185 | ||||||||||||
|
|
|
|
|
|
|
|
|
|||||||||
| Total Operating Expenses |
3,627 | (446 | ) | 2,423 | 1,650 | |||||||||||
| OPERATING INCOME |
1,204 | 35 | 916 | 253 | ||||||||||||
| Income from Equity Method Investments |
6 | — | — | 6 | ||||||||||||
| Net Gains (Losses) on Trust Investments |
(20 | ) | 3 | 1 | (24 | ) | ||||||||||
| Other Income (Deductions) |
42 | — | 53 | (11 | ) | |||||||||||
| Non-Operating Pension and OPEB Credits (Costs) |
124 | 4 | 103 | 17 | ||||||||||||
| Interest Expense |
(304 | ) | (46 | ) | (194 | ) | (64 | ) | ||||||||
|
|
|
|
|
|
|
|
|
|||||||||
| INCOME (LOSS) BEFORE INCOME TAXES |
1,052 | (4 | ) | 879 | 177 | |||||||||||
| Income Tax Benefit (Expense) |
(153 | ) | (3 | ) | (156 | ) | 6 | |||||||||
|
|
|
|
|
|
|
|
|
|||||||||
| NET INCOME (LOSS) |
$ | 899 | $ | (7 | ) | $ | 723 | $ | 183 | |||||||
|
|
|
|
|
|
|
|
|
|||||||||
| Reconciling Items Excluded from Net Income (Loss) (b) |
25 | — | — | 25 | ||||||||||||
|
|
|
|
|
|
|
|
|
|||||||||
| OPERATING EARNINGS (non-GAAP) |
$ | 924 | $ | (7 | ) | $ | 723 | $ | 208 | |||||||
|
|
|
|
|
|
|
|
|
|||||||||
| Earnings Per Share |
||||||||||||||||
| NET INCOME (LOSS) |
$ | 1.77 | $ | (0.02 | ) | $ | 1.43 | $ | 0.36 | |||||||
|
|
|
|
|
|
|
|
|
|||||||||
| Reconciling Items Excluded from Net Income (Loss) (b) |
0.05 | — | — | 0.05 | ||||||||||||
|
|
|
|
|
|
|
|
|
|||||||||
| OPERATING EARNINGS (non-GAAP) |
$ | 1.82 | $ | (0.02 | ) | $ | 1.43 | $ | 0.41 | |||||||
|
|
|
|
|
|
|
|
|
|||||||||
| Six Months Ended June 30, 2019 | ||||||||||||||||
| PSEG | PSEG Enterprise/ Other (a) |
PSE&G | PSEG Power |
|||||||||||||
| OPERATING REVENUES |
$ | 5,296 | $ | (617 | ) | $ | 3,414 | $ | 2,499 | |||||||
| OPERATING EXPENSES |
||||||||||||||||
| Energy Costs |
1,828 | (845 | ) | 1,476 | 1,197 | |||||||||||
| Operation and Maintenance |
1,506 | 226 | 777 | 503 | ||||||||||||
| Depreciation and Amortization |
621 | 18 | 414 | 189 | ||||||||||||
| Loss on Asset Dispositions |
395 | — | — | 395 | ||||||||||||
|
|
|
|
|
|
|
|
|
|||||||||
| Total Operating Expenses |
4,350 | (601 | ) | 2,667 | 2,284 | |||||||||||
|
|
|
|
|
|
|
|
|
|||||||||
| OPERATING INCOME |
946 | (16 | ) | 747 | 215 | |||||||||||
| Income from Equity Method Investments |
7 | — | — | 7 | ||||||||||||
| Net Gains (Losses) on Trust Investments |
167 | 2 | 1 | 164 | ||||||||||||
| Other Income (Deductions) |
66 | — | 38 | 28 | ||||||||||||
| Non-Operating Pension and OPEB Credits (Costs) |
66 | 1 | 59 | 6 | ||||||||||||
| Interest Expense |
(270 | ) | (43 | ) | (176 | ) | (51 | ) | ||||||||
|
|
|
|
|
|
|
|
|
|||||||||
| INCOME (LOSS) BEFORE INCOME TAXES |
982 | (56 | ) | 669 | 369 | |||||||||||
| Income Tax Benefit (Expense) |
(129 | ) | 23 | (39 | ) | (113 | ) | |||||||||
|
|
|
|
|
|
|
|
|
|||||||||
| NET INCOME (LOSS) |
$ | 853 | $ | (33 | ) | $ | 630 | $ | 256 | |||||||
|
|
|
|
|
|
|
|
|
|||||||||
| Reconciling Items Excluded from Net Income (Loss) (b) |
(12 | ) | 32 | — | (44 | ) | ||||||||||
|
|
|
|
|
|
|
|
|
|||||||||
| OPERATING EARNINGS (non-GAAP) |
$ | 841 | $ | (1 | ) | $ | 630 | $ | 212 | |||||||
|
|
|
|
|
|
|
|
|
|||||||||
| Earnings Per Share |
||||||||||||||||
| NET INCOME (LOSS) |
$ | 1.68 | $ | (0.07 | ) | $ | 1.24 | $ | 0.51 | |||||||
|
|
|
|
|
|
|
|
|
|||||||||
| Reconciling Items Excluded from Net Income (Loss) (b) |
(0.02 | ) | 0.07 | — | (0.09 | ) | ||||||||||
|
|
|
|
|
|
|
|
|
|||||||||
| OPERATING EARNINGS (non-GAAP) |
$ | 1.66 | $ | — | $ | 1.24 | $ | 0.42 | ||||||||
|
|
|
|
|
|
|
|
|
|||||||||
| (a) | Includes activities at Energy Holdings, PSEG Long Island and the Parent as well as intercompany eliminations. |
| (b) | See Attachments 8 and 9 for details of items excluded from Net Income/(Loss) to compute Operating Earnings (non-GAAP). |
Attachment 3
PUBLIC SERVICE ENTERPRISE GROUP INCORPORATED
Capitalization Schedule
(Unaudited, $ millions)
| June 30, 2020 |
December 31, 2019 |
|||||||
| DEBT |
||||||||
| Commercial Paper and Loans |
$ | 1,165 | $ | 1,115 | ||||
| Long-Term Debt* |
15,673 | 15,108 | ||||||
|
|
|
|
|
|||||
| Total Debt |
16,838 | 16,223 | ||||||
| STOCKHOLDERS’ EQUITY |
||||||||
| Common Stock |
5,003 | 5,003 | ||||||
| Treasury Stock |
(865 | ) | (831 | ) | ||||
| Retained Earnings |
11,808 | 11,406 | ||||||
| Accumulated Other Comprehensive Loss |
(455 | ) | (489 | ) | ||||
|
|
|
|
|
|||||
| Total Stockholders’ Equity |
15,491 | 15,089 | ||||||
|
|
|
|
|
|||||
| Total Capitalization |
$ | 32,329 | $ | 31,312 | ||||
|
|
|
|
|
|||||
| * | Includes current portion of Long-Term Debt |
Attachment 4
PUBLIC SERVICE ENTERPRISE GROUP INCORPORATED
CONDENSED CONSOLIDATED STATEMENTS OF CASH FLOWS
(Unaudited, $ millions)
| Six Months Ended June 30, | ||||||||
| 2020 | 2019 | |||||||
| CASH FLOWS FROM OPERATING ACTIVITIES |
||||||||
| Net Income |
$ | 899 | $ | 853 | ||||
| Adjustments to Reconcile Net Income to Net Cash Flows From Operating Activities |
765 | 971 | ||||||
|
|
|
|
|
|||||
| NET CASH PROVIDED BY (USED IN) OPERATING ACTIVITIES |
1,664 | 1,824 | ||||||
|
|
|
|
|
|||||
| NET CASH PROVIDED BY (USED IN) INVESTING ACTIVITIES |
(1,433 | ) | (1,622 | ) | ||||
|
|
|
|
|
|||||
| NET CASH PROVIDED BY (USED IN) FINANCING ACTIVITIES |
60 | (286 | ) | |||||
|
|
|
|
|
|||||
| Net Change in Cash, Cash Equivalents and Restricted Cash |
291 | (84 | ) | |||||
| Cash, Cash Equivalents and Restricted Cash at Beginning of Period |
176 | 199 | ||||||
|
|
|
|
|
|||||
| Cash, Cash Equivalents and Restricted Cash at End of Period |
$ | 467 | $ | 115 | ||||
|
|
|
|
|
|||||
Attachment 5
PUBLIC SERVICE ELECTRIC & GAS COMPANY
Retail Sales
(Unaudited)
June 30, 2020
Electric Sales
| Three Months | Change vs. | Six Months | Change vs. | |||||||||||||
| Sales (millions kWh) |
Ended | 2019 | Ended | 2019 | ||||||||||||
| Residential |
3,236 | 12 | % | 6,113 | 2 | % | ||||||||||
| Commercial & Industrial |
5,572 | (13 | %) | 12,036 | (8 | %) | ||||||||||
| Other |
75 | 9 | % | 174 | (21 | %) | ||||||||||
|
|
|
|
|
|||||||||||||
| Total |
8,883 | (5 | %) | 18,323 | (5 | %) | ||||||||||
|
|
|
|
|
|||||||||||||
Gas Sold and Transported
| Three Months | Change vs. | Six Months | Change vs. | |||||||||||||
| Sales (millions therms)* |
Ended | 2019 | Ended | 2019 | ||||||||||||
| Firm Sales |
||||||||||||||||
| Residential Sales |
248 | 35 | % | 875 | (7 | %) | ||||||||||
| Commercial & Industrial |
170 | 8 | % | 584 | (12 | %) | ||||||||||
|
|
|
|
|
|||||||||||||
| Total Firm Sales |
418 | 23 | % | 1,459 | (9 | %) | ||||||||||
|
|
|
|
|
|||||||||||||
| Non-Firm Sales |
||||||||||||||||
| Commercial & Industrial |
178 | (24 | %) | 370 | (36 | %) | ||||||||||
|
|
|
|
|
|||||||||||||
| Total Non-Firm Sales |
178 | 370 | ||||||||||||||
|
|
|
|
|
|||||||||||||
| Total Sales |
596 | 4 | % | 1,829 | (16 | %) | ||||||||||
|
|
|
|
|
|||||||||||||
| *CSG rate included in non-firm sales |
Weather Data
| Three Months | Change vs. | Six Months | Change vs. | |||||||||||||
| Ended | 2019 | Ended | 2019 | |||||||||||||
| THI Hours - Actual |
4,025 | 7 | % | 4,054 | 7 | % | ||||||||||
| THI Hours - Normal |
4,149 | 4,165 | ||||||||||||||
| Degree Days - Actual |
631 | 46 | % | 2,708 | (9 | %) | ||||||||||
| Degree Days - Normal |
494 | 3,047 | ||||||||||||||
Attachment 6
PSEG POWER LLC
Generation Measures(1)
(Unaudited)
| GWhr Breakdown | GWhr Breakdown | |||||||||||||||
| Three Months Ended | Six Months Ended | |||||||||||||||
| June 30, | June 30, | |||||||||||||||
| 2020 | 2019 | 2020 | 2019 | |||||||||||||
| Nuclear - NJ |
4,902 | 4,258 | 10,004 | 9,567 | ||||||||||||
| Nuclear - PA |
2,879 | 2,886 | 5,812 | 5,793 | ||||||||||||
|
|
|
|
|
|
|
|
|
|||||||||
| Total Nuclear |
7,781 | 7,144 | 15,816 | 15,360 | ||||||||||||
| Fossil - Natural Gas - NJ |
1,689 | 2,379 | 3,670 | 4,875 | ||||||||||||
| Fossil - Natural Gas - NY |
1,135 | 1,038 | 2,158 | 1,948 | ||||||||||||
| Fossil - Natural Gas - MD |
1,262 | 1,174 | 2,456 | 2,222 | ||||||||||||
| Fossil - Natural Gas - CT |
878 | 213 | 1,830 | 207 | ||||||||||||
|
|
|
|
|
|
|
|
|
|||||||||
| Total Natural Gas(2) |
4,964 | 4,804 | 10,114 | 9,252 | ||||||||||||
| Fossil - Coal |
(6 | ) | 1,187 | (13 | ) | 2,618 | ||||||||||
|
|
|
|
|
|
|
|
|
|||||||||
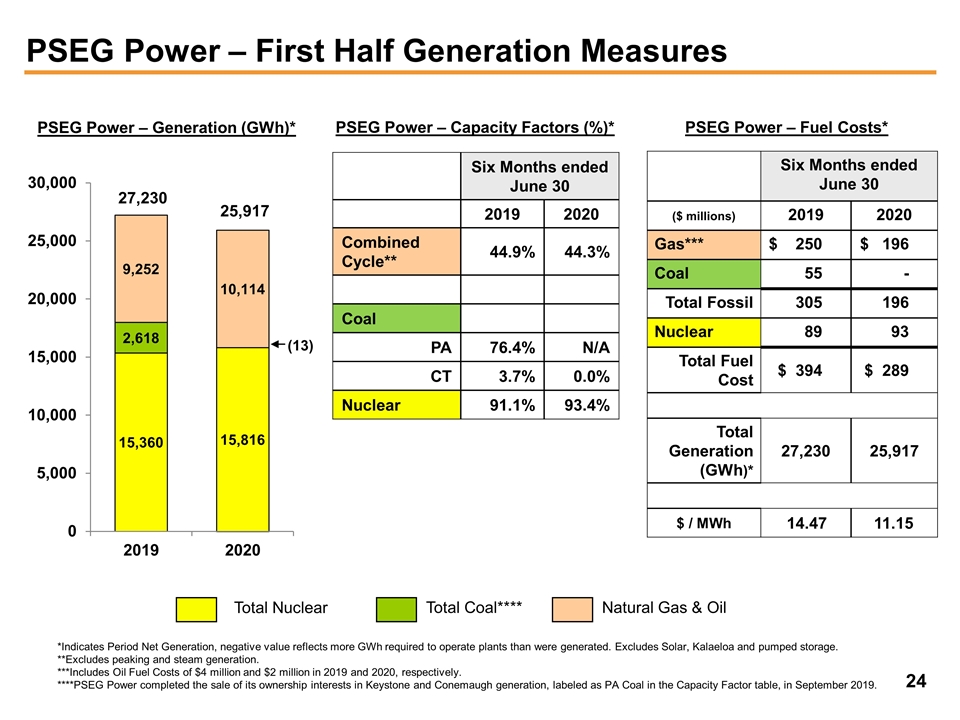
| 12,739 | 13,135 | 25,917 | 27,230 | |||||||||||||
|
|
|
|
|
|
|
|
|
|||||||||
| % Generation by Fuel Type | % Generation by Fuel Type | |||||||||||||||
| Three Months Ended | Six Months Ended | |||||||||||||||
| June 30, | June 30, | |||||||||||||||
| 2020 | 2019 | 2020 | 2019 | |||||||||||||
| Nuclear - NJ |
38 | % | 32 | % | 39 | % | 35 | % | ||||||||
| Nuclear - PA |
23 | % | 22 | % | 22 | % | 21 | % | ||||||||
|
|
|
|
|
|
|
|
|
|||||||||
| Total Nuclear |
61 | % | 54 | % | 61 | % | 56 | % | ||||||||
| Fossil - Natural Gas - NJ |
13 | % | 18 | % | 14 | % | 18 | % | ||||||||
| Fossil - Natural Gas - NY |
9 | % | 8 | % | 8 | % | 7 | % | ||||||||
| Fossil - Natural Gas - MD |
10 | % | 9 | % | 10 | % | 8 | % | ||||||||
| Fossil - Natural Gas - CT |
7 | % | 2 | % | 7 | % | 1 | % | ||||||||
|
|
|
|
|
|
|
|
|
|||||||||
| Total Natural Gas(2) |
39 | % | 37 | % | 39 | % | 34 | % | ||||||||
| Fossil - Coal |
0 | % | 9 | % | 0 | % | 10 | % | ||||||||
|
|
|
|
|
|
|
|
|
|||||||||
| 100 | % | 100 | % | 100 | % | 100 | % | |||||||||
|
|
|
|
|
|
|
|
|
|||||||||
| (1) | Indicates Period Net Generation, negative value reflects more GWh required to operate plants than were generated. Excludes Solar, Kalaeloa and pumped storage. |
| (2) | Includes several units that are dual fuel for oil. |
Attachment 7
PUBLIC SERVICE ENTERPRISE GROUP INCORPORATED
Statistical Measures
(Unaudited)
| Three Months Ended June 30, | Six Months Ended June 30, | |||||||||||||||
| 2020 | 2019 | 2020 | 2019 | |||||||||||||
| Weighted Average Common Shares Outstanding (millions) |
||||||||||||||||
| Basic |
504 | 504 | 504 | 504 | ||||||||||||
| Diluted |
507 | 507 | 507 | 507 | ||||||||||||
| Stock Price at End of Period |
$ | 49.16 | $ | 58.82 | ||||||||||||
| Dividends Paid per Share of Common Stock |
$ | 0.49 | $ | 0.47 | $ | 0.98 | $ | 0.94 | ||||||||
| Dividend Yield |
4.0 | % | 3.2 | % | ||||||||||||
| Book Value per Common Share |
$ | 30.75 | $ | 29.28 | ||||||||||||
| Market Price as a Percent of Book Value |
160 | % | 201 | % | ||||||||||||
Attachment 8
PUBLIC SERVICE ENTERPRISE GROUP INCORPORATED
Consolidated Operating Earnings (non-GAAP) Reconciliation
| Three Months Ended | Six Months Ended | |||||||||||||||
| June 30, | June 30, | |||||||||||||||
| Reconciling Items |
2020 | 2019 | 2020 | 2019 | ||||||||||||
| ($ millions, Unaudited) | ||||||||||||||||
| Net Income |
$ | 451 | $ | 153 | $ | 899 | $ | 853 | ||||||||
| (Gain) Loss on Nuclear Decommissioning Trust (NDT) Fund Related Activity, pre-tax (PSEG Power) |
(192 | ) | (41 | ) | 27 | (168 | ) | |||||||||
| (Gain) Loss on Mark-to-Market (MTM), pre-tax (a) (PSEG Power) |
107 | (210 | ) | — | (316 | ) | ||||||||||
| Plant Retirements and Dispositions, pre-tax (PSEG Power) |
— | 395 | — | 395 | ||||||||||||
| Oil Lower of Cost or Market (LOCOM) adjustment, pre-tax (PSEG Power) |
(9 | ) | — | 11 | — | |||||||||||
| Lease Related Activity, pre-tax (PSEG Enterprise/Other) |
— | 58 | — | 58 | ||||||||||||
| Income Taxes related to Operating Earnings (non-GAAP) reconciling items(b) |
47 | (61 | ) | (13 | ) | 19 | ||||||||||
|
|
|
|
|
|
|
|
|
|||||||||
| Operating Earnings (non-GAAP) |
$ | 404 | $ | 294 | $ | 924 | $ | 841 | ||||||||
|
|
|
|
|
|
|
|
|
|||||||||
| PSEG Fully Diluted Average Shares Outstanding (in millions) |
507 | 507 | 507 | 507 | ||||||||||||
| ($ Per Share Impact - Diluted, Unaudited) | ||||||||||||||||
| Net Income |
$ | 0.89 | $ | 0.30 | $ | 1.77 | $ | 1.68 | ||||||||
| (Gain) Loss on NDT Fund Related Activity, pre-tax (PSEG Power) |
(0.39 | ) | (0.08 | ) | 0.05 | (0.33 | ) | |||||||||
| (Gain) Loss on MTM, pre-tax (a) (PSEG Power) |
0.21 | (0.41 | ) | — | (0.62 | ) | ||||||||||
| Plant Retirements and Dispositions, pre-tax (PSEG Power) |
— | 0.78 | — | 0.78 | ||||||||||||
| Oil LOCOM adjustment, pre-tax (PSEG Power) |
(0.02 | ) | — | 0.02 | — | |||||||||||
| Lease Related Activity, pre-tax (PSEG Enterprise/Other) |
— | 0.11 | — | 0.11 | ||||||||||||
| Income Taxes related to Operating Earnings (non-GAAP) reconciling items(b) |
0.10 | (0.12 | ) | (0.02 | ) | 0.04 | ||||||||||
|
|
|
|
|
|
|
|
|
|||||||||
| Operating Earnings (non-GAAP) |
$ | 0.79 | $ | 0.58 | $ | 1.82 | $ | 1.66 | ||||||||
|
|
|
|
|
|
|
|
|
|||||||||
| (a) | Includes the financial impact from positions with forward delivery months. |
| (b) | Income tax effect calculated at the statutory rate except for lease related activity which is calculated at a combined leveraged lease effective tax rate, and NDT related activity which is calculated at the statutory rate plus a 20% tax on income (loss) from qualified NDT funds. |
Attachment 9
PSEG Power Operating Earnings (non-GAAP) and Adjusted EBITDA (non-GAAP) Reconciliation
| Three Months Ended | Six Months Ended | |||||||||||||||
| June 30, | June 30, | |||||||||||||||
| Reconciling Items |
2020 | 2019 | 2020 | 2019 | ||||||||||||
| ($ millions, Unaudited) | ||||||||||||||||
| Net Income (Loss) |
$ | 170 | $ | (40 | ) | $ | 183 | $ | 256 | |||||||
| (Gain) Loss on NDT Fund Related Activity, pre-tax |
(192 | ) | (41 | ) | 27 | (168 | ) | |||||||||
| (Gain) Loss on MTM, pre-tax (a) |
107 | (210 | ) | — | (316 | ) | ||||||||||
| Plant Retirements and Dispositions, pre-tax |
— | 395 | — | 395 | ||||||||||||
| Oil LOCOM adjustment, pre-tax |
(9 | ) | — | 11 | — | |||||||||||
| Income Taxes related to Operating Earnings (non-GAAP) reconciling items(b) |
47 | (35 | ) | (13 | ) | 45 | ||||||||||
|
|
|
|
|
|
|
|
|
|||||||||
| Operating Earnings (non-GAAP) |
$ | 123 | $ | 69 | $ | 208 | $ | 212 | ||||||||
| Depreciation and Amortization, pre-tax (c) |
89 | 94 | 182 | 187 | ||||||||||||
| Interest Expense, pre-tax (c) (d) |
29 | 24 | 62 | 48 | ||||||||||||
| Income Taxes (c) |
17 | 24 | 7 | 68 | ||||||||||||
|
|
|
|
|
|
|
|
|
|||||||||
| Adjusted EBITDA (non-GAAP) |
$ | 258 | $ | 211 | $ | 459 | $ | 515 | ||||||||
|
|
|
|
|
|
|
|
|
|||||||||
| PSEG Fully Diluted Average Shares Outstanding (in millions) |
507 | 507 | 507 | 507 | ||||||||||||
| (a) | Includes the financial impact from positions with forward delivery months. |
| (b) | Income tax effect calculated at the statutory rate except for NDT related activity which is calculated at the statutory rate plus a 20% tax on income (loss) from qualified NDT funds. |
| (c) | Excludes amounts related to Operating Earnings (non-GAAP) reconciling items. |
| (d) | Net of capitalized interest. |
PSEG Enterprise/Other
Operating Earnings (non-GAAP) Reconciliation
| Three Months Ended | Six Months Ended | |||||||||||||||
| June 30, | June 30, | |||||||||||||||
| Reconciling Items |
2020 | 2019 | 2020 | 2019 | ||||||||||||
| ($ millions, Unaudited) | ||||||||||||||||
| Net Income (Loss) |
$ | (2 | ) | $ | (34 | ) | $ | (7 | ) | $ | (33 | ) | ||||
| Lease Related Activity, pre-tax |
— | 58 | — | 58 | ||||||||||||
| Income Taxes related to Lease related activity(a) |
— | (26 | ) | — | (24 | ) | ||||||||||
|
|
|
|
|
|
|
|
|
|||||||||
| Operating Earnings (non-GAAP) |
$ | (2 | ) | $ | (2 | ) | $ | (7 | ) | $ | 1 | |||||
|
|
|
|
|
|
|
|
|
|||||||||
| PSEG Fully Diluted Average Shares Outstanding (in millions) |
507 | 507 | 507 | 507 | ||||||||||||
| (a) | Income tax effect calculated at a combined leveraged lease effective tax rate. |