8-K
falsefalse00000810330000788784 0000788784 2025-04-30 2025-04-30 0000788784 pseg:PublicServiceElectricAndGasCompanyMember 2025-04-30 2025-04-30 0000788784 pseg:PublicServiceElectricAndGasCompanyMember pseg:FirstAndRefundingMortgageBondsEightPercentDueTwoThousandThirtySevenMember 2025-04-30 2025-04-30 0000788784 us-gaap:CommonStockMember 2025-04-30 2025-04-30 0000788784 pseg:PublicServiceElectricAndGasCompanyMember pseg:FirstAndRefundingMortgageBondsFivePercentDueTwoThousandThirtySevenMember 2025-04-30 2025-04-30
 
 
UNITED STATES
SECURITIES AND EXCHANGE COMMISSION
Washington, D.C. 20549
 
 
FORM
8-K
 
 
CURRENT REPORT
Pursuant to Section 13 or 15(d)
of the Securities Exchange Act of 1934
Date of Report (Date of earliest event reported)
April 30, 2025
 
 
Public Service Enterprise Group Incorporated
(Exact name of registrant as specified in its charter)


New Jersey
 
001-09120
 
22-2625848
(State or other jurisdiction
of incorporation)
 
(Commission
File Number)
 
(I.R.S. Employer
Identification Number)
80 Park Plaza
Newark
,
New Jersey
07102
(Address of principal executive offices) (Zip Code)
973
430
-
7000
(Registrant’s telephone number, including area code)
 
 
Public Service Electric and Gas Company
(Exact name of registrant as specified in its charter)


New Jersey
 
001-00973
 
22-1212800
(State or other jurisdiction
of incorporation)
 
(Commission
File Number)
 
(I.R.S. Employer
Identification Number)
80 Park Plaza
Newark
,
New Jersey
07102
(Address of principal executive offices) (Zip Code)
973 430-7000
(Registrant’s telephone number, including area code)
 
 
Check the appropriate box below if the Form
8-K
filing is intended to simultaneously satisfy the filing obligation of the registrant under any of the following provisions (see General Instruction A.2. below):
 
Written communications pursuant to Rule 425 under the Securities Act (17 CFR 230.425)
 
Soliciting material pursuant to Rule
14a-12
under the Exchange Act (17 CFR
240.14a-12)
 
Pre-commencement
communications pursuant to Rule
14d-2(b)
under the Exchange Act (17 CFR
240.14d-2(b))
 
Pre-commencement
communications pursuant to Rule
13e-4(c)
under the Exchange Act (17 CFR
240.13e-4(c))
Securities registered pursuant to Section 12(b) of the Act:
 
Title of Each Class
 
Trading
Symbol(s)
 
Name of Each Exchange
On Which Registered
Public Service Enterprise Group Incorporated
Common Stock without par value
  PEG   New York Stock Exchange
Public Service Electric and Gas Company
8.00% First and Refunding Mortgage Bonds, due 2037   PEG37D   New York Stock Exchange
5.00% First and Refunding Mortgage Bonds, due 2037   PEG37J   New York Stock Exchange
Indicate by check mark whether any of the registrants is an emerging growth company as defined in Rule 405 of the Securities Act of 1933 (§230.405 of this chapter) or Rule
12b-2
of the Securities Exchange Act of 1934
(§240.12b-2
of this chapter).
Emerging growth company 
 
If an emerging growth company, indicate by check mark if such registrant has elected not to use the extended transition period for complying with any new or revised financial accounting standards provided pursuant to Section 13(a) of the Exchange Act.   


The information contained in Item 2.02. Results of Operations and Financial Condition in this Form
8-K
is furnished solely for Public Service Enterprise Group Incorporated (PSEG). The information contained in Item 7.01 Regulation FD Disclosure in this combined Form
8-K
is separately furnished, as noted, by PSEG and Public Service Electric and Gas Company (PSE&G). Information contained herein relating to any individual company is provided by such company on its own behalf and in connection with its respective Form
8-K.
PSE&G makes representations only as to itself and makes no other representations whatsoever as to any other company. The materials furnished as Exhibits 99 and 99.1 are available on the corporate.pseg.com website under the investor tab, or at https://investor.pseg.com.
 
Item 2.02
Results of Operations and Financial Condition
PSEG
On April 30, 2025, PSEG announced financial results for the three months ended March 31, 2025. A copy of the earnings release dated April 30, 2025 is furnished as Exhibit 99 to this Form
8-K.
 
Item 7.01
Regulation FD Disclosure
PSEG and PSE&G
On April 30, 2025, PSEG conducted an earnings call regarding its results for the three months ended March 31, 2025. A copy of the slideshow presentation used during the earnings call is furnished as Exhibit 99.1 to this Form
8-K.
 
Item 9.01
Financial Statements and Exhibits
 
Exhibit 99    Press Release dated April 30, 2025
Exhibit 99.1    Slideshow Presentation
Exhibit 104    Cover Page Interactive Data File (embedded within the Inline XBRL document)
 
2

SIGNATURE
Pursuant to the requirements of the Securities Exchange Act of 1934, the registrant has duly caused this report to be signed on its behalf by the undersigned thereunto duly authorized. The signature of the undersigned company shall be deemed to relate only to matters having reference to such company and any subsidiaries thereof.
 
PUBLIC SERVICE ENTERPRISE GROUP INCORPORATED
  (Registrant)
By:  
/s/ Rose M. Chernick
  ROSE M. CHERNICK
  Vice President and Controller
  (Principal Accounting Officer)
Date: April 30, 2025
SIGNATURE
Pursuant to the requirements of the Securities Exchange Act of 1934, the registrant has duly caused this report to be signed on its behalf by the undersigned thereunto duly authorized. The signature of the undersigned company shall be deemed to relate only to matters having reference to such company and any subsidiaries thereof.
 
PUBLIC SERVICE ELECTRIC AND GAS COMPANY
    
  (Registrant)
By:  
/s/ Rose M. Chernick
  ROSE M. CHERNICK
  Vice President and Controller
  (Principal Accounting Officer)
Date: April 30, 2025
 
3

Exhibit 99


LOGO   

Public Service Enterprise Group

80 Park Plaza

Newark, NJ 07102

PSEG ANNOUNCES FIRST QUARTER 2025 RESULTS

$1.18 PER SHARE NET INCOME

$1.43 PER SHARE NON-GAAP OPERATING EARNINGS

Maintains 2025 Non-GAAP Operating Earnings Guidance of $3.94 - $4.06 Per Share

(NEWARK, N.J. – April 30, 2025) Public Service Enterprise Group (NYSE: PEG) reported the following results for the first quarter 2025:

PSEG Consolidated (unaudited)

First Quarter Comparative Results


     Income      Earnings Per Share  

($ millions, except per share amounts)

   1Q 2025      1Q 2024      1Q 2025      1Q 2024  

Net Income

   $ 589      $ 532      $ 1.18      $ 1.06  

Reconciling Items

     129        125        0.25        0.25  

Non-GAAP Operating Earnings

   $ 718      $ 657      $ 1.43      $ 1.31  

Average Shares Outstanding (Diluted)

           500        500  

See Attachments 7 and 8 for a complete list of items excluded from Net Income in the determination of non-GAAP Operating Earnings.

“PSEG delivered a solid operating and financial performance to begin the year. Our service territory experienced multiple cold spells in January and February with temperatures remaining below 20°F for several days in a row, prompting the highest winter peak load for both gas and electric in the last six years. During these challenging conditions, our electric and gas operations maintained high levels of reliability and efficient customer response times,” said Ralph LaRossa, PSEG’s chair, president and CEO.

“Our regulated capital investment plan for 2025 remains focused on infrastructure replacement and modernization to ensure safe and reliable service, and to meet growing customer demand. PSE&G also began rolling out the second phase of its Clean Energy Future - Energy Efficiency II program, which helps customers save energy, lower their bills and reduce carbon emissions while supporting job training and economic growth in New Jersey.”

“PSE&G experienced another quarterly increase in large load inquiries for new service connections. This pipeline totaled over 6,400 MW of capacity requested as of March 31, and our engineers have been responding to these inquiries on a timely basis – still


1


averaging about four months. Our speed to response is supportive of the state objective to spur economic development. To the extent these large load prospects convert into new utility customers in the future, fixed costs are spread over a larger user base, which helps to lower existing customer bills.”

“At PSEG Nuclear, we generated approximately 8.4 terawatt hours of energy during the first quarter, supplying the grid with 24x7, carbon-free power and achieving a capacity factor of 99.9%.”

LaRossa added, “PSEG’s focus on increasing the predictability of our results continues to benefit both customers and the company, aided by our Conservation Incentive Program, and deferral mechanisms from the recently concluded rate case. We also constantly manage our cost structure to keep bills as low as possible. Preserving PSEG’s financial flexibility helps us to accomplish our financial and strategic goals, including executing on PSE&G’s regulated capital investment plan, which is on track and on budget.”

“PSEG continues to pursue opportunities to grow our existing 5% to 7% compound annual growth outlook for non-GAAP Operating Earnings over the 2025 to 2029 period, including the potential to contract our nuclear output under long-term agreements.”

“PSEG also declared a first-quarter common stock dividend of $0.63 per share, representing an indicative annual rate of $2.52 per share, a 5% increase for 2025,” said LaRossa.

PSEG Results by Segment (unaudited)

First Quarter Comparative Results


($ millions)

   1Q 2025      1Q 2024  

PSE&G Net Income/Non-GAAP Operating Earnings

   $ 546      $ 488  

PSEG Power & Other Net Income

     43        44  

Total PSEG Net Income

   $ 589      $ 532  

PSEG Power & Other Non-GAAP Operating Earnings

   $ 172      $ 169  

Total PSEG Non-GAAP Operating Earnings

   $ 718      $ 657  

PSE&G’s results for the first quarter reflect new electric and gas base distribution rates in effect for a full quarter following the October 15, 2024 implementation date. This increase in revenue reflected over $3 billion of investments made in the electric and gas systems over the past several years. The improvement in results also reflects the seasonality of higher gas revenue collection during the winter months, which was partly offset by higher operation and maintenance costs as well as higher depreciation and interest expense from recent capital investments.


2


PSEG Power & Other results for the quarter reflect the positive impact of our consistent and reliable nuclear generation performance coupled with higher realized prices, primarily driven by the cold weather experienced in January and February.

###

PSEG will host a conference call to review its first quarter 2025 results, earnings guidance, and other matters with the financial community at 11:00 a.m. ET today. Please register to access this event by visiting:

https://investor.pseg.com/investor-news-and-events


Media Relations:    Investor Relations:

(973) 430-7734

[email protected]

   (973) 430-6565

[email protected]

About PSEG

Public Service Enterprise Group (PSEG) (NYSE: PEG) is a predominantly regulated infrastructure company operating New Jersey’s largest transmission and distribution utility, serving approximately 2.4 million electric and 1.9 million natural gas customers. PSEG also owns an independent fleet of 3,758 MW of carbon-free, baseload nuclear power generating units in NJ and PA. Guided by its Powering Progress vision, PSEG aims to power a future where people use less energy, and it’s cleaner, safer and delivered more reliably than ever. PSEG is a member of the S&P 500 Index and has been named to the Dow Jones Sustainability North America Index for 17 consecutive years. PSEG’s businesses include Public Service Electric and Gas Co. (PSE&G), PSEG Power and PSEG Long Island (https://corporate.pseg.com).

Non-GAAP Financial Measures

Management uses non-GAAP Operating Earnings in its internal analysis, and in communications with investors and analysts, as a consistent measure for comparing PSEG’s financial performance to previous financial results. Non-GAAP Operating Earnings exclude the impact of gains (losses) associated with the Nuclear Decommissioning Trust (NDT), Mark-to-Market (MTM) accounting and other material infrequent items.

See Attachments 7 and 8 for a complete list of items excluded from Net Income in the determination of non-GAAP Operating Earnings. The presentation of non-GAAP Operating Earnings is intended to complement and should not be considered an alternative to the presentation of Net Income, which is an indicator of financial performance determined in accordance with GAAP. In addition, non-GAAP Operating Earnings as presented in this report may not be comparable to similarly titled measures used by other companies.

Due to the forward-looking nature of non-GAAP Operating Earnings guidance, PSEG is unable to reconcile this non-GAAP financial measure to the most directly comparable GAAP financial measure because comparable GAAP measures are not reasonably accessible or reliable due to the inherent difficulty in forecasting and quantifying measures that would be required for such reconciliation. Namely, we are not able to reliably project without unreasonable effort MTM and NDT gains (losses), for future periods due to market volatility. These items are uncertain, depend on various factors, and may have a material impact on our future GAAP results.


3


Forward-Looking Statements

Certain of the matters discussed in this report about our and our subsidiaries’ future performance, including, without limitation, future revenues, earnings, strategies, prospects, consequences, and all other statements that are not purely historical constitute “forward-looking statements” within the meaning of the Private Securities Litigation Reform Act of 1995. Such forward-looking statements are subject to risks and uncertainties, which could cause actual results to differ materially from those anticipated. Such statements are based on management’s beliefs as well as assumptions made by and information currently available to management. When used herein, the words “anticipate,” “intend,” “estimate,” “believe,” “expect,” “plan,” “should,” “hypothetical,” “potential,” “forecast,” “project,” variations of such words and similar expressions are intended to identify forward-looking statements. Factors that may cause actual results to differ are often presented with the forward-looking statements themselves. Other factors that could cause actual results to differ materially from those contemplated in any forward-looking statements made by us herein are discussed in filings we make with the United States Securities and Exchange Commission (SEC), including our Annual Report on Form 10-K and subsequent reports on Form 10-Q and Form 8-K. These factors include, but are not limited to:


any inability to successfully develop, obtain regulatory approval for, or construct transmission and distribution, and our nuclear generation projects;


the physical, financial and transition risks related to climate change, including risks relating to potentially increased legislative and regulatory burdens, changing customer preferences and lawsuits;


any equipment failures, accidents, critical operating technology or business system failures, natural disasters, severe weather events, acts of war, terrorism or other acts of violence, sabotage, physical attacks or security breaches, cyberattacks or other incidents that may impact our ability to provide safe and reliable service to our customers;


any inability to recover the carrying amount of our long-lived assets;


disruptions or cost increases in our supply chain, including labor shortages;


any inability to maintain sufficient liquidity or access sufficient capital on commercially reasonable terms;


the impact of cybersecurity attacks or intrusions or other disruptions to our information technology, operational or other systems;


an increasing demand for power and load growth, potentially compounded by a shift away from natural gas toward increased electrification;


failure to attract and retain a qualified workforce;


increases in the costs of equipment, materials, fuel, services and labor;


the impact of our covenants in our debt instruments and credit agreements on our business;


adverse performance of our defined benefit plan trust funds and Nuclear Decommissioning Trust Fund and increases in funding requirements;


any inability to enter into or extend certain significant contracts;


development, adoption and use of Artificial Intelligence by us and our third-party vendors;


fluctuations in, or third-party default risk in wholesale power and natural gas markets, including the potential impacts on the economic viability of our generation units;


our ability to obtain adequate nuclear fuel supply;


changes in technology related to energy generation, distribution and consumption and changes in customer usage patterns;


third-party credit risk relating to our sale of nuclear generation output and purchase of nuclear fuel;


any inability to meet our commitments under forward sale obligations and Regional Transmission Organization rules;


the impact of changes in state and federal legislation and regulations on our business, including PSE&G’s ability to recover costs and earn returns on authorized investments;


PSE&G’s proposed investment projects or programs may not be fully approved by regulators and its capital investment may be lower than planned;


our ability to receive sufficient financial support for our New Jersey nuclear plants from the markets, production tax credit and/or zero emission certificates program;


adverse changes in and non-compliance with energy industry laws, policies, regulations and standards, including market structures and transmission planning and transmission returns;


risks associated with our ownership and operation of nuclear facilities and third-party operation of co-owned nuclear facilities, including increased nuclear fuel storage costs, regulatory risks, such as compliance with the Atomic Energy Act and trade control, environmental and other regulations, as well as operational, financial, environmental and health and safety risks;


changes in federal, state and local environmental laws and regulations and enforcement;


delays in receipt of, or an inability to receive, necessary licenses and permits and siting approvals; and


changes in tax laws and regulations.

All of the forward-looking statements made in this report are qualified by these cautionary statements and we cannot assure you that the results or developments anticipated by management will be realized or even if realized, will have the expected consequences to, or effects on, us or our business, prospects, financial condition, results of operations or cash flows. Readers are cautioned not to place undue reliance on these forward-looking statements in making any investment decision. Forward-looking statements made in this report apply only as of the date of this report. While we may elect to update forward-looking statements from time to time, we specifically disclaim any obligation to do so, even in light of new information or future events, unless otherwise required by applicable securities laws.


4


The forward-looking statements contained in this report are intended to qualify for the safe harbor provisions of Section 27A of the Securities Act of 1933, as amended, and Section 21E of the Securities Exchange Act of 1934, as amended.


From time to time, PSEG and PSE&G release important information via postings on their corporate Investor Relations website at https://investor.pseg.com. Investors and other interested parties are encouraged to visit the Investor Relations website to review new postings. You can sign up for automatic email alerts regarding new postings at the bottom of the webpage at https://investor.pseg.com or by navigating to the Email Alerts webpage here. The information on https://investor.pseg.com and https://investor.pseg.com/resources/email-alerts/default.aspx is not incorporated herein and is not part of this press release or the Form 8-K to which it is an exhibit.


5


Attachment 1

Public Service Enterprise Group Incorporated

Consolidating Statements of Operations

(Unaudited, $ millions, except per share data)


     Three Months Ended March 31, 2025  
     PSEG     Eliminations     PSE&G     PSEG
Power &
Other(a)
 

OPERATING REVENUES

   $ 3,222     $ (534   $ 2,664     $ 1,092  

OPERATING EXPENSES


Energy Costs

     1,186       (534     1,094       626  

Operation and Maintenance

     919       —        576       343  

Depreciation and Amortization

     320       —        280       40  


Total Operating Expenses

     2,425       (534     1,950       1,009  

OPERATING INCOME

     797       —        714       83  

Net Gains (Losses) on Trust Investments

     8       —        —        8  

Net Other Income (Deductions)

     37       (1     16       22  

Net Non-Operating Pension and OPEB Credits (Costs)

     16       —        17       (1

Interest Expense

     (241     1       (157     (85


INCOME BEFORE INCOME TAXES

     617       —        590       27  

Income Tax (Expense) Benefit

     (28     —        (44     16  


NET INCOME

   $ 589     $ —      $ 546     $ 43  


Reconciling Items Excluded from Net Income(b)

     129       —        —        129  


OPERATING EARNINGS (non-GAAP)

   $ 718     $ —      $ 546     $ 172  


Earnings Per Share


NET INCOME

   $ 1.18        


Reconciling Items Excluded from Net Income(b)

     0.25        


OPERATING EARNINGS (non-GAAP)

   $ 1.43        


     Three Months Ended March 31, 2024  
     PSEG     Eliminations     PSE&G     PSEG Power
& Other(a)
 

OPERATING REVENUES

   $ 2,760     $ (445   $ 2,333     $ 872  

OPERATING EXPENSES


Energy Costs

     997       (445     928       514  

Operation and Maintenance

     783       —        465       318  

Depreciation and Amortization

     295       —        257       38  


Total Operating Expenses

     2,075       (445     1,650       870  

OPERATING INCOME

     685       —        683       2  

Net Gains (Losses) on Trust Investments

     95       —        —        95  

Net Other Income (Deductions)

     35       (1     16       20  

Net Non-Operating Pension and OPEB Credits (Costs)

     19       —        19       —   

Interest Expense

     (205     1       (138     (68


INCOME BEFORE INCOME TAXES

     629       —        580       49  

Income Tax Expense

     (97     —        (92     (5


NET INCOME

   $ 532     $ —      $ 488     $ 44  


Reconciling Items Excluded from Net Income(b)

     125       —        —        125  


OPERATING EARNINGS (non-GAAP)

   $ 657     $ —      $ 488     $ 169  


Earnings Per Share


NET INCOME

   $ 1.06        


Reconciling Items Excluded from Net Income(b)

     0.25        


OPERATING EARNINGS (non-GAAP)

   $ 1.31        


(a)

Includes activities at PSEG Power, PSEG Long Island, Energy Holdings, PSEG Services Corporation and the Parent.

(b)

See Attachments 7 and 8 for details of items excluded from Net Income to compute Operating Earnings (non-GAAP).


Attachment 2


Public Service Enterprise Group Incorporated

Capitalization Schedule

(Unaudited, $ millions)


     March 31,
2025
    December 31,
2024
 

DEBT


Commercial Paper and Loans

   $ 400     $ 1,593  

Long-Term Debt*

     22,998       21,114  


Total Debt

     23,398       22,707  

STOCKHOLDERS’ EQUITY


Common Stock

     5,014       5,057  

Treasury Stock

     (1,376     (1,403

Retained Earnings

     12,868       12,593  

Accumulated Other Comprehensive Loss

     (136     (133


Total Stockholders’ Equity

     16,370       16,114  


Total Capitalization

   $ 39,768     $ 38,821  


*

Includes current portion of Long-Term Debt


Attachment 3


Public Service Enterprise Group Incorporated

Condensed Consolidated Statements of Cash Flows

(Unaudited, $ millions)


     Three Months Ended March 31,  
     2025     2024  

Cash Flows From Operating Activities


Net Income

   $ 589     $ 532  

Adjustments to Reconcile Net Income to Net Cash Flows From Operating Activities

     460       129  


Net Cash Provided By (Used In) Operating Activities

     1,049       661  


Net Cash Provided By (Used In) Investing Activities

     (618     (785


Net Cash Provided By (Used In) Financing Activities

     345       1,249  


Net Change in Cash, Cash Equivalents and Restricted Cash

     776       1,125  

Cash, Cash Equivalents and Restricted Cash at Beginning of Period

     154       99  


Cash, Cash Equivalents and Restricted Cash at End of Period

   $ 930     $ 1,224  


Attachment 4


Public Service Electric & Gas Company

Retail Sales

(Unaudited)

March 31, 2025

Electric Sales


Sales (millions kWh)

   Three Months
Ended
     Change vs.
2024
 

Residential

     3,290        6

Commercial & Industrial

     6,578        1

Other

     101        1


Total

     9,969        2


Gas Sold and Transported


Sales (millions therms)

   Three Months
Ended
     Change vs.
2024
 

Firm Sales


Residential Sales

     747        14

Commercial & Industrial

     495        11


Total Firm Sales

     1,242        13


Non-Firm Sales*


Commercial & Industrial

     130        (25 %) 


Total Non-Firm Sales

     130     


Total Sales

     1,372        7


*

Contract Service Gas rate included in non-firm sales

Weather Data*


     Three Months
Ended
     Change vs.
2024
 

Degree Days - Actual

     2,376        13

Degree Days - Normal

     2,485     


*

Winter weather as defined by heating degree days (HDD) to serve as a measure for the need for heating. For each day, HDD is calculated as HDD = 65°F – the average hourly daily temperature. The measures use data provided by the National Oceanic and Atmospheric Administration based on readings from Newark Liberty International Airport. Comparisons to normal are based on twenty years of historic data.


Attachment 5


Nuclear Generation Measures

(Unaudited)


     GWh Breakdown  
     Three Months Ended  
     March 31,  
     2025      2024  

Nuclear - NJ

     5,464        5,337  

Nuclear - PA

     2,891        2,864  


     8,355        8,201  


Attachment 6


Public Service Enterprise Group Incorporated

Statistical Measures

(Unaudited)


     Three Months Ended
March 31,
 
     2025     2024  

Weighted Average Common Shares Outstanding (millions)


Basic

     498       499  

Diluted

     500       500  

Stock Price at End of Period

   $ 82.30     $ 66.78  

Dividends Paid per Share of Common Stock

   $ 0.63     $ 0.60  

Dividend Yield

     3.1     3.6

Book Value per Common Share

   $ 32.83     $ 31.54  

Market Price as a Percent of Book Value

     251     212


Attachment 7


Public Service Enterprise Group Incorporated

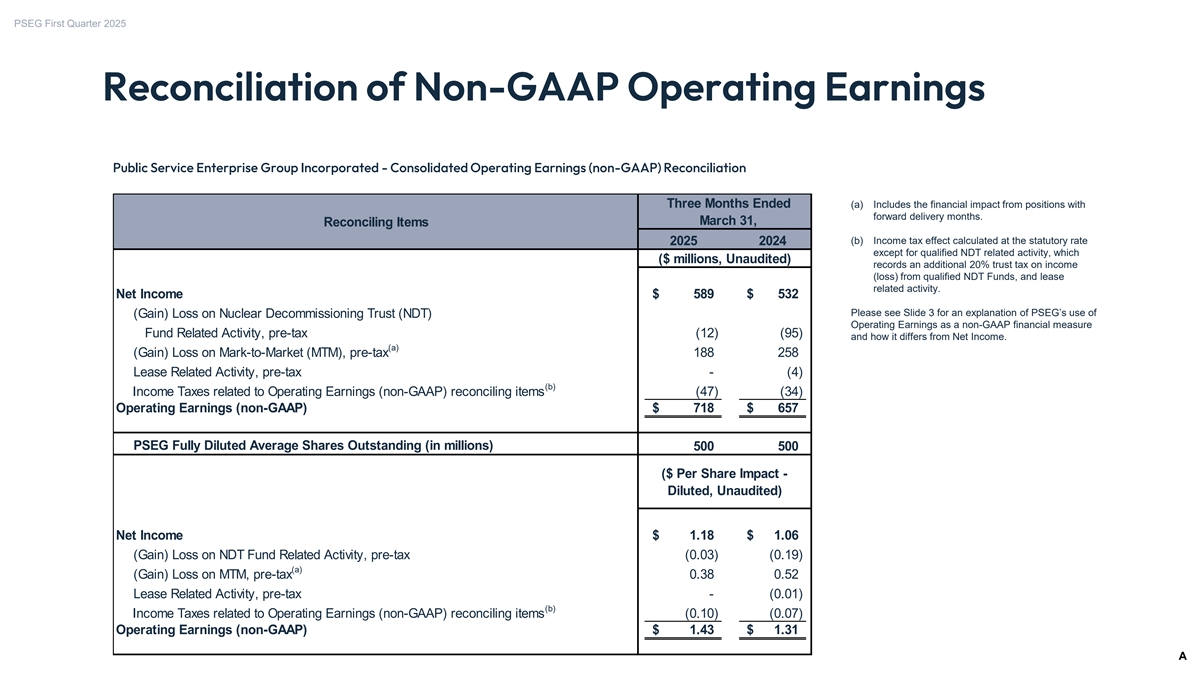
Consolidated Operating Earnings (non-GAAP) Reconciliation


     Three Months Ended  

Reconciling Items

   March 31,  
     2025     2024  
     ($ millions, Unaudited)  

Net Income

   $ 589     $ 532  

(Gain) Loss on Nuclear Decommissioning Trust (NDT) Fund Related Activity, pre-tax

     (12     (95

(Gain) Loss on Mark-to-Market (MTM), pre-tax(a)

     188       258  

Lease Related Activity, pre-tax

     —        (4

Income Taxes related to Operating Earnings (non-GAAP) reconciling items(b)

     (47     (34


Operating Earnings (non-GAAP)

   $ 718     $ 657  


PSEG Fully Diluted Average Shares Outstanding (in millions)

     500       500  
     ($ Per Share Impact -
Diluted, Unaudited)
 

Net Income

   $ 1.18     $ 1.06  

(Gain) Loss on NDT Fund Related Activity, pre-tax

     (0.03     (0.19

(Gain) Loss on MTM, pre-tax(a)

     0.38       0.52  

Lease Related Activity, pre-tax

     —        (0.01

Income Taxes related to Operating Earnings (non-GAAP) reconciling items(b)

     (0.10     (0.07


Operating Earnings (non-GAAP)

   $ 1.43     $ 1.31  


(a)

Includes the financial impact from positions with forward delivery months.

(b)

Income tax effect calculated at the statutory rate except for qualified NDT related activity, which records an additional 20% trust tax on income (loss) from qualified NDT Funds, and lease related activity.


Attachment 8


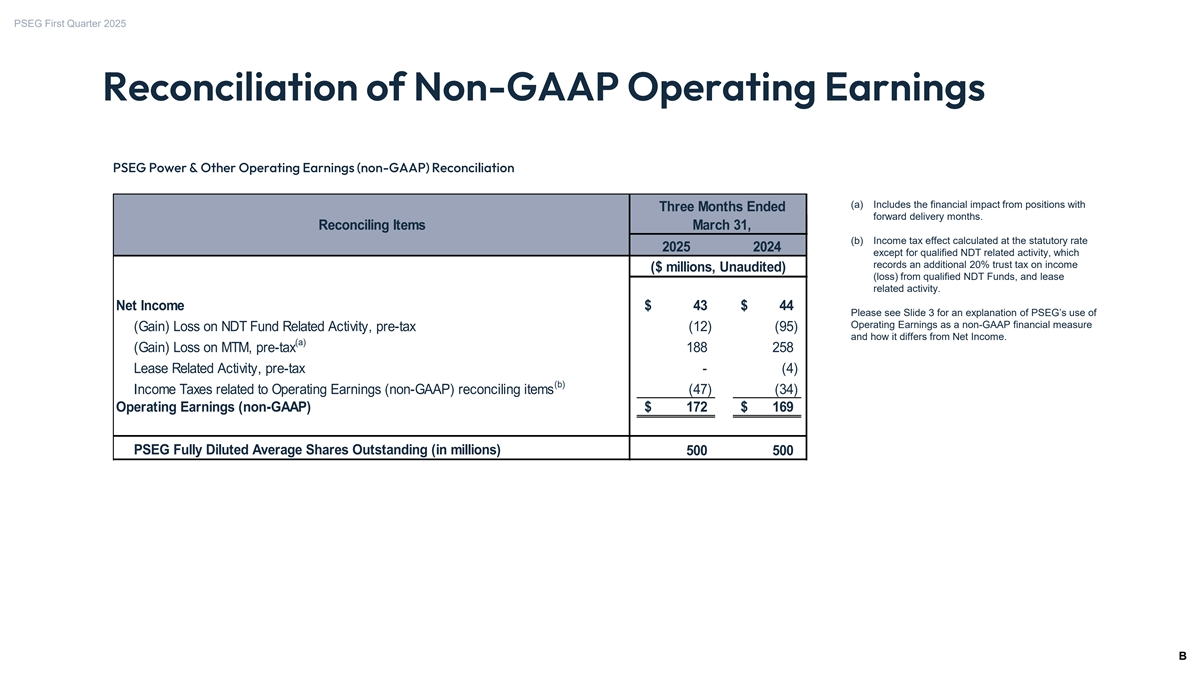
PSEG Power & Other Operating Earnings (non-GAAP) Reconciliation


Reconciling Items

   Three Months Ended
March 31,
 
     2025     2024  
     ($ millions, Unaudited)  

Net Income

   $ 43     $ 44  

(Gain) Loss on NDT Fund Related Activity, pre-tax

     (12     (95

(Gain) Loss on MTM, pre-tax(a)

     188       258  

Lease Related Activity, pre-tax

     —        (4

Income Taxes related to Operating Earnings (non-GAAP) reconciling items(b)

     (47     (34


Operating Earnings (non-GAAP)

   $ 172     $ 169  


PSEG Fully Diluted Average Shares Outstanding (in millions)

     500       500  


(a)

Includes the financial impact from positions with forward delivery months.

(b)

Income tax effect calculated at the statutory rate except for qualified NDT related activity, which records an additional 20% trust tax on income (loss) from qualified NDT Funds, and lease related activity.

Exhibit 99.1 Public Service Enterprise Group FIRST QUARTER 2025 NYSE: PEG Financial Results Presentation April 30, 2025


PSEG First Quarter 2025 Forward-Looking Statements Certain of the matters discussed in this report about our and our subsidiaries’ future performance, • fluctuations in, or third-party default risk in wholesale power and natural gas markets, including the potential impacts on the economic viability of our generation units; including, without limitation, future revenues, earnings, strategies, prospects, consequences, and • our ability to obtain adequate nuclear fuel supply; all other statements that are not purely historical constitute “forward-looking statements” within • changes in technology related to energy generation, distribution and consumption and the meaning of the Private Securities Litigation Reform Act of 1995. Such forward-looking changes in customer usage patterns; statements are subject to risks and uncertainties, which could cause actual results to differ • third-party credit risk relating to our sale of nuclear generation output and purchase of nuclear fuel; materially from those anticipated. Such statements are based on management’s beliefs as well as • any inability to meet our commitments under forward sale obligations and Regional assumptions made by and information currently available to management. When used herein, the Transmission Organization rules; words “anticipate,” “intend,” “estimate,” “believe,” “expect,” “plan,” “should,” “hypothetical,” • the impact of changes in state and federal legislation and regulations on our business, “potential,” “forecast,” “project,” variations of such words and similar expressions are intended to including PSE&G’s ability to recover costs and earn returns on authorized investments; • PSE&G’s proposed investment projects or programs may not be fully approved by identify forward-looking statements. Factors that may cause actual results to differ are often regulators and its capital investment may be lower than planned; presented with the forward-looking statements themselves. Other factors that could cause actual • our ability to receive sufficient financial support for our New Jersey nuclear plants from results to differ materially from those contemplated in any forward-looking statements made by us the markets, production tax credit and/or zero emission certificates program; herein are discussed in filings we make with the United States Securities and Exchange • adverse changes in and non-compliance with energy industry laws, policies, regulations and standards, including market structures and transmission planning and transmission Commission (SEC), including our Annual Report on Form 10-K and subsequent reports on Form returns; 10-Q and Form 8-K. These factors include, but are not limited to: • risks associated with our ownership and operation of nuclear facilities and third-party • any inability to successfully develop, obtain regulatory approval for, or construct operation of co-owned nuclear facilities, including increased nuclear fuel storage costs, transmission and distribution, and our nuclear generation projects; regulatory risks, such as compliance with the Atomic Energy Act and trade control, • the physical, financial and transition risks related to climate change, including risks relating environmental and other regulations, as well as operational, financial, environmental and to potentially increased legislative and regulatory burdens, changing customer preferences health and safety risks; and lawsuits; • changes in federal, state and local environmental laws and regulations and enforcement; • any equipment failures, accidents, critical operating technology or business system • delays in receipt of, or an inability to receive, necessary licenses and permits and siting failures, natural disasters, severe weather events, acts of war, terrorism or other acts of approvals; and violence, sabotage, physical attacks or security breaches, cyberattacks or other incidents • changes in tax laws and regulations. that may impact our ability to provide safe and reliable service to our customers; • any inability to recover the carrying amount of our long-lived assets; All of the forward-looking statements made in this report are qualified by these cautionary • disruptions or cost increases in our supply chain, including labor shortages; statements and we cannot assure you that the results or developments anticipated by • any inability to maintain sufficient liquidity or access sufficient capital on commercially management will be realized or even if realized, will have the expected consequences to, or reasonable terms; • the impact of cybersecurity attacks or intrusions or other disruptions to our information effects on, us or our business, prospects, financial condition, results of operations or cash flows. technology, operational or other systems; Readers are cautioned not to place undue reliance on these forward-looking statements in • an increasing demand for power and load growth, potentially compounded by a shift away making any investment decision. Forward-looking statements made in this report apply only as from natural gas toward increased electrification; of the date of this report. While we may elect to update forward-looking statements from time to • failure to attract and retain a qualified workforce; • increases in the costs of equipment, materials, fuel, services and labor; time, we specifically disclaim any obligation to do so, even in light of new information or future • the impact of our covenants in our debt instruments and credit agreements on our events, unless otherwise required by applicable securities laws. business; • adverse performance of our defined benefit plan trust funds and Nuclear Decommissioning The forward-looking statements contained in this report are intended to qualify for the safe Trust Fund and increases in funding requirements; harbor provisions of Section 27A of the Securities Act of 1933, as amended, and Section 21E of • any inability to enter into or extend certain significant contracts; the Securities Exchange Act of 1934, as amended. • development, adoption and use of Artificial Intelligence by us and our third-party vendors; 2 2


PSEG First Quarter 2025 GAAP Disclaimer PSEG presents Operating Earnings in addition to its Net Income Net Income, which is an indicator of financial performance reported in accordance with accounting principles generally determined in accordance with GAAP. In addition, non-GAAP accepted in the United States (GAAP). Operating Earnings is a Operating Earnings as presented in this report may not be non-GAAP financial measure that differs from Net Income. Non- comparable to similarly titled measures used by other GAAP Operating Earnings exclude the impact of gains (losses) companies. associated with the Nuclear Decommissioning Trust (NDT), Due to the forward-looking nature of non-GAAP Operating Mark-to-Market (MTM) accounting and other material infrequent Earnings guidance, PSEG is unable to reconcile this non-GAAP items. The last two slides in this presentation (Slides A and B) financial measure to the most directly comparable GAAP include a list of items excluded from Net Income to reconcile to financial measure because comparable GAAP measures are not non-GAAP Operating Earnings with a reference to those slides reasonably accessible or reliable due to the inherent difficulty in included on each of the slides where the non-GAAP information forecasting and quantifying measures that would be required for appears. such reconciliation. Namely, we are not able to reliably project Management uses non-GAAP Operating Earnings in its internal without unreasonable effort MTM and NDT gains (losses), for analysis, and in communications with investors and analysts, as future periods due to market volatility. These items are a consistent measure for comparing PSEG’s financial uncertain, depend on various factors, and may have a material performance to previous financial results. The presentation of impact on our future GAAP results. non-GAAP Operating Earnings is intended to complement, and should not be considered an alternative to, the presentation of From time to time, PSEG and PSE&G release important information via postings on their corporate Investor Relations website at https://investor.pseg.com. Investors and other interested parties are encouraged to visit the Investor Relations website to review new postings. You can sign up for automatic email alerts regarding new postings at the bottom of the webpage at https://investor.pseg.com or by navigating to the Email Alerts webpage here. The information on https://investor.pseg.com and https://investor.pseg.com/resources/email-alerts/default.aspx is not incorporated herein and is not part of this communication or the Form 8-K to which it is an exhibit. 3 3


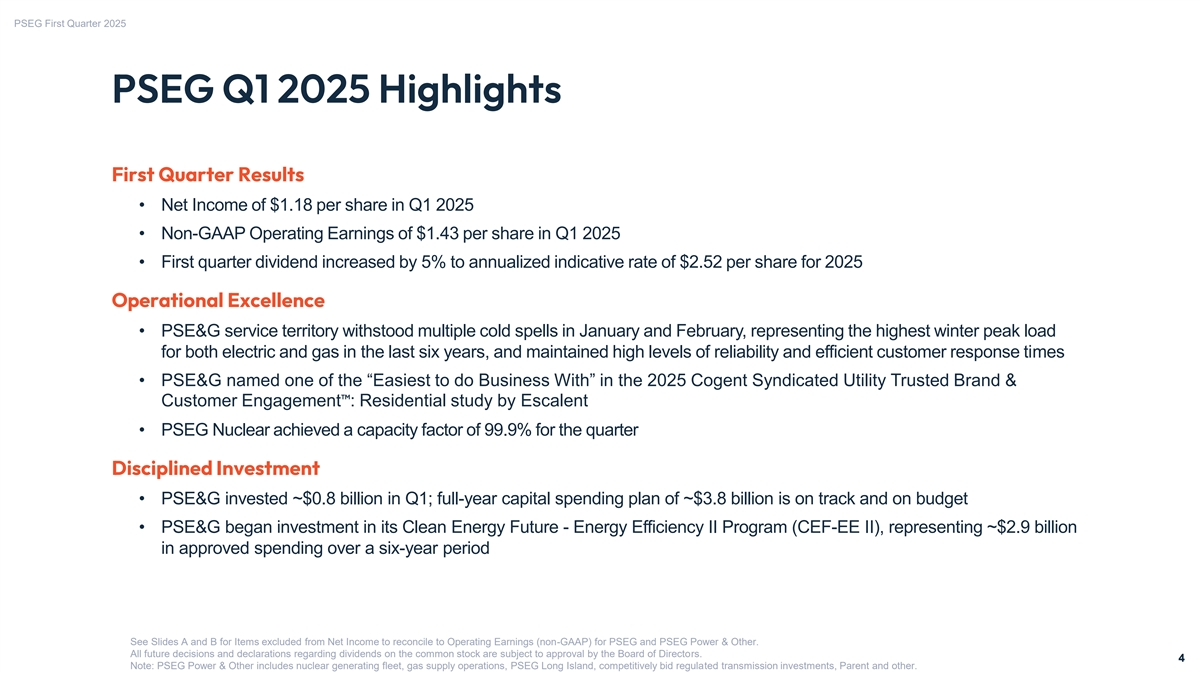
PSEG First Quarter 2025 PSEG Q1 2025 Highlights First Quarter Results • Net Income of $1.18 per share in Q1 2025 • Non-GAAP Operating Earnings of $1.43 per share in Q1 2025 • First quarter dividend increased by 5% to annualized indicative rate of $2.52 per share for 2025 Operational Excellence • PSE&G service territory withstood multiple cold spells in January and February, representing the highest winter peak load for both electric and gas in the last six years, and maintained high levels of reliability and efficient customer response times • PSE&G named one of the “Easiest to do Business With” in the 2025 Cogent Syndicated Utility Trusted Brand & Customer Engagement : Residential study by Escalent • PSEG Nuclear achieved a capacity factor of 99.9% for the quarter Disciplined Investment • PSE&G invested ~$0.8 billion in Q1; full-year capital spending plan of ~$3.8 billion is on track and on budget • PSE&G began investment in its Clean Energy Future - Energy Efficiency II Program (CEF-EE II), representing ~$2.9 billion in approved spending over a six-year period See Slides A and B for Items excluded from Net Income to reconcile to Operating Earnings (non-GAAP) for PSEG and PSEG Power & Other. All future decisions and declarations regarding dividends on the common stock are subject to approval by the Board of Directors. 4 4 Note: PSEG Power & Other includes nuclear generating fleet, gas supply operations, PSEG Long Island, competitively bid regulated transmission investments, Parent and other.


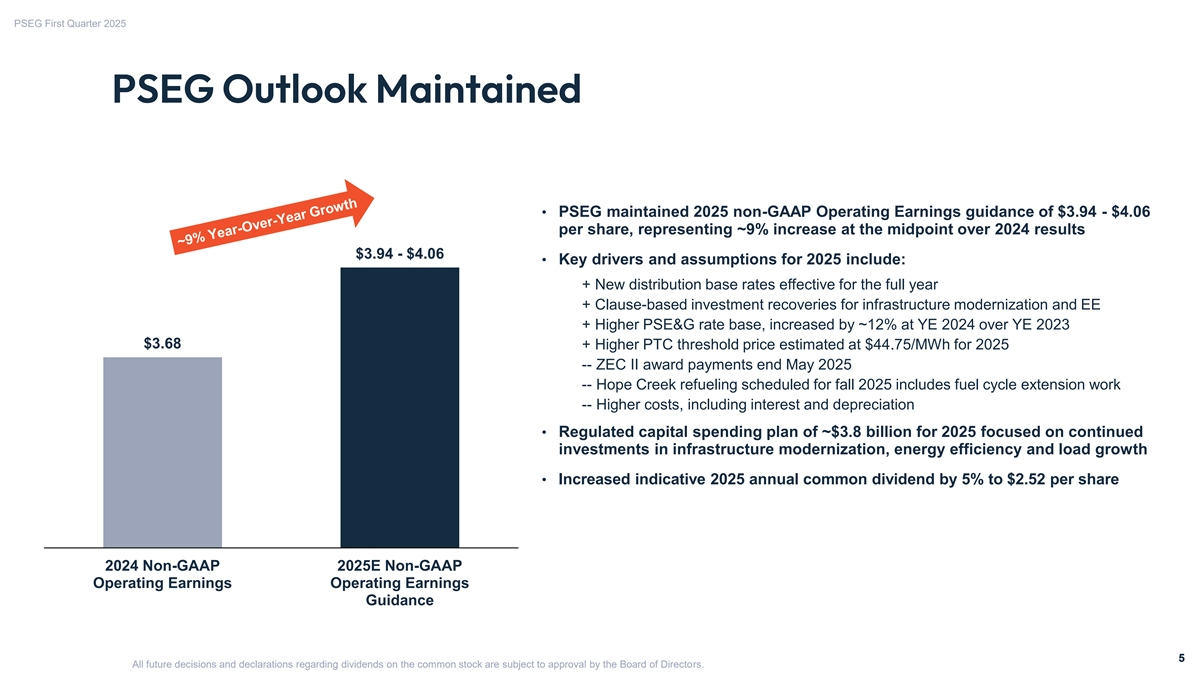
PSEG First Quarter 2025 PSEG Outlook Maintained • PSEG maintained 2025 non-GAAP Operating Earnings guidance of $3.94 - $4.06 per share, representing ~9% increase at the midpoint over 2024 results $3.94 - $4.06 • Key drivers and assumptions for 2025 include: + New distribution base rates effective for the full year + Clause-based investment recoveries for infrastructure modernization and EE + Higher PSE&G rate base, increased by ~12% at YE 2024 over YE 2023 $3.68 + Higher PTC threshold price estimated at $44.75/MWh for 2025 -- ZEC II award payments end May 2025 -- Hope Creek refueling scheduled for fall 2025 includes fuel cycle extension work -- Higher costs, including interest and depreciation • Regulated capital spending plan of ~$3.8 billion for 2025 focused on continued investments in infrastructure modernization, energy efficiency and load growth • Increased indicative 2025 annual common dividend by 5% to $2.52 per share 2024 Non-GAAP 2025E Non-GAAP Operating Earnings Operating Earnings Guidance 5 5 All future decisions and declarations regarding dividends on the common stock are subject to approval by the Board of Directors.


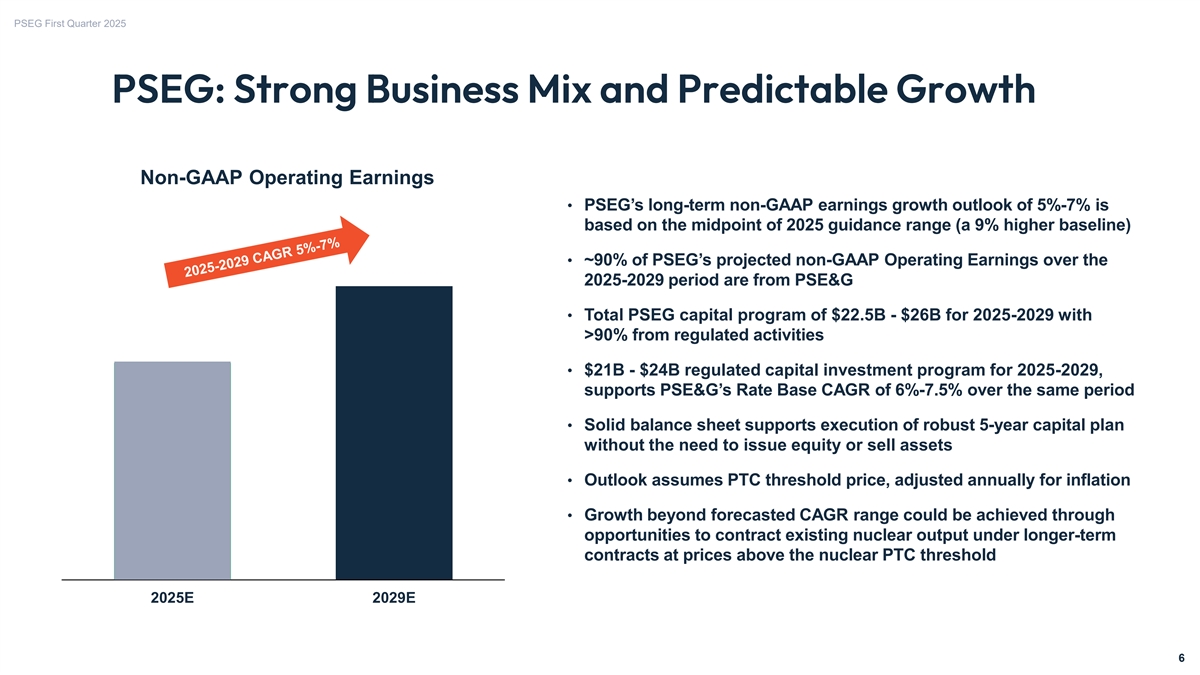
PSEG First Quarter 2025 PSEG: Strong Business Mix and Predictable Growth Non-GAAP Operating Earnings • PSEG’s long-term non-GAAP earnings growth outlook of 5%-7% is based on the midpoint of 2025 guidance range (a 9% higher baseline) • ~90% of PSEG’s projected non-GAAP Operating Earnings over the 2025-2029 period are from PSE&G • Total PSEG capital program of $22.5B - $26B for 2025-2029 with >90% from regulated activities • $21B - $24B regulated capital investment program for 2025-2029, supports PSE&G’s Rate Base CAGR of 6%-7.5% over the same period • Solid balance sheet supports execution of robust 5-year capital plan without the need to issue equity or sell assets • Outlook assumes PTC threshold price, adjusted annually for inflation • Growth beyond forecasted CAGR range could be achieved through opportunities to contract existing nuclear output under longer-term contracts at prices above the nuclear PTC threshold 2025E 2029E 6


PSEG First Quarter 2025 Q1 2025 Review 7


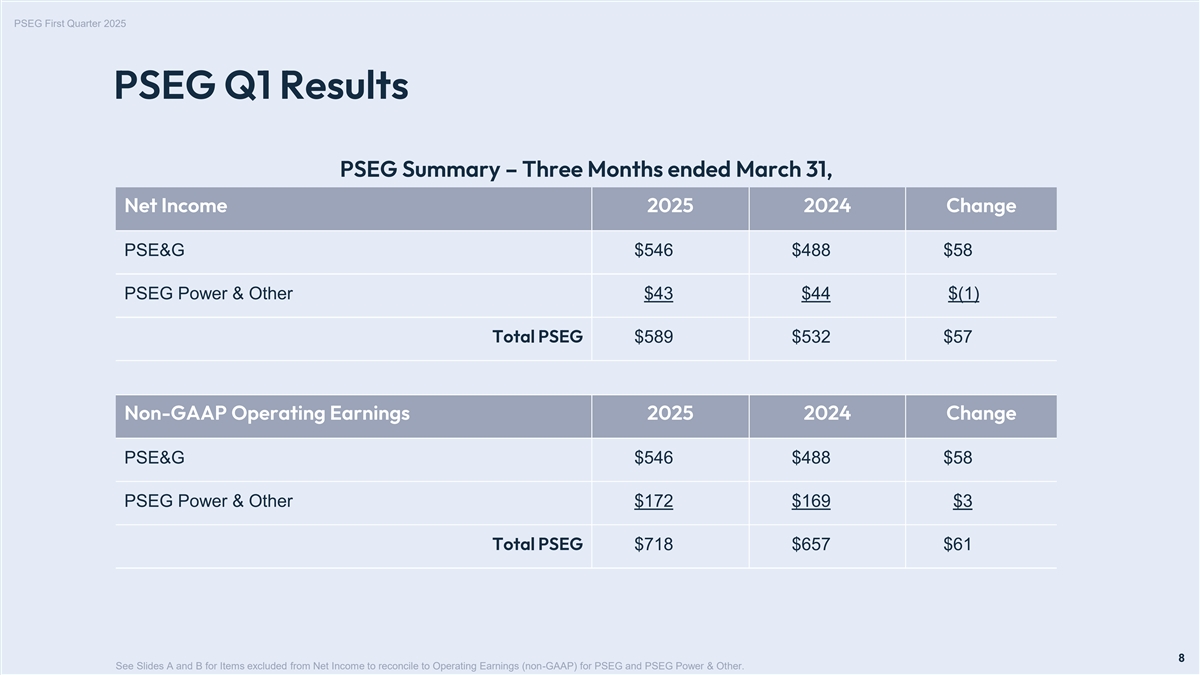
PSEG First Quarter 2025 PSEG Q1 Results PSEG Summary – Three Months ended March 31, Net Income 2025 2024 Change PSE&G $546 $488 $58 PSEG Power & Other $43 $44 $(1) Total PSEG $589 $532 $57 Non-GAAP Operating Earnings 2025 2024 Change PSE&G $546 $488 $58 PSEG Power & Other $172 $169 $3 Total PSEG $718 $657 $61 8 8 See Slides A and B for Items excluded from Net Income to reconcile to Operating Earnings (non-GAAP) for PSEG and PSEG Power & Other.


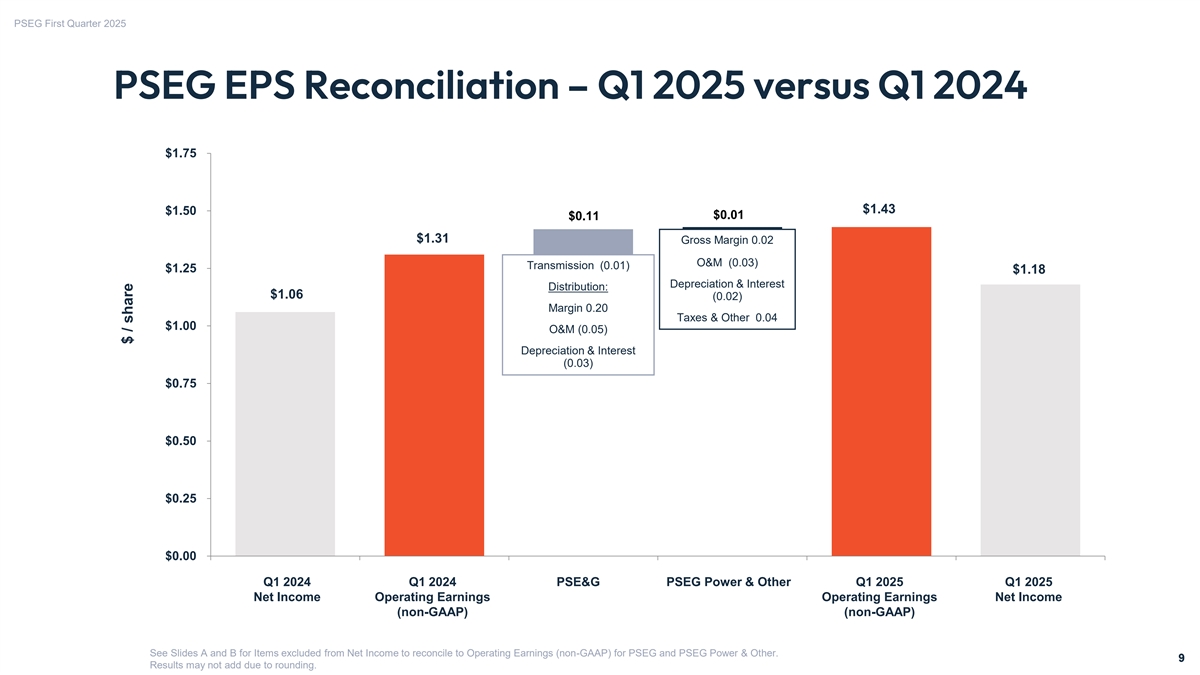
PSEG First Quarter 2025 PSEG EPS Reconciliation – Q1 2025 versus Q1 2024 $1.75 $1.43 $1.50 $0.01 $0.11 $1.31 Gross Margin 0.02 O&M (0.03) Transmission (0.01) $1.25 $1.18 Depreciation & Interest Distribution: $1.06 (0.02) Margin 0.20 Taxes & Other 0.04 $1.00 O&M (0.05) Depreciation & Interest (0.03) $0.75 $0.50 $0.25 $0.00 Q1 2024 Q1 2024 PSE&G PSEG Power & Other Q1 2025 Q1 2025 Net Income Operating Earnings Operating Earnings Net Income (non-GAAP) (non-GAAP) See Slides A and B for Items excluded from Net Income to reconcile to Operating Earnings (non-GAAP) for PSEG and PSEG Power & Other. 9 9 Results may not add due to rounding. $ / share


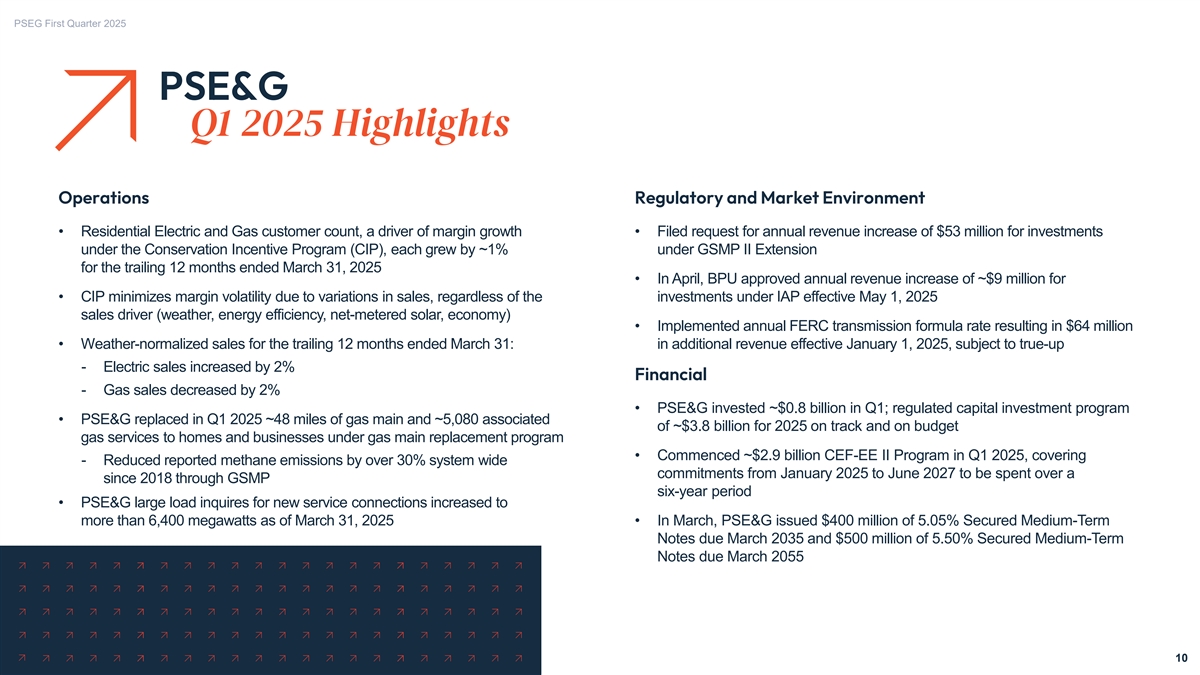
PSEG First Quarter 2025 PSE&G Q1 2025 Highlights Operations Regulatory and Market Environment • Residential Electric and Gas customer count, a driver of margin growth • Filed request for annual revenue increase of $53 million for investments under the Conservation Incentive Program (CIP), each grew by ~1% under GSMP II Extension for the trailing 12 months ended March 31, 2025 • In April, BPU approved annual revenue increase of ~$9 million for • CIP minimizes margin volatility due to variations in sales, regardless of the investments under IAP effective May 1, 2025 sales driver (weather, energy efficiency, net-metered solar, economy) • Implemented annual FERC transmission formula rate resulting in $64 million • Weather-normalized sales for the trailing 12 months ended March 31: in additional revenue effective January 1, 2025, subject to true-up - Electric sales increased by 2% Financial - Gas sales decreased by 2% • PSE&G invested ~$0.8 billion in Q1; regulated capital investment program • PSE&G replaced in Q1 2025 ~48 miles of gas main and ~5,080 associated of ~$3.8 billion for 2025 on track and on budget gas services to homes and businesses under gas main replacement program • Commenced ~$2.9 billion CEF-EE II Program in Q1 2025, covering - Reduced reported methane emissions by over 30% system wide commitments from January 2025 to June 2027 to be spent over a since 2018 through GSMP six-year period • PSE&G large load inquires for new service connections increased to more than 6,400 megawatts as of March 31, 2025 • In March, PSE&G issued $400 million of 5.05% Secured Medium-Term Notes due March 2035 and $500 million of 5.50% Secured Medium-Term Notes due March 2055 10


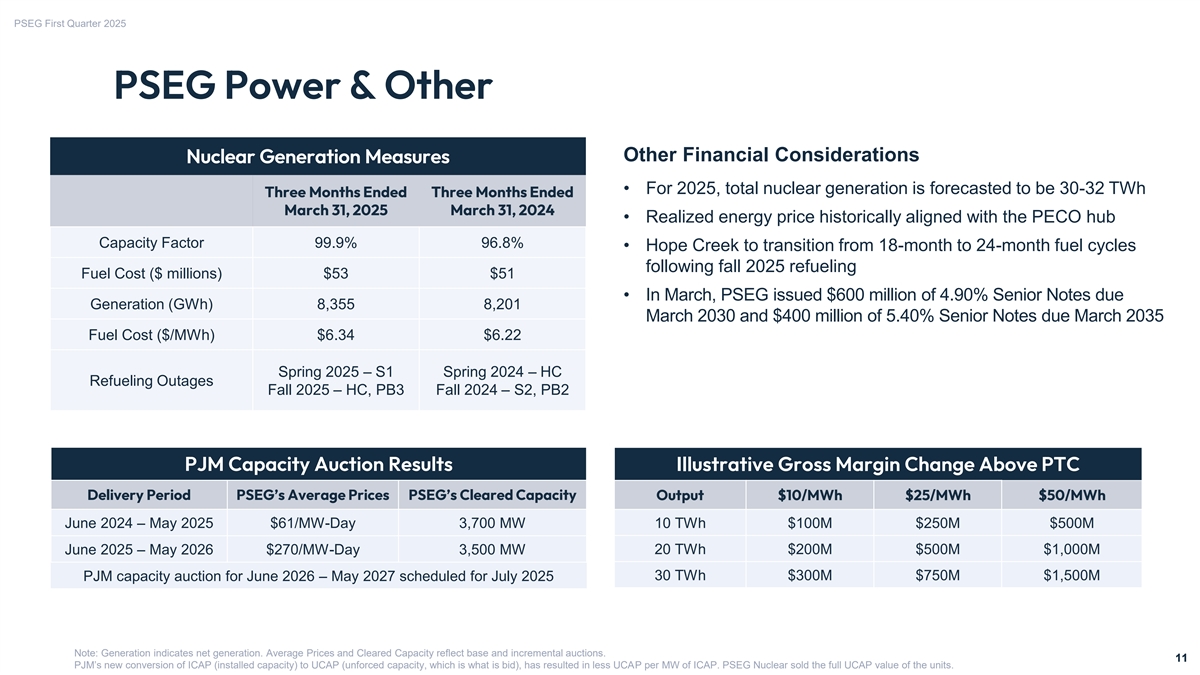
PSEG First Quarter 2025 PSEG Power & Other Other Financial Considerations Nuclear Generation Measures • For 2025, total nuclear generation is forecasted to be 30-32 TWh Three Months Ended Three Months Ended March 31, 2025 March 31, 2024 • Realized energy price historically aligned with the PECO hub Capacity Factor 99.9% 96.8% • Hope Creek to transition from 18-month to 24-month fuel cycles following fall 2025 refueling Fuel Cost ($ millions) $53 $51 • In March, PSEG issued $600 million of 4.90% Senior Notes due Generation (GWh) 8,355 8,201 March 2030 and $400 million of 5.40% Senior Notes due March 2035 Fuel Cost ($/MWh) $6.34 $6.22 Spring 2025 – S1 Spring 2024 – HC Refueling Outages Fall 2025 – HC, PB3 Fall 2024 – S2, PB2 PJM Capacity Auction Results Illustrative Gross Margin Change Above PTC Delivery Period PSEG’s Average Prices PSEG’s Cleared Capacity Output $10/MWh $25/MWh $50/MWh June 2024 – May 2025 $61/MW-Day 3,700 MW 10 TWh $100M $250M $500M 20 TWh $200M $500M $1,000M June 2025 – May 2026 $270/MW-Day 3,500 MW 30 TWh $300M $750M $1,500M PJM capacity auction for June 2026 – May 2027 scheduled for July 2025 Note: Generation indicates net generation. Average Prices and Cleared Capacity reflect base and incremental auctions. 11 11 PJM’s new conversion of ICAP (installed capacity) to UCAP (unforced capacity, which is what is bid), has resulted in less UCAP per MW of ICAP. PSEG Nuclear sold the full UCAP value of the units.


PSEG First Quarter 2025 Appendix 12


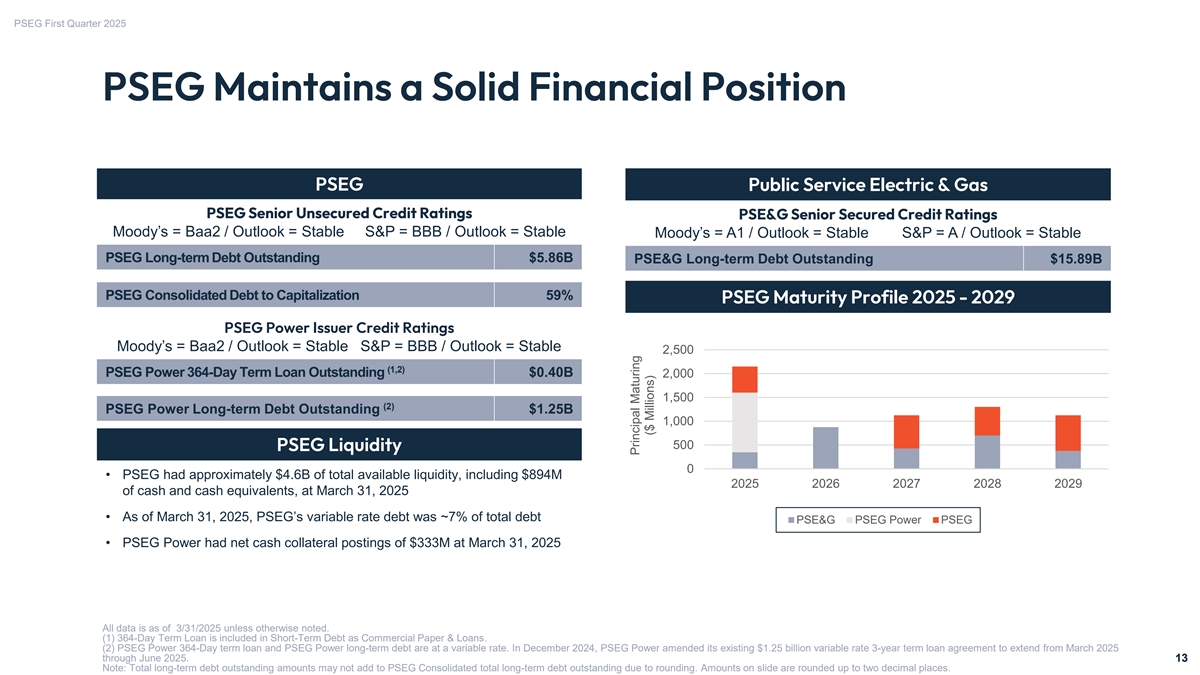
PSEG First Quarter 2025 PSEG Maintains a Solid Financial Position PSEG Public Service Electric & Gas PSEG Senior Unsecured Credit Ratings PSE&G Senior Secured Credit Ratings Moody’s = Baa2 / Outlook = Stable S&P = BBB / Outlook = Stable Moody’s = A1 / Outlook = Stable S&P = A / Outlook = Stable PSEG Long-term Debt Outstanding $5.86B PSE&G Long-term Debt Outstanding $15.89B PSEG Consolidated Debt to Capitalization 59% PSEG Maturity Profile 2025 - 2029 PSEG Power Issuer Credit Ratings Moody’s = Baa2 / Outlook = Stable S&P = BBB / Outlook = Stable 2,500 (1,2) PSEG Power 364-Day Term Loan Outstanding $0.40B 2,000 1,500 (2) PSEG Power Long-term Debt Outstanding $1.25B 1,000 500 PSEG Liquidity PSEG Liquidity and Net Cash Collateral Postings 0 • PSEG had approximately $4.6B of total available liquidity, including $894M 2025 2026 2027 2028 2029 of cash and cash equivalents, at March 31, 2025 • As of March 31, 2025, PSEG’s variable rate debt was ~7% of total debt PSE&G PSEG Power PSEG • PSEG Power had net cash collateral postings of $333M at March 31, 2025 All data is as of 3/31/2025 unless otherwise noted. (1) 364-Day Term Loan is included in Short-Term Debt as Commercial Paper & Loans. (2) PSEG Power 364-Day term loan and PSEG Power long-term debt are at a variable rate. In December 2024, PSEG Power amended its existing $1.25 billion variable rate 3-year term loan agreement to extend from March 2025 through June 2025. 13 13 Note: Total long-term debt outstanding amounts may not add to PSEG Consolidated total long-term debt outstanding due to rounding. Amounts on slide are rounded up to two decimal places. Principal Maturing ($ Millions)


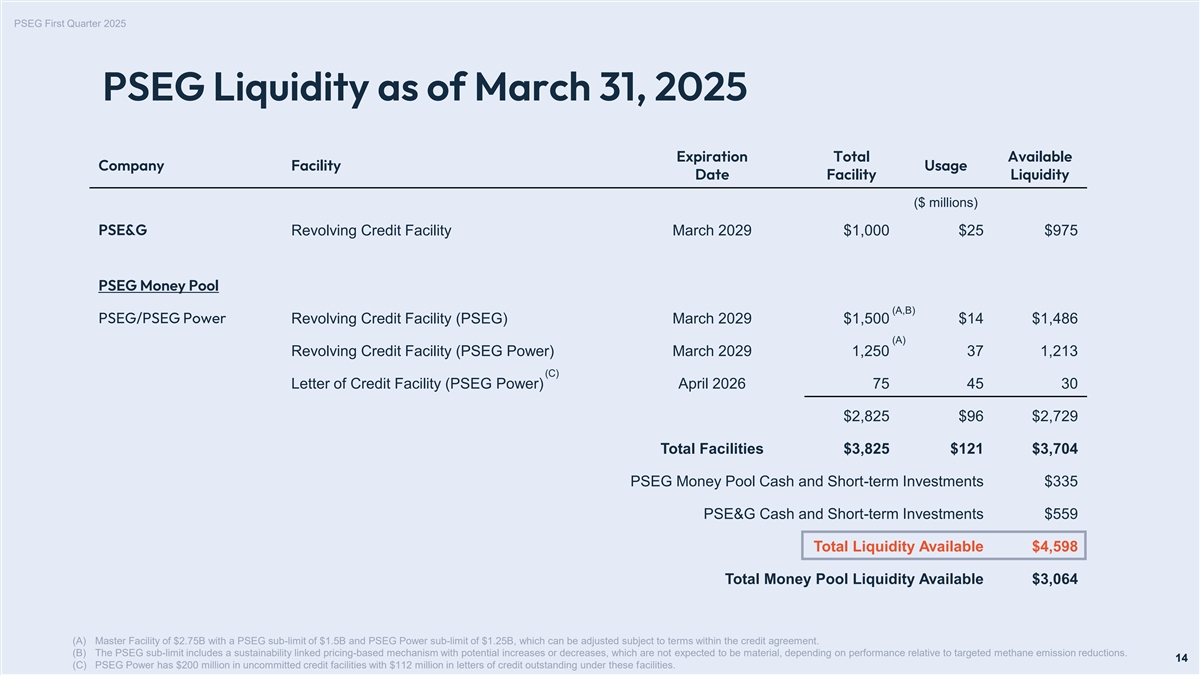
PSEG First Quarter 2025 PSEG Liquidity as of March 31, 2025 Expiration Total Available Company Facility Usage Date Facility Liquidity ($ millions) PSE&G Revolving Credit Facility March 2029 $1,000 $25 $975 PSEG Money Pool (A,B) PSEG/PSEG Power Revolving Credit Facility (PSEG) March 2029 $1,500 $14 $1,486 (A) Revolving Credit Facility (PSEG Power) March 2029 1,250 37 1,213 (C) Letter of Credit Facility (PSEG Power) April 2026 75 45 30 $2,825 $96 $2,729 Total Facilities $3,825 $121 $3,704 PSEG Money Pool Cash and Short-term Investments $335 PSE&G Cash and Short-term Investments $559 Total Liquidity Available $4,598 Total Money Pool Liquidity Available $3,064 (A) Master Facility of $2.75B with a PSEG sub-limit of $1.5B and PSEG Power sub-limit of $1.25B, which can be adjusted subject to terms within the credit agreement. (B) The PSEG sub-limit includes a sustainability linked pricing-based mechanism with potential increases or decreases, which are not expected to be material, depending on performance relative to targeted methane emission reductions. 14 14 (C) PSEG Power has $200 million in uncommitted credit facilities with $112 million in letters of credit outstanding under these facilities.


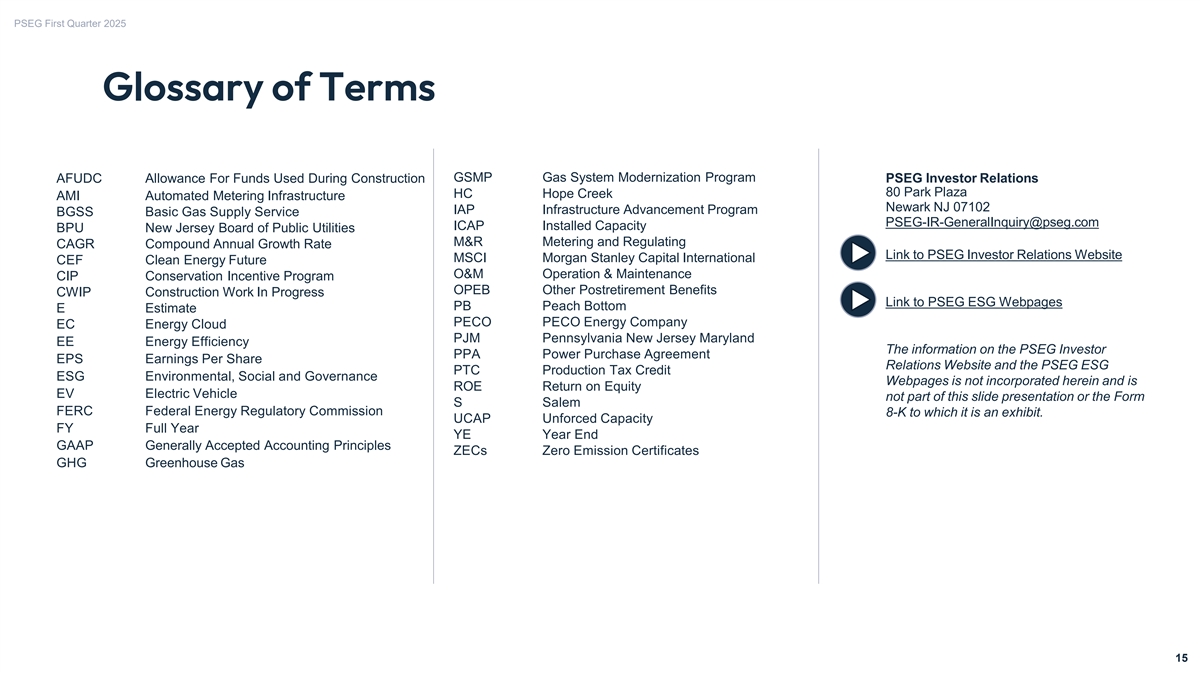
PSEG First Quarter 2025 Glossary of Terms AFUDC Allowance For Funds Used During Construction GSMP Gas System Modernization Program PSEG Investor Relations 80 Park Plaza HC Hope Creek AMI Automated Metering Infrastructure Newark NJ 07102 IAP Infrastructure Advancement Program BGSS Basic Gas Supply Service [email protected] ICAP Installed Capacity BPU New Jersey Board of Public Utilities M&R Metering and Regulating CAGR Compound Annual Growth Rate Link to PSEG Investor Relations Website MSCI Morgan Stanley Capital International CEF Clean Energy Future O&M Operation & Maintenance CIP Conservation Incentive Program OPEB Other Postretirement Benefits CWIP Construction Work In Progress Link to PSEG ESG Webpages PB Peach Bottom E Estimate PECO PECO Energy Company EC Energy Cloud PJM Pennsylvania New Jersey Maryland EE Energy Efficiency The information on the PSEG Investor PPA Power Purchase Agreement EPS Earnings Per Share Relations Website and the PSEG ESG PTC Production Tax Credit ESG Environmental, Social and Governance Webpages is not incorporated herein and is ROE Return on Equity EV Electric Vehicle not part of this slide presentation or the Form S Salem FERC Federal Energy Regulatory Commission 8-K to which it is an exhibit. UCAP Unforced Capacity FY Full Year YE Year End GAAP Generally Accepted Accounting Principles ZECs Zero Emission Certificates GHG Greenhouse Gas 15 15


PSEG First Quarter 2025 Reconciliation of Non-GAAP Operating Earnings Public Service Enterprise Group Incorporated - Consolidated Operating Earnings (non-GAAP) Reconciliation Three Months Ended (a) Includes the financial impact from positions with forward delivery months. March 31, Reconciling Items (b) Income tax effect calculated at the statutory rate 2025 2024 except for qualified NDT related activity, which ($ millions, Unaudited) records an additional 20% trust tax on income (loss) from qualified NDT Funds, and lease related activity. Net Income $ 589 $ 532 Please see Slide 3 for an explanation of PSEG’s use of (Gain) Loss on Nuclear Decommissioning Trust (NDT) Operating Earnings as a non-GAAP financial measure Fund Related Activity, pre-tax (12) (95) and how it differs from Net Income. (a) (Gain) Loss on Mark-to-Market (MTM), pre-tax 188 258 Lease Related Activity, pre-tax - (4) (b) Income Taxes related to Operating Earnings (non-GAAP) reconciling items (47) (34) Operating Earnings (non-GAAP) $ 718 $ 657 PSEG Fully Diluted Average Shares Outstanding (in millions) 500 500 ($ Per Share Impact - Diluted, Unaudited) Net Income $ 1.18 $ 1.06 (Gain) Loss on NDT Fund Related Activity, pre-tax (0.03) (0.19) (a) (Gain) Loss on MTM, pre-tax 0.38 0.52 Lease Related Activity, pre-tax - ( 0.01) (b) Income Taxes related to Operating Earnings (non-GAAP) reconciling items (0.10) ( 0.07) Operating Earnings (non-GAAP) $ 1.43 $ 1.31 A 16 16


PSEG First Quarter 2025 Reconciliation of Non-GAAP Operating Earnings PSEG Power & Other Operating Earnings (non-GAAP) Reconciliation (a) Includes the financial impact from positions with Three Months Ended forward delivery months. Reconciling Items March 31, (b) Income tax effect calculated at the statutory rate 2025 2024 except for qualified NDT related activity, which records an additional 20% trust tax on income ($ millions, Unaudited) (loss) from qualified NDT Funds, and lease related activity. Net Income $ 43 $ 44 Please see Slide 3 for an explanation of PSEG’s use of Operating Earnings as a non-GAAP financial measure (Gain) Loss on NDT Fund Related Activity, pre-tax (12) (95) and how it differs from Net Income. (a) (Gain) Loss on MTM, pre-tax 188 258 Lease Related Activity, pre-tax - (4) (b) Income Taxes related to Operating Earnings (non-GAAP) reconciling items (47) (34) Operating Earnings (non-GAAP) $ 172 $ 169 PSEG Fully Diluted Average Shares Outstanding (in millions) 500 500 B 17 17