Form 8-K
falsefalsefalse000078878400000810330001158659 0000788784 2021-11-02 2021-11-02 0000788784 pseg:PublicServiceElectricAndGasCompanyMember 2021-11-02 2021-11-02 0000788784 pseg:PsegPowerLlcMember 2021-11-02 2021-11-02 0000788784 us-gaap:CommonStockMember 2021-11-02 2021-11-02 0000788784 pseg:FirstAndRefundingMortgageBondsEightPercentDueTwoThousandThirtySevenMember pseg:PublicServiceElectricAndGasCompanyMember 2021-11-02 2021-11-02 0000788784 pseg:FirstAndRefundingMortgageBondsFivePercentDueTwoThousandThirtySevenMember pseg:PublicServiceElectricAndGasCompanyMember 2021-11-02 2021-11-02
 
 
UNITED STATES
SECURITIES AND EXCHANGE COMMISSION
Washington, D.C. 20549
 
 
FORM
8-K
 
 
CURRENT REPORT
Pursuant to Section 13 or 15(d) of the Securities Exchange Act of 1934
Date of Report (Date of earliest event reported) November 2, 2021
 
 
Public Service Enterprise Group Incorporated
(Exact name of registrant as specified in its charter)


New Jersey
 
001-09120
 
22-2625848
(State or other jurisdiction of
incorporation)
  (Commission File Number)  
(I.R.S. Employer
Identification Number)
80 Park Plaza
Newark, New Jersey 07102
(Address of principal executive offices) (Zip Code)
973
430-7000
(Registrant’s telephone number, including area code)
Public Service Electric and Gas Company
(Exact name of registrant as specified in its charter)
 
New Jersey
 
001-00973
 
22-1212800
(State or other jurisdiction of
incorporation)
  (Commission File Number)   (I.R.S. Employer
Identification Number)
80 Park Plaza
Newark, New Jersey 07102
(Address of principal executive offices) (Zip Code)
973
430-7000
(Registrant’s telephone number, including area code)
PSEG Power LLC
(Exact name of registrant as specified in its charter)
 
Delaware
 
001-34232
 
22-3663480
(State or other jurisdiction
of incorporation)
  (Commission File Number)   (I.R.S. Employer
Identification Number)
80 Park Plaza
Newark, New Jersey 07102
(Address of principal executive offices) (Zip Code)
973
430-7000
(Registrant’s telephone number, including area code)
 
 
Check the appropriate box below if the Form
8-K
filing is intended to simultaneously satisfy the filing obligation of the registrant under any of the following provisions (see General Instruction A.2. below):
 
Written communications pursuant to Rule 425 under the Securities Act (17 CFR 230.425)
 
Soliciting material pursuant to Rule
14a-12
under the Exchange Act (17 CFR
240.14a-12)
 
Pre-commencement
communications pursuant to Rule
14d-2(b)
under the Exchange Act (17 CFR
240.14d-2(b))
 
Pre-commencement
communications pursuant to Rule
13e-4(c)
under the Exchange Act (17 CFR
240.13e-4(c))
Securities registered pursuant to Section 12(b) of the Act:
 
Title of Each Class
 
Trading
Symbol(s)
 
Name of Each Exchange
On Which Registered
Public Service Enterprise Group Incorporated
       
Common Stock without par value   PEG   New York Stock Exchange
     
Public Service Electric and Gas Company
       
8.00% First and Refunding Mortgage Bonds, due 2037   PEG37D   New York Stock Exchange
5.00% First and Refunding Mortgage Bonds, due 2037   PEG37J   New York Stock Exchange
Indicate by check mark whether any of the registrants is an emerging growth company as defined in Rule 405 of the Securities Act of 1933 (§230.405 of this chapter) or Rule
12b-2
of the Securities Exchange Act of 1934
(§240.12b-2
of this chapter).
Emerging growth company  
If an emerging growth company, indicate by check mark if such registrant has elected not to use the extended transition period for complying with any new or revised financial accounting standards provided pursuant to Section 13(a) of the Exchange Act.  ☐


The information contained in Item 2.02. Results of Operations and Financial Condition in this Form
8-K
is furnished solely for Public Service Enterprise Group Incorporated (PSEG). The information contained in Item 7.01 Regulation FD Disclosure in this combined Form
8-K
is separately furnished, as noted, by PSEG, Public Service Electric and Gas Company (PSE&G) and PSEG Power LLC (PSEG Power). Information contained herein relating to any individual company is provided by such company on its own behalf and in connection with its respective Form
8-K.
PSE&G and PSEG Power each makes representations only as to itself and makes no other representations whatsoever as to any other company. The materials furnished as Exhibits 99 and 99.1 are available on the corporate.pseg.com website under the investor tab, or at http://investor.pseg.com.
Item 2.02 Results of Operations and Financial Condition
PSEG
On November 2, 2021, PSEG announced financial results for the three and nine months ended September 30, 2021. A copy of the earnings release dated November 2, 2021 is furnished as Exhibit 99 to this Form
8-K.
Item 7.01 Regulation FD Disclosure
PSEG, PSE&G and PSEG Power
On November 2, 2021, PSEG conducted an earnings call regarding its results for the three and nine months ended September 30, 2021. A copy of the slideshow presentation used during the earnings call is furnished as Exhibit 99.1 to this Form
8-K.
Item 9.01 Financial Statements and Exhibits
 
Exhibit 99   Press Release dated November 2, 2021
Exhibit 99.1   Slideshow Presentation
Exhibit 104   Cover Page Interactive Data File (embedded within the Inline XBRL document).
 
2

SIGNATURE
Pursuant to the requirements of the Securities Exchange Act of 1934, the registrant has duly caused this report to be signed on its behalf by the undersigned thereunto duly authorized. The signature of the undersigned company shall be deemed to relate only to matters having reference to such company and any subsidiaries thereof.
 
PUBLIC SERVICE ENTERPRISE GROUP INCORPORATED
(Registrant)
    By:  
/s/ Rose M. Chernick
        ROSE M. CHERNICK
        Vice President and Controller
        (Principal Accounting Officer)
Date: November 2, 2021
SIGNATURE
Pursuant to the requirements of the Securities Exchange Act of 1934, the registrant has duly caused this report to be signed on its behalf by the undersigned thereunto duly authorized. The signature of the undersigned company shall be deemed to relate only to matters having reference to such company and any subsidiaries thereof.
 
PUBLIC SERVICE ELECTRIC AND GAS COMPANY
(Registrant)
    By:  
/s/ Rose M. Chernick
        ROSE M. CHERNICK
        Vice President and Controller
        (Principal Accounting Officer)
Date: November 2, 2021
SIGNATURE
Pursuant to the requirements of the Securities Exchange Act of 1934, the registrant has duly caused this report to be signed on its behalf by the undersigned thereunto duly authorized. The signature of the undersigned company shall be deemed to relate only to matters having reference to such company and any subsidiaries thereof.
 
PSEG POWER LLC
(Registrant)
     
    By:  
/s/ Rose M. Chernick
        ROSE M. CHERNICK
        Vice President and Controller
        (Principal Accounting Officer)
Date: November 2, 2021
 
3

EXHIBIT 99


Public Service Enterprise Group

80 Park Plaza

Newark, NJ 07102


LOGO

CONTACT:   

Investor Relations

[email protected]

973-430-6565


Media Relations

[email protected]

908-531-4253

PSEG ANNOUNCES 2021 THIRD QUARTER RESULTS

$3.10 PER SHARE NET LOSS FROM PSEG POWER FOSSIL SALE CHARGES

$0.98 PER SHARE NON-GAAP OPERATING EARNINGS

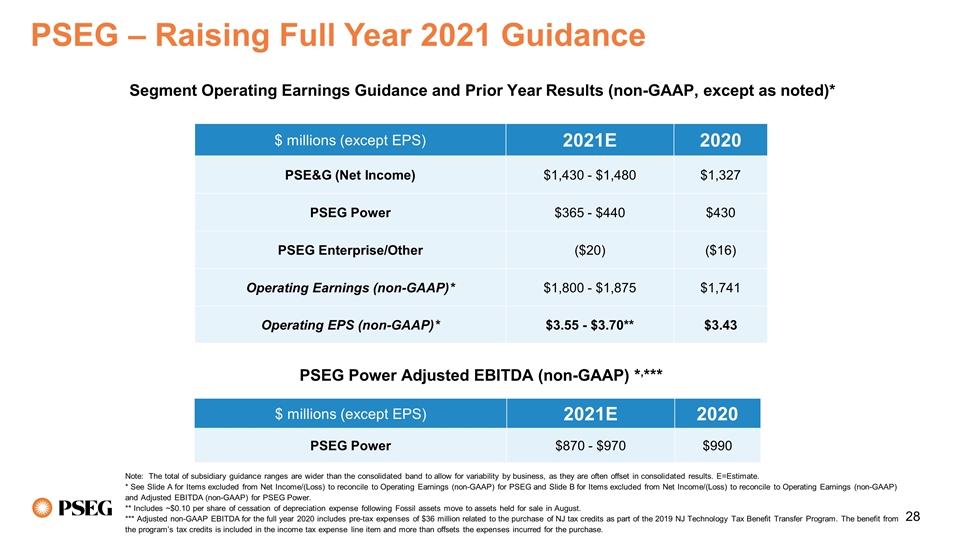
Raises Full Year 2021 Non-GAAP Operating Earnings Guidance to $3.55 – $3.70 Per Share

FERC Approves Transmission Rate Settlement, Fossil Sale Progressing

(November 2, 2021 – Newark, NJ) Public Service Enterprise Group (NYSE: PEG) reported a Net Loss for the third quarter of 2021 of $1,564 million, or $3.10 per share, compared to Net Income of $575 million, or $1.14 per share, in the third quarter of 2020. Non-GAAP Operating Earnings for the third quarter of 2021 were $495 million, or $0.98 per share, compared to non-GAAP Operating Earnings for the third quarter of 2020 of $488 million, or $0.96 per share. Non-GAAP results for the third quarter exclude items shown in Attachments 8 and 9. As previously noted, in connection with the Fossil sale announced in August 2021, PSEG Power recorded a pre-tax impairment loss of approximately $2,175 million in the third quarter, which includes $13 million of employee costs, environmental accruals and other items related to the Fossil sale.

Ralph Izzo, Chairman, President and Chief Executive Officer commented, “We delivered another solid operating quarter and continue on schedule to close on the sale of our Fossil units by year-end 2021 or early 2022, advancing our progress to becoming a predominantly regulated electric and gas utility complemented by contracted, zero-carbon energy and infrastructure investments. PSEG also took significant steps in the quarter to advance our climate leadership by accelerating our Net-Zero vision to 2030, and signing onto the Race to Zero campaign to establish science-based targets in alignment with the 1.5°C scenario across all three emission scopes. While our GAAP results for the third quarter reflect the results of our Fossil sale, our non-GAAP Operating Earnings of $0.98 per share are in line with PSEG’s updated full-year 2021 results, and were also influenced by the Fossil sale.”

The following table provides a reconciliation of PSEG’s Net Income/(Loss) to non-GAAP Operating Earnings for the third quarter. See Attachments 8 and 9 for a complete list of items excluded from Net Income/(Loss) in the determination of non-GAAP Operating Earnings.


1


PSEG CONSOLIDATED RESULTS (unaudited)

Third Quarter Comparative Results

2021 and 2020


     Net Income/(Loss)      Diluted Earnings/(Loss)  
     ($ millions)      Per Share  
     2021      2020      2021      2020  

Net Income/(Loss)

   $ (1,564    $ 575      $ (3.10    $ 1.14  

Reconciling Items

     2,059        (87      4.08        (0.18


Non-GAAP Operating Earnings

   $ 495      $ 488      $ 0.98      $ 0.96  


     Avg. Shares        504M  *       507M  


*

Approximately three million potentially dilutive shares were excluded from fully diluted average shares outstanding used to calculate the diluted GAAP loss per share for the quarter ended September 30, 2021 as their impact was antidilutive to GAAP results. For non-GAAP per share calculations, we used fully diluted average shares outstanding of 507 million, including the three million potentially dilutive shares as they were dilutive to non-GAAP results.

Ralph Izzo added, “We are raising our full-year 2021 non-GAAP Operating Earnings guidance to a range of $3.55 to $3.70 per share (from $3.50 to $3.65 per share) based on solid results through the first nine months of the year. Our results for the third quarter and nine months ended September 30 incorporate the planned August 1 implementation of PSE&G’s transmission rate settlement announced in July, and reflect PSEG Power’s cessation of depreciation expense on the Fossil assets upon their move to held for sale treatment in August. The utility’s planned $2.7 billion capital spending program for 2021 continues on schedule as part of PSEG’s five-year, $15-$17 billion capital plan – recently raised by $1 billion – which we still intend to execute without the need to issue new equity. As we continue to execute our strategy consistent with the significant financial announcements made at our September 2021 PSEG Investor Conference, we remain focused on providing our shareholders with the premier opportunity to pursue sustainable growth in earnings and dividends with an industry leading ESG platform.”

The following table outlines PSEG’s expectations for non-GAAP Operating Earnings by subsidiary:

2021 Non-GAAP Operating Earnings Guidance

($ millions, except EPS)


     Updated 2021E    Prior 2021E

PSE&G

   $1,430 - $1,480    $1,420 - $1,470

PSEG Power

   $365 - $440    $350 - $425

PSEG Enterprise/Other

   $(20)    ($20)


Non-GAAP Operating Earnings

   $1,800 - $1,875    $1,775 - $1,850


Non-GAAP Operating EPS

   $3.55 - $3.70    $3.50 - $3.65


E = Estimate


2


Results and Outlook by Operating Subsidiary

PSE&G

Third Quarter 2021 and 2020 Comparative Results

($ millions, except EPS)


PSE&G

   3Q 2021      3Q 2020      Q/Q Change  
Net Income    $ 389      $ 313      $ 76  

Earnings Per Share

   $ 0.77      $ 0.61      $ 0.16  

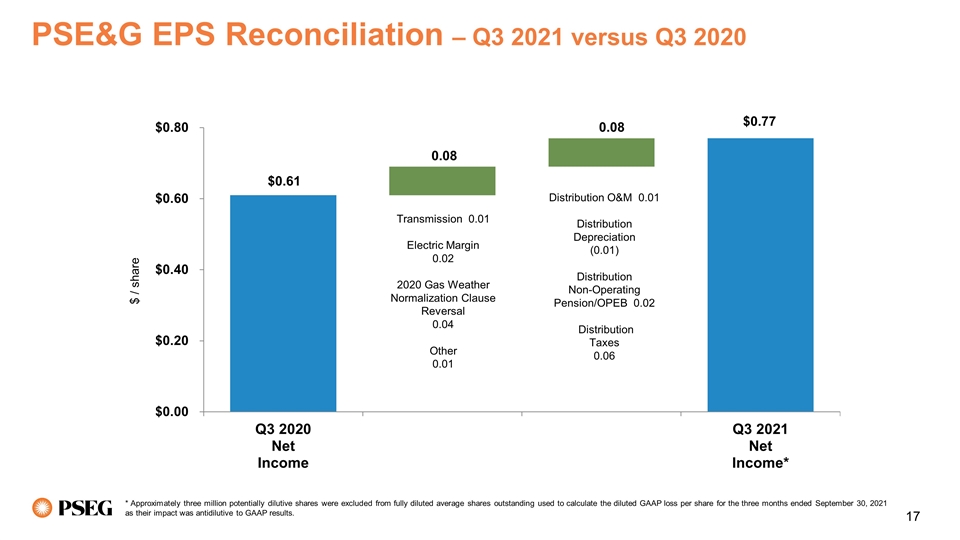
PSE&G’s third quarter results rose by $0.16 per share over third quarter 2020, and reflect revenue growth from ongoing capital investment programs as well as several one-time items. Growth in transmission rate base added $0.01 per share to third quarter Net Income after incorporating the August 1 implementation of PSE&G’s Transmission rate settlement lowering its return on equity for its formula rate. Electric margin added $0.02 per share to Net Income compared to the year-ago quarter – as the Conservation Incentive Program combined with Energy Strong II roll-ins more than offset a reduction in weather-normalized volumes. Gas results were $0.04 favorable compared to the year-ago quarter, reflecting the absence of the weather normalization clause reversal in the third quarter of 2020. Operation and maintenance expense was $0.01 per share favorable compared to the year-ago quarter. Non-operating pension expense was $0.02 per share favorable compared with the third quarter 2020. Tax expense was $0.06 favorable compared to third quarter 2020, driven by the timing of taxes to reflect PSE&G’s lower estimated annual effective tax rate due to higher tax flow backs in 2021. This impact is expected to reverse in the fourth quarter of 2021, when PSE&G finalizes its actual tax rate for the year.

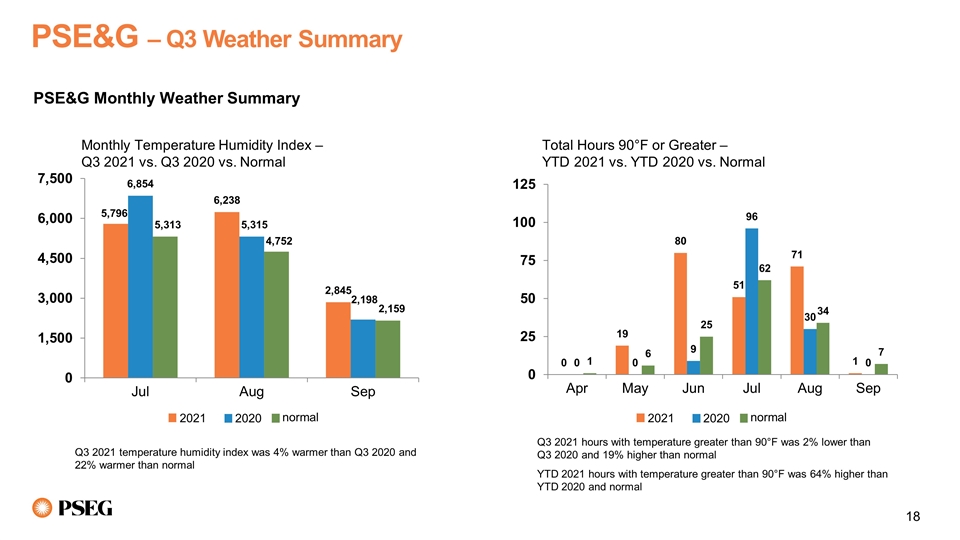
Weather during the third quarter, as measured by the Temperature Humidity Index, was 4% warmer than the year-ago period, and 22% warmer than normal, contributing to a third quarter and year to date total number of hours at 90°F or greater that was 19% and 64% above normal, respectively. Compared to the third quarter of 2020, the continued reopening of the New Jersey economy is unwinding some of the shift in sales, as residential electric sales, adjusted for weather, declined as more people returned to work, school and other activities outside the home, partly offset by higher commercial and industrial sales. On a trailing 12-month basis, weather normalized electric sales were flat and gas sales were up by nearly 2%. Growth in the number of both electric and gas customers rose by approximately 1.5% each versus the third quarter of 2020.

The Conservation Incentive Program, which is now in effect for both electric (as of June 1) and gas sales (as of October 1), removes the variations of weather, economic activity, efficiency and customer usage from our financial results, resetting margins to a baseline level per customer. This new mechanism reduces earnings volatility, supports PSE&G’s ability to promote maximum customer participation in energy efficiency programs without the loss of margin from lower sales, and retains earnings upside potential for customer growth.

PSE&G’s capital program remains on schedule. PSE&G invested approximately $670 million in the third quarter and $1.95 billion for the nine months through September. This capital is part of


3


2021’s $2.7 billion electric and gas infrastructure program to upgrade transmission and distribution facilities, and enhance reliability and increase resiliency.

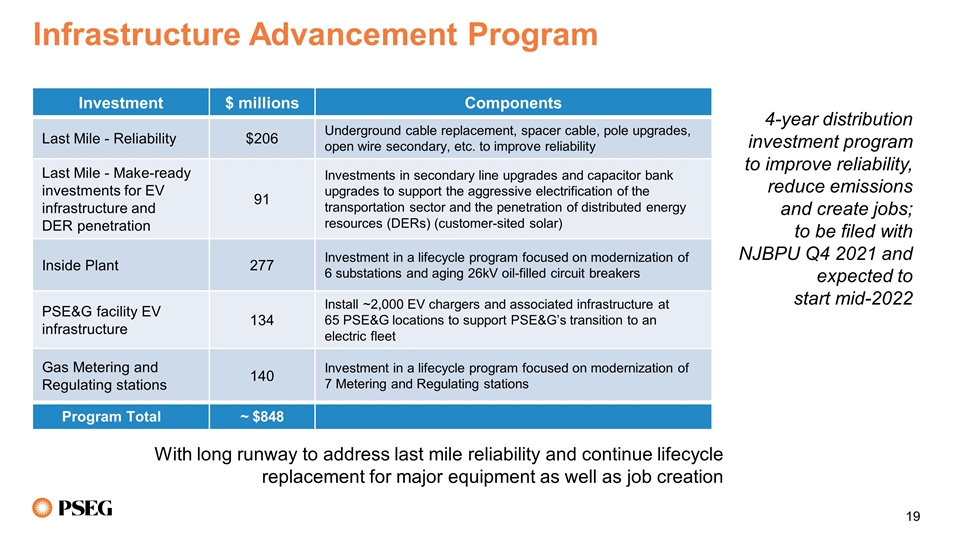
During the fourth quarter of 2021, PSE&G intends to submit an Infrastructure Advancement Program filing with the New Jersey Board of Public Utilities. This jobs and economic stimulus focused infrastructure proposal, if approved as filed, would direct approximately $848 million of investment over a four-year period to improve the reliability of the “last mile” of our electric distribution system; address aging substations and gas metering and regulating stations; and invest in electric vehicle charging infrastructure at our facilities to support the planned electrification of the PSE&G fleet.

PSE&G has raised the forecast of Net Income for 2021 to $1,430 million - $1,480 million, from $1,420 million - $1,470 million prior.

PSEG Power

Third Quarter 2021 and 2020 Comparative Results

($ millions, except EPS)


PSEG Power

   3Q 2021      3Q 2020      Q/Q Change  

Net Income (Loss)

   $ (1,933    $ 254      $ (2,187

Earnings (Loss) Per Share (EPS)

   $ (3.84    $ 0.51      $ (4.35

Non-GAAP Operating Earnings

   $ 119      $ 167      $ (48

Non-GAAP EPS

   $ 0.23      $ 0.33      $ (0.10

Non-GAAP Adjusted EBITDA

   $ 237      $ 349      $ (112

PSEG Power reported a Net Loss of $1,933 million ($3.84 per share) for the third quarter of 2021, non-GAAP Operating Earnings of $119 million ($0.23 per share), and non-GAAP Adjusted EBITDA of $237 million. This compares to third quarter 2020 Net Income of $254 million ($0.51 per share), non-GAAP Operating Earnings of $167 million ($0.33 per share), and non-GAAP Adjusted EBITDA of $349 million.

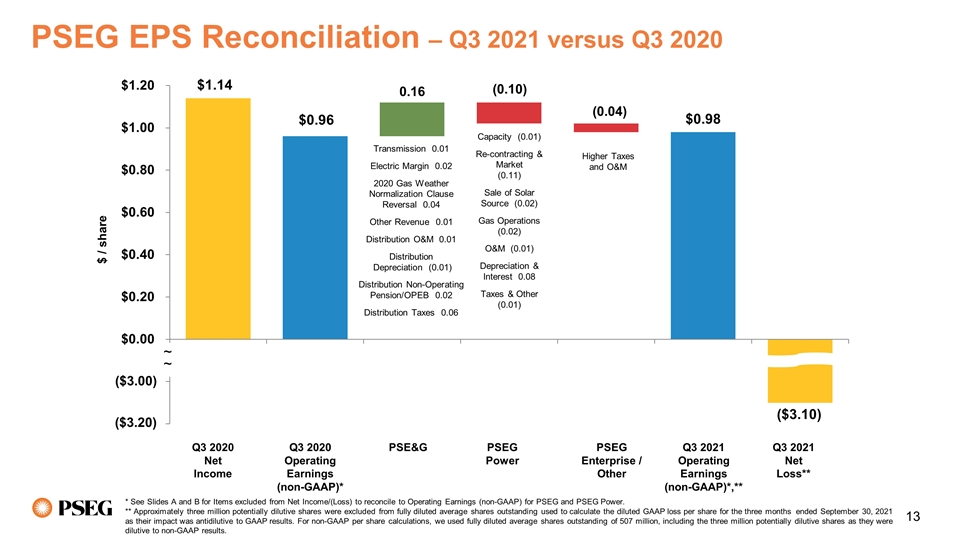
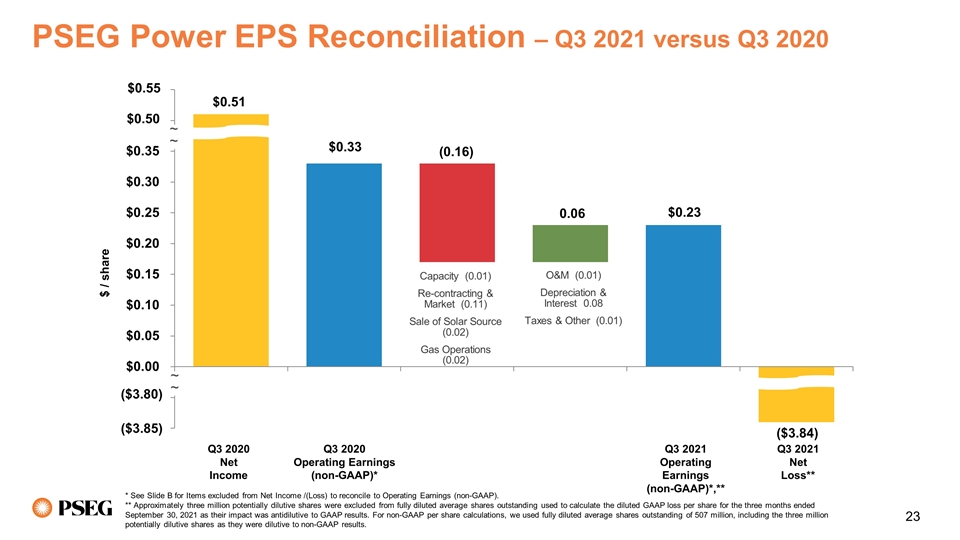
PSEG Power’s third quarter non-GAAP Operating Earnings were $0.10 per share lower than third quarter 2020 results. Re-contracting and power market impacts reduced results by $0.11 per share, as the seasonal shape of hedging activity and higher cost to serve load versus the year-ago quarter lowered gross margin. The sale of the Solar Source portfolio earlier in the year also lowered gross margin results by $0.02 compared to the year-ago quarter. The retirement of Bridgeport Harbor 3 on May 31, 2021, Power’s last coal unit, lowered New England capacity revenue by $0.01 per share versus third quarter 2020. Gas operations were lower by $0.02 per share, reflecting the absence of a pipeline refund received in last year’s third quarter. O&M expense lowered results by $0.01 per share compared to the year-ago quarter, as higher nuclear costs were partly offset by lower solar expenses. Lower depreciation expense associated with Fossil assets moving to held for sale accounting status, the sale of the Solar Source portfolio and the early retirement of Bridgeport Harbor 3, combined with lower interest expense to add $0.08


4


per share versus the year-ago quarter. Lastly, taxes and other items were $0.01 per share unfavorable compared with the third quarter of 2020.

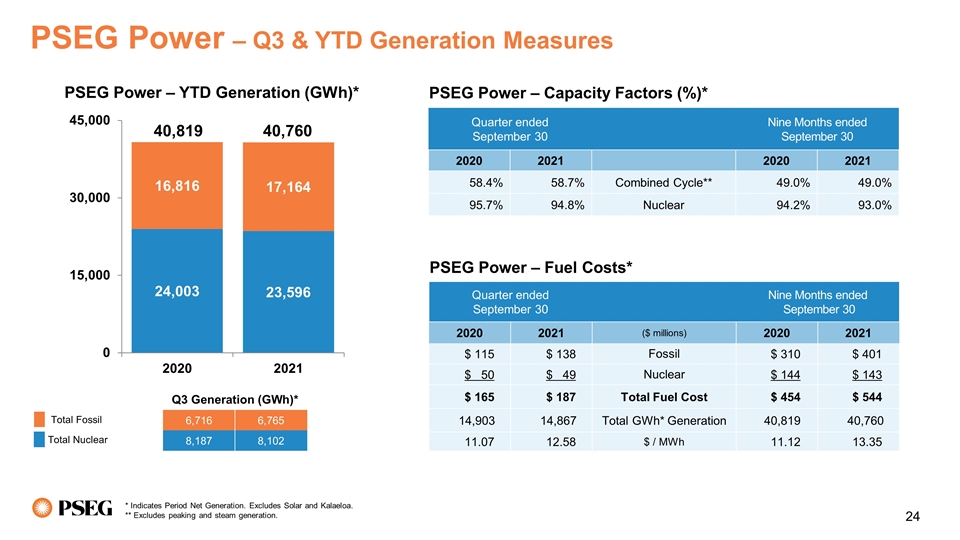
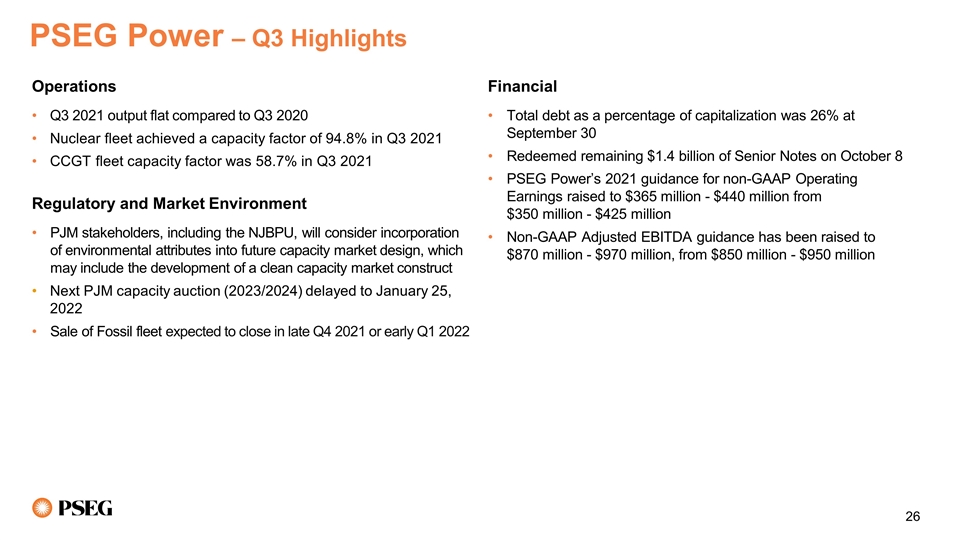
Total generation output of 14.9 TWh matched the output of third quarter 2020. PSEG Power’s CCGT fleet produced 6.8 TWh of output in response to higher market prices. The nuclear fleet operated at an average capacity factor of 94.8% for the quarter, producing 8.1 TWh, which represented 54% of total generation. For the balance of 2021, PSEG Power is forecasting total baseload and combined cycle generation of 12 to 14 TWh, hedged 85% - 90% at an average price of $32 per MWh.

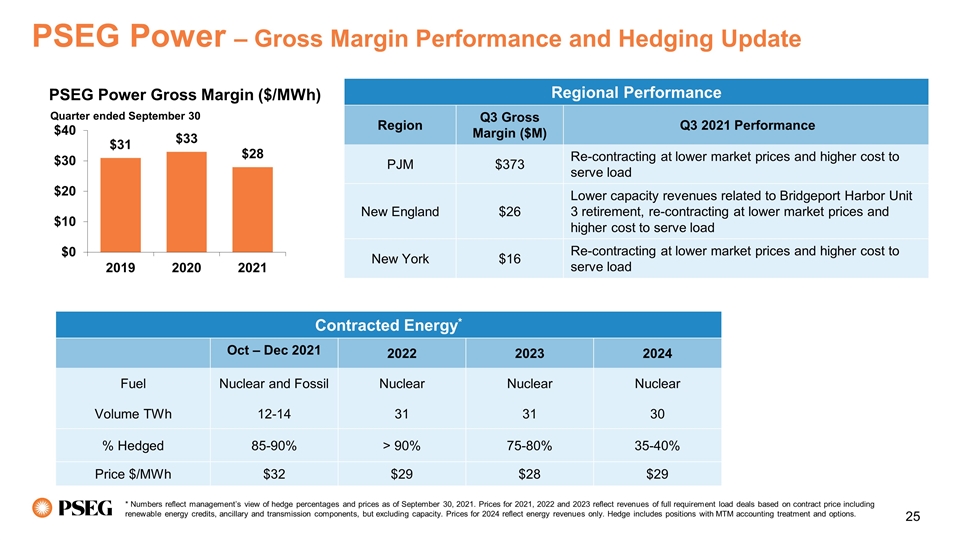
Expected gross margin of over $1 billion for 2022, excluding Fossil results, is over 90% hedged via forward energy sales, approximately $156 million of capacity revenues, and Zero Emission Certificates. For 2022, 2023 and 2024, nuclear output is forecast to be 31, 31, and 30 TWh, respectively. Our ratable hedging approach, executed over a rolling three-year basis, helps to stabilize gross margin from market volatility. Consistent with that methodology, our projected baseload output is currently over 90%, 75-80%, and 35-40% hedged at prices averaging $29, $28, and $29 per MWh for the years 2022, 2023, and 2024, respectively, which is in line with the historical forward prices for those corresponding years.

PSEG Power has raised the forecast for its non-GAAP Operating Earnings for 2021 to $365 million - $440 million, from $350 million - $425 million prior. Our estimate of non-GAAP Adjusted EBITDA has also been raised to $870 million - $970 million, from $850 million - $950 million prior.

PSEG Enterprise/Other

PSEG Enterprise/Other reported a Net Loss of $20 million, or $(0.03) per share, for the third quarter compared to Net Income of $8 million, or $0.02 per share, for the third quarter of 2020. Non-GAAP Operating Loss for the third quarter was $13 million or $(0.02) per share, compared to non-GAAP Operating Earnings of $8 million, or $0.02 per share, for the third quarter of 2020. Results this quarter reflect higher tax and O&M expenses at the parent versus the year-ago period.

For 2021, the forecast for PSEG Enterprise/Other is unchanged at a non-GAAP Operating Loss of $20 million.

###

Public Service Enterprise Group Inc. (PSEG) (NYSE: PEG) is a publicly traded diversified energy company with approximately 13,000 employees. Headquartered in Newark, N.J., PSEG’s principal operating subsidiaries are: Public Service Electric and Gas Co. (PSE&G), PSEG Power and PSEG Long Island. PSEG is a Fortune 500 company included in the S&P 500 Index and has been named to the Dow Jones Sustainability Index for North America for 13 consecutive years (https://corporate.pseg.com).


5


Non-GAAP Financial Measures

Management uses non-GAAP Operating Earnings in its internal analysis, and in communications with investors and analysts, as a consistent measure for comparing PSEG’s financial performance to previous financial results. Non-GAAP Operating Earnings exclude the impact of returns (losses) associated with the Nuclear Decommissioning Trust (NDT), Mark-to-Market (MTM) accounting and material one-time items.

Management believes the presentation of non-GAAP Adjusted EBITDA for PSEG Power is useful to investors and other users of our financial statements in evaluating operating performance because it provides them with an additional tool to compare business performance across companies and across periods. Management also believes that non-GAAP Adjusted EBITDA is widely used by investors to measure operating performance without regard to items such as income tax expense, interest expense and depreciation and amortization, which can vary substantially from company to company depending upon, among other things, the book value of assets, capital structure and whether assets were constructed or acquired. Non-GAAP Adjusted EBITDA also allows investors and other users to assess the underlying financial performance of our fleet before management’s decision to deploy capital. Non-GAAP Adjusted EBITDA excludes the same items as our non-GAAP Operating Earnings measure as well as income tax expense, interest expense and depreciation and amortization.

See Attachments 8 and 9 for a complete list of items excluded from Net Income/(Loss) in the determination of non-GAAP Operating Earnings and non-GAAP Adjusted EBITDA. The presentation of non-GAAP Operating Earnings and non-GAAP Adjusted EBITDA is intended to complement, and should not be considered an alternative to the presentation of Net Income/(Loss), which is an indicator of financial performance determined in accordance with GAAP. In addition, non-GAAP Operating Earnings and non-GAAP Adjusted EBITDA as presented in this release may not be comparable to similarly titled measures used by other companies.

Due to the forward looking nature of non-GAAP Operating Earnings and non-GAAP Adjusted EBITDA guidance, PSEG is unable to reconcile these non-GAAP financial measures to the most directly comparable GAAP financial measure. Management is unable to project certain reconciling items, in particular MTM and NDT gains (losses), for future periods due to market volatility.

Forward-Looking Statements

Certain of the matters discussed in this report about our and our subsidiaries’ future performance, including, without limitation, future revenues, earnings, strategies, prospects, consequences and all other statements that are not purely historical constitute “forward-looking statements” within the meaning of the Private Securities Litigation Reform Act of 1995. Such forward- looking statements are subject to risks and uncertainties, which could cause actual results to differ materially from those anticipated. Such statements are based on management’s beliefs as well as assumptions made by and information currently available to management. When used herein, the words “anticipate,” “intend,” “estimate,”


6


“believe,” “expect,” “plan,” “should,” “hypothetical,” “potential,” “forecast,” “project,” variations of such words and similar expressions are intended to identify forward-looking statements. Factors that may cause actual results to differ are often presented with the forward-looking statements themselves. Other factors that could cause actual results to differ materially from those contemplated in any forward- looking statements made by us herein are discussed in filings we make with the United States Securities and Exchange Commission (SEC), including our Annual Report on Form 10-K and subsequent reports on Form 10-Q and Form 8-K. These factors include, but are not limited to:


any inability to successfully develop, obtain regulatory approval for, or construct generation, transmission and distribution projects;


lack of growth or slower growth in the number of customers or the failure of our Conservation Incentive Program to fully address a decline in customer demand;


any equipment failures, accidents, severe weather events, acts of war or terrorism or other incidents, including pandemics such as the ongoing coronavirus pandemic, that may impact our ability to provide safe and reliable service to our customers;


any inability to recover the carrying amount of our long-lived assets;


any inability to maintain sufficient liquidity;


the impact of cybersecurity attacks or intrusions or other disruptions to our information technology or other systems;


the impact of the ongoing coronavirus pandemic;


the impact of our covenants in our debt instruments on our operations;


adverse performance of our nuclear decommissioning and defined benefit plan trust fund investments and changes in funding requirements;


risks associated with the timeline and ultimate completion of the sale of our fossil generating fleet;


the failure to complete, or delays in completing, our proposed investment in the Ocean Wind offshore wind project, or following the completion of our initial investment in the project, the failure to realize the anticipated strategic and financial benefits of the project;


fluctuations in wholesale power and natural gas markets, including the potential impacts on the economic viability of our generation units;


our ability to obtain adequate fuel supply;


disruptions or cost increase in our supply chain, including labor shortages;


market risks impacting the operation of our generating stations;


changes in technology related to energy generation, distribution and consumption and changes in customer usage patterns;


third-party credit risk relating to our sale of generation output and purchase of fuel;


any inability of PSEG Power to meet its commitments under forward sale obligations;


reliance on transmission facilities to maintain adequate transmission capacity for our power generation fleet;


the impact of changes in state and federal legislation and regulations on our business, including PSE&G’s ability to recover costs and earn returns on authorized investments;


PSE&G’s proposed investment programs may not be fully approved by regulators and its capital investment may be lower than planned;


7


the absence of a long-term legislative or other solution for our New Jersey nuclear plants that sufficiently values them for their carbon-free, fuel diversity and resilience attributes, or the impact of the current or subsequent payments for such attributes being materially adversely modified through legal proceedings;


adverse changes in energy industry laws, policies and regulations, including market structures and transmission planning and transmission returns;


risks associated with our ownership and operation of nuclear facilities, including regulatory risks, such as compliance with the Atomic Energy Act and trade control, environmental and other regulations, as well as financial, environmental and health and safety risks;


changes in federal and state environmental regulations and enforcement;


changes in tax laws and regulations, and;


delays in receipt of, or an inability to receive, necessary licenses and permits.

All of the forward-looking statements made in this report are qualified by these cautionary statements and we cannot assure you that the results or developments anticipated by management will be realized or even if realized, will have the expected consequences to, or effects on, us or our business, prospects, financial condition, results of operations or cash flows. Readers are cautioned not to place undue reliance on these forward-looking statements in making any investment decision. Forward- looking statements made in this report apply only as of the date of this report. While we may elect to update forward-looking statements from time to time, we specifically disclaim any obligation to do so, even in light of new information or future events, unless otherwise required by applicable securities laws.

The forward-looking statements contained in this report are intended to qualify for the safe harbor provisions of Section 27A of the Securities Act of 1933, as amended, and Section 21E of the Securities Exchange Act of 1934, as amended.


From time to time, PSEG, PSE&G and PSEG Power release important information via postings on their corporate Investor Relations website at https://investor.pseg.com. Investors and other interested parties are encouraged to visit the Investor Relations website to review new postings. You can sign up for automatic email alerts regarding new postings at the bottom of the webpage at https://investor.pseg.com.


8


Exhibit 99

Attachment 1

PUBLIC SERVICE ENTERPRISE GROUP INCORPORATED

Consolidating Statements of Operations

(Unaudited, $ millions, except per share data)


     Three Months Ended September 30, 2021  
     PSEG     PSEG Enterprise/
Other (a)
    PSE&G     PSEG
Power
 

OPERATING REVENUES

   $ 1,903     $ 32     $  1,820     $ 51  

OPERATING EXPENSES


Energy Costs

     860       (128     698       290  

Operation and Maintenance

     807       155       422       230  

Depreciation and Amortization

     283       7       226       50  

(Gains) Losses on Asset Dispositions and Impairments

     2,158       —         (4     2,162  


Total Operating Expenses

     4,108       34       1,342       2,732  

OPERATING INCOME (LOSS)

     (2,205     (2     478       (2,681

Income from Equity Method Investments

     3       —         —         3  

Net Gains (Losses) on Trust Investments

     (17     —         —         (17

Other Income (Deductions)

     35       (1     20       16  

Net Non-Operating Pension and OPEB Credits (Costs)

     82       3       67       12  

Interest Expense

     (144     (23     (102     (19


INCOME (LOSS) BEFORE INCOME TAXES

     (2,246     (23     463       (2,686

Income Tax Benefit (Expense)

     682       3       (74     753  


NET INCOME (LOSS)

   $  (1,564   $  (20   $ 389     $  (1,933


Reconciling Items Excluded from Net Income (Loss)(b)

     2,059       7       —         2,052  


OPERATING EARNINGS (non-GAAP)

   $ 495     $ (13   $ 389     $ 119  


Earnings Per Share


NET INCOME (LOSS)

   $ (3.10   $  (0.03   $ 0.77     $ (3.84


Reconciling Items Excluded from Net Income (Loss)(b)

     4.08       0.01       —         4.07  


OPERATING EARNINGS (non-GAAP)

   $ 0.98     $  (0.02   $ 0.77     $ 0.23  


     Three Months Ended September 30, 2020  
     PSEG     PSEG Enterprise/
Other (a)
    PSE&G     PSEG
Power
 

OPERATING REVENUES

   $  2,370     $  (36   $  1,660     $ 746  

OPERATING EXPENSES


Energy Costs

     775       (178     663       290  

Operation and Maintenance

     767       145       409       213  

Depreciation and Amortization

     317       8       218       91  

(Gains) Losses on Asset Dispositions and Impairments

     (122     —         —         (122


Total Operating Expenses

     1,737       (25     1,290       472  

OPERATING INCOME

     633       (11     370       274  

Income from Equity Method Investments

     4       —         —         4  

Net Gains (Losses) on Trust Investments

     107       3       1       103  

Other Income (Deductions)

     39       —         28       11  

Net Non-Operating Pension and OPEB Credits (Costs)

     62       3       51       8  

Interest Expense

     (149     (24     (97     (28


INCOME (LOSS) BEFORE INCOME TAXES

     696       (29     353       372  

Income Tax Benefit (Expense)

     (121     37       (40     (118


NET INCOME

   $ 575     $ 8     $ 313     $ 254  


Reconciling Items Excluded from Net Income(b)

     (87     —         —         (87


OPERATING EARNINGS (non-GAAP)

   $ 488     $ 8     $ 313     $ 167  


Earnings Per Share


NET INCOME

   $ 1.14     $  0.02     $ 0.61     $ 0.51  


Reconciling Items Excluded from Net Income(b)

     (0.18     —         —         (0.18


OPERATING EARNINGS (non-GAAP)

   $ 0.96     $ 0.02     $ 0.61     $ 0.33  


(a)

Includes activities at Energy Holdings, PSEG Long Island and the Parent as well as intercompany eliminations.

(b)

See Attachments 8 and 9 for details of items excluded from Net Income/(Loss) to compute Operating Earnings (non-GAAP).


Attachment 2


PUBLIC SERVICE ENTERPRISE GROUP INCORPORATED

Consolidating Statements of Operations

(Unaudited, $ millions, except per share data)


     Nine Months Ended September 30, 2021  
     PSEG     PSEG Enterprise/
Other (a)
    PSE&G     PSEG
Power
 

OPERATING REVENUES

   $ 6,666     $  (339   $  5,407     $ 1,598  

OPERATING EXPENSES


Energy Costs

     2,495       (804     2,056       1,243  

Operation and Maintenance

     2,368       418       1,239       711  

Depreciation and Amortization

     946       23       698       225  

(Gains) Losses on Asset Dispositions and Impairments

     2,615       —         (4     2,619  


Total Operating Expenses

     8,424       (363     3,989       4,798  

OPERATING INCOME (LOSS)

     (1,758     24       1,418       (3,200

Income from Equity Method Investments

     12       —         —         12  

Net Gains (Losses) on Trust Investments

     124       3       1       120  

Other Income (Deductions)

     93       1       72       20  

Non-Operating Pension and OPEB Credits (Costs)

     246       12       199       35  

Interest Expense

     (437     (66     (301     (70


INCOME (LOSS) BEFORE INCOME TAXES

     (1,720     (26     1,389       (3,083

Income Tax Benefit (Expense)

     627       13       (214     828  


NET INCOME (LOSS)

   $  (1,093   $ (13   $ 1,175     $  (2,255


Reconciling Items Excluded from Net Income (Loss)(b)

     2,594       7       —         2,587  


OPERATING EARNINGS (non-GAAP)

   $ 1,501     $ (6   $ 1,175     $ 332  


Earnings Per Share


NET INCOME (LOSS)

   $ (2.17   $  (0.02   $ 2.33     $  (4.48


Reconciling Items Excluded from Net Income (Loss) (b)

     5.15       0.01       —         5.14  

Share Differential (b)

     (0.02     —         (0.01     (0.01


OPERATING EARNINGS (non-GAAP)

   $ 2.96     $  (0.01   $ 2.32     $ 0.65  


     Nine Months Ended September 30, 2020  
     PSEG     PSEG Enterprise/
Other (a)
    PSE&G     PSEG
Power
 

OPERATING REVENUES

   $  7,201     $  (447   $  4,999     $  2,649  

OPERATING EXPENSES


Energy Costs

     2,276       (894     1,881       1,289  

Operation and Maintenance

     2,254       400       1,175       679  

Depreciation and Amortization

     956       23       657       276  

(Gains) Losses on Asset Dispositions and Impairments

     (122     —         —         (122


Total Operating Expenses

     5,364       (471     3,713       2,122  

OPERATING INCOME

     1,837       24       1,286       527  

Income from Equity Method Investments

     10       —         —         10  

Net Gains (Losses) on Trust Investments

     87       6       2       79  

Other Income (Deductions)

     81       —         81       —    

Non-Operating Pension and OPEB Credits (Costs)

     186       7       154       25  

Interest Expense

     (453     (70     (291     (92


INCOME (LOSS) BEFORE INCOME TAXES

     1,748       (33     1,232       549  

Income Tax Benefit (Expense)

     (274     34       (196     (112


NET INCOME

   $ 1,474     $ 1     $ 1,036     $ 437  


Reconciling Items Excluded from Net Income(b)

     (62     —         —         (62


OPERATING EARNINGS (non-GAAP)

   $ 1,412     $ 1     $ 1,036     $ 375  


Earnings Per Share


NET INCOME

   $ 2.91     $ —       $ 2.04     $ 0.87  


Reconciling Items Excluded from Net Income(b)

     (0.13     —         —         (0.13


OPERATING EARNINGS (non-GAAP)

   $ 2.78     $ —       $ 2.04     $ 0.74  


(a)

Includes activities at Energy Holdings, PSEG Long Island and the Parent as well as intercompany eliminations.

(b)

See Attachments 8 and 9 for details of items excluded from Net Income/(Loss) to compute Operating Earnings (non-GAAP) and the impact of using different share amounts (Share Differential) for calculating earnings per share for PSEG’s consolidated GAAP Net Loss versus consolidated Operating Earnings (non-GAAP).


Attachment 3


PUBLIC SERVICE ENTERPRISE GROUP INCORPORATED

Capitalization Schedule

(Unaudited, $ millions)


     September 30,     December 31,  
     2021     2020  

DEBT


Commercial Paper and Loans

   $ 3,705     $ 1,063  

Long-Term Debt*

     16,075       16,180  


Total Debt

     19,780       17,243  

STOCKHOLDERS’ EQUITY


Common Stock

     5,039       5,031  

Treasury Stock

     (898     (861

Retained Earnings

     10,452       12,318  

Accumulated Other Comprehensive Loss

     (524     (504


Total Stockholders’ Equity

     14,069       15,984  


Total Capitalization

   $  33,849     $  33,227  


*

Includes current portion of Long-Term Debt


Attachment 4


PUBLIC SERVICE ENTERPRISE GROUP INCORPORATED

CONDENSED CONSOLIDATED STATEMENTS OF CASH FLOWS

(Unaudited, $ millions)


     Nine Months Ended September 30,  
     2021      2020  

CASH FLOWS FROM OPERATING ACTIVITIES


Net Income (Loss)

   $  (1,093)      $ 1,474  

Adjustments to Reconcile Net Income (Loss) to Net Cash Flows From Operating Activities

     2,271        1,043  


NET CASH PROVIDED BY (USED IN) OPERATING ACTIVITIES

     1,178        2,517  


NET CASH PROVIDED BY (USED IN) INVESTING ACTIVITIES

     (1,583)        (1,855)  


NET CASH PROVIDED BY (USED IN) FINANCING ACTIVITIES

     1,693        161  


Net Change in Cash, Cash Equivalents and Restricted Cash

     1,288        823  

Cash, Cash Equivalents and Restricted Cash at Beginning of Period

     572        176  


Cash, Cash Equivalents and Restricted Cash at End of Period

   $ 1,860      $ 999  


Attachment 5


PUBLIC SERVICE ELECTRIC & GAS COMPANY

Retail Sales

(Unaudited)

September 30, 2021


Electric Sales


Sales (millions kWh)

   Three Months
Ended
     Change vs.
2020
    Nine Months
Ended
     Change vs.
2020
 

Residential

     4,681        (7 %)      11,156        0

Commercial & Industrial

     7,188        1     19,605        3

Other

     73        (1 %)      244        (2 %) 


Total

     11,942        (2 %)      31,005        2


Gas Sold and Transported


Sales (millions therms)

   Three Months
Ended
     Change vs.
2020
    Nine Months
Ended
     Change vs.
2020
 

Firm Sales


Residential Sales

     91        (4 %)      1,033        6

Commercial & Industrial

     97        8     726        8


Total Firm Sales

     188        2     1,759        7


Non-Firm Sales*


Commercial & Industrial

     317        (1 %)      680        (1 %) 


Total Non-Firm Sales

     317          680     


Total Sales

     505        0     2,439        5


*

Contract Service Gas rate included in non-firm sales


Weather Data*


     Three Months
Ended
     Change vs.
2020
    Nine Months
Ended
     Change vs.
2020
 

THI Hours - Actual

     14,880        4     20,449        11

THI Hours - Normal

     12,225          16,372     

Degree Days - Actual

     2        (95 %)      2,891        5

Degree Days - Normal

     24          3,053     


*

Winter weather as defined by heating degree days (HDD) to serve as a measure for the need for heating. For each day, HDD is calculated as HDD = 65°F – the average hourly daily temperature. Summer weather is measured by the temperature-humidity index (THI), which takes into account both the temperature and the humidity to measure the need for air conditioning. Both measures use data provided by the National Oceanic and Atmospheric Administration based on readings from Newark Liberty International Airport. Comparisons to normal are based on twenty years of historic data.


Attachment 6


PSEG POWER LLC

Generation Measures(1)

(Unaudited)


     GWhr Breakdown
Three Months Ended
September 30,
    GWhr Breakdown
Nine Months Ended
September 30,
 
     2021     2020     2021      2020  

Nuclear - NJ

     5,332       5,487       15,079        15,491  

Nuclear - PA

     2,770       2,700       8,517        8,512  


Total Nuclear

     8,102       8,187       23,596        24,003  

Fossil - Natural Gas - NJ

     2,988       3,008       6,616        6,678  

Fossil - Natural Gas - NY

     1,493       1,478       3,874        3,636  

Fossil - Natural Gas - MD

     1,292       1,276       3,656        3,732  

Fossil - Natural Gas - CT

     993       956       2,774        2,786  


Total Natural Gas(2)

     6,766       6,718       16,920        16,832  

Fossil - Coal

     (1     (2     244        (16


     14,867       14,903       40,760        40,819  


     % Generation by Fuel Type
Three Months Ended
September 30,
    % Generation by Fuel Type
Nine Months Ended
September 30,
 
     2021     2020     2021     2020  

Nuclear - NJ

     36     37     37     38

Nuclear - PA

     18     18     21     21


Total Nuclear

     54     55     58     59

Fossil - Natural Gas - NJ

     20     20     16     16

Fossil - Natural Gas - NY

     10     10     10     9

Fossil - Natural Gas - MD

     9     9     9     9

Fossil - Natural Gas - CT

     7     6     7     7


Total Natural Gas(2)

     46     45     42     41

Fossil - Coal

     0     0     0     0


     100     100     100     100


(1) 

Indicates Period Net Generation, negative value reflects more GWh required to operate plants than were generated. Excludes Solar and Kalaeloa.

(2) 

Includes several units that are dual fuel for oil.


Attachment 7


PUBLIC SERVICE ENTERPRISE GROUP INCORPORATED

Statistical Measures

(Unaudited)


     Three Months Ended September 30,      Nine Months Ended September 30,  
     2021      2020      2021     2020  

Weighted Average Common Shares Outstanding (millions)*


Basic

     504        504        504       504  

Diluted

     504        507        504       507  

Stock Price at End of Period

           $60.90       $54.91  

Dividends Paid per Share of Common Stock

     $0.51        $0.49        $1.53       $1.47  

Dividend Yield

           3.3     3.6

Book Value per Common Share

           $27.94       $31.43  

Market Price as a Percent of Book Value

           218     175


*

Approximately three million potentially dilutive shares were excluded from fully diluted average shares outstanding used to calculate the diluted GAAP loss per share for the three months and nine months ended September 30, 2021 as their impact was antidilutive to GAAP results.


Attachment 8


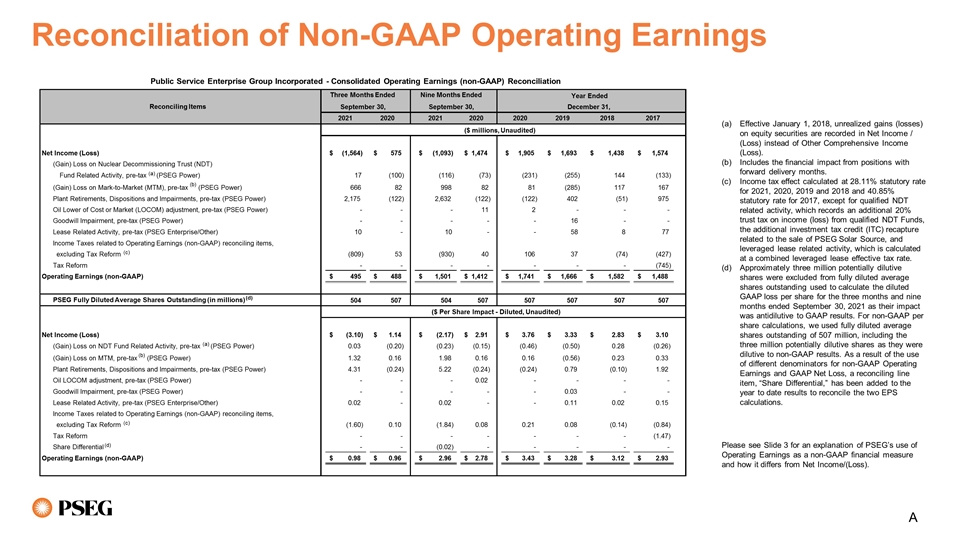
PUBLIC SERVICE ENTERPRISE GROUP INCORPORATED

Consolidated Operating Earnings (non-GAAP) Reconciliation


Reconciling Items

   Three Months Ended
September 30,
    Nine Months Ended
September 30,
 
     2021     2020     2021     2020  
     ($ millions, Unaudited)  

Net Income (Loss)

   $ (1,564   $ 575     $ (1,093   $ 1,474  

(Gain) Loss on Nuclear Decommissioning Trust (NDT)


Fund Related Activity, pre-tax (PSEG Power)

     17       (100     (116     (73

(Gain) Loss on Mark-to-Market (MTM), pre-tax (a) (PSEG Power)

     666       82       998       82  

Plant Retirements, Dispositions and Impairments, pre-tax (PSEG Power)

     2,175       (122     2,632       (122

Oil Lower of Cost or Market (LOCOM) adjustment, pre-tax (PSEG Power)

     —         —         —         11  

Lease Related Activity, pre-tax (PSEG Enterprise/Other)

     10       —         10       —    

Income Taxes related to Operating Earnings (non-GAAP) reconciling items(b)

     (809     53       (930     40  


Operating Earnings (non-GAAP)

   $ 495     $ 488     $ 1,501     $ 1,412  


PSEG Fully Diluted Average Shares Outstanding (in millions)(c)

     504       507       504       507  


     ($ Per Share Impact—Diluted, Unaudited)  
        

Net Income (Loss)

   $ (3.10   $ 1.14     $ (2.17   $ 2.91  

(Gain) Loss on NDT Fund Related Activity, pre-tax (PSEG Power)

     0.03       (0.20     (0.23     (0.15

(Gain) Loss on MTM, pre-tax (a) (PSEG Power)

     1.32       0.16       1.98       0.16  

Plant Retirements, Dispositions and Impairments, pre-tax (PSEG Power)

     4.31       (0.24     5.22       (0.24

Oil LOCOM adjustment, pre-tax (PSEG Power)

     —         —         —         0.02  

Lease Related Activity, pre-tax (PSEG Enterprise/Other)

     0.02       —         0.02       —    

Income Taxes related to Operating Earnings (non-GAAP) reconciling items(b)

     (1.60     0.10       (1.84     0.08  

Share Differential(c)

     —         —         (0.02     —    


Operating Earnings (non-GAAP)

   $ 0.98     $ 0.96     $ 2.96     $ 2.78  


(a)

Includes the financial impact from positions with forward delivery months.

(b)

Income tax effect calculated at the statutory rate except for qualified NDT related activity, which records an additional 20% trust tax on income (loss) from qualified NDT Funds, the additional investment tax credit (ITC) recapture related to the sale of PSEG Solar Source, and leveraged lease related activity, which is calculated at a combined leveraged lease effective tax rate.

(c)

Approximately three million potentially dilutive shares were excluded from fully diluted average shares outstanding used to calculate the diluted GAAP loss per share for the three months and nine months ended September 30, 2021 as their impact was antidilutive to GAAP results. For non-GAAP per share calculations, we used fully diluted average shares outstanding of 507 million, including the three million potentially dilutive shares as they were dilutive to non-GAAP results. As a result of the use of different denominators for non-GAAP Operating Earnings and GAAP Net Loss, a reconciling line item, “Share Differential,” has been added to the year to date results to reconcile the two EPS calculations.


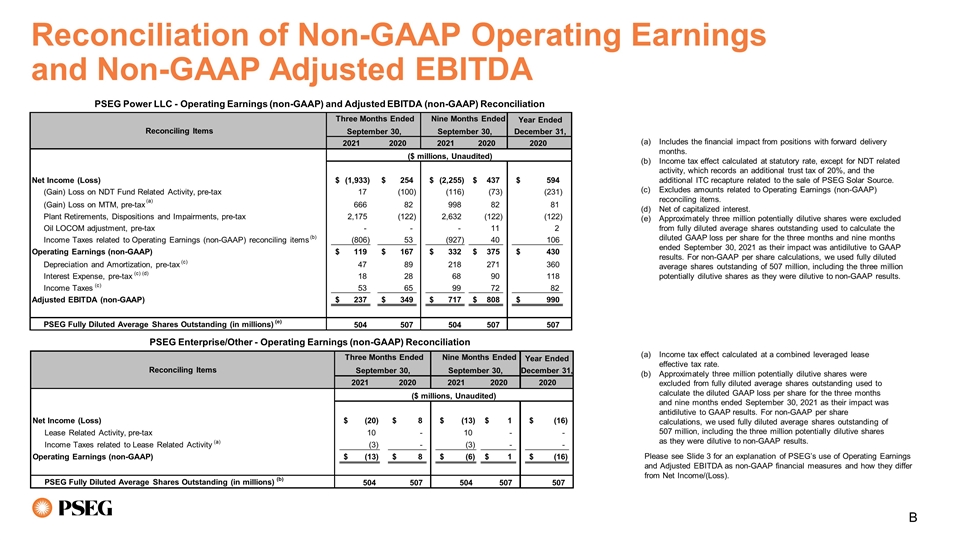
Attachment 9


PSEG Power Operating Earnings (non-GAAP) and Adjusted EBITDA (non-GAAP) Reconciliation


Reconciling Items

   Three Months Ended
September 30,
    Nine Months Ended
September 30,
 
     2021     2020     2021     2020  
     ($ millions, Unaudited)  

Net Income (Loss)

   $ (1,933   $ 254     $ (2,255   $ 437  

(Gain) Loss on NDT Fund Related Activity, pre-tax

     17       (100     (116     (73

(Gain) Loss on MTM, pre-tax (a)

     666       82       998       82  

Plant Retirements, Dispositions and Impairments, pre-tax

     2,175       (122     2,632       (122

Oil LOCOM adjustment, pre-tax

     —         —         —         11  

Income Taxes related to Operating Earnings (non-GAAP) reconciling items(b)

     (806     53       (927     40  


Operating Earnings (non-GAAP)

   $ 119     $ 167     $ 332     $ 375  

Depreciation and Amortization, pre-tax (c)

     47       89       218       271  

Interest Expense, pre-tax (c) (d)

     18       28       68       90  

Income Taxes (c)

     53       65       99       72  


Adjusted EBITDA (non-GAAP)

   $ 237     $ 349     $ 717     $ 808  


PSEG Fully Diluted Average Shares Outstanding (in millions)(e)

     504       507       504       507  


(a)

Includes the financial impact from positions with forward delivery months.

(b)

Income tax effect calculated at the statutory rate except for qualified NDT related activity, which records an additional 20% trust tax on income (loss) from qualified NDT Funds and the additional investment tax credit (ITC) recapture related to the sale of PSEG Solar Source.

(c)

Excludes amounts related to Operating Earnings (non-GAAP) reconciling items.

(d)

Net of capitalized interest.

(e)

Approximately three million potentially dilutive shares were excluded from fully diluted average shares outstanding used to calculate the diluted GAAP loss per share for the three months and nine months ended September 30, 2021 as their impact was antidilutive to GAAP results. For non-GAAP per share calculations, we used fully diluted average shares outstanding of 507 million, including the three million potentially dilutive shares as they were dilutive to non-GAAP results.

PSEG Enterprise/Other

Operating Earnings (non-GAAP) Reconciliation


Reconciling Items

   Three Months Ended
September 30,
     Nine Months Ended
September 30,
 
     2021     2020      2021     2020  
     ($ millions, Unaudited)  

Net Income (Loss)

   $ (20   $ 8      $ (13   $ 1  

Lease Related Activity, pre-tax

     10       —          10       —    

Income Taxes related to Lease Related Activity(a)

     (3     —          (3     —    


Operating Earnings (non-GAAP)

   $ (13   $ 8      $ (6   $ 1  


PSEG Fully Diluted Average Shares Outstanding (in millions)(b)

     504       507        504       507  


(a)

Income tax effect calculated at a combined leveraged lease effective tax rate.

(b)

Approximately three million potentially dilutive shares were excluded from fully diluted average shares outstanding used to calculate the diluted GAAP loss per share for the three months and nine months ended September 30, 2021 as their impact was antidilutive to GAAP results. For non-GAAP per share calculations, we used fully diluted average shares outstanding of 507 million, including the three million potentially dilutive shares as they were dilutive to non-GAAP results.

Slide 1

Public Service Enterprise Group Financial Results and Conference Call 3rd QUARTER 2 NOV 2021 EXHIBIT 99.1


Slide 2

Certain of the matters discussed in this presentation about our and our subsidiaries’ future performance, including, without limitation, future revenues, earnings, strategies, prospects, consequences and all other statements that are not purely historical constitute “forward-looking statements” within the meaning of the Private Securities Litigation Reform Act of 1995. Such forward-looking statements are subject to risks and uncertainties, which could cause actual results to differ materially from those anticipated. Such statements are based on management’s beliefs as well as assumptions made by and information currently available to management. When used herein, the words “anticipate,” “intend,” “estimate,” “believe,” “expect,” “plan,” “should,” “hypothetical,” “potential,” “forecast,” “project,” variations of such words and similar expressions are intended to identify forward-looking statements. Factors that may cause actual results to differ are often presented with the forward-looking statements themselves. Other factors that could cause actual results to differ materially from those contemplated in any forward-looking statements made by us herein are discussed in filings we make with the United States Securities and Exchange Commission (SEC), including our Annual Report on Form 10-K and subsequent reports on Form 10-Q and Form 8-K. These factors include, but are not limited to: any inability to successfully develop, obtain regulatory approval for, or construct generation, transmission and distribution projects; lack of growth or slower growth in the number of customers or the failure of our Conservation Incentive Program to fully address a decline in customer demand; any equipment failures, accidents, severe weather events, acts of war or terrorism or other incidents, including pandemics such as the ongoing coronavirus pandemic, that may impact our ability to provide safe and reliable service to our customers; any inability to recover the carrying amount of our long-lived assets; any inability to maintain sufficient liquidity; the impact of cybersecurity attacks or intrusions or other disruptions to our information technology or other systems; the impact of the ongoing coronavirus pandemic; the impact of our covenants in our debt instruments on our operations; adverse performance of our nuclear decommissioning and defined benefit plan trust fund investments and changes in funding requirements; risks associated with the timeline and ultimate completion of the sale of our fossil generating fleet; the failure to complete, or delays in completing, our proposed investment in the Ocean Wind offshore wind project, or following the completion of our initial investment in the project, the failure to realize the anticipated strategic and financial benefits of the project; fluctuations in wholesale power and natural gas markets, including the potential impacts on the economic viability of our generation units; our ability to obtain adequate fuel supply; disruptions or cost increase in our supply chain, including labor shortages; market risks impacting the operation of our generating stations; changes in technology related to energy generation, distribution and consumption and changes in customer usage patterns; third-party credit risk relating to our sale of generation output and purchase of fuel; any inability of PSEG Power to meet its commitments under forward sale obligations; reliance on transmission facilities to maintain adequate transmission capacity for our power generation fleet; the impact of changes in state and federal legislation and regulations on our business, including PSE&G’s ability to recover costs and earn returns on authorized investments; PSE&G’s proposed investment programs may not be fully approved by regulators and its capital investment may be lower than planned; the absence of a long-term legislative or other solution for our New Jersey nuclear plants that sufficiently values them for their carbon-free, fuel diversity and resilience attributes, or the impact of the current or subsequent payments for such attributes being materially adversely modified through legal proceedings; adverse changes in energy industry laws, policies and regulations, including market structures and transmission planning and transmission returns; risks associated with our ownership and operation of nuclear facilities, including regulatory risks, such as compliance with the Atomic Energy Act and trade control, environmental and other regulations, as well as financial, environmental and health and safety risks; changes in federal and state environmental regulations and enforcement; changes in tax laws and regulations; and delays in receipt of, or an inability to receive, necessary licenses and permits. All of the forward-looking statements made in this presentation are qualified by these cautionary statements and we cannot assure you that the results or developments anticipated by management will be realized or even if realized, will have the expected consequences to, or effects on, us or our business, prospects, financial condition, results of operations or cash flows. Readers are cautioned not to place undue reliance on these forward-looking statements in making any investment decision. Forward-looking statements made in this presentation apply only as of the date of this presentation. While we may elect to update forward-looking statements from time to time, we specifically disclaim any obligation to do so, even in light of new information or future events, unless otherwise required by applicable securities laws. The forward-looking statements contained in this presentation are intended to qualify for the safe harbor provisions of Section 27A of the Securities Act of 1933, as amended, and Section 21E of the Securities Exchange Act of 1934, as amended. Forward-Looking Statements


Slide 3

PSEG presents Operating Earnings and Adjusted Earnings Before Interest, Taxes, Depreciation and Amortization (EBITDA) in addition to its Net Income/(Loss) reported in accordance with accounting principles generally accepted in the United States (GAAP). Operating Earnings and Adjusted EBITDA are non-GAAP financial measures that differ from Net Income/(Loss). Non-GAAP Operating Earnings exclude the impact of returns (losses) associated with the Nuclear Decommissioning Trust (NDT), Mark-to-Market (MTM) accounting and material one-time items. Non-GAAP Adjusted EBITDA excludes the same items as our non-GAAP Operating Earnings measure as well as income tax expense, interest expense and depreciation and amortization. The last two slides in this presentation (Slides A and B) include a list of items excluded from Net Income/(Loss) to reconcile to non-GAAP Operating Earnings and non-GAAP Adjusted EBITDA with a reference to those slides included on each of the slides where the non-GAAP information appears. Management uses non-GAAP Operating Earnings in its internal analysis, and in communications with investors and analysts, as a consistent measure for comparing PSEG’s financial performance to previous financial results. Management believes non-GAAP Adjusted EBITDA is useful to investors and other users of our financial statements in evaluating operating performance because it provides them with an additional tool to compare business performance across companies and across periods. Management also believes that non-GAAP Adjusted EBITDA is widely used by investors to measure operating performance without regard to items such as income tax expense, interest expense and depreciation and amortization, which can vary substantially from company to company depending upon, among other things, the book value of assets, capital structure and whether assets were constructed or acquired. Non-GAAP Adjusted EBITDA also allows investors and other users to assess the underlying financial performance of our fleet before management’s decision to deploy capital. The presentation of non-GAAP Operating Earnings and non-GAAP Adjusted EBITDA is intended to complement, and should not be considered an alternative to, the presentation of Net Income/(Loss), which is an indicator of financial performance determined in accordance with GAAP. In addition, non-GAAP Operating Earnings and non-GAAP Adjusted EBITDA as presented in this release may not be comparable to similarly titled measures used by other companies. Due to the forward-looking nature of non-GAAP Operating Earnings and non-GAAP Adjusted EBITDA guidance, PSEG is unable to reconcile these non-GAAP financial measures to the most directly comparable GAAP financial measure. Management is unable to project certain reconciling items, in particular MTM and NDT gains (losses), for future periods due to market volatility. GAAP Disclaimer From time to time, PSEG, PSE&G and PSEG Power release important information via postings on their corporate Investor Relations website at https://investor.pseg.com. Investors and other interested parties are encouraged to visit the Investor Relations website to review new postings. You can sign up for automatic email alerts regarding new postings at the bottom of the webpage at https://investor.pseg.com.


Slide 4

PSEG Q3 2021 Ralph Izzo Chairman, President and Chief Executive Officer


Slide 5

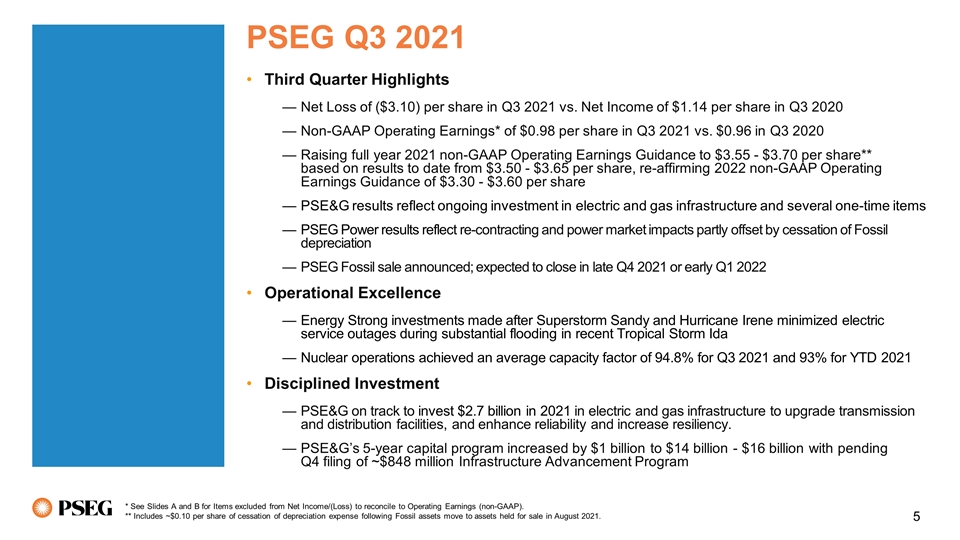
PSEG Q3 2021 Third Quarter Highlights Net Loss of ($3.10) per share in Q3 2021 vs. Net Income of $1.14 per share in Q3 2020 Non-GAAP Operating Earnings* of $0.98 per share in Q3 2021 vs. $0.96 in Q3 2020 Raising full year 2021 non-GAAP Operating Earnings Guidance to $3.55 - $3.70 per share** based on results to date from $3.50 - $3.65 per share, re-affirming 2022 non-GAAP Operating Earnings Guidance of $3.30 - $3.60 per share PSE&G results reflect ongoing investment in electric and gas infrastructure and several one-time items PSEG Power results reflect re-contracting and power market impacts partly offset by cessation of Fossil depreciation PSEG Fossil sale announced; expected to close in late Q4 2021 or early Q1 2022 Operational Excellence Energy Strong investments made after Superstorm Sandy and Hurricane Irene minimized electric service outages during substantial flooding in recent Tropical Storm Ida Nuclear operations achieved an average capacity factor of 94.8% for Q3 2021 and 93% for YTD 2021 Disciplined Investment PSE&G on track to invest $2.7 billion in 2021 in electric and gas infrastructure to upgrade transmission and distribution facilities, and enhance reliability and increase resiliency. PSE&G’s 5-year capital program increased by $1 billion to $14 billion - $16 billion with pending Q4 filing of ~$848 million Infrastructure Advancement Program * See Slides A and B for Items excluded from Net Income/(Loss) to reconcile to Operating Earnings (non-GAAP). ** Includes ~$0.10 per share of cessation of depreciation expense following Fossil assets move to assets held for sale in August 2021.


Slide 6

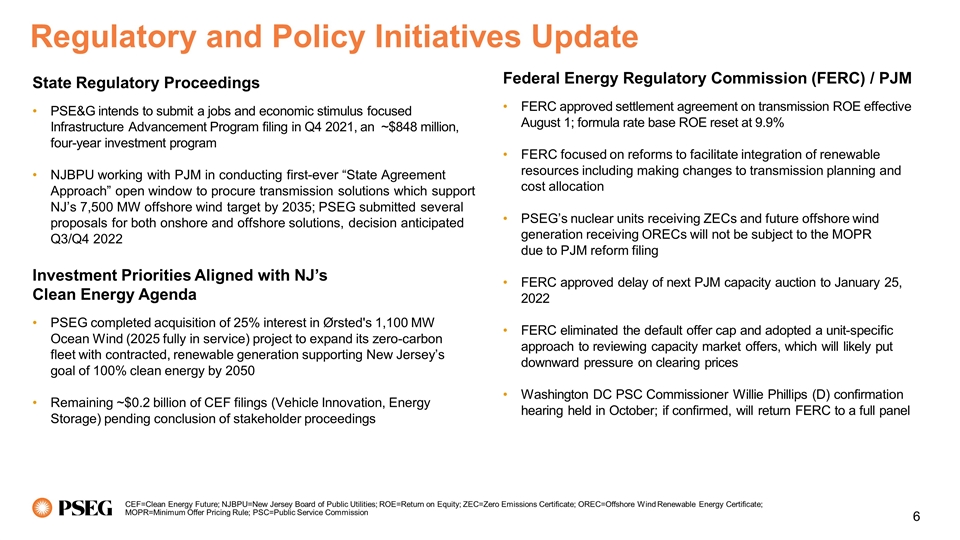
Regulatory and Policy Initiatives Update CEF=Clean Energy Future; NJBPU=New Jersey Board of Public Utilities; ROE=Return on Equity; ZEC=Zero Emissions Certificate; OREC=Offshore Wind Renewable Energy Certificate; MOPR=Minimum Offer Pricing Rule; PSC=Public Service Commission State Regulatory Proceedings PSE&G intends to submit a jobs and economic stimulus focused Infrastructure Advancement Program filing in Q4 2021, an ~$848 million, four-year investment program NJBPU working with PJM in conducting first-ever “State Agreement Approach” open window to procure transmission solutions which support NJ’s 7,500 MW offshore wind target by 2035; PSEG submitted several proposals for both onshore and offshore solutions, decision anticipated Q3/Q4 2022 Investment Priorities Aligned with NJ’s Clean Energy Agenda PSEG completed acquisition of 25% interest in Ørsted's 1,100 MW Ocean Wind (2025 fully in service) project to expand its zero-carbon fleet with contracted, renewable generation supporting New Jersey’s goal of 100% clean energy by 2050 Remaining ~$0.2 billion of CEF filings (Vehicle Innovation, Energy Storage) pending conclusion of stakeholder proceedings Federal Energy Regulatory Commission (FERC) / PJM FERC approved settlement agreement on transmission ROE effective August 1; formula rate base ROE reset at 9.9% FERC focused on reforms to facilitate integration of renewable resources including making changes to transmission planning and cost allocation PSEG’s nuclear units receiving ZECs and future offshore wind generation receiving ORECs will not be subject to the MOPR due to PJM reform filing FERC approved delay of next PJM capacity auction to January 25, 2022 FERC eliminated the default offer cap and adopted a unit-specific approach to reviewing capacity market offers, which will likely put downward pressure on clearing prices Washington DC PSC Commissioner Willie Phillips (D) confirmation hearing held in October; if confirmed, will return FERC to a full panel


Slide 7

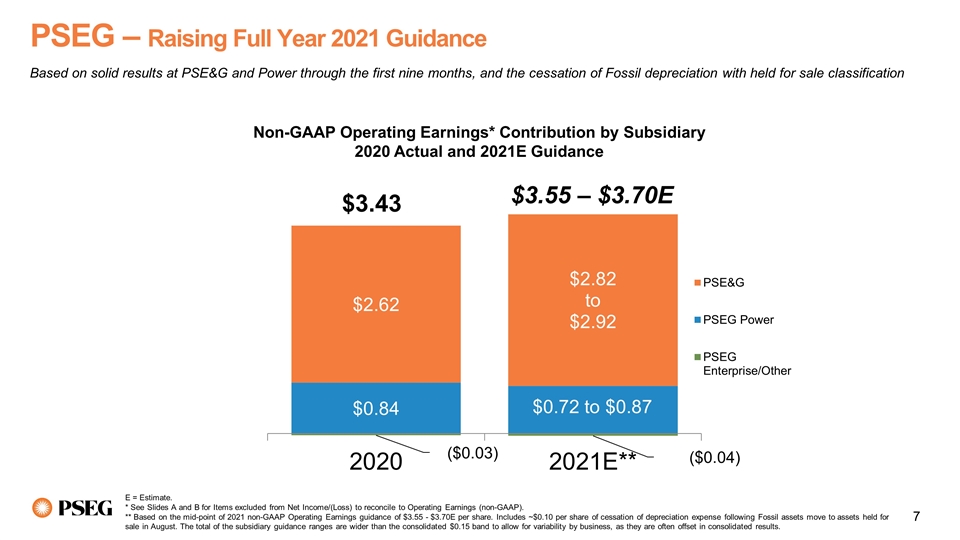
Non-GAAP Operating Earnings* Contribution by Subsidiary 2020 Actual and 2021E Guidance E = Estimate. * See Slides A and B for Items excluded from Net Income/(Loss) to reconcile to Operating Earnings (non-GAAP). ** Based on the mid-point of 2021 non-GAAP Operating Earnings guidance of $3.55 - $3.70E per share. Includes ~$0.10 per share of cessation of depreciation expense following Fossil assets move to assets held for sale in August. The total of the subsidiary guidance ranges are wider than the consolidated $0.15 band to allow for variability by business, as they are often offset in consolidated results. $3.55 – $3.70E PSEG – Raising Full Year 2021 Guidance Based on solid results at PSE&G and Power through the first nine months, and the cessation of Fossil depreciation with held for sale classification


Slide 8

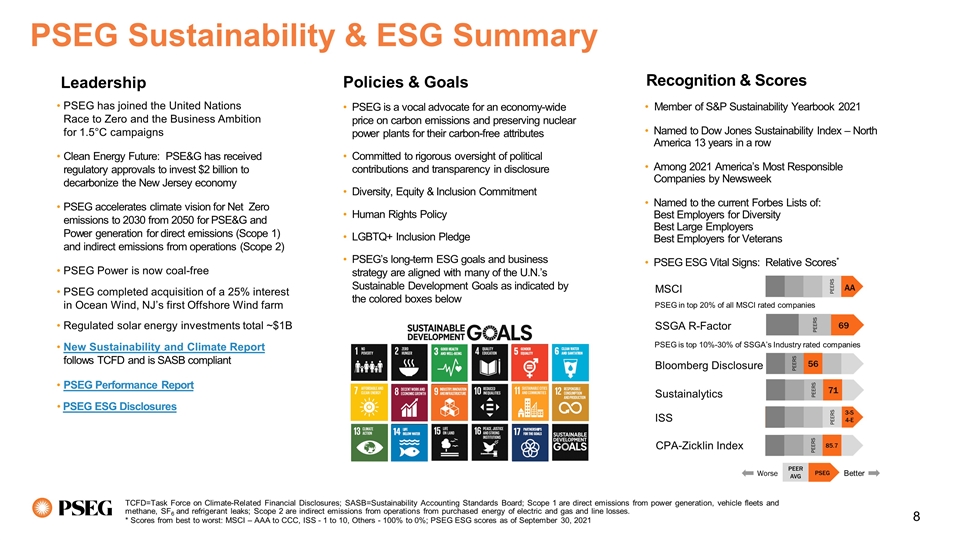
Member of S&P Sustainability Yearbook 2021 Named to Dow Jones Sustainability Index – North America 13 years in a row Among 2021 America’s Most Responsible Companies by Newsweek Named to the current Forbes Lists of: Best Employers for Diversity Best Large Employers Best Employers for Veterans PSEG ESG Vital Signs: Relative Scores* PSEG Sustainability & ESG Summary Leadership Policies & Goals Recognition & Scores PSEG is a vocal advocate for an economy-wide price on carbon emissions and preserving nuclear power plants for their carbon-free attributes Committed to rigorous oversight of political contributions and transparency in disclosure Diversity, Equity & Inclusion Commitment Human Rights Policy LGBTQ+ Inclusion Pledge PSEG’s long-term ESG goals and business strategy are aligned with many of the U.N.’s Sustainable Development Goals as indicated by the colored boxes below TCFD=Task Force on Climate-Related Financial Disclosures; SASB=Sustainability Accounting Standards Board; Scope 1 are direct emissions from power generation, vehicle fleets and methane, SF6 and refrigerant leaks; Scope 2 are indirect emissions from operations from purchased energy of electric and gas and line losses. PSEG in top 20% of all MSCI rated companies Worse Better SSGA R-Factor Sustainalytics Bloomberg Disclosure ISS MSCI CPA-Zicklin Index PSEG is top 10%-30% of SSGA’s Industry rated companies PSEG has joined the United Nations Race to Zero and the Business Ambition for 1.5°C campaigns Clean Energy Future: PSE&G has received regulatory approvals to invest $2 billion to decarbonize the New Jersey economy PSEG accelerates climate vision for Net Zero emissions to 2030 from 2050 for PSE&G and Power generation for direct emissions (Scope 1) and indirect emissions from operations (Scope 2) PSEG Power is now coal-free PSEG completed acquisition of a 25% interest in Ocean Wind, NJ’s first Offshore Wind farm Regulated solar energy investments total ~$1B New Sustainability and Climate Report follows TCFD and is SASB compliant PSEG Performance Report PSEG ESG Disclosures * Scores from best to worst: MSCI – AAA to CCC, ISS - 1 to 10, Others - 100% to 0%; PSEG ESG scores as of September 30, 2021


Slide 9

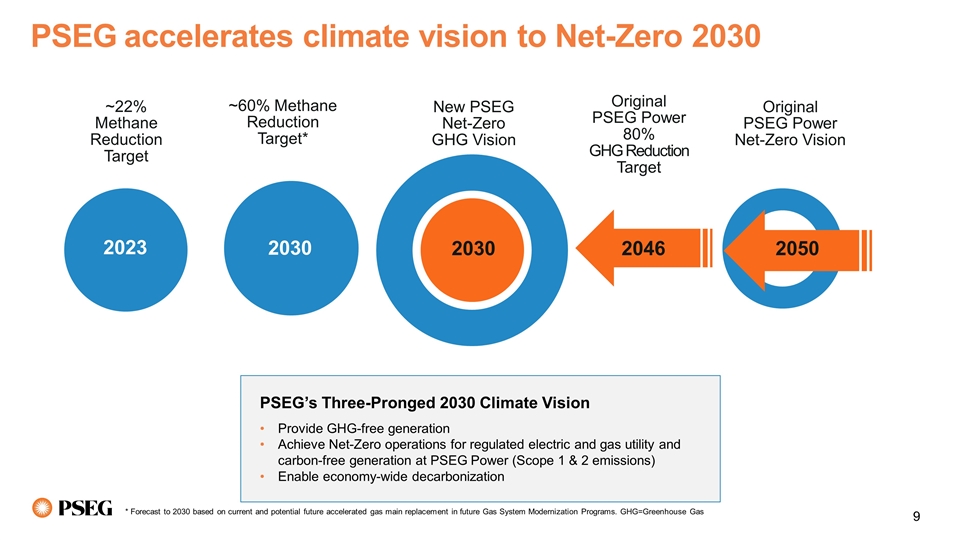
2023 2030 2030 2046 2050 PSEG accelerates climate vision to Net-Zero 2030 PSEG’s Three-Pronged 2030 Climate Vision Provide GHG-free generation Achieve Net-Zero operations for regulated electric and gas utility and carbon-free generation at PSEG Power (Scope 1 & 2 emissions) Enable economy-wide decarbonization * Forecast to 2030 based on current and potential future accelerated gas main replacement in future Gas System Modernization Programs. GHG=Greenhouse Gas New PSEG Net-Zero GHG Vision Original PSEG Power Net-Zero Vision Original PSEG Power 80% GHG Reduction Target ~22% Methane Reduction Target ~60% Methane Reduction Target*


Slide 10

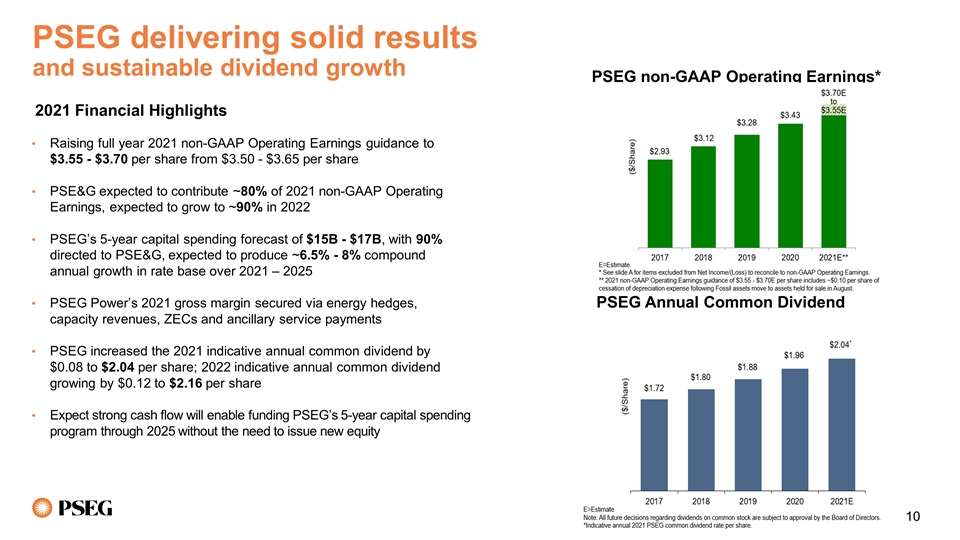
PSEG delivering solid results and sustainable dividend growth PSEG non-GAAP Operating Earnings* PSEG Annual Common Dividend Raising full year 2021 non-GAAP Operating Earnings guidance to $3.55 - $3.70 per share from $3.50 - $3.65 per share PSE&G expected to contribute ~80% of 2021 non-GAAP Operating Earnings, expected to grow to ~90% in 2022 PSEG’s 5-year capital spending forecast of $15B - $17B, with 90% directed to PSE&G, expected to produce ~6.5% - 8% compound annual growth in rate base over 2021 – 2025 PSEG Power’s 2021 gross margin secured via energy hedges, capacity revenues, ZECs and ancillary service payments PSEG increased the 2021 indicative annual common dividend by $0.08 to $2.04 per share; 2022 indicative annual common dividend growing by $0.12 to $2.16 per share Expect strong cash flow will enable funding PSEG’s 5-year capital spending program through 2025 without the need to issue new equity 2021 Financial Highlights


Slide 11

PSEG Q3 2021 Operating Company Review Dan Cregg EVP and Chief Financial Officer


Slide 12

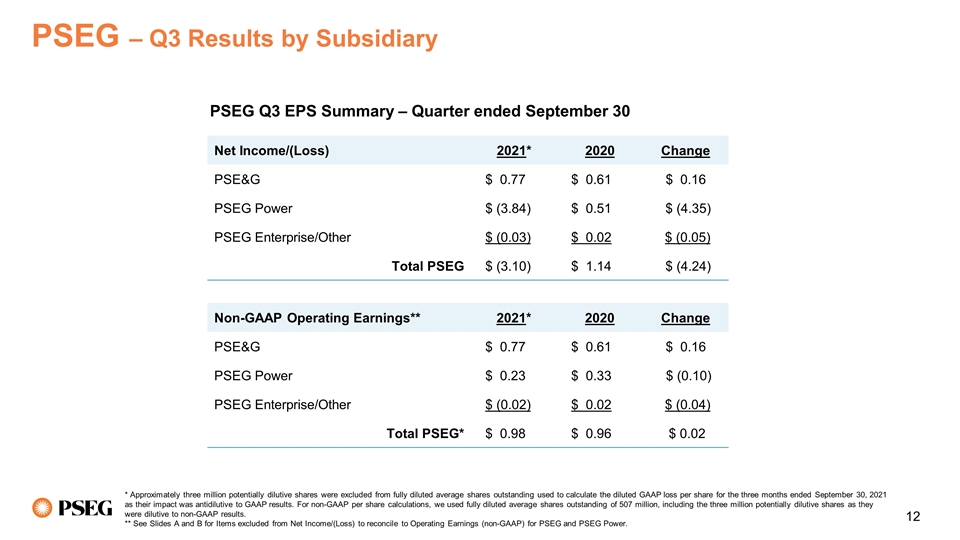
PSEG – Q3 Results by Subsidiary Net Income/(Loss) 2021* 2020 Change PSE&G $ 0.77 $ 0.61 $ 0.16 PSEG Power $ (3.84) $ 0.51 $ (4.35) PSEG Enterprise/Other $ (0.03) $ 0.02- $ (0.05) Total PSEG $ (3.10) $ 1.14 $ (4.24) Non-GAAP Operating Earnings** 2021* 2020 Change PSE&G $ 0.77 $ 0.61 $ 0.16 PSEG Power $ 0.23 $ 0.33 $ (0.10) PSEG Enterprise/Other $ (0.02) $ 0.02 $ (0.04) Total PSEG* $ 0.98 $ 0.96 $ 0.02 * Approximately three million potentially dilutive shares were excluded from fully diluted average shares outstanding used to calculate the diluted GAAP loss per share for the three months ended September 30, 2021 as their impact was antidilutive to GAAP results. For non-GAAP per share calculations, we used fully diluted average shares outstanding of 507 million, including the three million potentially dilutive shares as they were dilutive to non-GAAP results. ** See Slides A and B for Items excluded from Net Income/(Loss) to reconcile to Operating Earnings (non-GAAP) for PSEG and PSEG Power. PSEG Q3 EPS Summary – Quarter ended September 30


Slide 13

$ / share PSEG EPS Reconciliation – Q3 2021 versus Q3 2020 Capacity (0.01) Re-contracting & Market (0.11) Sale of Solar Source (0.02) Gas Operations (0.02) O&M (0.01) Depreciation & Interest 0.08 Taxes & Other (0.01) Transmission 0.01 Electric Margin 0.02 2020 Gas Weather Normalization Clause Reversal 0.04 Other Revenue 0.01 Distribution O&M 0.01 Distribution Depreciation (0.01) Distribution Non-Operating Pension/OPEB 0.02 Distribution Taxes 0.06 Higher Taxes and O&M Q3 2020 Net Income Q3 2020 Operating Earnings (non-GAAP)* Q3 2021 Net Loss** Q3 2021 Operating Earnings (non-GAAP)*,** PSE&G PSEG Power PSEG Enterprise / Other ($3.20) ~ ~ ($3.00) * See Slides A and B for Items excluded from Net Income/(Loss) to reconcile to Operating Earnings (non-GAAP) for PSEG and PSEG Power. ** Approximately three million potentially dilutive shares were excluded from fully diluted average shares outstanding used to calculate the diluted GAAP loss per share for the three months ended September 30, 2021 as their impact was antidilutive to GAAP results. For non-GAAP per share calculations, we used fully diluted average shares outstanding of 507 million, including the three million potentially dilutive shares as they were dilutive to non-GAAP results.


Slide 14

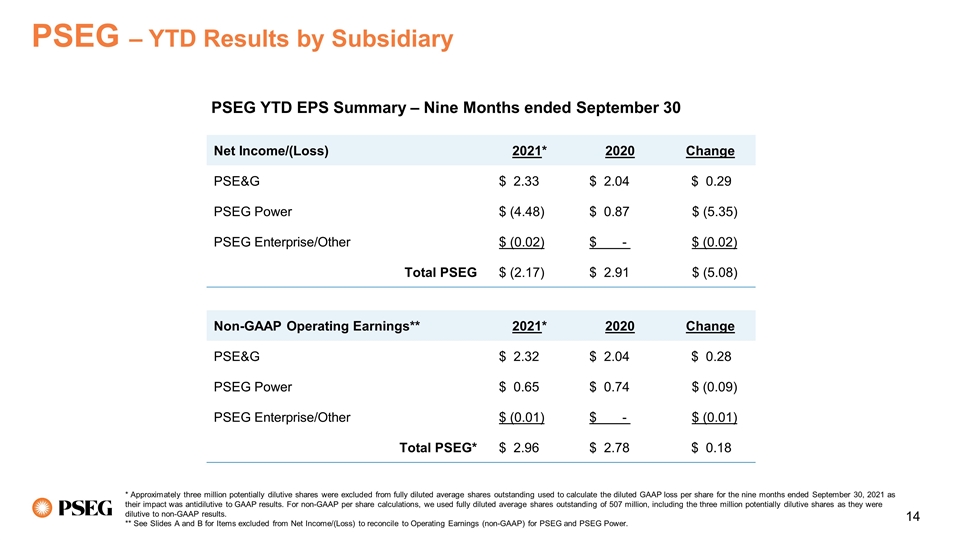
PSEG – YTD Results by Subsidiary Net Income/(Loss) 2021* 2020 Change PSE&G $ 2.33 $ 2.04 $ 0.29 PSEG Power $ (4.48) $ 0.87 $ (5.35) PSEG Enterprise/Other $ (0.02) $ - - $ (0.02) Total PSEG $ (2.17) $ 2.91 $ (5.08) Non-GAAP Operating Earnings** 2021* 2020 Change PSE&G $ 2.32 $ 2.04 $ 0.28 PSEG Power $ 0.65 $ 0.74 $ (0.09) PSEG Enterprise/Other $ (0.01) $ - - $ (0.01) Total PSEG* $ 2.96 $ 2.78 $ 0.18 PSEG YTD EPS Summary – Nine Months ended September 30 * Approximately three million potentially dilutive shares were excluded from fully diluted average shares outstanding used to calculate the diluted GAAP loss per share for the nine months ended September 30, 2021 as their impact was antidilutive to GAAP results. For non-GAAP per share calculations, we used fully diluted average shares outstanding of 507 million, including the three million potentially dilutive shares as they were dilutive to non-GAAP results. ** See Slides A and B for Items excluded from Net Income/(Loss) to reconcile to Operating Earnings (non-GAAP) for PSEG and PSEG Power.


Slide 15

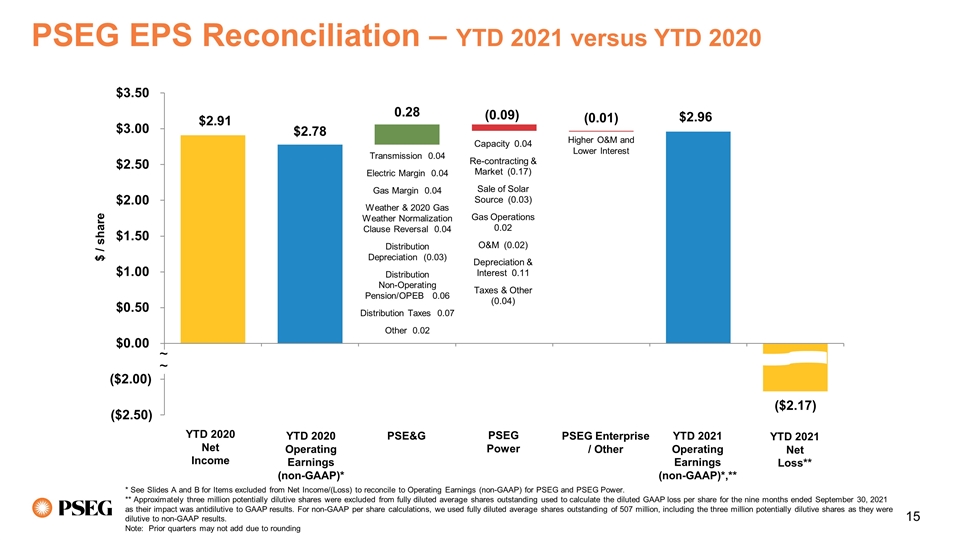
$ / share PSEG EPS Reconciliation – YTD 2021 versus YTD 2020 Capacity 0.04 Re-contracting & Market (0.17) Sale of Solar Source (0.03) Gas Operations 0.02 O&M (0.02) Depreciation & Interest 0.11 Taxes & Other (0.04) Transmission 0.04 Electric Margin 0.04 Gas Margin 0.04 Weather & 2020 Gas Weather Normalization Clause Reversal 0.04 Distribution Depreciation (0.03) Distribution Non-Operating Pension/OPEB 0.06 Distribution Taxes 0.07 Other 0.02 Higher O&M and Lower Interest ($2.50) ~ ~ ($2.00) YTD 2020 Net Income YTD 2020 Operating Earnings (non-GAAP)* YTD 2021 Net Loss** YTD 2021 Operating Earnings (non-GAAP)*,** PSE&G PSEG Power PSEG Enterprise / Other * See Slides A and B for Items excluded from Net Income/(Loss) to reconcile to Operating Earnings (non-GAAP) for PSEG and PSEG Power. ** Approximately three million potentially dilutive shares were excluded from fully diluted average shares outstanding used to calculate the diluted GAAP loss per share for the nine months ended September 30, 2021 as their impact was antidilutive to GAAP results. For non-GAAP per share calculations, we used fully diluted average shares outstanding of 507 million, including the three million potentially dilutive shares as they were dilutive to non-GAAP results. Note: Prior quarters may not add due to rounding


Slide 16

Public Service Electric & Gas Q3 2021 Review


Slide 17

$ / share PSE&G EPS Reconciliation – Q3 2021 versus Q3 2020 Distribution O&M 0.01 Distribution Depreciation (0.01) Distribution Non-Operating Pension/OPEB 0.02 Distribution Taxes 0.06 Transmission 0.01 Electric Margin 0.02 2020 Gas Weather Normalization Clause Reversal 0.04 Other 0.01 * Approximately three million potentially dilutive shares were excluded from fully diluted average shares outstanding used to calculate the diluted GAAP loss per share for the three months ended September 30, 2021 as their impact was antidilutive to GAAP results.


Slide 18

PSE&G – Q3 Weather Summary PSE&G Monthly Weather Summary Monthly Temperature Humidity Index – Q3 2021 vs. Q3 2020 vs. Normal Q3 2021 temperature humidity index was 4% warmer than Q3 2020 and 22% warmer than normal 2020 2021 normal Total Hours 90°F or Greater – YTD 2021 vs. YTD 2020 vs. Normal Q3 2021 hours with temperature greater than 90°F was 2% lower than Q3 2020 and 19% higher than normal YTD 2021 hours with temperature greater than 90°F was 64% higher than YTD 2020 and normal 2020 2021 normal


Slide 19

Infrastructure Advancement Program 4-year distribution investment program to improve reliability, reduce emissions and create jobs; to be filed with NJBPU Q4 2021 and expected to start mid-2022 Investment $ millions Components Last Mile - Reliability $206 Underground cable replacement, spacer cable, pole upgrades, open wire secondary, etc. to improve reliability Last Mile - Make-ready investments for EV infrastructure and DER penetration 91 Investments in secondary line upgrades and capacitor bank upgrades to support the aggressive electrification of the transportation sector and the penetration of distributed energy resources (DERs) (customer-sited solar) Inside Plant 277 Investment in a lifecycle program focused on modernization of 6 substations and aging 26kV oil-filled circuit breakers PSE&G facility EV infrastructure 134 Install ~2,000 EV chargers and associated infrastructure at 65 PSE&G locations to support PSE&G’s transition to an electric fleet Gas Metering and Regulating stations 140 Investment in a lifecycle program focused on modernization of 7 Metering and Regulating stations Program Total ~ $848 With long runway to address last mile reliability and continue lifecycle replacement for major equipment as well as job creation


Slide 20

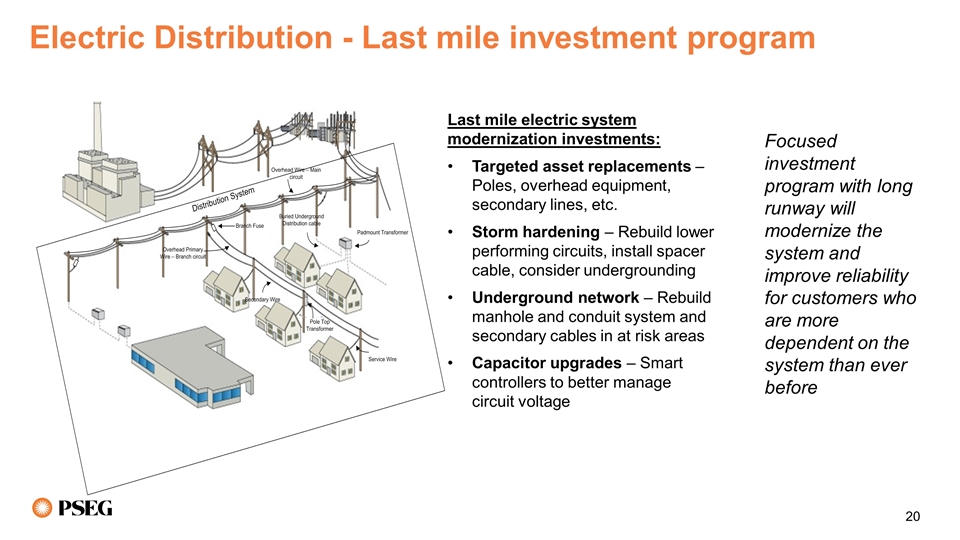
Electric Distribution - Last mile investment program Last mile electric system modernization investments: Targeted asset replacements – Poles, overhead equipment, secondary lines, etc. Storm hardening – Rebuild lower performing circuits, install spacer cable, consider undergrounding Underground network – Rebuild manhole and conduit system and secondary cables in at risk areas Capacitor upgrades – Smart controllers to better manage circuit voltage Focused investment program with long runway will modernize the system and improve reliability for customers who are more dependent on the system than ever before


Slide 21

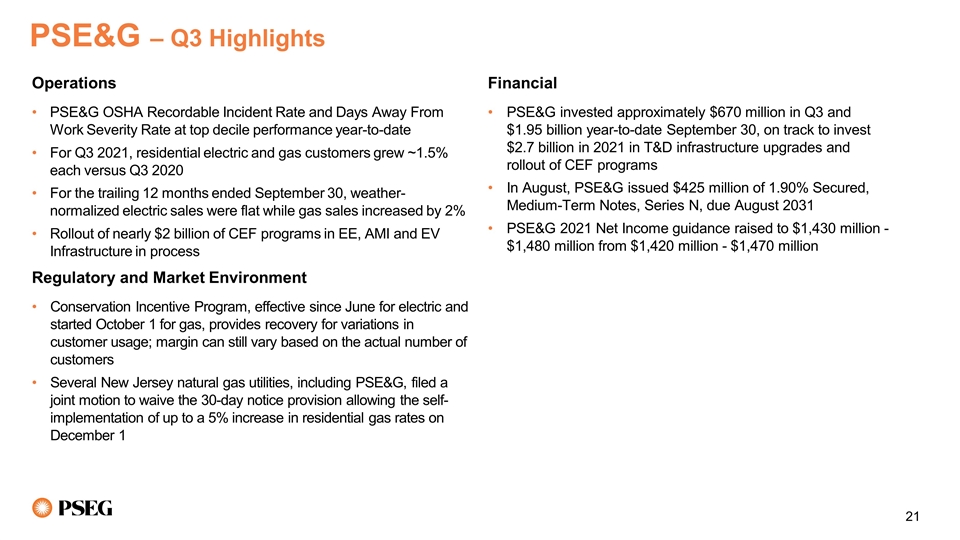
PSE&G – Q3 Highlights Operations PSE&G OSHA Recordable Incident Rate and Days Away From Work Severity Rate at top decile performance year-to-date For Q3 2021, residential electric and gas customers grew ~1.5% each versus Q3 2020 For the trailing 12 months ended September 30, weather-normalized electric sales were flat while gas sales increased by 2% Rollout of nearly $2 billion of CEF programs in EE, AMI and EV Infrastructure in process Regulatory and Market Environment Conservation Incentive Program, effective since June for electric and started October 1 for gas, provides recovery for variations in customer usage; margin can still vary based on the actual number of customers Several New Jersey natural gas utilities, including PSE&G, filed a joint motion to waive the 30-day notice provision allowing the self-implementation of up to a 5% increase in residential gas rates on December 1 Financial PSE&G invested approximately $670 million in Q3 and $1.95 billion year-to-date September 30, on track to invest $2.7 billion in 2021 in T&D infrastructure upgrades and rollout of CEF programs In August, PSE&G issued $425 million of 1.90% Secured, Medium-Term Notes, Series N, due August 2031 PSE&G 2021 Net Income guidance raised to $1,430 million - $1,480 million from $1,420 million - $1,470 million


Slide 22

PSEG Power Q3 2021 Review


Slide 23

PSEG Power EPS Reconciliation – Q3 2021 versus Q3 2020 Q3 2020 Net Income Q3 2020 Operating Earnings (non-GAAP)* Q3 2021 Net Loss** Q3 2021 Operating Earnings (non-GAAP)*,** Capacity (0.01) Re-contracting & Market (0.11) Sale of Solar Source (0.02) Gas Operations (0.02) O&M (0.01) Depreciation & Interest 0.08 Taxes & Other (0.01) $ / share ($3.85) $0.50 $0.55 ~ ~ ($3.80) * See Slide B for Items excluded from Net Income /(Loss) to reconcile to Operating Earnings (non-GAAP). ** Approximately three million potentially dilutive shares were excluded from fully diluted average shares outstanding used to calculate the diluted GAAP loss per share for the three months ended September 30, 2021 as their impact was antidilutive to GAAP results. For non-GAAP per share calculations, we used fully diluted average shares outstanding of 507 million, including the three million potentially dilutive shares as they were dilutive to non-GAAP results. ~ ~


Slide 24

PSEG Power – Q3 & YTD Generation Measures * Indicates Period Net Generation. Excludes Solar and Kalaeloa. ** Excludes peaking and steam generation. PSEG Power – YTD Generation (GWh)* PSEG Power – Capacity Factors (%)* Quarter ended September 30 Nine Months ended September 30 2020 2021 ($ millions) 2020 2021 $ 115 $ 138 Fossil $ 310 $ 401 $ 50 $ 49 Nuclear $ 144 $ 143 $ 165 $ 187 Total Fuel Cost $ 454 $ 544 14,903 14,867 Total GWh* Generation 40,819 40,760 11.07 12.58 $ / MWh 11.12 13.35 PSEG Power – Fuel Costs* Quarter ended September 30 Nine Months ended September 30 2020 2021 2020 2021 58.4% 58.7% Combined Cycle** 49.0% 49.0% 95.7% 94.8% Nuclear 94.2% 93.0% 40,819 40,760 Q3 Generation (GWh)* 6,716 6,765 8,187 8,102 Total Nuclear Total Fossil


Slide 25

PSEG Power – Gross Margin Performance and Hedging Update Regional Performance Region Q3 Gross Margin ($M) Q3 2021 Performance PJM $373 Re-contracting at lower market prices and higher cost to serve load New England $26 Lower capacity revenues related to Bridgeport Harbor Unit 3 retirement, re-contracting at lower market prices and higher cost to serve load New York $16 Re-contracting at lower market prices and higher cost to serve load PSEG Power Gross Margin ($/MWh) Quarter ended September 30 * Numbers reflect management’s view of hedge percentages and prices as of September 30, 2021. Prices for 2021, 2022 and 2023 reflect revenues of full requirement load deals based on contract price including renewable energy credits, ancillary and transmission components, but excluding capacity. Prices for 2024 reflect energy revenues only. Hedge includes positions with MTM accounting treatment and options. Contracted Energy* Oct – Dec 2021 2022 2023 2024 Fuel Nuclear and Fossil Nuclear Nuclear Nuclear Volume TWh 12-14 31 31 30 % Hedged 85-90% > 90% 75-80% 35-40% Price $/MWh $32 $29 $28 $29


Slide 26

PSEG Power – Q3 Highlights Operations Q3 2021 output flat compared to Q3 2020 Nuclear fleet achieved a capacity factor of 94.8% in Q3 2021 CCGT fleet capacity factor was 58.7% in Q3 2021 Regulatory and Market Environment PJM stakeholders, including the NJBPU, will consider incorporation of environmental attributes into future capacity market design, which may include the development of a clean capacity market construct Next PJM capacity auction (2023/2024) delayed to January 25, 2022 Sale of Fossil fleet expected to close in late Q4 2021 or early Q1 2022 Financial Total debt as a percentage of capitalization was 26% at September 30 Redeemed remaining $1.4 billion of Senior Notes on October 8 PSEG Power’s 2021 guidance for non-GAAP Operating Earnings raised to $365 million - $440 million from $350 million - $425 million Non-GAAP Adjusted EBITDA guidance has been raised to $870 million - $970 million, from $850 million - $950 million


Slide 27

APPENDIX


Slide 28

PSEG – Raising Full Year 2021 Guidance $ millions (except EPS) 2021E 2020 PSE&G (Net Income) $1,430 - $1,480 $1,327 PSEG Power $365 - $440 $430 PSEG Enterprise/Other ($20) ($16) Operating Earnings (non-GAAP)* $1,800 - $1,875 $1,741 Operating EPS (non-GAAP)* $3.55 - $3.70** $3.43 Segment Operating Earnings Guidance and Prior Year Results (non-GAAP, except as noted)* $ millions (except EPS) 2021E 2020 PSEG Power $870 - $970 $990 PSEG Power Adjusted EBITDA (non-GAAP) *,*** Note: The total of subsidiary guidance ranges are wider than the consolidated band to allow for variability by business, as they are often offset in consolidated results. E=Estimate. * See Slide A for Items excluded from Net Income/(Loss) to reconcile to Operating Earnings (non-GAAP) for PSEG and Slide B for Items excluded from Net Income/(Loss) to reconcile to Operating Earnings (non-GAAP) and Adjusted EBITDA (non-GAAP) for PSEG Power. ** Includes ~$0.10 per share of cessation of depreciation expense following Fossil assets move to assets held for sale in August. *** Adjusted non-GAAP EBITDA for the full year 2020 includes pre-tax expenses of $36 million related to the purchase of NJ tax credits as part of the 2019 NJ Technology Tax Benefit Transfer Program. The benefit from the program’s tax credits is included in the income tax expense line item and more than offsets the expenses incurred for the purchase.


Slide 29

PSEG maintains a solid financial position PSEG Senior Unsecured Credit Ratings Moody’s = Baa2 / Outlook = Stable S&P = BBB / Outlook = Stable PSEG Senior Notes Outstanding as of 9/30/2021 Sr. Notes due November 2021 $300M Sr. Notes due November 2022 $700M Sr. Notes due June 2024 $750M Sr. Notes due August 2025 $550M Sr. Notes due August 2030 $550M Sr. Notes due April 2031 $96M Total Long-term Debt Outstanding as of 9/30/2021 $2.9B PSEG Consolidated Debt to Capitalization 58% * Remaining PSEG Power Senior Notes totaling $1.4 billion were redeemed October 8, 2021. Note: Credit Ratings are as of November 2, 2021; Total Long-Term Debt Outstanding amounts may not add to PSEG Consolidated Total Long-Term Debt Outstanding due to rounding Public Service Electric & Gas Senior Secured Credit Ratings Moody’s = A1 / Outlook = Stable S&P = A / Outlook = Stable 2021 PSE&G Debt Issuances as of 9/30/2021 Secured 0.95% Medium Term Notes due March 2026 $450M Secured 3.00% Medium Term Notes due March 2051 $450M Secured 1.90% Medium Term Notes due August 2031 $425M Total Long-term Debt Outstanding as of 9/30/2021 $11.8B PSEG Power Issuer Credit Ratings Moody’s = Baa2 / Outlook = Stable S&P = BBB / Outlook = Stable PSEG Power Senior Notes Outstanding as of 9/30/2021* Sr. Notes due June 2023 $700M Sr. Notes due November 2023 $250M Sr. Notes due April 2031 $404M Total Long-term Debt Outstanding as of 9/30/2021 $1.4B* PSEG Power Consolidated Debt to Capitalization 26% PSEG had approximately $3B of available liquidity at 9/30 PSEG Power had net cash collateral postings of $999M at 9/30 related to out-of-the-money hedge positions resulting from higher energy prices during the third quarter of 2021 PSEG Liquidity and Net Cash Collateral Postings


Slide 30

Reconciliation of Non-GAAP Operating Earnings Please see Slide 3 for an explanation of PSEG’s use of Operating Earnings as a non-GAAP financial measure and how it differs from Net Income/(Loss). Effective January 1, 2018, unrealized gains (losses) on equity securities are recorded in Net Income / (Loss) instead of Other Comprehensive Income (Loss). Includes the financial impact from positions with forward delivery months. Income tax effect calculated at 28.11% statutory rate for 2021, 2020, 2019 and 2018 and 40.85% statutory rate for 2017, except for qualified NDT related activity, which records an additional 20% trust tax on income (loss) from qualified NDT Funds, the additional investment tax credit (ITC) recapture related to the sale of PSEG Solar Source, and leveraged lease related activity, which is calculated at a combined leveraged lease effective tax rate. Approximately three million potentially dilutive shares were excluded from fully diluted average shares outstanding used to calculate the diluted GAAP loss per share for the three months and nine months ended September 30, 2021 as their impact was antidilutive to GAAP results. For non-GAAP per share calculations, we used fully diluted average shares outstanding of 507 million, including the three million potentially dilutive shares as they were dilutive to non-GAAP results. As a result of the use of different denominators for non-GAAP Operating Earnings and GAAP Net Loss, a reconciling line item, “Share Differential,” has been added to the year to date results to reconcile the two EPS calculations. A 2021 2020 2021 2020 2020 2019 2018 2017 Net Income (Loss) (1,564) $ 575 $ (1,093) $ 1,474 $ 1,905 $ 1,693 $ 1,438 $ 1,574 $ (Gain) Loss on Nuclear Decommissioning Trust (NDT) Fund Related Activity, pre-tax (a) (PSEG Power) 17 (100) (116) (73) (231) (255) 144 (133) (Gain) Loss on Mark-to-Market (MTM), pre-tax (b) (PSEG Power) 666 82 998 82 81 (285) 117 167 Plant Retirements, Dispositions and Impairments, pre-tax (PSEG Power) 2,175 (122) 2,632 (122) (122) 402 (51) 975 Oil Lower of Cost or Market (LOCOM) adjustment, pre-tax (PSEG Power) - - - 11 2 - - - Goodwill Impairment, pre-tax (PSEG Power) - - - - - 16 - - Lease Related Activity, pre-tax (PSEG Enterprise/Other) 10 - 10 - - 58 8 77 Income Taxes related to Operating Earnings (non-GAAP) reconciling items, excluding Tax Reform (c) (809) 53 (930) 40 106 37 (74) (427) Tax Reform - - - - - - - (745) Operating Earnings (non-GAAP) 495 $ 488 $ 1,501 $ 1,412 $ 1,741 $ 1,666 $ 1,582 $ 1,488 $ PSEG Fully Diluted Average Shares Outstanding (in millions) (d) 504 507 504 507 507 507 507 507 Net Income (Loss) (3.10) $ 1.14 $ (2.17) $ 2.91 $ 3.76 $ 3.33 $ 2.83 $ 3.10 $ (Gain) Loss on NDT Fund Related Activity, pre-tax (a) (PSEG Power) 0.03 (0.20) (0.23) (0.15) (0.46) (0.50) 0.28 (0.26) (Gain) Loss on MTM, pre-tax (b) (PSEG Power) 1.32 0.16 1.98 0.16 0.16 (0.56) 0.23 0.33 Plant Retirements, Dispositions and Impairments, pre-tax (PSEG Power) 4.31 (0.24) 5.22 (0.24) (0.24) 0.79 (0.10) 1.92 Oil LOCOM adjustment, pre-tax (PSEG Power) - - - 0.02 - - - - Goodwill Impairment, pre-tax (PSEG Power) - - - - - 0.03 - - Lease Related Activity, pre-tax (PSEG Enterprise/Other) 0.02 - 0.02 - - 0.11 0.02 0.15 Income Taxes related to Operating Earnings (non-GAAP) reconciling items, excluding Tax Reform (c) (1.60) 0.10 (1.84) 0.08 0.21 0.08 (0.14) (0.84) Tax Reform - - - - - - - (1.47) Share Differential (d) - - (0.02) - - - - - Operating Earnings (non-GAAP) 0.98 $ 0.96 $ 2.96 $ 2.78 $ 3.43 $ 3.28 $ 3.12 $ 2.93 $ Public Service Enterprise Group Incorporated - Consolidated Operating Earnings (non-GAAP) Reconciliation Reconciling Items Year Ended December 31, September 30, ($ millions, Unaudited) ($ Per Share Impact - Diluted, Unaudited) Three Months Ended Nine Months Ended September 30,


Slide 31

Reconciliation of Non-GAAP Operating Earnings and Non-GAAP Adjusted EBITDA Please see Slide 3 for an explanation of PSEG’s use of Operating Earnings and Adjusted EBITDA as non-GAAP financial measures and how they differ from Net Income/(Loss). Includes the financial impact from positions with forward delivery months. Income tax effect calculated at statutory rate, except for NDT related activity, which records an additional trust tax of 20%, and the additional ITC recapture related to the sale of PSEG Solar Source. Excludes amounts related to Operating Earnings (non-GAAP) reconciling items. Net of capitalized interest. Approximately three million potentially dilutive shares were excluded from fully diluted average shares outstanding used to calculate the diluted GAAP loss per share for the three months and nine months ended September 30, 2021 as their impact was antidilutive to GAAP results. For non-GAAP per share calculations, we used fully diluted average shares outstanding of 507 million, including the three million potentially dilutive shares as they were dilutive to non-GAAP results. B Income tax effect calculated at a combined leveraged lease effective tax rate. Approximately three million potentially dilutive shares were excluded from fully diluted average shares outstanding used to calculate the diluted GAAP loss per share for the three months and nine months ended September 30, 2021 as their impact was antidilutive to GAAP results. For non-GAAP per share calculations, we used fully diluted average shares outstanding of 507 million, including the three million potentially dilutive shares as they were dilutive to non-GAAP results. Three Months Ended Nine Months Ended 2021 2020 2021 2020 2020 Net Income (Loss) (1,933) $ 254 $ (2,255) $ 437 $ 594 $ (Gain) Loss on NDT Fund Related Activity, pre-tax 17 (100) (116) (73) (231) (Gain) Loss on MTM, pre-tax (a) 666 82 998 82 81 Plant Retirements, Dispositions and Impairments, pre-tax 2,175 (122) 2,632 (122) (122) Oil LOCOM adjustment, pre-tax - - - 11 2 Income Taxes related to Operating Earnings (non-GAAP) reconciling items (b) (806) 53 (927) 40 106 Operating Earnings (non-GAAP) 119 $ 167 $ 332 $ 375 $ 430 $ Depreciation and Amortization, pre-tax (c) 47 89 218 271 360 Interest Expense, pre-tax (c) (d) 18 28 68 90 118 Income Taxes (c) 53 65 99 72 82 Adjusted EBITDA (non-GAAP) 237 $ 349 $ 717 $ 808 $ 990 $ PSEG Fully Diluted Average Shares Outstanding (in millions) (e) 504 507 504 507 507 ($ millions, Unaudited) PSEG Power LLC - Operating Earnings (non-GAAP) and Adjusted EBITDA (non-GAAP) Reconciliation September 30, Reconciling Items Year Ended September 30, December 31, Three Months Ended Nine Months Ended 2021 2020 2021 2020 2020 Net Income (Loss) (20) $ 8 $ (13) $ 1 $ (16) $ Lease Related Activity, pre-tax 10 - 10 - - Income Taxes related to Lease Related Activity (a) (3) - (3) - - Operating Earnings (non-GAAP) (13) $ 8 $ (6) $ 1 $ (16) $ PSEG Fully Diluted Average Shares Outstanding (in millions) (b) 504 507 504 507 507 ($ millions, Unaudited) PSEG Enterprise/Other - Operating Earnings (non-GAAP) Reconciliation Reconciling Items Year Ended September 30, September 30, December 31,


Slide 32