Exhibit 99.1

PennyMac Financial Services, Inc. Reports
Fourth Quarter and Full-Year 2025 Results
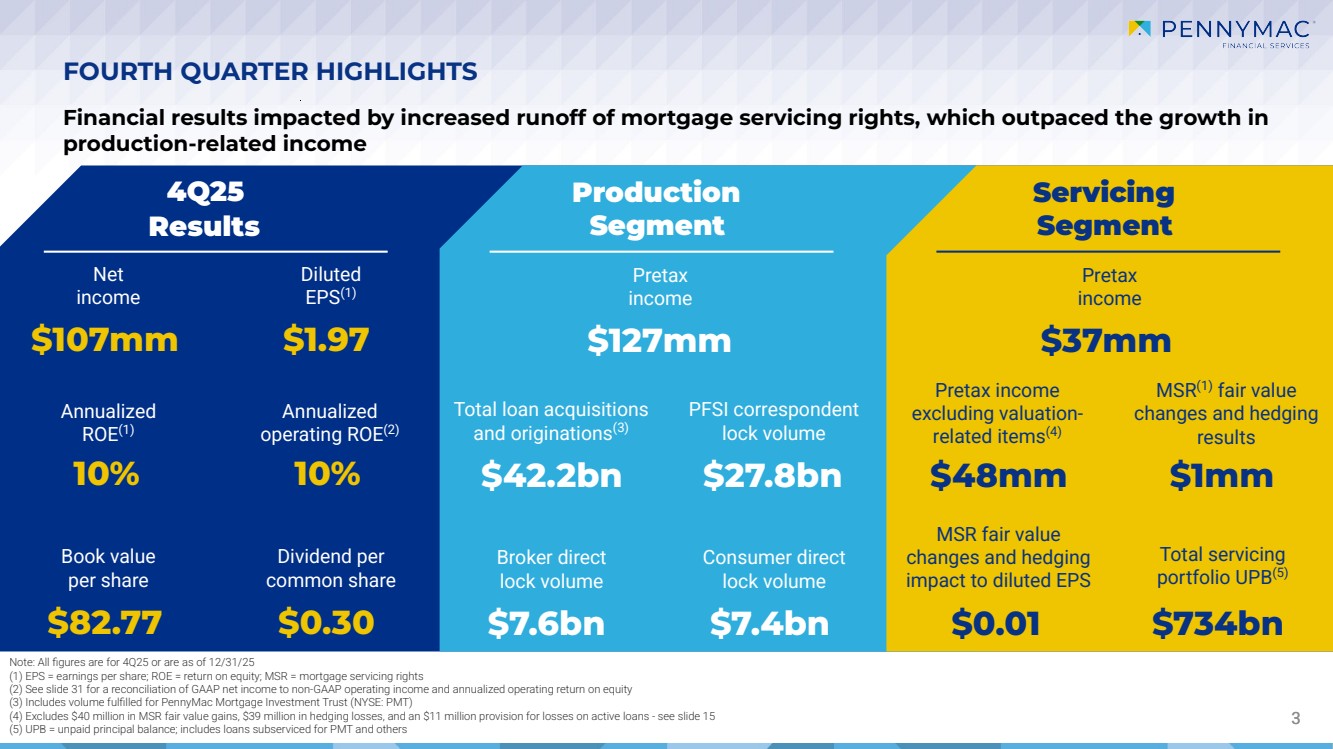
WESTLAKE VILLAGE, Calif. – January 29, 2026 – PennyMac Financial Services, Inc. (NYSE: PFSI) today reported net income of $106.8 million for the fourth quarter of 2025, or $1.97 per share on a diluted basis, on total net revenues of $538.0 million. Book value per share increased to $82.77 from $81.12 at September 30, 2025.
PFSI’s Board of Directors declared a fourth quarter cash dividend of $0.30 per share, payable on February 26, 2026, to common stockholders of record as of February 16, 2026.
Fourth Quarter 2025 Highlights
| · | Pretax income was $134.4 million, down from $236.4 million in the prior quarter and up from $129.4 million in the fourth quarter of 2024 |
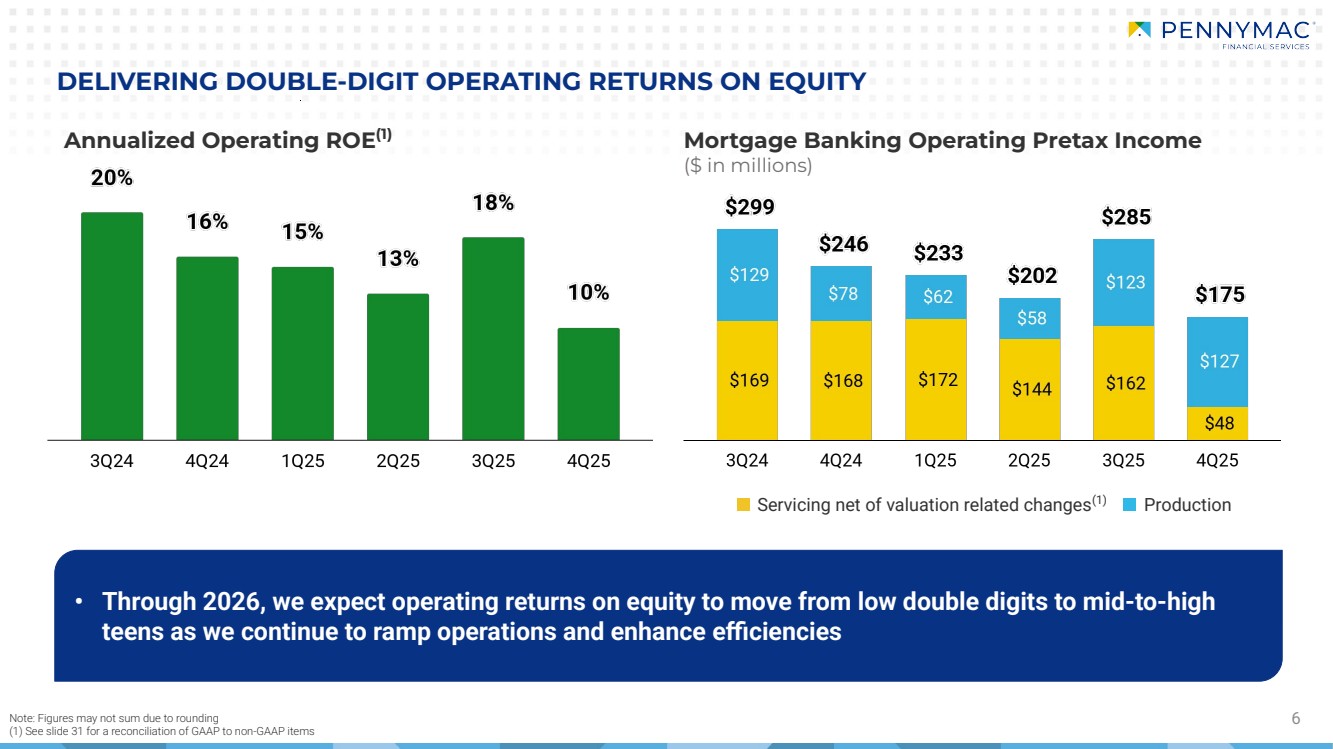
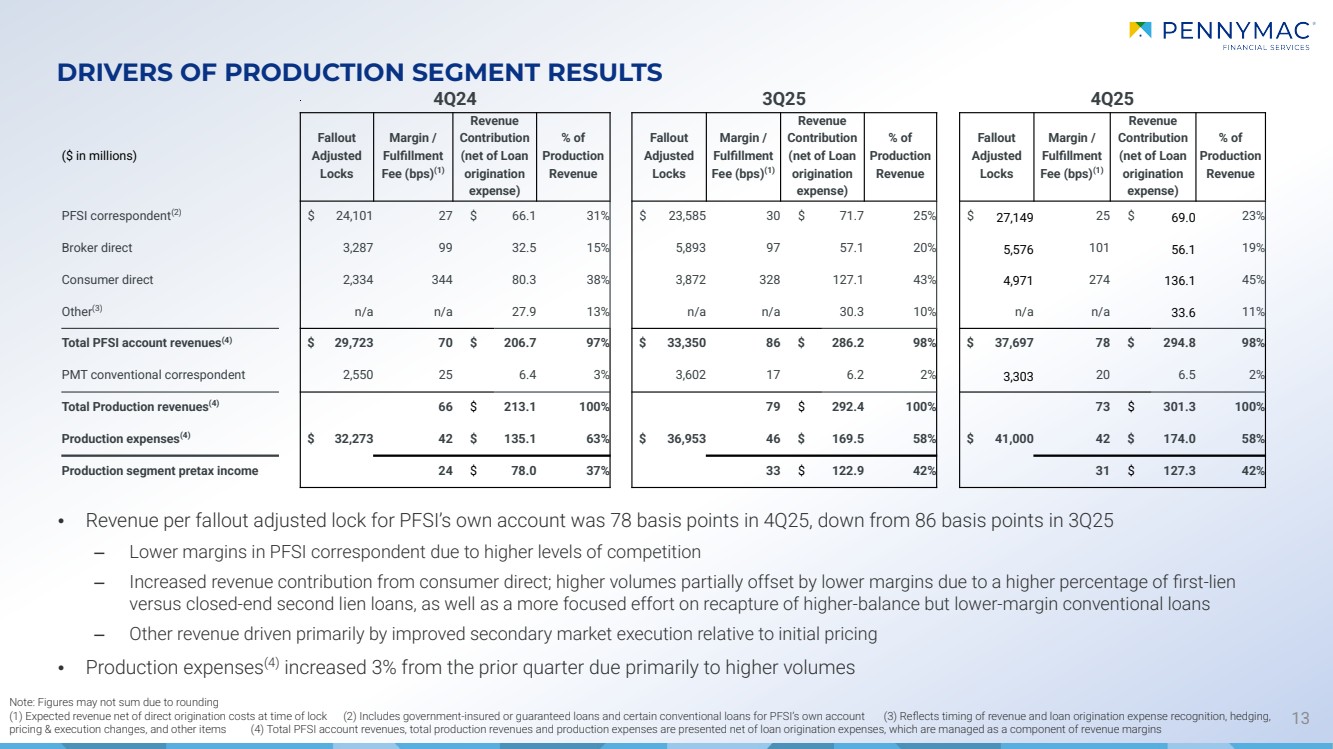
| · | Production segment pretax income was $127.3 million, up from $122.9 million in the prior quarter and $78.0 million in the fourth quarter of 2024 |
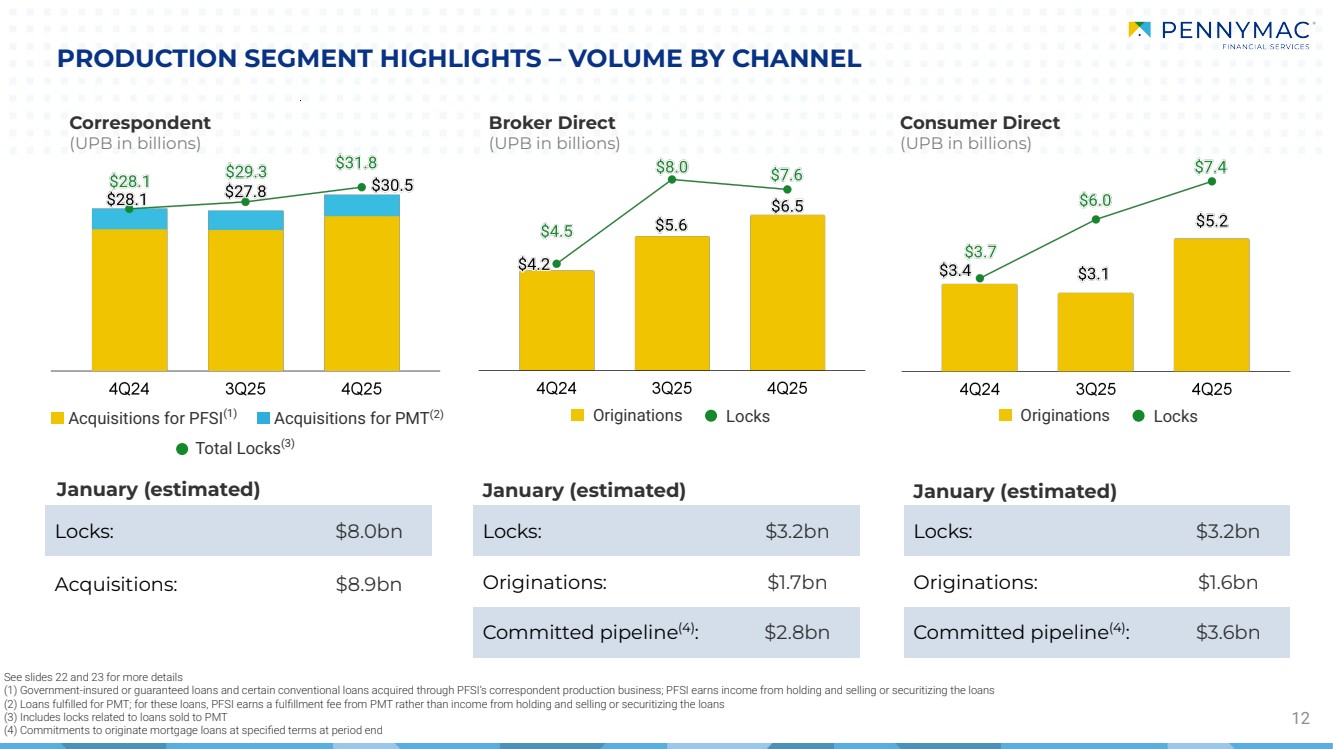
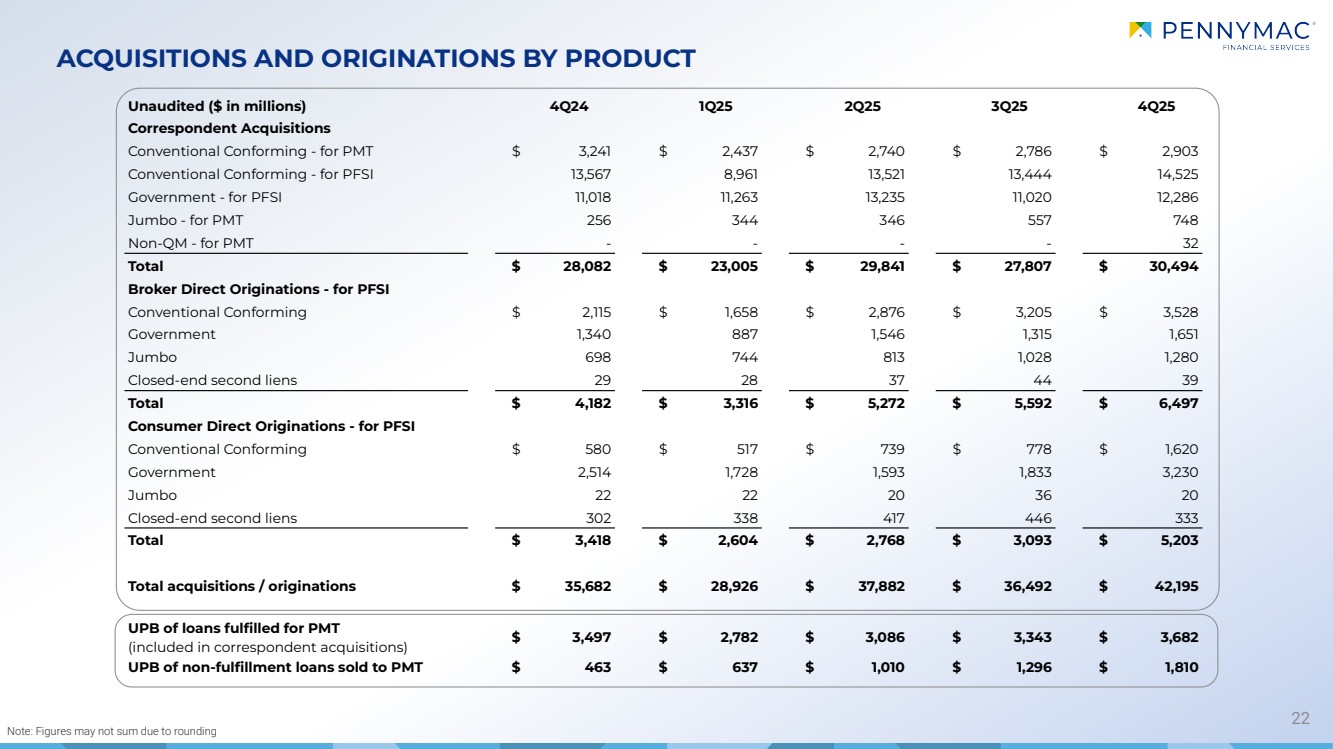
| o | Total loan acquisitions and originations, including those fulfilled for PennyMac Mortgage Investment Trust (NYSE: PMT), were $42.2 billion in unpaid principal balance (UPB), up 16 percent from the prior quarter and 18 percent from the fourth quarter of 2024 |
| – | Correspondent acquisitions of conventional conforming and non-Agency eligible loans fulfilled for PMT were $3.7 billion in UPB, up 10 percent from the prior quarter and 5 percent from the fourth quarter of 2024 |
| – | PMT purchased 17 percent of total conventional conforming correspondent loan volume and 100 percent of total non-Agency eligible correspondent loan volume from PFSI through their fulfillment agreement in the fourth quarter, both percentages unchanged from the prior quarter |
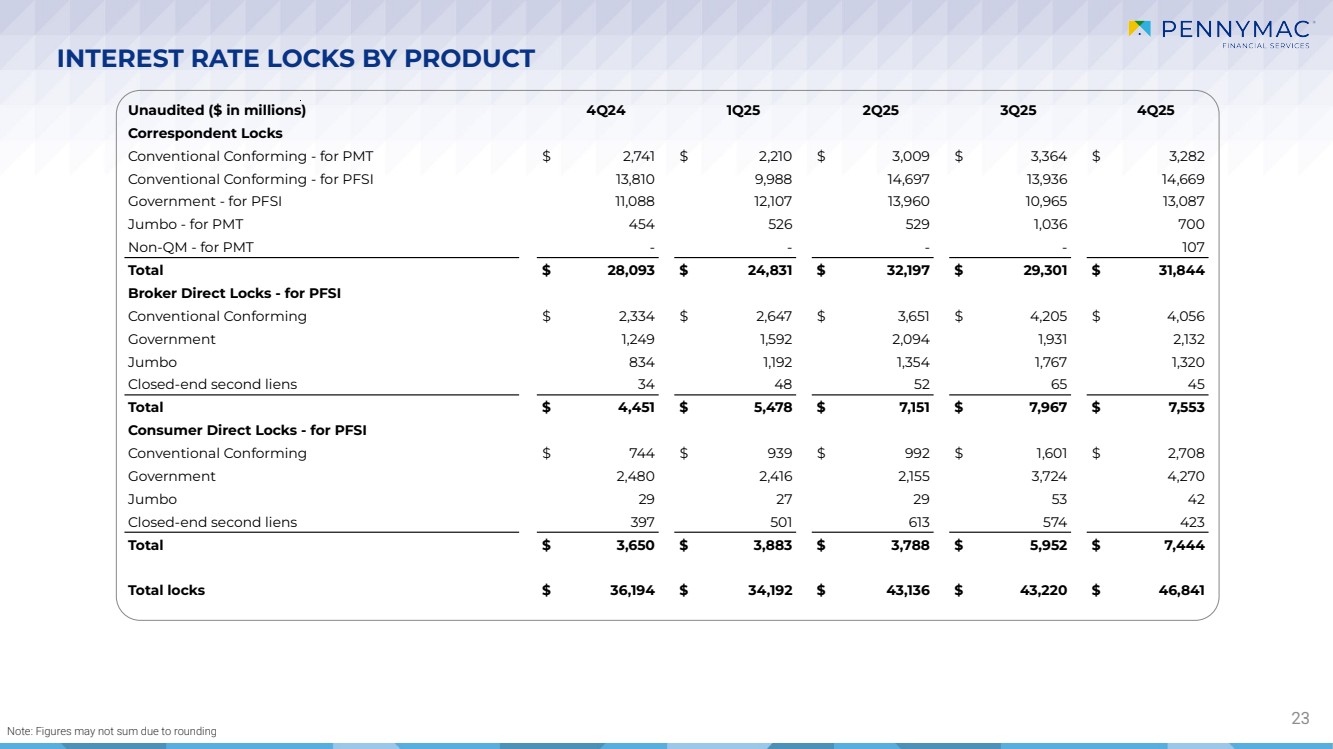
| o | Total locks, including those for PMT, were $46.8 billion in UPB, up 8 percent from the prior quarter and 29 percent from the fourth quarter of 2024 |
| – | Correspondent lock volume for PMT’s account was $4.1 billion in UPB, down 7 percent from the prior quarter and up 28 percent from the fourth quarter of 2024 |
| · | Servicing segment pretax income was $37.3 million, down from $157.4 million in the prior quarter and $87.3 million in the fourth quarter of 2024 |
1
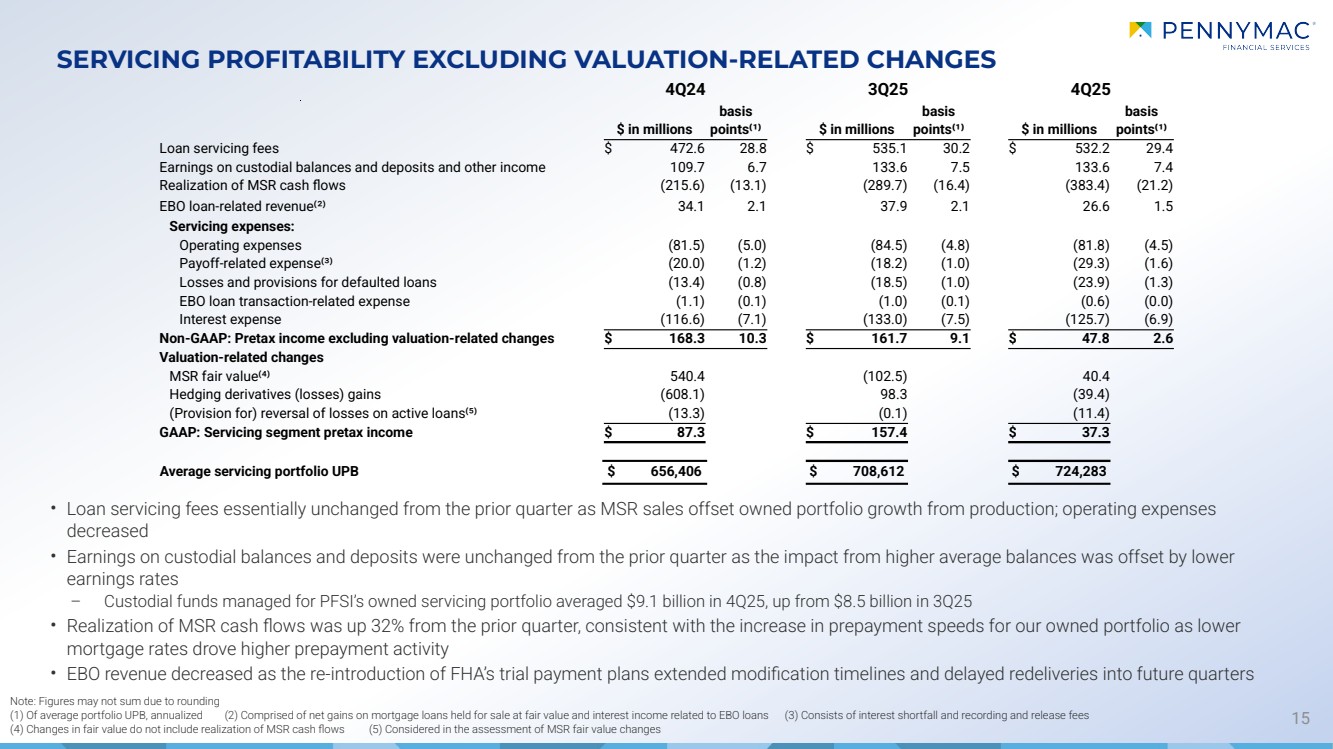
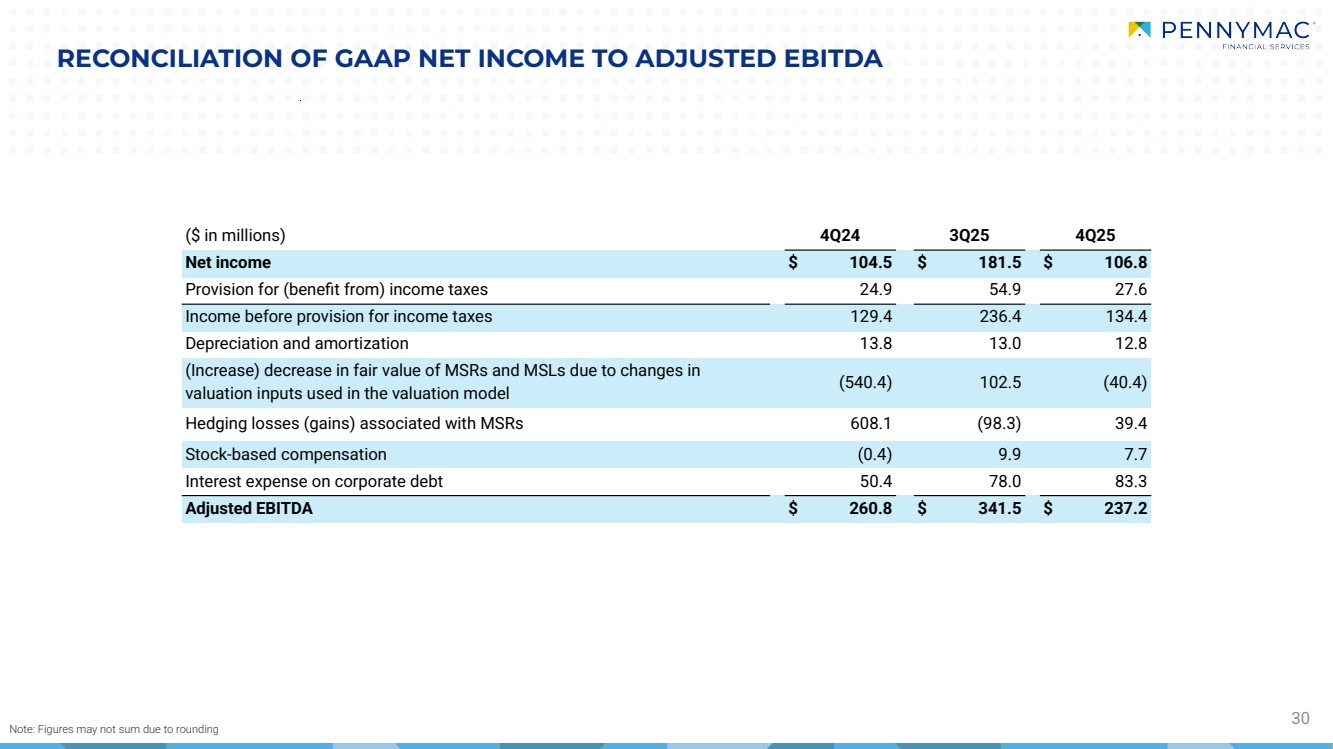
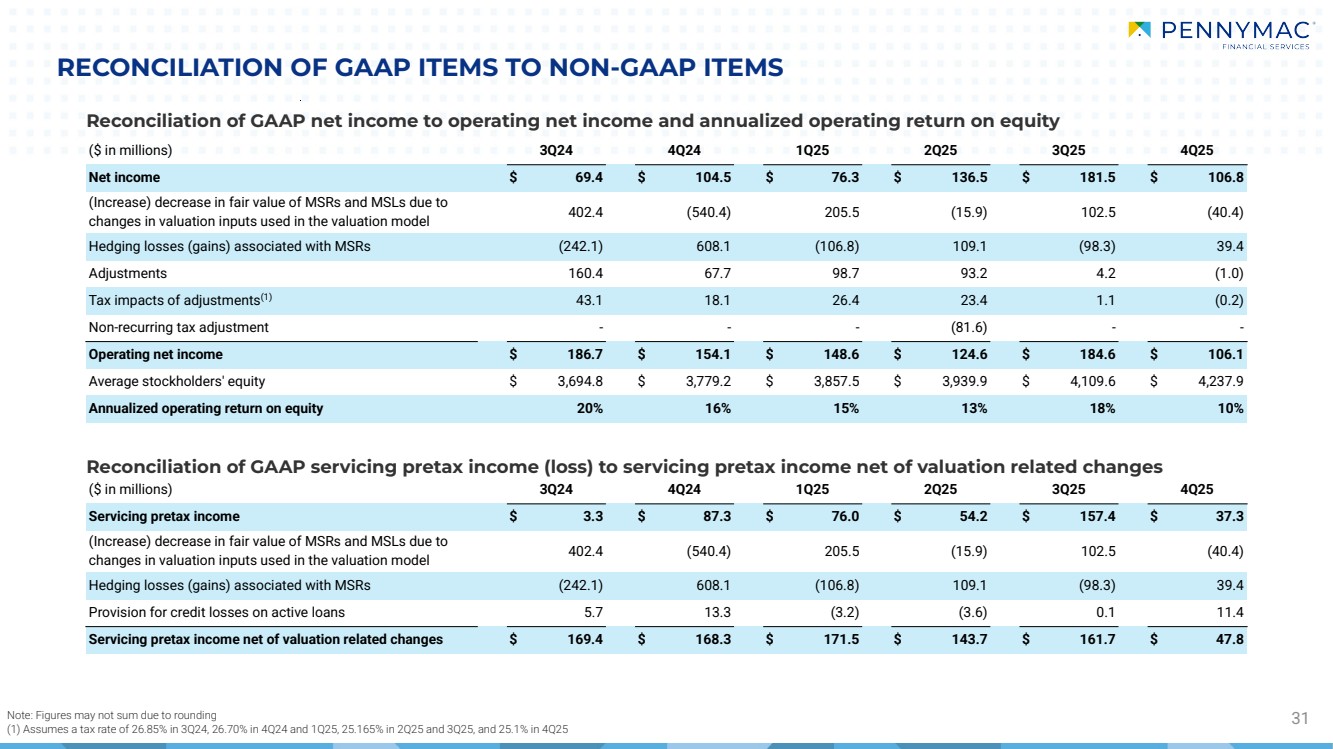
| o | Pretax income excluding valuation-related items was $47.8 million, down 70 percent from the prior quarter driven primarily by increased realization of mortgage servicing rights (MSR) cash flows as lower mortgage rates drove higher prepayment activity |
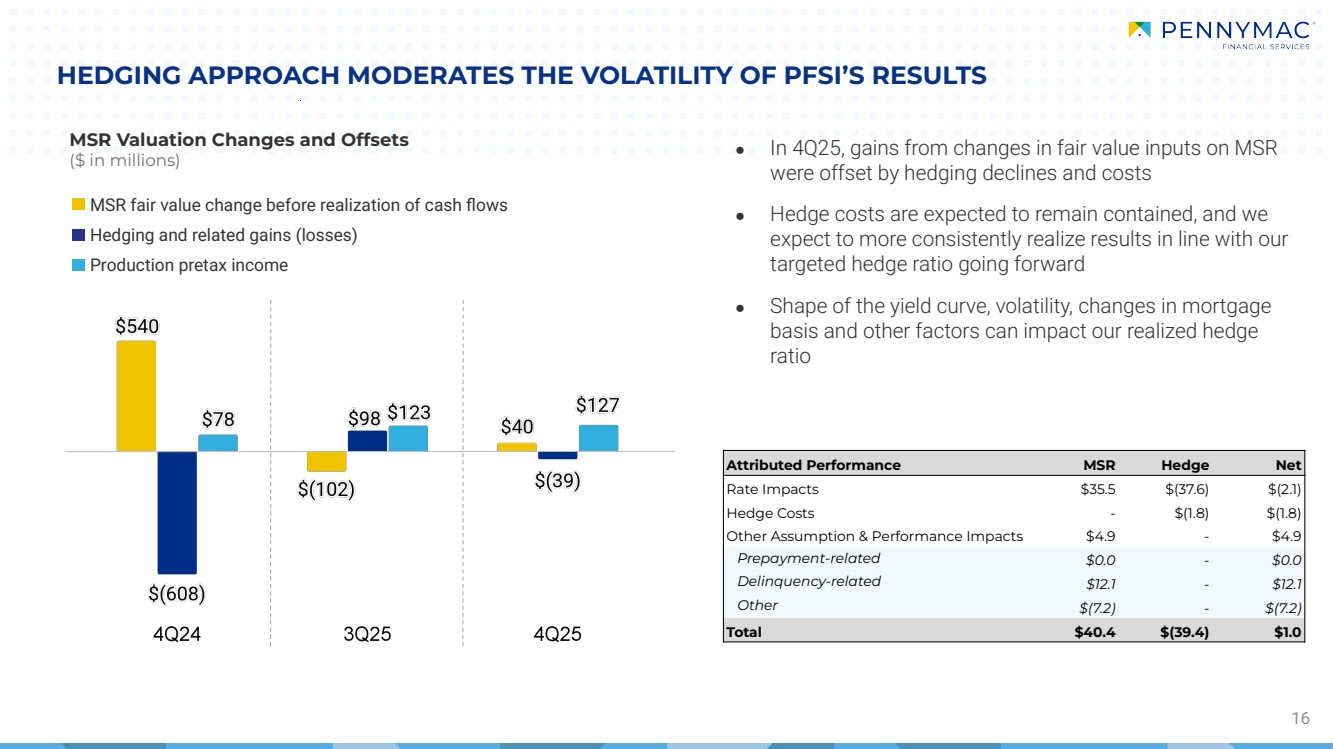
| o | Valuation-related items included: |
| – | $40.4 million in MSR fair value gains and $39.4 million in hedging losses |
| · | Net impact on pretax income related to these items was $1.0 million or $0.01 in diluted earnings per share |
| – | $11.4 million provision for losses on active loans |
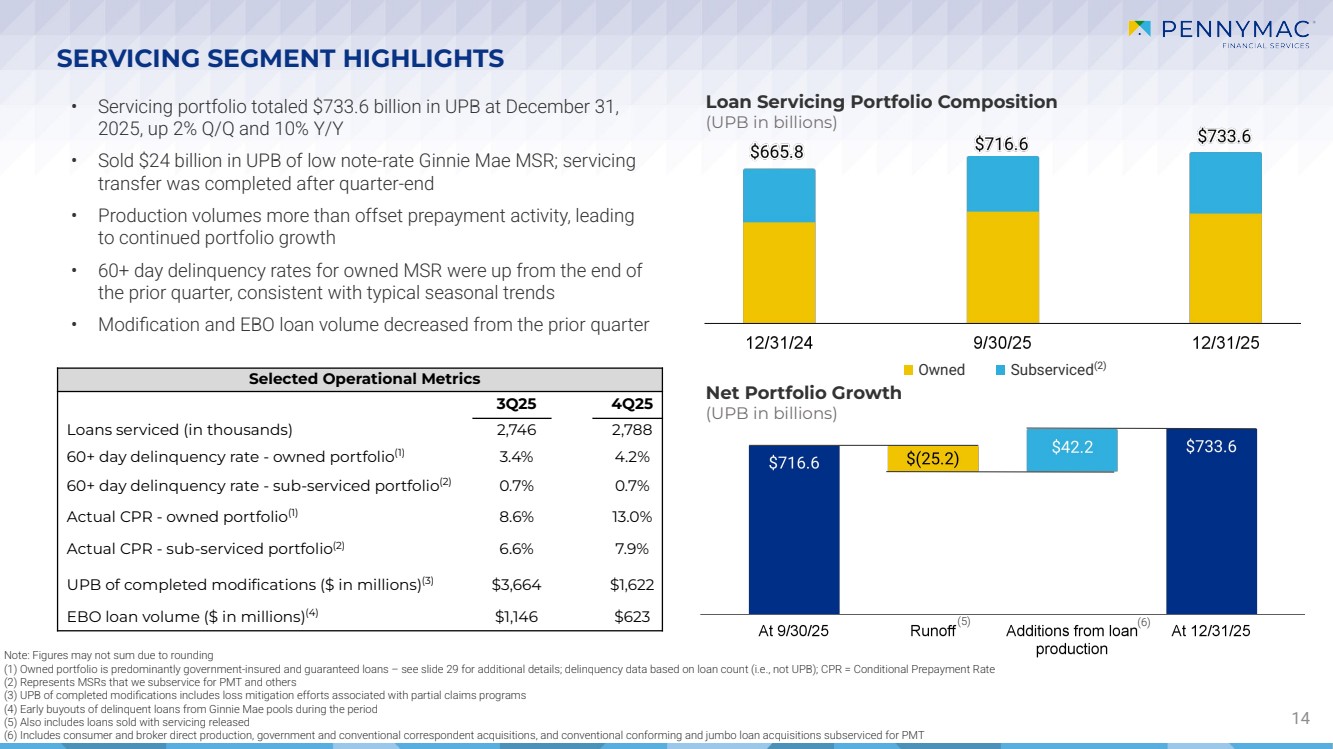
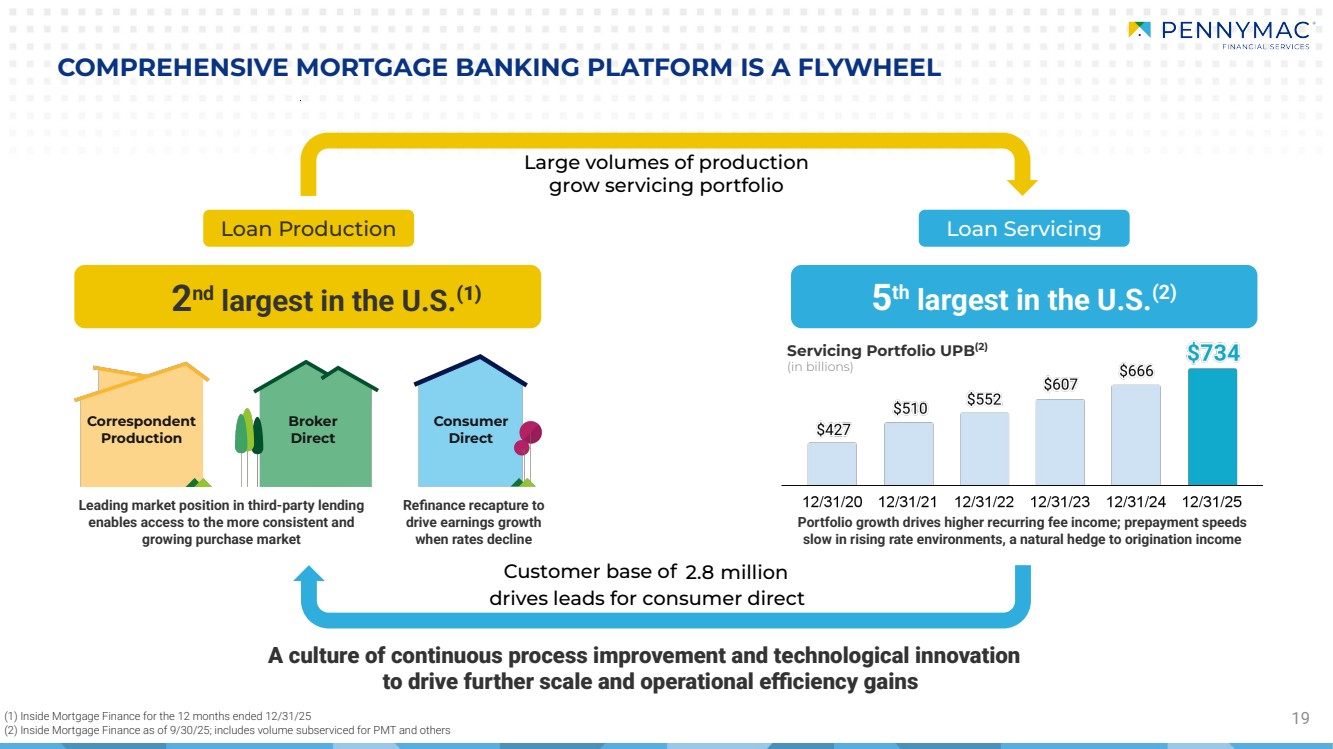
| o | Servicing portfolio grew to $733.6 billion in UPB, up 2 percent from September 30, 2025 and 10 percent from December 31, 2024, driven by production volumes which more than offset prepayment activity |
| o | Completed the sale of an MSR portfolio totaling $24.4 billion in UPB; PFSI subserviced the portfolio on an interim basis through December 31, 2025 and the servicing transfer was completed in early January 2026 |
| · | Pretax loss from Corporate and Other was $30.2 million, down from $43.9 million in the prior quarter and $35.9 million in the fourth quarter of 2024 |
Full-Year 2025 Highlights
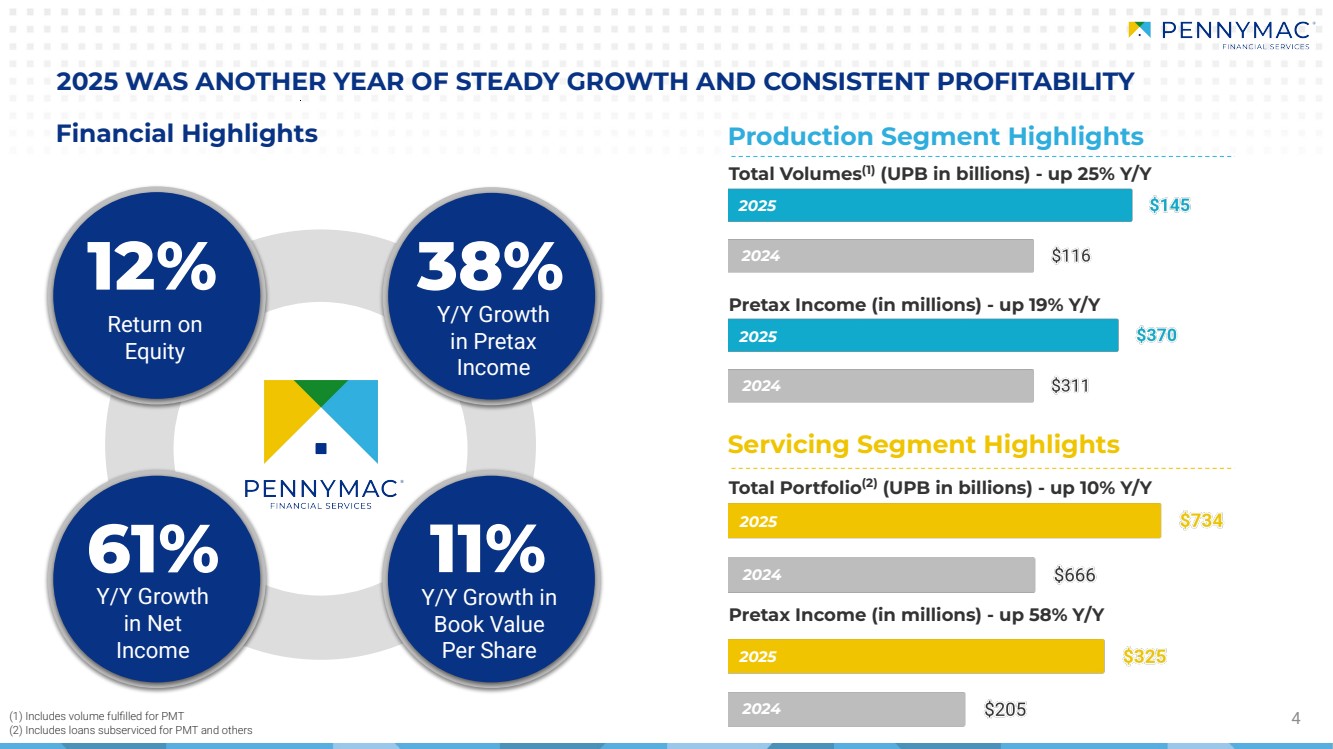
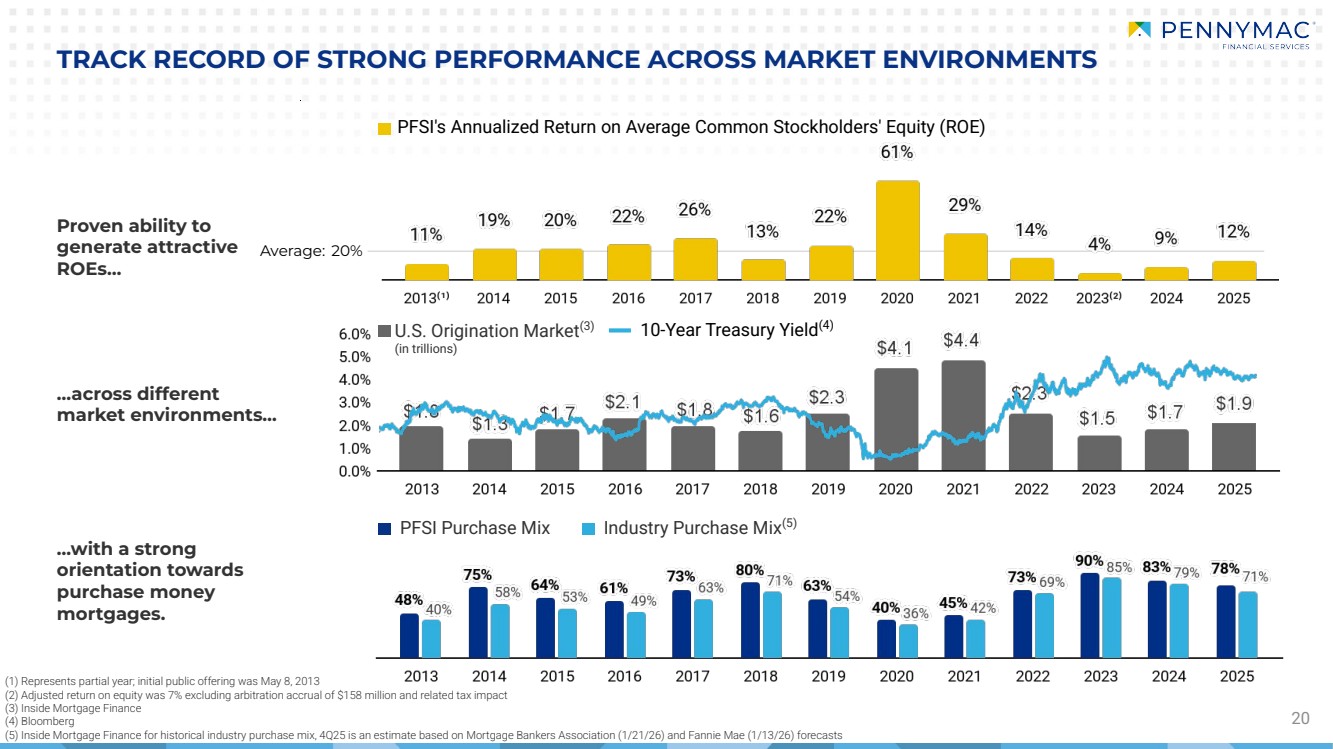
| · | Net income of $501.1 million, up from $311.4 million in 2024 and representing a return on equity of 12 percent |
| · | Pretax income of $551.4 million, up from $401.0 million in 2024 |
| · | Total net revenue of $2.0 billion, up from $1.6 billion in 2024 |
| · | Total loan production of $145.5 billion in UPB, an increase of 25 percent from 2024 |
| · | Servicing portfolio UPB of $733.6 billion at year end, up 10 percent from December 31, 2024 |
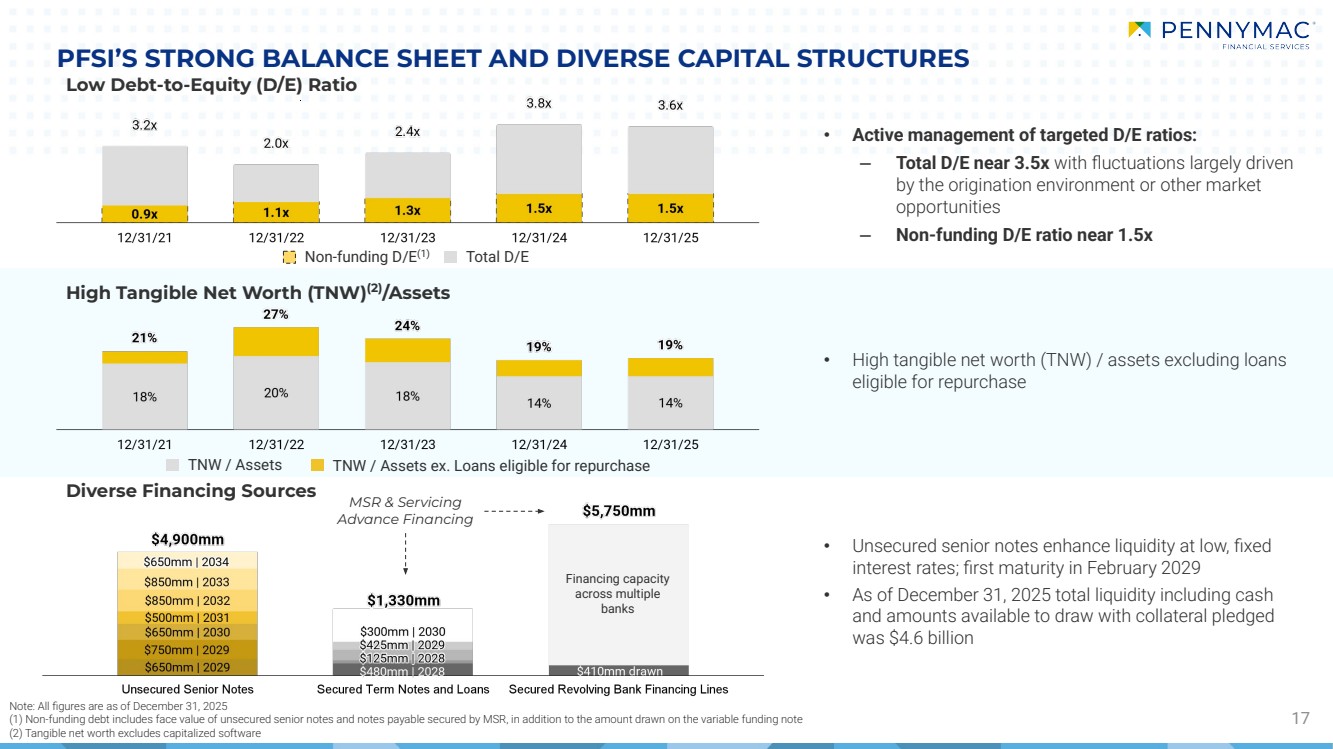
| · | Issued $2.35 billion of unsecured senior notes with maturities ranging from 2032 to 2034 |
| · | Issued $300 million of Ginnie Mae MSR term notes due August 2030 |
| · | Redeemed $650 million of unsecured notes and $700 million of Ginnie Mae MSR term notes |
2
“PFSI finished the year with a solid fourth quarter, generating a 10 percent annualized return on equity with strong production results offset by increased runoff on our MSR asset as prepayment speeds increased,” said Chairman and CEO David Spector. “For the full year 2025, our balanced business model generated very strong financial results. We achieved double-digit earnings growth across both operating segments, with servicing pretax income up 58 percent and production pretax income up 19 percent. These results were driven by significant operational momentum, including a 25 percent increase in production volumes and 10 percent growth in our servicing portfolio UPB. In total, we generated a 12 percent return on equity for the year and 11 percent growth in book value per share, underscoring our ability to consistently create stockholder value through disciplined execution.”
Mr. Spector concluded, “As we look to 2026, Pennymac is uniquely positioned to lead the industry. Our balanced business model and cutting edge technology provides a powerful foundation for our continued growth. We remain focused on the continued advancement of our strategies to drive sustained long-term value for our stockholders.”
3
The following table presents the contributions of PFSI’s segments to pretax income:
| Quarter ended December 31, 2025 | ||||||||||||||||||||
| Production | Servicing | Reportable segment total | Corporate and other | Total | ||||||||||||||||
| (in thousands) | ||||||||||||||||||||
| Revenue: | ||||||||||||||||||||
| Net gains on loans held for sale at fair value | $ | 276,060 | $ | 25,543 | $ | 301,603 | $ | - | $ | 301,603 | ||||||||||
| Loan origination fees | 68,437 | - | 68,437 | - | 68,437 | |||||||||||||||
| Fulfillment fees from PMT | 6,538 | - | 6,538 | - | 6,538 | |||||||||||||||
| Net loan servicing fees | - | 149,780 | 149,780 | - | 149,780 | |||||||||||||||
| Management fees | - | - | - | 6,856 | 6,856 | |||||||||||||||
| Net interest income (expense): | ||||||||||||||||||||
| Interest income | 128,953 | 134,642 | 263,595 | 299 | 263,894 | |||||||||||||||
| Interest expense | 109,189 | 153,807 | 262,996 | - | 262,996 | |||||||||||||||
| 19,764 | (19,165 | ) | 599 | 299 | 898 | |||||||||||||||
| Other | 187 | (2,256 | ) | (2,069 | ) | 5,962 | 3,893 | |||||||||||||
| Total net revenue | 370,986 | 153,902 | 524,888 | 13,117 | 538,005 | |||||||||||||||
| Expenses | ||||||||||||||||||||
| Compensation | 123,386 | 51,612 | 174,998 | 33,075 | 208,073 | |||||||||||||||
| Loan origination | 69,651 | - | 69,651 | - | 69,651 | |||||||||||||||
| Technology | 27,909 | 10,847 | 38,756 | (3,378 | ) | 35,378 | ||||||||||||||
| Servicing | - | 43,360 | 43,360 | - | 43,360 | |||||||||||||||
| Marketing and advertising | 8,506 | 555 | 9,061 | 1,242 | 10,303 | |||||||||||||||
| Professional services | 3,942 | 1,986 | 5,928 | 4,483 | 10,411 | |||||||||||||||
| Occupancy and equipment | 5,162 | 2,477 | 7,639 | 2,324 | 9,963 | |||||||||||||||
| Other | 5,123 | 5,726 | 10,849 | 5,612 | 16,461 | |||||||||||||||
| Total expenses | 243,679 | 116,563 | 360,242 | 43,358 | 403,600 | |||||||||||||||
| Income (loss) before provision for income taxes | $ | 127,307 | $ | 37,339 | $ | 164,646 | $ | (30,241 | ) | $ | 134,405 | |||||||||
Production Segment
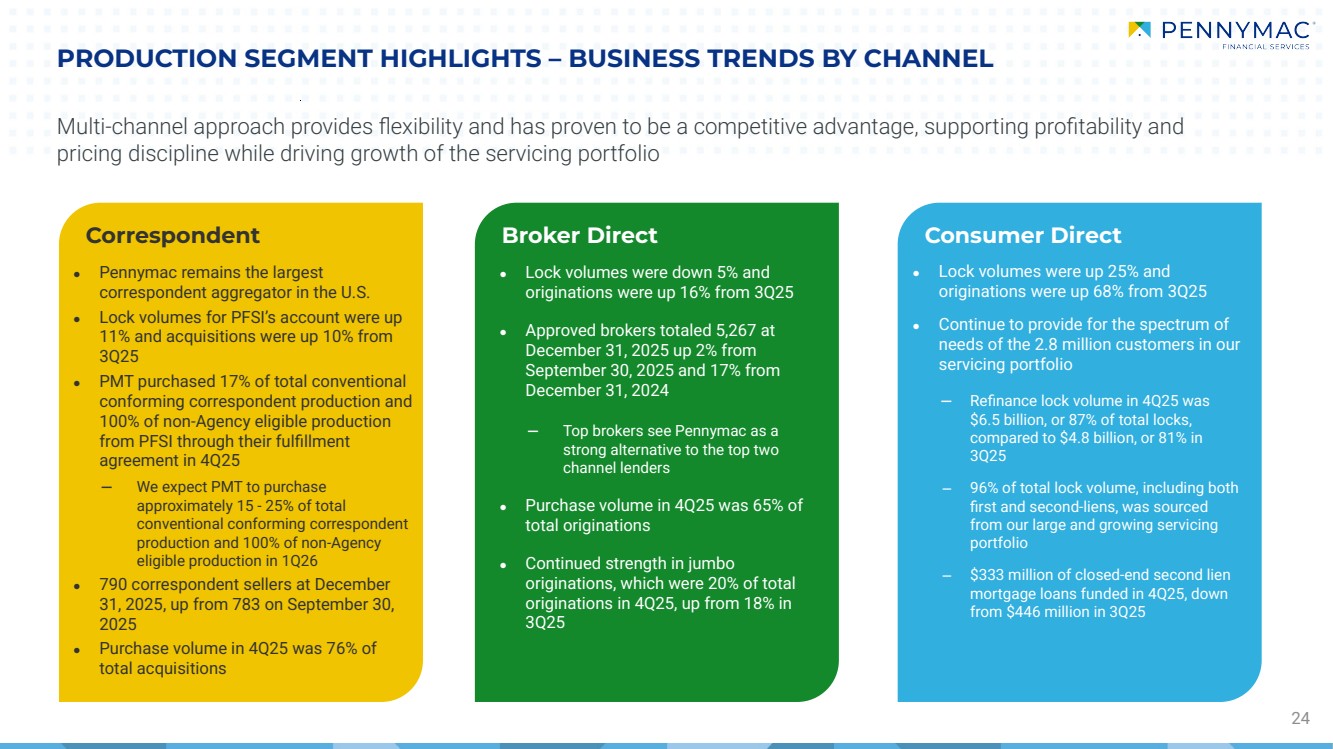
The Production segment includes the correspondent acquisition of newly originated government-insured and conventional conforming loans for PFSI’s own account, fulfillment services on behalf of PMT and direct lending through the consumer direct and broker direct channels, including the underwriting and acquisition of loans from correspondent sellers on a non-delegated basis.
PFSI’s loan production activity for the quarter totaled $42.2 billion in UPB, $38.5 billion of which was for its own account, and $3.7 billion of which was fee-based fulfillment activity for PMT. Correspondent locks for PFSI and direct lending IRLCs totaled $42.8 billion in UPB, up 10 percent from the prior quarter and 30 percent from the fourth quarter of 2024.
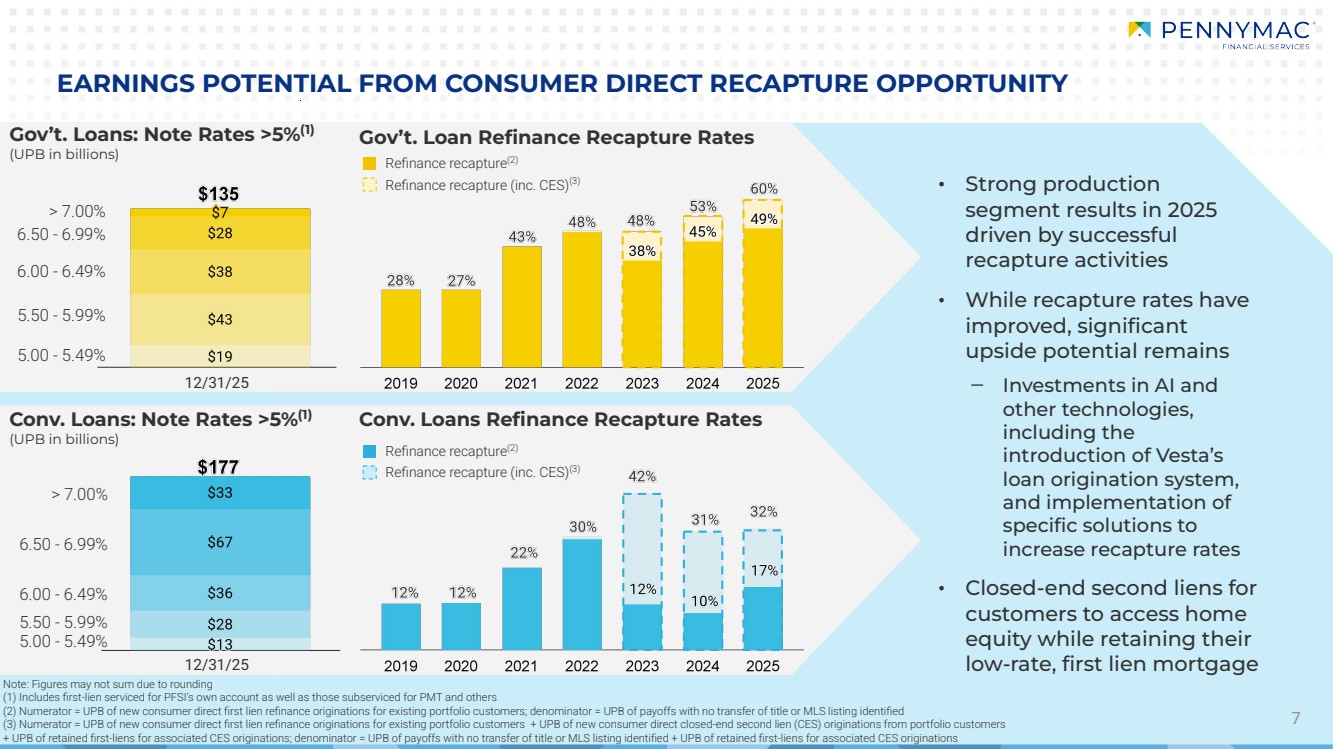
Production segment pretax income was $127.3 million, up from $122.9 million in the prior quarter and $78.0 million in the fourth quarter of 2024. Production segment net revenues totaled $371.0 million, up 3 percent from the prior quarter and 42 percent from the fourth quarter of 2024. The increase in revenue from the prior quarter was primarily due to higher volumes in the consumer direct lending channel and was largely offset by lower margins. The increase from the fourth quarter of 2024 was primarily due to higher volumes across all channels.
4
The components of net gains on loans held for sale are detailed in the following table:
| Quarter ended | ||||||||||||
| December 31, 2025 | September 30, 2025 | December 31, 2024 | ||||||||||
| (in thousands) | ||||||||||||
| Receipt of MSRs | $ | 775,242 | $ | 700,326 | $ | 748,121 | ||||||
| Gains on sale of loans to PennyMac Mortgage Investment Trust net of mortgage servicing rights recapture payable | 16,341 | 17,454 | 2,387 | |||||||||
| Provision for representations and warranties, net | (2,924 | ) | (2,354 | ) | (1,633 | ) | ||||||
| Cash loss, including cash hedging results | (492,013 | ) | (284,589 | ) | (373,307 | ) | ||||||
| Fair value changes of pipeline, inventory and hedges | 4,957 | (116,382 | ) | (153,524 | ) | |||||||
| Net gains on mortgage loans held for sale | $ | 301,603 | $ | 314,455 | $ | 222,044 | ||||||
| Net gains on mortgage loans held for sale by segment: | ||||||||||||
| Production | $ | 276,060 | $ | 280,092 | $ | 195,070 | ||||||
| Servicing | $ | 25,543 | $ | 34,363 | $ | 26,974 | ||||||
PFSI performs fulfillment services for certain conventional conforming and non-Agency eligible loans that it acquires from non-affiliates in its correspondent production business and subsequently sells to PMT. These services include, but are not limited to, marketing, relationship management, correspondent seller approval and monitoring, loan file review, underwriting, pricing, hedging and activities related to the subsequent sale and securitization of loans in the secondary mortgage markets for PMT.
Fees earned from the fulfillment of correspondent loans on behalf of PMT totaled $6.5 million in the fourth quarter, up 6 percent from the prior quarter and 3 percent from the fourth quarter of 2024. The increase was driven by higher acquisition volumes for PMT’s account.
Correspondent production volumes are initially acquired by PFSI. PMT retains the right to purchase up to 100 percent of non-government correspondent loan production. In the fourth quarter, PMT acquired all non-Agency eligible correspondent production and 17 percent of total conventional conforming correspondent production. In the first quarter of 2026, we expect PMT to acquire all non-Agency eligible correspondent production and 15 to 25 percent of total conventional conforming correspondent production.
Net interest income in the fourth quarter totaled $19.8 million, up from $13.7 million in the prior quarter. Interest income totaled $129.0 million, up from $111.3 million in the prior quarter, and interest expense totaled $109.2 million, up from $97.7 million in the prior quarter, both due to the increase in volumes.
5
Production segment expenses were $243.7 million, up 2 percent from the prior quarter and 33 percent from the fourth quarter of 2024. The increase from the prior quarter was primarily due to higher compensation expenses that resulted from the increase in consumer direct volumes. The increase from the fourth quarter of 2024 was primarily due to higher compensation and loan origination expenses from growth in the direct lending channels.
Servicing Segment
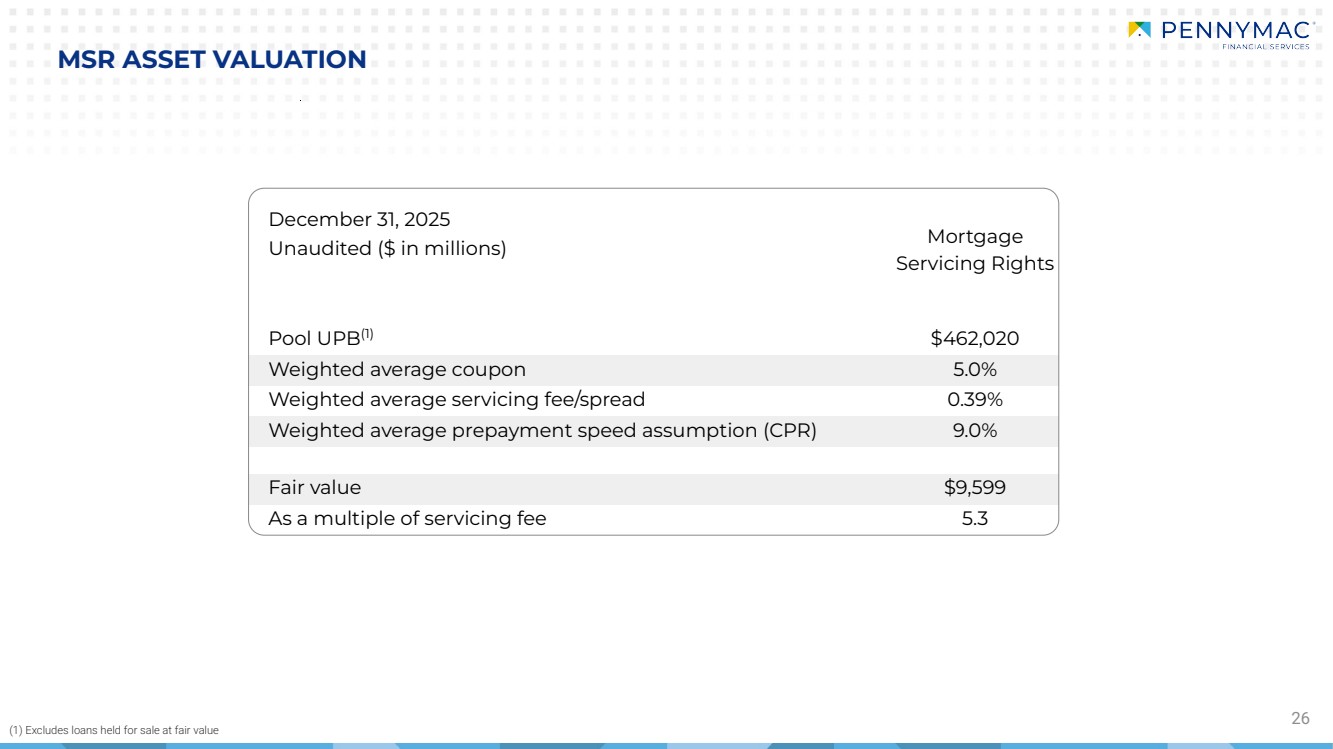
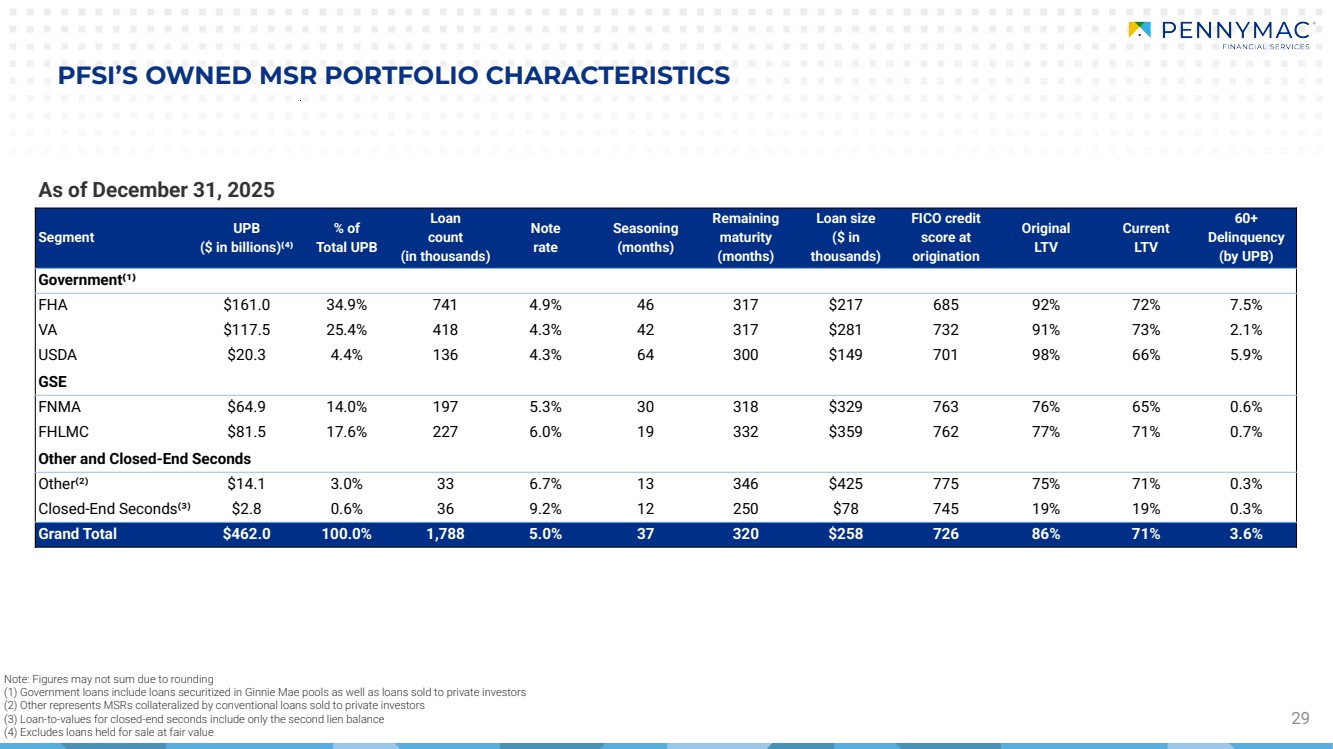
The Servicing segment includes income from owned MSRs and subservicing. The total servicing portfolio increased to $733.6 billion in UPB at December 31, 2025, up 2 percent from September 30, 2025 and up 10 percent from December 31, 2024. PFSI’s owned MSR portfolio totaled $471.0 billion in UPB, a decrease of 1 percent from September 30, 2025 as runoff along with the sale of $24.4 billion in UPB of MSRs more than offset the net growth from production. PFSI’s owned MSR portfolio UPB increased 8 percent from December 31, 2024, primarily due to production volumes, which more than offset runoff and MSR sales. PFSI subservices $262.6 billion in UPB, up 10 percent from the prior quarter. Of total subservicing UPB, $226.8 billion was for PMT, $24.3 billion was subserviced on an interim basis and $11.6 billion was for other non-affiliates.
The table below details PFSI’s servicing portfolio UPB:
| December 31, 2025 | September 30, 2025 | December 31, 2024 | ||||||||||
| (in thousands) | ||||||||||||
| Owned | ||||||||||||
| Mortgage servicing rights and liabilities | ||||||||||||
| Originated | $ | 448,035,447 | $ | 455,894,902 | $ | 410,393,342 | ||||||
| Purchased | 13,999,998 | 14,404,290 | 15,681,406 | |||||||||
| 462,035,445 | 470,299,192 | 426,074,748 | ||||||||||
| Loans held for sale | 8,930,477 | 7,303,091 | 8,128,914 | |||||||||
| 470,965,922 | 477,602,283 | 434,203,662 | ||||||||||
| Subserviced for: | ||||||||||||
| PMT | 226,774,067 | 227,101,009 | 230,753,581 | |||||||||
| Interim servicing | 24,257,095 | 65,286 | 806,584 | |||||||||
| Other non-affiliates | 11,616,738 | 11,863,843 | - | |||||||||
| 262,647,900 | 239,030,138 | 231,560,165 | ||||||||||
| Total loans serviced | $ | 733,613,822 | $ | 716,632,421 | $ | 665,763,827 | ||||||
Servicing segment pretax income was $37.3 million, down from $157.4 million in the prior quarter and $87.3 million in the fourth quarter of 2024. Servicing segment net revenues totaled $153.9 million, down from $259.5 million in the prior quarter and $197.5 million in the fourth quarter of 2024.
6
Revenue from net loan servicing fees totaled $149.8 million, down from $241.2 million in the prior quarter and $189.3 million in the fourth quarter of 2024. Net loan servicing fee revenues included $532.2 million in loan servicing fees, down slightly from the prior quarter due to the aforementioned sale of MSRs. Realization of cash flows was $383.4 million in the fourth quarter, up 32 percent from the prior quarter, consistent with the increase in prepayment speeds for the owned portfolio as lower mortgage rates drove higher prepayment activity. Net valuation-related gains totaled $1.0 million, comprised of MSR fair value gains of $40.4 million and hedging losses of $39.4 million.
The following table presents a breakdown of net loan servicing fees:
| Quarter ended | ||||||||||||
| December 31, 2025 | September 30, 2025 | December 31, 2024 | ||||||||||
| (in thousands) | ||||||||||||
| Loan servicing fees | $ | 532,192 | $ | 535,106 | $ | 472,563 | ||||||
| Changes in fair value of MSRs and MSLs resulting from: | ||||||||||||
| Realization of cash flows | (383,368 | ) | (289,679 | ) | (215,590 | ) | ||||||
| Change in fair value inputs | 40,388 | (102,495 | ) | 540,406 | ||||||||
| Hedging (losses) gains | (39,432 | ) | 98,306 | (608,112 | ) | |||||||
| Net change in fair value of MSRs and MSLs | (382,412 | ) | (293,868 | ) | (283,296 | ) | ||||||
| Net loan servicing fees | $ | 149,780 | $ | 241,238 | $ | 189,267 | ||||||
Servicing segment revenue included $25.5 million in net gains on loans held for sale related to early buyout loans (EBOs), down from $34.4 million in the prior quarter and $27.0 million in the fourth quarter of 2024. The decrease from the prior quarter was primarily driven by the re-introduction of FHA’s trial payment plans, which extended modification timelines and delayed redeliveries into future quarters. These EBOs are previously delinquent loans that were brought back to performing status through PFSI’s successful servicing efforts.
Net interest expense totaled $19.2 million, compared to $15.1 million in the prior quarter and $19.5 million in the fourth quarter of 2024. Interest income was $134.6 million, down slightly from $137.1 million in the prior quarter as lower earnings rates on custodial balances more than offset the benefit of higher average balances. Interest expense was $153.8 million, up slightly from $152.2 million in the prior quarter.
7
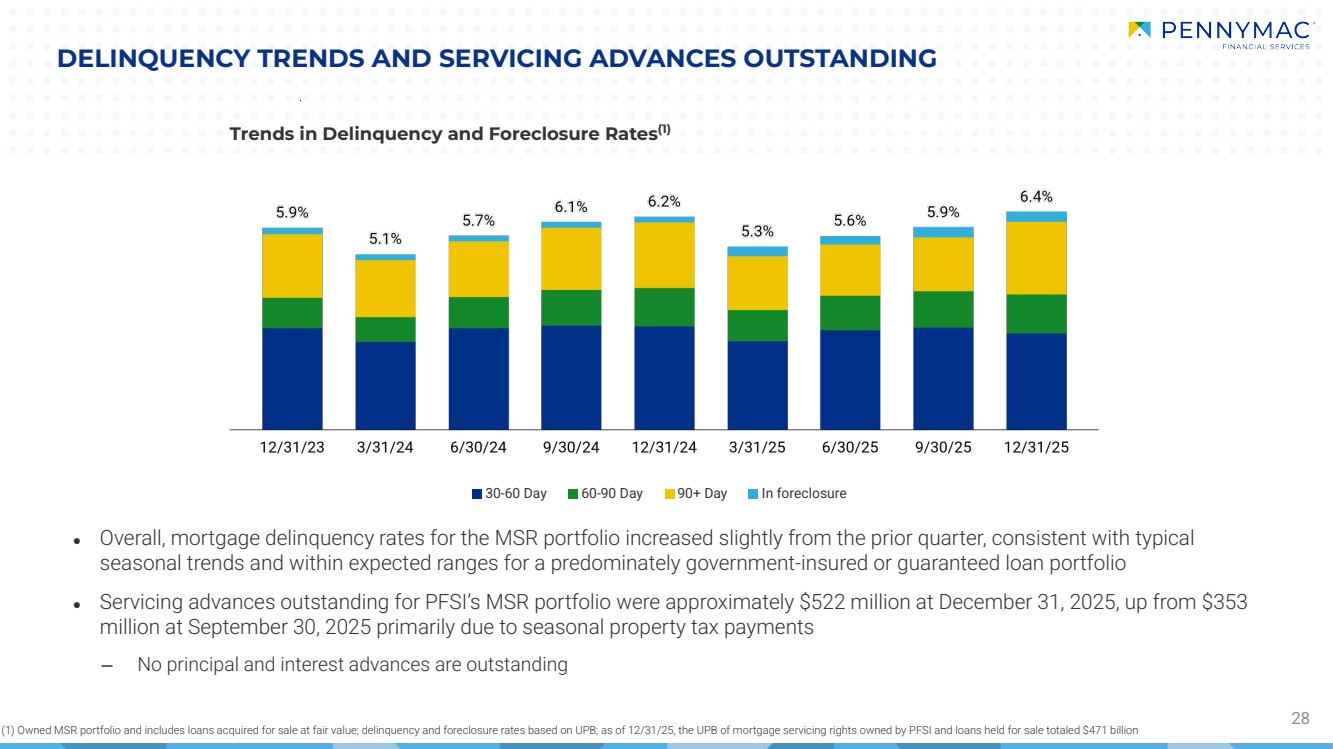
Servicing segment expenses totaled $116.6 million, up from $102.1 million in the prior quarter primarily due to an increased provision for losses on active loans associated with seasonal increases in delinquencies and servicing advance balances.
Corporate and Other
Corporate and Other items include amounts attributable to corporate activities not directly attributable to the production and servicing segments as well as management fees earned from PMT. PFSI manages PMT for which it earns base management fees and may earn performance incentive fees.
Pretax loss for Corporate and Other was $30.2 million, down from $43.9 million in the prior quarter and $35.9 million in the fourth quarter of 2024.
Corporate and Other net revenues totaled $13.1 million, and consisted of $6.9 million in management fees, $6.0 million in other revenue, and $0.3 million of net interest income. No performance incentive fees were earned in the fourth quarter.
Expenses were $43.4 million, down from $55.5 million in the prior quarter and $47.4 million in the fourth quarter of 2024. The decrease from the prior quarter was primarily driven by increased capitalization of certain technology expenses and decreased performance-based incentive compensation.
Average PMT shareholders’ equity was $1.8 billion for the fourth quarter of 2025, essentially unchanged from the third quarter of 2025, and down slightly from the fourth quarter of 2024.
8
The following table presents a breakdown of management fees:
| Quarter ended | ||||||||||||
| December 31, 2025 | September 30, 2025 | December 31, 2024 | ||||||||||
| (in thousands) | ||||||||||||
| Management fees: | ||||||||||||
| Base fees | $ | 6,856 | $ | 6,912 | $ | 7,149 | ||||||
| Performance incentive fees | - | - | - | |||||||||
| Total management fees | $ | 6,856 | $ | 6,912 | $ | 7,149 | ||||||
| Average PMT shareholders' equity used to calculate base management fees | $ | 1,813,357 | $ | 1,828,365 | $ | 1,896,220 | ||||||
Consolidated Expenses
Total expenses were $403.6 million, up from $396.5 million in the prior quarter due to higher expenses in both the production and servicing segments as mentioned above.
Taxes
PFSI recorded a provision for tax expense of $27.6 million, resulting in an effective tax rate of 20.5 percent. The provision for tax expense included a $4.3 million tax benefit consisting of a repricing of deferred tax liabilities and an adjustment to the 2025 tax accrual. PFSI’s tax provision rate in future periods is expected to be 25.1percent, down slightly from 25.2 percent in recent quarters.
***
Management’s slide presentation and accompanying material will be available in the Investor Relations section of the Company’s website at pfsi.pennymac.com after the market closes on Thursday, January 29, 2026. Management will also host a conference call and live audio webcast at 5:00 p.m. Eastern Time to review the Company’s financial results. The webcast can be accessed at pfsi.pennymac.com, and a replay will be available shortly after its conclusion.
***
About PennyMac Financial Services, Inc.
PennyMac Financial Services, Inc. is a specialty financial services firm focused on the production and servicing of U.S. mortgage loans and the management of investments related to the U.S. mortgage market. Founded in 2008, the company is recognized as a leader in the U.S. residential mortgage industry and employs approximately 4,900 people across the country. In 2025, PFSI’s production of newly originated loans totaled $145 billion in UPB, making it a top lender in the nation. As of December 31, 2025, PFSI serviced loans totaling $734 billion in UPB, making it a top mortgage servicer in the nation. Additional information about PFSI is available at pfsi.pennymac.com.
| Media | Investors |
| Kristyn Clark | Kevin Chamberlain |
| [email protected] | Isaac Garden |
| 805.395.9943 | [email protected] |
| 818.264.4907 |
9
Forward-Looking Statements
This press release contains forward-looking statements within the meaning of Section 21E of the Securities Exchange Act of 1934, as amended, regarding management’s beliefs, estimates, projections, and assumptions with respect to, among other things, our financial results, future operations, business plans and investment strategies, as well as industry and market conditions, all of which are subject to change. Words like “believe,” “expect,” “anticipate,” “promise,” “project,” “plan,” and other expressions or words of similar meanings, as well as future or conditional verbs such as “will,” “would,” “should,” “could,” or “may” are generally intended to identify forward-looking statements. Actual results and operations for any future period may vary materially from those projected herein and from past results discussed herein. Factors which could cause actual results to differ materially from historical results or those anticipated include, but are not limited to: interest rate changes; changes in macroeconomic, consumer and real estate market conditions; changes in housing prices, housing sales and real estate values; changes in homeownership costs and affordability; compliance with changing federal, state and local laws and regulations applicable to the highly regulated industry in which we operate; lawsuits or governmental actions that may result from any noncompliance with the laws and regulations applicable to our business; the mortgage lending and servicing-related regulations promulgated by federal and state regulators and the enforcement of these regulations; the licensing and operational requirements of states and other jurisdictions applicable to our business, to which our bank competitors are not subject; difficulties inherent in adjusting the size of our operations to reflect changes in business levels; purchase and sales opportunities for mortgage servicing rights; our substantial amount of indebtedness; increases in loan delinquencies, defaults and forbearances; foreclosure delays and changes in foreclosure practices; our dependence on U.S. government-sponsored entities and changes in their current roles or their guarantees or guidelines; our reliance on PennyMac Mortgage Investment Trust (NYSE: PMT) as a significant contributor to our mortgage banking business; maintaining sufficient capital and liquidity and compliance with financial covenants; our obligation to indemnify third-party purchasers or repurchase loans if loans that we originate, acquire, service or assist in the fulfillment of, fail to meet certain criteria; our obligation to indemnify PMT if our services fail to meet certain criteria or characteristics or under other circumstances; investment management and incentive fees; the accuracy or changes in the estimates we make about uncertainties, contingencies and asset and liability valuations; conflicts of interest in allocating our services and investment opportunities among us and our advised entity; our ability to mitigate cybersecurity risks, cyber incidents and technology disruptions; the development of artificial intelligence; the effect of public opinion on our reputation; our exposure to risks of loss from severe weather events, man-made or other natural conditions, including climate change and pandemics; our ability to effectively identify, manage and hedge our credit, interest rate, prepayment, liquidity and climate risks; expanding or creating new business activities or strategies; our ability to detect misconduct and fraud; our ability to pay dividends to our stockholders; and our organizational structure and certain requirements in our charter documents. You should not place undue reliance on any forward- looking statement and should consider all of the uncertainties and risks described above, as well as those more fully discussed in reports and other documents filed by the Company with the Securities and Exchange Commission from time to time. The Company undertakes no obligation to publicly update or revise any forward-looking statements or any other information contained herein, and the statements made in this press release are current as of the date of this release only. The press release contains financial information calculated other than in accordance with U.S. generally accepted accounting principles (“GAAP”), such as pretax income excluding valuation-related items and operating net income that provide a meaningful perspective on the Company’s business results since the Company utilizes this information to evaluate and manage the business. Non-GAAP disclosures have limitations as an analytical tool and should not be viewed as a substitute for financial information determined in accordance with GAAP.
10
PENNYMAC FINANCIAL SERVICES, INC.
CONSOLIDATED BALANCE SHEETS (UNAUDITED)
| December 31, 2025 | September 30, 2025 | December 31, 2024 | ||||||||||
| (in thousands, except share amounts) | ||||||||||||
| ASSETS | ||||||||||||
| Cash | $ | 301,680 | $ | 621,921 | $ | 238,482 | ||||||
| Short-term investment at fair value | 410,037 | 62,228 | 420,553 | |||||||||
| Principal-only stripped mortgage-backed securities at fair value | 722,528 | 774,021 | 825,865 | |||||||||
| Loans held for sale at fair value | 9,123,410 | 7,490,473 | 8,217,468 | |||||||||
| Derivative assets | 187,775 | 202,082 | 113,076 | |||||||||
| Servicing advances, net | 589,542 | 396,006 | 568,512 | |||||||||
| Mortgage servicing rights at fair value | 9,598,941 | 9,653,942 | 8,744,528 | |||||||||
| Receivable from PennyMac Mortgage Investment Trust | 17,122 | 40,165 | 30,206 | |||||||||
| Loans eligible for repurchase | 7,409,800 | 5,416,967 | 6,157,172 | |||||||||
| Other | 1,027,854 | 743,315 | 771,025 | |||||||||
| Total assets | $ | 29,388,689 | $ | 25,401,120 | $ | 26,086,887 | ||||||
| LIABILITIES | ||||||||||||
| Assets sold under agreements to repurchase | $ | 8,794,002 | $ | 7,130,423 | $ | 8,685,207 | ||||||
| Mortgage loan participation purchase and sale agreements | 696,618 | 699,182 | 496,512 | |||||||||
| Notes payable secured by mortgage servicing assets | 1,326,021 | 1,325,716 | 2,048,972 | |||||||||
| Unsecured senior notes | 4,831,742 | 4,829,113 | 3,164,032 | |||||||||
| Derivative liabilities | 15,806 | 24,276 | 40,900 | |||||||||
| Mortgage servicing liabilities at fair value | 1,572 | 1,593 | 1,683 | |||||||||
| Accounts payable and accrued expenses | 643,896 | 476,094 | 354,414 | |||||||||
| Payable to PennyMac Mortgage Investment Trust | 116,585 | 80,605 | 122,317 | |||||||||
| Payable to exchanged Private National Mortgage Acceptance Company, LLC unitholders under tax receivable agreement | 24,757 | 24,806 | 25,898 | |||||||||
| Income taxes payable | 1,184,020 | 1,151,395 | 1,131,000 | |||||||||
| Liability for loans eligible for repurchase | 7,409,800 | 5,416,967 | 6,157,172 | |||||||||
| Liability for losses under representations and warranties | 34,894 | 33,064 | 29,129 | |||||||||
| Total liabilities | 25,079,713 | 21,193,234 | 22,257,236 | |||||||||
| STOCKHOLDERS' EQUITY | ||||||||||||
| Common stock—authorized 200,000,000 shares of $0.0001 par value; issued and outstanding 52,061,346, 51,875,223, and 51,376,616 shares, respectively | 5 | 5 | 5 | |||||||||
| Additional paid-in capital | 96,870 | 86,680 | 56,072 | |||||||||
| Retained earnings | 4,212,101 | 4,121,201 | 3,773,574 | |||||||||
| Total stockholders' equity | 4,308,976 | 4,207,886 | 3,829,651 | |||||||||
| Total liabilities and stockholders’ equity | $ | 29,388,689 | $ | 25,401,120 | $ | 26,086,887 | ||||||
11
PENNYMAC FINANCIAL SERVICES, INC.
CONSOLIDATED STATEMENTS OF INCOME (UNAUDITED)
| Quarter ended | ||||||||||||
| December 31, 2025 | September 30, 2025 | December 31, 2024 | ||||||||||
| (in thousands, except per share amounts) | ||||||||||||
| Revenues | ||||||||||||
| Net gains on loans held for sale at fair value | $ | 301,603 | $ | 314,455 | $ | 222,044 | ||||||
| Loan origination fees | 68,437 | 61,696 | 57,824 | |||||||||
| Fulfillment fees from PennyMac Mortgage Investment Trust | 6,538 | 6,162 | 6,356 | |||||||||
| Net loan servicing fees: | ||||||||||||
| Loan servicing fees | 532,192 | 535,106 | 472,563 | |||||||||
| Change in fair value of mortgage servicing rights and mortgage servicing liabilities | (342,980 | ) | (392,174 | ) | 324,816 | |||||||
| Mortgage servicing rights hedging results | (39,432 | ) | 98,306 | (608,112 | ) | |||||||
| Net loan servicing fees | 149,780 | 241,238 | 189,267 | |||||||||
| Net interest income (expense): | ||||||||||||
| Interest income | 263,894 | 248,753 | 210,859 | |||||||||
| Interest expense | 262,996 | 249,900 | 228,111 | |||||||||
| 898 | (1,147 | ) | (17,252 | ) | ||||||||
| Management fees from PennyMac Mortgage Investment Trust | 6,856 | 6,912 | 7,149 | |||||||||
| Other | 3,893 | 3,582 | 4,722 | |||||||||
| Total net revenues | 538,005 | 632,898 | 470,110 | |||||||||
| Expenses | ||||||||||||
| Compensation | 208,073 | 205,314 | 173,090 | |||||||||
| Loan origination | 69,651 | 69,407 | 48,046 | |||||||||
| Servicing | 43,360 | 29,105 | 38,088 | |||||||||
| Technology | 35,378 | 44,772 | 40,831 | |||||||||
| Professional services | 10,411 | 10,145 | 9,987 | |||||||||
| Marketing and advertising | 10,303 | 14,016 | 7,765 | |||||||||
| Occupancy and equipment | 9,963 | 8,604 | 8,173 | |||||||||
| Other | 16,461 | 15,161 | 14,766 | |||||||||
| Total expenses | 403,600 | 396,524 | 340,746 | |||||||||
| Income before provision for income taxes | 134,405 | 236,374 | 129,364 | |||||||||
| Provision for income taxes | 27,574 | 54,871 | 24,875 | |||||||||
| Net income | $ | 106,831 | $ | 181,503 | $ | 104,489 | ||||||
| Earnings per share | ||||||||||||
| Basic | $ | 2.05 | $ | 3.51 | $ | 2.04 | ||||||
| Diluted | $ | 1.97 | $ | 3.37 | $ | 1.95 | ||||||
| Weighted-average common shares outstanding | ||||||||||||
| Basic | 52,003 | 51,730 | 51,274 | |||||||||
| Diluted | 54,171 | 53,879 | 53,576 | |||||||||
| Dividend declared per share | $ | 0.30 | $ | 0.30 | $ | 0.30 | ||||||
12
PENNYMAC FINANCIAL SERVICES, INC.
CONSOLIDATED STATEMENTS OF INCOME (UNAUDITED)
| Year ended December 31, | ||||||||||||
| 2025 | 2024 | 2023 | ||||||||||
| (in thousands, except earnings per share) | ||||||||||||
| Revenues | ||||||||||||
| Net gains on loans held for sale at fair value | $ | 1,071,754 | $ | 817,368 | $ | 545,943 | ||||||
| Loan origination fees | 235,835 | 185,700 | 146,118 | |||||||||
| Fulfillment fees from PennyMac Mortgage Investment Trust | 23,804 | 26,291 | 27,826 | |||||||||
| Net loan servicing fees: | ||||||||||||
| Loan servicing fees | 2,062,433 | 1,799,480 | 1,484,946 | |||||||||
| Change in fair value of mortgage servicing rights and mortgage servicing liabilities | (1,413,280 | ) | (433,342 | ) | (605,568 | ) | ||||||
| Mortgage servicing rights hedging results | 56,546 | (832,483 | ) | (236,778 | ) | |||||||
| Net loan servicing fees | 705,699 | 533,655 | 642,600 | |||||||||
| Net interest expense: | ||||||||||||
| Interest income | 924,447 | 793,566 | 632,924 | |||||||||
| Interest expense | 960,555 | 819,348 | 637,777 | |||||||||
| (36,108 | ) | (25,782 | ) | (4,853 | ) | |||||||
| Management fees from PennyMac Mortgage Investment Trust | 27,649 | 28,623 | 28,762 | |||||||||
| Other | 17,903 | 27,876 | 15,260 | |||||||||
| Total net revenues | 2,046,536 | 1,593,731 | 1,401,656 | |||||||||
| Expenses | ||||||||||||
| Compensation | 782,916 | 632,738 | 576,964 | |||||||||
| Loan origination | 251,990 | 164,092 | 114,500 | |||||||||
| Technology | 162,604 | 149,547 | 143,152 | |||||||||
| Servicing | 122,626 | 105,997 | 69,433 | |||||||||
| Marketing and advertising | 46,140 | 21,969 | 17,631 | |||||||||
| Professional services | 37,973 | 37,992 | 60,521 | |||||||||
| Occupancy and equipment | 35,328 | 32,898 | 36,558 | |||||||||
| Legal settlements | — | 1,591 | 162,770 | |||||||||
| Other | 55,542 | 45,881 | 36,496 | |||||||||
| Total expenses | 1,495,119 | 1,192,705 | 1,218,025 | |||||||||
| Income before provision for income taxes | 551,417 | 401,026 | 183,631 | |||||||||
| Provision for income taxes | 50,340 | 89,603 | 38,975 | |||||||||
| Net income | $ | 501,077 | $ | 311,423 | $ | 144,656 | ||||||
| Earnings per share | ||||||||||||
| Basic | $ | 9.69 | $ | 6.11 | $ | 2.89 | ||||||
| Diluted | $ | 9.30 | $ | 5.84 | $ | 2.74 | ||||||
| Weighted average shares outstanding | ||||||||||||
| Basic | 51,728 | 50,990 | 49,978 | |||||||||
| Diluted | 53,882 | 53,356 | 52,733 | |||||||||
13