Exhibit
99.1

PennyMac Financial
Services, Inc. Reports
Second Quarter
2022 Results
WESTLAKE VILLAGE, Calif. –
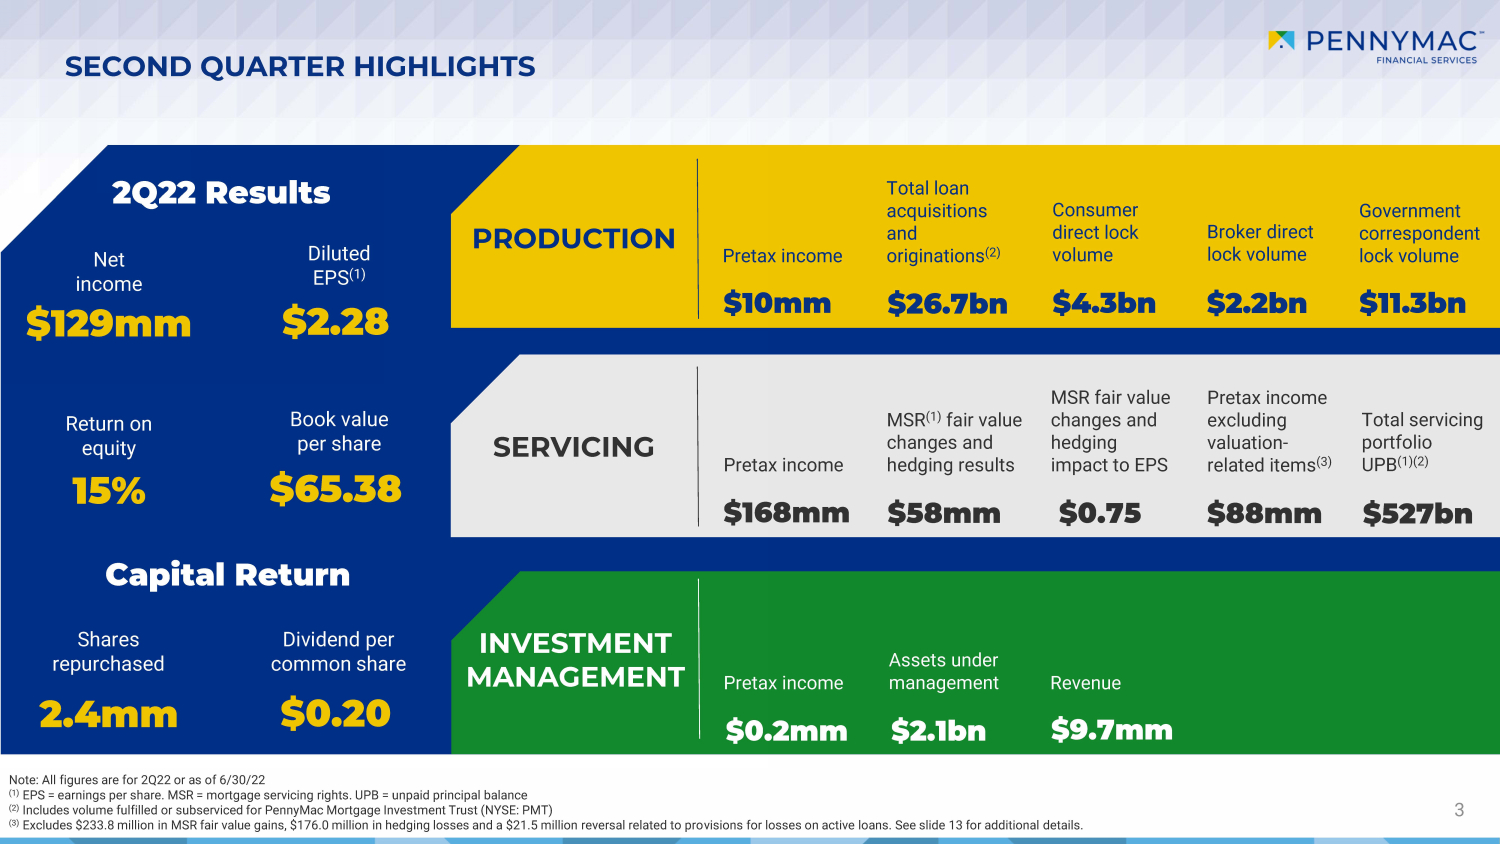
August 2, 2022 – PennyMac Financial Services, Inc. (NYSE: PFSI) today reported net income of $129.2 million for the second
quarter of 2022, or $2.28 per share on a diluted basis, on revenue of $511.5 million. Book value per share increased to $65.38 from
$62.19 at March 31, 2022.
PFSI’s Board of Directors declared
a second quarter cash dividend of $0.20 per share, payable on August 26, 2022, to common stockholders of record as of August 16, 2022.
Second Quarter 2022 Highlights
| · | Pretax
income was $177.5 million, down 24 percent from the prior quarter and 36 percent from the
second quarter of 2021 |
| o | Repurchased 2.4 million shares of PFSI’s
common stock at an average price of $46.81 per share for a cost of $113.6 million; also repurchased
an additional 478 thousand shares in July at an average price of $48.19 per share for a cost
of $23.0 million |
| o | Issued $500 million of 5-year term notes
secured by Ginnie Mae mortgage servicing rights (MSRs) |
| · | Production
segment pretax income of $9.7 million, up slightly from $9.3 million in the prior quarter
and down from $244.4 million in the second quarter of 2021 primarily due to lower volumes
as a result of the smaller origination market |
| o | Consumer direct interest rate lock commitments
(IRLCs) were $4.3 billion in unpaid principal balance (UPB), down 53 percent from the prior
quarter and 69 percent from the second quarter of 2021 |
| o | Broker direct IRLCs were $2.2 billion
in UPB, down 37 percent from the prior quarter and 51 percent from the second quarter of
2021 |
| o | Government correspondent IRLCs totaled
$11.3 billion in UPB, down 9 percent from the prior quarter and 28 percent from
the second quarter of 2021 |
| o | Total loan acquisitions and originations,
including those fulfilled for PennyMac Mortgage Investment Trust (NYSE: PMT), were $26.7 billion
in UPB, down 20 percent from the prior quarter and 56 percent from the second quarter
of 2021 |
| o | Correspondent acquisitions of conventional
loans fulfilled for PMT were $10.3 billion in UPB, up 6 percent from the prior quarter and
down 66 percent from the second quarter of 2021 |
| · | Servicing
segment pretax income was $167.6 million, down from $225.2 million in the prior quarter
and up from $30.9 million in the second quarter of 2021 |
| o | Pretax income excluding valuation-related
items was $88.3 million, up 3 percent from the prior quarter |
| o | Valuation items included: |
| – | $233.8 million in mortgage servicing
rights (MSR) fair value gains partially offset by $176.0 million in fair value decreases
from hedging results |
| · | Net
impact on pretax income related to these items was $57.8 million, or $0.75 in earnings per
share |
| – | $21.5 million of reversals related
to provisions for losses on active loans |
| o | Servicing portfolio grew to $527.3 billion
in UPB, up 2 percent from March 31, 2022 and 11 percent from June 30, 2021, driven by production
volumes which more than offset prepayment activity |
| · | Investment
Management segment pretax income was $0.2 million, up from $0.1 million in the prior quarter
and down from $4.1 million in the second quarter of 2021 |
| o | Net assets under management (AUM) were
$2.1 billion, down 7 percent from March 31, 2022, and 12 percent from June 30, 2021 |
“PFSI continues to distinguish
itself as a best-in-class mortgage company, delivering strong financial results in the second quarter with an annualized return on equity
of 15 percent,” said Chairman and CEO David Spector. “The quick, decisive and meaningful actions taken earlier this year
to better align our expenses with lower expected levels of activity led to continued profitability in our production segment despite
higher interest rates, increased volatility and industry overcapacity. We also saw a strong income contribution from our servicing business,
which continues to grow organically as additions to the platform from our loan production activities more than offset prepayment activity.
We ended the quarter with a servicing portfolio of 2.2 million customers representing nearly $530 billion in unpaid principal balance.”
Mr. Spector continued, “We remain
diligent in identifying and implementing additional efficiencies across the Company while also simultaneously making investments in transformational
technology projects which we believe will position PFSI for continued success. Though PFSI’s returns are projected to trend lower
over the next few quarters due to volatility in the current market environment, I remain confident in our positioning over the long-term
given our balanced business model with a large and growing servicing portfolio and this management team’s long history of executing
through various markets.”
The following table presents the contributions
of PennyMac Financial’s segments to pretax income:
| |
|
Quarter
ended June 30, 2022 |
|
| |
|
Mortgage
Banking |
|
|
|
|
|
Investment |
|
|
|
|
| |
|
Production |
|
|
Servicing |
|
|
Total |
|
|
Management |
|
|
Total |
|
| |
|
|
|
|
|
|
|
|
|
|
|
|
|
|
|
| |
|
(in thousands) |
|
| Revenue |
|
|
|
|
|
|
|
|
|
|
|
|
|
|
|
|
|
|
|
|
| Net
gains on loans held for sale at fair value |
|
$ |
152,895 |
|
|
$ |
69,672 |
|
|
$ |
222,567 |
|
|
$ |
- |
|
|
$ |
222,567 |
|
| Loan origination
fees |
|
|
39,945 |
|
|
|
- |
|
|
|
39,945 |
|
|
|
- |
|
|
|
39,945 |
|
| Fulfillment
fees from PMT |
|
|
20,646 |
|
|
|
- |
|
|
|
20,646 |
|
|
|
- |
|
|
|
20,646 |
|
| Net loan
servicing fees |
|
|
- |
|
|
|
238,447 |
|
|
|
238,447 |
|
|
|
- |
|
|
|
238,447 |
|
| Management
fees |
|
|
- |
|
|
|
- |
|
|
|
- |
|
|
|
7,910 |
|
|
|
7,910 |
|
| Net interest
expense: |
|
|
|
|
|
|
|
|
|
|
|
|
|
|
|
|
|
|
|
|
| Interest income |
|
|
28,379 |
|
|
|
21,485 |
|
|
|
49,864 |
|
|
|
- |
|
|
|
49,864 |
|
| Interest
expense |
|
|
19,207 |
|
|
|
51,920 |
|
|
|
71,127 |
|
|
|
- |
|
|
|
71,127 |
|
| |
|
|
9,172 |
|
|
|
(30,435 |
) |
|
|
(21,263 |
) |
|
|
- |
|
|
|
(21,263 |
) |
| Other |
|
|
583 |
|
|
|
900 |
|
|
|
1,483 |
|
|
|
1,780 |
|
|
|
3,263 |
|
| Total
net revenue |
|
|
223,241 |
|
|
|
278,584 |
|
|
|
501,825 |
|
|
|
9,690 |
|
|
|
511,515 |
|
| Expenses |
|
|
213,587 |
|
|
|
110,959 |
|
|
|
324,546 |
|
|
|
9,443 |
|
|
|
333,989 |
|
| Income
before provision for income taxes |
|
$ |
9,654 |
|
|
$ |
167,625 |
|
|
$ |
177,279 |
|
|
$ |
247 |
|
|
$ |
177,526 |
|
Production Segment
The Production segment includes the
correspondent acquisition of newly originated government-insured mortgage loans for PennyMac Financial’s own account, fulfillment
services on behalf of PMT and direct lending through the consumer direct and broker direct channels, including the underwriting and acquisition
of loans from correspondent sellers on a non-delegated basis.
PennyMac Financial’s loan production
activity for the quarter totaled $26.7 billion in UPB, $16.4 billion of which was for its own account, and $10.3 billion of which
was fee-based fulfillment activity for PMT. Correspondent government and direct lending IRLCs totaled $17.9 billion in UPB, down 29 percent
from the prior quarter and 48 percent from the second quarter of 2021 due to the significant reduction in the size of the overall origination
market.
Production segment pretax income was
$9.7 million, up slightly from $9.3 million in the prior quarter and down from $244.4 million in the second quarter of 2021. Production
segment revenue totaled $223.2 million, down 28 percent from the prior quarter and 61 percent from the second quarter of 2021. The
quarter-over-quarter decrease was primarily driven by a $68.7 million decrease in net gains on loans held for sale and a $27.9 million
decrease in loan origination fees, both driven by lower volumes.
The components of net gains on loans
held for sale are detailed in the following table:
| | |
Quarter
ended | |
| | |
June
30,
2022 | | |
March
31,
2022 | | |
June
30,
2021 | |
| | |
| | |
| | |
| |
| | |
(in thousands) | |
| Receipt
of MSRs and recognition of MSLs in loan sale transactions | |
$ | 398,253 | | |
$ | 616,302 | | |
$ | 425,941 | |
| Mortgage
servicing rights recapture payable to PennyMac Mortgage Investment Trust | |
| (4,752 | ) | |
| (9,652 | ) | |
| (11,548 | ) |
| Reversal
of (provision for) liability for representations and warranties, net | |
| 45 | | |
| (885 | ) | |
| (6,664 | ) |
| Cash
(loss) gain (1) | |
| (368,554 | ) | |
| (54,134 | ) | |
| 61,654 | |
| Fair
value changes of pipeline, inventory and hedges | |
| 197,575 | | |
| (253,172 | ) | |
| 113,265 | |
| Net
gains on mortgage loans held for sale | |
$ | 222,567 | | |
$ | 298,459 | | |
$ | 582,648 | |
| Net
gains on mortgage loans held for sale by segment: | |
| | | |
| | | |
| | |
| Production | |
$ | 152,895 | | |
$ | 221,610 | | |
$ | 419,293 | |
| Servicing | |
$ | 69,672 | | |
$ | 76,849 | | |
$ | 163,355 | |
(1)
Net of cash hedging results
PennyMac Financial performs fulfillment
services for conventional conforming and jumbo loans acquired by PMT from non-affiliates in its correspondent production business. These
services include, but are not limited to, marketing, relationship management, correspondent seller approval and monitoring, loan file
review, underwriting, pricing, hedging and activities related to the subsequent sale and securitization of loans in the secondary mortgage
markets for PMT.
Fees earned from the fulfillment of
correspondent loans on behalf of PMT totaled $20.6 million in the second quarter, up 23 percent from the prior quarter and
down 62 percent from the second quarter of 2021. The increase from the prior quarter was driven by higher conventional acquisition volumes
and a higher weighted average fulfillment fee while the decrease from the second quarter of 2021 was primarily driven by the decrease
in conventional acquisition volumes.
Net interest income totaled $9.2 million,
up from $3.9 million in the prior quarter. Interest income in the second quarter totaled $28.4 million, down from $30.9 million in the
prior quarter, and interest expense totaled $19.2 million, down from $27.1 million in the prior quarter, due to lower average balances
of loans held-for-sale during the quarter.
Production segment expenses were $213.6 million,
down 29 percent from the prior quarter and 34 percent from the second quarter of 2021. The decline from the prior quarter was driven
by lower production volumes and a reduction in headcount consistent with the expense management initiatives announced in the prior quarter.
Servicing Segment
The Servicing segment includes income
from owned MSRs, subservicing and special servicing activities. Servicing segment pretax income was $167.6 million, down from $225.2
million in the prior quarter and up from $30.9 million in the second quarter of 2021. Servicing segment net revenues totaled $278.6
million, down from $336.5 million in the prior quarter and up from $162.6 million in the second quarter of 2021. The quarter-over-quarter
decrease was primarily driven by a $47.9 million decrease in net loan servicing fees and a $7.2 million reduction in gains on loans held
for sale related to early buyout (EBO) activity.
Revenue from net loan servicing fees
totaled $238.4 million, down from $286.3 million in the prior quarter primarily driven by lower net valuation related gains. Revenue
from loan servicing fees included $302.4 million in servicing fees, reduced by $121.7 million from the realization of MSR cash flows.
Net valuation-related gains totaled $57.8 million, and included MSR fair value gains of $233.8 million and hedging declines of $176.0
million primarily driven by increasing interest rates during the period.
The following table presents a breakdown
of net loan servicing fees:
| |
|
Quarter
ended |
|
| |
|
June
30,
2022 |
|
|
March
31,
2022 |
|
|
June
30,
2021 |
|
| |
|
|
|
|
|
|
|
|
|
| |
|
(in thousands) |
|
| Loan
servicing fees (1) |
|
$ |
302,350 |
|
|
$ |
291,258 |
|
|
$ |
260,021 |
|
| Changes in
fair value of MSRs and MSLs resulting from: |
|
|
|
|
|
|
|
|
|
|
|
|
| Realization
of cash flows |
|
|
(121,724 |
) |
|
|
(111,155 |
) |
|
|
(85,671 |
) |
| Change in
fair value inputs |
|
|
233,826 |
|
|
|
324,066 |
|
|
|
(250,597 |
) |
| Hedging
losses |
|
|
(176,005 |
) |
|
|
(217,860 |
) |
|
|
91,118 |
|
| Net
change in fair value of MSRs and MSLs |
|
|
(63,903 |
) |
|
|
(4,949 |
) |
|
|
(245,150 |
) |
| Net
loan servicing fees |
|
$ |
238,447 |
|
|
$ |
286,309 |
|
|
$ |
14,871 |
|
(1)
Includes contractually-specified servicing fees
Servicing segment revenue included $69.7
million in net gains on loans held for sale related to reperforming government-insured and guaranteed loans purchased out of Ginnie Mae
securitizations, or EBOs. These gains were down from $76.8 million in the prior quarter and $163.4 million in the second quarter
of 2021 as a result of lower volumes and redelivery gains due to higher interest rates.
These EBOs are previously delinquent
loans that were brought back to performing status through PennyMac Financial’s successful servicing efforts, primarily through
loan modifications or FHA Partial Claims. With respect to the FHA Partial Claims, the reperforming loans must remain current for a minimum
of six months to be eligible for resecuritization.
Net interest expense totaled $30.4 million,
versus net interest expense of $27.3 million in the prior quarter and $16.5 million in the second quarter of 2021. Interest income was
$21.5 million, down from $22.9 million in the prior quarter as increased placement fees on custodial balances offset the decline in interest
income on EBO loans held for sale. Interest expense was $51.9 million, up slightly from the prior quarter.
Servicing segment expenses totaled $111.0
million, essentially unchanged from the prior quarter.
The total servicing portfolio grew to
$527.3 billion in UPB at June 30, 2022, an increase of 2 percent from March 31, 2022 and 11 percent from June 30, 2021. PennyMac
Financial subservices or conducts special servicing for $226.4 billion in UPB, up 2 percent from March 31, 2022 and 11 percent from
June 30, 2021. PennyMac Financial’s owned MSR portfolio grew to $300.9 billion in UPB, an increase of 2 percent from March
31, 2022 and 12 percent from June 30, 2021.
The table below details PennyMac Financial’s
servicing portfolio UPB:
| |
|
June
30,
2022 |
|
|
March
31,
2022 |
|
|
June
30,
2021 |
|
| |
|
|
|
|
|
|
|
|
|
| |
|
(in thousands) |
|
| Prime servicing: |
|
|
|
|
|
|
|
|
|
| Owned |
|
|
|
|
|
|
|
|
|
| Mortgage servicing
rights and liabilities |
|
|
|
|
|
|
|
|
|
|
|
|
| Originated |
|
$ |
276,627,961 |
|
|
$ |
268,886,759 |
|
|
$ |
227,560,336 |
|
| Acquisitions |
|
|
20,683,203 |
|
|
|
21,911,132 |
|
|
|
31,050,313 |
|
| |
|
|
297,311,164 |
|
|
|
290,797,891 |
|
|
|
258,610,649 |
|
| Loans
held for sale |
|
|
3,575,712 |
|
|
|
5,125,298 |
|
|
|
10,438,935 |
|
| |
|
|
300,886,876 |
|
|
|
295,923,189 |
|
|
|
269,049,584 |
|
| Subserviced
for PMT |
|
|
226,365,581 |
|
|
|
222,864,324 |
|
|
|
204,132,766 |
|
| Total prime
servicing |
|
|
527,252,457 |
|
|
|
518,787,513 |
|
|
|
473,182,350 |
|
| Special
servicing - subserviced for PMT |
|
|
23,001 |
|
|
|
23,047 |
|
|
|
41,696 |
|
| Total
loans serviced |
|
$ |
527,275,458 |
|
|
$ |
518,810,560 |
|
|
$ |
473,224,046 |
|
Investment Management Segment
PennyMac Financial manages PMT for which
it earns base management fees and may earn incentive compensation. Net AUM were $2.1 billion as of June 30, 2022, down 7 percent
from March 31, 2022 and 12 percent from June 30, 2021 due to PMT’s financial performance.
Pretax income for the Investment Management
segment was $0.2 million, up from $0.1 million in the prior quarter and down from $4.1 million in the second quarter of 2021. Base
management fees from PMT were $7.9 million, down from $8.1 million in the prior quarter and $8.6 million in the second quarter of 2021
due to the decline in AUM. No performance incentive fees were earned in the first or second quarters of 2022, while performance incentive
fees of $3.3 million were earned in the second quarter of 2021.
The following table presents a breakdown
of management fees:
| |
|
Quarter
ended |
|
| |
|
June
30,
2022 |
|
|
March
31,
2022 |
|
|
June
30,
2021 |
|
| |
|
|
|
|
|
|
|
|
|
| |
|
(in thousands) |
|
| Management
fees: |
|
|
|
|
|
|
|
|
|
|
|
|
| Base |
|
$ |
7,910 |
|
|
$ |
8,117 |
|
|
$ |
8,648 |
|
| Performance
incentive |
|
|
- |
|
|
|
- |
|
|
|
3,265 |
|
| Total
management fees |
|
$ |
7,910 |
|
|
$ |
8,117 |
|
|
$ |
11,913 |
|
| |
|
|
|
|
|
|
|
|
|
|
|
|
| Net assets
of PennyMac Mortgage Investment Trust |
|
$ |
2,070,640 |
|
|
$ |
2,221,938 |
|
|
$ |
2,343,390 |
|
Investment Management segment expenses
totaled $9.4 million, down 6 percent from the prior quarter and essentially unchanged from the second quarter of 2021.
Consolidated Expenses
Total expenses were $334.0 million,
down 21 percent from the prior quarter and 28 percent from the second quarter of 2021. The quarter-over-quarter decrease was
primarily driven by lower production volumes and a reduction in headcount as noted above.
***
Management’s slide presentation
will be available in the Investor Relations section of the Company’s website at ir.pennymacfinancial.com after the market closes
on Tuesday, August 2, 2022.
# -
About PennyMac Financial Services,
Inc.
PennyMac Financial Services, Inc. is
a specialty financial services firm focused on the production and servicing of U.S. mortgage loans and the management of investments
related to the U.S. mortgage market. Founded in 2008, the company is recognized as a leader in the U.S. residential mortgage industry
and employs over 4,800 people across the country. For the twelve months ended June 30, 2022, PennyMac Financial’s production of
newly originated loans totaled $166 billion in unpaid principal balance, making it the fourth largest mortgage lender in the nation.
As of June 30, 2022, PennyMac Financial serviced loans totaling $527 billion in unpaid principal balance, making it a top ten mortgage
servicer in the nation. Additional information about PennyMac Financial Services, Inc. is available at ir.pennymacfinancial.com.
Forward-Looking Statements
This press release contains forward-looking
statements within the meaning of Section 21E of the Securities Exchange Act of 1934, as amended, regarding management’s beliefs,
estimates, projections, and assumptions with respect to, among other things, the Company’s financial results, future operations,
business plans and investment strategies, as well as industry and market conditions, all of which are subject to change. Words like “believe,”
“expect,” “anticipate,” “promise,” “project,” “plan,” and other expressions
or words of similar meanings, as well as future or conditional verbs such as “will,” “would,” “should,”
“could,” or “may” are generally intended to identify forward-looking statements. Actual results and operations
for any future period may vary materially from those projected herein and from past results discussed herein. Factors which could cause
actual results to differ materially from historical results or those anticipated include, but are not limited to: changes in prevailing
interest rates; our exposure to risks of loss and disruptions in operations resulting from adverse weather conditions, man-made or natural
disasters, climate change and pandemics such as COVID-19; the continually changing federal, state and local laws and regulations applicable
to the highly regulated industry in which we operate; lawsuits or governmental actions that may result from any noncompliance with the
laws and regulations applicable to our businesses; the mortgage lending and servicing-related regulations promulgated by the Consumer
Financial Protection Bureau and its enforcement of these regulations; our dependence on U.S. government-sponsored entities and changes
in their current roles or their guarantees or guidelines; changes to government mortgage modification programs; the licensing and operational
requirements of states and other jurisdictions applicable to our business, to which our bank competitors are not subject; foreclosure
delays and changes in foreclosure practices; changes in macroeconomic and U.S. real estate market conditions; difficulties inherent in
adjusting the size of our operations to reflect changes in business levels; purchase opportunities for mortgage servicing rights and
our success in winning bids; our substantial amount of indebtedness; the discontinuation of LIBOR; increases in loan delinquencies and
defaults; failure to modify, resell or refinance early buyout loans; our reliance on PennyMac Mortgage Investment Trust (NYSE: PMT) as
a significant source of financing for, and revenue related to, our mortgage banking business; maintaining sufficient capital and liquidity
and compliance with financial covenants; our obligation to indemnify third-party purchasers or repurchase loans if loans that we originate,
acquire, service or assist in the fulfillment of, fail to meet certain criteria or characteristics or under other circumstances; our
obligation to indemnify PMT if our services fail to meet certain criteria or characteristics or under other circumstances; decreases
in the returns on the assets that we select and manage for our clients, and our resulting management and incentive fees; the extensive
amount of regulation applicable to our investment management segment; conflicts of interest in allocating our services and investment
opportunities among us and our advised entities; the effect of public opinion on our reputation; our ability to effectively identify,
manage and hedge our credit, interest rate, prepayment, liquidity and climate risks; our initiation or expansion of new business activities
or strategies; our ability to detect misconduct and fraud; our ability to mitigate cybersecurity risks and cyber incidents; our ability
to pay dividends to our stockholders; and our organizational structure and certain requirements in our charter documents. You should
not place undue reliance on any forward- looking statement and should consider all of the uncertainties and risks described above, as
well as those more fully discussed in reports and other documents filed by the Company with the Securities and Exchange Commission from
time to time. The Company undertakes no obligation to publicly update or revise any forward-looking statements or any other information
contained herein, and the statements made in this press release are current as of the date of this release only.
The Company’s earnings materials
contain financial information calculated other than in accordance with U.S. generally accepted accounting principles (“GAAP”),
such as pretax income excluding valuation-related items that provide a meaningful perspective on the Company’s business results
since the Company utilizes this information to evaluate and manage the business. Non-GAAP disclosure has limitations as an analytical
tool and should not be viewed as a substitute for financial information determined in accordance with GAAP.
PENNYMAC FINANCIAL
SERVICES, INC.
CONSOLIDATED
BALANCE SHEETS (UNAUDITED)
| |
|
June
30,
2022 |
|
|
March
31,
2022 |
|
|
June
30,
2021 |
|
| |
|
|
|
|
|
|
|
|
|
| |
|
(in thousands,
except share amounts) |
|
| ASSETS |
|
|
|
|
|
|
|
|
|
| Cash |
|
$ |
1,415,396 |
|
|
$ |
489,799 |
|
|
$ |
324,158 |
|
| Short-term
investments at fair value |
|
|
4,961 |
|
|
|
78,006 |
|
|
|
3,720 |
|
| Loans
held for sale at fair value |
|
|
3,586,810 |
|
|
|
5,119,234 |
|
|
|
10,884,506 |
|
| Derivative
assets |
|
|
103,901 |
|
|
|
225,071 |
|
|
|
371,269 |
|
| Servicing
advances, net |
|
|
570,822 |
|
|
|
616,874 |
|
|
|
519,028 |
|
| Mortgage
servicing rights at fair value |
|
|
5,217,167 |
|
|
|
4,707,039 |
|
|
|
3,412,648 |
|
| Operating
lease right-of-use assets |
|
|
82,078 |
|
|
|
85,262 |
|
|
|
75,829 |
|
| Investment
in PennyMac Mortgage Investment Trust at fair value |
|
|
1,037 |
|
|
|
1,267 |
|
|
|
1,580 |
|
| Receivable
from PennyMac Mortgage Investment Trust |
|
|
43,234 |
|
|
|
27,722 |
|
|
|
61,883 |
|
| Loans
eligible for repurchase |
|
|
2,778,768 |
|
|
|
2,721,574 |
|
|
|
7,613,244 |
|
| Other |
|
|
468,081 |
|
|
|
546,054 |
|
|
|
612,273 |
|
| Total
assets |
|
$ |
14,272,255 |
|
|
$ |
14,617,902 |
|
|
$ |
23,880,138 |
|
| |
|
|
|
|
|
|
|
|
|
|
|
|
| LIABILITIES |
|
|
|
|
|
|
|
|
|
|
|
|
| Assets
sold under agreements to repurchase |
|
$ |
2,441,816 |
|
|
$ |
3,333,444 |
|
|
$ |
8,254,543 |
|
| Mortgage
loan participation purchase and sale agreements |
|
|
502,116 |
|
|
|
494,396 |
|
|
|
512,253 |
|
| Obligations
under capital lease |
|
|
- |
|
|
|
1,396 |
|
|
|
7,677 |
|
| Notes
payable secured by mortgage servicing assets |
|
|
1,793,260 |
|
|
|
1,298,067 |
|
|
|
1,296,731 |
|
| Unsecured
senior notes |
|
|
1,778,055 |
|
|
|
1,777,132 |
|
|
|
1,288,769 |
|
| Derivative
liabilities |
|
|
42,702 |
|
|
|
90,837 |
|
|
|
43,910 |
|
| Mortgage
servicing liabilities at fair value |
|
|
2,337 |
|
|
|
2,564 |
|
|
|
100,091 |
|
| Accounts
payable and accrued expenses |
|
|
317,998 |
|
|
|
371,908 |
|
|
|
369,766 |
|
| Operating
lease liabilities |
|
|
102,756 |
|
|
|
106,316 |
|
|
|
96,463 |
|
| Payable
to PennyMac Mortgage Investment Trust |
|
|
98,991 |
|
|
|
159,468 |
|
|
|
136,660 |
|
| Payable
to exchanged Private National Mortgage Acceptance Company, LLC unitholders under tax receivable agreement |
|
|
27,014 |
|
|
|
30,530 |
|
|
|
31,815 |
|
| Income
taxes payable |
|
|
885,721 |
|
|
|
745,873 |
|
|
|
570,052 |
|
| Liability
for loans eligible for repurchase |
|
|
2,778,768 |
|
|
|
2,721,574 |
|
|
|
7,613,244 |
|
| Liability
for losses under representations and warranties |
|
|
39,336 |
|
|
|
42,794 |
|
|
|
44,335 |
|
| Total
liabilities |
|
|
10,810,870 |
|
|
|
11,176,299 |
|
|
|
20,366,309 |
|
| |
|
|
|
|
|
|
|
|
|
|
|
|
| STOCKHOLDERS'
EQUITY |
|
| Common
stock¾authorized
200,000,000 shares of $0.0001 par value; issued and outstanding 52,938,854, 55,341,627, and 64,483,965
shares, respectively |
|
|
5 |
|
|
|
6 |
|
|
|
6 |
|
| Additional
paid-in capital |
|
|
- |
|
|
|
- |
|
|
|
618,337 |
|
| Retained
earnings |
|
|
3,461,380 |
|
|
|
3,441,597 |
|
|
|
2,895,486 |
|
| Total
stockholders' equity |
|
|
3,461,385 |
|
|
|
3,441,603 |
|
|
|
3,513,829 |
|
| Total
liabilities and stockholders’ equity |
|
$ |
14,272,255 |
|
|
$ |
14,617,902 |
|
|
$ |
23,880,138 |
|
PENNYMAC
FINANCIAL SERVICES, INC.
CONSOLIDATED
STATEMENTS OF INCOME (UNAUDITED)
| | |
Quarter
ended | |
| | |
June
30,
2022 | | |
March
31,
2022 | | |
June
30,
2021 | |
| | |
| | |
| | |
| |
| | |
(in thousands,
except per share amounts) | |
| Revenue | |
| | |
| |
| Net
gains on loans held for sale at fair value | |
$ | 222,567 | | |
$ | 298,459 | | |
$ | 582,648 | |
| Loan
origination fees | |
| 39,945 | | |
| 67,858 | | |
| 97,291 | |
| Fulfillment
fees from PennyMac Mortgage Investment Trust | |
| 20,646 | | |
| 16,754 | | |
| 54,020 | |
| Net
loan servicing fees: |
| Loan
servicing fees | |
| 302,350 | | |
| 291,258 | | |
| 260,021 | |
| Change
in fair value of mortgage servicing rights, mortgage servicing liabilities and excess servicing spread financing | |
| 112,102 | | |
| 212,911 | | |
| (336,268 | ) |
| Mortgage
servicing rights hedging results | |
| (176,005 | ) | |
| (217,860 | ) | |
| 91,118 | |
| Net
loan servicing fees | |
| 238,447 | | |
| 286,309 | | |
| 14,871 | |
| Net
interest expense: |
| Interest
income | |
| 49,864 | | |
| 53,882 | | |
| 80,797 | |
| Interest
expense | |
| 71,127 | | |
| 77,307 | | |
| 102,431 | |
| | |
| (21,263 | ) | |
| (23,425 | ) | |
| (21,634 | ) |
| Management
fees from PennyMac Mortgage Investment Trust | |
| 7,910 | | |
| 8,117 | | |
| 11,913 | |
| Other | |
| 3,263 | | |
| 3,432 | | |
| 3,143 | |
| Total
net revenue | |
| 511,515 | | |
| 657,504 | | |
| 742,252 | |
| Expenses |
| Compensation | |
| 198,192 | | |
| 245,547 | | |
| 265,067 | |
| Loan
origination | |
| 44,931 | | |
| 75,333 | | |
| 75,675 | |
| Technology | |
| 34,621 | | |
| 34,786 | | |
| 34,236 | |
| Professional
services | |
| 20,793 | | |
| 20,103 | | |
| 24,834 | |
| Marketing
and advertising | |
| 13,007 | | |
| 22,403 | | |
| 10,213 | |
| Occupancy
and equipment | |
| 9,371 | | |
| 9,469 | | |
| 9,029 | |
| Servicing | |
| 3,051 | | |
| (1,246 | ) | |
| 31,290 | |
| Other | |
| 10,023 | | |
| 16,589 | | |
| 12,393 | |
| Total
expenses | |
| 333,989 | | |
| 422,984 | | |
| 462,737 | |
| Income
before provision for income taxes | |
| 177,526 | | |
| 234,520 | | |
| 279,515 | |
| Provision
for income taxes | |
| 48,363 | | |
| 60,927 | | |
| 75,286 | |
| Net
income | |
$ | 129,163 | | |
$ | 173,593 | | |
$ | 204,229 | |
| Earnings
per share |
| Basic | |
$ | 2.38 | | |
$ | 3.11 | | |
$ | 3.10 | |
| Diluted | |
$ | 2.28 | | |
$ | 2.94 | | |
$ | 2.94 | |
| Weighted-average
common shares outstanding |
| Basic | |
| 54,167 | | |
| 55,831 | | |
| 65,890 | |
| Diluted | |
| 56,642 | | |
| 59,129 | | |
| 69,399 | |
| Dividend
declared per share | |
$ | 0.20 | | |
$ | 0.20 | | |
$ | 0.20 | |
Exhibit 99.2

2Q22 EARNINGS REPORT PennyMac Financial Services, Inc. August 2022
2 This presentation contains forward - looking statements within the meaning of Section 21E of the Securities Exchange Act of 1934, as amended, regarding management’s beliefs, estimates, projections and assumptions with respect to, among other things, our financial results, future operations, business plans and in vestment strategies, as well as industry and market conditions, all of which are subject to change. Words like “believe,” “expect,” “anticipate,” “promise,” “project,” “plan,” and other expression s o r words of similar meanings, as well as future or conditional verbs such as “will,” “would,” “should,” “could,” or “may” are generally intended to identify forward - looking statements. Actual results and o perations for any future period may vary materially from those projected herein and from past results discussed herein. These forward - looking statements include, but are not limited to, statements rega rding the future changes in interest rates and prepayment rates; the impact of the COVID - 19 pandemic; future loan origination, servicing and production, including future production and operating e xpenses; future loan delinquencies and forbearances; future early buyout loans; future custodial balance earnings; future earnings and return on equity as well as other business and financial ex pectations. Factors which could cause actual results to differ materially from historical results or those anticipated include, but are not limited to: changes in prevailing interest rates; our expos ure to risks of loss and disruptions in operations resulting from adverse weather conditions, man - made or natural disasters, climate change and pandemics such as COVID - 19; the continually changing feder al, state and local laws and regulations applicable to the highly regulated industry in which we operate; lawsuits or governmental actions that may result from any noncompliance with the laws an d regulations applicable to our businesses; the mortgage lending and servicing - related regulations promulgated by the Consumer Financial Protection Bureau and its enforcement of these regulatio ns; our dependence on U.S. government - sponsored entities and changes in their current roles or their guarantees or guidelines; changes to government mortgage modification programs; the l ice nsing and operational requirements of states and other jurisdictions applicable to our business, to which our bank competitors are not subject; foreclosure delays and changes in foreclosure prac tic es; changes in macroeconomic and U.S. real estate market conditions; difficulties inherent in adjusting the size of our operations to reflect changes in business levels; purchase opp ort unities for mortgage servicing rights and our success in winning bids; our substantial amount of indebtedness; the discontinuation of LIBOR; increases in loan delinquencies and defaults; failure to mo dif y, resell or refinance early buyout loans; our reliance on PennyMac Mortgage Investment Trust (NYSE: PMT) as a significant source of financing for, and revenue related to, our mortgage banking bus iness; maintaining sufficient capital and liquidity and compliance with financial covenants; our obligation to indemnify third - party purchasers or repurchase loans if loans that we originate, acq uire, service or assist in the fulfillment of, fail to meet certain criteria or characteristics or under other circumstances; our obligation to indemnify PMT if our services fail to meet certain criteria o r c haracteristics or under other circumstances; decreases in the returns on the assets that we select and manage for our clients, and our resulting management and incentive fees; the extensive amount o f r egulation applicable to our investment management segment; conflicts of interest in allocating our services and investment opportunities among us and our advised entities; the effect o f p ublic opinion on our reputation; our ability to effectively identify, manage and hedge our credit, interest rate, prepayment, liquidity and climate risks; our initiation or expansion of new business act ivi ties or strategies; our ability to detect misconduct and fraud; our ability to mitigate cybersecurity risks and cyber incidents; our ability to pay dividends to our stockholders; and our organizational st ruc ture and certain requirements in our charter documents. You should not place undue reliance on any forward - looking statement and should consider all of the uncertainties and risks described above, as well as those more fully discussed in reports and other documents filed by the Company with the Securities and Exchange Commission from time to time. The Company undertakes no obligation to p ubl icly update or revise any forward - looking statements or any other information contained herein, and the statements made in this presentation are current as of the date of this presentat ion only. This presentation contains financial information calculated other than in accordance with U.S. generally accepted accounting pri nciples (“GAAP”), such as pretax income excluding valuation - related items that provide a meaningful perspective on the Company’s business results since the Company utilizes this information to eva luate and manage the business. Non - GAAP disclosure has limitations as an analytical tool and should not be viewed as a substitute for financial information determined in accordance wi th GAAP. FORWARD - LOOKING STATEMENTS
SECOND QUARTER HIGHLIGHTS 3 3 PRODUCTION INVESTMENT MANAGEMENT Net income $129mm 2Q22 Results Diluted EPS (1) $2.28 Return on equity 15% Book value per share $65.38 Capital Return Shares repurchased 2.4mm Dividend per common share $0.20 Pretax income $10mm $4.3bn Government correspondent lock volume $11.3bn Broker direct lock volume $2.2bn $26.7bn Pretax income $0.2mm Assets under management $2.1bn Revenue $9.7mm Note: All figures are for 2Q22 or as of 6/30/22 (1) EPS = earnings per share. MSR = mortgage servicing rights. UPB = unpaid principal balance (2) Includes volume fulfilled or subserviced for PennyMac Mortgage Investment Trust (NYSE: PMT) (3) Excludes $233.8 million in MSR fair value gains, $176.0 million in hedging losses and a $21.5 million reversal related to pro vi sions for losses on active loans. See slide 13 for additional details. SERVICING Pretax income $168mm MSR (1) fair value changes and hedging results $58mm Pretax income excluding valuation - related items (3) $88mm MSR fair value changes and hedging impact to EPS $0.75 Total servicing portfolio UPB (1)(2) $527bn Total loan acquisitions and originations (2) Consumer direct lock volume
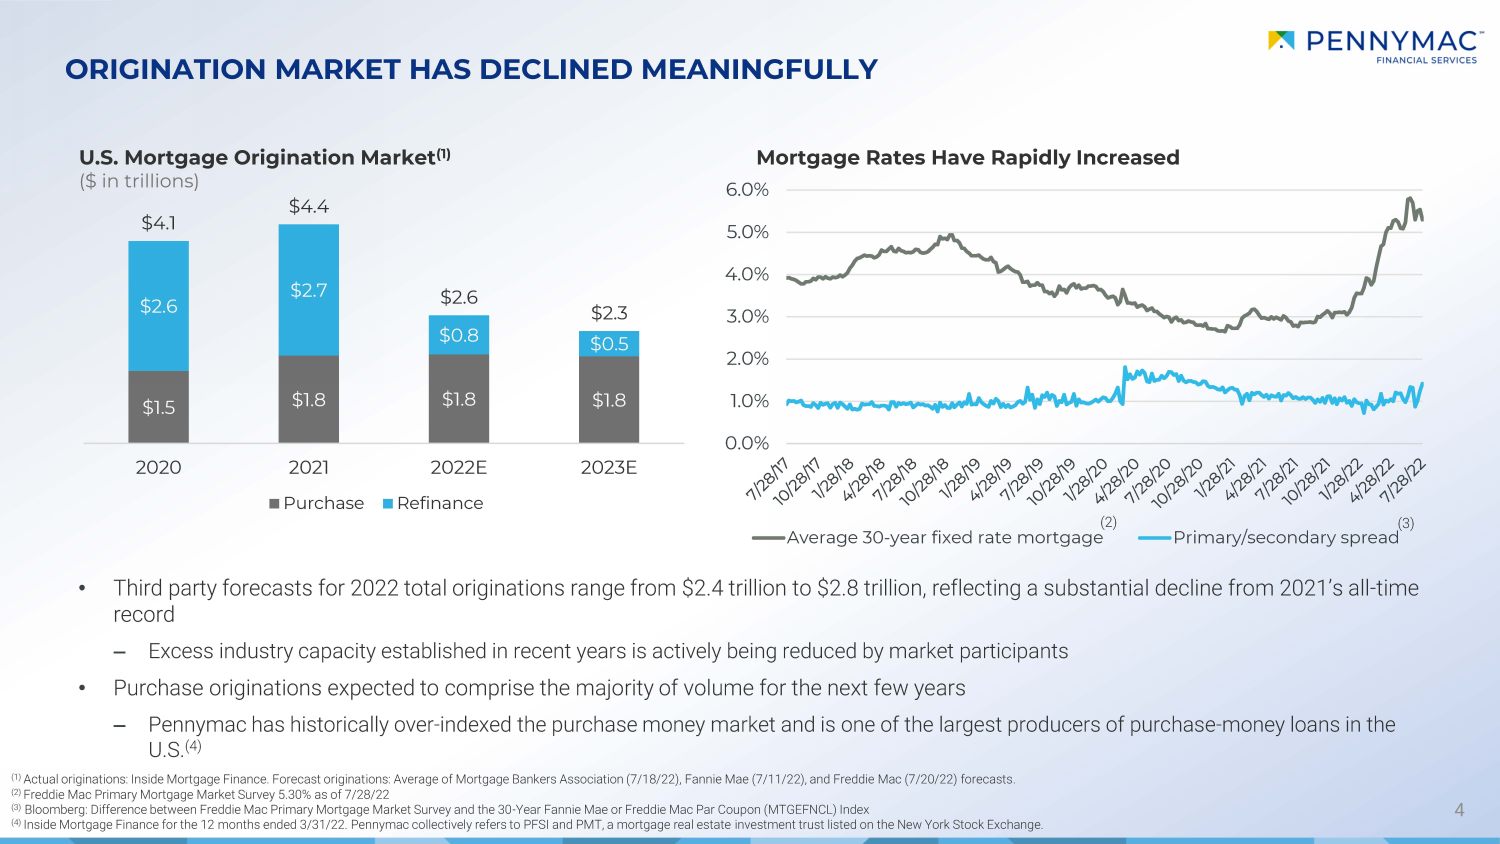
0.0% 1.0% 2.0% 3.0% 4.0% 5.0% 6.0% Average 30-year fixed rate mortgage Primary/secondary spread 4 ORIGINATION MARKET HAS DECLINED MEANINGFULLY U.S. Mortgage Origination Market (1) ($ in trillions) Mortgage Rates Have Rapidly Increased • Third party forecasts for 2022 total originations range from $2.4 trillion to $ 2.8 trillion, reflecting a substantial decline from 2021’s all - time record ‒ Excess industry capacity established in recent years is actively being reduced by market participants • Purchase originations expected to comprise the majority of volume for the next few years ‒ Pennymac has historically over - indexed the purchase money market and is one of the largest producers of purchase - money loans in the U.S. (4) (1) Actual originations: Inside Mortgage Finance. F orecast originations: Average of Mortgage Bankers Association ( 7 /18/22), Fannie Mae ( 7 /11/22), and Freddie Mac (7/20/22) forecasts . (2) Freddie Mac Primary Mortgage Market Survey 5.30 % as of 7/28/22 (3) Bloomberg: Difference between Freddie Mac Primary Mortgage Market Survey and the 30 - Year Fannie Mae or Freddie Mac Par Coupon ( MTGEFNCL) Index (4) Inside Mortgage Finance for the 12 months ended 3/31/22. Pennymac collectively refers to PFSI and PMT, a mortgage real estate in vestment trust listed on the New York Stock Exchange. (2) (3) $1.5 $1.8 $1.8 $1.8 $2.6 $2.7 $0.8 $0.5 $4.1 $4.4 $2.6 $2.3 2020 2021 2022E 2023E Purchase Refinance
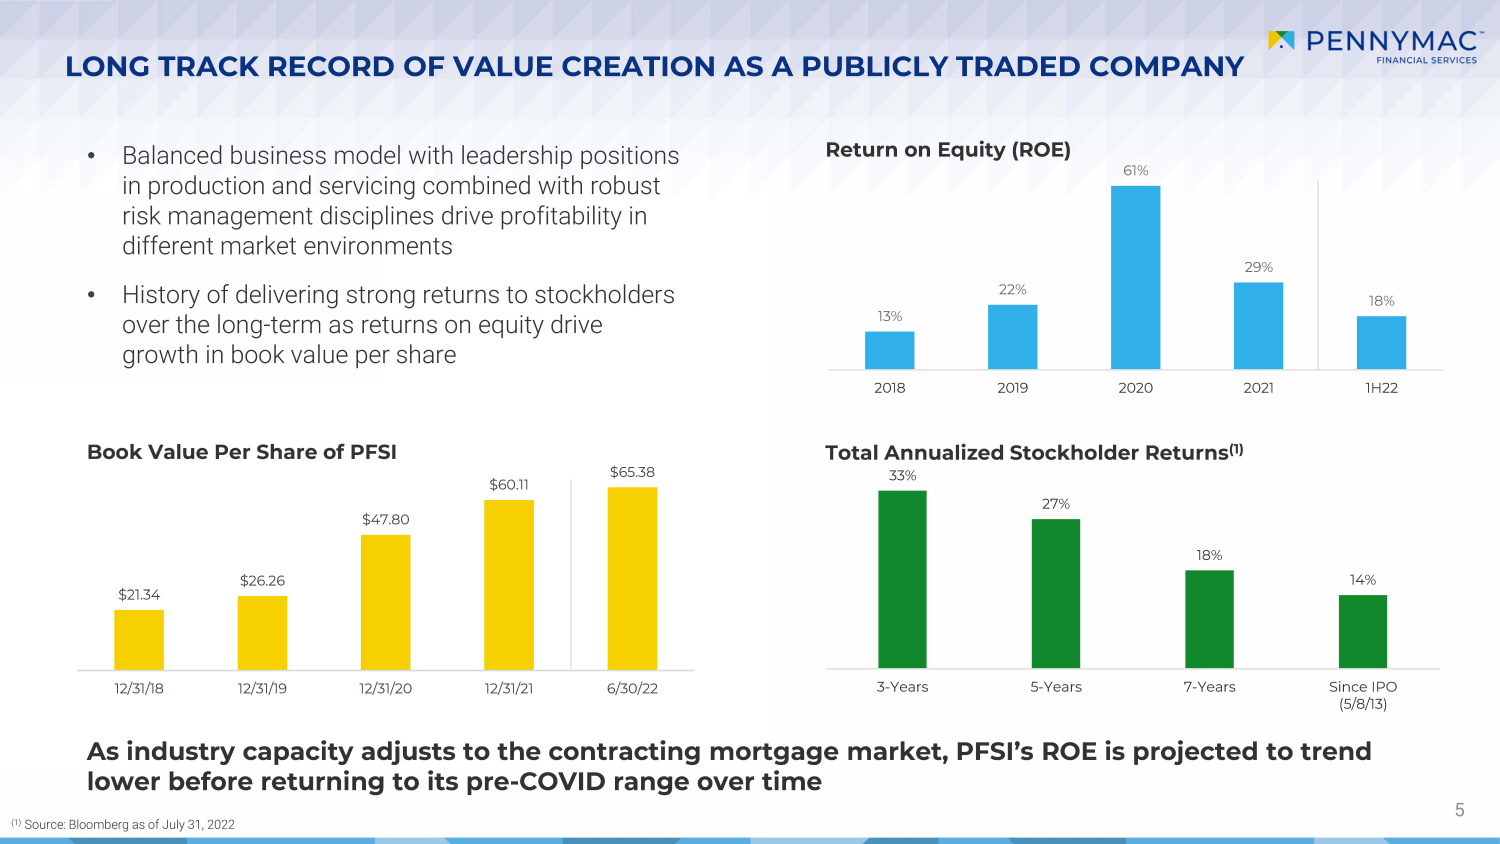
13% 22% 61% 29% 18% 2018 2019 2020 2021 1H22 $21.34 $26.26 $47.80 $60.11 $65.38 12/31/18 12/31/19 12/31/20 12/31/21 6/30/22 5 LONG TRACK RECORD OF VALUE CREATION AS A PUBLICLY TRADED COMPANY Book Value Per Share of PFSI Return on Equity (ROE) • Balanced business model with leadership positions in production and servicing combined with robust risk management disciplines drive profitability in different market environments • History of delivering strong returns to stockholders over the long - term as returns on equity drive growth in book value per share As industry capacity adjusts to the contracting mortgage market, PFSI’s ROE is projected to trend lower before returning to its pre - COVID range over time Total Annualized Stockholder Returns (1) (1) Source: Bloomberg as of July 31, 2022 33% 27% 18% 14% 3-Years 5-Years 7-Years Since IPO (5/8/13)
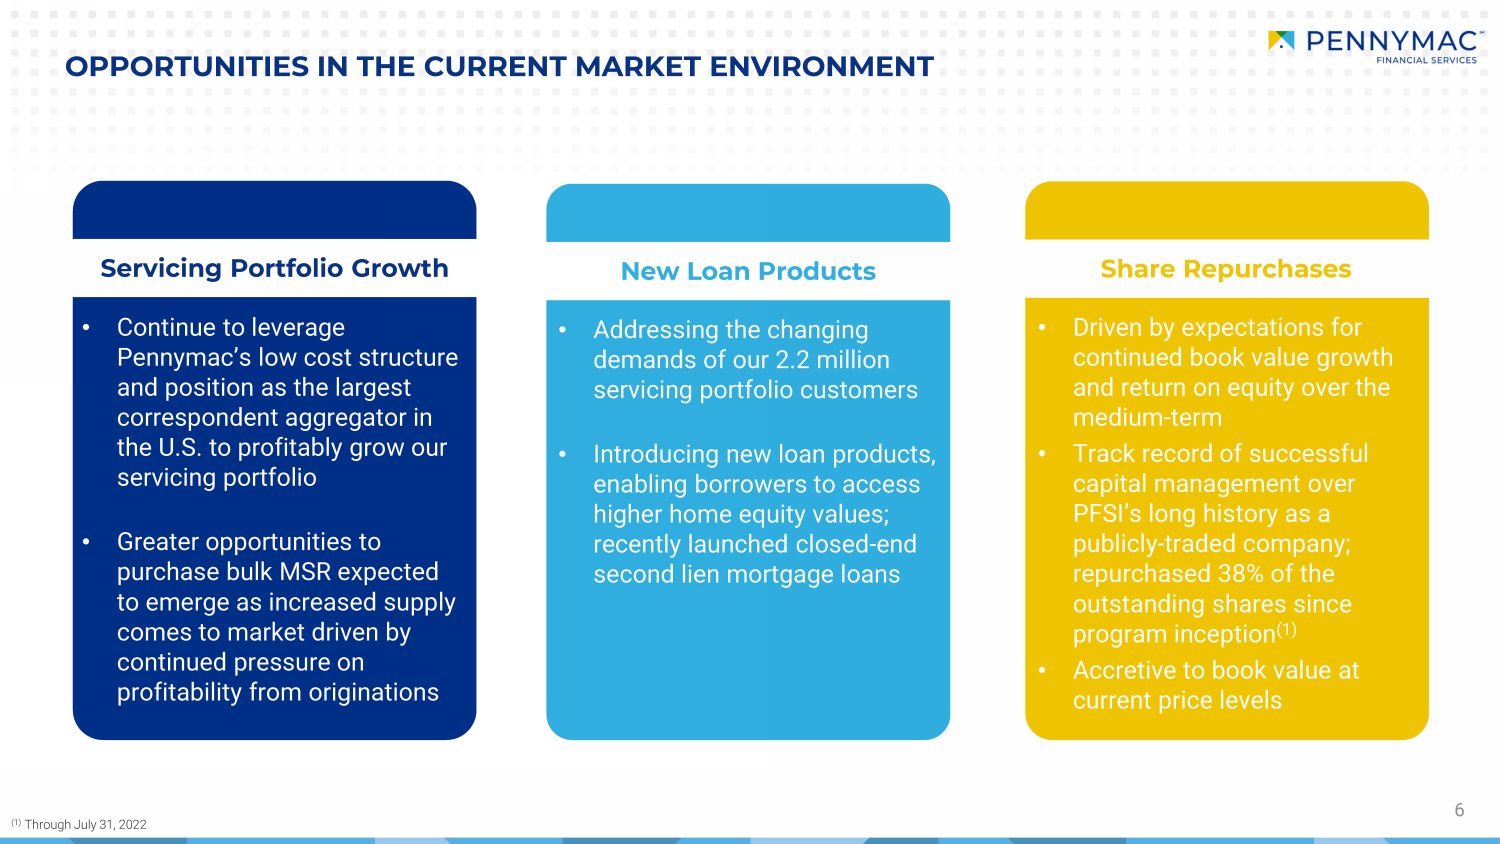
6 OPPORTUNITIES IN THE CURRENT MARKET ENVIRONMENT Servicing Portfolio Growth Share Repurchases New Loan Products • Continue to leverage Pennymac’s low cost structure and position as the largest correspondent aggregator in the U.S. to profitably grow our servicing portfolio • Greater opportunities to purchase bulk MSR expected to emerge as increased supply comes to market driven by continued pressure on profitability from originations • Driven by expectations for continued book value growth and return on equity over the medium - term • Track record of successful capital management over PFSI’s long history as a publicly - traded company; repurchased 38% of the outstanding shares since program inception (1) • Accretive to book value at current price levels • Addressing the changing demands of our 2.2 million servicing portfolio customers • Introducing new loan products, enabling borrowers to access higher home equity values; recently launched closed - end second lien mortgage loans (1) Through July 31, 2022
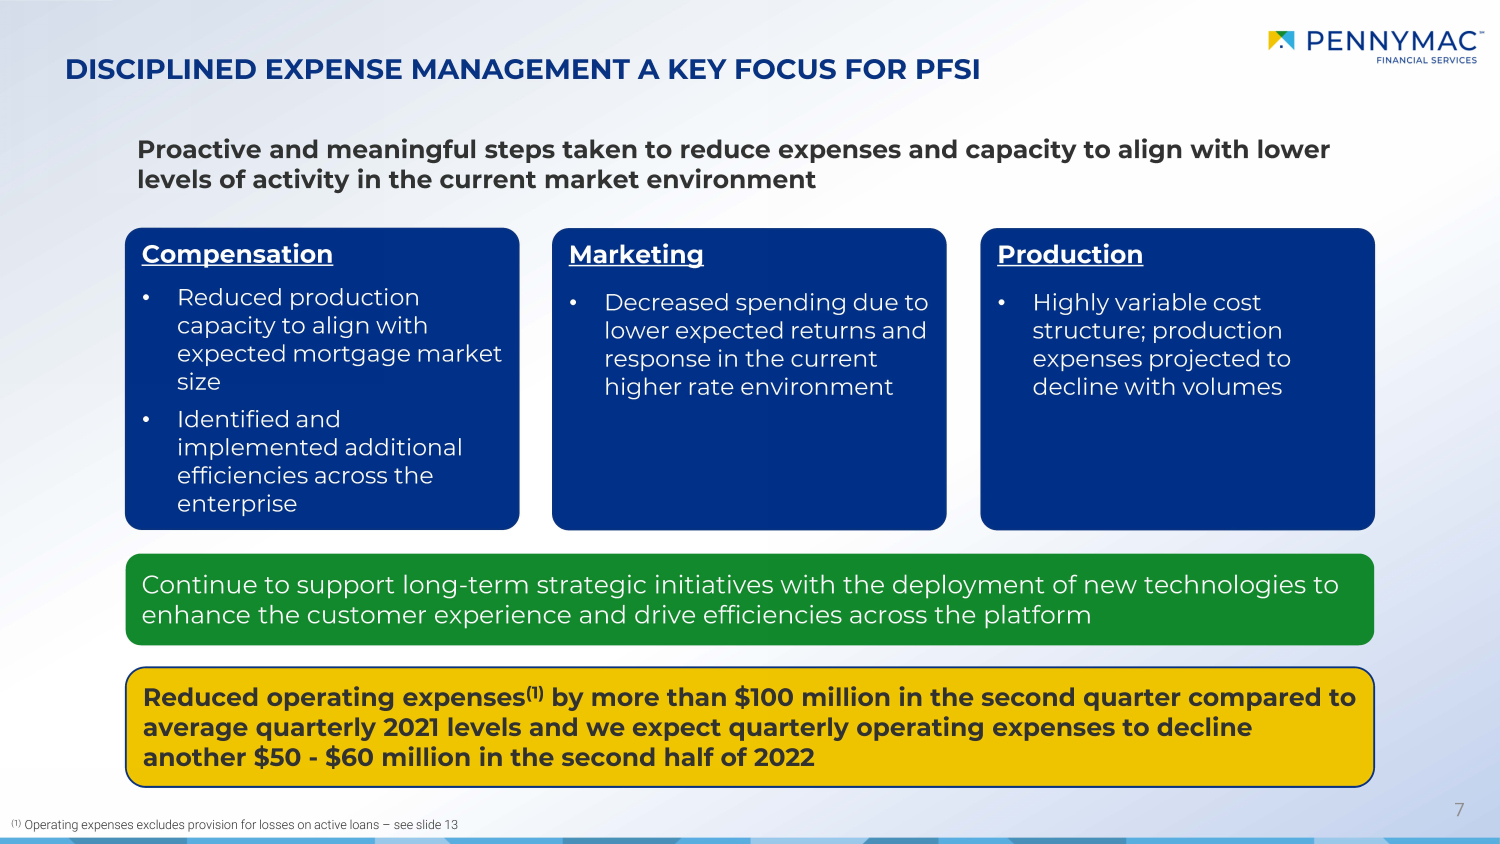
7 DISCIPLINED EXPENSE MANAGEMENT A KEY FOCUS FOR PFSI Compensation • Reduced production capacity to align with expected mortgage market size • Identified and implemented additional efficiencies across the enterprise Marketing • Decreased spending due to lower expected returns and response in the current higher rate environment Production • Highly variable cost structure; production expenses projected to decline with volumes Continue to support long - term strategic initiatives with the deployment of new technologies to enhance the customer experience and drive efficiencies across the platform (1) Operating expenses excludes provision for losses on active loans – see slide 13 Reduced operating expenses (1) by more than $100 million in the second quarter compared to average quarterly 2021 levels and we expect quarterly operating expenses to decline another $50 - $60 million in the second half of 2022 Proactive and meaningful steps taken to reduce expenses and capacity to align with lower levels of activity in the current market environment
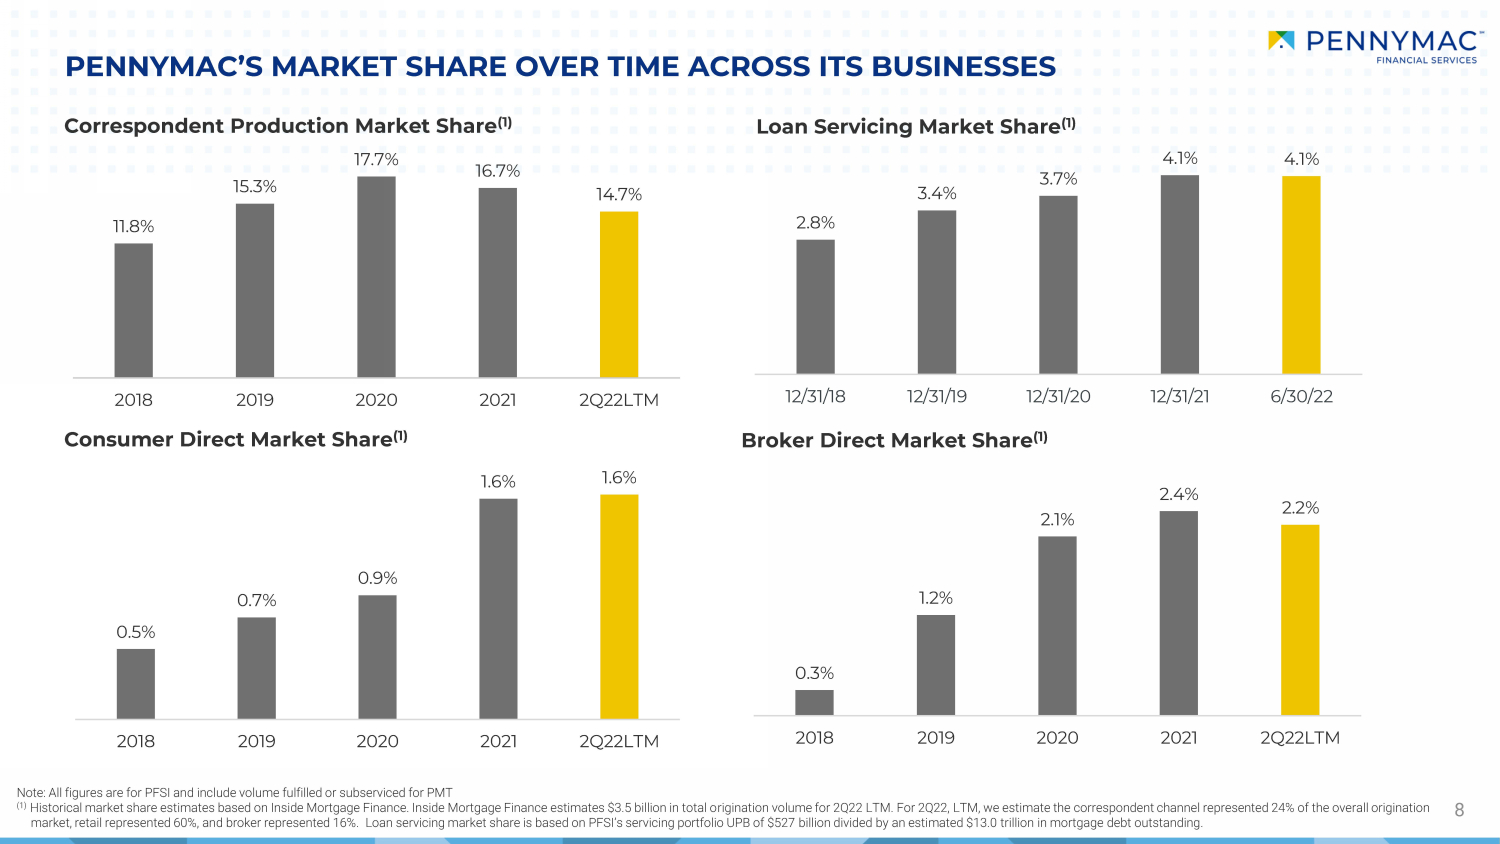
0.5% 0.7% 0.9% 1.6% 1.6% 2018 2019 2020 2021 2Q22LTM 0.3% 1.2% 2.1% 2.4% 2.2% 2018 2019 2020 2021 2Q22LTM 2.8% 3.4% 3.7% 4.1% 4.1% 12/31/18 12/31/19 12/31/20 12/31/21 6/30/22 PENNYMAC’S MARKET SHARE OVER TIME ACROSS ITS BUSINESSES 8 Loan Servicing Market Share (1) Correspondent Production Market Share (1) Consumer Direct Market Share (1) Broker Direct Market Share (1) Note: All figures are for PFSI and include volume fulfilled or subserviced for PMT (1) Historical market share estimates based on Inside Mortgage Finance. Inside Mortgage Finance estimates $3.5 billion in total o ri gination volume for 2Q22 LTM. For 2Q22, LTM, we estimate the correspondent channel represented 24% of the overall origination market, retail represented 60%, and broker represented 16%. Loan servicing market share is based on PFSI’s servicing portfolio UPB of $527 billion divided by an estimated $13.0 trillion in mortgage debt outstanding. 11.8% 15.3% 17.7% 16.7% 14.7% 2018 2019 2020 2021 2Q22LTM
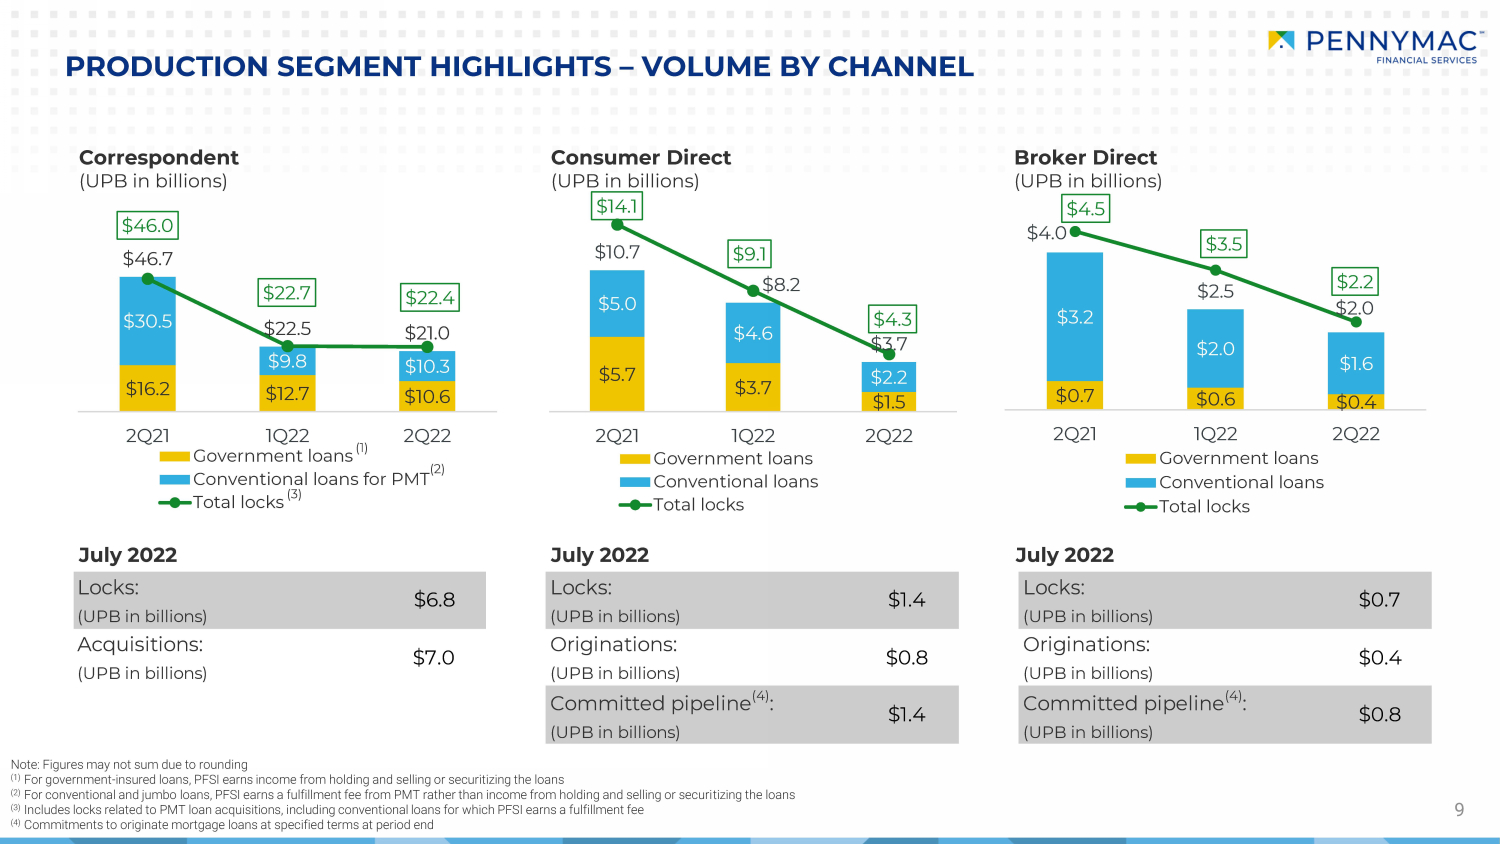
$5.7 $3.7 $1.5 $5.0 $4.6 $2.2 $10.7 $8.2 $3.7 $14.1 $9.1 $4.3 2Q21 1Q22 2Q22 Government loans Conventional loans Total locks $16.2 $12.7 $10.6 $30.5 $9.8 $10.3 $46.7 $22.5 $21.0 $46.0 $22.7 $22.4 2Q21 1Q22 2Q22 Government loans Conventional loans for PMT Total locks PRODUCTION SEGMENT HIGHLIGHTS – VOLUME BY CHANNEL 9 Consumer Direct (UPB in billions) Broker Direct (UPB in billions) July 2022 July 2022 July 2022 Note: Figures may not sum due to rounding (1) For government - insured loans, PFSI earns income from holding and selling or securitizing the loans (2) For conventional and jumbo loans, PFSI earns a fulfillment fee from PMT rather than income from holding and selling or securi ti zing the loans (3) Includes locks related to PMT loan acquisitions, including conventional loans for which PFSI earns a fulfillment fee (4) Commitments to originate mortgage loans at specified terms at period end (1) (2) (3) Correspondent (UPB in billions) $0.7 $0.6 $0.4 $3.2 $2.0 $1.6 $4.0 $2.5 $2.0 $4.5 $3.5 $2.2 2Q21 1Q22 2Q22 Government loans Conventional loans Total locks Locks: (UPB in billions) $6.8 Locks: (UPB in billions) $1.4 Locks: (UPB in billions) $0.7 Acquisitions: (UPB in billions) $7.0 Originations: (UPB in billions) $0.8 Originations: (UPB in billions) $0.4 Committed pipeline (4) : (UPB in billions) $1.4 Committed pipeline (4) : (UPB in billions) $0.8
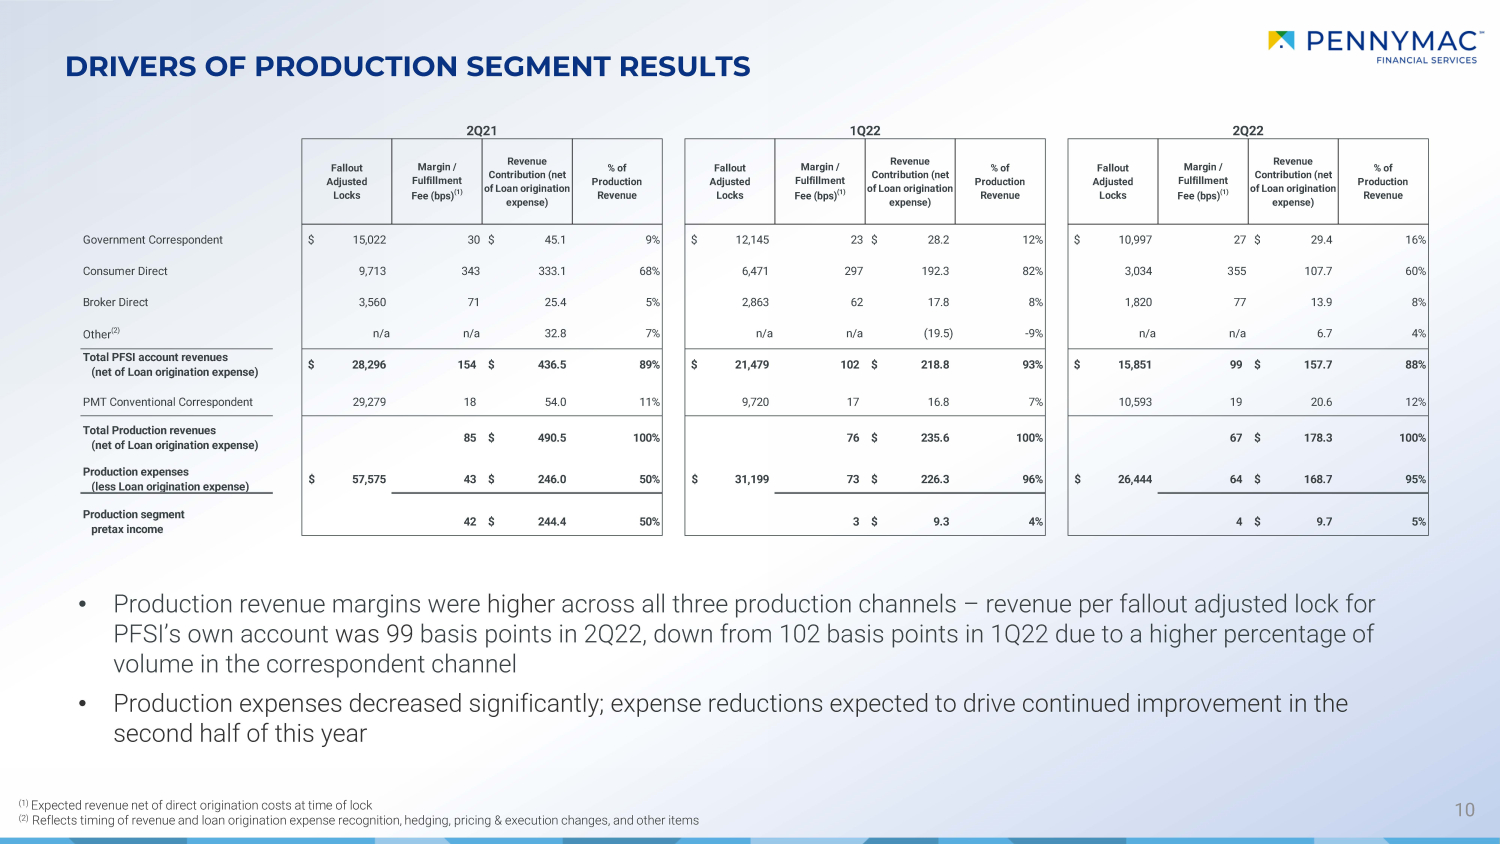
10 (1) Expected revenue net of direct origination costs at time of lock (2) Reflects timing of revenue and loan origination expense recognition, hedging, pricing & execution changes, and other items DRIVERS OF PRODUCTION SEGMENT RESULTS • Production revenue margins were higher across all three production channels – revenue per fallout adjusted lock for PFSI’s own account was 99 basis points in 2Q22, down from 102 basis points in 1Q22 due to a higher percentage of volume in the correspondent channel • Production expenses decreased significantly; expense reductions expected to drive continued improvement in the second half of this year Fallout Adjusted Locks Margin / Fulfillment Fee (bps) (1) Revenue Contribution (net of Loan origination expense) % of Production Revenue Fallout Adjusted Locks Margin / Fulfillment Fee (bps) (1) Revenue Contribution (net of Loan origination expense) % of Production Revenue Fallout Adjusted Locks Margin / Fulfillment Fee (bps) (1) Revenue Contribution (net of Loan origination expense) % of Production Revenue Government Correspondent 15,022$ 30 45.1$ 9% 12,145$ 23 28.2$ 12% 10,997$ 27 29.4$ 16% Consumer Direct 9,713 343 333.1 68% 6,471 297 192.3 82% 3,034 355 107.7 60% Broker Direct 3,560 71 25.4 5% 2,863 62 17.8 8% 1,820 77 13.9 8% Other (2) n/a n/a 32.8 7% n/a n/a (19.5) -9% n/a n/a 6.7 4% Total PFSI account revenues (net of Loan origination expense) 28,296$ 154 436.5$ 89% 21,479$ 102 218.8$ 93% 15,851$ 99 157.7$ 88% PMT Conventional Correspondent 29,279 18 54.0 11% 9,720 17 16.8 7% 10,593 19 20.6 12% Total Production revenues (net of Loan origination expense) 85 490.5$ 100% 76 235.6$ 100% 67 178.3$ 100% Production expenses (less Loan origination expense) 43 246.0$ 50% 73 226.3$ 96% 64 168.7$ 95% Production segment pretax income 42 244.4$ 50% 3 9.3$ 4% 4 9.7$ 5% 2Q21 57,575$ 1Q22 31,199$ 2Q22 26,444$
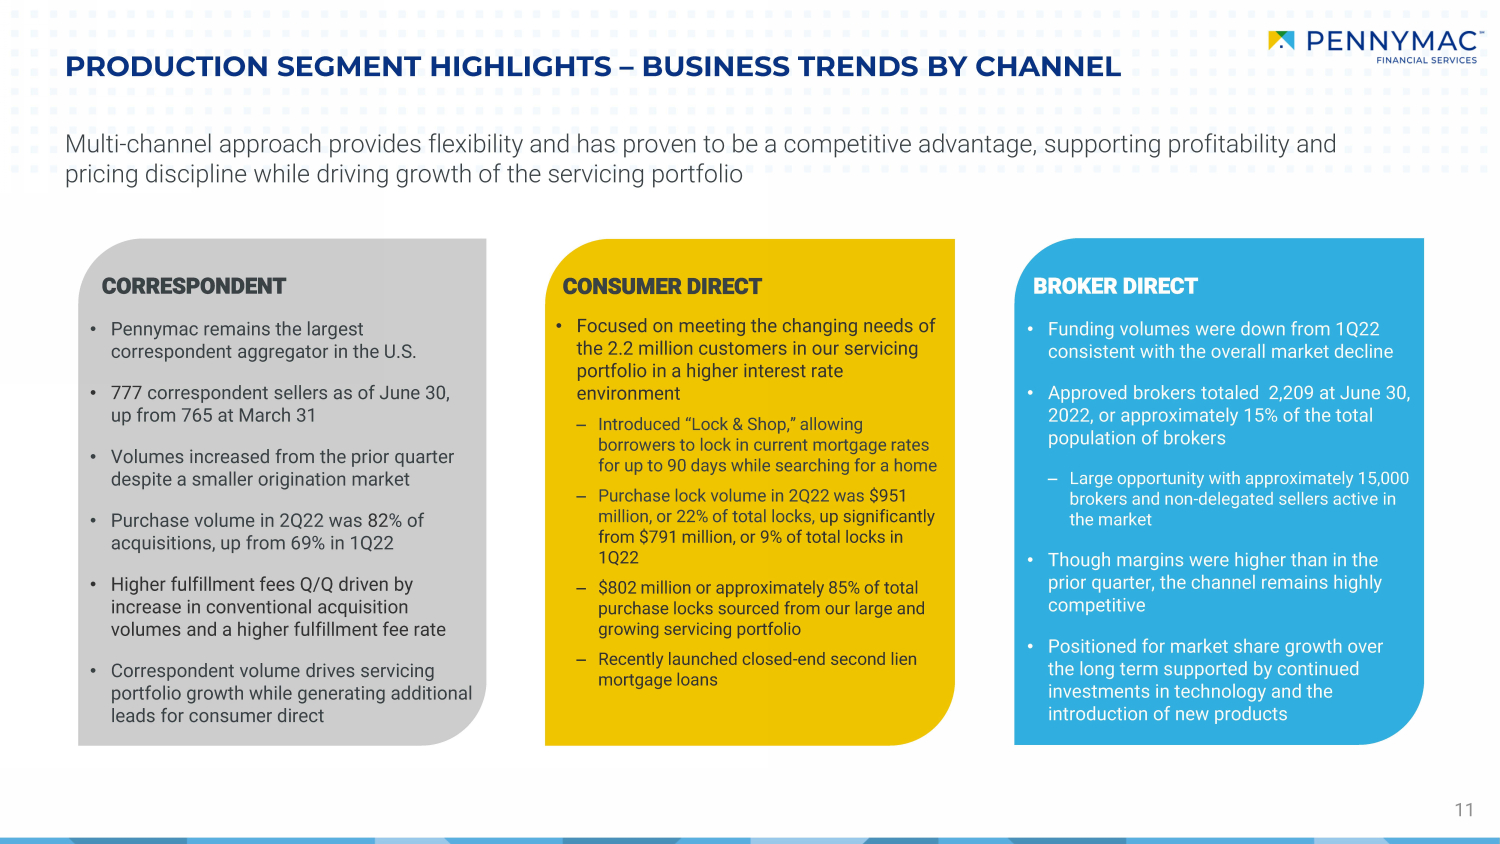
PRODUCTION SEGMENT HIGHLIGHTS – BUSINESS TRENDS BY CHANNEL 11 • Pennymac remains the largest correspondent aggregator in the U.S. • 777 correspondent sellers as of June 30, up from 765 at March 31 • Volumes increased from the prior quarter despite a smaller origination market • Purchase volume in 2Q22 was 82 % of acquisitions, up from 69% in 1Q22 • Higher fulfillment fees Q/Q driven by increase in conventional acquisition volumes and a higher fulfillment fee rate • Correspondent volume drives servicing portfolio growth while generating additional leads for consumer direct • Focused on meeting the changing needs of the 2.2 million customers in our servicing portfolio in a higher interest rate environment ‒ Introduced “Lock & Shop,” allowing borrowers to lock in current mortgage rates for up to 90 days while searching for a home ‒ Purchase lock volume in 2Q22 was $951 million, or 22% of total locks, up significantly from $791 million, or 9% of total locks in 1Q22 ‒ $802 million or approximately 85% of total purchase locks sourced from our large and growing servicing portfolio ‒ Recently launched closed - end second lien mortgage loans • Funding volumes were down from 1Q22 consistent with the overall market decline • Approved brokers totaled 2,209 at June 30, 2022, or approximately 15% of the total population of brokers ‒ Large opportunity with approximately 15,000 brokers and non - delegated sellers active in the market • Though margins were higher than in the prior quarter, the channel remains highly competitive • Positioned for market share growth over the long term supported by continued investments in technology and the introduction of new products CORRESPONDENT CONSUMER DIRECT BROKER DIRECT Multi - channel approach provides flexibility and has proven to be a competitive advantage, supporting profitability and pricing discipline while driving growth of the servicing portfolio
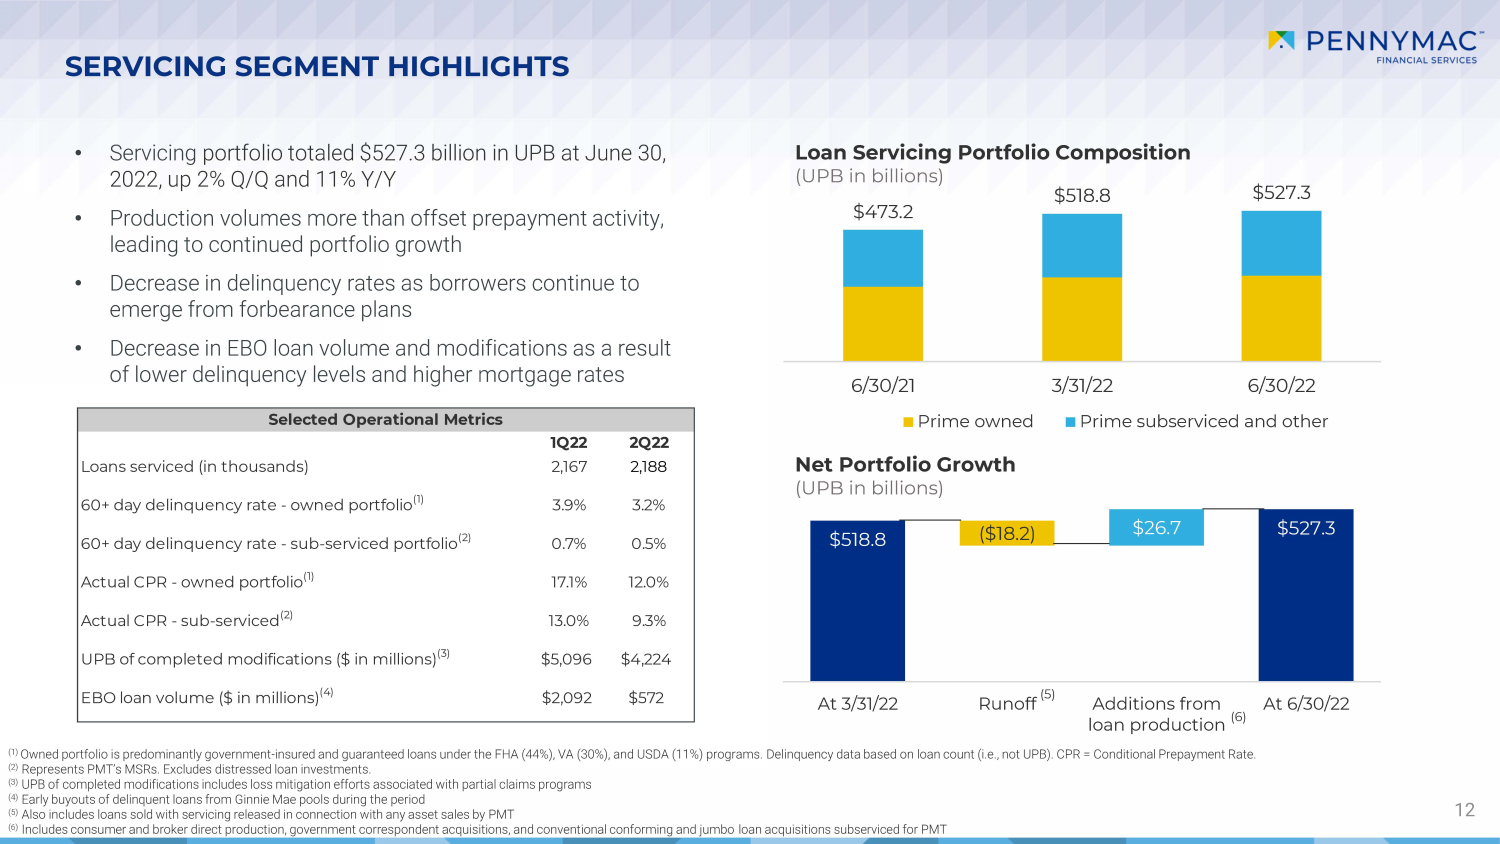
$518.8 $527.3 ($18.2) $26.7 At 3/31/22 Runoff Additions from loan production At 6/30/22 SERVICING SEGMENT HIGHLIGHTS 12 • Servicing portfolio totaled $527.3 billion in UPB at June 30, 2022, up 2% Q/Q and 11% Y/Y • Production volumes more than offset prepayment activity, leading to continued portfolio growth • Decrease in delinquency rates as borrowers continue to emerge from forbearance plans • Decrease in EBO loan volume and modifications as a result of lower delinquency levels and higher mortgage rates Loan Servicing Portfolio Composition (UPB in billions) Net Portfolio Growth (UPB in billions) (1) Owned portfolio is predominantly government - insured and guaranteed loans under the FHA (44%), VA (30%), and USDA (11%) programs. Delinquency data based on loan count (i.e., not UPB). CPR = Conditional Prepayment Rate. (2) Represents PMT’s MSRs. Excludes distressed loan investments. (3) UPB of completed modifications includes loss mitigation efforts associated with partial claims programs (4) Early buyouts of delinquent loans from Ginnie Mae pools during the period (5) Also includes loans sold with servicing released in connection with any asset sales by PMT (6) Includes consumer and broker direct production, government correspondent acquisitions, and conventional conforming and jumbo lo an acquisitions subserviced for PMT (5) (6) $473.2 $518.8 $527.3 6/30/21 3/31/22 6/30/22 Prime owned Prime subserviced and other 1Q22 2Q22 Loans serviced (in thousands) 2,167 2,188 60+ day delinquency rate - owned portfolio (1) 3.9% 3.2% 60+ day delinquency rate - sub-serviced portfolio (2) 0.7% 0.5% Actual CPR - owned portfolio (1) 17.1% 12.0% Actual CPR - sub-serviced (2) 13.0% 9.3% UPB of completed modifications ($ in millions) (3) $5,096 $4,224 EBO loan volume ($ in millions) (4) $2,092 $572 Selected Operational Metrics
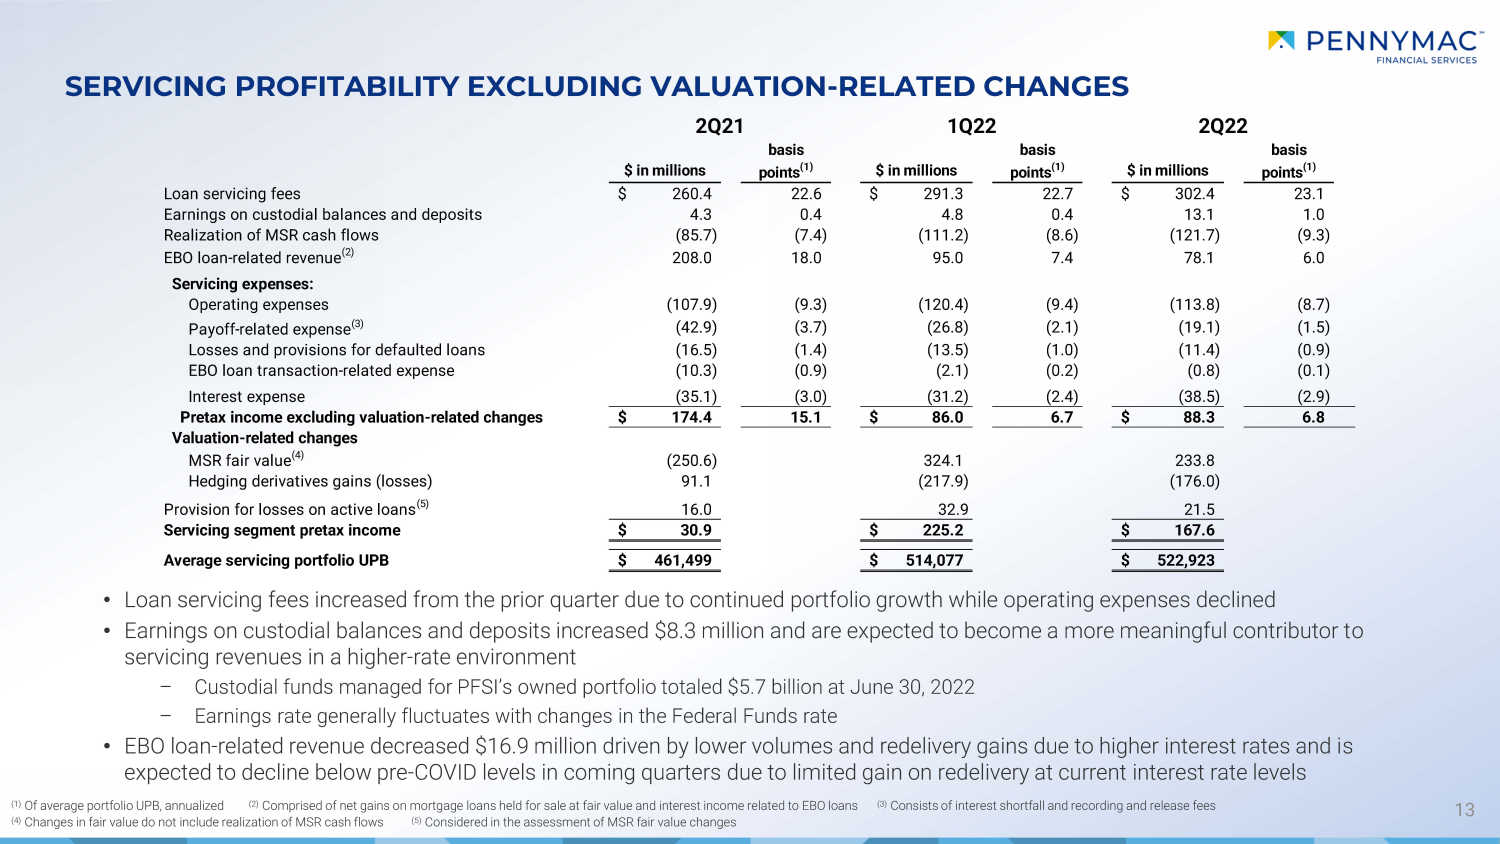
SERVICING PROFITABILITY EXCLUDING VALUATION - RELATED CHANGES 13 (1) Of average portfolio UPB, annualized (2) Comprised of net gains on mortgage loans held for sale at fair value and interest income related to EBO loans (3) Consists of interest shortfall and recording and release fees (4) Changes in fair value do not include realization of MSR cash flows (5) Considered in the assessment of MSR fair value changes • Loan servicing fees increased from the prior quarter due to continued portfolio growth while operating expenses declined • Earnings on custodial balances and deposits increased $8.3 million and are expected to become a more meaningful contributor t o servicing revenues in a higher - rate environment – Custodial funds managed for PFSI’s owned portfolio totaled $5.7 billion at June 30, 2022 – Earnings rate generally fluctuates with changes in the Federal Funds rate • EBO loan - related revenue decreased $16.9 million driven by lower volumes and redelivery gains due to higher interest rates and i s expected to decline below pre - COVID levels in coming quarters due to limited gain on redelivery at current interest rate levels $ in millions basis points (1) $ in millions basis points (1) $ in millions basis points (1) Loan servicing fees 260.4$ 22.6 291.3$ 22.7 302.4$ 23.1 Earnings on custodial balances and deposits 4.3 0.4 4.8 0.4 13.1 1.0 Realization of MSR cash flows (85.7) (7.4) (111.2) (8.6) (121.7) (9.3) EBO loan-related revenue (2) 208.0 18.0 95.0 7.4 78.1 6.0 Servicing expenses: Operating expenses (107.9) (9.3) (120.4) (9.4) (113.8) (8.7) Payoff-related expense (3) (42.9) (3.7) (26.8) (2.1) (19.1) (1.5) Losses and provisions for defaulted loans (16.5) (1.4) (13.5) (1.0) (11.4) (0.9) EBO loan transaction-related expense (10.3) (0.9) (2.1) (0.2) (0.8) (0.1) Interest expense (35.1) (3.0) (31.2) (2.4) (38.5) (2.9) Pretax income excluding valuation-related changes 174.4$ 15.1 86.0$ 6.7 88.3$ 6.8 Valuation-related changes MSR fair value (4) (250.6) 324.1 233.8 Hedging derivatives gains (losses) 91.1 (217.9) (176.0) Provision for losses on active loans (5) 16.0 32.9 21.5 Servicing segment pretax income 30.9$ 225.2$ 167.6$ Average servicing portfolio UPB 461,499$ 514,077$ 522,923$ 2Q222Q21 1Q22
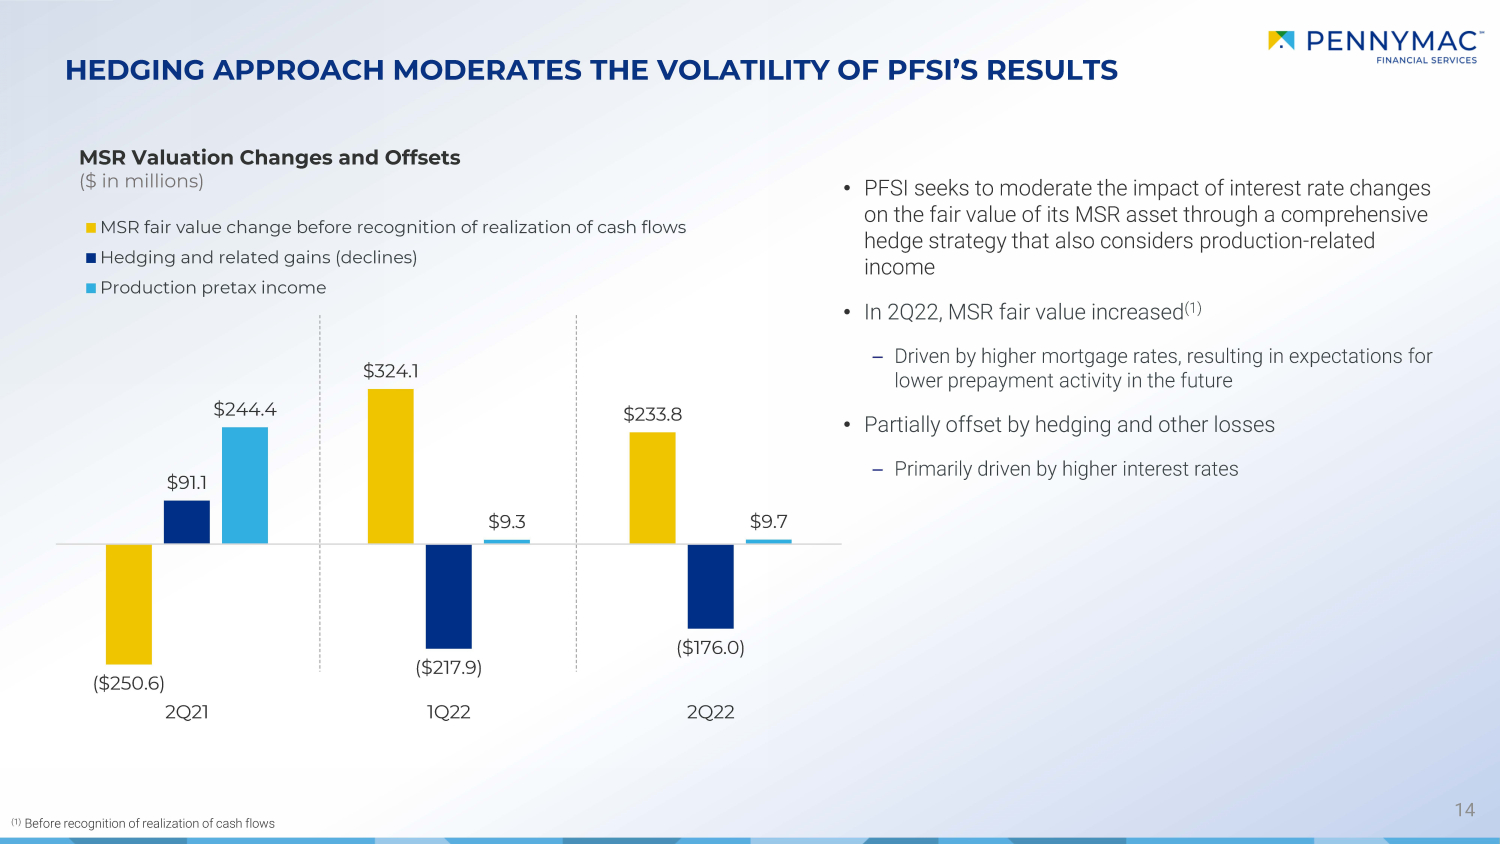
14 HEDGING APPROACH MODERATES THE VOLATILITY OF PFSI’S RESULTS MSR Valuation Changes and Offsets ($ in millions) • PFSI seeks to moderate the impact of interest rate changes on the fair value of its MSR asset through a comprehensive hedge strategy that also considers production - related income • In 2Q22, MSR fair value increased (1) – Driven by higher mortgage rates, resulting in expectations for lower prepayment activity in the future • Partially offset by hedging and other losses – Primarily driven by higher interest rates (1) Before recognition of realization of cash flows ($250.6) $324.1 $233.8 $91.1 ($217.9) ($176.0) $244.4 $9.3 $9.7 2Q21 1Q22 2Q22 MSR fair value change before recognition of realization of cash flows Hedging and related gains (declines) Production pretax income
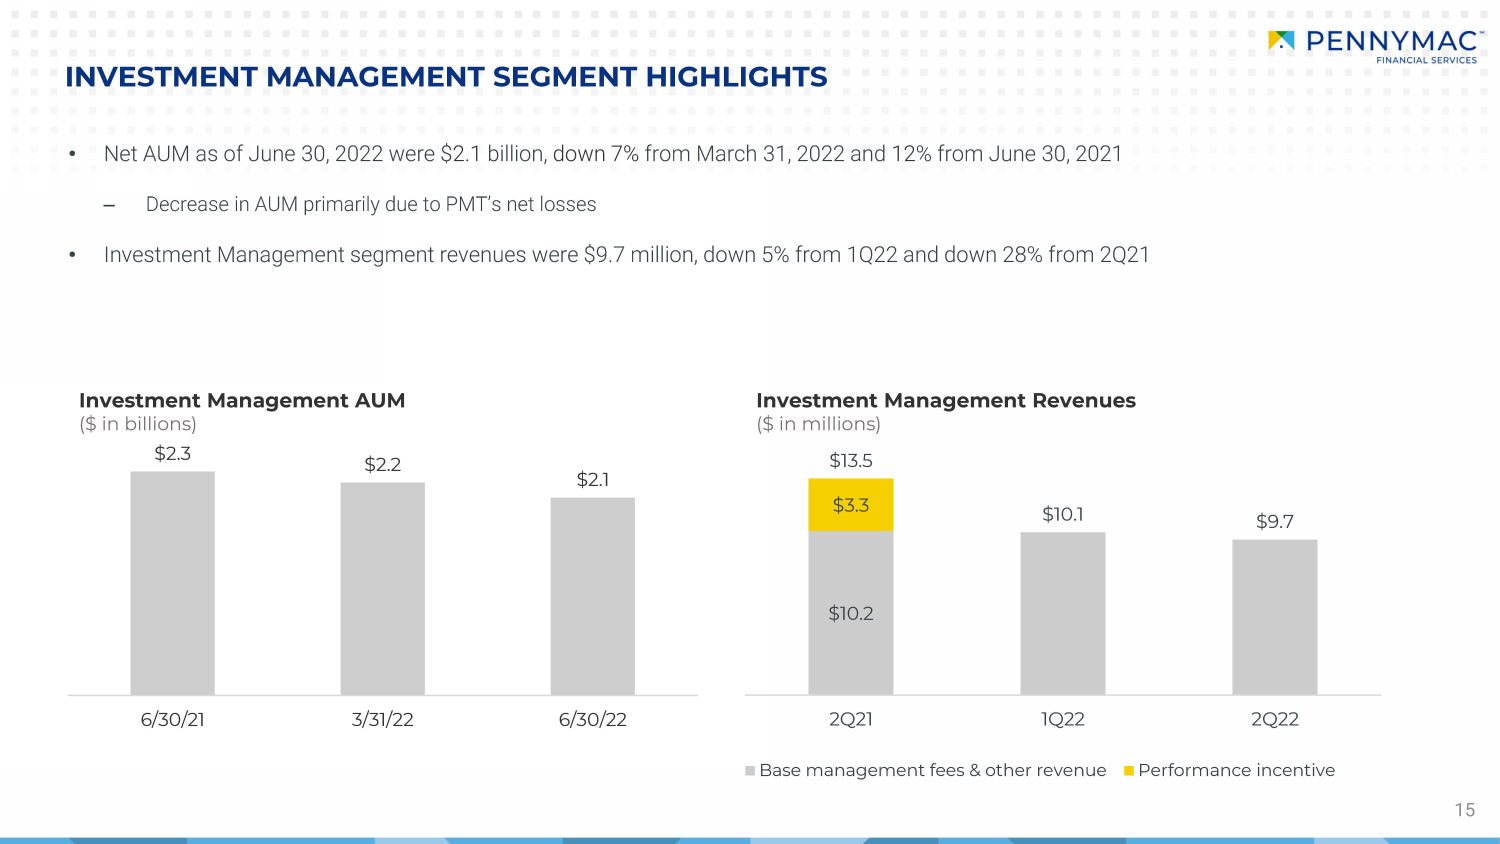
INVESTMENT MANAGEMENT SEGMENT HIGHLIGHTS 15 • Net AUM as of June 30, 2022 were $ 2.1 billion, down 7% from March 31, 2022 and 12 % from June 30, 2021 ‒ Decrease in AUM primarily due to PMT’s net losses • Investment Management segment revenues were $9.7 million, down 5% from 1Q22 and down 28% from 2Q21 Investment Management AUM ($ in billions) Investment Management Revenues ($ in millions) $2.3 $2.2 $2.1 6/30/21 3/31/22 6/30/22 $10.2 $3.3 $13.5 $10.1 $9.7 2Q21 1Q22 2Q22 Base management fees & other revenue Performance incentive
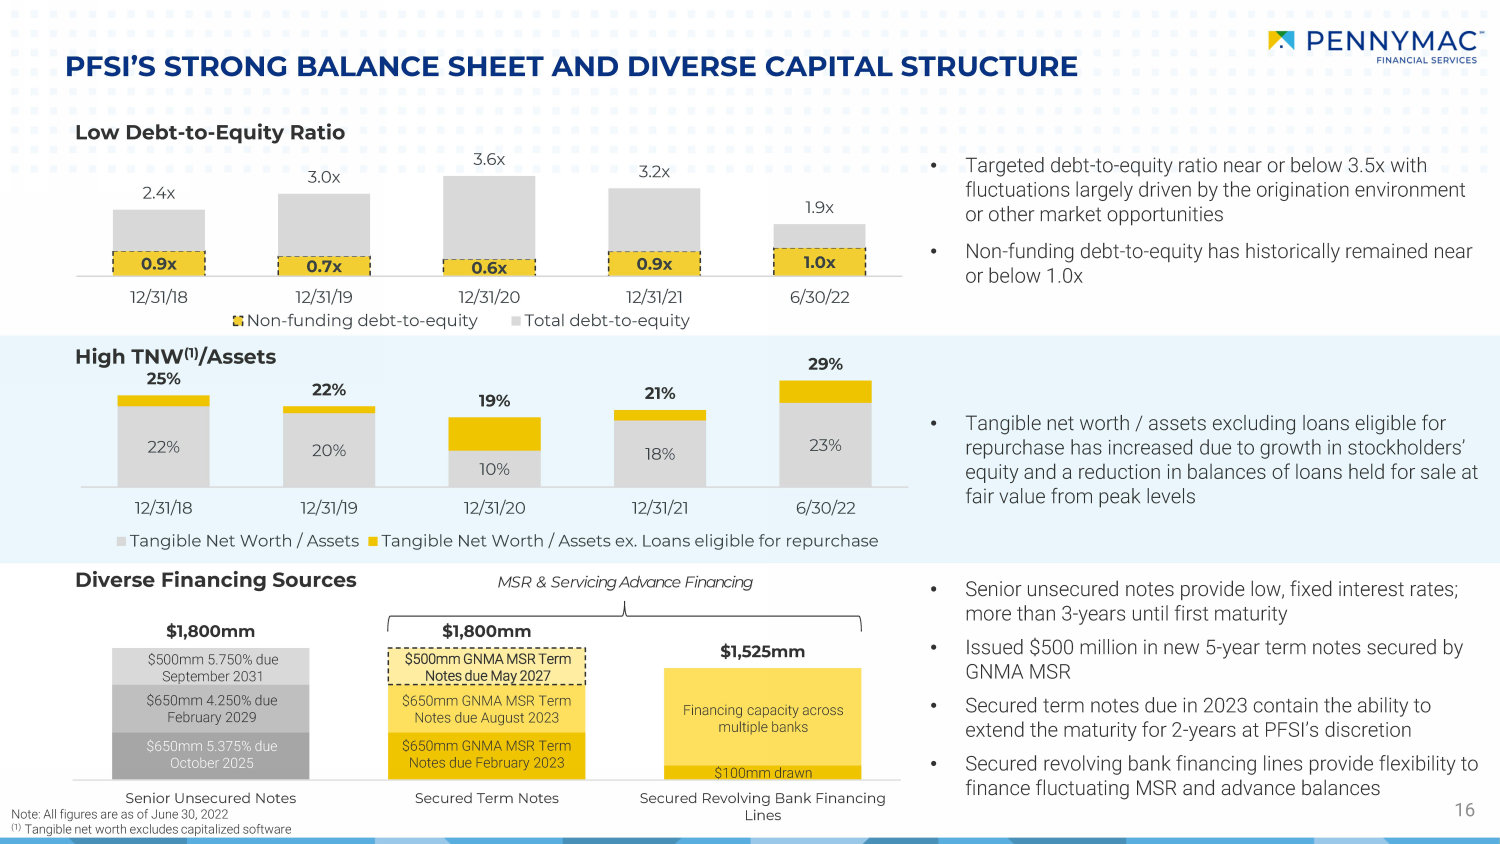
$1,800mm $1,800mm $1,525mm Senior Unsecured Notes Secured Term Notes Secured Revolving Bank Financing Lines 0.9x 0.7x 0.6x 0.9x 1.0x 2.4x 3.0x 3.6x 3.2x 1.9x 12/31/18 12/31/19 12/31/20 12/31/21 6/30/22 Non-funding debt-to-equity Total debt-to-equity 22% 20% 10% 18% 23% 25% 22% 19% 21% 29% 12/31/18 12/31/19 12/31/20 12/31/21 6/30/22 Tangible Net Worth / Assets Tangible Net Worth / Assets ex. Loans eligible for repurchase PFSI’S STRONG BALANCE SHEET AND DIVERSE CAPITAL STRUCTURE 16 Low Debt - to - Equity Ratio Diverse Financing Sources High TNW (1) /Assets • Tangible net worth / assets excluding loans eligible for repurchase has increased due to growth in stockholders’ equity and a reduction in balances of loans held for sale at fair value from peak levels $500mm GNMA MSR Term Notes due May 2027 $650mm GNMA MSR Term Notes due August 2023 $650mm GNMA MSR Term Notes due February 2023 $500mm 5.750% due September 2031 $650mm 4.250% due February 2029 $650mm 5.375% due October 2025 • Targeted debt - to - equity ratio near or below 3.5x with fluctuations largely driven by the origination environment or other market opportunities • Non - funding debt - to - equity has historically remained near or below 1.0x • Senior unsecured notes provide low, fixed interest rates; more than 3 - years until first maturity • Issued $500 million in new 5 - year term notes secured by GNMA MSR • Secured term notes due in 2023 contain the ability to extend the maturity for 2 - years at PFSI’s discretion • Secured revolving bank financing lines provide flexibility to finance fluctuating MSR and advance balances MSR & Servicing Advance Financing Financing capacity across multiple banks Note: All figures are as of June 30, 2022 (1) Tangible net worth excludes capitalized software $100mm drawn

APPENDIX
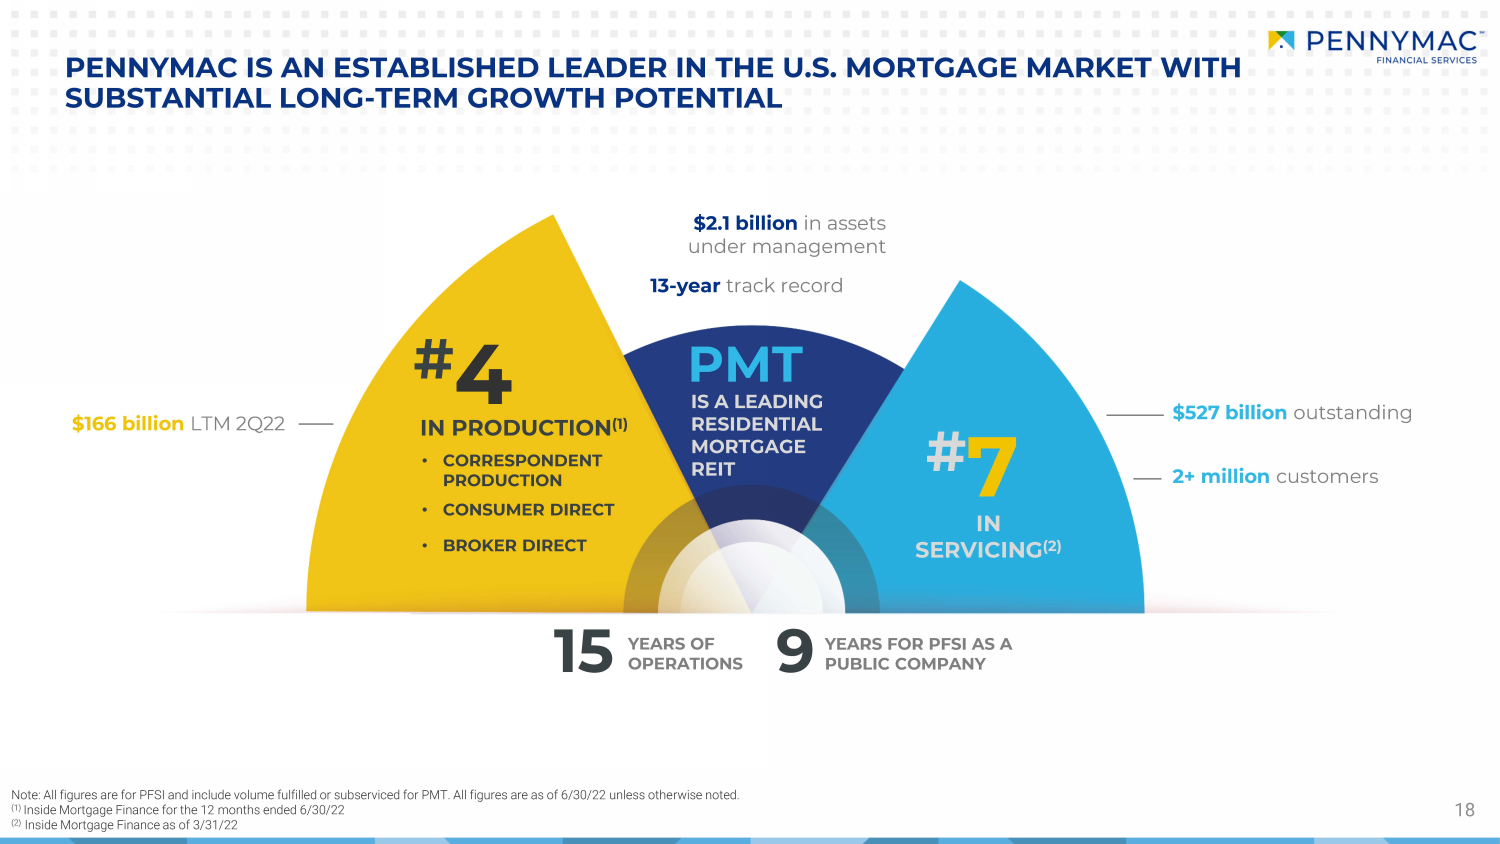
18 PENNYMAC IS AN ESTABLISHED LEADER IN THE U.S. MORTGAGE MARKET WITH SUBSTANTIAL LONG - TERM GROWTH POTENTIAL $527 billion outstanding IN SER VIC ING (2) YEARS FOR PFSI AS A PUBLIC COMPANY 9 15 YEARS OF OPERATIONS PMT # 4 • CORRESPONDENT PRODUCTION • CONSUMER DIRECT • BROKER DIRECT IN PRODUCTION (1) IS A LEADING RESIDENTIAL MORTGAGE REIT # 7 Note: All figures are for PFSI and include volume fulfilled or subserviced for PMT. All figures are as of 6/30/22 unless othe rwi se noted. (1) Inside Mortgage Finance for the 12 months ended 6/30/22 (2) Inside Mortgage Finance as of 3/31/22 $2.1 billion in assets under management 13 - year track record 2+ million customers $ 166 billion LTM 2Q22
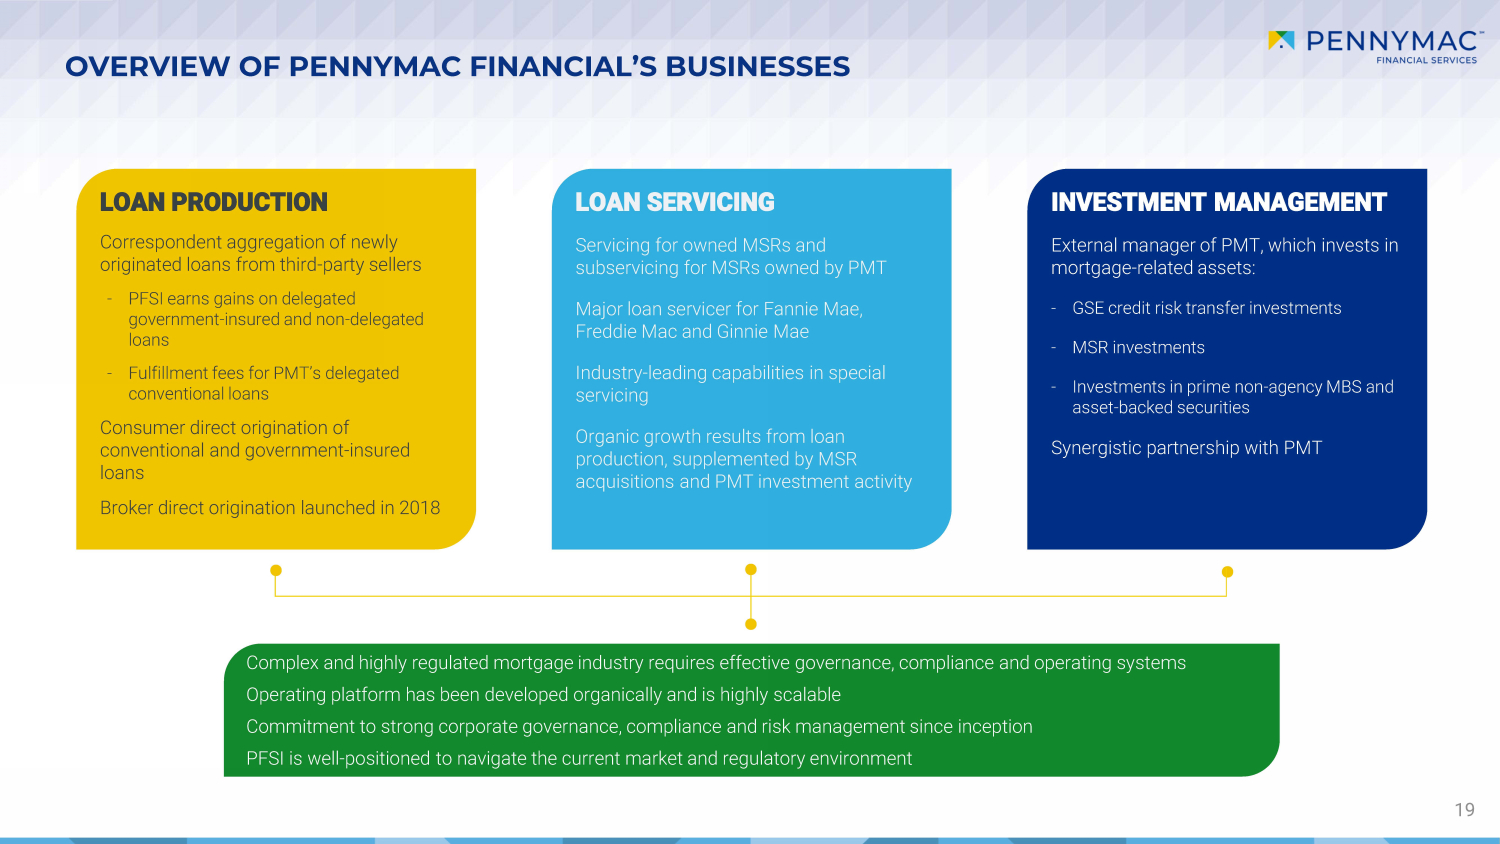
OVERVIEW OF PENNYMAC FINANCIAL’S BUSINESSES 19 LOAN PRODUCTION Correspondent aggregation of newly originated loans from third - party sellers - PFSI earns gains on delegated government - insured and non - delegated loans - Fulfillment fees for PMT’s delegated conventional loans Consumer direct origination of conventional and government - insured loans Broker direct origination launched in 2018 LOAN SERVICING Servicing for owned MSRs and subservicing for MSRs owned by PMT Major loan servicer for Fannie Mae, Freddie Mac and Ginnie Mae Industry - leading capabilities in special servicing Organic growth results from loan production, supplemented by MSR acquisitions and PMT investment activity INVESTMENT MANAGEMENT External manager of PMT, which invests in mortgage - related assets: - GSE credit risk transfer investments - MSR investments - Investments in prime non - agency MBS and asset - backed securities Synergistic partnership with PMT Complex and highly regulated mortgage industry requires effective governance, compliance and operating systems Operating platform has been developed organically and is highly scalable Commitment to strong corporate governance, compliance and risk management since inception PFSI is well - positioned to navigate the current market and regulatory environment
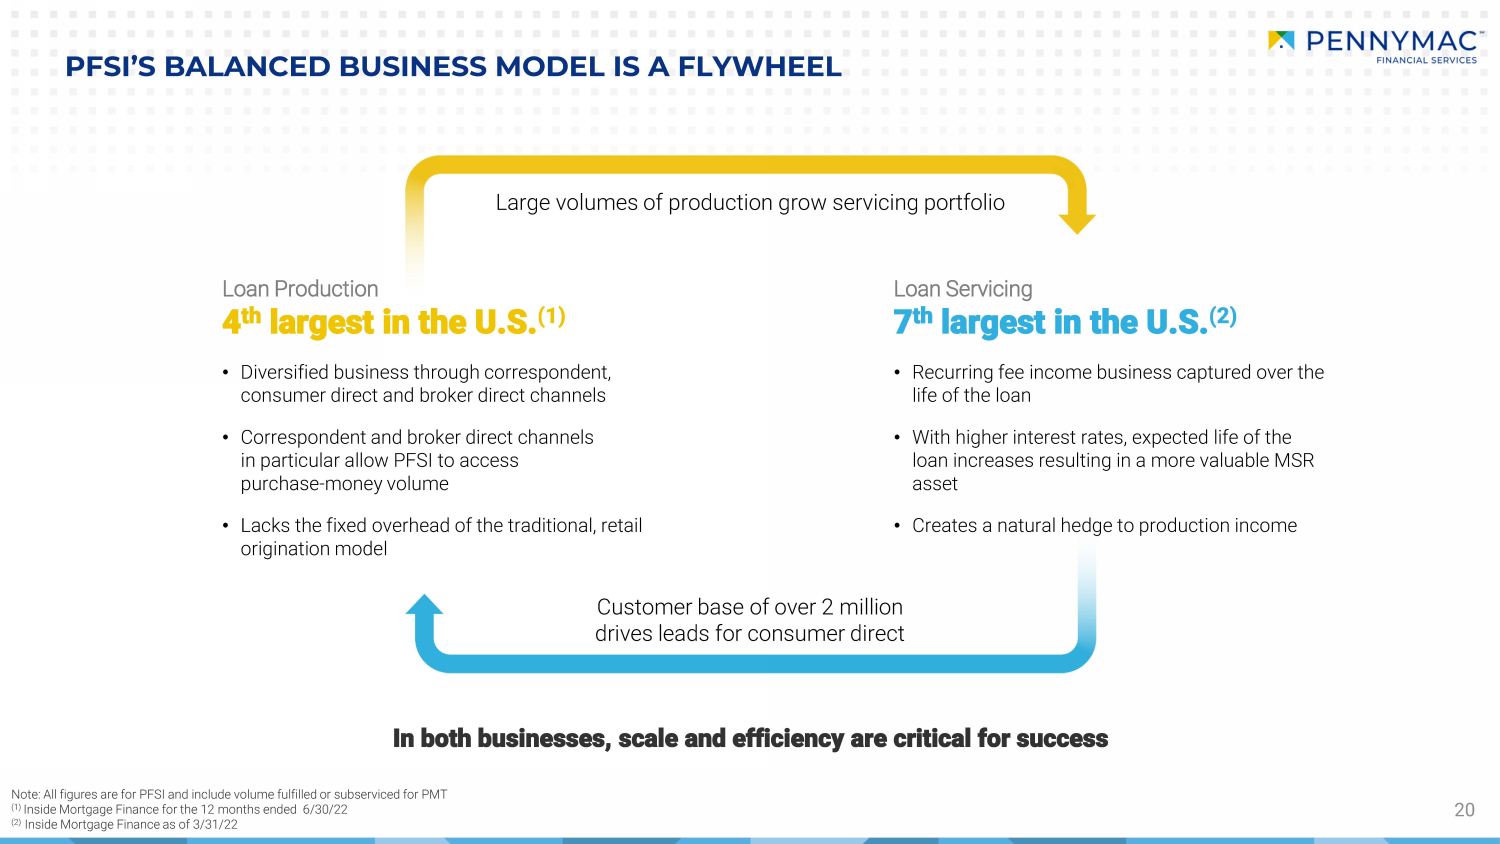
20 PFSI’S BALANCED BUSINESS MODEL IS A FLYWHEEL • Diversified business through correspondent, consumer direct and broker direct channels • Correspondent and broker direct channels in particular allow PFSI to access purchase - money volume • Lacks the fixed overhead of the traditional, retail origination model • Recurring fee income business captured over the life of the loan • With higher interest rates, expected life of the loan increases resulting in a more valuable MSR asset • Creates a natural hedge to production income Customer base of over 2 million drives leads for consumer direct Large volumes of production grow servicing portfolio Loan Production 4 th largest in the U.S. (1) Loan Servicing 7 th largest in the U.S. (2) In both businesses, scale and efficiency are critical for success Note: All figures are for PFSI and include volume fulfilled or subserviced for PMT (1) Inside Mortgage Finance for the 12 months ended 6/30/22 (2) Inside Mortgage Finance as of 3/31/22
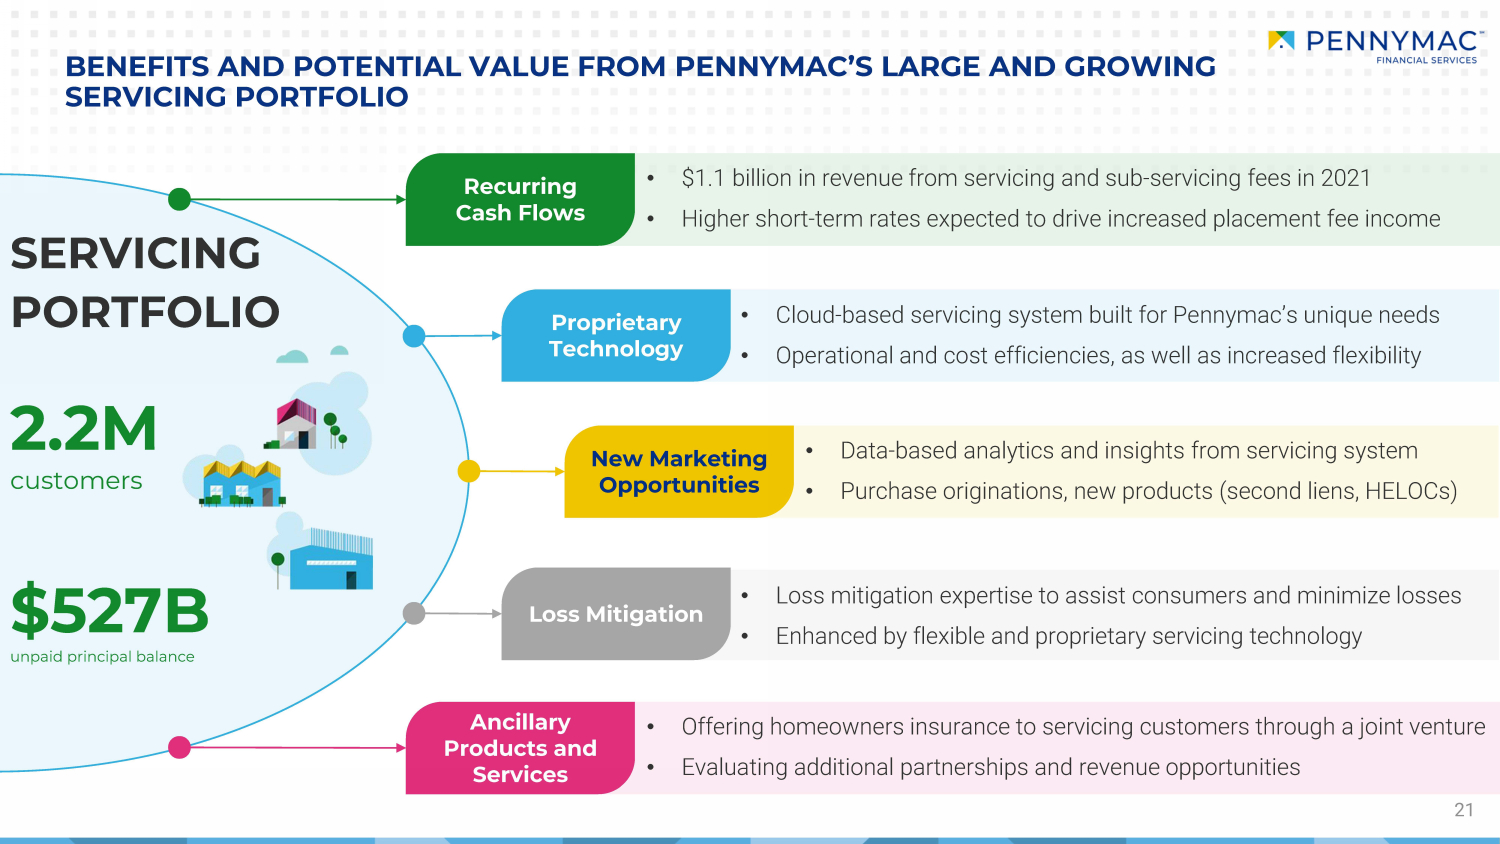
21 • $1.1 billion in revenue from servicing and sub - servicing fees in 2021 • Higher short - term rates expected to drive increased placement fee income • Cloud - based servicing system built for Pennymac’s unique needs • Operational and cost efficiencies, as well as increased flexibility • Data - based analytics and insights from servicing system • Purchase originations, new products (second liens, HELOCs) • Loss mitigation expertise to assist consumers and minimize losses • Enhanced by flexible and proprietary servicing technology • Offering homeowners insurance to servicing customers through a joint venture • Evaluating additional partnerships and revenue opportunities BENEFITS AND POTENTIAL VALUE FROM PENNYMAC’S LARGE AND GROWING SERVICING PORTFOLIO SERVICING PORTFOLIO Recurring Cash Flows Proprietary Technology New Marketing Opportunities Loss Mitigation Ancillary Products and Services 2.2M customers $527B unpaid principal balance
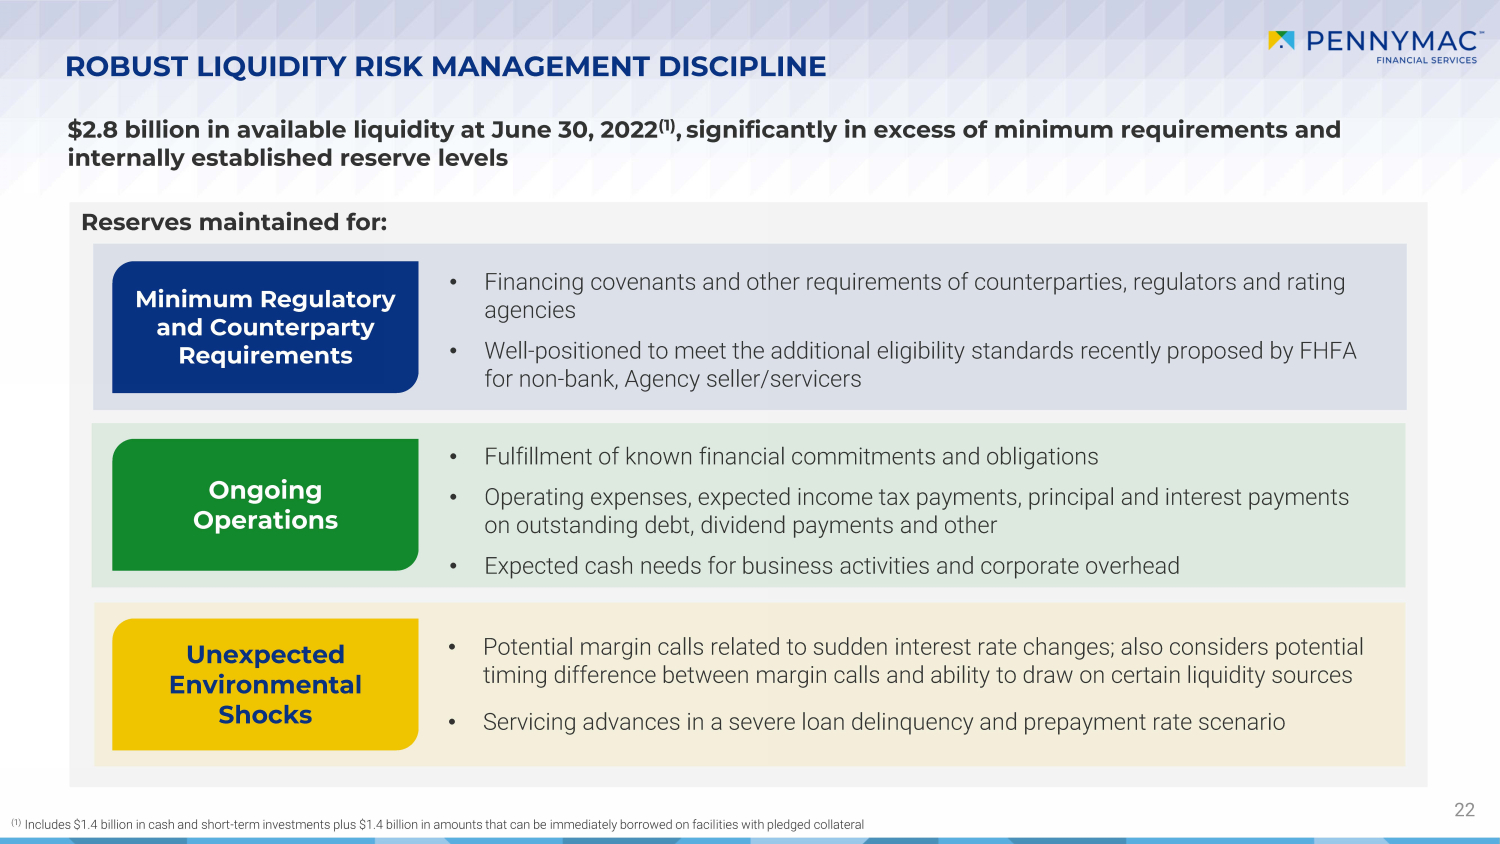
Reserves maintained for: ROBUST LIQUIDITY RISK MANAGEMENT DISCIPLINE 22 $2.8 billion in available liquidity at June 30, 2022 (1) , significantly in excess of minimum requirements and internally established reserve levels (1) Includes $1.4 billion in cash and short - term investments plus $1.4 billion in amounts that can be immediately borrowed on facil ities with pledged collateral Minimum Regulatory and Counterparty Requirements Ongoing Operations Unexpected Environmental Shocks • Financing covenants and other requirements of counterparties, regulators and rating agencies • Well - positioned to meet the additional eligibility standards recently proposed by FHFA for non - bank, Agency seller/servicers • Fulfillment of known financial commitments and obligations • Operating expenses, expected income tax payments, principal and interest payments on outstanding debt, dividend payments and other • Expected cash needs for business activities and corporate overhead • Potential margin calls related to sudden interest rate changes; also considers potential timing difference between margin calls and ability to draw on certain liquidity sources • Servicing advances in a severe loan delinquency and prepayment rate scenario
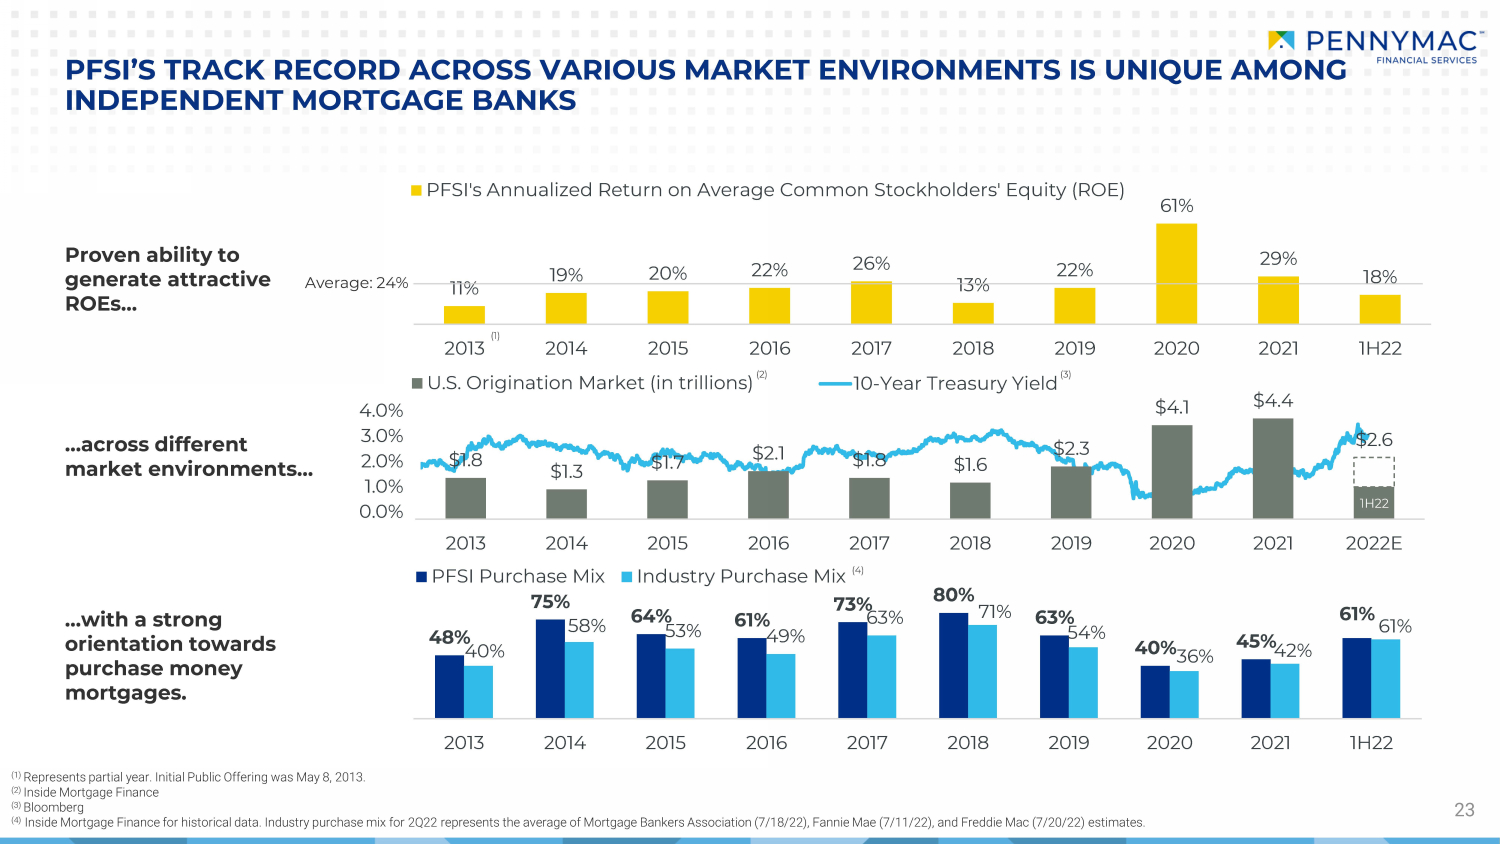
48% 75% 64% 61% 73% 80% 63% 40% 45% 61% 40% 58% 53% 49% 63% 71% 54% 36% 42% 61% 2013 2014 2015 2016 2017 2018 2019 2020 2021 1H22 PFSI Purchase Mix Industry Purchase Mix 0.0% 1.0% 2.0% 3.0% 4.0% 10-Year Treasury Yield 1H22 $1.8 $1.3 $1.7 $2.1 $1.8 $1.6 $2.3 $4.1 $4.4 $2.6 2013 2014 2015 2016 2017 2018 2019 2020 2021 2022E U.S. Origination Market (in trillions) 11% 19% 20% 22% 26% 13% 22% 61% 29% 18% 2013 2014 2015 2016 2017 2018 2019 2020 2021 1H22 PFSI's Annualized Return on Average Common Stockholders' Equity (ROE) 23 PFSI’S TRACK RECORD ACROSS VARIOUS MARKET ENVIRONMENTS IS UNIQUE AMONG INDEPENDENT MORTGAGE BANKS Proven ability to generate attractive ROEs… …across different market environments… …with a strong orientation towards purchase money mortgages. (1) Represents partial year. Initial Public Offering was May 8, 2013. (2) Inside Mortgage Finance (3) Bloomberg (4) Inside Mortgage Finance for historical data. Industry purchase mix for 2 Q22 represents the average of Mortgage Bankers Association (7/18/22), Fannie Mae (7/11/22), and Freddie Mac (7/20/22) estimates. (1) (2) (3) (4) Average: 24%
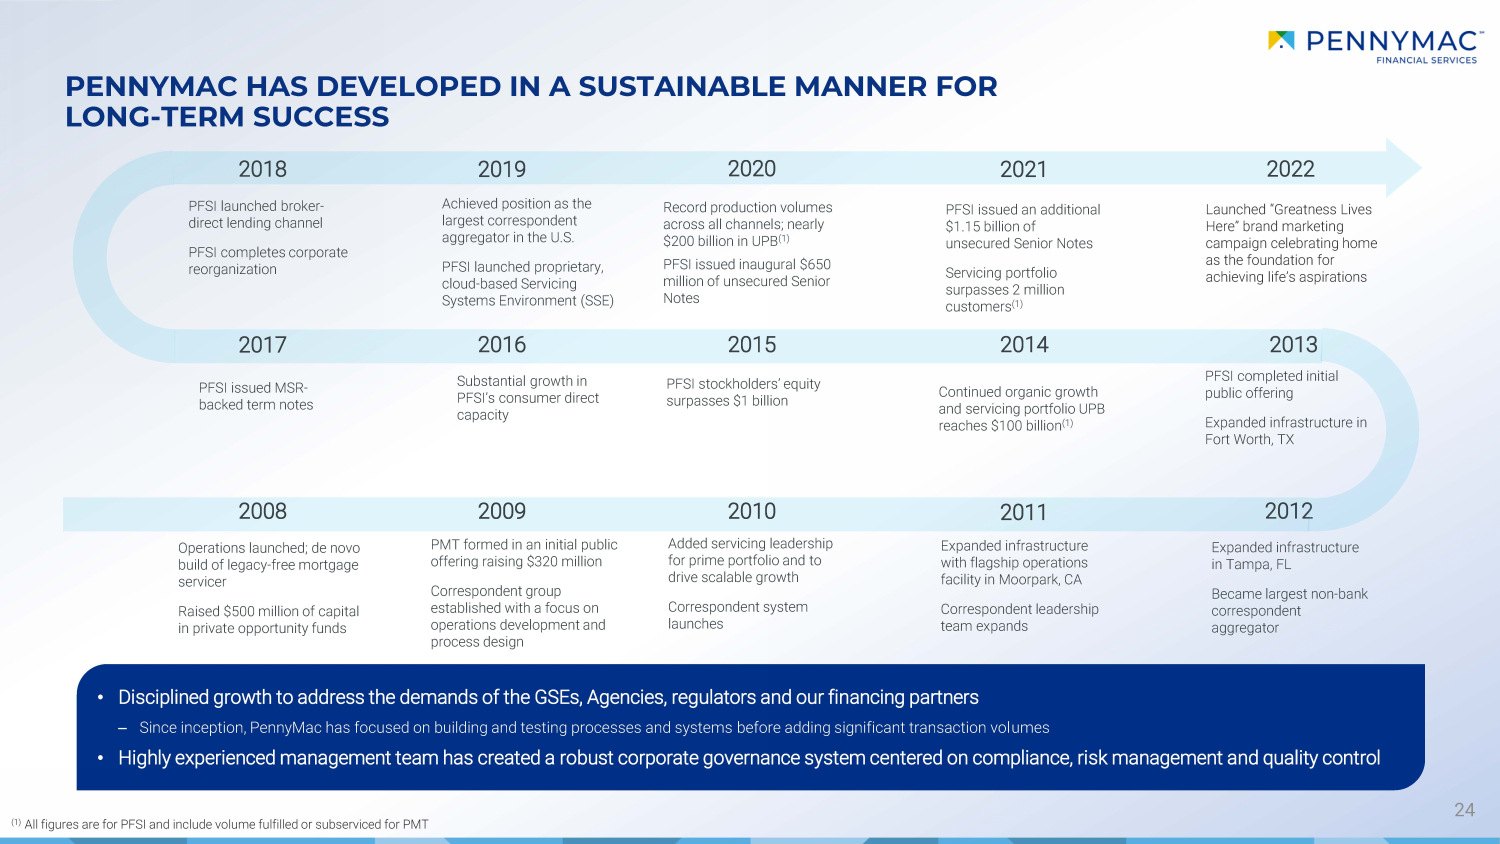
PENNYMAC HAS DEVELOPED IN A SUSTAINABLE MANNER FOR LONG - TERM SUCCESS 24 2008 2009 2010 2011 2012 2013 2014 2015 2016 2017 2018 2019 2020 2021 Operations launched; de novo build of legacy - free mortgage servicer Raised $500 million of capital in private opportunity funds PMT formed in an initial public offering raising $320 million Correspondent group established with a focus on operations development and process design Added servicing leadership for prime portfolio and to drive scalable growth Correspondent system launches Expanded infrastructure with flagship operations facility in Moorpark, CA Correspondent leadership team expands Expanded infrastructure in Tampa, FL Became largest non - bank correspondent aggregator PFSI completed initial public offering Expanded infrastructure in Fort Worth, TX Continued organic growth and servicing portfolio UPB reaches $100 billion (1) PFSI stockholders’ equity surpasses $1 billion Substantial growth in PFSI’s consumer direct capacity PFSI issued MSR - backed term notes PFSI launched broker - direct lending channel PFSI completes corporate reorganization Achieved position as the largest correspondent aggregator in the U.S. PFSI launched proprietary, cloud - based Servicing Systems Environment (SSE) Record production volumes across all channels; nearly $200 billion in UPB (1) PFSI issued inaugural $650 million of unsecured Senior Notes PFSI issued an additional $1.15 billion of unsecured Senior Notes Servicing portfolio surpasses 2 million customers (1) (1) All figures are for PFSI and include volume fulfilled or subserviced for PMT • Disciplined growth to address the demands of the GSEs, Agencies, regulators and our financing partners ‒ Since inception, PennyMac has focused on building and testing processes and systems before adding significant transaction vol ume s • Highly experienced management team has created a robust corporate governance system centered on compliance, risk management a nd quality control 2022 Launched “Greatness Lives Here” brand marketing campaign celebrating home as the foundation for achieving life’s aspirations
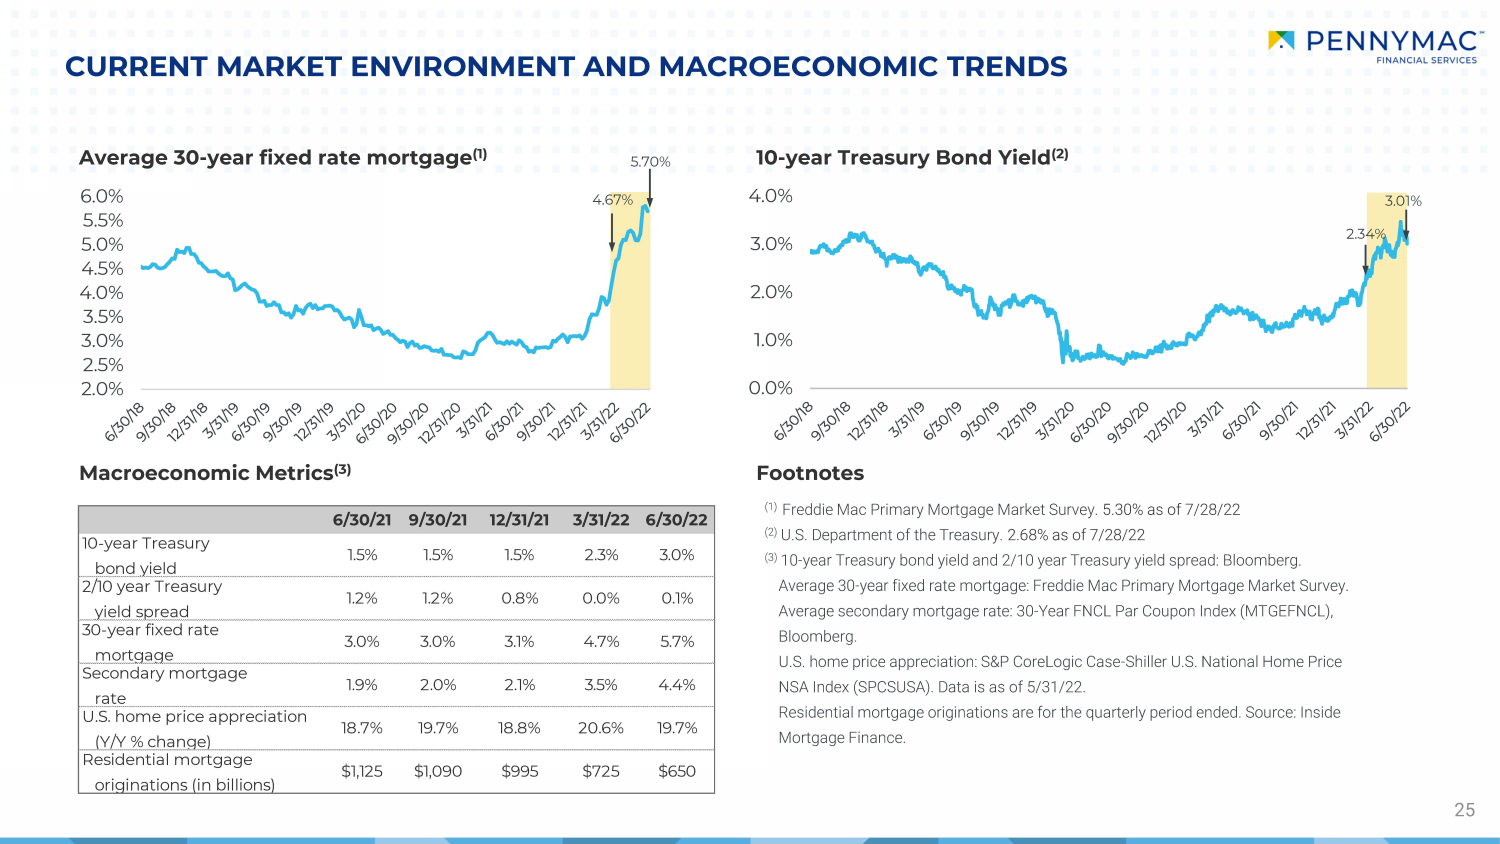
2.0% 2.5% 3.0% 3.5% 4.0% 4.5% 5.0% 5.5% 6.0% 0.0% 1.0% 2.0% 3.0% 4.0% 2.34% CURRENT MARKET ENVIRONMENT AND MACROECONOMIC TRENDS 25 Macroeconomic Metrics (3) Footnotes (1) Freddie Mac Primary Mortgage Market Survey. 5.30% as of 7/28/22 (2) U.S. Department of the Treasury. 2.68% as of 7/28/22 (3) 10 - year Treasury bond yield and 2/10 year Treasury yield spread: Bloomberg. Average 30 - year fixed rate mortgage: Freddie Mac Primary Mortgage Market Survey. Average secondary mortgage rate: 30 - Year FNCL Par Coupon Index (MTGEFNCL), Bloomberg. U.S. home price appreciation: S&P CoreLogic Case - Shiller U.S. National Home Price NSA Index (SPCSUSA). Data is as of 5/31/22 . Residential mortgage originations are for the quarterly period ended. Source: Inside Mortgage Finance. Average 30 - year fixed rate mortgage (1) 10 - year Treasury Bond Yield (2) 3.01% 5.70% 4.67% 6/30/21 9/30/21 12/31/21 3/31/22 6/30/22 10-year Treasury bond yield 1.5% 1.5% 1.5% 2.3% 3.0% 2/10 year Treasury yield spread 1.2% 1.2% 0.8% 0.0% 0.1% 30-year fixed rate mortgage 3.0% 3.0% 3.1% 4.7% 5.7% Secondary mortgage rate 1.9% 2.0% 2.1% 3.5% 4.4% U.S. home price appreciation (Y/Y % change) 18.7% 19.7% 18.8% 20.6% 19.7% Residential mortgage originations (in billions) $1,125 $1,090 $995 $725 $650
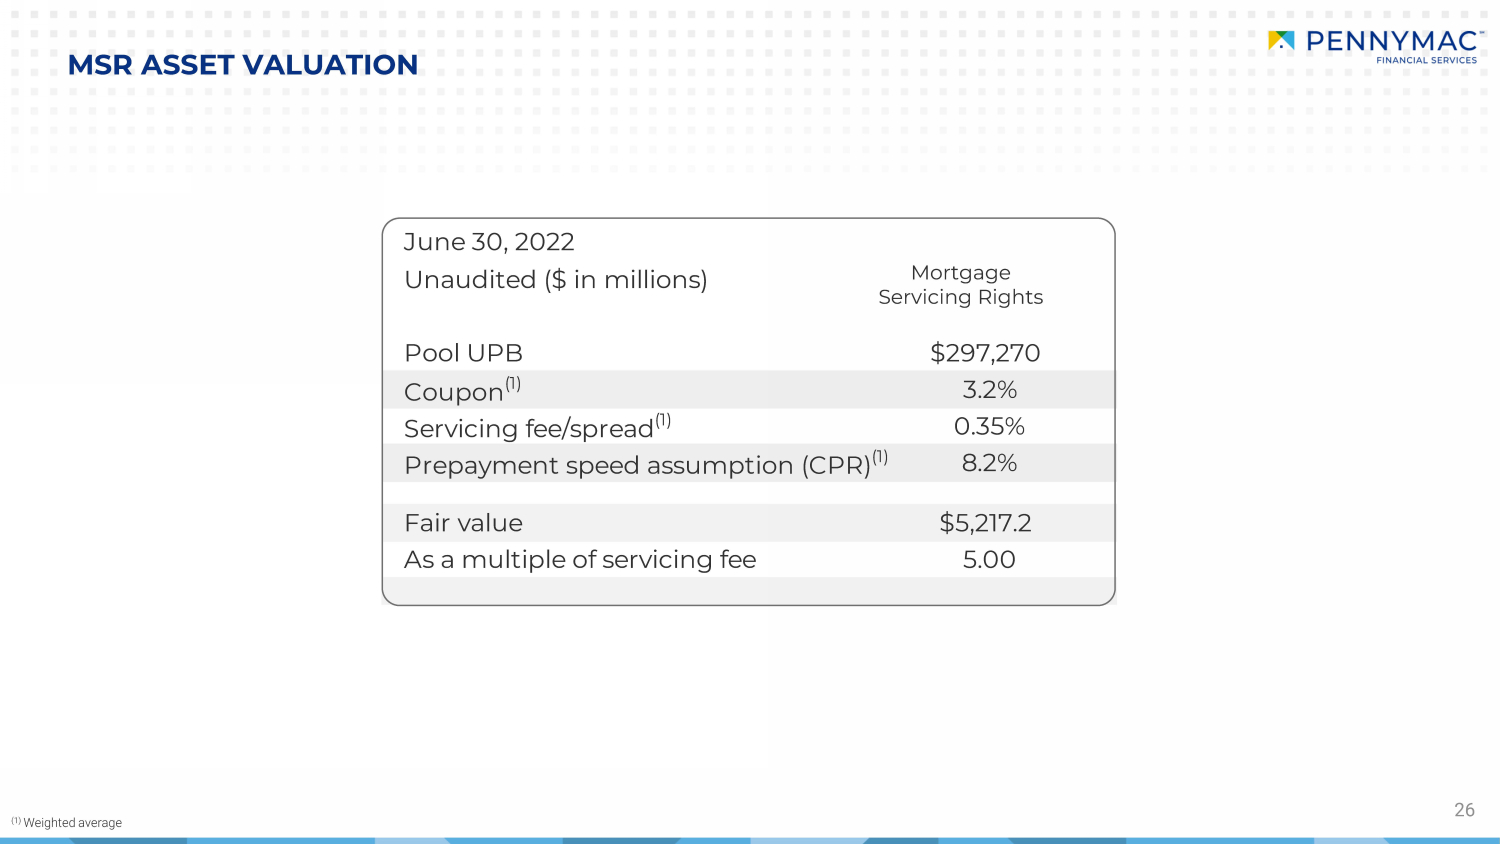
26 MSR ASSET VALUATION (1) Weighted average Mortgage Servicing Rights Pool UPB $297,270 Coupon (1) 3.2% Servicing fee/spread (1) 0.35% Prepayment speed assumption (CPR) (1) 8.2% Fair value $5,217.2 As a multiple of servicing fee 5.00 June 30, 2022 Unaudited ($ in millions)
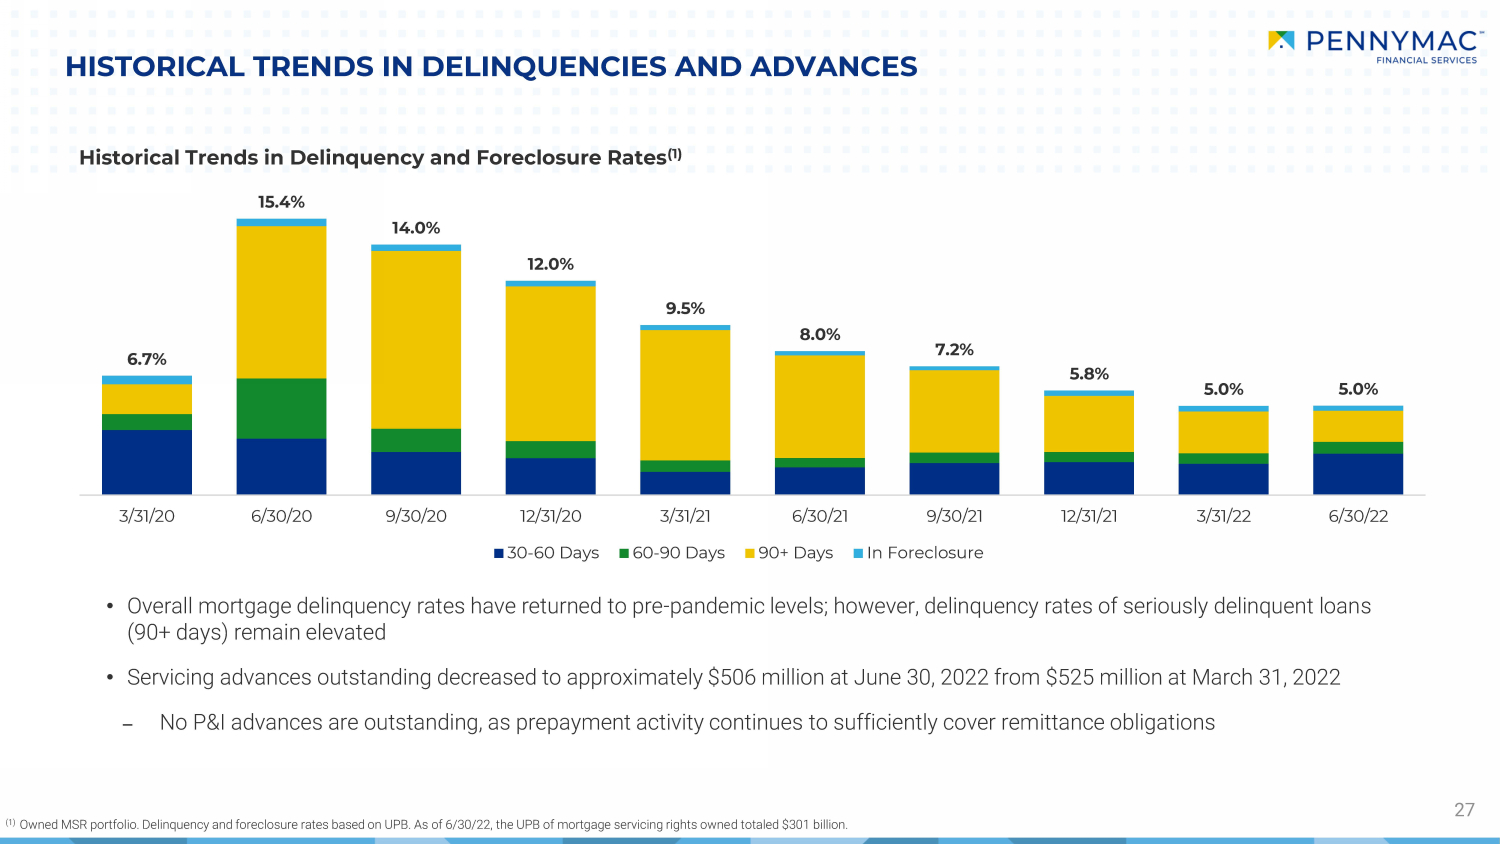
6.7% 15.4% 14.0% 12.0% 9.5% 8.0% 7.2% 5.8% 5.0% 5.0% 3/31/20 6/30/20 9/30/20 12/31/20 3/31/21 6/30/21 9/30/21 12/31/21 3/31/22 6/30/22 30-60 Days 60-90 Days 90+ Days In Foreclosure • Overall mortgage delinquency rates have returned to pre - pandemic levels; however, delinquency rates of seriously delinquent loan s (90+ days) remain elevated • Servicing advances outstanding decreased to approximately $506 million at June 30, 2022 from $525 million at March 31, 2022 – No P&I advances are outstanding, as prepayment activity continues to sufficiently cover remittance obligations HISTORICAL TRENDS IN DELINQUENCIES AND ADVANCES 27 Historical Trends in Delinquency and Foreclosure Rates (1) (1) Owned MSR portfolio. Delinquency and foreclosure rates based on UPB. As of 6/30/22, the UPB of mortgage servicing rights owne d t otaled $301 billion.
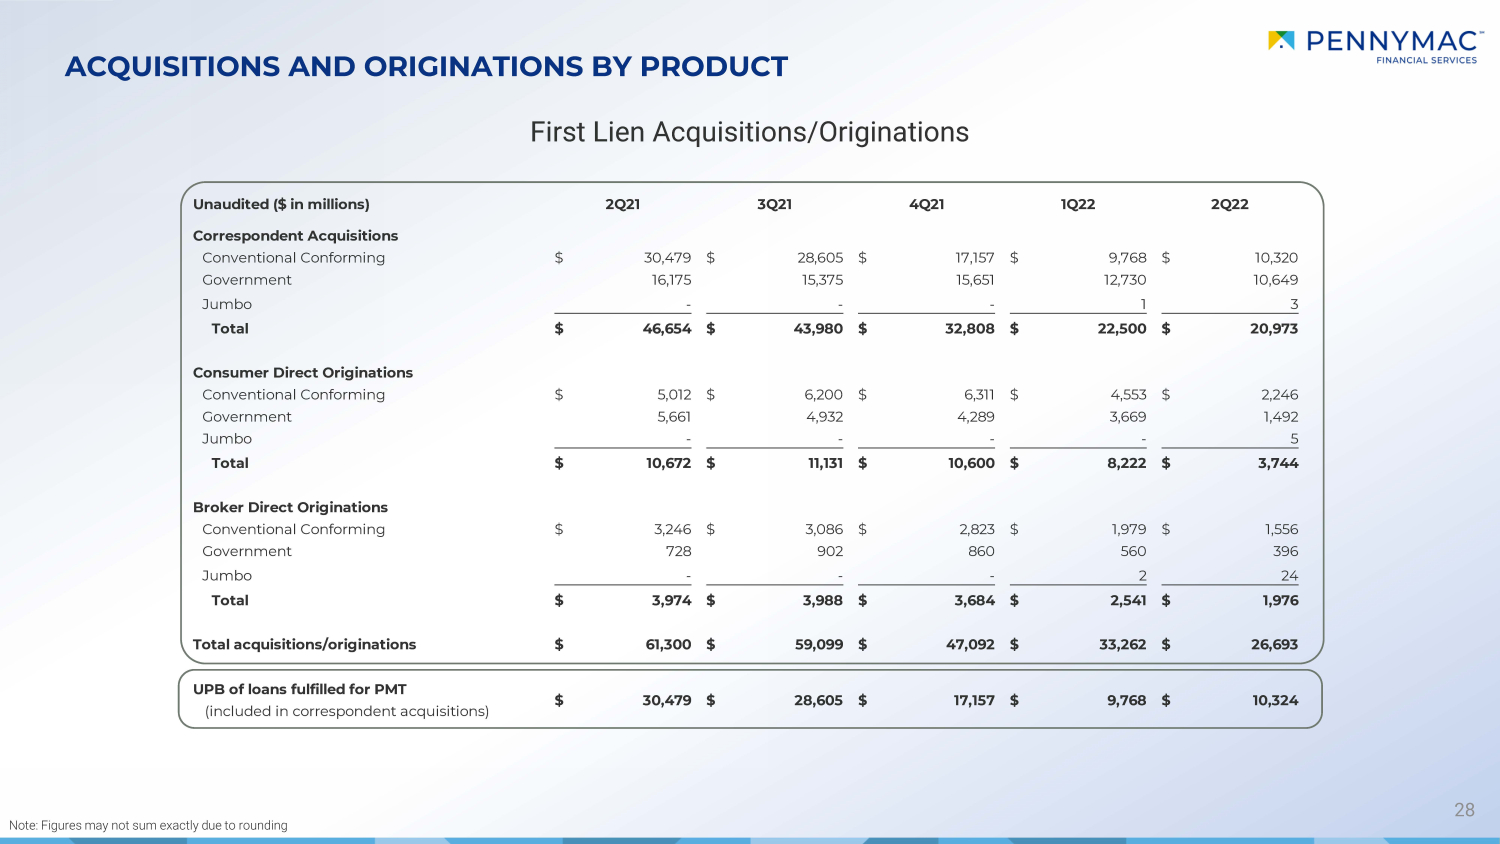
ACQUISITIONS AND ORIGINATIONS BY PRODUCT 28 First Lien Acquisitions/Originations Note: Figures may not sum exactly due to rounding Unaudited ($ in millions) 2Q21 3Q21 4Q21 1Q22 2Q22 Correspondent Acquisitions Conventional Conforming 30,479$ 28,605$ 17,157$ 9,768$ 10,320$ Government 16,175 15,375 15,651 12,730 10,649 Jumbo - - - 1 3 Total 46,654$ 43,980$ 32,808$ 22,500$ 20,973$ Consumer Direct Originations Conventional Conforming 5,012$ 6,200$ 6,311$ 4,553$ 2,246$ Government 5,661 4,932 4,289 3,669 1,492 Jumbo - - - - 5 Total 10,672$ 11,131$ 10,600$ 8,222$ 3,744$ Broker Direct Originations Conventional Conforming 3,246$ 3,086$ 2,823$ 1,979$ 1,556$ Government 728 902 860 560 396 Jumbo - - - 2 24 Total 3,974$ 3,988$ 3,684$ 2,541$ 1,976$ Total acquisitions/originations 61,300$ 59,099$ 47,092$ 33,262$ 26,693$ UPB of loans fulfilled for PMT (included in correspondent acquisitions) 30,479$ 28,605$ 17,157$ 9,768$ 10,324$
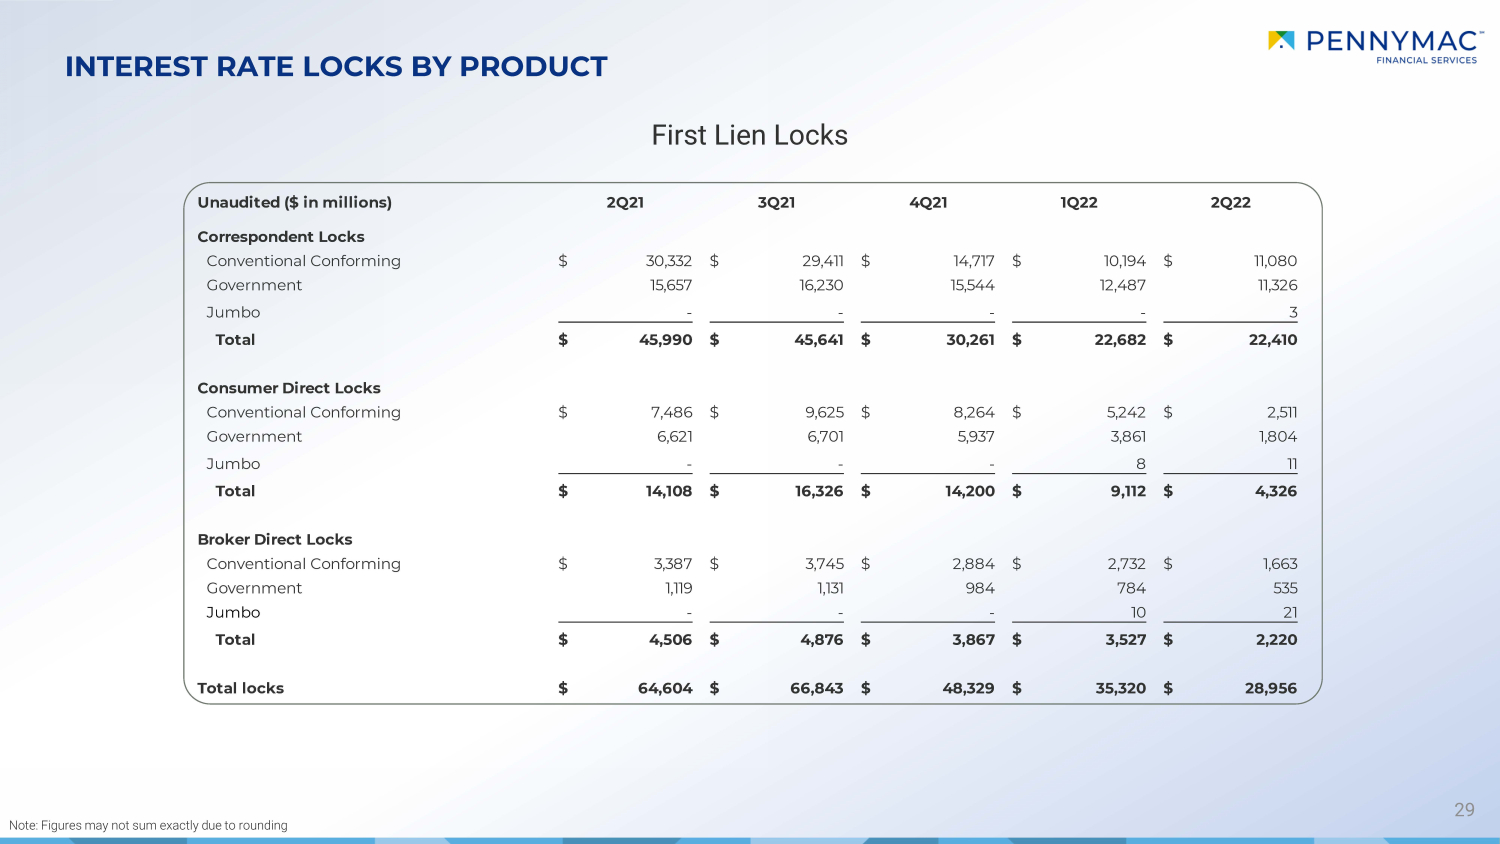
INTEREST RATE LOCKS BY PRODUCT 29 Note: Figures may not sum exactly due to rounding First Lien Locks Unaudited ($ in millions) 2Q21 3Q21 4Q21 1Q22 2Q22 Correspondent Locks Conventional Conforming 30,332$ 29,411$ 14,717$ 10,194$ 11,080$ Government 15,657 16,230 15,544 12,487 11,326 Jumbo - - - - 3 Total 45,990$ 45,641$ 30,261$ 22,682$ 22,410$ Consumer Direct Locks Conventional Conforming 7,486$ 9,625$ 8,264$ 5,242$ 2,511$ Government 6,621 6,701 5,937 3,861 1,804 Jumbo - - - 8 11 Total 14,108$ 16,326$ 14,200$ 9,112$ 4,326$ Broker Direct Locks Conventional Conforming 3,387$ 3,745$ 2,884$ 2,732$ 1,663$ Government 1,119 1,131 984 784 535 Jumbo - - - 10 21 Total 4,506$ 4,876$ 3,867$ 3,527$ 2,220$ Total locks 64,604$ 66,843$ 48,329$ 35,320$ 28,956$
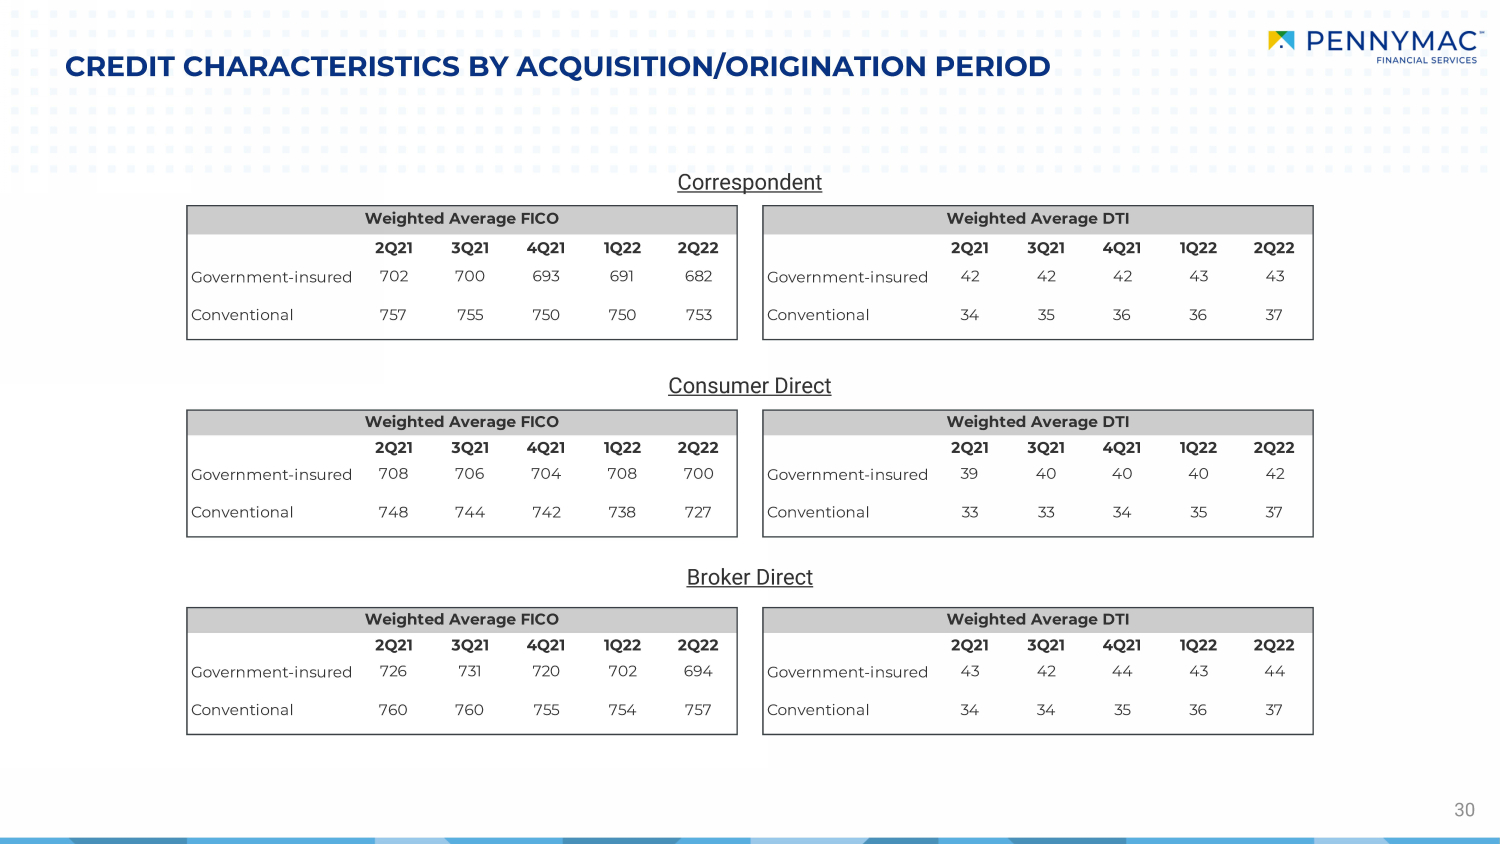
CREDIT CHARACTERISTICS BY ACQUISITION/ORIGINATION PERIOD 30 Correspondent Consumer Direct Broker Direct 2Q21 3Q21 4Q21 1Q22 2Q22 2Q21 3Q21 4Q21 1Q22 2Q22 Government-insured 702 700 693 691 682 Government-insured 42 42 42 43 43 Conventional 757 755 750 750 753 Conventional 34 35 36 36 37 2Q21 3Q21 4Q21 1Q22 2Q22 2Q21 3Q21 4Q21 1Q22 2Q22 Government-insured 708 706 704 708 700 Government-insured 39 40 40 40 42 Conventional 748 744 742 738 727 Conventional 33 33 34 35 37 2Q21 3Q21 4Q21 1Q22 2Q22 2Q21 3Q21 4Q21 1Q22 2Q22 Government-insured 726 731 720 702 694 Government-insured 43 42 44 43 44 Conventional 760 760 755 754 757 Conventional 34 34 35 36 37 Weighted Average FICO Weighted Average DTI Weighted Average FICO Weighted Average DTI Weighted Average FICO Weighted Average DTI
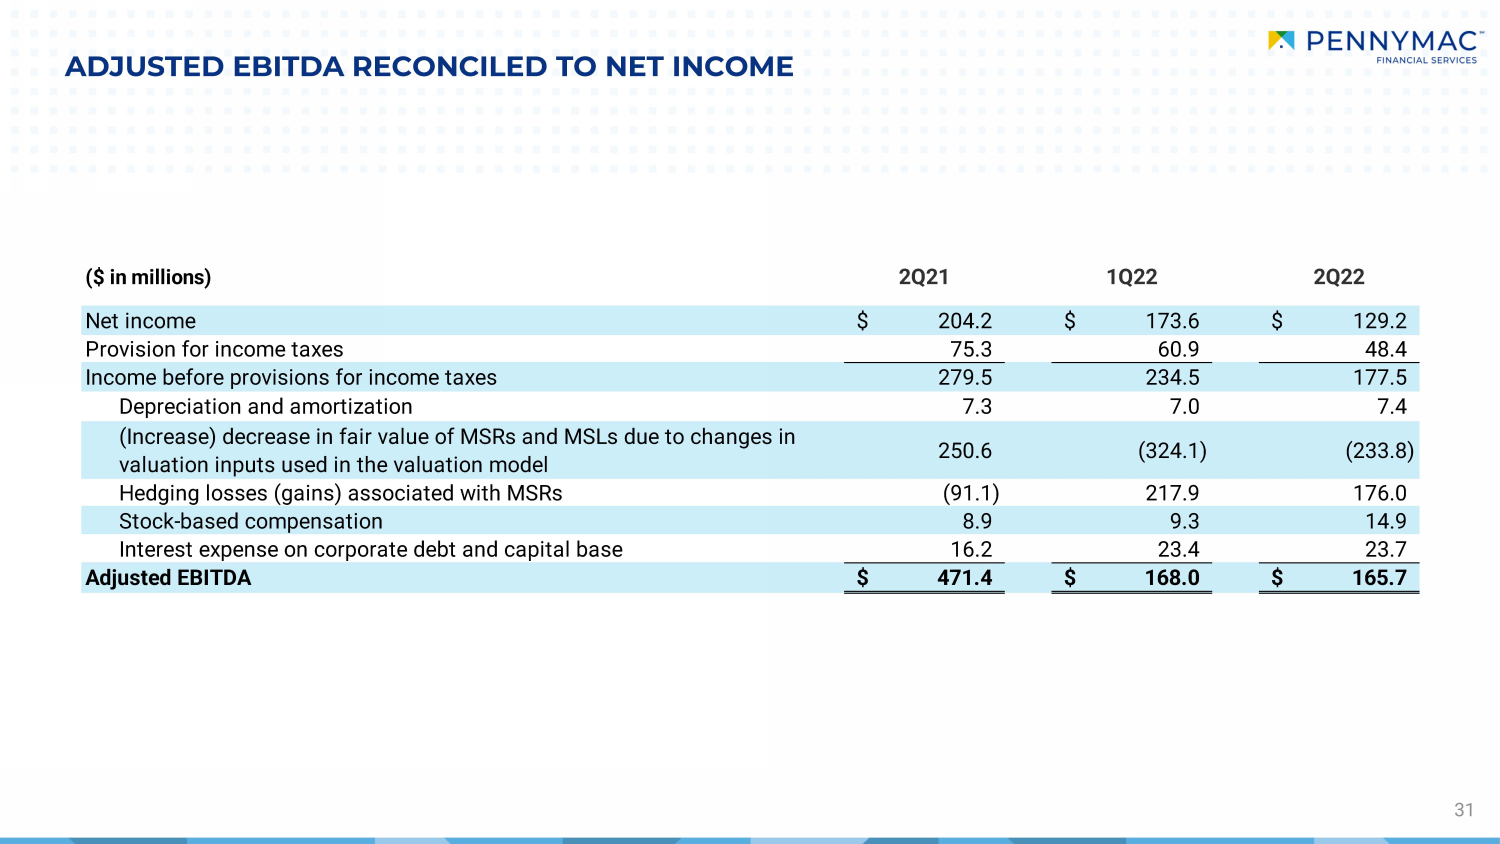
ADJUSTED EBITDA RECONCILED TO NET INCOME 31 ($ in millions) 2Q21 1Q22 2Q22 Net income 204.2$ 173.6$ 129.2$ Provision for income taxes 75.3 60.9 48.4 Income before provisions for income taxes 279.5 234.5 177.5 Depreciation and amortization 7.3 7.0 7.4 (Increase) decrease in fair value of MSRs and MSLs due to changes in valuation inputs used in the valuation model 250.6 (324.1) (233.8) Hedging losses (gains) associated with MSRs (91.1) 217.9 176.0 Stock-based compensation 8.9 9.3 14.9 Interest expense on corporate debt and capital base 16.2 23.4 23.7 Adjusted EBITDA 471.4$ 168.0$ 165.7$