
Welcome to Our 2023 Annual Meeting Exhibit 99.1
Statement Regarding Forward-Looking Information This presentation contains forward-looking statements within the meaning of the Private Securities Litigation Reform Act of 1995. Such statements are not historical facts and may include expressions about Management’s strategies and Management’s expectations about financial results, new and existing programs and products, investments, relationships, opportunities and market conditions. These statements may be identified by such forward-looking terminology as “expect,” “look,” “believe,” “anticipate,” “may,” or similar statements or variations of such terms. Actual results may differ materially from such forward-looking statements. Factors that may cause actual results to differ materially from those contemplated by such forward-looking statements include, but are not limited to: 1) our ability to successfully grow our business and implement our strategic plan, including our ability to generate revenues to offset the increased personnel and other costs related to the strategic plan; 2) the current or anticipated impact of military conflict, terrorism or other geopolitical events; 3) the impact of anticipated higher operating expenses in 2023 and beyond; 4) our ability to successfully integrate wealth management firm acquisitions; 5) our ability to manage our growth; 6) our ability to successfully integrate our expanded employee base; 7) a decline in the economy, in particular in our New Jersey and New York market areas, including potential recessionary conditions; 8) declines in our net interest margin caused by the interest rate environment (including the shape of the yield curve) and our highly competitive market; 9) declines in the value in our investment portfolio; 10) impact on our business from a pandemic event (including COVID-19) on our business, operations, customers, allowance for credit losses, and capital levels; 11) higher than expected increases in our allowance for loan and lease losses; 12) higher than expected increases in loan and lease losses or in the level of nonperforming loans; 13) changes in interest rates and the effects of inflation; 14) a decline in real estate values within our market areas; 15) legislative and regulatory actions (including the impact of the Dodd-Frank Wall Street Reform and Consumer Protection Act, Basel III and related regulations) that may result in increased compliance costs; 16) changes in monetary policy by the Federal Reserve Board; 17) changes to tax or accounting matters; 18) successful cyberattacks against our IT infrastructure and that of our IT providers; 19) higher than expected FDIC insurance premiums; 20) adverse weather conditions; 21) our ability to successfully generate business in new geographic markets; 22) a reduction in our lower-cost funding sources; 23) changes in liquidity, including the size and composition of our deposit portfolio, including the percentage of uninsured deposits in the portfolio; 24) our ability to adapt to technological changes; 25) claims and litigation pertaining to fiduciary responsibility, environmental laws and other matters; 26) our ability to retain key employees; 27) demands for loans and deposits in our market areas; 28) adverse changes in securities markets and 29) other unexpected material adverse changes in our operations or earnings. The Company undertakes no duty to update any forward-looking statement to conform the statement to actual results or changes in the Company’s expectations. Although we believe that the expectations reflected in the forward-looking statements are reasonable, the Company cannot guarantee future results, levels of activity, performance or achievements. 2
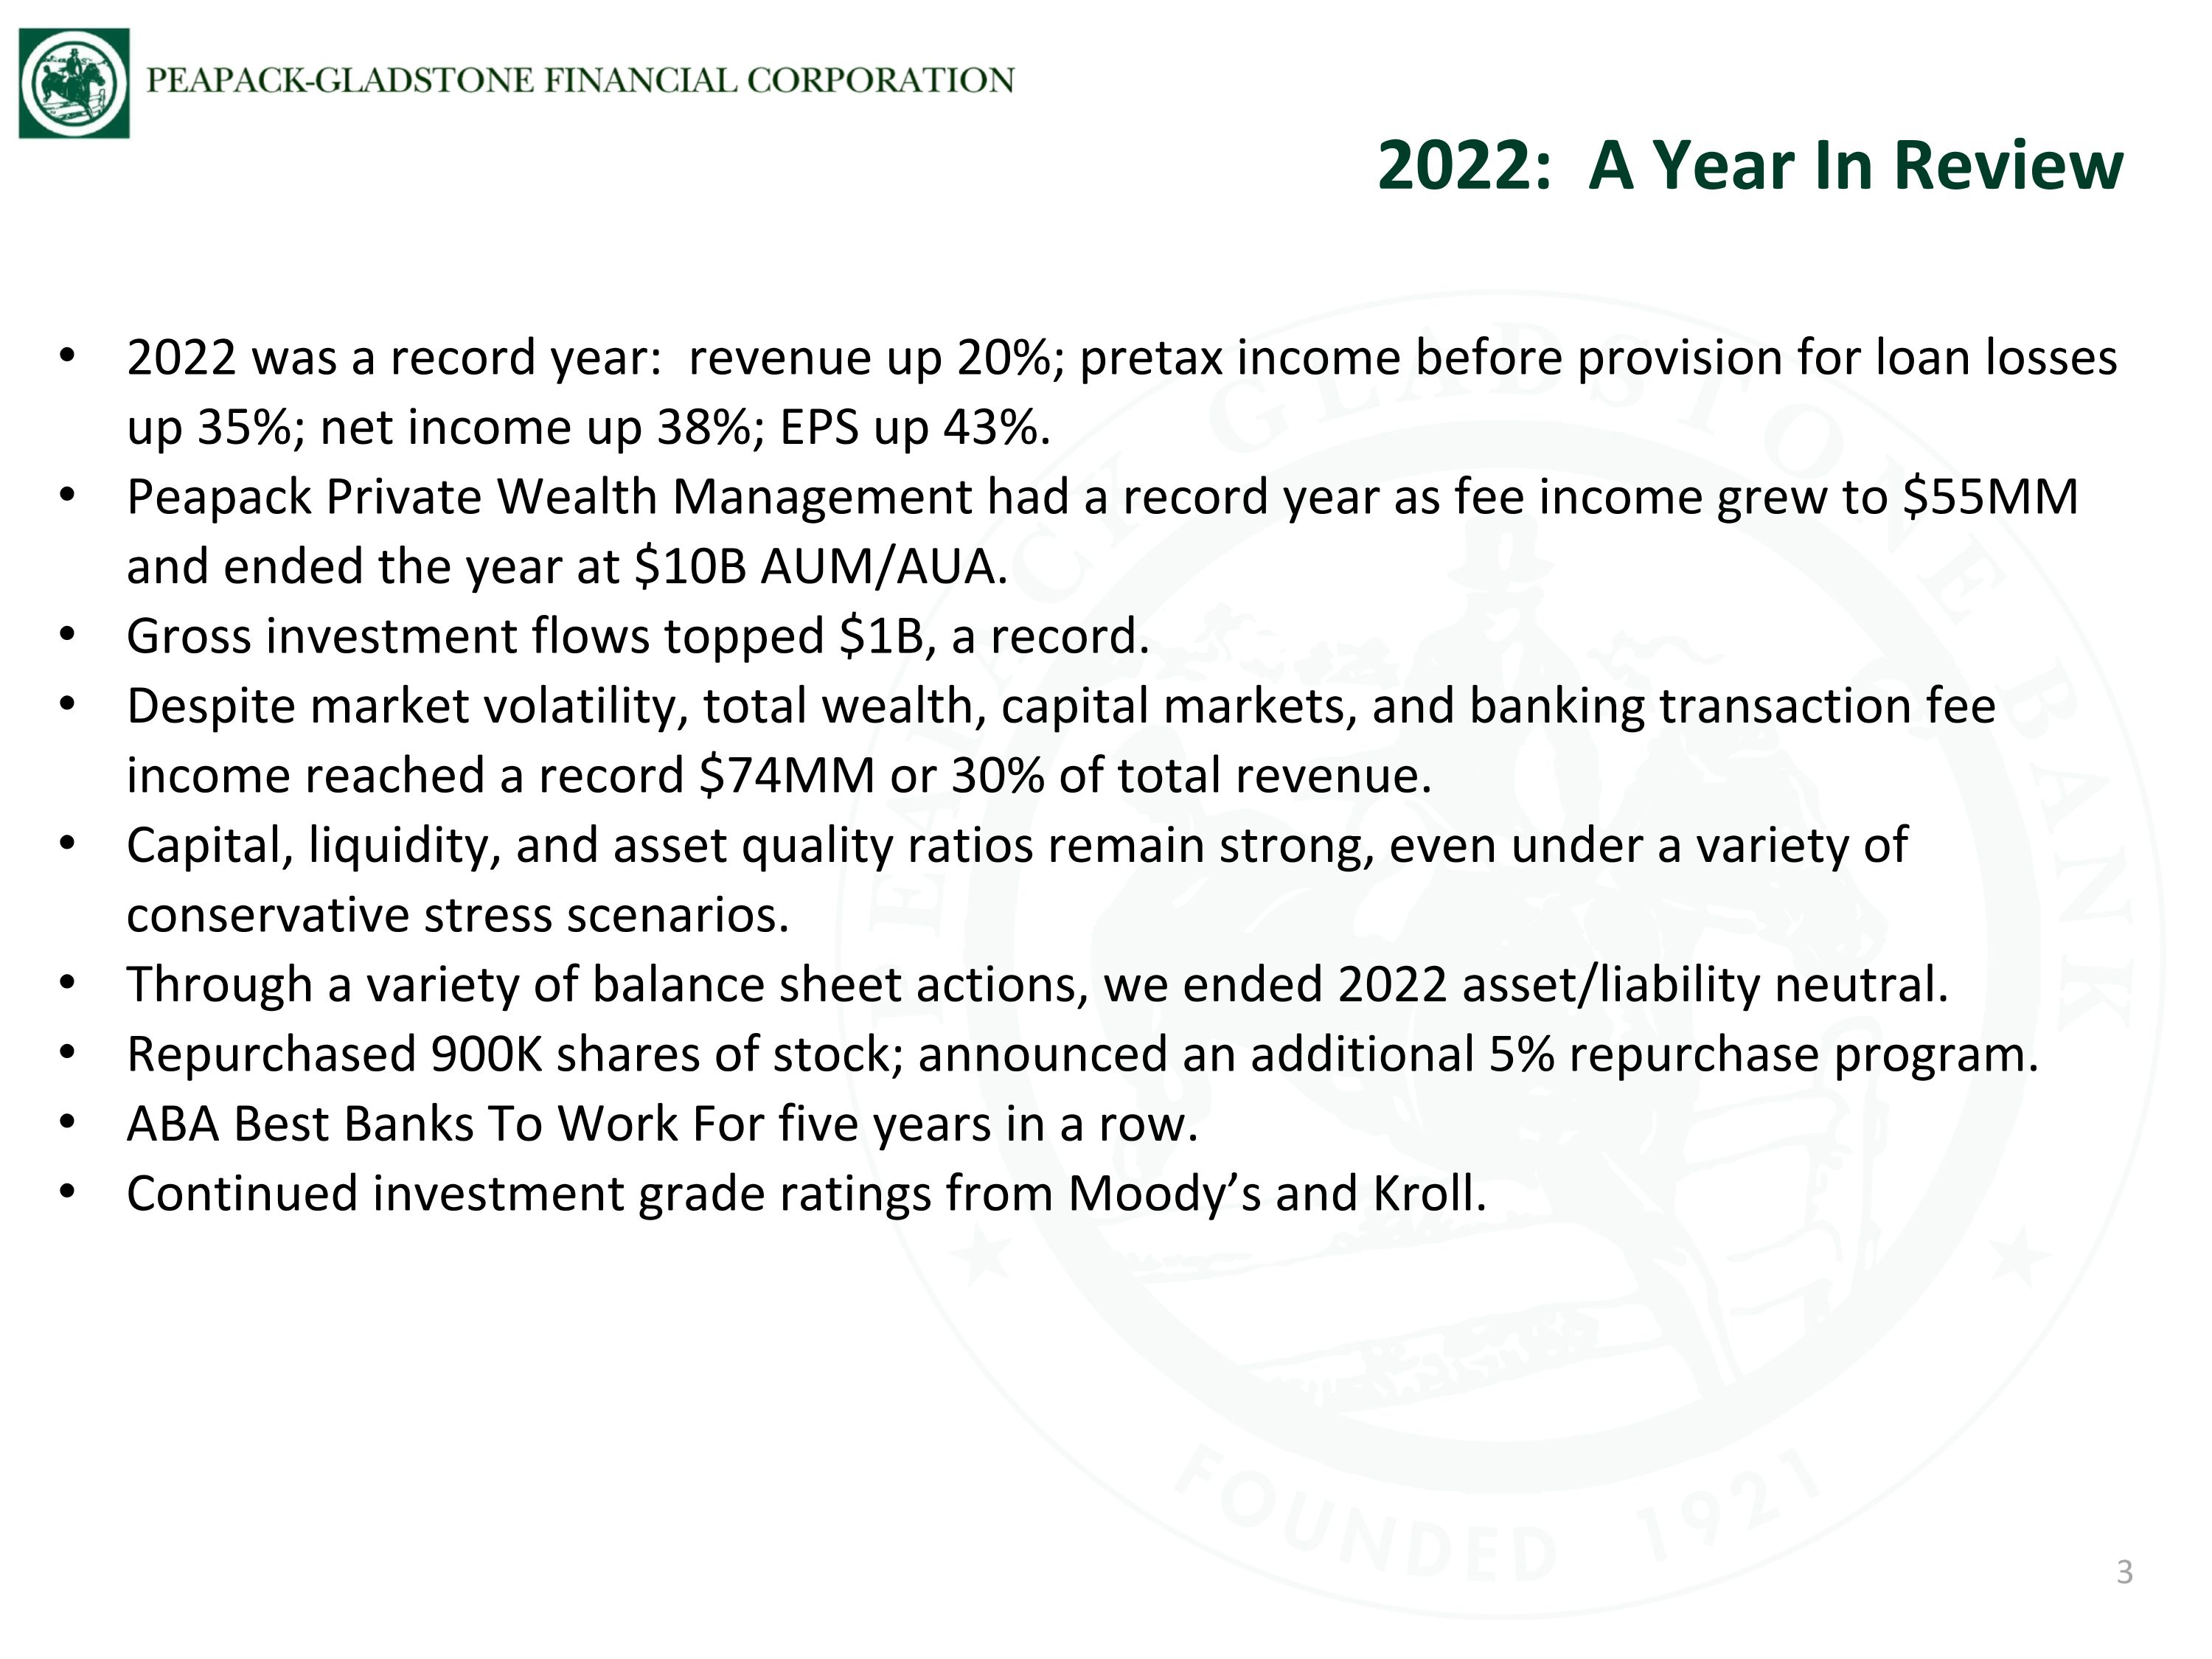
2022 was a record year: revenue up 20%; pretax income before provision for loan losses up 35%; net income up 38%; EPS up 43%. Peapack Private Wealth Management had a record year as fee income grew to $55MM and ended the year at $10B AUM/AUA. Gross investment flows topped $1B, a record. Despite market volatility, total wealth, capital markets, and banking transaction fee income reached a record $74MM or 30% of total revenue. Capital, liquidity, and asset quality ratios remain strong, even under a variety of conservative stress scenarios. Through a variety of balance sheet actions, we ended 2022 asset/liability neutral. Repurchased 900K shares of stock; announced an additional 5% repurchase program. ABA Best Banks To Work For five years in a row. Continued investment grade ratings from Moody’s and Kroll. 2022: A Year In Review 3
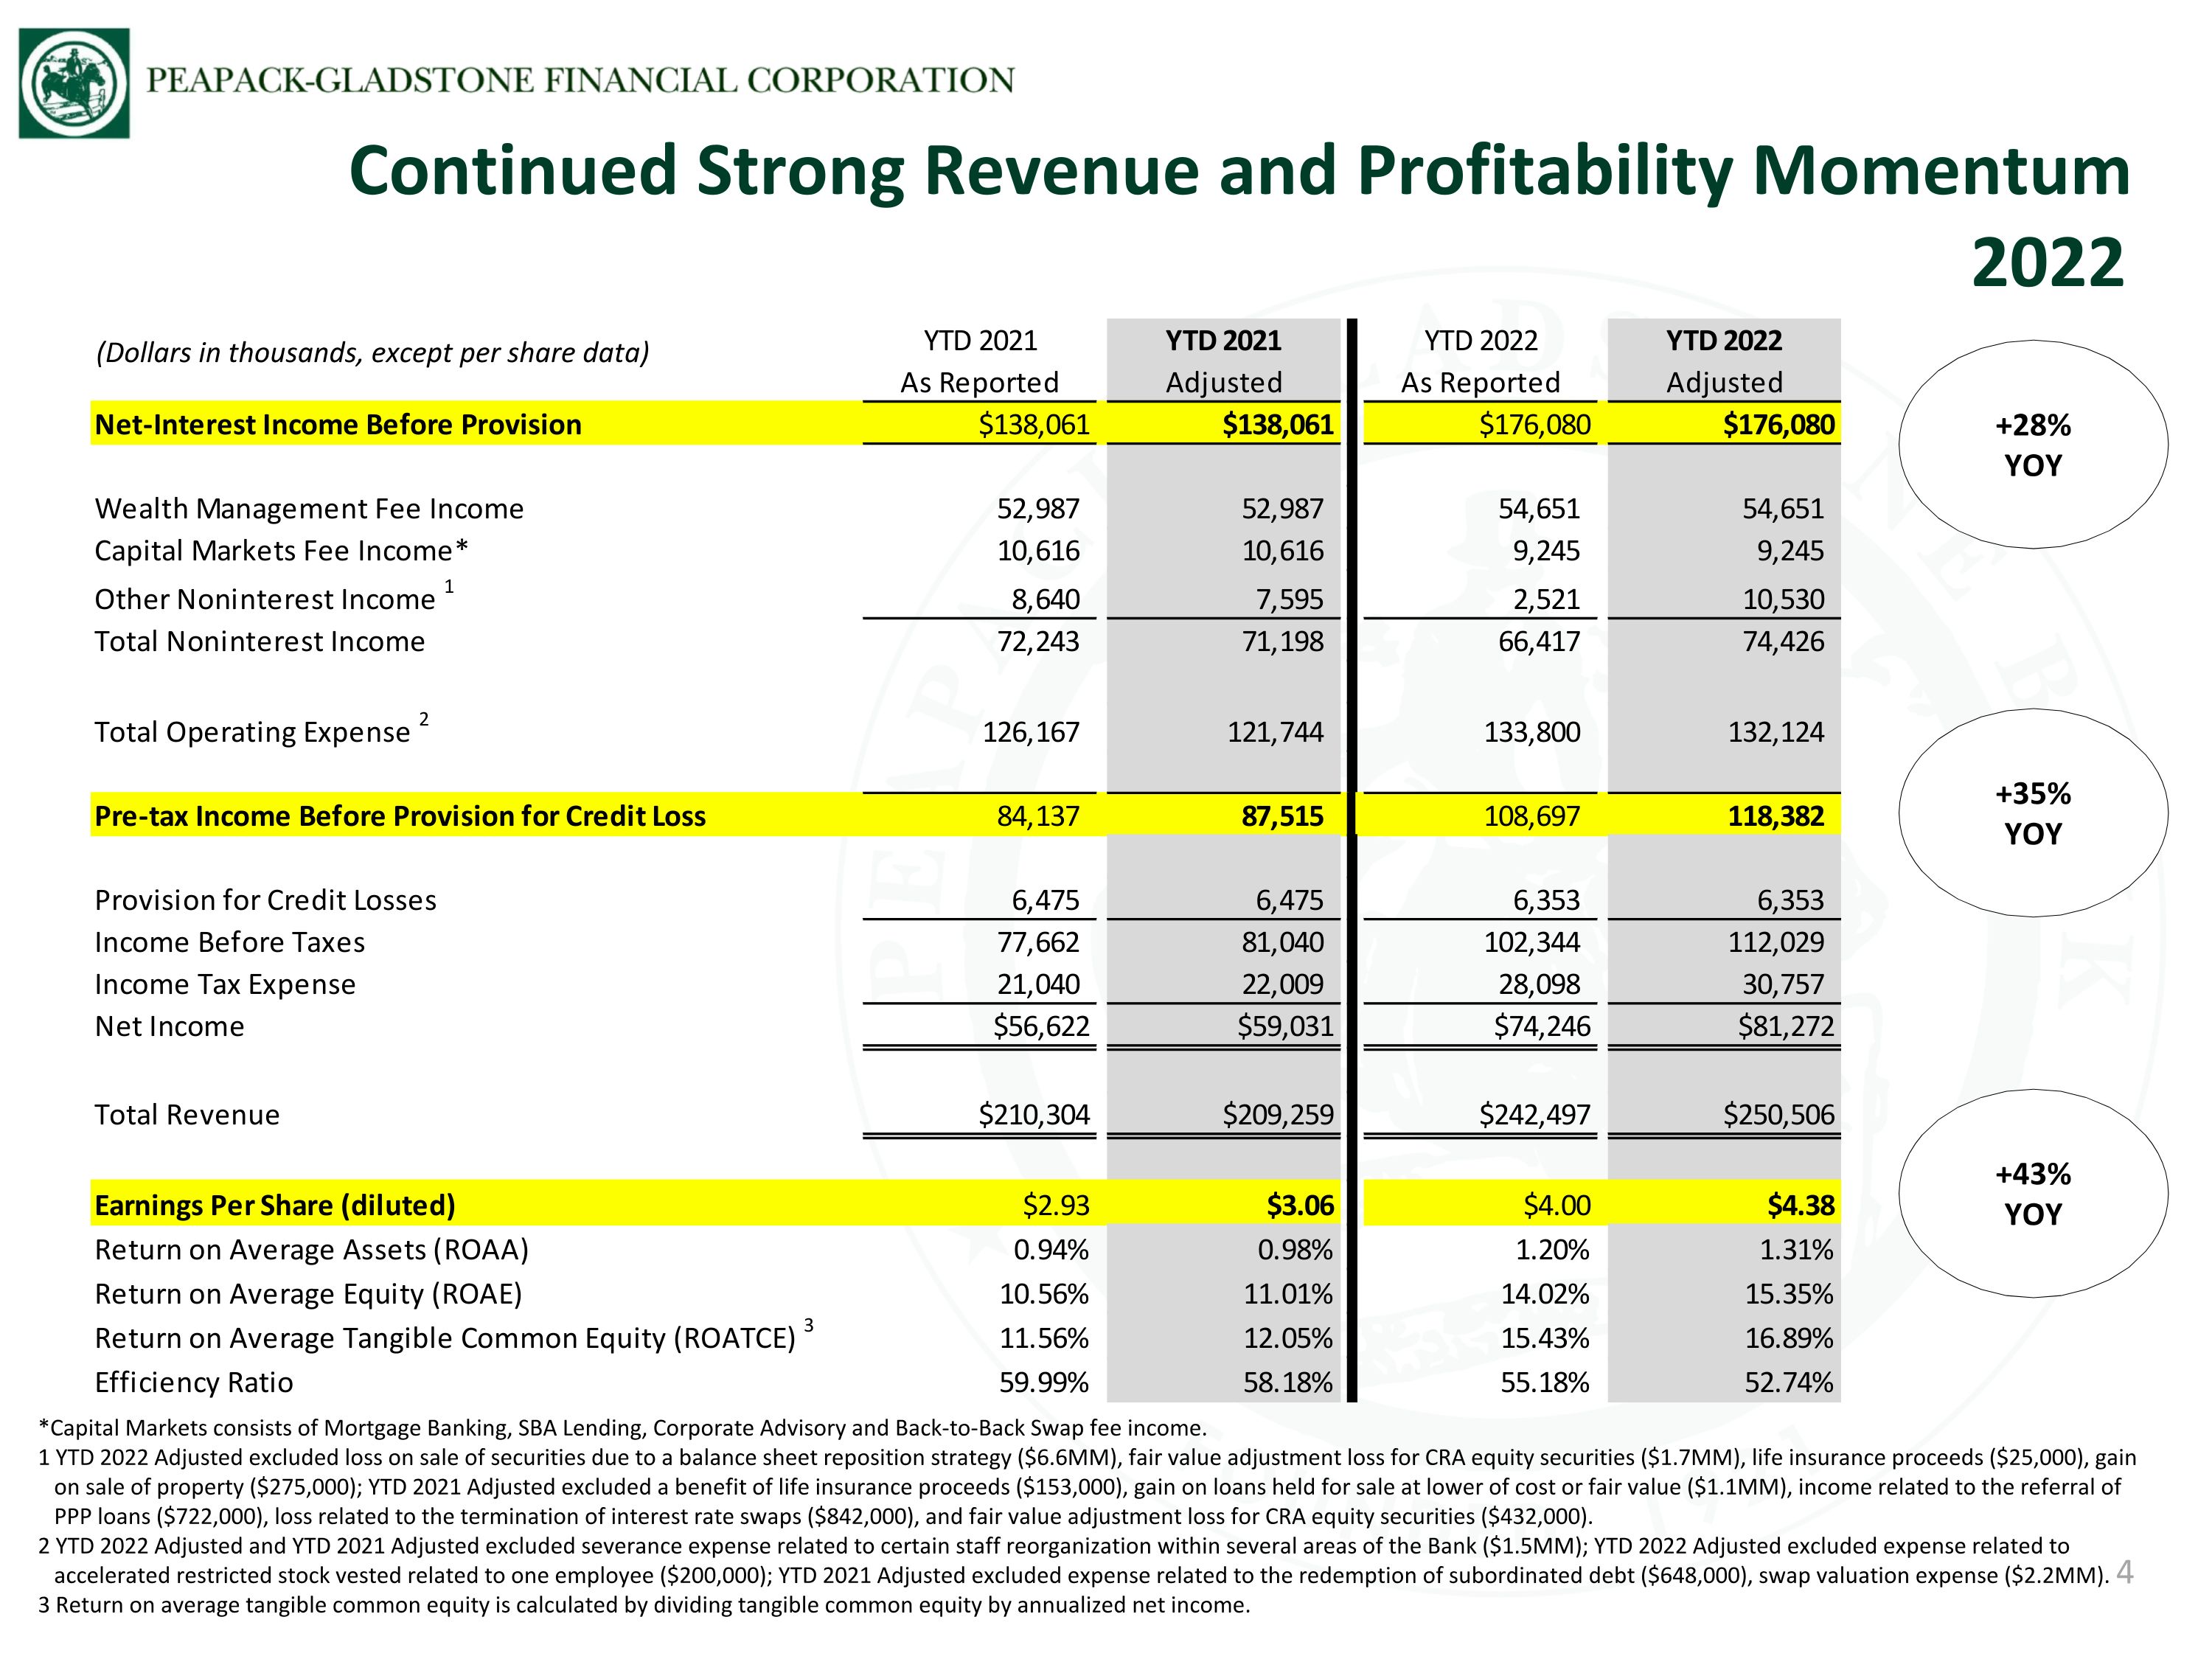
4 Continued Strong Revenue and Profitability Momentum 2022 +28% YOY (Dollars in thousands, except per share data) +43% YOY *Capital Markets consists of Mortgage Banking, SBA Lending, Corporate Advisory and Back-to-Back Swap fee income. 1 YTD 2022 Adjusted excluded loss on sale of securities due to a balance sheet reposition strategy ($6.6MM), fair value adjustment loss for CRA equity securities ($1.7MM), life insurance proceeds ($25,000), gain on sale of property ($275,000); YTD 2021 Adjusted excluded a benefit of life insurance proceeds ($153,000), gain on loans held for sale at lower of cost or fair value ($1.1MM), income related to the referral of PPP loans ($722,000), loss related to the termination of interest rate swaps ($842,000), and fair value adjustment loss for CRA equity securities ($432,000). 2 YTD 2022 Adjusted and YTD 2021 Adjusted excluded severance expense related to certain staff reorganization within several areas of the Bank ($1.5MM); YTD 2022 Adjusted excluded expense related to accelerated restricted stock vested related to one employee ($200,000); YTD 2021 Adjusted excluded expense related to the redemption of subordinated debt ($648,000), swap valuation expense ($2.2MM). 3 Return on average tangible common equity is calculated by dividing tangible common equity by annualized net income. +35% YOY
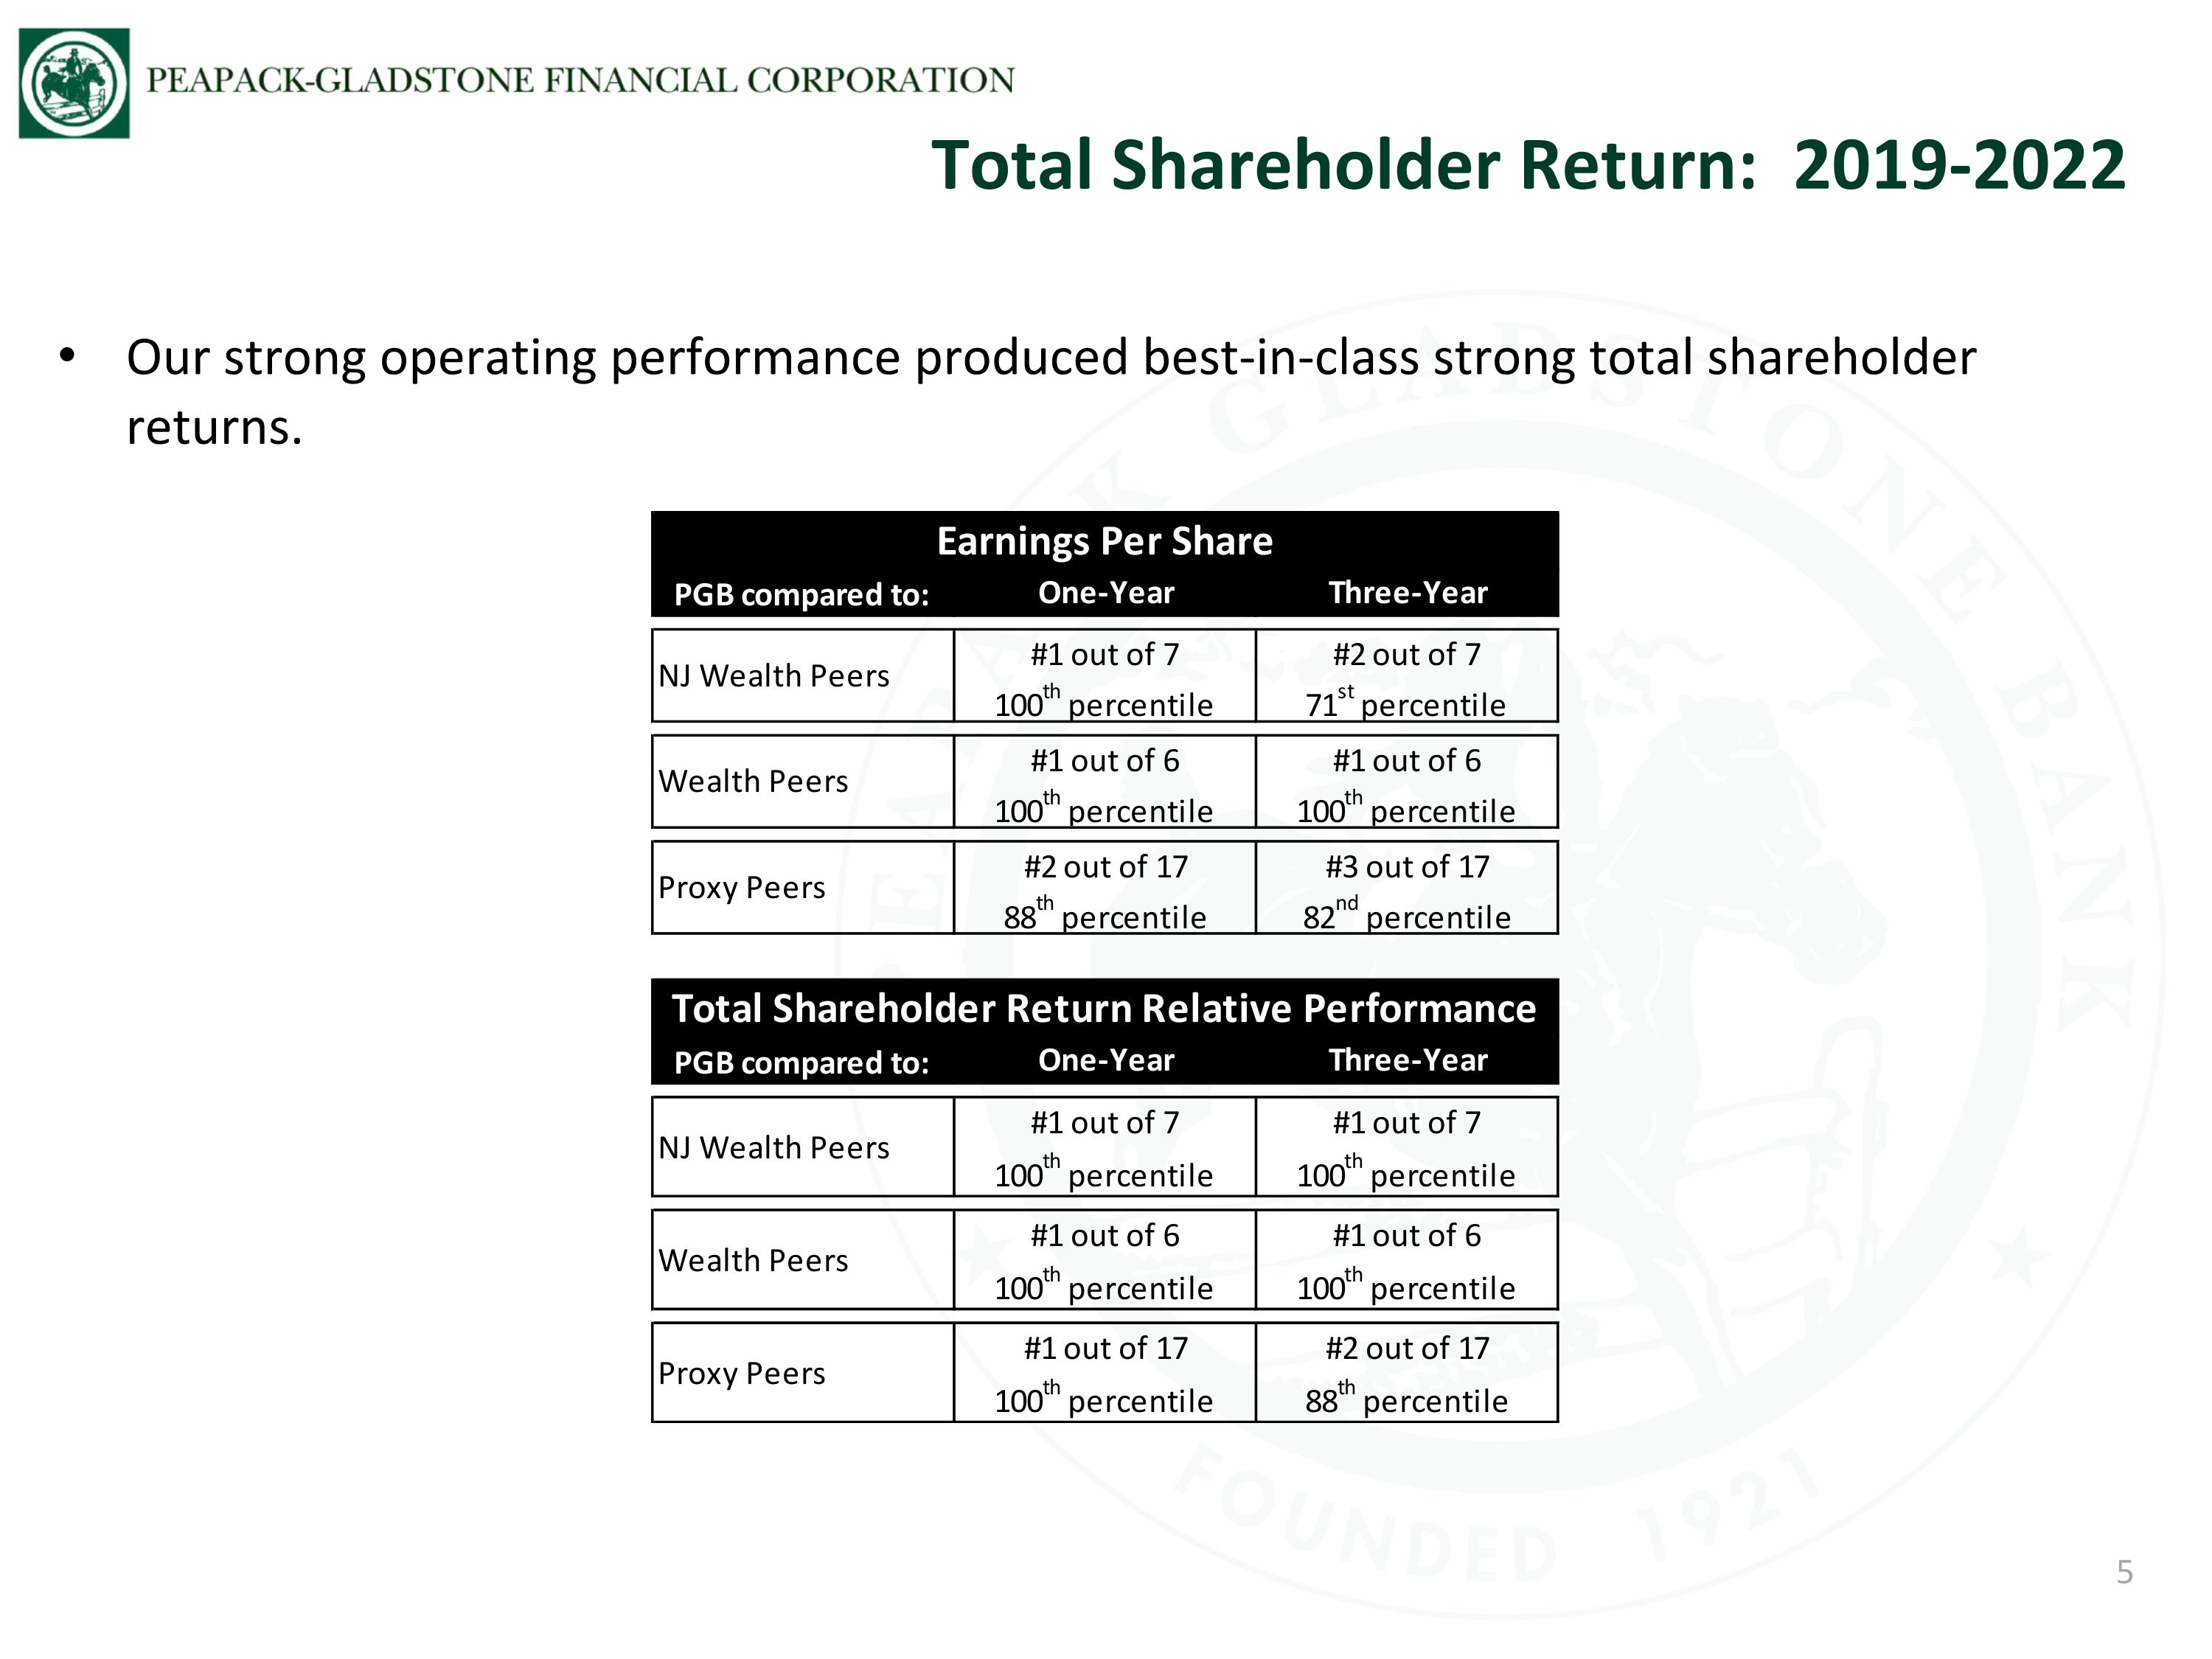
Our strong operating performance produced best-in-class strong total shareholder returns. Total Shareholder Return: 2019-2022 5
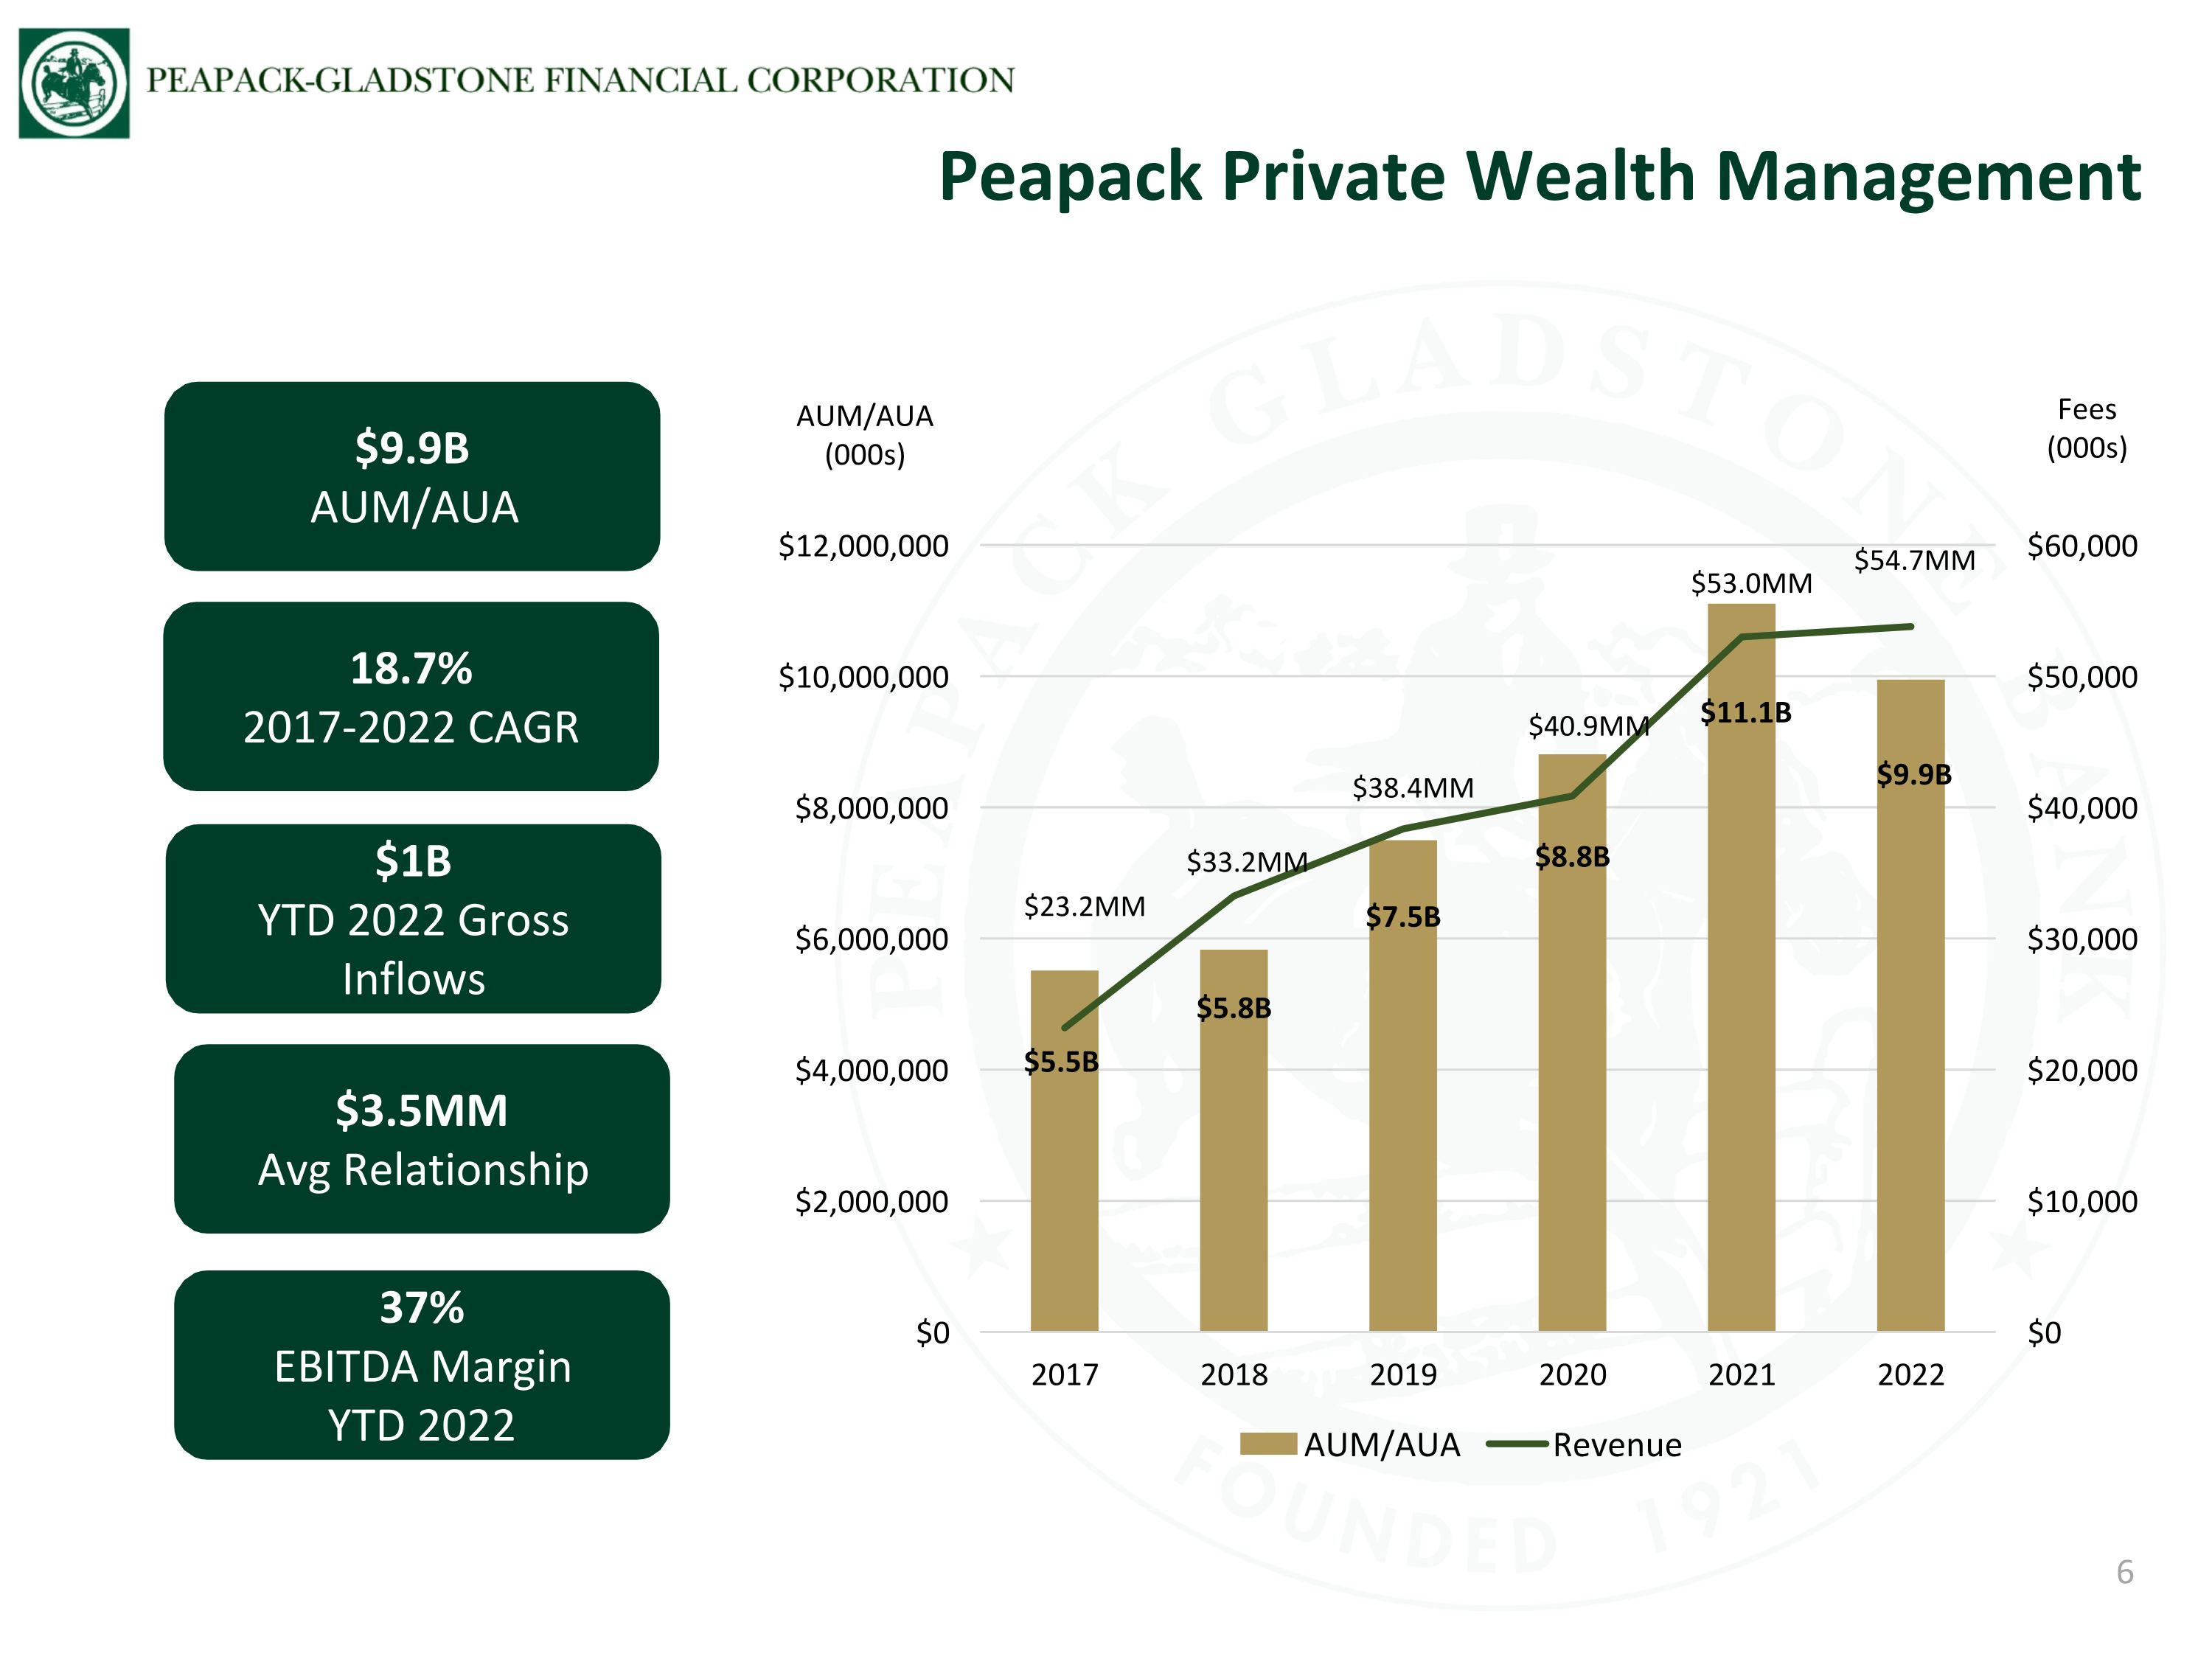
AUM/AUA (000s) Fees (000s) Peapack Private Wealth Management 6 $9.9B AUM/AUA 37% EBITDA Margin YTD 2022 18.7% 2017-2022 CAGR $3.5MM Avg Relationship $1B YTD 2022 Gross Inflows
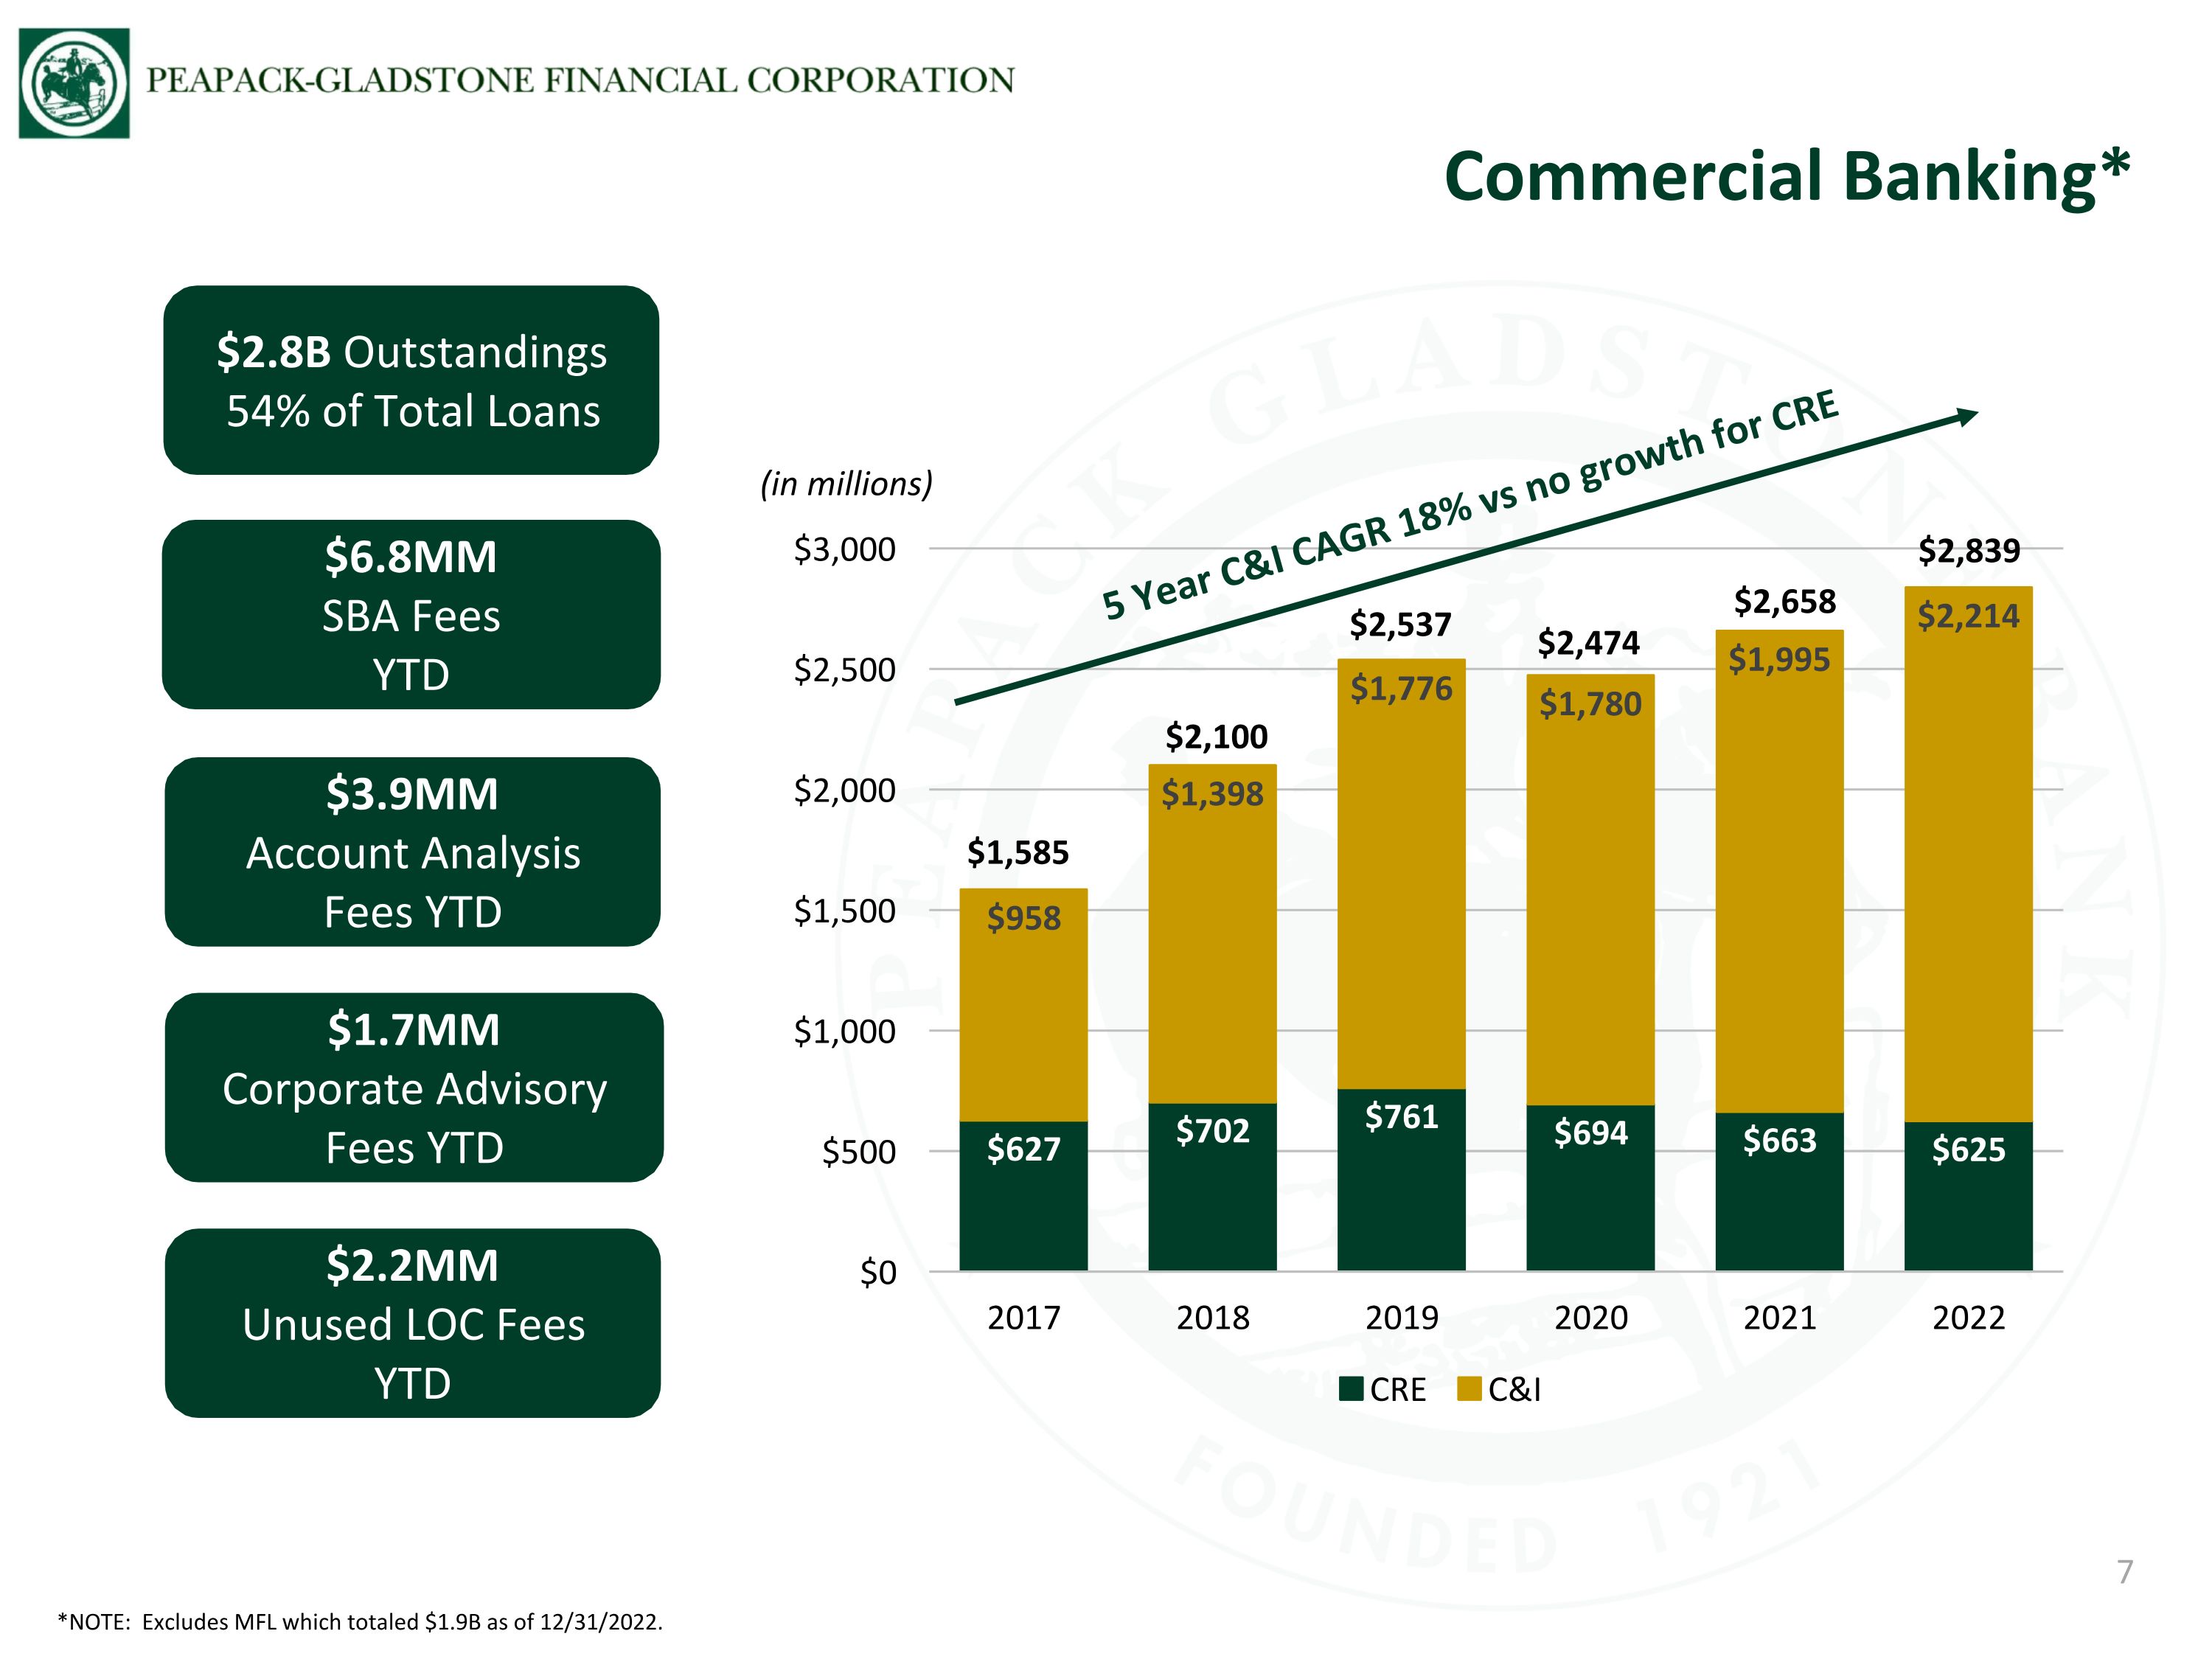
Commercial Banking* 7 $2.8B Outstandings 54% of Total Loans $6.8MM SBA Fees YTD $2.2MM Unused LOC Fees YTD (in millions) $1,585 *NOTE: Excludes MFL which totaled $1.9B as of 12/31/2022. $2,100 $2,474 $2,658 $2,537 $2,839 $3.9MM Account Analysis Fees YTD $1.7MM Corporate Advisory Fees YTD 5 Year C&I CAGR 18% vs no growth for CRE
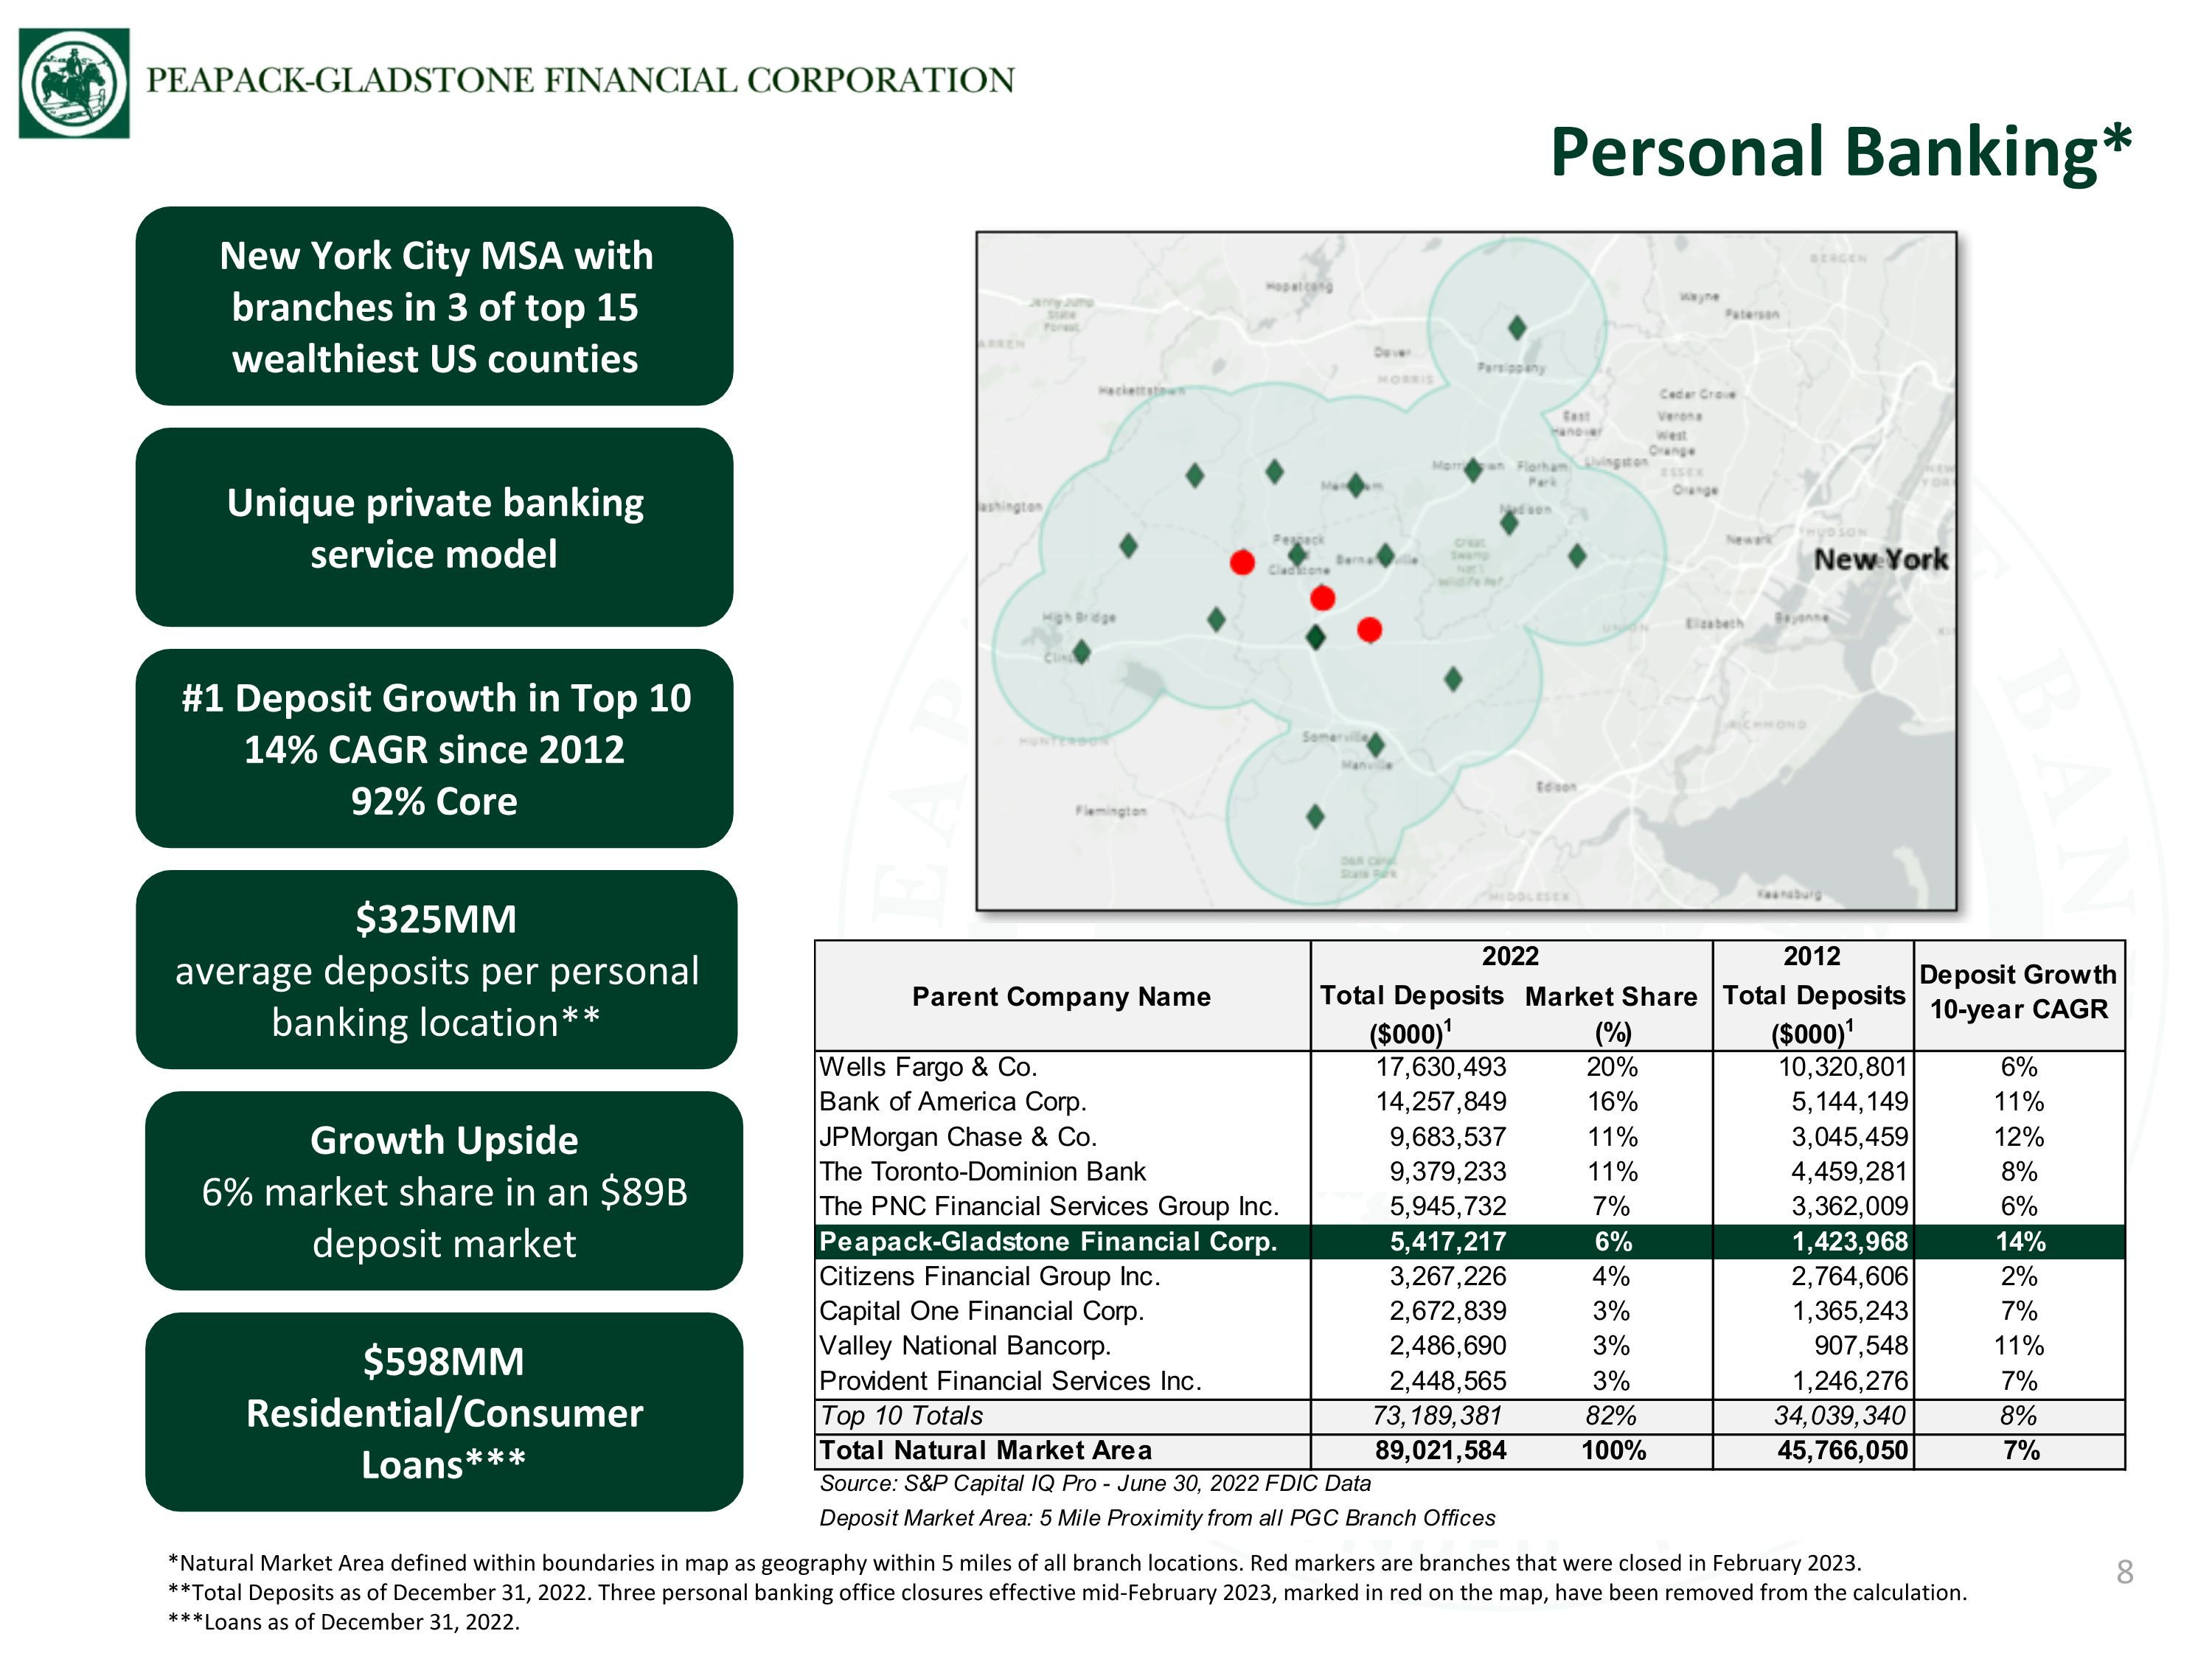
Personal Banking* 8 $325MM average deposits per personal banking location** New York City MSA with branches in 3 of top 15 wealthiest US counties #1 Deposit Growth in Top 10 14% CAGR since 2012 92% Core Unique private banking service model Growth Upside 6% market share in an $89B deposit market *Natural Market Area defined within boundaries in map as geography within 5 miles of all branch locations. Red markers are branches that were closed in February 2023. **Total Deposits as of December 31, 2022. Three personal banking office closures effective mid-February 2023, marked in red on the map, have been removed from the calculation. ***Loans as of December 31, 2022. $598MM Residential/Consumer Loans***
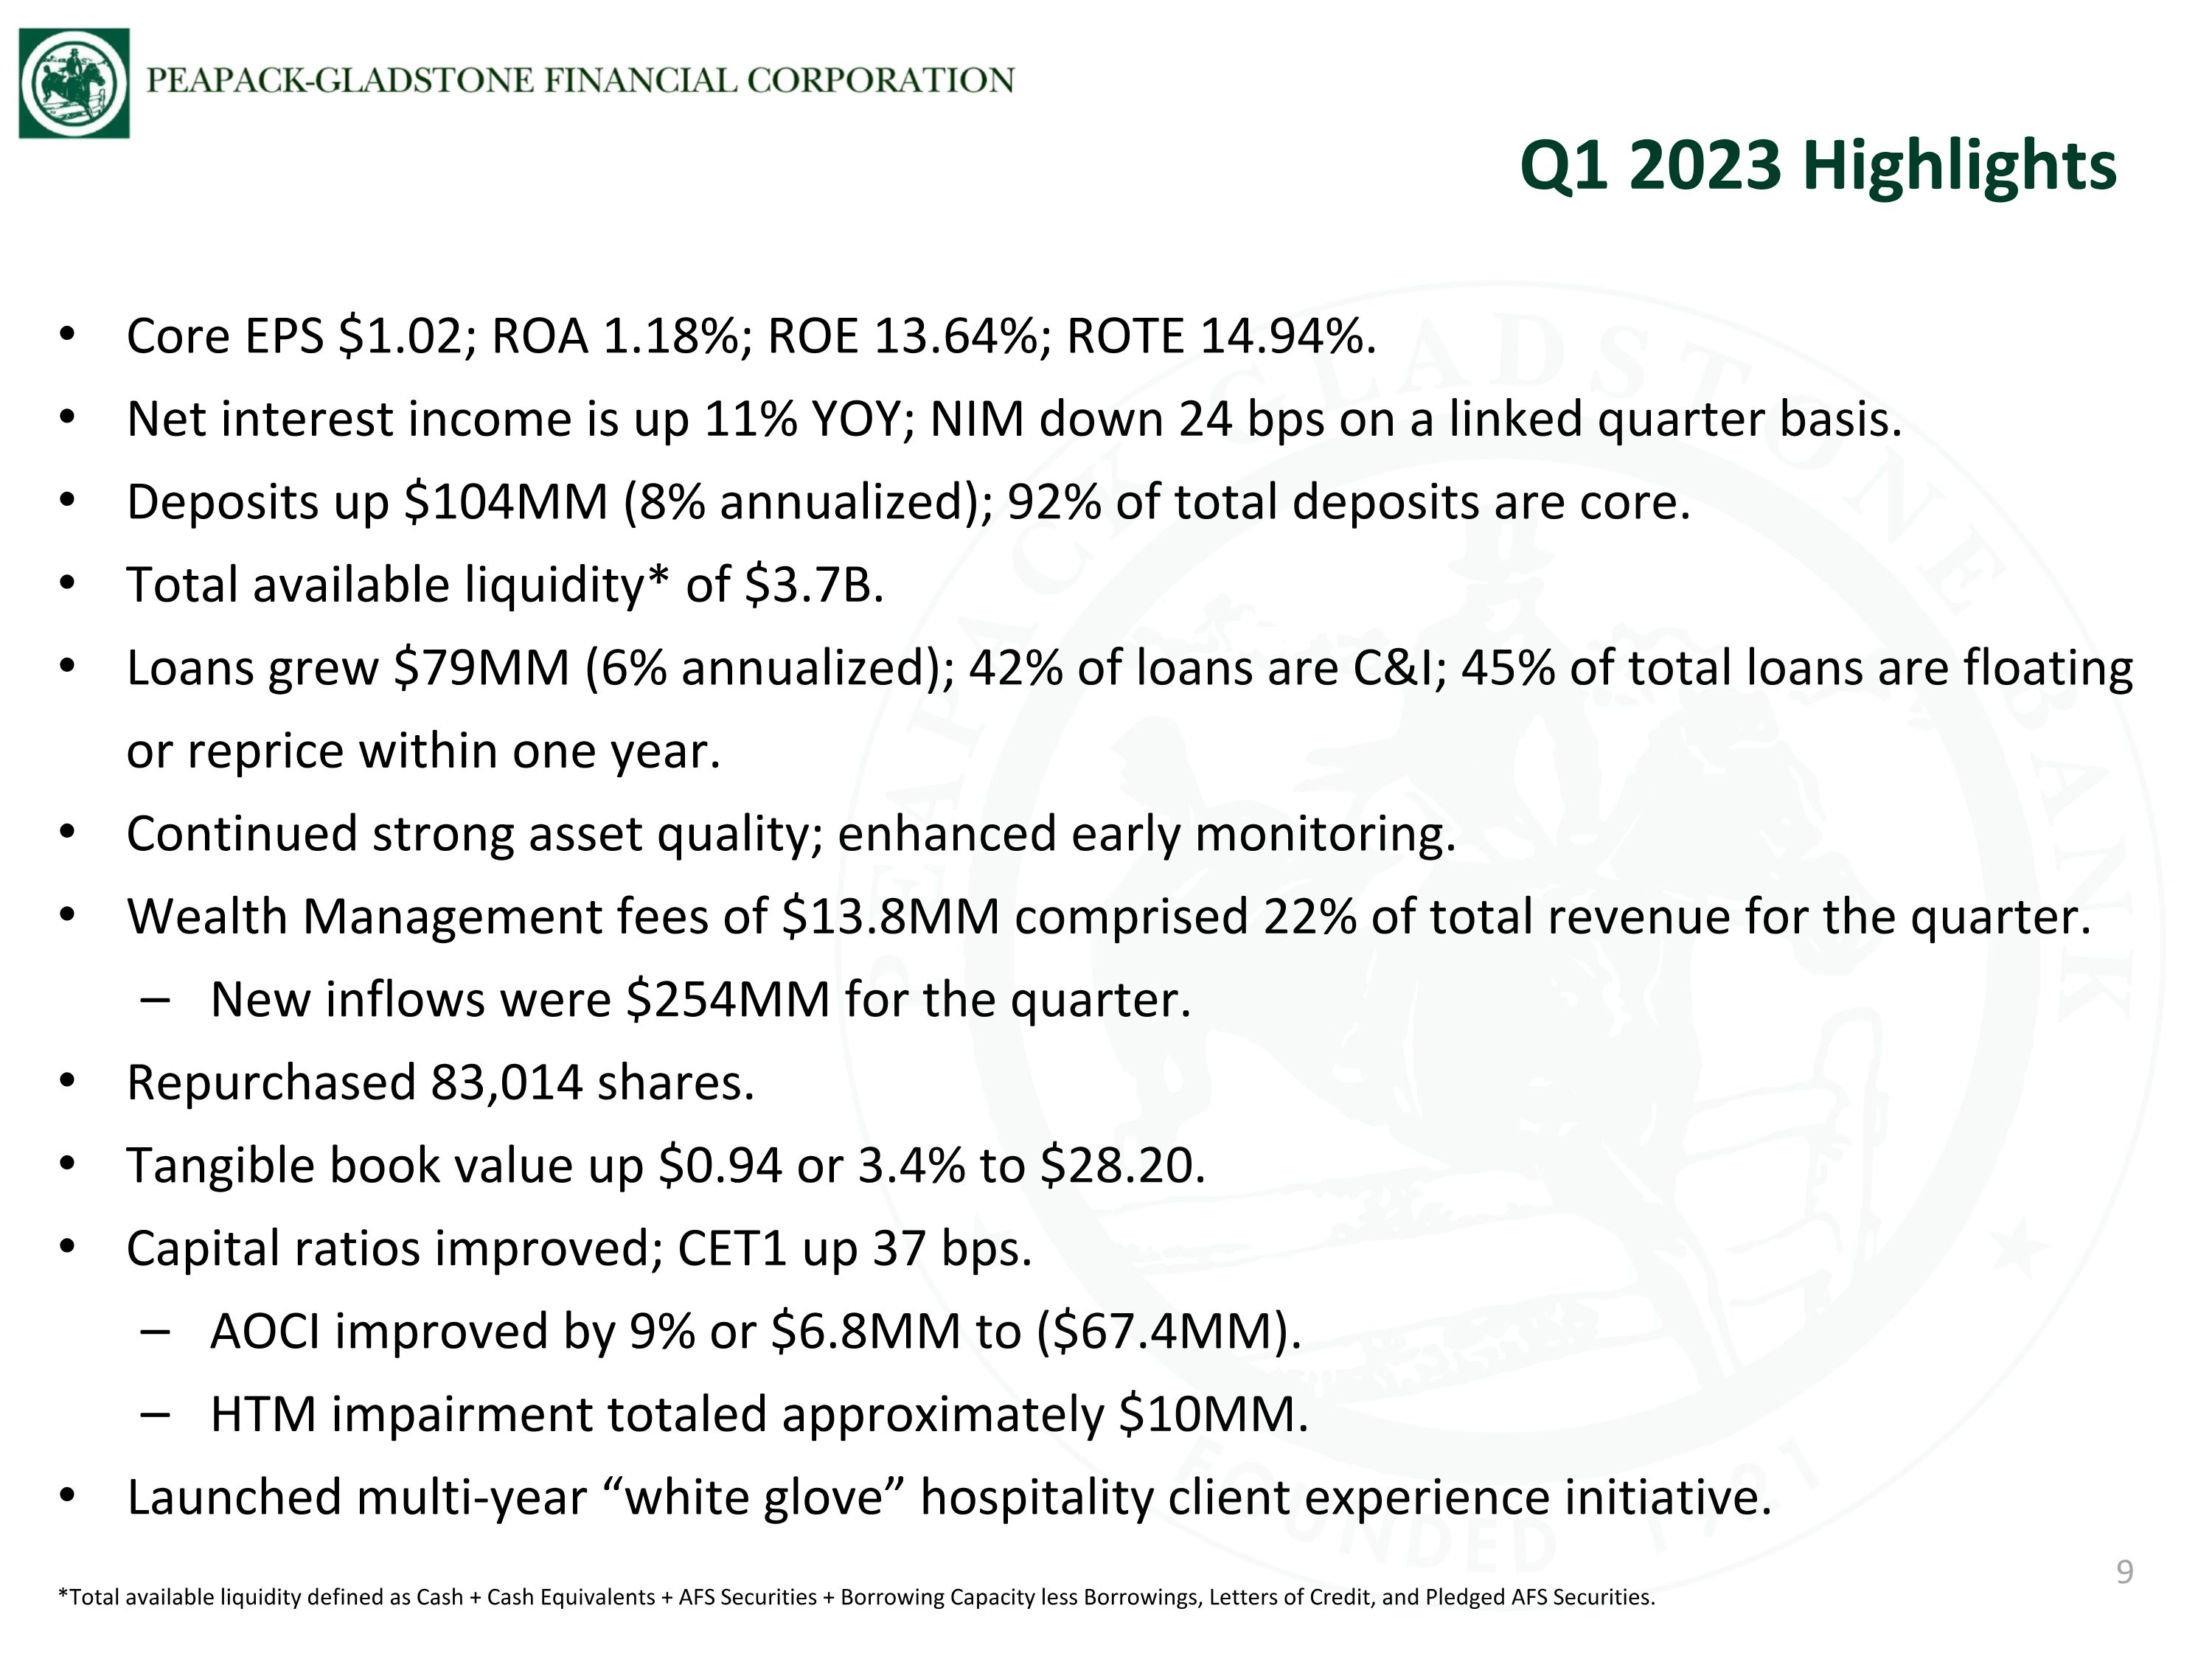
Core EPS $1.02; ROA 1.18%; ROE 13.64%; ROTE 14.94%. Net interest income is up 11% YOY; NIM down 24 bps on a linked quarter basis. Deposits up $104MM (8% annualized); 92% of total deposits are core. Total available liquidity* of $3.7B. Loans grew $79MM (6% annualized); 42% of loans are C&I; 45% of total loans are floating or reprice within one year. Continued strong asset quality; enhanced early monitoring. Wealth Management fees of $13.8MM comprised 22% of total revenue for the quarter. New inflows were $254MM for the quarter. Repurchased 83,014 shares. Tangible book value up $0.94 or 3.4% to $28.20. Capital ratios improved; CET1 up 37 bps. AOCI improved by 9% or $6.8MM to ($67.4MM). HTM impairment totaled approximately $10MM. Launched multi-year “white glove” hospitality client experience initiative. Q1 2023 Highlights 9 *Total available liquidity defined as Cash + Cash Equivalents + AFS Securities + Borrowing Capacity less Borrowings, Letters of Credit, and Pledged AFS Securities.
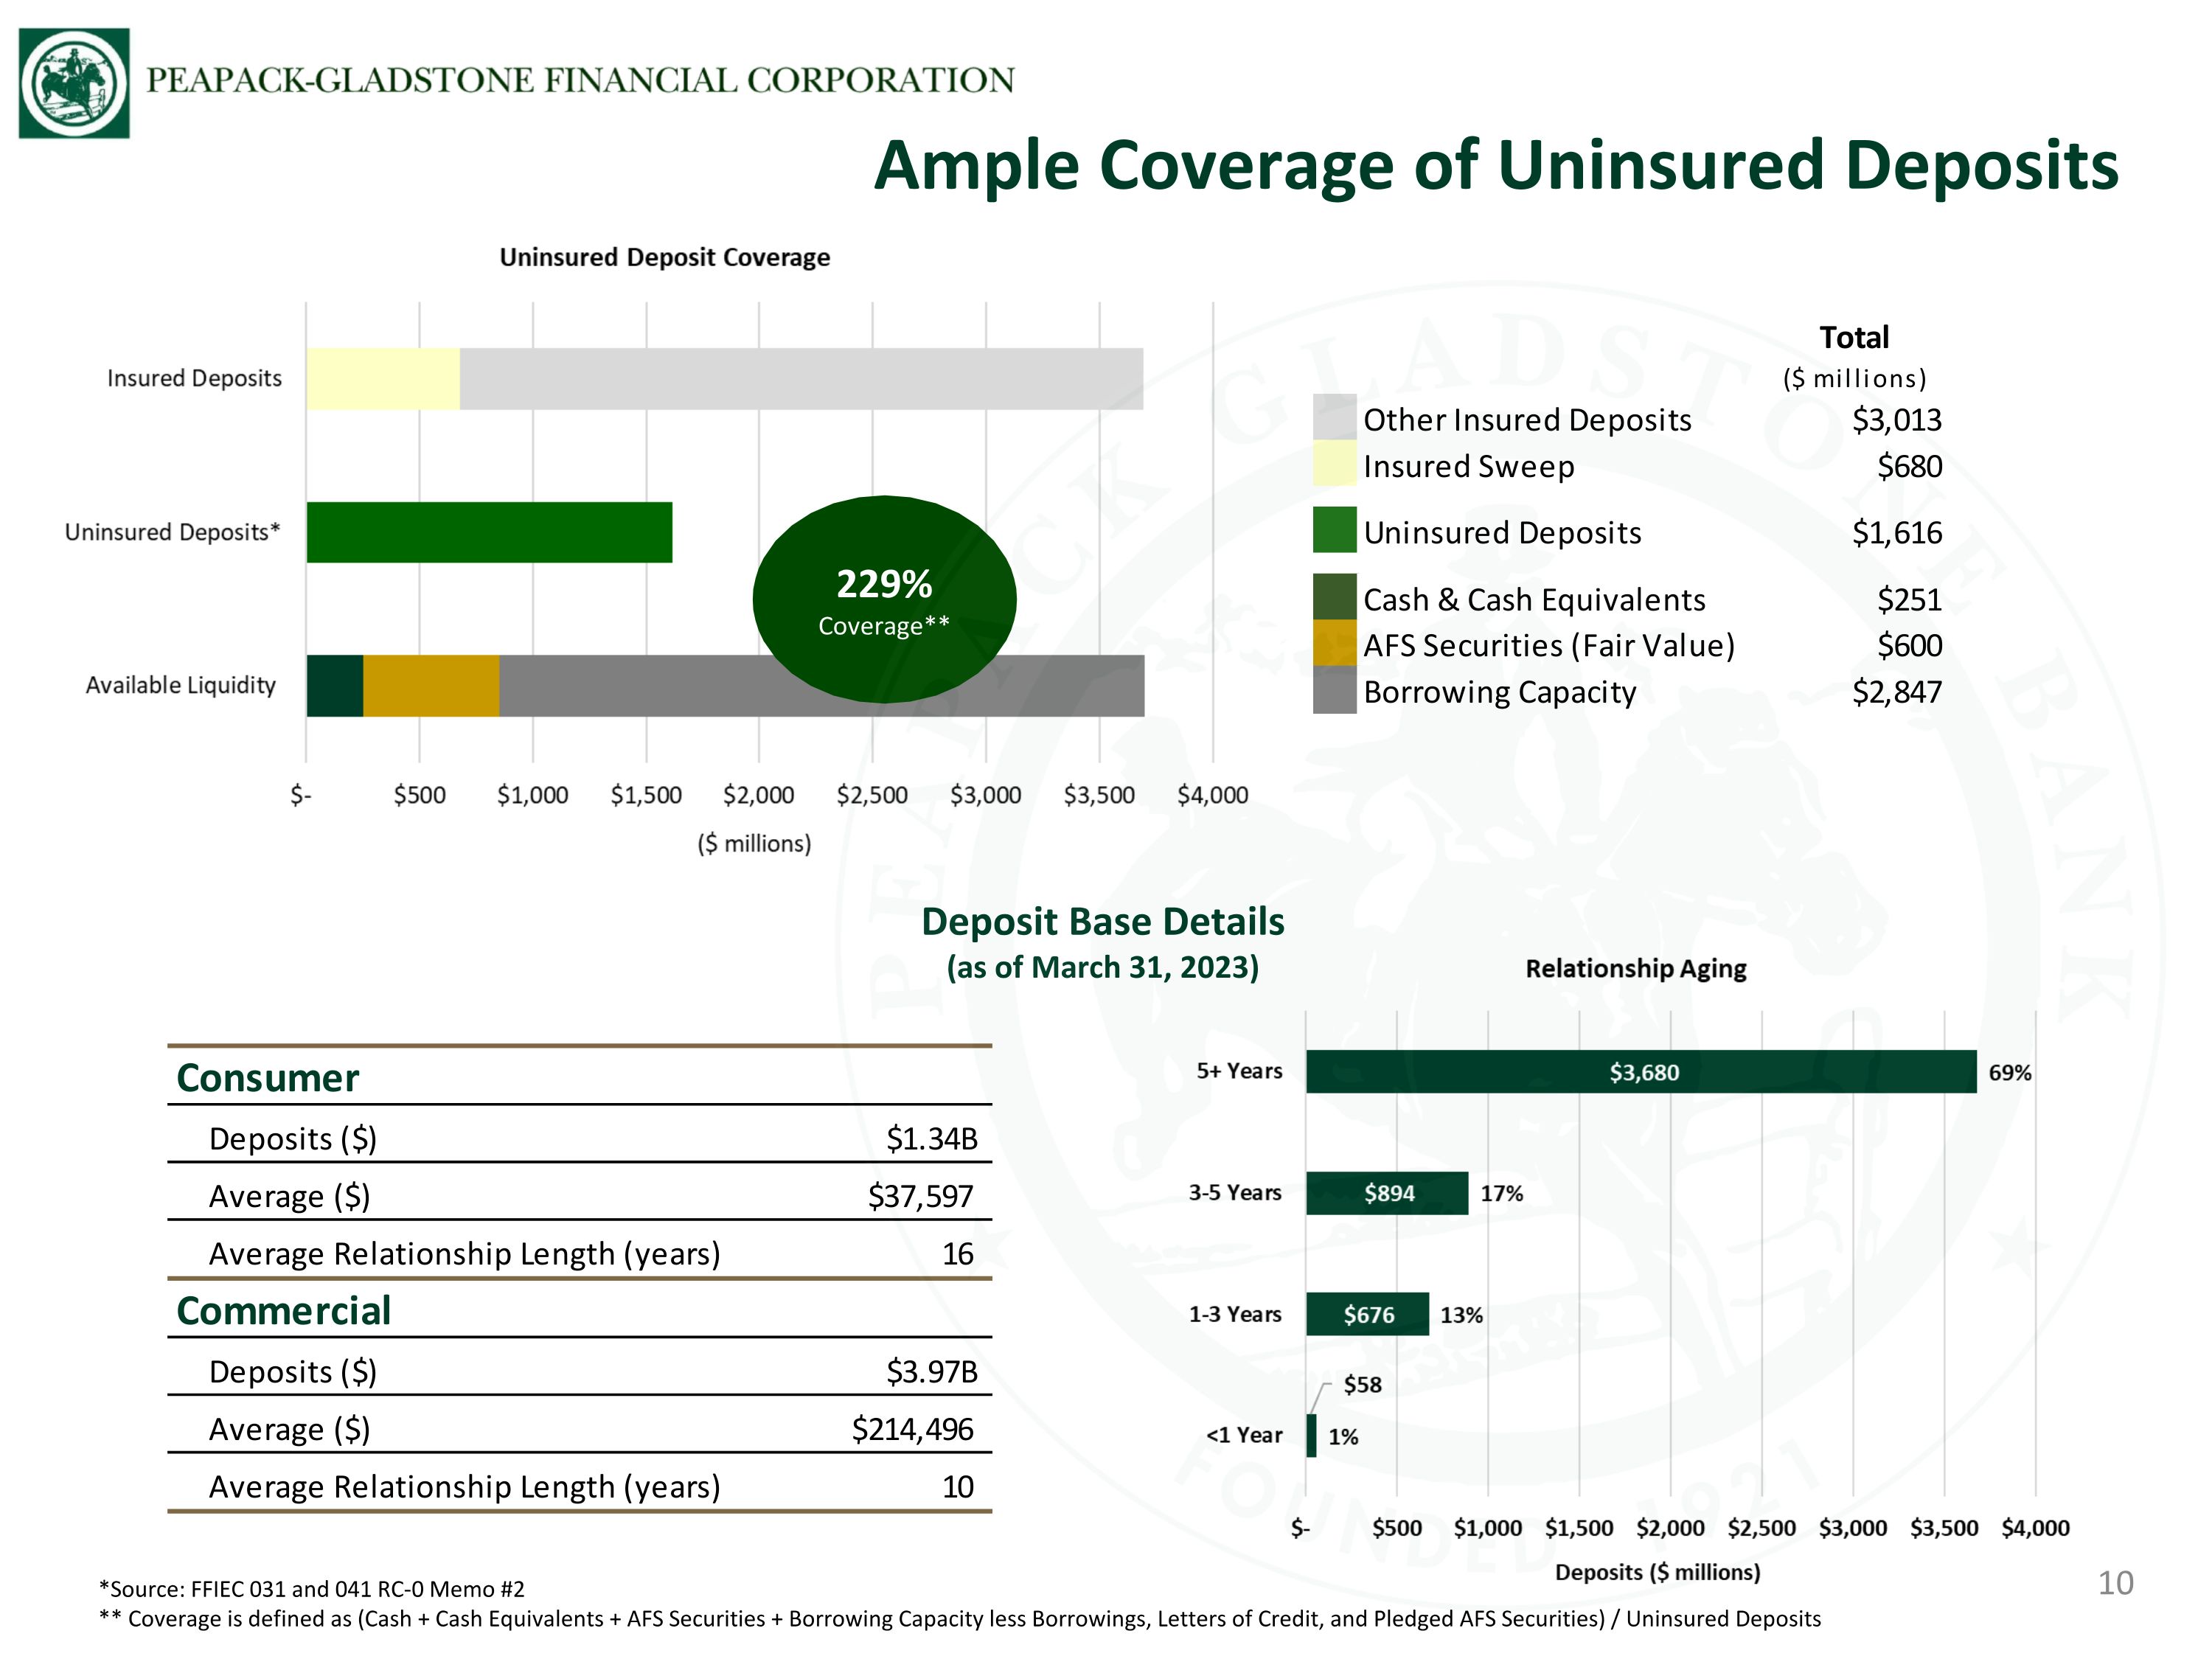
*Source: FFIEC 031 and 041 RC-0 Memo #2 ** Coverage is defined as (Cash + Cash Equivalents + AFS Securities + Borrowing Capacity less Borrowings, Letters of Credit, and Pledged AFS Securities) / Uninsured Deposits Ample Coverage of Uninsured Deposits Deposit Base Details (as of March 31, 2023) 229% Coverage**
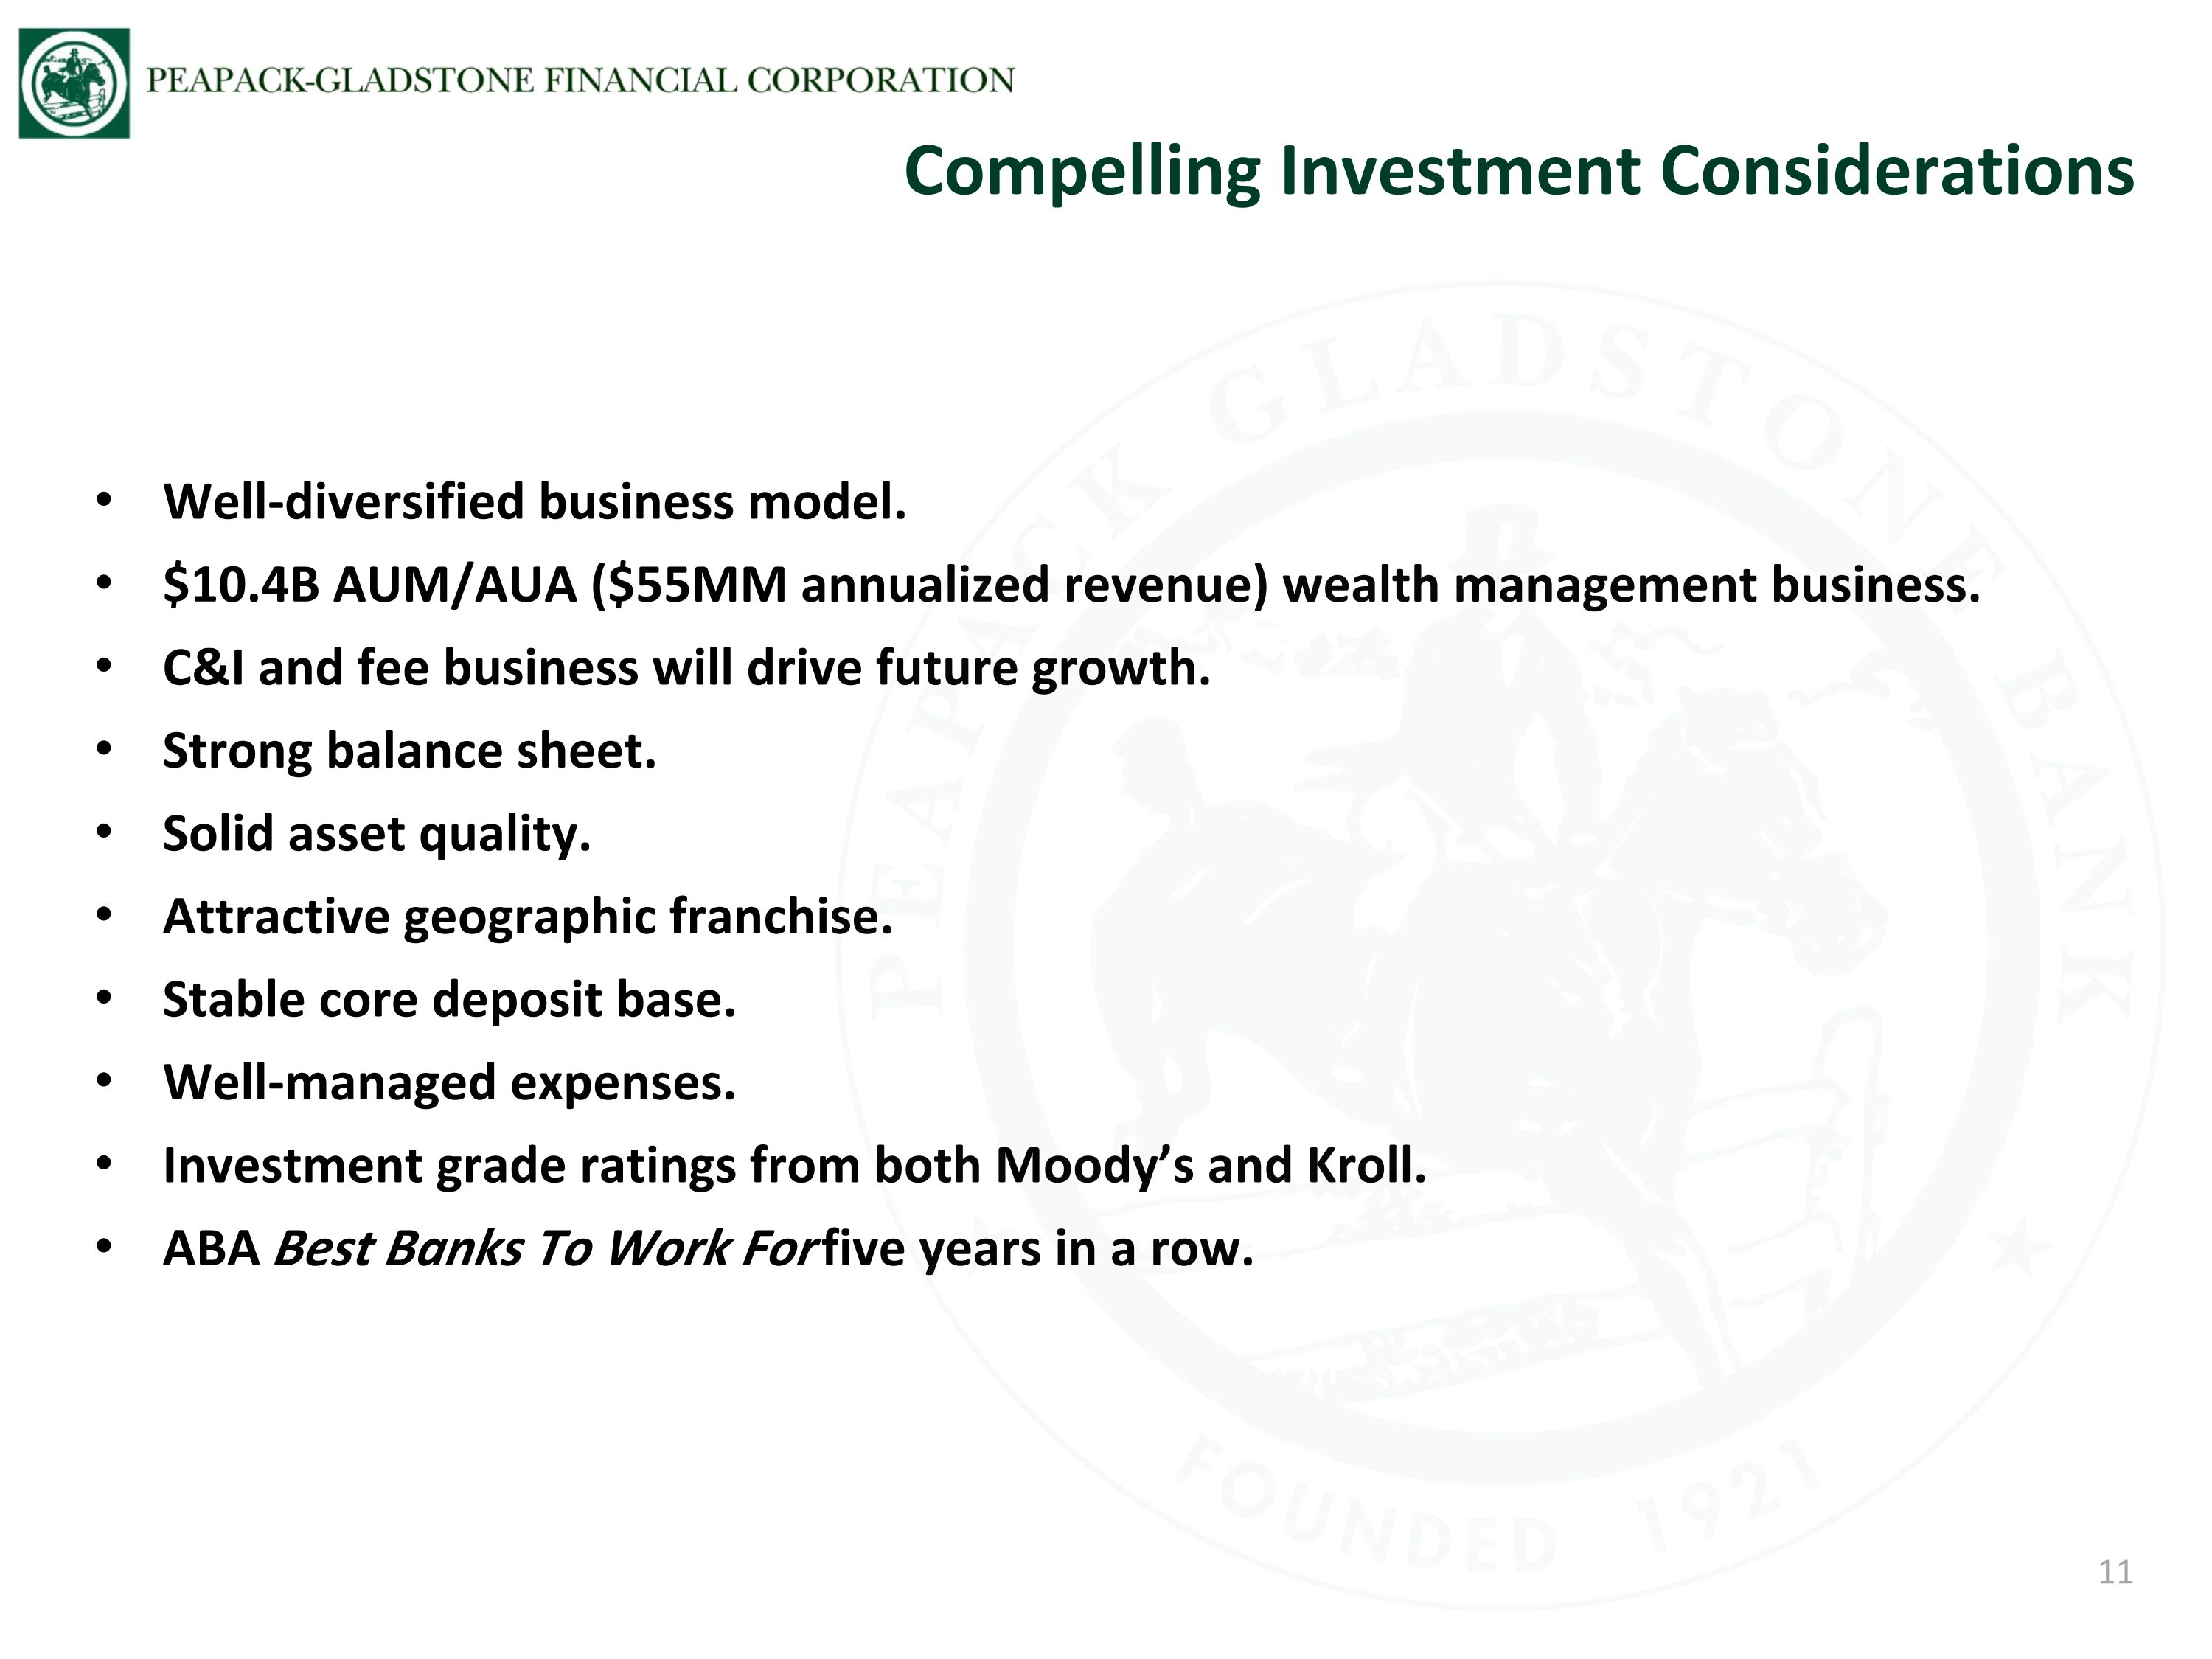
Well-diversified business model. $10.4B AUM/AUA ($55MM annualized revenue) wealth management business. C&I and fee business will drive future growth. Strong balance sheet. Solid asset quality. Attractive geographic franchise. Stable core deposit base. Well-managed expenses. Investment grade ratings from both Moody’s and Kroll. ABA Best Banks To Work For five years in a row. Compelling Investment Considerations 11

Q & A