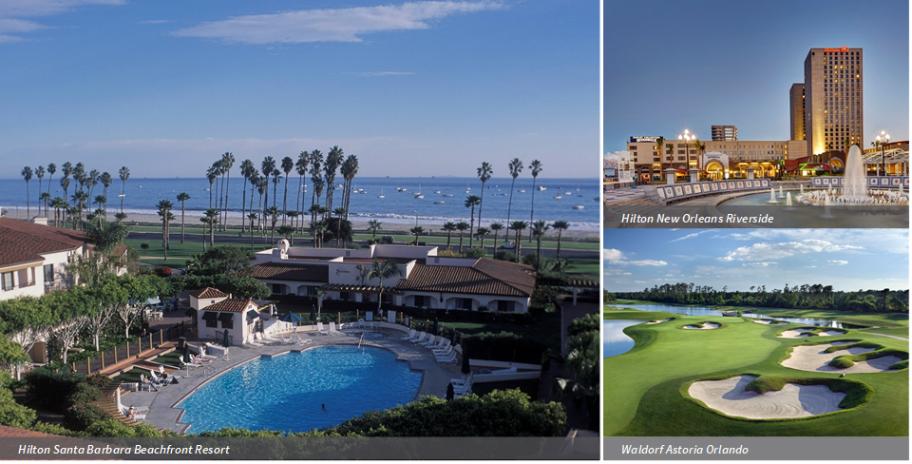
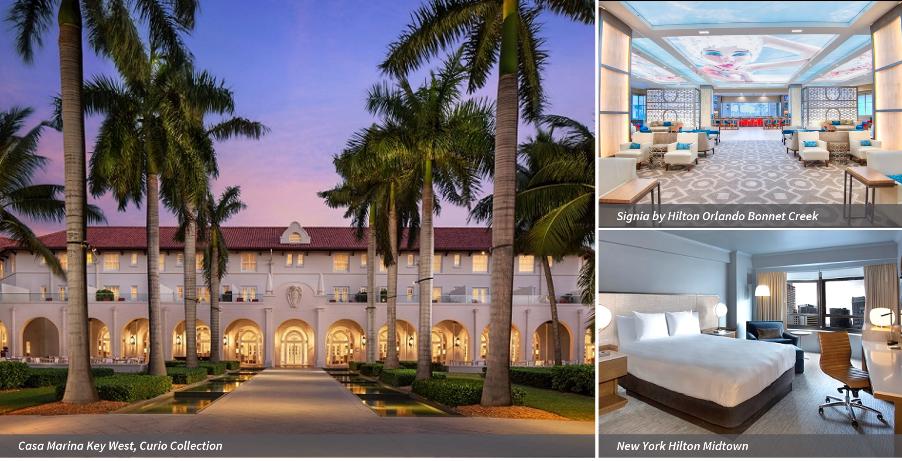
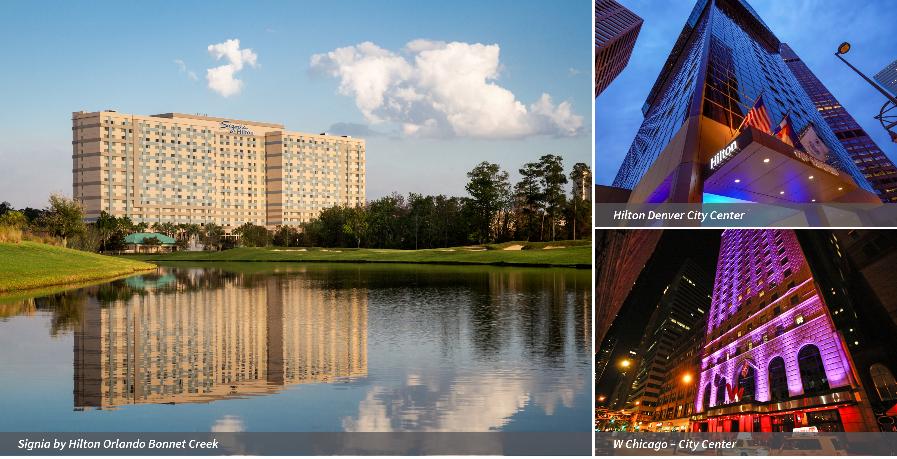
8-K
0001617406false00016174062022-05-022022-05-02


period

UNITED STATES

SECURITIES AND EXCHANGE COMMISSION

WASHINGTON, D.C. 20549


FORM 8-K


CURRENT REPORT

Pursuant to Section 13 or 15(d)

of the Securities Exchange Act of 1934

Date of Report (Date of earliest event reported): May 2, 2022


Park Hotels & Resorts Inc.

(Exact name of Registrant as Specified in Its Charter)


Delaware

001-37795

36-2058176

(State or Other Jurisdiction

of Incorporation)

(Commission

File Number)

(IRS Employer

Identification No.)


1775 Tysons Blvd., 7th Floor, Tysons, VA


22102

(Address of Principal Executive Offices)


(Zip Code)

(571) 302-5757

(Registrant’s Telephone Number, Including Area Code)

Not Applicable

(Former Name or Former Address, if Changed Since Last Report)


Check the appropriate box below if the Form 8-K filing is intended to simultaneously satisfy the filing obligation of the registrant under any of the following provisions (see General Instructions A.2. below):


Written communications pursuant to Rule 425 under the Securities Act (17 CFR 230.425)

Soliciting material pursuant to Rule 14a-12 under the Exchange Act (17 CFR 240.14a-12)

Pre-commencement communications pursuant to Rule 14d-2(b) under the Exchange Act (17 CFR 240.14d-2(b))

Pre-commencement communications pursuant to Rule 13e-4(c) under the Exchange Act (17 CFR 240.13e-4(c))

Securities registered pursuant to Section 12(b) of the Act:


Title of class

Trading Symbol

Name of exchange on which registered

Common Stock, $0.01 par value per share

PK

New York Stock Exchange

Indicate by check mark whether the registrant is an emerging growth company as defined in Rule 405 of the Securities Act of 1933 (§ 230.405 of this chapter) or Rule 12b-2 of the Securities Exchange Act of 1934 (§ 240.12b-2 of this chapter).

Emerging growth company

If an emerging growth company, indicate by check mark if the registrant has elected not to use the extended transition period for complying with any new or revised financial accounting standards provided pursuant to Section 13(a) of the Exchange Act. ☐


Item 2.02. Results of Operations and Financial Condition.

On May 2, 2022, Park Hotels & Resorts Inc. (the “Company”) issued a press release announcing its results of operations for the first quarter ended March 31, 2022 and made available certain supplemental information concerning the portfolio and operation of the Company. Copies of the press release and the supplemental information are furnished as Exhibits 99.1 and Exhibit 99.2, respectively, to this Current Report on Form 8-K.

In accordance with General Instructions B.2 of Form 8-K, the information included in Item 2.02 of this Current Report on Form 8-K (including Exhibits 99.1 and 99.2 hereto) shall not be deemed “filed” for the purposes of Section 18 of the Securities Exchange Act of 1934, as amended (the “Exchange Act”), or otherwise subject to the liabilities of that section, nor shall it be deemed incorporated by reference into any filing made by the Company under the Exchange Act or Securities Act of 1933, as amended, except as shall be expressly set forth by specific reference in such a filing.

Item 9.01. Financial Statements and Exhibits.

(d) Exhibits.


Exhibit

Number


Description


99.1


Press release dated May 2, 2022.

99.2


First Quarter 2022 Supplemental Data.

104


Cover Page Interactive Data File (embedded within the Inline XBRL document).


SIGNATURES

Pursuant to the requirements of the Securities Exchange Act of 1934, the registrant has duly caused this report to be signed on its behalf by the undersigned thereunto duly authorized.


Park Hotels & Resorts Inc.


Date: May 2, 2022


By:

/s/ Sean M. Dell’Orto


Sean M. Dell’Orto


Executive Vice President, Chief Financial Officer and Treasurer


Exhibit 99.1

img186621066_0.jpg 


Investor Contact

1775 Tysons Boulevard, 7th Floor

Ian Weissman

Tysons, VA 22102

+ 1 571 302 5591

www.pkhotelsandresorts.com


Park Hotels & Resorts Inc. Reports First Quarter 2022 Results

TYSONS, VA (May 2, 2022) – Park Hotels & Resorts Inc. (“Park” or the “Company”) (NYSE: PK) today announced results for the first quarter ended March 31, 2022 and provided an operational update.


First quarter financial highlights include:

RevPAR was $116.42, an increase of $75.10, or 181.7%, on a pro-forma basis from the same period in 2021 and a decrease of 32.8% on a pro-forma basis from the same period in 2019;
Occupancy for Park’s 46 consolidated hotels open during the first quarter was 54.4%;
Net loss and net loss attributable to stockholders were $(56) million and $(57) million, respectively, which represent an improvement of 70.7% and 70.0%, respectively, compared to the same period in 2021;
Adjusted EBITDA was $82 million, an increase of 1.8%, compared to the fourth quarter of 2021;
Hotel Adjusted EBITDA was $89 million, an improvement on a pro-forma basis of 4.2%, compared to the fourth quarter of 2021;
Adjusted FFO attributable to stockholders was $18 million, an improvement of 66.6%, compared to the fourth quarter of 2021;
Diluted loss per share was $(0.24), an improvement of $0.57, or 70.4%, compared to the same period in 2021; and
Diluted Adjusted FFO per share was $0.08, an improvement of $0.56, or 116.7%, compared to the same period in 2021.


Additional highlights include:


Reopened the 314-room Hilton Short Hills, NJ, and expect to open our last remaining suspended hotel, the Parc 55 San Francisco - a Hilton Hotel, on May 19, 2022 based on improving demand trends in the San Francisco market;
Moody’s Investors Service upgraded Park’s outlook to Stable from Negative;
Repurchased 3.4 million shares of common stock at an average price of $17.99 per share, or $61 million;
Reinstated Park's quarterly cash dividend, declaring $0.01 per share to stockholders of record as of March 31, 2022;
Converted the Casa Marina Key West from a Waldorf Astoria Resort to a Curio in March 2022;
Amended the credit facility to provide, among other changes, an extension of covenant relief and the removal or reduction of certain restrictions, including certain limitations on asset sales and stock repurchases; and
Sold the 131-room Hampton Inn & Suites Memphis – Shady Grove in April 2022 for gross proceeds of $11.5 million or $88,000 per key.


Thomas J. Baltimore, Jr., Chairman and Chief Executive Officer, stated, “I am extremely pleased with Park's first quarter results, which came in well ahead of expectations due to encouraging demand growth across our portfolio from both leisure and business travel. Strong leisure demand continued in Hawaii, Florida and Puerto Rico, while business and group demand in our San Francisco, New York, Boston, Washington, D.C. and Chicago markets witnessed solid gains during the second half of the quarter, which have accelerated into April. Despite some disruption from the Omicron variant during the first six weeks of the quarter, we continued to generate positive Hotel Adjusted EBITDA for the quarter and surpassed 2019 average daily rate for the portfolio for the first time since the start of the pandemic. Looking ahead, I am very encouraged by the accelerating demand trends we have been seeing month to month for the balance of the year and expect Park's diversified portfolio to benefit across all major segments. With current liquidity of over $1.5 billion, we are well positioned to seek out opportunities throughout the year to execute Park's business and growth strategies."


1


Selected Statistical and Financial Information

(unaudited, amounts in millions, except Pro-forma RevPAR, Pro-forma ADR and per share data)


Three Months Ended March 31,


2022


2021


Change ($)


Change(1)


Pro-forma RevPAR


$

116.42


$

41.32


$

75.10


181.7

%


Pro-forma Occupancy


51.9

%


26.6

%


N/A


25.3

%

pts

Pro-forma ADR


$

224.42


$

155.60


$

68.82


44.2

%


Pro-forma Total RevPAR


$

184.11


$

61.04


$

123.07


201.6

%


Net loss


$

(56

)


$

(191

)


$

135


70.7

%


Net loss attributable to stockholders


$

(57

)


$

(190

)


$

133


70.0

%


Adjusted EBITDA


$

82


$

(49

)


$

131


267.3

%


Pro-forma Hotel Adjusted EBITDA


$

89


$

(32

)


$

121


376.1

%


Pro-forma Hotel Adjusted EBITDA margin


19.3

%


(21.1

)%


N/A


4,040 bps


Adjusted FFO attributable to stockholders


$

18


$

(113

)


$

131


115.9

%


Loss per share - Diluted(1)


$

(0.24

)


$

(0.81

)


$

0.57


70.4

%


Adjusted FFO per share - Diluted(1)


$

0.08


$

(0.48

)


$

0.56


116.7

%


Weighted average shares outstanding - Diluted


235


236


N/A


(1

)


(1)

Amounts are calculated based on unrounded numbers.


Operational Update


Since originally suspending hotel operations, Park has reopened all hotels except the 1,024-room Parc 55 San Francisco – a Hilton Hotel, which is anticipated to reopen earlier than expected on May 19, 2022, based on improving demand trends in the San Francisco market.

Changes in Park's 2022 Pro-forma ADR, Occupancy and RevPAR compared to the same periods in 2021 and 2019, and 2022 Occupancy for Park’s 48 consolidated hotels owned as of March 31, 2022 were as follows:


Change in Pro-forma ADR


Change in Pro-forma Occupancy


Change in Pro-forma RevPAR


2022 vs. 2021


2022 vs. 2019


2022 vs. 2021


2022 vs. 2019


2022 vs. 2021


2022 vs. 2019


2022 Occupancy


Jan 2022


49.5

%


(10.7

)%


18.6

%

 pts


(31.8

)%

 pts


179.7

%


(50.3

)%


40.0

%

Feb 2022


45.8


2.0


27.6


(25.0

)


204.9


(30.8

)


52.9


Mar 2022


40.3


6.0


30.0


(19.4

)


168.2


(18.9

)


62.9


Q1 2022


44.2


0.1


25.3


(25.4

)


181.7


(32.8

)


51.9


Preliminary Apr 2022


36.2


7.8


33.2


(14.2

)


159.0


(10.4

)


70.1


Changes in Park's 2022 Pro-forma ADR, Occupancy and RevPAR compared to the same periods in 2021 and 2019, and 2022 Occupancy for only the consolidated hotels owned as of March 31, 2022 and open for the entirety of each period were as follows:


Number of Consolidated


Change in Pro-forma ADR


Change in Pro-forma Occupancy


Change in Pro-forma RevPAR


Hotels Open


2022 vs. 2021


2022 vs. 2019


2022 vs. 2021


2022 vs. 2019


2022 vs. 2021


2022 vs. 2019


2022 Occupancy


Jan 2022

46


49.5

%


(8.4

)%


19.5

%


(29.5

)%

pts


179.7

%


(46.2

)%


42.0

%

Feb 2022

46


45.8


3.4


29.0


(22.1

)


204.9


(26.0

)


55.5


Mar 2022

47


40.3


7.1


31.1


(16.7

)


168.2


(14.7

)


65.3


Q1 2022

46


44.3


1.8


26.5


(22.7

)


181.1


(28.2

)


54.4


Preliminary Apr 2022

47


36.2


8.9


34.5


(11.3

)


159.0


(5.8

)


72.8


For the first quarter of 2022, Park’s portfolio generated positive Hotel Adjusted EBITDA for the fourth consecutive quarter with 33 of 46 of Park’s open consolidated hotels exceeding break-even levels.

2


Domestic leisure transient demand continues to grow compared to 2021 as a result of the easing of domestic restrictions, despite some disruption from virus variants; however, some restrictions on international travel remain in place. The Rooms Revenue mix for the three months ended March 31, 2022, 2021, 2020 and 2019 for the 46 consolidated hotels open the entirety of the first quarter of 2022 were as follows:


Three Months Ended March 31,


2022


2021


2020


2019


Group


25.2

%


6.9

%


33.4

%


34.5

%

Transient


68.1


81.2


58.0


58.8


Contract


4.8


10.3


6.2


4.6


Other


1.9


1.6


2.4


2.1


Park saw an improvement in demand beginning in mid-February 2022 as COVID-19 cases declined across the country, business travel accelerated and group demand began to return to Park's urban hotels. In March 2022, group bookings for the remainder of 2022 and 2023 tripled, an increase of approximately 200,000 room nights, up from approximately 65,000 room nights in February 2022. As of the end of March 2022, group bookings for the remainder of 2022 were approximately 66% of what 2019 group bookings were as of March 2019, an improvement of 400 basis points from December 2021, with average group rate in line with 2019 levels for the same time period. Group bookings for 2023 are 73% of what 2019 group bookings were as of March 2018, with average group rates exceeding 2019 average group rates by 2.5% for the same time period.

Additionally, group lead volumes continue to increase, with March 2022 lead demand up over 30% compared to January 2022, representing approximately 90% of 2019 levels. Mid-week occupancies, excluding resort hotels, more than doubled to 54% in March of 2022 compared to the end of January 2022, signaling continued recovery of business transient demand.


Highlights for Park's consolidated hotels owned as of March 31, 2022 in each of the Company’s key markets, segmented between leisure and other markets, are as follows:

Leisure Markets

Hawaii: Park's Hawaii hotels continued to benefit from domestic leisure demand and experienced a return of group demand, achieving peak occupancy of 84% in March 2022, an increase of 12 percentage points from January 2022. Occupancy for the quarter was 80% and 77% for Hilton Waikoloa Village and the Hilton Hawaiian Village, respectively, an increase of 12 percentage points and 14 percentage points, respectively, from the fourth quarter of 2021. Preliminary combined occupancy for April 2022 is 87%. At the Hilton Waikoloa Village rate increased by 38% and RevPAR increased by 32% compared to the first quarter of 2019;
Orlando: Park’s Orlando hotels benefited in the second half of the quarter from spring break travel and approached seasonal peak occupancy, with combined occupancy of 70% in March 2022, an increase of 25 percentage points from January 2022, and combined occupancy of 59% for the quarter, an increase of 2 percentage points from the fourth quarter of 2021. Preliminary combined occupancy for April 2022 is 77%. Combined rate increased 21% compared to the first quarter of 2019;
New Orleans: The Hilton New Orleans Riverside benefited from an increase in both leisure and group demand in March 2022 during Mardi Gras, achieving peak occupancy of 75% in March 2022, an increase of 50 percentage points from January 2022, and occupancy of 54% for the quarter, an increase of 2 percentage points from the fourth quarter. Preliminary occupancy for April 2022 is 71%. Rate was 95% of the first quarter of 2019;
Southern California: Park’s hotels in Southern California benefited from an increase in leisure demand in the second half of the quarter, resulting in peak combined occupancy of 76% in March 2022, an increase of 23 percentage points from January 2022, and 67% for the quarter. Preliminary combined occupancy for April 2022 is 80%. Compared to the first quarter of 2019, combined rate increased by 15% on a pro-forma basis;
Key West: Casa Marina Key West, Curio Collection, and The Reach Key West, Curio Collection, continued to benefit from strong leisure transient demand from spring break travel achieving the hotels' highest-ever combined rate of $815, RevPAR of $715 and occupancy of 88% in March 2022, an increase of 13 percentage points from January 2022. The hotels achieved combined occupancy of 83% for the quarter, an increase of 6 percentage points from the fourth quarter of 2021. Preliminary combined occupancy for April 2022 is 76%. Compared to the first quarter of 2019, combined rate increased by 62% and combined RevPAR increased by 49%; and
Miami: Park’s Miami hotels benefited from strong domestic leisure transient demand and an increase in group demand, achieving peak combined occupancy of 88% in March 2022, an increase of 15 percentage points from January 2022, and 82% for the quarter, an increase of 4 percentage points from the fourth quarter of 2021. Preliminary combined occupancy for April 2022 is 91%. Compared to the first quarter of 2019, combined rate increased by 14% and combined RevPAR increased by 3%, both on a pro-forma basis.

3


Other Markets


San Francisco: Three of Park's four hotels in the San Francisco market are open and achieved a combined occupancy for its open hotels of 42% in March 2022, an increase of 16 percentage points from January 2022, and 35% for the quarter, with preliminary combined occupancy for its open hotels in April 2022 of 64%. The JW Marriott San Francisco Union Square and the Hyatt Centric Fisherman's Wharf achieved peak occupancy of 75% and 81% in March 2022, respectively, an increase of 34 percentage points and 31 percentage points from January 2022, respectively. The JW Marriott San Francisco Union Square and Hyatt Centric Fisherman's Wharf achieved occupancy of 56% and 64% for the quarter, respectively;
Boston: Park’s Boston hotels benefited from strong leisure demand coupled with demand from airline crews in March 2022, achieving peak combined occupancy of 69% in March 2022, an increase of 23 percentage points from January 2022, and 57% for the quarter. Preliminary combined occupancy for April 2022 is 75%;
New York: The New York Hilton Midtown experienced a decrease in demand in the first half of the quarter, but benefited from the return of domestic leisure demand in the second half of the quarter and achieved peak occupancy of 54% in March 2022, an increase of 40 percentage points from January 2022, with rate 3% higher as compared to March 2019. Occupancy was 34% for the quarter, and preliminary occupancy for April 2022 is 69%;
Chicago: Park's Chicago hotels experienced a decrease in demand in the first half of the quarter, but achieved combined peak occupancy of 44% for March 2022, an increase of 26 percentage points from January 2022, and 29% for the quarter, with preliminary combined occupancy for April 2022 of 56%. Compared to the first quarter of 2019, combined rate increased by 9% on a pro-forma basis. In particular, the Hilton Chicago Downtown saw rates 18% higher than the first quarter of 2019, mostly due to strong group and leisure demand;
Denver: The Hilton Denver experienced a decrease in demand during the first half of the quarter, but saw a return of both group and transient demand in the second half of the quarter and achieved peak occupancy of 66% in March 2022, an increase of 28 percentage points from January 2022, and 56% for the quarter. Preliminary occupancy for April 2022 is 69%;
Washington, D.C.: Park’s hotels in the Washington, D.C. market benefited primarily from leisure demand in the second half of the quarter, with combined occupancy at a peak of 59% for March 2022, an increase of 26 percentage points from January 2022, and 46% for the quarter. Preliminary combined occupancy for April 2022 is 77%; and
Seattle: Park’s Seattle hotels benefited from demand from airline crews with combined occupancy at a peak of 67% in March 2022, an increase of 15 percentage points from January 2022, and 58% for the quarter, an increase of 4 percentage points from the fourth quarter of 2021. Preliminary combined occupancy for April 2022 is 73%.


4


Balance Sheet and Liquidity


Park’s Net Debt as of March 31, 2022 was $4.2 billion. The Company has just $78 million outstanding on its sole remaining corporate term loan. Only 1% of Park’s total outstanding debt matures in 2022, and the weighted average maturity of Park’s consolidated debt is 4.4 years. Park's current liquidity is over $1.5 billion, including $901 million of available capacity under the Company's Revolver.

Park had the following debt outstanding as of March 31, 2022:


(unaudited, dollars in millions)


Debt


Collateral


Interest Rate


Maturity Date


As of March 31, 2022


Fixed Rate Debt


Mortgage loan


Hilton Denver City Center


4.90%


September 2022(1)


$

58


Mortgage loan


Hilton Checkers Los Angeles


4.11%


March 2023


26


Mortgage loan


W Chicago - City Center


4.25%


August 2023


75


Mortgage loan


Hilton San Francisco Union Square, Parc 55 San Francisco - a Hilton Hotel


4.11%


November 2023


725


Mortgage loan


Hyatt Regency Boston


4.25%


July 2026


134


Mortgage loan


DoubleTree Hotel Spokane City Center


3.62%


July 2026


14


Mortgage loan


Hilton Hawaiian Village Beach Resort


4.20%


November 2026


1,275


Mortgage loan


Hilton Santa Barbara Beachfront Resort


4.17%


December 2026


164


2025 Senior Secured Notes


7.50%


June 2025


650


2028 Senior Secured Notes


5.88%


October 2028


725


2029 Senior Secured Notes


4.88%


May 2029


750


Total Fixed Rate Debt


5.03%(2)


4,596


Variable Rate Debt


Mortgage loan


DoubleTree Hotel Ontario Airport


L + 3.00%(3)


May 2022(3)


30


Revolving credit facility(4)


Unsecured


L + 3.00%


December 2023


2019 Term Facility(4)(5)


Unsecured


L + 2.65%


August 2024


78


Total Variable Rate Debt


3.32%(2)


108


Add: unamortized premium


4


Less: unamortized deferred financing costs and discount


(37

)

Total Debt(6)


5.02%(2)


$

4,671


(1)

The loan matures in August 2042 but is callable by the lender with six months of notice. As of March 31, 2022, Park had not received notice from the lender.

(2)

Calculated on a weighted average basis.

(3)

In April 2022, Park's joint venture refinanced the mortgage loan secured by the DoubleTree Hotel Ontario Airport, which extended the maturity date to May 2027 with a fixed interest rate of 5.37%.

(4)

In May 2020, Park amended its credit and term loan facilities to add a LIBOR floor of 25 basis points. As of March 31, 2022, Park had $901 million of available capacity under the Revolver.

(5)

The outstanding balance of the 2019 Term Facility was hedged by an interest rate swap with a fixed interest rate of 1.86% per annum, which matured in April 2022.


(6)

Excludes $225 million of Park’s share of debt of its unconsolidated joint ventures.


Capital Investments

During 2021, Park resumed investing in certain capital projects to enhance the value of its hotels as it saw further signs of a broader based recovery and spent $54 million on capital investments. During the first quarter of 2022, Park spent $21 million on capital improvements at its hotels. Park expects to invest approximately $175 million to $200 million in capital improvements during 2022. Key projects are summarized below:


Recently Completed Projects

Hilton San Francisco Union Square (Meeting Space & Guestroom): $8 million ballroom and boardroom renovation which was completed in the fourth quarter of 2021.


Ongoing Projects

Hilton Hawaiian Village Waikiki Beach Resort (Guestroom): $25 million was spent on the first phase of guest room renovations in the 1,020 room Tapa Tower, which began in the third quarter of 2019 and was completed in the fourth

5


quarter of 2021, after being put on hold in 2020. Phase two of guest room renovations in the Tapa Tower is expected to be completed by the end of 2022 and is budgeted for approximately $30 million;
Waldorf Astoria Orlando and Signia by Hilton Orlando Bonnet Creek Complex (Meeting Space): $110 million expansion to add more than 100,000 square feet of meeting and event space, of which $8 million was spent during the first quarter of 2022 and bringing the total invested to date to $35 million since the project began in the fourth quarter of 2019, before being put on hold in 2020. Park expects the expansion for the Waldorf Astoria Orlando to be completed by the fourth quarter of 2022 and the Signia by Hilton Orlando Bonnet Creek to be completed by the first quarter of 2024;
Signia by Hilton Orlando Bonnet Creek (Existing Meeting Space & Lobby): $20 million for existing meeting space and lobby renovation, of which $8 million has already been spent. Park expects the project to be completed by the fourth quarter of 2022; and
Waldorf Astoria Orlando (Guestroom, Existing Meeting Space & Lobby): $34 million guestroom, existing meeting space, lobby and other public space renovations which are expected to begin in the second quarter of 2022 and to be completed by the third quarter of 2023.


Dividends and Share Repurchases

Park declared a first quarter 2022 cash dividend of $0.01 per share to stockholders of record as of March 31, 2022. The first quarter 2022 cash dividend was paid on April 15, 2022.

During the first quarter, Park repurchased 3.4 million shares of its common stock at an average price of $17.99 per share, or $61 million in the aggregate, through its previously disclosed $300 million stock repurchase program, which was approved by our Board of Directors in February 2022.


2022 Outlook

Based on recent trends, which are signaling continued recovery, Park's outlook for Q2 2022 is as follows:


(unaudited, dollars in millions, except per share amounts and RevPAR)


Q2 2022 Outlook


as of May 2, 2022


Metric


Low


High


RevPAR


$

160


$

164


RevPAR Growth vs. 2019


(16

)%


(14

)%

RevPAR Growth vs. 2021


104

%


109

%


Net income


$

16


$

36


Net income attributable to stockholders


$

13


$

33


Earnings per share - Diluted(1)


$

0.05


$

0.14


Adjusted EBITDA


$

160


$

180


Hotel Adjusted EBITDA margin change vs. 2019


(390) bps


(240) bps


Hotel Adjusted EBITDA margin change vs. 2021


1,320 bps


1,470 bps


Adjusted FFO per share - Diluted(1)


$

0.40


$

0.49


(1)

Per share amounts are calculated based on unrounded numbers.

Q2 2022 outlook is based in part on the following assumptions:


Fully diluted weighted average shares are expected to be 233 million; and
Does not take into account potential future acquisitions and dispositions, including those currently under contract, which could result in a material change to Park’s outlook.

Park's Q2 2022 outlook is based on many factors, many of which are outside the Company's control, including uncertainty surrounding any new disruptions from the COVID-19 pandemic, and all of which are subject to change. The Company continues to be unable to provide a full-year outlook for 2022 given the continued economic uncertainty as the global economy continues to recover

6


from the COVID-19 pandemic; however, if the positive demand trends continue over the next few months, the Company anticipates being able to provide a full-year outlook in its second quarter earnings release.


Supplemental Disclosures

In conjunction with this release, Park has furnished a financial supplement with additional disclosures on its website. Visit www.pkhotelsandresorts.com for more information. Park has no obligation to update any of the information provided to conform to actual results or changes in Park’s portfolio, capital structure or future expectations.

Conference Call

Park will host a conference call for investors and other interested parties to discuss first quarter 2022 results on May 2, 2022 beginning at 11 a.m. Eastern Time. Participants may listen to the live webcast by logging onto the Investors section of the website at www.pkhotelsandresorts.com. Alternatively, participants may listen to the live call by dialing (877) 451-6152 in the United States or (201) 389-0879 internationally and requesting Park Hotels & Resorts’ First Quarter 2022 Earnings Conference Call. Participants are encouraged to dial into the call or link to the webcast at least ten minutes prior to the scheduled start time.

A replay of the webcast will be available within 24 hours after the live event on the Investors section of Park’s website.

Forward-Looking Statements


This press release contains forward-looking statements within the meaning of Section 27A of the Securities Act of 1933, as amended, and Section 21E of the Securities Exchange Act of 1934, as amended. Forward-looking statements include, but are not limited to, statements related to Park’s current expectations regarding the performance of its business, financial results, liquidity and capital resources, including expected dates that its hotels will reopen, break even or achieve positive Hotel Adjusted EBITDA, the impact to the Company's business and financial condition and that of its hotel management companies, measures being taken in response to COVID-19, the impact from macroeconomic factors (including inflation and geopolitical conflicts), the effects of competition and the effects of future legislation or regulations, the expected completion of anticipated dispositions, the declaration and payment of future dividends and other non-historical statements. Forward-looking statements include all statements that are not historical facts, and in some cases, can be identified by the use of forward-looking terminology such as the words “outlook,” “believes,” “expects,” “potential,” “continues,” “may,” “will,” “should,” “could,” “seeks,” “projects,” “predicts,” “intends,” “plans,” “estimates,” “anticipates,” “hopes” or the negative version of these words or other comparable words. You should not rely on forward-looking statements since they involve known and unknown risks, uncertainties and other factors which are, in some cases, beyond the Company’s control and which could materially affect its results of operations, financial condition, cash flows, performance or future achievements or events. Currently, one of the most significant factors continues to be the adverse effect of COVID-19, including actions taken to contain the pandemic or mitigate its effects, the emergences of virus variants and resurgences, on the Company’s financial condition, results of operations, cash flows and performance, its hotel management companies and its hotels’ tenants, and the global economy and financial markets. Investors are cautioned to interpret many of the risks identified in the risk factors included in the Company’s Annual Report on Form 10-K for the year ended December 31, 2021 as being heightened as a result of the ongoing and numerous adverse effects of COVID-19.


Forward-looking statements involve risks, uncertainties and assumptions. Actual results may differ materially from those expressed in these forward-looking statements. You should not put undue reliance on any forward-looking statements and Park urges investors to carefully review the disclosures Park makes concerning risk and uncertainties in Item 1A: “Risk Factors” in Park’s Annual Report on Form 10-K for the year ended December 31, 2021, as such factors may be updated from time to time in Park’s filings with the SEC, which are accessible on the SEC’s website at www.sec.gov. Except as required by law, Park undertakes no obligation to update or revise publicly any forward-looking statements, whether as a result of new information, future events or otherwise.

Non-GAAP Financial Measures

Park presents certain non-GAAP financial measures in this press release, including Nareit FFO attributable to stockholders, Adjusted FFO attributable to stockholders, EBITDA, Adjusted EBITDA, Hotel Adjusted EBITDA, Hotel Adjusted EBITDA margin and Net debt. These non-GAAP financial measures should be considered along with, but not as alternatives to, net income (loss) as a measure of its operating performance. Please see the schedules included in this press release including the “Definitions” section for additional information and reconciliations of such non-GAAP financial measures.

7


About Park

Park is the second largest publicly traded lodging REIT with a diverse portfolio of market-leading hotels and resorts with significant underlying real estate value. Park’s portfolio currently consists of 53 premium-branded hotels and resorts with approximately 32,000 rooms primarily located in prime city center and resort locations. Visit www.pkhotelsandresorts.com for more information.


8


PARK HOTELS & RESORTS INC.

CONDENSED CONSOLIDATED BALANCE SHEETS

(in millions, except share and per share data)


March 31, 2022


December 31, 2021


(unaudited)


ASSETS


Property and equipment, net


$

8,465


$

8,511


Investments in affiliates


16


15


Intangibles, net


44


44


Cash and cash equivalents


639


688


Restricted cash


78


75


Accounts receivable, net of allowance for doubtful accounts of $2 and $2


106


96


Prepaid expenses


58


35


Other assets


65


69


Operating lease right-of-use assets


232


210


TOTAL ASSETS (variable interest entities - $240 and $237)


$

9,703


$

9,743


LIABILITIES AND EQUITY


Liabilities


Debt


$

4,671


$

4,672


Accounts payable and accrued expenses


200


156


Due to hotel managers


113


111


Other liabilities


184


174


Operating lease liabilities


250


227


Total liabilities (variable interest entities - $219 and $219)


5,418


5,340


Stockholders' Equity


Common stock, par value $0.01 per share, 6,000,000,000 shares
   authorized, 233,835,899 shares issued and 233,324,391 shares outstanding
   as of March 31, 2022 and 236,888,804 shares issued and 236,483,990
   shares outstanding as of December 31, 2021


2


2


Additional paid-in capital


4,473


4,533


Accumulated deficit


(142

)


(83

)

Total stockholders' equity


4,333


4,452


Noncontrolling interests


(48

)


(49

)

Total equity


4,285


4,403


TOTAL LIABILITIES AND EQUITY


$

9,703


$

9,743


9


PARK HOTELS & RESORTS INC.

CONDENSED CONSOLIDATED STATEMENTS OF OPERATIONS

(unaudited, in millions, except per share data)


Three Months Ended March 31,


2022


2021


Revenues


Rooms


$

292


$

106


Food and beverage


110


22


Ancillary hotel


61


29


Other


16


8


Total revenues


479


165


Operating expenses


Rooms


85


35


Food and beverage


87


21


Other departmental and support


133


78


Other property-level


50


48


Management fees


22


7


Depreciation and amortization


69


74


Corporate general and administrative


16


18


Other


16


7


Total expenses


478


288


Operating income (loss)


1


(123

)


Interest expense


(62

)


(63

)

Equity in losses from investments in affiliates


(4

)

Other gain, net


5


Loss before income taxes


(56

)


(190

)

Income tax expense


(1

)

Net loss


(56

)


(191

)

Net (income) loss attributable to noncontrolling interests


(1

)


1


Net loss attributable to stockholders


$

(57

)


$

(190

)


Loss per share:


Loss per share – Basic


$

(0.24

)


$

(0.81

)

Loss per share – Diluted


$

(0.24

)


$

(0.81

)


Weighted average shares outstanding – Basic


235


235


Weighted average shares outstanding – Diluted


235


236


10


PARK HOTELS & RESORTS INC.

NON-GAAP FINANCIAL MEASURES RECONCILIATIONS

EBITDA AND ADJUSTED EBITDA


(unaudited, in millions)


Three Months Ended March 31,


2022


2021


Net loss


$

(56

)


$

(191

)

Depreciation and amortization expense


69


74


Interest expense


62


63


Income tax expense


1


Interest expense, income tax and depreciation and amortization
     included in equity in earnings from investments in affiliates


1


1


EBITDA


76


(52

)

Share-based compensation expense


4


6


Other items


2


(3

)

Adjusted EBITDA


$

82


$

(49

)


11


PARK HOTELS & RESORTS INC.

NON-GAAP FINANCIAL MEASURES RECONCILIATIONS

PRO-FORMA HOTEL ADJUSTED EBITDA AND

PRO-FORMA HOTEL ADJUSTED EBITDA MARGIN


(unaudited, dollars in millions)


Three Months Ended


March 31,


2022


2021


Adjusted EBITDA


$

82


$

(49

)

Less: Adjusted EBITDA from investments in affiliates


(5

)


2


Add: All other(1)


12


11


Hotel Adjusted EBITDA


89


(36

)

Less: Adjusted EBITDA from hotels disposed of


4


Pro-forma Hotel Adjusted EBITDA


$

89


$

(32

)


Three Months Ended


March 31,


2022


2021


Total Revenues


$

479


$

165


Less: Other revenue


(16

)


(8

)

Less: Revenues from hotels disposed of


(4

)

Pro-forma Hotel Revenues


$

463


$

153


Three Months Ended


March 31,


2022


2021


Change(2)


Pro-forma Hotel Revenues


$

463


$

153


201.6

%

Pro-forma Hotel Adjusted EBITDA


$

89


$

(32

)


376.1

%

Pro-forma Hotel Adjusted EBITDA
     margin
(2)


19.3

%


(21.1

)%


4,040 bps


__________________________________


(1) Includes other revenues and other expenses, non-income taxes on TRS leases included in other property-level expenses and
      
corporate general and administrative expenses in the condensed consolidated statements of operations.


(2)  Percentages are calculated based on unrounded numbers.


12


PARK HOTELS & RESORTS INC.

NON-GAAP FINANCIAL MEASURES RECONCILIATIONS

NAREIT FFO AND ADJUSTED FFO


(unaudited, in millions, except per share data)


Three Months Ended March 31,


2022


2021


Net loss attributable to stockholders


$

(57

)


$

(190

)

Depreciation and amortization expense


69


74


Depreciation and amortization expense
   attributable to noncontrolling interests


(1

)


(1

)

Equity investment adjustments:


Equity in losses from investments in affiliates


4


Pro rata FFO of investments in affiliates


2


(2

)

Nareit FFO attributable to stockholders


13


(115

)

Share-based compensation expense


4


6


Other items


1


(4

)

Adjusted FFO attributable to stockholders


$

18


$

(113

)

Nareit FFO per share – Diluted(1)


$

0.05


$

(0.49

)

Adjusted FFO per share – Diluted(1)


$

0.08


$

(0.48

)

Weighted average shares outstanding – Diluted


235


236


(1)

Per share amounts are calculated based on unrounded numbers.


13


PARK HOTELS & RESORTS INC.

NON-GAAP FINANCIAL MEASURES RECONCILIATIONS

NET DEBT


(unaudited, in millions)


March 31, 2022


Debt


$

4,671


Add: unamortized deferred financing costs and discount


37


Less: unamortized premium


(4

)

Debt, excluding unamortized deferred financing cost,
   premiums and discounts


4,704


Add: Park's share of unconsolidated affiliates debt,
   excluding unamortized deferred financing costs


225


Less: cash and cash equivalents


(639

)

Less: restricted cash


(78

)

Net debt


$

4,212


14


PARK HOTELS & RESORTS INC.

NON-GAAP FINANCIAL MEASURES RECONCILIATIONS

Q2 2022 OUTLOOK – EBITDA AND ADJUSTED EBITDA


Three Months Ended


(unaudited, in millions)


June 30, 2022


Low Case


High Case


Net income


$

16


$

36


Depreciation and amortization expense


69


69


Interest expense


61


61


Interest expense, income tax and depreciation and amortization included in
   equity in earnings from investments in affiliates


3


3


EBITDA


149


169


Share-based compensation expense


4


4


Other items


7


7


Adjusted EBITDA


$

160


$

180


15


PARK HOTELS & RESORTS INC.

NON-GAAP FINANCIAL MEASURES RECONCILIATIONS

Q2 2022 OUTLOOK –NAREIT FFO ATTRIBUTABLE TO STOCKHOLDERS AND

ADJUSTED FFO ATTRIBUTABLE TO STOCKHOLDERS


Three Months Ended


(unaudited, in millions except per share data)


June 30, 2022


Low Case


High Case


Net income attributable to stockholders


$

13


$

33


Depreciation and amortization expense


69


69


Depreciation and amortization expense attributable to noncontrolling interests


(1

)


(1

)

Equity investment adjustments:


Equity in earnings from investments in affiliates


(4

)


(4

)

Pro rata FFO of equity investments


5


5


Nareit FFO attributable to stockholders


82


102


Share-based compensation expense


4


4


Other items


7


7


Adjusted FFO attributable to stockholders


$

93


$

113


Adjusted FFO per share - Diluted(1)


$

0.40


$

0.49


Weighted average diluted shares outstanding


233.0


233.0


(1)

Per share amounts are calculated based on unrounded numbers.


16


PARK HOTELS & RESORTS INC.

DEFINITIONS

Pro-forma

The Company presents certain data for its consolidated hotels on a pro-forma hotel basis as supplemental information for investors: Pro-forma Hotel Revenues, Pro-forma RevPAR, Pro-forma Total RevPAR, Pro-forma Occupancy, Pro-forma ADR, Pro-forma Hotel Adjusted EBITDA and Pro-forma Hotel Adjusted EBITDA Margin. The Company presents pro-forma hotel results to help the Company and its investors evaluate the ongoing operating performance of its hotels. The Company’s pro-forma metrics exclude results from property dispositions that have occurred through March 31, 2022 and include results from property acquisitions as though such acquisitions occurred on the earliest period presented.

EBITDA, Adjusted EBITDA, Hotel Adjusted EBITDA and Hotel Adjusted EBITDA margin

Earnings (loss) before interest expense, taxes and depreciation and amortization (“EBITDA”), presented herein, reflects net income (loss) excluding depreciation and amortization, interest income, interest expense, income taxes and interest expense, income tax and depreciation and amortization included in equity in earnings (losses) from investments in affiliates.

Adjusted EBITDA, presented herein, is calculated as EBITDA, as previously defined, further adjusted to exclude:

Gains or losses on sales of assets for both consolidated and unconsolidated investments;
Costs associated with hotel acquisitions or dispositions expensed during the period;
Severance expense;
Share-based compensation expense;
Impairment losses and casualty gains or losses; and
Other items that management believes are not representative of the Company’s current or future operating performance.

Hotel Adjusted EBITDA measures hotel-level results before debt service, depreciation and corporate expenses of the Company’s consolidated hotels, which excludes hotels owned by unconsolidated affiliates, and is a key measure of the Company’s profitability. The Company presents Hotel Adjusted EBITDA to help the Company and its investors evaluate the ongoing operating performance of the Company’s consolidated hotels.

Hotel Adjusted EBITDA margin is calculated as Hotel Adjusted EBITDA divided by total hotel revenue.

EBITDA, Adjusted EBITDA, Hotel Adjusted EBITDA and Hotel Adjusted EBITDA margin are not recognized terms under United States (“U.S.”) GAAP and should not be considered as alternatives to net income (loss) or other measures of financial performance or liquidity derived in accordance with U.S. GAAP. In addition, the Company’s definitions of EBITDA, Adjusted EBITDA, Hotel Adjusted EBITDA and Hotel Adjusted EBITDA margin may not be comparable to similarly titled measures of other companies.

The Company believes that EBITDA, Adjusted EBITDA, Hotel Adjusted EBITDA and Hotel Adjusted EBITDA margin provide useful information to investors about the Company and its financial condition and results of operations for the following reasons: (i) EBITDA, Adjusted EBITDA, Hotel Adjusted EBITDA and Hotel Adjusted EBITDA margin are among the measures used by the Company’s management team to make day-to-day operating decisions and evaluate its operating performance between periods and between REITs by removing the effect of its capital structure (primarily interest expense) and asset base (primarily depreciation and amortization) from its operating results; and (ii) EBITDA, Adjusted EBITDA, Hotel Adjusted EBITDA and Hotel Adjusted EBITDA margin are frequently used by securities analysts, investors and other interested parties as a common performance measure to compare results or estimate valuations across companies in the industry.

EBITDA, Adjusted EBITDA, Hotel Adjusted EBITDA and Hotel Adjusted EBITDA margin have limitations as analytical tools and should not be considered either in isolation or as a substitute for net income (loss) or other methods of analyzing the Company’s operating performance and results as reported under U.S. GAAP. Because of these limitations, EBITDA, Adjusted EBITDA and Hotel Adjusted EBITDA should not be considered as discretionary cash available to the Company to reinvest in the growth of its business or as measures of cash that will be available to the Company to meet its obligations.

17


Nareit FFO attributable to stockholders, Adjusted FFO attributable to stockholders Nareit FFO per share - diluted and Adjusted FFO per share - diluted

Nareit FFO attributable to stockholders and Nareit FFO per diluted share (defined as set forth below) are presented herein as non-GAAP measures of the Company’s performance. The Company calculates funds from (used in) operations (“FFO”) attributable to stockholders for a given operating period in accordance with standards established by the National Association of Real Estate Investment Trusts (“Nareit”), as net income (loss) attributable to stockholders (calculated in accordance with U.S. GAAP), excluding depreciation and amortization, gains or losses on sales of assets, impairment, and the cumulative effect of changes in accounting principles, plus adjustments for unconsolidated joint ventures. Adjustments for unconsolidated joint ventures are calculated to reflect the Company’s pro rata share of the FFO of those entities on the same basis. As noted by Nareit in its December 2018 “Nareit Funds from Operations White Paper – 2018 Restatement,” since real estate values historically have risen or fallen with market conditions, many industry investors have considered presentation of operating results for real estate companies that use historical cost accounting to be insufficient by themselves. For these reasons, Nareit adopted the FFO metric in order to promote an industry-wide measure of REIT operating performance. The Company believes Nareit FFO provides useful information to investors regarding its operating performance and can facilitate comparisons of operating performance between periods and between REITs. The Company’s presentation may not be comparable to FFO reported by other REITs that do not define the terms in accordance with the current Nareit definition, or that interpret the current Nareit definition differently. The Company calculates Nareit FFO per diluted share as Nareit FFO divided by the number of fully diluted shares outstanding during a given operating period.

The Company also presents Adjusted FFO attributable to stockholders and Adjusted FFO per diluted share when evaluating its performance because management believes that the exclusion of certain additional items described below provides useful supplemental information to investors regarding the Company’s ongoing operating performance. Management historically has made the adjustments detailed below in evaluating its performance and in its annual budget process. Management believes that the presentation of Adjusted FFO provides useful supplemental information that is beneficial to an investor’s complete understanding of operating performance. The Company adjusts Nareit FFO attributable to stockholders for the following items, which may occur in any period, and refers to this measure as Adjusted FFO attributable to stockholders:

Costs associated with hotel acquisitions or dispositions expensed during the period;
Severance expense;
Share-based compensation expense;
Other items that management believes are not representative of the Company’s current or future operating performance.

Net Debt

Net debt, presented herein, is a non-GAAP financial measure that the Company uses to evaluate its financial leverage. Net debt is calculated as (i) long-term debt, including current maturities and excluding unamortized deferred financing costs; and (ii) the Company’s share of investments in affiliate debt, excluding unamortized deferred financing costs; reduced by (a) cash and cash equivalents; and (b) restricted cash and cash equivalents.

The Company believes Net debt provides useful information about its indebtedness to investors as it is frequently used by securities analysts, investors and other interested parties to compare the indebtedness of companies. Net debt should not be considered as a substitute to debt presented in accordance with U.S. GAAP. Net debt may not be comparable to a similarly titled measure of other companies.

Occupancy

Occupancy represents the total number of room nights sold divided by the total number of room nights available at a hotel or group of hotels. Room nights available to guests have not been adjusted for suspended or reduced operations at certain of Park’s hotels as a result of COVID-19. Occupancy measures the utilization of the Company’s hotels’ available capacity. Management uses occupancy to gauge demand at a specific hotel or group of hotels in a given period. Occupancy levels also help management determine achievable Average Daily Rate (“ADR”) levels as demand for rooms increases or decreases.

Average Daily Rate

ADR (or rate) represents rooms revenue divided by total number of room nights sold in a given period. ADR measures average room price attained by a hotel and ADR trends provide useful information concerning the pricing environment and the nature of the customer base of a hotel or group of hotels. ADR is a commonly used performance measure in the hotel industry, and management uses ADR to assess pricing levels that the Company is able to generate by type of customer, as changes in rates have a more pronounced effect on overall revenues and incremental profitability than changes in occupancy, as described above.


18


Revenue per Available Room

Revenue per Available Room (“RevPAR”) represents rooms revenue divided by the total number of room nights available to guests for a given period. Room nights available to guests have not been adjusted for suspended or reduced operations at certain of Park’s hotels as a result of COVID-19. Management considers RevPAR to be a meaningful indicator of the Company’s performance as it provides a metric correlated to two primary and key factors of operations at a hotel or group of hotels: occupancy and ADR. RevPAR is also a useful indicator in measuring performance over comparable periods.

Total RevPAR

Total RevPAR represents rooms, food and beverage and other hotel revenues divided by the total number of room nights available to guests for a given period. Room nights available to guests have not been adjusted for suspended or reduced operations at certain of Park’s hotels as a result of COVID-19. Management considers Total RevPAR to be a meaningful indicator of the Company’s performance as approximately one-third of revenues are earned from food and beverage and other hotel revenues. Total RevPAR is also a useful indicator in measuring performance over comparable periods.

19
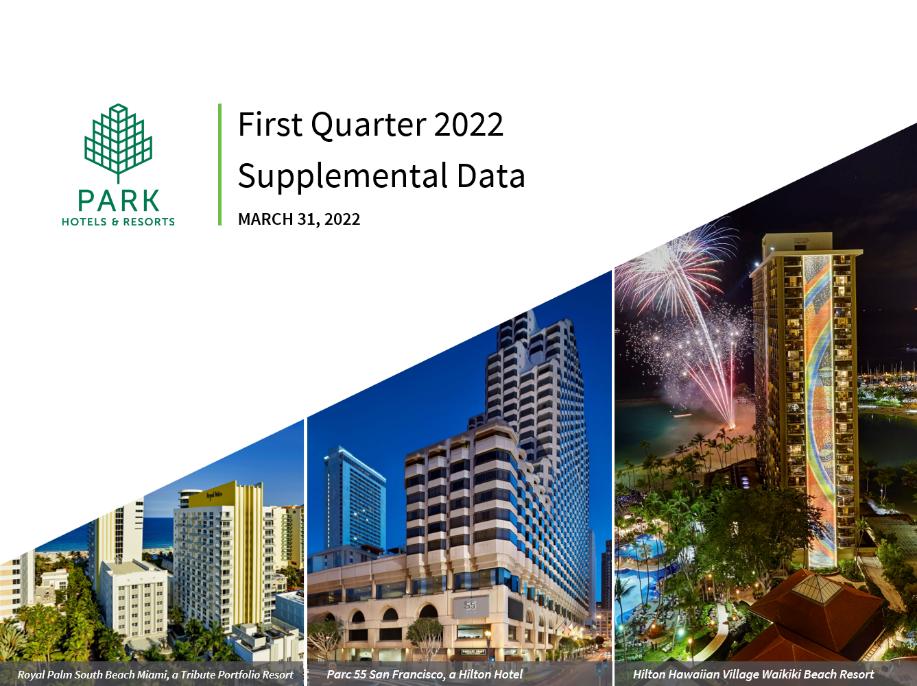


Exhibit 99.2


img187544587_0.jpg 


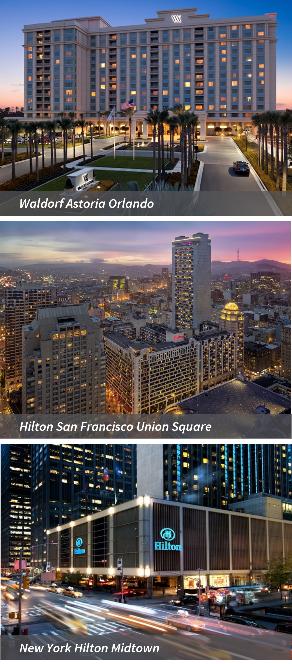
PARK HOTELS & RESORTS First Quarter 2021 Supplemental Data MARCH Royal Palm South Beach Miami, a Tribute Portfolio Resort Parc 55 San Francisco, a Hilton Hotel Hilton Hawaiian Village Waikiki Beach Resort


About Park and Safe Harbor Disclosure


About Park Hotels & Resorts Inc.

Park (NYSE: PK) is the second largest publicly-traded lodging real estate company with a diverse portfolio of market-leading hotels and resorts with significant underlying real estate value. Park’s portfolio consists of 53 premium-branded hotels and resorts with approximately 32,000 rooms primarily located in prime city center and resort locations. Visit www.pkhotelsandresorts.com for more information.


Forward-Looking Statements

This supplement contains forward-looking statements within the meaning of Section 27A of the Securities Act of 1933, as amended, and Section 21E of the Securities Exchange Act of 1934, as amended. Forward-looking statements include, but are not limited to, statements related to Park’s current expectations regarding the performance of its business, financial results, liquidity and capital resources, including expected dates that its hotels will reopen, break even or achieve positive Hotel Adjusted EBITDA, the impact to the Company's business and financial condition and that of its hotel management companies, measures being taken in response to COVID-19, the impact from macroeconomic factors (including inflation and geopolitical conflicts), the effects of competition and the effects of future legislation or regulations, the expected completion of anticipated dispositions, the declaration and payment of future dividends and other non-historical statements. Forward-looking statements include all statements that are not historical facts, and in some cases, can be identified by the use of forward-looking terminology such as the words “outlook,” “believes,” “expects,” “potential,” “continues,” “may,” “will,” “should,” “could,” “seeks,” “projects,” “predicts,” “intends,” “plans,” “estimates,” “anticipates,” “hopes” or the negative version of these words or other comparable words. You should not rely on forward-looking statements since they involve known and unknown risks, uncertainties and other factors which are, in some cases, beyond the Company’s control and which could materially affect its results of operations, financial condition, cash flows, performance or future achievements or events. Currently, one of the most significant factors continues to be the adverse effect of COVID-19, including actions taken to contain the pandemic or mitigate its effects, the emergences of virus variants and resurgences, on the Company’s financial condition, results of operations, cash flows and performance, its hotel management companies and its hotels’ tenants, and the global economy and financial markets. Investors are cautioned to interpret many of the risks identified in the risk factors included in the Company’s Annual Report on Form 10-K for the year ended December 31, 2021 as being heightened as a result of the ongoing and numerous adverse effects of COVID-19.


Forward-looking statements involve risks, uncertainties and assumptions. Actual results may differ materially from those expressed in these forward-looking statements. You should not put undue reliance on any forward-looking statements and Park urges investors to carefully review the disclosures Park makes concerning risk and uncertainties in Item 1A: “Risk Factors” in Park’s Annual Report on Form 10-K for the year ended December 31, 2021, as such factors may be updated from time to time in Park’s filings with the SEC, which are accessible on the SEC’s website at www.sec.gov. Except as required by law, Park undertakes no obligation to update or revise publicly any forward-looking statements, whether as a result of new information, future events or otherwise.


Supplemental Financial Information

Park refers to certain non-generally accepted accounting principles (“GAAP”) financial measures in this presentation, including Funds from (used in) Operations (“FFO”) calculated in accordance with the guidelines of the National Association of Real Estate Investment Trusts (“Nareit”), Adjusted FFO, FFO per share, Adjusted FFO per share, Earnings (loss) before interest expense, taxes and depreciation and amortization (“EBITDA”), Adjusted EBITDA, Hotel Adjusted EBITDA, Hotel Adjusted EBITDA margin, Net debt and Net debt to Adjusted EBITDA ratio. These non-GAAP financial measures should be considered along with, but not as alternatives to, net income (loss) as a measure of its operating performance. Please see the schedules included in this presentation including the “Definitions” section for additional information and reconciliations of such non-GAAP financial measures.


2 |


img187544587_1.jpg 


img187544587_2.jpg 


Table of Contents


1. Financial Statements

4


2. Supplementary Financial Information

7


3. Outlook

18


4. Portfolio and Operating Metrics

22


5. Properties Acquired and Sold

33


6. Capital Structure

36


7. Definitions

38


3 |


img187544587_1.jpg 


Financial Statements


img187544587_3.jpg 


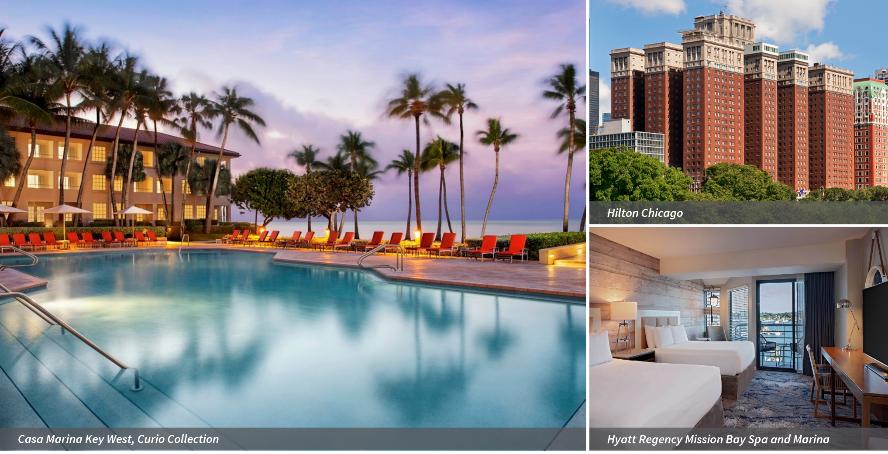
Casa Marina, a Waldorf Astoria Resort Hilton Chicago Hyatt Regency Mission Bay Spa and Marina


4 |


img187544587_1.jpg 


Financial Statements


Condensed Consolidated Balance Sheets


(in millions, except share and per share data)


March 31, 2022


December 31, 2021


(unaudited)


ASSETS


Property and equipment, net


$

8,465


$

8,511


Investments in affiliates


16


15


Intangibles, net


44


44


Cash and cash equivalents


639


688


Restricted cash


78


75


Accounts receivable, net of allowance for doubtful accounts of $2 and $2


106


96


Prepaid expenses


58


35


Other assets


65


69


Operating lease right-of-use assets


232


210


TOTAL ASSETS (variable interest entities - $240 and $237)


$

9,703


$

9,743


LIABILITIES AND EQUITY


Liabilities


Debt


$

4,671


$

4,672


Accounts payable and accrued expenses


200


156


Due to hotel managers


113


111


Other liabilities


184


174


Operating lease liabilities


250


227


Total liabilities (variable interest entities - $219 and $219)


5,418


5,340


Stockholders' Equity


Common stock, par value $0.01 per share, 6,000,000,000 shares

   authorized, 233,835,899 shares issued and 233,324,391 shares outstanding

   as of March 31, 2022 and 236,888,804 shares issued and 236,483,990

   shares outstanding as of December 31, 2021


2


2


Additional paid-in capital


4,473


4,533


Accumulated deficit


(142

)


(83

)

Total stockholders' equity


4,333


4,452


Noncontrolling interests


(48

)


(49

)

Total equity


4,285


4,403


TOTAL LIABILITIES AND EQUITY


$

9,703


$

9,743


5 |


img187544587_1.jpg 


Financial Statements (continued)


Condensed Consolidated Statements of Operations


(unaudited, in millions, except per share data)


Three Months Ended March 31,


2022


2021


2019


Revenues


Rooms


$

292


$

106


$

403


Food and beverage


110


22


183


Ancillary hotel


61


29


55


Other


16


8


18


Total revenues


479


165


659


Operating expenses


Rooms


85


35


107


Food and beverage


87


21


124


Other departmental and support


133


78


149


Other property-level


50


48


49


Management fees


22


7


33


Depreciation and amortization


69


74


62


Corporate general and administrative


16


18


17


Other


16


7


20


Total expenses


478


288


561


Gain on sales of assets, net


31


Operating income (loss)


1


(123

)


129


Interest income


1


Interest expense


(62

)


(63

)


(32

)

Equity in (losses) earnings from investments in affiliates


(4

)


5


Other gain, net


5


1


(Loss) income before income taxes


(56

)


(190

)


104


Income tax expense


(1

)


(7

)

Net (loss) income


(56

)


(191

)


97


Net (income) loss attributable to noncontrolling interests


(1

)


1


(1

)

Net (loss) income attributable to stockholders


$

(57

)


$

(190

)


$

96


(Loss) Earnings per share:


(Loss) Earnings per share - Basic


$

(0.24

)


$

(0.81

)


$

0.48


(Loss) Earnings per share - Diluted


$

(0.24

)


$

(0.81

)


$

0.48


Weighted average shares outstanding – Basic


235


235


201


Weighted average shares outstanding – Diluted


235


236


202


6 |


img187544587_1.jpg 


Supplementary Financial Information


img187544587_4.jpg 


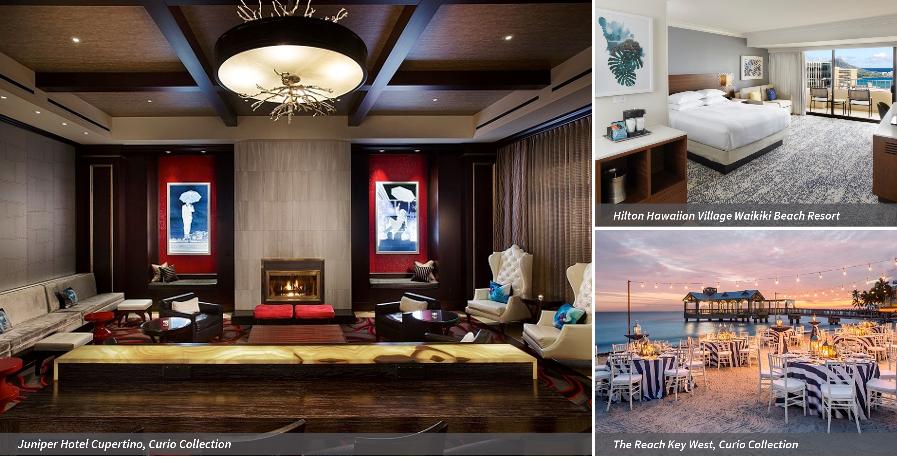
Juniper Hotel Cupertino, Curio Collection Hotel Adagio, Autograph Collection The Reach Key West, Curio Collection


7 |


img187544587_1.jpg 


Supplementary Financial Information


EBITDA and Adjusted EBITDA


(unaudited, in millions)


Three Months Ended March 31,


2022


2021


2019


Net (loss) income


$

(56

)


$

(191

)


$

97


Depreciation and amortization expense


69


74


62


Interest income


(1

)

Interest expense


62


63


32


Income tax expense


1


7


Interest expense, income tax and depreciation and amortization

     included in equity in earnings from investments in affiliates


1


1


5


EBITDA


76


(52

)


202


Gain on sales of assets, net


(31

)

Severance expense


1


Share-based compensation expense


4


6


4


Other items


2


(3

)


Adjusted EBITDA


$

82


$

(49

)


$

176


8 |


img187544587_1.jpg 


Supplementary Financial Information (continued)


Pro-forma Hotel Adjusted EBITDA and Pro-forma Hotel Adjusted EBITDA Margin


(unaudited, dollars in millions)


Three Months Ended March 31,


2022


2021


2019


Adjusted EBITDA(1)


$

82


$

(49

)


$

176


Less: Adjusted EBITDA from investments in affiliates


(5

)


2


(10

)

Add: All other(1)


12


11


15


Hotel Adjusted EBITDA


89


(36

)


181


Add: Adjusted EBITDA from hotels acquired


37


Less: Adjusted EBITDA from hotels disposed of


4


(23

)

Pro-forma Hotel Adjusted EBITDA


$

89


$

(32

)


$

195


Three Months Ended March 31,


2022


2021


2019


Total Revenues


$

479


$

165


$

659


Less: Other revenue


(16

)


(8

)


(18

)

Add: Revenues from hotels acquired


130


Less: Revenues from hotels disposed of


(4

)


(76

)

Pro-forma Hotel Revenues


$

463


$

153


$

695


Three Months Ended March 31,


2022 vs 2021


2022 vs 2019


2022


2021


2019


Change(2)


Change(2)


Pro-forma Hotel Revenues


$

463


$

153


$

695


201.6

%


(33.5

)%

Pro-forma Hotel Adjusted EBITDA


$

89


$

(32

)


$

195


376.1

%


(54.3

)%

Pro-forma Hotel Adjusted EBITDA

     margin(2)


19.3

%


(21.1

)%


28.0

%


4,040

bps


(870

) bps


(1) Includes other revenues and other expenses, non-income taxes on TRS leases included in other property-level expenses and

corporate general and administrative expenses in the condensed consolidated statements of operations.


(2)  Percentages are calculated based on unrounded numbers.


9 |


img187544587_1.jpg 


Supplementary Financial Information (continued)


Nareit FFO and Adjusted FFO


(unaudited, in millions, except per share data)


Three Months Ended March 31,


2022


2021


2019


Net (loss) income attributable to stockholders


$

(57

)


$

(190

)


$

96


Depreciation and amortization expense


69


74


62


Depreciation and amortization expense

   attributable to noncontrolling interests


(1

)


(1

)


(1

)

Gain on sales of assets, net


(31

)

Equity investment adjustments:


Equity in losses (earnings) from investments in affiliates


4


(5

)

Pro rata FFO of investments in affiliates


2


(2

)


9


Nareit FFO attributable to stockholders


13


(115

)


130


Severance expense


1


Share-based compensation expense


4


6


4


Other items


1


(4

)


1


Adjusted FFO attributable to stockholders


$

18


$

(113

)


$

136


Nareit FFO per share - Diluted(1)


$

0.05


$

(0.49

)


$

0.65


Adjusted FFO per share - Diluted(1)


$

0.08


$

(0.48

)


$

0.67


Weighted average shares outstanding - Diluted(2)


235


236


202


(1) Per share amounts are calculated based on unrounded numbers.

(2) Derived from Park’s earnings per share calculations for each period presented; for shares outstanding as of March 31, 2022, see page 5.


10 |


img187544587_1.jpg 


Supplementary Financial Information (continued)


Historical Pro-forma Hotel Metrics


The financial information below is for the 48 consolidated hotels owned as of March 31, 2022.


Three Months Ended


(unaudited)


March 31,


2022


RevPAR


$

116.42


Occupancy


51.9

%


ADR


$

224.42


Hotel Revenues (in millions)


$

463


Hotel Adjusted EBITDA (in millions)


$

89


Hotel Adjusted EBITDA margin(1)


19.3

%


Three Months Ended


Full Year


March 31,


June 30,


September 30,


December 31,


December 31,


2021


2021


2021


2021


2021


Pro-forma RevPAR


$

41.32


$

78.44


$

105.48


$

110.22


$

84.11


Pro-forma Occupancy


26.6

%


42.2

%


51.3

%


52.5

%


43.2

%

Pro-forma ADR


$

155.60


$

185.74


$

205.56


$

210.00


$

194.53


Pro-forma Hotel Revenues (in millions)


$

153


$

302


$

404


$

435


$

1,294


Pro-forma Hotel Adjusted EBITDA (in millions)


$

(32

)


$

43


$

83


$

85


$

179


Pro-forma Hotel Adjusted EBITDA margin(1)


(21.1

)%


14.1

%


20.6

%


19.7

%


13.8

%


Three Months Ended


Full Year


March 31,


June 30,


September 30,


December 31,


December 31,


2019


2019


2019


2019


2019


Pro-forma RevPAR


$

173.32


$

190.96


$

186.33


$

176.57


$

181.82


Pro-forma Occupancy


77.3

%


85.6

%


84.3

%


80.6

%


81.9

%

Pro-forma ADR


$

224.27


$

223.09


$

220.95


$

219.15


$

221.83


Pro-forma Hotel Revenues (in millions)


$

695


$

764


$

724


$

741


$

2,924


Pro-forma Hotel Adjusted EBITDA (in millions)


$

195


$

238


$

208


$

216


$

857


Pro-forma Hotel Adjusted EBITDA margin(1)


28.0

%


31.2

%


28.7

%


29.1

%


29.3

%


__________________________________________________________________________________

(1)          Percentages are calculated based on unrounded numbers.


11 |


img187544587_1.jpg 


Supplementary Financial Information (continued)


Hotel Adjusted EBITDA – YTD 2022


The financial information below is for the 48 consolidated hotels owned as of March 31, 2022.


Three Months Ended


(unaudited, in millions)

March 31,


2022


Net loss

$

(56

)

Depreciation and amortization expense


69


Interest expense


62


Interest expense, income tax and depreciation and amortization


     included in equity in earnings from investments in affiliates


1


EBITDA


76


Share-based compensation expense


4


Other items


2


Adjusted EBITDA


82


Less: Adjusted EBITDA from investments in affiliates


(5

)

Add: All other(1)


12


Hotel Adjusted EBITDA

$

89


(1)         Includes other revenues and other expenses, non-income taxes on TRS leases included in other property-level expenses and corporate general and administrative expenses in the condensed consolidated statements of operations.


12 |


img187544587_1.jpg 


Supplementary Financial Information (continued)


Historical Pro-forma Hotel Adjusted EBITDA – Full Year 2021


The financial information below is for the 48 consolidated hotels owned as of March 31, 2022.


Three Months Ended


Full Year


(unaudited, in millions)

March 31,


June 30,


September 30,


December 31,


December 31,


2021


2021


2021


2021


2021


Net loss

$

(191

)


$

(114

)


$

(82

)


$

(65

)


$

(452

)

Depreciation and amortization expense


74


71


68


68


281


Interest income


(1

)


(1

)

Interest expense


63


66


66


63


258


Income tax expense (benefit)


1


(3

)


4


2


Interest expense, income tax and depreciation

   and amortization included in equity in

   earnings from investments in affiliates


1


4


3


3


11


EBITDA


(52

)


27


52


72


99


Loss (gain) on sales of assets, net


(6

)


11


5


Share-based compensation expense


6


4


5


4


19


Impairment and casualty loss, net


5


2


2


9


Other items


(3

)


3


7


3


10


Adjusted EBITDA


(49

)


33


77


81


142


Less: Adjusted EBITDA from hotels disposed of


4


1


(1

)


(2

)


2


Less: Adjusted EBITDA from investments in

   affiliates disposed of


1


1


Pro-forma Adjusted EBITDA


(45

)


35


76


79


145


Less: Adjusted EBITDA from investments in

   affiliates


2


(3

)


(4

)


(3

)


(8

)

Add: All other(1)


11


11


11


9


42


Pro-forma Hotel Adjusted EBITDA

$

(32

)


$

43


$

83


$

85


$

179


______________________________________________________________________________________

(1)         Includes other revenues and other expenses, non-income taxes on TRS leases included in other property-level expenses and corporate general and administrative expenses in the consolidated statements of operations.


13 |


img187544587_1.jpg 


Supplementary Financial Information (continued)


Historical Pro-forma Hotel Adjusted EBITDA – Full Year 2019


The financial information below is for the 48 consolidated hotels owned as of March 31, 2022.


Three Months Ended


Full Year


(unaudited, in millions)

March 31,


June 30,


September 30,


December 31,


December 31,


2019


2019


2019


2019


2019


Net income

$

97


$

84


$

9


$

126


$

316


Depreciation and amortization expense


62


61


61


80


264


Interest income


(1

)


(2

)


(2

)


(1

)


(6

)

Interest expense


32


33


33


42


140


Income tax expense


7


5


23


35


Interest expense, income tax and depreciation and amortization included in equity in earnings from investments in affiliates


5


7


7


4


23


EBITDA


202


188


108


274


772


(Gain) loss on sales of assets, net


(31

)


12


(1

)


1


(19

)

Gain on sale of investments in affiliates(1)


(44

)


(44

)

Acquisition costs


6


59


5


70


Severance expense


1


1


2


Share-based compensation expense


4


4


4


4


16


Casualty loss (gain) and impairment loss, net


8


(26

)


(18

)

Other items


(4

)


2


9


7


Adjusted EBITDA


176


207


180


223


786


Add: Adjusted EBITDA from hotels acquired


37


53


39


129


Less: Adjusted EBITDA from hotels disposed of


(23

)


(24

)


(14

)


(13

)


(74

)

Less: Adjusted EBITDA from investments in

   affiliates disposed of


(1

)


(2

)


(3

)

Pro-forma Adjusted EBITDA(2)


190


235


203


210


838


Less: Adjusted EBITDA from investments in

   affiliates


(10

)


(11

)


(7

)


(6

)


(34

)

Add: All other(3)


15


14


12


12


53


Pro-forma Hotel Adjusted EBITDA

$

195


$

238


$

208


$

216


$

857


______________________________________________________________________________________

(1)

Included in other loss, net in the consolidated statements of operations.

(2)

Full year December 31, 2019 includes $15 million associated with 466 rooms at the Hilton Waikoloa Village that were transferred to Hilton Grand Vacations at the end of 2019, $6 million associated with business interruption proceeds related to the loss of income in prior years for the Hilton Caribe and a $6 million operating loss generated from Park’s laundry facilities that were closed in 2021. Excluding these amounts, 2019 Pro-forma Adjusted EBITDA would have been $823 million.

(3)

Includes other revenues and other expenses, non-income taxes on TRS leases included in other property-level expenses and corporate general and administrative expenses in the consolidated statements of operations.


14 |


img187544587_1.jpg 


Supplementary Financial Information (continued)


Historical Pro-forma Hotel Revenues – 2022, 2021 and 2019


The financial information below is for the 48 consolidated hotels owned as of March 31, 2022.


Three Months Ended


(unaudited, in millions)


March 31,


2022


Total Revenues


$

479


Less: Other revenue


(16

)


Hotel Revenues


$

463


Three Months Ended


Full Year


March 31,


June 30,


September 30,


December 31,


December 31,


2021


2021


2021


2021


2021


Total Revenues


$

165


$

323


$

423


$

451


$

1,362


Less: Other revenue


(8

)


(12

)


(15

)


(16

)


(51

)

Less: Revenues from hotels disposed of


(4

)


(9

)


(4

)


(17

)

Pro-forma Hotel Revenues


$

153


$

302


$

404


$

435


$

1,294


Three Months Ended


Full Year


March 31,


June 30,


September 30,


December 31,


December 31,


2019


2019


2019


2019


2019


Total Revenues


$

659


$

703


$

672


$

810


$

2,844


Less: Other revenue


(18

)


(19

)


(22

)


(18

)


(77

)

Add: Revenues from hotels acquired


130


151


125


406


Less: Revenues from hotels disposed of


(76

)


(71

)


(51

)


(51

)


(249

)

Pro-forma Hotel Revenues


$

695


$

764


$

724


$

741


$

2,924


15 |


img187544587_1.jpg 


Supplementary Financial Information (continued)


General and Administrative Expenses


(unaudited, in millions)


Three Months Ended


March 31,


2022


2021


Corporate general and administrative expenses


$

16


$

18


Less:


Share-based compensation expense


4


6


Other items


2


1


G&A, excluding expenses not included in Adjusted EBITDA and Adjusted FFO


$

10


$

11


16 |


img187544587_1.jpg 


Supplementary Financial Information (continued)


Net Debt and Net Debt to Pro-forma Adjusted EBITDA Ratio


(unaudited, in millions)


March 31, 2022


December 31, 2021


December 31, 2020


Debt


$

4,671


$

4,672


$

5,121


Add: unamortized deferred financing costs and discount


37


38


38


Less: unamortized premium


(4

)


(4

)


(3

)

Debt, excluding unamortized deferred financing cost,

   premiums and discounts


4,704


4,706


5,156


Add: Park's share of unconsolidated affiliates debt,

   excluding unamortized deferred financing costs


225


225


225


Less: cash and cash equivalents


(639

)


(688

)


(951

)

Less: restricted cash


(78

)


(75

)


(30

)

Net debt


$

4,212


$

4,168


$

4,400


2019 Pro-forma Adjusted EBITDA(1)


$

838


$

838


$

838


Net debt to Pro-forma Adjusted EBITDA ratio


5.03x


4.97x


5.25x


(1)         See page 14 for Pro-forma Adjusted EBITDA for the year ended December 31, 2019.


17 |


img187544587_1.jpg 


Outlook


img187544587_5.jpg 


Outlook


Q2 2022 Outlook and Assumptions


(unaudited, dollars in millions, except per share amounts and RevPAR)


Q2 2022 Outlook


as of May 2, 2022


Metric


Low


High


RevPAR


$

160


$

164


RevPAR Growth vs. 2019


(16

)%


(14

)%

RevPAR Growth vs. 2021


104

%


109

%


Net income


$

16


$

36


Net income attributable to stockholders


$

13


$

33


Earnings per share - Diluted(1)


$

0.05


$

0.14


Adjusted EBITDA


$

160


$

180


Hotel Adjusted EBITDA margin change vs. 2019


(390

) bps


(240

) bps

Hotel Adjusted EBITDA margin change vs. 2021


1,320

bps


1,470

bps

Adjusted FFO per share - Diluted(1)


$

0.40


$

0.49


(1)

Per share amounts are calculated based on unrounded numbers.


Q2 2022 outlook is based in part on the following assumptions:


Fully diluted weighted average shares are expected to be 233 million; and
Does not take into account potential future acquisitions and dispositions, including those currently under contract, which could result in a material change to Park’s outlook.


19 |


img187544587_1.jpg 


Outlook (continued)


EBITDA and Adjusted EBITDA


Three Months Ended


(unaudited, in millions)


June 30, 2022


Low Case


High Case


Net income


$

16


$

36


Depreciation and amortization expense


69


69


Interest expense


61


61


Interest expense, income tax and depreciation and amortization included in

   equity in earnings from investments in affiliates


3


3


EBITDA


149


169


Share-based compensation expense


4


4


Other items


7


7


Adjusted EBITDA


$

160


$

180


20 |


img187544587_1.jpg 


Outlook (continued)


Nareit FFO and Adjusted FFO


Three Months Ended


(unaudited, in millions except per share data)


June 30, 2022


Low Case


High Case


Net income attributable to stockholders


$

13


$

33


Depreciation and amortization expense


69


69


Depreciation and amortization expense attributable to noncontrolling interests


(1

)


(1

)

Equity investment adjustments:


Equity in earnings from investments in affiliates


(4

)


(4

)

Pro rata FFO of equity investments


5


5


Nareit FFO attributable to stockholders


82


102


Share-based compensation expense


4


4


Other items


7


7


Adjusted FFO attributable to stockholders


$

93


$

113


Adjusted FFO per share - Diluted(1)


$

0.40


$

0.49


Weighted average diluted shares outstanding


233.0


233.0


(1)
Per share amounts are calculated based on unrounded numbers.


21 |


img187544587_6.jpg 


Portfolio and Operating Metrics


img187544587_7.jpg 


Hilton Santa Barbara Beachfront Resort Hilton New Orleans Riverside Waldorf Astoria Orlando


22 |


img187544587_6.jpg 


Portfolio and Operating Metrics


Hotel Portfolio as of May 2, 2022


Hotel Name

Total Rooms


Operating Status

Reopening Date

Market

Meeting Space

(square feet)


Ownership

Equity Ownership


Debt

(in millions)


Consolidated Portfolio


Hilton Hawaiian Village Waikiki Beach Resort


2,860


Open

12/15/2020

Hawaii


150,000


Fee Simple

100%


$

1,275


Hilton San Francisco Union Square


1,921


Open

5/24/2021

San Francisco


135,000


Fee Simple

100%


$

725


(2)

New York Hilton Midtown


1,878


Open

10/4/2021

New York


151,000


Fee Simple

100%


Hilton New Orleans Riverside


1,622


Open

7/9/2020

New Orleans


130,000


Fee Simple

100%


Hilton Chicago


1,544


Open

6/10/2021

Chicago


234,000


Fee Simple

100%


Parc 55 San Francisco - a Hilton Hotel


1,024


Suspended

5/19/2022(1)

San Francisco


32,000


Fee Simple

100%


(2)

Signia by Hilton Orlando Bonnet Creek


1,009


Open

7/1/2020

Orlando


157,000


Fee Simple

100%


DoubleTree Hotel Seattle Airport


850


Open

3/21/2021

Seattle


41,000


Leasehold

100%


Hilton Orlando Lake Buena Vista


814


Open

11/2/2020

Orlando


78,000


Leasehold

100%


Caribe Hilton


652


Open

10/8/2020

Other U.S.


65,000


Fee Simple

100%


Hilton Waikoloa Village


647


Open

11/13/2020

Hawaii


241,000


Fee Simple

100%


DoubleTree Hotel Washington DC – Crystal City


627


Open


Washington, D.C.


36,000


Fee Simple

100%


Hilton Denver City Center


613


Open

7/1/2020

Denver


50,000


Fee Simple

100%


$

58


Hilton Boston Logan Airport


604


Open


Boston


30,000


Leasehold

100%


W Chicago - Lakeshore


520


Open


Chicago


20,000


Fee Simple

100%


Hilton Miami Airport


508


Open

6/4/2020

Miami


30,000


Fee Simple

100%


DoubleTree Hotel San Jose


505


Open


Other U.S.


48,000


Fee Simple

100%


Hyatt Regency Boston


502


Open

6/21/2020

Boston


30,000


Fee Simple

100%


$

134


Waldorf Astoria Orlando


502


Open

7/1/2020

Orlando


33,000


Fee Simple

100%


Hilton Salt Lake City Center


499


Open


Other U.S.


24,000


Leasehold

100%


DoubleTree Hotel Ontario Airport


482


Open


Southern California


27,000


Fee Simple

67%


$

30


Hilton McLean Tysons Corner


458


Open


Washington, D.C.


28,000


Fee Simple

100%


Hyatt Regency Mission Bay Spa and Marina


438


Open

6/25/2020

Southern California


24,000


Leasehold

100%


Boston Marriott Newton


430


Open


Boston


34,000


Fee Simple

100%


W Chicago - City Center


403


Open

5/13/2021

Chicago


13,000


Fee Simple

100%


$

75


Hilton Seattle Airport & Conference Center


396


Open


Seattle


40,000


Leasehold

100%


Royal Palm South Beach Miami, a Tribute Portfolio Resort


393


Open

6/1/2020

Miami


11,000


Fee Simple

100%


DoubleTree Hotel Spokane City Center


375


Open


Other U.S.


21,000


Fee Simple

10%


$

14


Hilton Santa Barbara Beachfront Resort


360


Open


Southern California


62,000


Fee Simple

50%


$

164


Hilton Oakland Airport


360


Open


Other U.S.


15,000


Leasehold

100%


JW Marriott San Francisco Union Square


344


Open


San Francisco


12,000


Leasehold

100%


Hyatt Centric Fisherman's Wharf


316


Open


San Francisco


19,000


Fee Simple

100%


Hilton Short Hills


314


Open

3/1/2022

Other U.S.


21,000


Fee Simple

100%


Casa Marina Key West, Curio Collection


311


Open

6/1/2020

Key West


21,000


Fee Simple

100%


DoubleTree Hotel San Diego – Mission Valley


300


Open

9/14/2020

Southern California


24,000


Leasehold

100%


Barbara Beachfront Resort Hilton New Orleans Riverside Waldorf Astoria Orlando


(1) As of May 2, 2022, the current projected reopening date for Parc 55 San Francisco – a Hilton Hotel is estimated.

(2) Single $725 million CMBS loan secured by Hilton San Francisco Union Square and Parc 55 San Francisco – a Hilton Hotel.


23 |


img187544587_6.jpg 


Portfolio and Operating Metrics (continued)


Hotel Portfolio as of May 2, 2022


Hotel Name

Total Rooms


Operating Status

Reopening Date

Market

Meeting Space

(square feet)


Ownership

Equity Ownership


Debt(1)

(in millions)


Consolidated Portfolio (continued)


Embassy Suites Kansas City Plaza


266


Open

7/16/2020

Other U.S.


11,000


Leasehold

100%


Embassy Suites Austin Downtown South Congress


262


Open

7/1/2020

Other U.S.


2,000


Leasehold

100%


DoubleTree Hotel Sonoma Wine Country


245


Open

6/4/2020

Other U.S.


50,000


Leasehold

100%


Juniper Hotel Cupertino, Curio Collection


224


Open

7/9/2020

Other U.S.


5,000


Fee Simple

100%


Hilton Chicago/Oak Brook Suites


211


Open


Chicago


3,000


Fee Simple

100%


Homewood Suites by Hilton Seattle Convention Center Pike Street


195


Open


Seattle


1,000


Fee Simple

100%


Hilton Checkers Los Angeles


193


Open

7/20/2020

Southern California


3,000


Fee Simple

100%


$

26


Embassy Suites Phoenix Airport


182


Open

6/12/2020

Other U.S.


5,000


Leasehold

100%


Hilton Garden Inn LAX/El Segundo


162


Open

7/1/2020

Southern California


3,000


Fee Simple

100%


DoubleTree Hotel Durango


159


Open

6/1/2020

Other U.S.


7,000


Leasehold

100%


The Reach Key West, Curio Collection


150


Open

6/1/2020

Key West


18,000


Fee Simple

100%


Hilton Garden Inn Chicago/Oak Brook Terrace


128


Open

6/1/2021

Chicago


2,000


Fee Simple

100%


Total Consolidated Portfolio (47 Hotels)


27,758


2,197,000


$

2,501


Unconsolidated Joint Venture Portfolio


Hilton Orlando


1,424


Open


Orlando


249,000


Fee Simple

20%


$

95


Hilton San Diego Bayfront


1,190


Open

8/15/2020

Southern California


170,000


Leasehold

25%


$

55


Capital Hilton


550


Open

8/20/2020

Washington, D.C.


30,000


Fee Simple

25%


$

25


Hilton La Jolla Torrey Pines


394


Open


Southern California


41,000


Leasehold

25%


$

24


Embassy Suites Alexandria Old Town


288


Open

7/1/2020

Washington, D.C.


11,000


Fee Simple

50%


$

26


DoubleTree Hotel Las Vegas Airport


190


Open


Other U.S.


3,000


Fee Simple

50%


Total Unconsolidated Joint Venture Portfolio (6 Hotels)


4,036


504,000


$

225


TOTAL PARK HOTELS & RESORTS PORTFOLIO (53 Hotels)


31,794


2,701,000


$

2,726


(1) Debt related to unconsolidated joint ventures is presented on a pro-rata basis.


24 |


img187544587_6.jpg 


Portfolio and Operating Metrics (continued)


Pro-forma Hotels by Market: Q1 2022 vs. Q1 2021


(unaudited)


Pro-forma ADR


Pro-forma Occupancy


Pro-forma RevPAR


Pro-forma Total RevPAR


Hotels


Rooms


1Q22


1Q21


Change(1)


1Q22


1Q21


Change


1Q22


1Q21


Change(1)


1Q22


1Q21


Change(1)


Hawaii


2


3,507


$

270.20


$

199.42


35.5

%


77.5

%


25.0

%


52.5

%

pts


$

209.44


$

49.81


320.5

%


$

368.93


$

91.84


301.7

%

San Francisco


4


3,605


202.36


147.58


37.1


24.7


5.1


19.6


50.05


7.51


566.7


75.40


10.14


643.5


Orlando


3


2,325


279.55


175.94


58.9


58.7


26.2


32.5


164.17


46.18


255.5


318.66


93.90


239.4


New Orleans


1


1,622


204.48


62.02


229.7


53.6


50.8


2.8


109.58


31.50


247.8


187.62


45.06


316.4


Boston


3


1,536


161.77


116.28


39.1


57.0


26.3


30.7


92.16


30.60


201.2


125.33


39.91


214.1


New York


1


1,878


237.96


100.0


33.8


33.8


80.41


100.0


134.91


1.46


9,140.9


Southern California


6


1,935


200.03


149.54


33.8


67.1


37.9


29.2


134.20


56.73


136.6


198.68


79.60


149.6


Chicago


5


2,806


151.76


117.51


29.2


29.2


5.6


23.6


44.36


6.62


570.2


69.09


8.57


706.0


Key West


2


461


752.55


522.14


44.1


83.1


84.3


(1.2

)


625.18


440.21


42.0


854.94


610.64


40.0


Denver


1


613


140.46


102.94


36.4


55.5


23.8


31.7


78.01


24.51


218.2


115.08


29.77


286.6


Miami


2


901


269.87


181.15


49.0


82.3


65.6


16.7


222.18


118.94


86.8


286.02


164.73


73.6


Washington, D.C.


2


1,085


130.98


114.08


14.8


46.1


44.1


2.0


60.43


50.41


19.9


86.65


56.12


54.4


Seattle


3


1,441


122.73


97.50


25.9


57.5


27.4


30.1


70.59


26.70


164.4


102.26


33.43


205.9


Other


13


4,174


178.27


122.90


45.0


52.7


38.7


14.0


93.98


47.59


97.5


128.35


60.61


111.8


All Markets


48


27,889


$

224.42


$

155.60


44.2

%


51.9

%


26.6

%


25.3

%

pts


$

116.42


$

41.32


181.7

%


$

184.11


$

61.04


201.6

%


(1)          Calculated based on unrounded numbers.


25 |


img187544587_6.jpg 


Portfolio and Operating Metrics (continued)


Pro-forma Hotels by Market: Q1 2022 vs. Q1 2021


(unaudited, dollars in millions)


Pro-forma Hotel Adjusted EBITDA


Pro-forma Hotel Revenue


Pro-forma Hotel Adjusted EBITDA Margin


Hotels


Rooms


1Q22


1Q21


Change(1)


1Q22


1Q21


Change(1)


1Q22


1Q21


Change

Hawaii


2


3,507


$

42


$

(2

)


2,551.7

%


$

116


$

29


301.7

%


36.1

%


(6.0

)%


4,210


bps

San Francisco


4


3,605


(11

)


(14

)


21.0


24


3


643.5


(46.9

)


(442.0

)


39,510


Orlando


3


2,325


25


8,636.5


67


20


239.4


37.0


(1.5

)


3,850


New Orleans


1


1,622


10


(1

)


1,802.9


27


7


316.4


36.6


(8.9

)


4,550


Boston


3


1,536


1


(4

)


112.2


17


6


214.1


3.0


(77.4

)


8,040


New York


1


1,878


(12

)


(9

)


(26.8

)


23


100.0


(50.7

)


(3,692.8

)


364,210


Southern California


6


1,935


9


15,561.2


35


14


149.6


25.8


(0.4

)


2,620


Chicago


5


2,806


(7

)


(8

)


18.8


17


2


706.0


(39.5

)


(392.1

)


35,260


Key West


2


461


19


12


49.7


35


25


40.0


52.6


49.2


340


Denver


1


613


1


(1

)


186.9


6


2


286.6


15.4


(68.5

)


8,390


Miami


2


901


10


4


131.8


23


13


73.6


44.6


33.4


1,120


Washington, D.C.


2


1,085


(1

)


(675.8

)


8


5


54.4


(7.9

)


2.1


(1,000

)


Seattle


3


1,441


(3

)


88.5


13


4


205.9


(2.7

)


(70.8

)


6,810


Other


13


4,174


3


(6

)


162.8


52


23


111.8


7.9


(26.6

)


3,450


All Markets


48


27,889


$

89


$

(32

)


376.1

%


$

463


$

153


201.6

%


19.3

%


(21.1

)%


4,040


bps


(1)          Calculated based on unrounded numbers.


26 |


img187544587_6.jpg 


Portfolio and Operating Metrics (continued)


Pro-forma Core Hotels: Q1 2022 vs. Q1 2021


(unaudited)


Pro-forma ADR


Pro-forma Occupancy


Pro-forma RevPAR


Pro-forma Total RevPAR


1Q22


1Q21


Change(1)


1Q22


1Q21


Change


1Q22


1Q21


Change(1)


1Q22


1Q21


Change(1)


Core Hotels


1

Hilton Hawaiian Village Waikiki Beach Resort


$

255.57


$

200.30


27.6

%


77.0

%


21.3

%


55.7

%

pts


$

196.80


$

42.69


361.0

%


$

314.55


$

68.07


362.1

%

2

Hilton Waikoloa Village


332.61


197.40


68.5


79.8


41.2


38.6


265.34


81.26


226.5


609.31


196.90


209.5


3

Hilton San Francisco Union Square


203.52


100.0


25.9


25.9


52.76


100.0


79.31


0.83


9,485.9


4

Parc 55 San Francisco - a Hilton Hotel


0.81


1.31


(38.1

)

5

JW Marriott San Francisco Union Square


247.88


168.70


46.9


55.7


26.1


29.6


138.02


44.07


213.2


216.10


51.49


319.7


6

Hyatt Centric Fisherman's Wharf


156.36


127.97


22.2


64.0


29.6


34.4


100.03


37.88


164.1


140.15


50.35


178.4


7

Signia by Hilton Orlando Bonnet Creek


250.30


143.67


74.2


52.6


30.9


21.7


131.71


44.37


196.8


295.10


92.71


218.3


8

Waldorf Astoria Orlando


486.94


345.32


41.0


55.9


24.4


31.5


272.29


84.19


223.4


506.81


179.96


181.6


9

Hilton Orlando Lake Buena Vista


202.46


115.38


75.5


68.0


21.6


46.4


137.73


24.98


451.4


231.84


42.29


448.2


10

Hilton New Orleans Riverside


204.48


62.02


229.7


53.6


50.8


2.8


109.58


31.50


247.8


187.62


45.06


316.4


11

Hyatt Regency Boston


175.39


98.62


77.8


46.9


27.1


19.8


82.21


26.71


207.8


111.70


37.15


200.7


12

Hilton Boston Logan Airport


160.56


128.84


24.6


81.7


34.5


47.2


131.14


44.46


194.9


172.11


55.53


209.9


13

Boston Marriott Newton


143.95


112.66


27.8


34.1


14.0


20.1


49.03


15.68


212.7


75.54


21.18


256.6


14

New York Hilton Midtown


237.96


100.0


33.8


33.8


80.41


100.0


134.91


1.46


9,140.9


15

Hilton Santa Barbara Beachfront Resort


302.39


258.07


17.2


69.7


42.3


27.4


210.66


109.05


93.2


293.18


155.12


89.0


16

Hyatt Regency Mission Bay Spa and Marina


228.84


172.67


32.5


53.8


26.4


27.4


123.14


45.54


170.4


223.15


84.92


162.8


17

Hilton Checkers Los Angeles


225.60


122.37


84.4


49.4


22.0


27.4


111.38


26.88


314.3


126.36


31.35


303.0


18

Hilton Chicago


162.46


100.0


26.4


26.4


42.93


100.0


79.58


1.33


5,896.6


19

W Chicago - City Center


208.54


100.0


21.2


21.2


44.19


100.0


55.36


276,890.9


20

W Chicago - Lakeshore


138.53


134.15


3.3


26.4


18.4


8.0


36.52


24.59


48.5


45.37


28.80


57.5


21

Casa Marina Key West, Curio Collection


748.98


550.24


36.1


85.3


83.3


2.0


638.60


458.20


39.4


869.49


642.02


35.4


22

The Reach Key West, Curio Collection


760.58


466.02


63.2


78.5


86.4


(7.9

)


597.37


402.92


48.3


824.77


545.57


51.2


23

Hilton Denver City Center


140.46


102.94


36.4


55.5


23.8


31.7


78.01


24.51


218.2


115.08


29.77


286.6


24

Royal Palm South Beach Miami


358.06


221.85


61.4


79.2


82.0


(2.8

)


283.45


181.92


55.8


357.46


252.69


41.5


25

DoubleTree Hotel Washington DC – Crystal City


122.89


116.62


5.4


51.1


43.8


7.3


62.84


51.15


22.8


84.40


55.76


51.3


26

DoubleTree Hotel San Jose


147.03


110.35


33.2


45.8


27.0


18.8


67.31


29.80


125.9


100.11


38.06


163.0


27

Juniper Hotel Cupertino, Curio Collection


127.65


87.77


45.4


40.8


33.0


7.8


52.11


29.01


79.6


65.72


31.61


107.9


Sub-total Core Hotels


$

249.29


$

178.12


40.0

%


49.4

%


22.4

%


27.0

%


$

123.05


$

39.87


208.6

%


$

201.24


$

62.18


223.6

%


All Other Hotels


$

164.10


$

117.72


39.4

%


59.2

%


38.7

%


20.5

%


$

97.14


$

45.55


113.2

%


$

134.27


$

57.73


132.6

%


Total Consolidated Portfolio


$

224.42


$

155.60


44.2

%


51.9

%


26.6

%


25.3

%

pts


$

116.42


$

41.32


181.7

%


$

184.11


$

61.04


201.6

%


(1) Calculated based on unrounded numbers.


27 |


img187544587_6.jpg 


Portfolio and Operating Metrics (continued)


Pro-forma Core Hotels: Q1 2022 vs. Q1 2021


(unaudited, dollars in millions)


Pro-forma Hotel Adjusted EBITDA


Pro-forma Hotel Revenue


Pro-forma Hotel Adjusted EBITDA Margin


1Q22


1Q21


Change(1)


1Q22


1Q21


Change(1)


1Q22


1Q21


Change


Core Hotels


1

Hilton Hawaiian Village Waikiki Beach Resort


$

29


$

(3

)


1,049.1

%


$

81


$

18


362.1

%


35.4

%


(17.2

)%


5,260


bps

2

Hilton Waikoloa Village


13


1


930.8


35


11


209.5


37.8


11.3


2,650


3

Hilton San Francisco Union Square


(7

)


(7

)


(1.2

)


14


100.0


(54.1

)


(5,120.6

)


506,650


4

Parc 55 San Francisco - a Hilton Hotel


(4

)


(4

)


(8.7

)


(5,732.0

)


(3,262.1

)


(246,990

)


5

JW Marriott San Francisco Union Square


(2

)


105.9


7


2


319.7


2.1


(150.5

)


15,260


6

Hyatt Centric Fisherman's Wharf


(1

)


109.8


4


1


178.4


2.1


(60.7

)


6,280


7

Signia by Hilton Orlando Bonnet Creek


9


3,753.7


27


8


218.3


34.9


(3.1

)


3,800


8

Waldorf Astoria Orlando


9


1


688.4


23


8


181.6


40.9


14.6


2,630


9

Hilton Orlando Lake Buena Vista


6


(1

)


588.5


17


3


448.2


35.1


(39.3

)


7,440


10

Hilton New Orleans Riverside


10


(1

)


1,802.9


27


7


316.4


36.6


(8.9

)


4,550


11

Hyatt Regency Boston


(2

)


110.1


5


2


200.7


3.2


(94.8

)


9,800


12

Hilton Boston Logan Airport


1


(2

)


137.0


9


3


209.9


6.7


(56.6

)


6,330


13

Boston Marriott Newton


(1

)


72.4


3


1


256.6


(9.2

)


(118.7

)


10,950


14

New York Hilton Midtown


(12

)


(9

)


(26.8

)


23


100.0


(50.7

)


(3,692.8

)


364,210


15

Hilton Santa Barbara Beachfront Resort


4


2


139.1


9


5


89.0


38.5


30.4


810


16

Hyatt Regency Mission Bay Spa and Marina


2


499.9


9


3


162.8


19.2


(12.7

)


3,190


17

Hilton Checkers Los Angeles


(1

)


137.7


2


1


303.0


11.3


(121.1

)


13,240


18

Hilton Chicago


(3

)


(5

)


25.2


11


100.0


(31.4

)


(2,516.6

)


248,520


19

W Chicago - City Center


(1

)


(1

)


(15.5

)


2


100.0


(70.0

)


(167,781.6

)


16,771,160


20

W Chicago - Lakeshore


(2

)


(2

)


(9.9

)


2


1


57.5


(105.7

)


(151.5

)


4,580


21

Casa Marina Key West, Curio Collection


13


9


39.4


24


18


35.4


52.9


51.4


150


22

The Reach Key West, Curio Collection


6


3


79.1


11


7


51.2


52.0


43.9


810


23

Hilton Denver City Center


1


(1

)


186.9


6


2


286.6


15.4


(68.5

)


8,390


24

Royal Palm South Beach Miami


6


4


66.7


13


9


41.5


47.3


40.1


720


25

DoubleTree Hotel Washington DC – Crystal City


1


(54.6

)


5


3


51.3


5.6


18.7


(1,310

)


26

DoubleTree Hotel San Jose


(1

)


(1

)


53.3


5


2


163.0


(14.0

)


(79.0

)


6,500


27

Juniper Hotel Cupertino, Curio Collection


(1

)


(1

)


27.9


1


1


107.9


(42.0

)


(121.2

)


7,920


Sub-total Core Hotels


$

78


$

(24

)


414.8

%


$

375


$

116


223.6

%


20.6

%


(21.2

)%


4,180


bps


All Other Hotels


$

11


$

(8

)


251.8

%


$

88


$

37


132.6

%


13.5

%


(20.7

)%


3,420


bps


Total Consolidated Portfolio


$

89


$

(32

)


376.1

%


$

463


$

153


201.6

%


19.3

%


(21.1

)%


4,040


bps


(1) Calculated based on unrounded numbers.


28 |


img187544587_6.jpg 


Portfolio and Operating Metrics (continued)


Pro-forma Hotels by Market: Q1 2022 vs. Q1 2019


(unaudited)


Pro-forma ADR


Pro-forma Occupancy


Pro-forma RevPAR


Pro-forma Total RevPAR


Hotels


Rooms


1Q22


1Q19


Change(1)


1Q22


1Q19


Change


1Q22


1Q19


Change(1)


1Q22


1Q19


Change(1)


Hawaii


2


3,507


$

270.20


$

255.24


5.9

%


77.5

%


90.1

%


(12.6

)%

pts


$

209.44


$

229.88


(8.9

)%


$

368.93


$

389.68


(5.3

)%

San Francisco


4


3,605


202.36


321.33


(37.0

)


24.7


87.5


(62.8

)


50.05


281.26


(82.2

)


75.40


369.76


(79.6

)

Orlando


3


2,325


279.55


230.25


21.4


58.7


86.1


(27.4

)


164.17


198.33


(17.2

)


318.66


414.25


(23.1

)

New Orleans


1


1,622


204.48


215.74


(5.2

)


53.6


76.1


(22.5

)


109.58


164.10


(33.2

)


187.62


285.74


(34.3

)

Boston


3


1,536


161.77


180.14


(10.2

)


57.0


76.6


(19.6

)


92.16


138.01


(33.2

)


125.33


198.10


(36.7

)

New York


1


1,878


237.96


227.91


4.4


33.8


79.1


(45.3

)


80.41


180.26


(55.4

)


134.91


308.07


(56.2

)

Southern California


6


1,935


200.03


174.06


14.9


67.1


81.8


(14.7

)


134.20


142.39


(5.7

)


198.68


227.64


(12.7

)

Chicago


5


2,806


151.76


139.81


8.5


29.2


55.2


(26.0

)


44.36


77.26


(42.6

)


69.09


134.03


(48.5

)

Key West


2


461


752.55


464.03


62.2


83.1


90.7


(7.6

)


625.18


420.58


48.6


854.94


597.85


43.0


Denver


1


613


140.46


163.18


(13.9

)


55.5


74.6


(19.1

)


78.01


121.82


(36.0

)


115.08


187.77


(38.7

)

Miami


2


901


269.87


237.08


13.8


82.3


90.9


(8.6

)


222.18


215.47


3.1


286.02


292.73


(2.3

)

Washington, D.C.


2


1,085


130.98


163.60


(19.9

)


46.1


65.8


(19.7

)


60.43


107.64


(43.9

)


86.65


162.41


(46.6

)

Seattle


3


1,441


122.73


140.79


(12.8

)


57.5


76.4


(18.9

)


70.59


107.63


(34.4

)


102.26


155.36


(34.2

)

Other


13


4,174


178.27


182.83


(2.5

)


52.7


63.2


(10.5

)


93.98


115.56


(18.7

)


128.35


159.15


(19.4

)

All Markets


48


27,889


$

224.42


$

224.27


0.1

%


51.9

%


77.3

%


(25.4

)%

pts


$

116.42


$

173.32


(32.8

)%


$

184.11


$

272.49


(32.4

)%


(1)          Calculated based on unrounded numbers.


29 |


img187544587_6.jpg 


Portfolio and Operating Metrics (continued)


Pro-forma Hotels by Market: Q1 2022 vs. Q1 2019


(unaudited, dollars in millions)


Pro-forma Hotel Adjusted EBITDA


Pro-forma Hotel Revenue


Pro-forma Hotel Adjusted EBITDA Margin


Hotels


Rooms


1Q22


1Q19


Change(1)


1Q22


1Q19


Change(1)


1Q22


1Q19


Change

Hawaii


2


3,507


$

42


$

51


(17.3

)%


$

116


$

139


(16.4

)%


36.1

%


36.5

%


(40

)

bps

San Francisco


4


3,605


(11

)


41


(128.0

)


24


120


(79.6

)


(46.9

)


34.2


(8,110

)


Orlando


3


2,325


25


35


(28.7

)


67


87


(23.1

)


37.0


39.9


(290

)


New Orleans


1


1,622


10


18


(43.1

)


27


42


(34.3

)


36.6


42.2


(560

)


Boston


3


1,536


1


5


(90.3

)


17


27


(36.6

)


3.0


19.7


(1,670

)


New York


1


1,878


(12

)


(2

)


(444.5

)


23


52


(56.2

)


(50.7

)


(4.1

)


(4,660

)


Southern California


6


1,935


9


10


(14.1

)


35


40


(12.5

)


25.8


26.3


(50

)


Chicago


5


2,806


(7

)


(5

)


(26.0

)


17


34


(48.5

)


(39.5

)


(16.2

)


(2,330

)


Key West


2


461


19


11


65.0


35


25


43.0


52.6


45.6


700


Denver


1


613


1


4


(72.3

)


6


10


(38.7

)


15.4


34.1


(1,870

)


Miami


2


901


10


11


(6.2

)


23


24


(2.3

)


44.6


46.5


(190

)


Washington, D.C.


2


1,085


(1

)


2


(133.4

)


8


16


(46.6

)


(7.9

)


12.7


(2,060

)


Seattle


3


1,441


3


(111.4

)


13


20


(34.2

)


(2.7

)


15.3


(1,800

)


Other


13


4,174


3


11


(67.0

)


52


59


(19.3

)


7.9


19.3


(1,140

)


All Markets


48


27,889


$

89


$

195


(54.3

)%


$

463


$

695


(33.5

)%


19.3

%


28.0

%


(870

)

bps


(1)       Calculated based on unrounded numbers.


30 |


img187544587_6.jpg 


s


Portfolio and Operating Metrics (continued)


Pro-forma Core Hotels: Q1 2022 vs. Q1 2019


(unaudited)


Pro-forma ADR


Pro-forma Occupancy


Pro-forma RevPAR


Pro-forma Total RevPAR


1Q22


1Q19


Change(1)


1Q22


1Q19


Change


1Q22


1Q19


Change(1)


1Q22


1Q19


Change(1)


Core Hotels


1

Hilton Hawaiian Village Waikiki Beach Resort


$

255.57


$

260.34


(1.8

)%


77.0

%


92.6

%


(15.6

)%

pts


$

196.80


$

240.99


(18.3

)%


$

314.55


$

386.99


(18.7

)%

2

Hilton Waikoloa Village


332.61


240.69


38.2


79.8


83.6


(3.8

)


265.34


201.24


31.8


609.31


396.59


53.6


3

Hilton San Francisco Union Square


203.52


320.01


(36.4

)


25.9


85.0


(59.1

)


52.76


271.96


(80.6

)


79.31


383.65


(79.3

)

4

Parc 55 San Francisco - a Hilton Hotel


309.13


(100.0

)


87.6


(87.6

)


270.94


(100.0

)


0.81


308.89


(99.7

)

5

JW Marriott San Francisco Union Square


247.88


424.88


(41.7

)


55.7


92.4


(36.7

)


138.02


392.35


(64.8

)


216.10


522.54


(58.6

)

6

Hyatt Centric Fisherman's Wharf


156.36


256.98


(39.2

)


64.0


97.4


(33.4

)


100.03


250.28


(60.0

)


140.15


316.31


(55.7

)

7

Signia by Hilton Orlando Bonnet Creek


250.30


223.66


11.9


52.6


85.4


(32.8

)


131.71


191.00


(31.0

)


295.10


457.91


(35.6

)

8

Waldorf Astoria Orlando


486.94


334.46


45.6


55.9


78.3


(22.4

)


272.29


261.81


4.0


506.81


514.18


(1.4

)

9

Hilton Orlando Lake Buena Vista


202.46


183.10


10.6


68.0


91.9


(23.9

)


137.73


168.26


(18.1

)


231.84


298.51


(22.3

)

10

Hilton New Orleans Riverside


204.48


215.74


(5.2

)


53.6


76.1


(22.5

)


109.58


164.10


(33.2

)


187.62


285.74


(34.3

)

11

Hyatt Regency Boston


175.39


175.14


0.1


46.9


91.3


(44.4

)


82.21


159.91


(48.6

)


111.70


212.83


(47.5

)

12

Hilton Boston Logan Airport


160.56


194.42


(17.4

)


81.7


77.5


4.2


131.14


150.65


(13.0

)


172.11


208.12


(17.3

)

13

Boston Marriott Newton


143.95


162.79


(11.6

)


34.1


58.3


(24.2

)


49.03


94.79


(48.3

)


75.54


166.94


(54.8

)

14

New York Hilton Midtown


237.96


227.91


4.4


33.8


79.1


(45.3

)


80.41


180.26


(55.4

)


134.91


308.07


(56.2

)

15

Hilton Santa Barbara Beachfront Resort


302.39


233.48


29.5


69.7


75.9


(6.2

)


210.66


177.14


18.9


293.18


294.11


(0.3

)

16

Hyatt Regency Mission Bay Spa and Marina


228.84


164.08


39.5


53.8


73.4


(19.6

)


123.14


120.45


2.2


223.15


239.05


(6.6

)

17

Hilton Checkers Los Angeles


225.60


231.69


(2.6

)


49.4


76.2


(26.8

)


111.38


176.49


(36.9

)


126.36


202.45


(37.6

)

18

Hilton Chicago


162.46


138.29


17.5


26.4


54.7


(28.3

)


42.93


75.72


(43.3

)


79.58


158.86


(49.9

)

19

W Chicago - City Center


208.54


190.17


9.7


21.2


58.5


(37.3

)


44.19


111.19


(60.3

)


55.36


147.51


(62.5

)

20

W Chicago - Lakeshore


138.53


124.84


11.0


26.4


45.8


(19.4

)


36.52


57.15


(36.1

)


45.37


76.89


(41.0

)

21

Casa Marina Key West, Curio Collection


748.98


476.63


57.1


85.3


91.5


(6.2

)


638.60


436.07


46.4


869.49


625.86


38.9


22

The Reach Key West, Curio Collection


760.58


437.15


74.0


78.5


88.8


(10.3

)


597.37


388.48


53.8


824.77


539.76


52.8


23

Hilton Denver City Center


140.46


163.18


(13.9

)


55.5


74.6


(19.1

)


78.01


121.82


(36.0

)


115.08


187.77


(38.7

)

24

Royal Palm South Beach Miami


358.06


276.66


29.4


79.2


96.9


(17.7

)


283.45


268.03


5.8


357.46


356.46


0.3


25

DoubleTree Hotel Washington DC – Crystal City


122.89


150.08


(18.1

)


51.1


62.4


(11.3

)


62.84


93.66


(32.9

)


84.40


127.73


(33.9

)

26

DoubleTree Hotel San Jose


147.03


231.69


(36.5

)


45.8


83.4


(37.6

)


67.31


193.12


(65.1

)


100.11


274.48


(63.5

)

27

Juniper Hotel Cupertino, Curio Collection


127.65


272.68


(53.2

)


40.8


79.9


(39.1

)


52.11


217.82


(76.1

)


65.72


257.62


(74.5

)


Sub-total Core Hotels


$

249.29


$

243.58


2.3

%


49.4

%


79.8

%


(30.4

)%

pts


$

123.05


$

194.46


(36.7

)%


$

201.24


$

310.68


(35.2

)%


All Other Hotels


$

164.10


$

158.49


3.5

%


59.2

%


69.7

%


(10.5

)%

pts


$

97.14


$

110.46


(12.1

)%


$

134.27


$

158.92


(15.5

)%


Total Consolidated Portfolio


$

224.42


$

224.27


0.1

%


51.9

%


77.3

%


(25.4

)%

pts


$

116.42


$

173.32


(32.8

)%


$

184.11


$

272.49


(32.4

)%


(1) Calculated based on unrounded numbers.


31 |


img187544587_6.jpg 


Portfolio and Operating Metrics (continued)


Pro-forma Core Hotels: Q1 2022 vs. Q1 2019


(unaudited, dollars in millions)


Pro-forma Hotel Adjusted EBITDA


Pro-forma Hotel Revenue


Pro-forma Hotel Adjusted EBITDA Margin


1Q22


1Q19


Change(1)


1Q22


1Q19


Change(1)


1Q22


1Q19


Change


Core Hotels


1

Hilton Hawaiian Village Waikiki Beach Resort


$

29


$

39


(25.8

)%


$

81


$

100


(18.7

)%


35.4

%


38.8

%


(340

)

bps

2

Hilton Waikoloa Village


13


12


9.5


35


40


(10.4

)


37.8


30.9


690


3

Hilton San Francisco Union Square


(7

)


23


(132.4

)


14


66


(79.3

)


(54.1

)


34.4


(8,850

)


4

Parc 55 San Francisco - a Hilton Hotel


(4

)


10


(143.0

)


28


(99.7

)


(5,732.0

)


35.1


(576,710

)


5

JW Marriott San Francisco Union Square


5


(97.4

)


7


16


(58.6

)


2.1


33.8


(3,170

)


6

Hyatt Centric Fisherman's Wharf


3


(96.8

)


4


9


(55.7

)


2.1


29.7


(2,760

)


7

Signia by Hilton Orlando Bonnet Creek


9


18


(47.3

)


27


42


(35.6

)


34.9


42.7


(780

)


8

Waldorf Astoria Orlando


9


9


8.9


23


23


(1.4

)


40.9


37.0


390


9

Hilton Orlando Lake Buena Vista


6


8


(28.0

)


17


22


(22.3

)


35.1


37.8


(270

)


10

Hilton New Orleans Riverside


10


18


(43.1

)


27


42


(34.3

)


36.6


42.2


(560

)


11

Hyatt Regency Boston


3


(94.0

)


5


10


(47.5

)


3.2


27.8


(2,460

)


12

Hilton Boston Logan Airport


1


2


(63.0

)


9


11


(16.7

)


6.7


15.1


(840

)


13

Boston Marriott Newton


1


(126.7

)


3


6


(54.8

)


(9.2

)


15.5


(2,470

)


14

New York Hilton Midtown


(12

)


(2

)


(444.5

)


23


52


(56.2

)


(50.7

)


(4.1

)


(4,660

)


15

Hilton Santa Barbara Beachfront Resort


4


3


15.3


9


10


(0.3

)


38.5


33.3


520


16

Hyatt Regency Mission Bay Spa and Marina


2


1


22.1


9


9


(5.8

)


19.2


14.8


440


17

Hilton Checkers Los Angeles


1


(74.3

)


2


4


(37.6

)


11.3


27.4


(1,610

)


18

Hilton Chicago


(3

)


(3

)


(8.8

)


11


22


(49.9

)


(31.4

)


(14.5

)


(1,690

)


19

W Chicago - City Center


(1

)


(217.0

)


2


5


(62.5

)


(70.0

)


(8.3

)


(6,170

)


20

W Chicago - Lakeshore


(2

)


(2

)


2.4


2


4


(41.0

)


(105.7

)


(63.9

)


(4,180

)


21

Casa Marina Key West, Curio Collection


13


8


61.5


24


18


38.9


52.9


45.5


740


22

The Reach Key West, Curio Collection


6


3


73.4


11


7


52.8


52.0


45.8


620


23

Hilton Denver City Center


1


4


(72.3

)


6


10


(38.7

)


15.4


34.1


(1,870

)


24

Royal Palm South Beach Miami


6


6


(3.8

)


13


13


0.3


47.3


49.3


(200

)


25

DoubleTree Hotel Washington DC – Crystal City


1


(50.3

)


5


7


(33.9

)


5.6


7.4


(180

)


26

DoubleTree Hotel San Jose


(1

)


4


(117.1

)


5


12


(63.5

)


(14.0

)


29.9


(4,390

)


27

Juniper Hotel Cupertino, Curio Collection


(1

)


2


(128.3

)


1


5


(74.5

)


(42.0

)


37.8


(7,980

)


Sub-total Core Hotels


$

78


$

177


(55.6

)%


$

375


$

593


(36.6

)%


20.6

%


29.4

%


(880

)

bps


All Other Hotels


$

11


$

18


(43.4

)%


$

88


$

102


(15.5

)%


13.5

%


20.1

%


(660

)

bps


Total Consolidated Portfolio


$

89


$

195


(54.3

)%


$

463


$

695


(33.5

)%


19.3

%


28.0

%


(870

)

bps


(1) Calculated based on unrounded numbers.


32 |


img187544587_6.jpg 


Properties Acquired and Sold


img187544587_8.jpg 


Hyatt Regency Boston Caribe Hilton W New Orleans - French Quarter


33 |


img187544587_6.jpg 


Properties Acquired and Sold


Properties Acquired


Hotel


Location


Room Count


2019 Acquisitions:


Chesapeake Lodging Trust Acquisition(1)


Hilton Denver City Center


Denver, CO


613


W Chicago – Lakeshore


Chicago, IL


520


Hyatt Regency Boston


Boston, MA


502


Hyatt Regency Mission Bay Spa and Marina


San Diego, CA


438


Boston Marriott Newton


Newton, MA


430


Le Meridien New Orleans(2)


New Orleans, LA


410


W Chicago – City Center


Chicago, IL


403


Royal Palm South Beach Miami, a Tribute Portfolio Resort


Miami Beach, FL


393


Le Meridien San Francisco(3)


San Francisco, CA


360


JW Marriott San Francisco Union Square


San Francisco, CA


344


Hyatt Centric Fisherman’s Wharf


San Francisco, CA


316


Hotel Indigo San Diego Gaslamp Quarter(4)


San Diego, CA


210


Courtyard Washington Capitol Hill/Navy Yard(4)


Washington, DC


204


Homewood Suites by Hilton Seattle Convention Center Pike Street


Seattle, WA


195


Hilton Checkers Los Angeles


Los Angeles, CA


193


Ace Hotel Downtown Los Angeles(2)


Los Angeles, CA


182


Hotel Adagio, Autograph Collection(5)


San Francisco, CA


171


W New Orleans – French Quarter(6)


New Orleans, LA


97


5,981


(1)         Park’s acquisition by merger of Chesapeake Lodging Trust closed in September 2019 for total consideration of approximately $2.5 billion, including acquisition costs.

(2)         Sold in December 2019.

(3)         Sold in August 2021.

(4)         Sold in June 2021.

(5)         Sold in July 2021.

(6)         Sold in April 2021.


34 |


img187544587_6.jpg 


Properties Acquired and Sold (continued)


Properties Sold


Hotel


Location


Month Sold


Room Count


Gross Proceeds


(in millions)


2018 Sales:


Hilton Rotterdam


Rotterdam, Netherlands


January 2018


254


$

62.2


Embassy Suites Portfolio - 3 Hotels


Domestic US


February 2018


676


95.8


UK Portfolio - 7 Hotels


United Kingdom


February 2018


1,334


188.5


Hilton Durban


Durban, South Africa


February 2018


328


32.5


Hilton Berlin(1)


Berlin, Germany


May 2018


601


140.0


2018 Total (13 Hotels)


3,193


$

519.0


2019 Sales:


Pointe Hilton Squaw Peak Resort


Phoenix, Arizona


February 2019


563


$

51.4


Hilton Nuremberg


Nuremberg, Germany


March 2019


152


17.5


Hilton Atlanta Airport


Atlanta, Georgia


June 2019


507


101.0


Hilton New Orleans Airport(2)


New Orleans, Louisiana


June 2019


317


48.0


Embassy Suites Parsippany(2)


Parsippany, New Jersey


June 2019


274


17.0


Conrad Dublin(3)


Dublin, Ireland


November 2019


192


61.0


Ace Hotel Downtown Los Angeles


Los Angeles, California


December 2019


182


117.0


Le Meridien New Orleans


New Orleans, Louisiana


December 2019


410


84.0


2019 Total (8 Hotels)


2,597


$

496.9


2020 Sales:


Hilton São Paulo Morumbi


São Paulo, Brazil


February 2020


503


$

117.5


Embassy Suites Washington DC Georgetown


Washington, D.C.


February 2020


197


90.4


2020 Total (2 Hotels)


700


$

207.9


2021 Sales:


W New Orleans - French Quarter


New Orleans, Louisiana


April 2021


97


$

24.1


Hotel Indigo San Diego Gaslamp Quarter(2)


San Diego, California


June 2021


210


78.0


Courtyard Washington Capitol Hill/Navy Yard(2)


Washington, District of Columbia


June 2021


204


71.0


Hotel Adagio, Autograph Collection


San Francisco, California


July 2021


171


82.0


Le Meridien San Francisco


San Francisco, California


August 2021


360


221.5


2021 Total (5 Hotels)


1,042


$

476.6


2022 Sales:


Hampton Inn & Suites Memphis – Shady Grove


Memphis, Tennessee


April 2022


131


$

11.5


2022 Total (1 Hotel)


131


$

11.5


Grand Total(4) (29 Hotels)


7,663


$

1,711.9


(1)          The unconsolidated hotel was sold for total gross proceeds of approximately $350 million, of which $140 million represents Park’s pro rata share.

(2)          Hotels were sold as a portfolio in the same transaction.

(3)          The unconsolidated hotel was sold for total gross proceeds of approximately $128 million, of which $61 million represents Park’s pro rata share.

(4)          To date, Park has sold a total of 29 hotels. In addition, in December 2019, Park terminated the ground lease on the Hilton Sheffield Hotel.


35 |


img187544587_6.jpg 


Capital Structure


img187544587_9.jpg 

Debt Summary Casa Marina, a Waldorf Astoria Resort Hilton Orlando Bonnet Creek New York Hilton Midtown

asa Marina, a Waldorf Astoria Resort Hilton Orlando Bonnet Creek New York Hilton Midtown


36 |


img187544587_6.jpg 


Capital Structure


Fixed and Variable Rate Debt


(unaudited, dollars in millions)


Debt


Collateral


Interest Rate


Maturity Date


As of March 31, 2022


Fixed Rate Debt


Mortgage loan


Hilton Denver City Center


4.90%


September 2022(1)


$

58


Mortgage loan


Hilton Checkers Los Angeles


4.11%


March 2023


26


Mortgage loan


W Chicago - City Center


4.25%


August 2023


75


Mortgage loan


Hilton San Francisco Union Square, Parc 55 San Francisco - a Hilton Hotel


4.11%


November 2023


725


Mortgage loan


Hyatt Regency Boston


4.25%


July 2026


134


Mortgage loan


DoubleTree Hotel Spokane City Center


3.62%


July 2026


14


Mortgage loan


Hilton Hawaiian Village Beach Resort


4.20%


November 2026


1,275


Mortgage loan


Hilton Santa Barbara Beachfront Resort


4.17%


December 2026


164


2025 Senior Secured Notes


7.50%


June 2025


650


2028 Senior Secured Notes


5.88%


October 2028


725


2029 Senior Secured Notes


4.88%


May 2029


750


Total Fixed Rate Debt


5.03%(2)


4,596


Variable Rate Debt


Mortgage loan


DoubleTree Hotel Ontario Airport


L + 3.00%(3)


May 2022(3)


30


Revolving credit facility(4)


Unsecured


L + 3.00%


December 2023


2019 Term Facility(4)(5)


Unsecured


L + 2.65%


August 2024


78


Total Variable Rate Debt


3.32%(2)


108


Add: unamortized premium


4


Less: unamortized deferred financing costs and discount


(37

)

Total Debt(6)


5.02%(2)


$

4,671


(1)          The loan matures in August 2042 but is callable by the lender with six months of notice. As of March 31, 2022, Park had not received notice from the lender.

(2)          Calculated on a weighted average basis.

(3) In April 2022, Park's joint venture refinanced the mortgage loan secured by the DoubleTree Hotel Ontario Airport, which extended the maturity date to May 2027 with a fixed interest rate of 5.37%.

(4)          In May 2020, Park amended its credit and term loan facilities to add a LIBOR floor of 25 basis points. As of March 31, 2022, Park had $901 million of available capacity under the Revolver.

(5)          The outstanding balance of the 2019 Term Facility was hedged by an interest rate swap with a fixed interest rate of 1.86% per annum, which matured in April 2022.

(6)          Excludes $225 million of Park’s share of debt of its unconsolidated joint ventures.


37 |


img187544587_6.jpg 


Definitions


img187544587_10.jpg 

Definitions Hilton Orlando Bonnet Creek Hilton Denver City Center W Chicago –City Center


Hilton Orlando Bonnet Creek Hilton Denver City Center W Chicago - City Center


38 |


img187544587_6.jpg 


Definitions


Pro-forma


The Company presents certain data for its consolidated hotels on a pro-forma hotel basis as supplemental information for investors: Pro-forma Hotel Revenues, Pro-forma RevPAR, Pro-forma Total RevPAR, Pro-forma Occupancy, Pro-forma ADR, Pro-forma Adjusted EBITDA, Pro-forma Hotel Adjusted EBITDA and Pro-forma Hotel Adjusted EBITDA Margin and Net debt to Pro-forma Adjusted EBITDA ratio. The Company presents pro-forma hotel results to help the Company and its investors evaluate the ongoing operating performance of its hotels. The Company’s pro-forma metrics exclude results from property dispositions that have occurred through March 31, 2022 and include results from property acquisitions as though such acquisitions occurred on the earliest period presented.


EBITDA, Adjusted EBITDA, Hotel Adjusted EBITDA and Hotel Adjusted EBITDA Margin

Earnings (loss) before interest expense, taxes and depreciation and amortization (“EBITDA”), presented herein, reflects net income (loss) excluding depreciation and amortization, interest income, interest expense, income taxes and interest expense, income tax and depreciation and amortization included in equity in earnings (losses) from investments in affiliates.

Adjusted EBITDA, presented herein, is calculated as EBITDA, as previously defined, further adjusted to exclude:

• Gains or losses on sales of assets for both consolidated and unconsolidated investments;

• Costs associated with hotel acquisitions or dispositions expensed during the period;

• Severance expense;

• Share-based compensation expense;

• Casualty gains or losses;

• Impairment losses; and

• Other items that management believes are not representative of the Company’s current or future operating performance.

Hotel Adjusted EBITDA measures hotel-level results before debt service, depreciation and corporate expenses of the Company’s consolidated hotels, which excludes hotels owned by unconsolidated affiliates, and is a key measure of the Company’s profitability. The Company presents Hotel Adjusted EBITDA to help the Company and its investors evaluate the ongoing operating performance of the Company’s consolidated hotels.

Hotel Adjusted EBITDA margin is calculated as Hotel Adjusted EBITDA divided by total hotel revenue.


39 |


img187544587_6.jpg 


Definitions (continued)


EBITDA, Adjusted EBITDA, Hotel Adjusted EBITDA and Hotel Adjusted EBITDA margin are not recognized terms under United States (“U.S.”) GAAP and should not be considered as alternatives to net income (loss) or other measures of financial performance or liquidity derived in accordance with U.S. GAAP. In addition, the Company’s definitions of EBITDA, Adjusted EBITDA, Hotel Adjusted EBITDA and Hotel Adjusted EBITDA margin may not be comparable to similarly titled measures of other companies.


The Company believes that EBITDA, Adjusted EBITDA, Hotel Adjusted EBITDA and Hotel Adjusted EBITDA margin provide useful information to investors about the Company and its financial condition and results of operations for the following reasons: (i) EBITDA, Adjusted EBITDA, Hotel Adjusted EBITDA and Hotel Adjusted EBITDA margin are among the measures used by the Company’s management team to make day-to-day operating decisions and evaluate its operating performance between periods and between REITs by removing the effect of its capital structure (primarily interest expense) and asset base (primarily depreciation and amortization) from its operating results; and (ii) EBITDA, Adjusted EBITDA, Hotel Adjusted EBITDA and Hotel Adjusted EBITDA margin are frequently used by securities analysts, investors and other interested parties as a common performance measure to compare results or estimate valuations across companies in the industry.

EBITDA, Adjusted EBITDA, Hotel Adjusted EBITDA and Hotel Adjusted EBITDA margin have limitations as analytical tools and should not be considered either in isolation or as a substitute for net income (loss) or other methods of analyzing the Company’s operating performance and results as reported under U.S. GAAP. Because of these limitations, EBITDA, Adjusted EBITDA and Hotel Adjusted EBITDA should not be considered as discretionary cash available to the Company to reinvest in the growth of Park’s business or as measures of cash that will be available to us to meet our obligations.


Nareit FFO attributable to stockholders, Adjusted FFO attributable to stockholders, Nareit FFO per share – Diluted and Adjusted FFO per share – Diluted


Nareit FFO attributable to stockholders and Nareit FFO per diluted share (defined as set forth below) are presented herein as non-GAAP measures of the Company’s performance. The Company calculates funds from (used in) operations (“FFO”) attributable to stockholders for a given operating period in accordance with standards established by the National Association of Real Estate Investment Trusts (“Nareit”), as net income (loss) attributable to stockholders (calculated in accordance with U.S. GAAP), excluding depreciation and amortization, gains or losses on sales of assets, impairment, and the cumulative effect of changes in accounting principles, plus adjustments for unconsolidated joint ventures. Adjustments for unconsolidated joint ventures are calculated to reflect the Company’s pro rata share of the FFO of those entities on the same basis. As noted by Nareit in its December 2018 “Nareit Funds from Operations White Paper – 2018 Restatement,” since real estate values historically have risen or fallen with market conditions, many industry investors have considered presentation of operating results for real estate companies that use historical cost accounting to be insufficient by themselves. For these reasons, Nareit adopted the FFO metric in order to promote an industry-wide measure of REIT operating performance. The Company believes Nareit FFO provides useful information to investors regarding its operating performance and can facilitate comparisons of operating performance between periods and between REITS. The Company’s presentation may not be comparable to FFO reported by other REITs that do not define the terms in accordance with the current Nareit definition, or that interpret the current Nareit definition differently. The Company calculates Nareit FFO per diluted share as Nareit FFO divided by the number of fully diluted shares outstanding during a given operating period.


40 |


img187544587_6.jpg 


Definitions (continued)


The Company also presents Adjusted FFO attributable to stockholders and Adjusted FFO per diluted share when evaluating its performance because management believes that the exclusion of certain additional items described below provides useful supplemental information to investors regarding the Company’s ongoing operating performance. Management historically has made the adjustments detailed below in evaluating its performance and in its annual budget process. Management believes that the presentation of Adjusted FFO provides useful supplemental information that is beneficial to an investor’s complete understanding of operating performance. The Company adjusts Nareit FFO attributable to stockholders for the following items, which may occur in any period, and refers to this measure as Adjusted FFO attributable to stockholders:


• Costs associated with hotel acquisitions or dispositions expensed during the period;

• Severance expense;

• Share-based compensation expense and;

• Other items that management believes are not representative of the Company’s current or future operating performance.


Net Debt

Net debt, presented herein, is a non-GAAP financial measure that the Company uses to evaluate its financial leverage. Net debt is calculated as (i) long-term debt, including current maturities and excluding unamortized deferred financing costs; and (ii) the Company’s share of investments in affiliate debt, excluding unamortized deferred financing costs; reduced by (a) cash and cash equivalents; and (b) restricted cash and cash equivalents.

The Company believes Net debt provides useful information about its indebtedness to investors as it is frequently used by securities analysts, investors and other interested parties to compare the indebtedness of companies. Net debt should not be considered as a substitute to debt presented in accordance with U.S. GAAP. Net debt may not be comparable to a similarly titled measure of other companies.

Net Debt to Adjusted EBITDA Ratio

Net debt to Adjusted EBITDA ratio, presented herein, is a non-GAAP financial measure and is included as it is frequently used by securities analysts, investors and other interested parties to compare the financial condition of companies. Net debt to Adjusted EBITDA ratio should not be considered as an alternative to measures of financial condition derived in accordance with U.S. GAAP and it may not be comparable to a similarly titled measure of other companies.

Occupancy

Occupancy represents the total number of room nights sold divided by the total number of room nights available at a hotel or group of hotels. Room nights available to guests have not been adjusted for suspended or reduced operations at certain of Park’s hotels as a result of COVID-19. Occupancy measures the utilization of the Company’s hotels’ available capacity. Management uses occupancy to gauge demand at a specific hotel or group of hotels in a given period. Occupancy levels also help management determine achievable Average Daily Rate (“ADR”) levels as demand for hotel rooms increases or decreases.


41 |


img187544587_6.jpg 


Definitions (continued)


Average Daily Rate

ADR represents rooms revenue divided by total number of room nights sold in a given period. ADR measures average room price attained by a hotel and ADR trends provide useful information concerning the pricing environment and the nature of the customer base of a hotel or group of hotels. ADR is a commonly used performance measure in the hotel industry, and management uses ADR to assess pricing levels that the Company is able to generate by type of customer, as changes in rates have a more pronounced effect on overall revenues and incremental profitability than changes in occupancy, as described above.

Revenue per Available Room

Revenue per Available Room (“RevPAR”) represents rooms revenue divided by total number of room nights available to guests for a given period. Room nights available to guests have not been adjusted for suspended or reduced operations at certain of Park’s hotels as a result of COVID-19. Management considers RevPAR to be a meaningful indicator of the Company’s performance as it provides a metric correlated to two primary and key factors of operations at a hotel or group of hotels: occupancy and ADR. RevPAR is also a useful indicator in measuring performance over comparable periods.

Total RevPAR

Total RevPAR represents rooms, food and beverage and other hotel revenues divided by the total number of room nights available to guests for a given period. Room nights available to guests have not been adjusted for suspended or reduced operations at certain of Park’s hotels as a result of COVID-19. Management considers Total RevPAR to be a meaningful indicator of the Company’s performance as approximately one-third of revenues are earned from food and beverage and other hotel revenues. Total RevPAR is also a useful indicator in measuring performance over comparable periods.

References to RevPAR, Total RevPAR and ADR are presented on a currency neutral basis (prior periods are reflected using current period exchange rates), unless otherwise noted.


42 |


img187544587_6.jpg 


Analyst Coverage


Analyst

Company

Phone

Email

Dany Asad

Bank of America

(646) 855-5238

[email protected]

Anthony Powell

Barclays

(212) 526-8768

[email protected]

Ari Klein

BMO Capital Markets

(212) 885-4103

[email protected]

Neil Malkin

Capital One Securities

(571) 633-8191

[email protected]

Smedes Rose

Citi Research

(212) 816-6243

[email protected]

Floris Van Dijkum

Compass Point

(646) 757-2621

[email protected]

Chris Woronka

Deutsche Bank

(212) 250-9376

[email protected]

Richard Hightower

Evercore ISI

(212) 752-0886

[email protected]

Stephen Grambling

Goldman Sachs

(212) 902-7832

[email protected]

Christopher Darling

Green Street

(949) 640-8780

[email protected]

David Katz

Jefferies

(212) 323-3355

[email protected]

Joe Greff

JP Morgan

(212) 622-0548

[email protected]

Bill Crow

Raymond James

(727) 567-2594

[email protected]

Rich Anderson

SMBC Nikko Securities

(646) 521-2351

[email protected]

Patrick Scholes

Truist Securities

(212) 319-3915

[email protected]

Robin Farley

UBS

(212) 713-2060

[email protected]

Dori Kesten

Wells Fargo

(617) 603-4262

[email protected]


43 |


img187544587_6.jpg