EXHIBIT 99.1
For Immediate Release: November 10, 2021
Investor Services
888-926-2688
Media Contact:
Diana Keary
949-270-9303
Griffin Realty Trust, Inc.
Third Quarter 2021 Results
El Segundo, Calif. (November 10, 2021) - Griffin Realty Trust, Inc. ("GRT" or the "Company") announced its results for the quarter ended September 30, 2021.
Highlights for the Quarter Ended September 30, 2021
•Total revenue of approximately $120.6 million
•Net income attributable to common stockholders of $0.01 per basic and diluted share
•Adjusted Funds from Operations available to common stockholders and limited partners, or AFFO1, of $0.15 per basic and diluted share
•Collected 100% percent of contractual rent due in the quarter and achieved a 100% rental collections rate for the last two years
•Recorded a quarter end 94.4% occupancy rate
•Signed five new leases totaling 165,000 square feet and three lease renewals totaling 548,000 square feet
Management Commentary
"Despite ongoing COVID impacts, emerging inflationary headwinds and other macro challenges, our high-quality office and industrial portfolio continued to generate consistent performance, which is a testament to the quality of our assets and the exceptional focus of our team,” stated Michael J. Escalante, GRT's Chief Executive Officer. “The portfolio’s 94.4% occupancy rate and our collection of 100% of contractual rent throughout the pandemic demonstrates the portfolio's resilience in the face of these challenges.”
Mr. Escalante continued, “We continue to maintain a strong balance sheet, with leverage at just 41.4% of enterprise value, which provides us with flexibility to navigate the current environment. Going forward, we intend to balance strategic initiatives with opportunities for accretive growth, particularly in the industrial market. While our primary focus will be on industrial properties, we will selectively pursue acquisition opportunities for office properties leased to strong creditworthy tenants that offer attractive risk-adjusted returns. We remain confident that our focus on blue chip tenants and essential assets will continue to provide stability and consistency in performance, and enable us to benefit as we continue to optimize our portfolio."
Results for the Quarter Ended September 30, 2021
Revenue
Total revenue of approximately $120.6 million for the quarter ended September 30, 2021, an increase of $20.6 million compared to the same quarter last year.
The growth was primarily attributable to $23.0 million of rental income in connection with the acquisition of CCIT II; offset by approximately $3.0 million of lower termination income in the current period.
Net Income (Loss)
Net income (loss) attributable to common stockholders was approximately $2.5 million, or $0.01 per basic and diluted share, for the quarter ended September 30, 2021, compared to a net loss attributable to common stockholders of approximately $(8.6) million, or $(0.04) per basic and diluted share, for the quarter ended September 30, 2020.
Adjusted Funds from Operations (AFFO)
AFFO was approximately $55.2 million and $39.7 million, or $0.15 per basic and diluted share, for the quarter ended September 30, 2021 and 2020, respectively.
Adjusted EBITDA
Adjusted EBITDA, as defined per the Company's credit facility agreement, was approximately $77.3 million for the quarter ended September 30, 2021. This resulted in fixed charge and interest coverage ratios of 3.0x and 3.8x, respectively, for the quarter.
Consolidated Financial Statistics
Compared to the last quarter, Net Debt remained consistent at $2.5 billion. The Company's Net Debt to Normalized EBITDAre and our Net Debt plus Preferred to Normalized EBITDAre were 7.3x and 7.6x, respectively. The ratio of Debt, net, less cash and cash equivalents, to total real estate, was 42.8%.
As of September 30, 2021, the Company's weighted average loan maturity was 4.0 years with 70% of the loan balance having a fixed interest rate, including the effect of interest rate swaps. Approximately 40% of the Company's consolidated debt was secured and approximately 60% was unsecured.
Leasing Activity
The Company signed five new leases totaling approximately 165,000 square feet. This activity includes a new lease with York Space Systems at East Village in metro Denver for approximately 138,000 square feet for a ten year term. The Company also signed three renewal leases representing approximately 548,000 square feet, including a long term lease extension with American Express in Phoenix for 300,000 square feet.
Portfolio Overview as of September 30, 2021
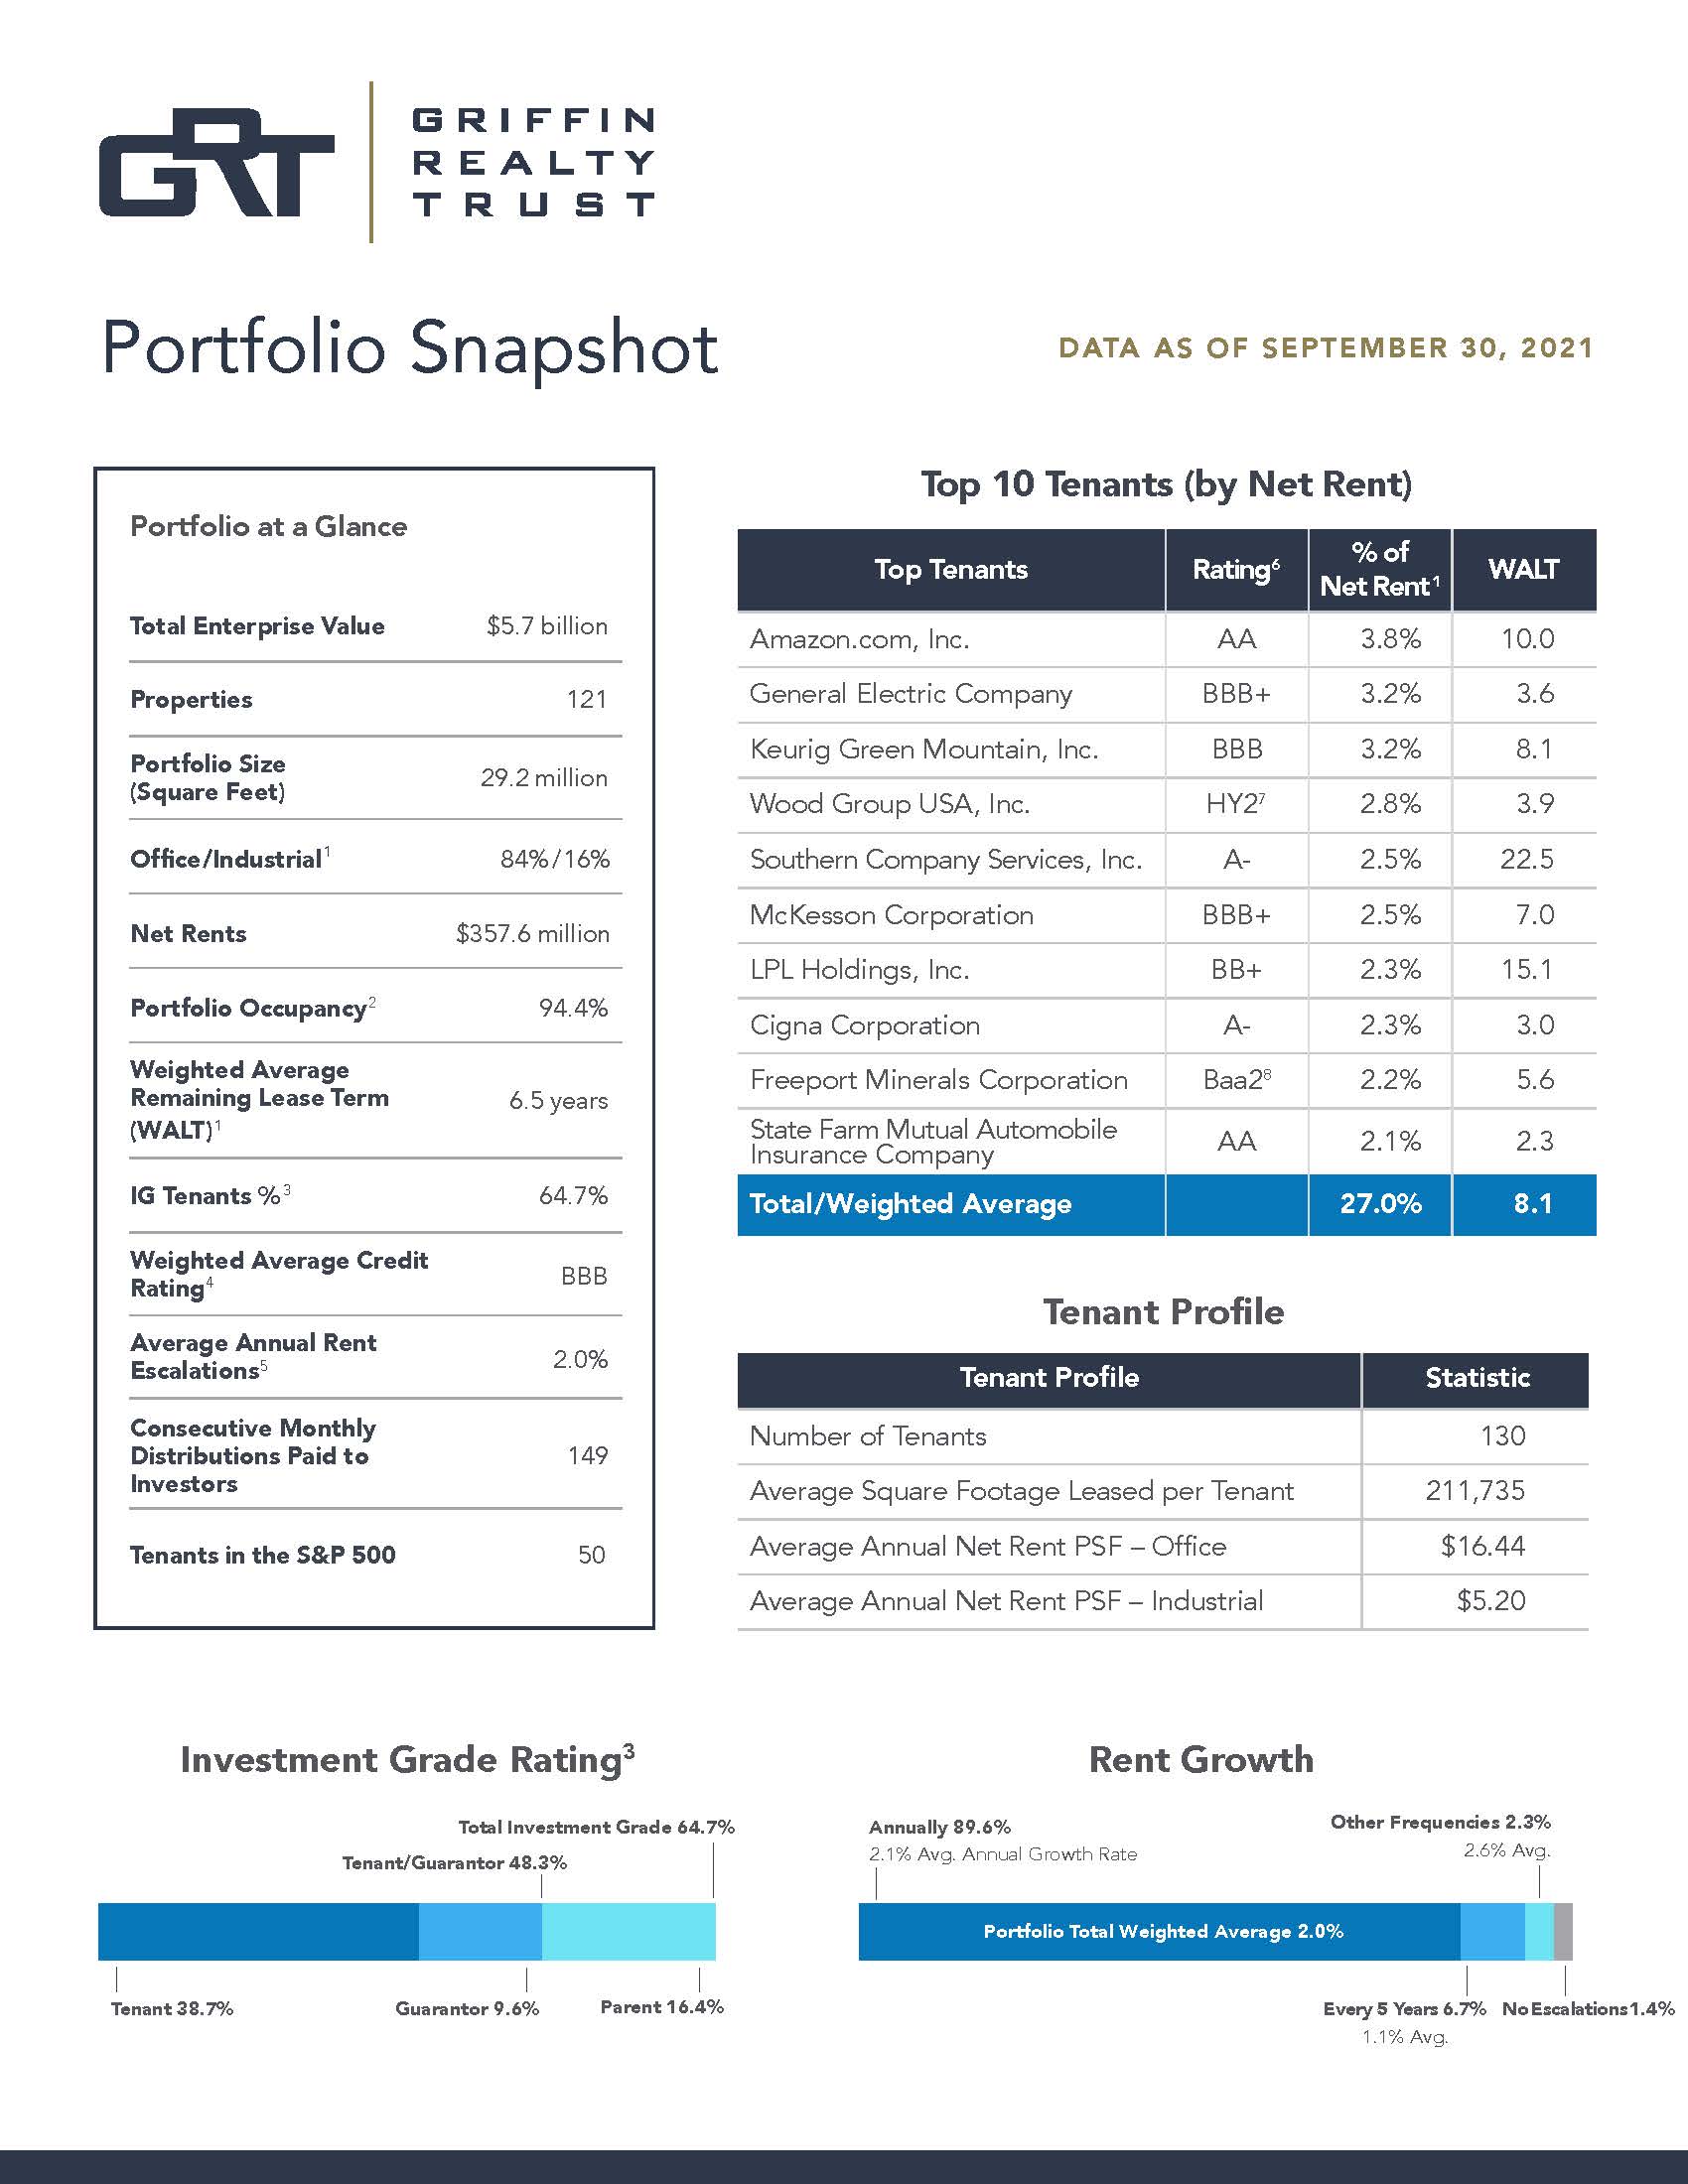
•Enterprise value was approximately $5.7 billion.2
•Weighted average remaining lease term was approximately 6.5 years with approximately 2.0 percent average annual contractual rent growth for the remainder of the existing term for all leases combined.
•The portfolio was 95.1 percent leased.
•The portfolio's economic occupancy was 94.4%. The industrial portfolio was at 100% economic occupancy, and the Company's office portfolio was at 91.1% economic occupancy.
•90% of the Company's net rental revenue is subject to annual escalations that average approximately 2%, and over 98% is subject to periodic increases.
•Approximately 64.7 percent of the portfolio’s net rental revenue3 was generated by properties leased and/or guaranteed, directly or indirectly, by companies that have investment grade credit ratings or what management believes are generally equivalent ratings.4
An overview of GRT's portfolio is provided in the accompanying Portfolio Snapshot.
About Griffin Realty Trust, Inc.
Griffin Realty Trust, Inc. – America's Blue-Chip LandlordTM – is an internally managed, publicly-registered, non-traded REIT. The Company owns and operates a geographically-diversified portfolio of strategically-located, high-quality, corporate office and industrial properties that are primarily net leased to single tenants that the Company has determined to be creditworthy. The Company's portfolio, as of September 30, 2021, consisted of 121 office and industrial properties (144 buildings), totaling 29.1 million in rentable square feet, located in 26 states, representing a total enterprise value of approximately $5.7 billion.
Additional information is available at www.grtreit.com.
Cautionary Statement Regarding Forward-Looking Statements
This press release contains statements that constitute forward-looking statements within the meaning of Section 27A of the Securities Act of 1933, as amended (the “Securities Act”), and Section 21E of the Securities Exchange Act of 1934, as amended (the “Exchange Act”). The Company intends for all such forward-looking statements to be covered by the applicable safe harbor provisions for forward-looking statements contained in Section 27A of the Securities Act and Section 21E of the Exchange Act. Forward-looking statements relate to expectations, beliefs, projections, future plans and strategies, anticipated events or trends and similar expressions concerning matters that are not historical facts. In some cases, you can identify forward-looking statements by the use of forward-looking terminology such as “may,” “will,” “should,” “expects,” “intends,” “plans,” “anticipates,” “believes,” “estimates,” “predicts,” or “potential” or the negative of these words and phrases or similar words or phrases which are predictions of or indicate future events or trends and which do not relate solely to historical matters. You can also identify forward-looking statements by discussions of strategy, plans or intentions. The forward-looking statements contained in this press release reflect the Company's current views about future events and are subject to numerous known and unknown risks, uncertainties, assumptions and changes in circumstances that may cause the Company's actual results to differ significantly from those expressed in any forward-looking statement.
The following factors, among others, could cause actual results and future events to differ materially from those set forth or contemplated in the forward-looking statements: the continued severity, duration, transmission rate and geographic spread of COVID-19 in the United States, the speed of the vaccine roll-out, effectiveness and willingness of people to take COVID-19 vaccines, the duration of associated immunity and their efficacy against emerging variants and mutations of COVID-19, the extent and effectiveness of other containment measures taken, and the response of the overall economy, the financial markets and the population, particularly in areas in which we operate and with respect to occupancy rates, rent deferrals and the financial condition of GRT’s tenants; general financial and economic conditions; statements about the benefits of the merger involving GRT and CCIT II and statements that address operating performance, events or developments that GRT expects or anticipates will occur in the future, including but not limited to statements regarding anticipated synergies and general and administrative expense savings in the merger, future financial and operating results, plans, objectives, expectations and intentions, expected sources of financing, anticipated asset dispositions, anticipated leadership and governance, creation of value for stockholders, benefits of the merger to customers, employees, stockholders and other constituents of the combined company, the integration of GRT and CCIT II, cost savings related to the merger and other non-historical statements; whether the merger will be accretive to AFFO in future quarters; risks related to the disruption of management’s attention from ongoing business operations due to the merger; the availability of suitable investment or disposition opportunities; changes in interest rates; the availability and terms of financing; market conditions; legislative and regulatory changes that could adversely affect the business of GRT; our future capital expenditures, distributions and acquisitions (including the amount and nature thereof), business strategies, the expansion and growth of our operations, our net sales, gross margin, operating expenses, operating income, net income, cash flow, financial condition, impairments, expenditures, capital structure, organizational structure, and other developments and trends of the real estate industry and other factors, including those risks disclosed in Part I, Item 1A. “Risk Factors” and Part II, Item 7. “Management’s Discussion and Analysis of Financial Condition and Results of Operations” of the Company's most recent Annual Report on Form 10-K and Part I, Item 2. “Management’s Discussion and Analysis of Financial Condition and Results of Operations” and Part II, Item 1A. “Risk Factors” of the Company's Quarterly Reports on Form 10-Q filed with the U.S. Securities and Exchange Commission. The Company cautions investors not to place undue reliance on these forward-looking statements and urge you to carefully review the disclosures it makes concerning risks. While forward-looking statements reflect the Company's good faith beliefs, assumptions and expectations, they are not guarantees of future performance. The forward-looking statements speak only as of the date of this press release. Furthermore, the Company disclaims any obligation to publicly update or revise any forward-looking statement to reflect changes in underlying assumptions or factors, of new information, data or methods, future events or other changes.
______________________________
1 FFO, as described by the National Association of Real Estate Investment Trusts ("NAREIT"), is adjusted for redeemable preferred distributions. Additionally, the Company uses AFFO as a non-GAAP financial measure to evaluate its operating performance. FFO and AFFO have been revised to include amounts available to both common stockholders and limited partners for all periods presented.
2 Enterprise value includes the outstanding debt balance (net of cash and cash equivalents) (excluding deferred financing costs and premium/discounts), plus unconsolidated debt - pro rata share, plus preferred equity, plus total outstanding shares multiplied by the NAV per share. Total outstanding shares includes limited partnership units issued and shares issued pursuant to the Company's distribution reinvestment plan, net of redemptions.
3 Net rental revenue is based on (a) the contractual base rental payments assuming the lease requires the tenant to reimburse the Company for certain operating expenses or the property is self-managed by the tenant and the tenant is responsible for all, or substantially all, of the operating expenses; or (b) contractual rent payments less certain operating expenses that are the Company's responsibility for the 12-month period subsequent to September 30, 2021 and includes assumptions that may not be indicative of the actual future performance of a property, including the assumption that the tenant will perform its obligations under its lease agreement during the next 12 months.
4 Approximately 64.7 percent of the portfolio's net rental revenue for the 12-month period subsequent to September 30, 2021 was generated by properties leased and/or guaranteed, directly or indirectly, by companies that have investment grade credit ratings or what management believes are generally equivalent ratings; 59.3 percent generated from companies with a Nationally Recognized Statistical Rating Organization ("NRSRO") credit rating; and the remaining 5.4 percent from companies with a non-NRSRO credit rating that the Company believes is generally equivalent to an NRSRO investment grade rating. Bloomberg’s default risk rating is an example of a non-NRSRO rating.
GRIFFIN REALTY TRUST, INC.
CONSOLIDATED BALANCE SHEETS
(Unaudited; in thousands, except units and share amounts)
| September 30, 2021 | December 31, 2020 | ||||||||||
| ASSETS | |||||||||||
| Cash and cash equivalents | $ | 164,127 | $ | 168,954 | |||||||
| Restricted cash | 20,371 | 34,352 | |||||||||
| Real estate: | |||||||||||
| Land | 584,291 | 445,674 | |||||||||
| Building and improvements | 4,082,595 | 3,112,253 | |||||||||
| Tenant origination and absorption cost | 876,746 | 740,489 | |||||||||
| Construction in progress | 21,517 | 11,886 | |||||||||
| Total real estate | 5,565,149 | 4,310,302 | |||||||||
| Less: accumulated depreciation and amortization | (940,323) | (817,773) | |||||||||
| Total real estate, net | 4,624,826 | 3,492,529 | |||||||||
| Intangible assets, net | 44,475 | 10,035 | |||||||||
| Deferred rent receivable | 109,535 | 98,116 | |||||||||
| Deferred leasing costs, net | 45,795 | 45,966 | |||||||||
| Goodwill | 229,948 | 229,948 | |||||||||
| Due from affiliates | 273 | 1,411 | |||||||||
| Right of use asset | 39,829 | 39,935 | |||||||||
| Other assets | 32,224 | 30,604 | |||||||||
| Total assets | $ | 5,311,403 | $ | 4,151,850 | |||||||
| LIABILITIES AND EQUITY | |||||||||||
| Debt, net | $ | 2,534,003 | $ | 2,140,427 | |||||||
| Restricted reserves | 11,527 | 12,071 | |||||||||
| Interest rate swap liability | 33,803 | 53,975 | |||||||||
| Redemptions payable | 5,331 | 5,345 | |||||||||
| Distributions payable | 12,042 | 9,430 | |||||||||
| Due to affiliates | 2,055 | 3,272 | |||||||||
| Intangible liabilities, net | 32,405 | 27,333 | |||||||||
| Lease liability | 50,809 | 45,646 | |||||||||
| Accrued expenses and other liabilities | 109,579 | 114,434 | |||||||||
| Total liabilities | 2,791,554 | 2,411,933 | |||||||||
| Perpetual convertible preferred shares | 125,000 | 125,000 | |||||||||
| Common stock subject to redemption | — | 2,038 | |||||||||
Noncontrolling interests subject to redemption; 556,099 units as of September 30, 2021 and December 31, 2020 | 4,702 | 4,610 | |||||||||
| Stockholders’ equity: | |||||||||||
Common stock, $0.001 par value; 800,000,000 shares authorized; 324,203,043 and 230,320,668 shares outstanding in the aggregate as of September 30, 2021 and December 31, 2020, respectively | 324 | 230 | |||||||||
| Additional paid-in capital | 2,952,220 | 2,103,028 | |||||||||
| Cumulative distributions | (893,856) | (813,892) | |||||||||
| Accumulated earnings | 140,970 | 140,354 | |||||||||
| Accumulated other comprehensive loss | (29,819) | (48,001) | |||||||||
| Total stockholders’ equity | 2,169,839 | 1,381,719 | |||||||||
| Noncontrolling interests | 220,308 | 226,550 | |||||||||
| Total equity | 2,390,147 | 1,608,269 | |||||||||
| Total liabilities and equity | $ | 5,311,403 | $ | 4,151,850 | |||||||
GRIFFIN REALTY TRUST, INC.
CONSOLIDATED STATEMENTS OF OPERATIONS
(Unaudited; in thousands, except share and per share amounts)
| Three Months Ended September 30, | Nine Months Ended September 30, | ||||||||||||||||||||||
| 2021 | 2020 | 2021 | 2020 | ||||||||||||||||||||
| Revenue: | |||||||||||||||||||||||
| Rental income | $ | 120,568 | $ | 100,002 | $ | 340,747 | $ | 301,157 | |||||||||||||||
| Expenses: | |||||||||||||||||||||||
| Property operating expense | 16,206 | 14,265 | 45,448 | 42,158 | |||||||||||||||||||
| Property tax expense | 10,308 | 9,330 | 29,665 | 28,291 | |||||||||||||||||||
| Property management fees to non-affiliates | 1,017 | 1,032 | 3,015 | 2,780 | |||||||||||||||||||
| General and administrative expenses | 10,462 | 8,207 | 30,129 | 23,280 | |||||||||||||||||||
| Corporate operating expenses to affiliates | 630 | 625 | 1,890 | 1,875 | |||||||||||||||||||
| Impairment provision | — | 9,572 | 4,242 | 22,195 | |||||||||||||||||||
| Depreciation and amortization | 55,269 | 39,918 | 154,716 | 120,947 | |||||||||||||||||||
| Total expenses | 93,892 | 82,949 | 269,105 | 241,526 | |||||||||||||||||||
| Income before other income and (expenses) | 26,676 | 17,053 | 71,642 | 59,631 | |||||||||||||||||||
| Other income (expenses): | |||||||||||||||||||||||
| Interest expense | (21,485) | (20,314) | (63,662) | (59,321) | |||||||||||||||||||
| Other income, net | 16 | 238 | 232 | 3,292 | |||||||||||||||||||
| Gain (Loss) from investment in unconsolidated entities | — | (4,452) | 8 | (6,523) | |||||||||||||||||||
| (Loss) Gain from disposition of assets | — | — | (326) | 4,268 | |||||||||||||||||||
| Net income (loss) | 5,207 | (7,475) | 7,894 | 1,347 | |||||||||||||||||||
| Distributions to redeemable preferred shareholders | (2,464) | (2,255) | (7,182) | (6,349) | |||||||||||||||||||
| Net (income) loss attributable to noncontrolling interests | (241) | 1,166 | 36 | 598 | |||||||||||||||||||
| Net income (loss) attributable to controlling interest | 2,502 | (8,564) | 748 | (4,404) | |||||||||||||||||||
| Distributions to redeemable noncontrolling interests attributable to common stockholders | (45) | (43) | (132) | (165) | |||||||||||||||||||
| Net income (loss) attributable to common stockholders | $ | 2,457 | $ | (8,607) | $ | 616 | $ | (4,569) | |||||||||||||||
| Net income (loss) attributable to common stockholders per share, basic and diluted | $ | 0.01 | $ | (0.04) | $ | — | $ | (0.02) | |||||||||||||||
| Weighted average number of common shares outstanding, basic and diluted | 324,479,039 | 230,159,620 | 304,211,053 | 229,950,613 | |||||||||||||||||||
| Cash distributions declared per common share | $ | 0.09 | $ | 0.09 | $ | 0.26 | $ | 0.32 | |||||||||||||||
GRIFFIN REALTY TRUST, INC.
Funds from Operations and Adjusted Funds from Operations
(Unaudited; in thousands except share and per share amounts)
Funds from Operations and Adjusted Funds from Operations
The Company's management believes that historical cost accounting for real estate assets in accordance with GAAP implicitly assumes that the value of real estate assets diminishes predictably over time. Since real estate values have historically risen or fallen with market conditions, many industry investors and analysts have considered the presentation of operating results for real estate companies that use historical cost accounting to be insufficient.
Management is responsible for managing interest rate, hedge and foreign exchange risks. To achieve the Company's objectives, it may borrow at fixed rates or variable rates. In order to mitigate interest rate risk on certain financial instruments, if any, the Company may enter into interest rate cap agreements or other hedge instruments and in order to mitigate its risk to foreign currency exposure, if any, the Company may enter into foreign currency hedges. The Company view's fair value adjustments of derivatives, impairment charges and gains and losses from dispositions of assets as non-recurring items or items which are unrealized and may not ultimately be realized, and which are not reflective of ongoing operations and are therefore typically adjusted for when assessing operating performance.
In order to provide a more complete understanding of the operating performance of a REIT, the National Association of Real Estate Investment Trusts (“NAREIT”) promulgated a measure known as Funds from Operations (“FFO”). FFO is defined as net income or loss computed in accordance with GAAP, excluding extraordinary items, as defined by GAAP, and gains and losses from sales of depreciable operating property, adding back asset impairment write-downs, plus real estate related depreciation and amortization (excluding amortization of deferred financing costs and depreciation of non-real estate assets), and after adjustment for unconsolidated partnerships, joint ventures and preferred distributions. Because FFO calculations exclude such items as depreciation and amortization of real estate assets and gains and losses from sales of operating real estate assets (which can vary among owners of identical assets in similar conditions based on historical cost accounting and useful-life estimates), they facilitate comparisons of operating performance between periods and between other REITs. As a result, the Company believes that the use of FFO, together with the required GAAP presentations, provides a more complete understanding of the Company's performance relative to its competitors and a more informed and appropriate basis on which to make decisions involving operating, financing, and investing activities. It should be noted, however, that other REITs may not define FFO in accordance with the current NAREIT definition or may interpret the current NAREIT definition differently than the Company does, making comparisons less meaningful.
Additionally, the Company uses Adjusted Funds from Operations (“AFFO”) as a non-GAAP financial measure to evaluate the Company's operating performance. AFFO excludes non-routine and certain non-cash items such as revenues in excess of cash received, amortization of stock-based compensation net, deferred rent, amortization of in-place lease valuation, acquisition-related costs, financed termination fee, net of payments received, gain or loss from the extinguishment of debt, unrealized gains (losses) on derivative instruments, write-off transaction costs and other one-time transactions. FFO and AFFO have been revised to include amounts available to both common stockholders and limits partners for all periods presented.
AFFO is a measure used among the Company's peer group, which includes daily NAV REITs. The Company also believes that AFFO is a recognized measure of sustainable operating performance by the REIT industry. Further, the Company believes AFFO is useful in comparing the sustainability of its operating performance with the sustainability of the operating performance of other real estate companies.
Management believes that AFFO is a beneficial indicator of its ongoing portfolio performance and ability to sustain its current distribution level. More specifically, AFFO isolates the financial results of the Company's operations. AFFO, however, is not considered an appropriate measure of historical earnings as it excludes certain significant costs that are otherwise included in reported earnings. Further, since the measure is based on historical financial information, AFFO for the period presented may not be indicative of future results or the Company's future ability to pay distributions. By providing FFO and AFFO, the Company presents information that assists investors in aligning their analysis with management’s analysis of long-term operating activities.
For all of these reasons, the Company believes the non-GAAP measures of FFO and AFFO, in addition to income (loss) from operations, net income (loss) and cash flows from operating activities, as defined by GAAP, are helpful supplemental performance measures and useful to investors in evaluating the performance of the Company's real estate portfolio. However, a material limitation associated with FFO and AFFO is that they are not indicative of the Company's cash available to
fund distributions since other uses of cash, such as capital expenditures at the Company's properties and principal payments of debt, are not deducted when calculating FFO and AFFO. The use of AFFO as a measure of long-term operating performance on value is also limited if the Company does not continue to operate under its current business plan as noted above. AFFO is useful in assisting management and investors in assessing the Company's ongoing ability to generate cash flow from operations and continue as a going concern in future operating periods, and in particular, after the offering and acquisition stages are complete. However, FFO and AFFO are not useful measures in evaluating NAV because impairments are taken into account in determining NAV but not in determining FFO and AFFO. Therefore, FFO and AFFO should not be viewed as a more prominent measure of performance than income (loss) from operations, net income (loss) or to cash flows from operating activities and each should be reviewed in connection with GAAP measurements.
Neither the SEC, NAREIT, nor any other applicable regulatory body has opined on the acceptability of the adjustments contemplated to adjust FFO in order to calculate AFFO and its use as a non-GAAP performance measure. In the future, the SEC or NAREIT may decide to standardize the allowable exclusions across the REIT industry, and the Company may have to adjust the calculation and characterization of this non-GAAP measure.
Our calculation of FFO and AFFO is presented in the following table for the three and nine months ended September 30, 2021 and 2020 (dollars in thousands, except per share amounts):
| Three Months Ended September 30, | Nine Months Ended September 30, | ||||||||||||||||||||||
| 2021 | 2020 | 2021 | 2020 | ||||||||||||||||||||
| Net income | $ | 5,207 | $ | (7,475) | $ | 7,894 | $ | 1,347 | |||||||||||||||
| Adjustments: | |||||||||||||||||||||||
| Depreciation of building and improvements | 33,074 | 23,759 | 92,353 | 69,957 | |||||||||||||||||||
| Amortization of leasing costs and intangibles | 22,286 | 16,232 | 62,621 | 51,207 | |||||||||||||||||||
| Impairment provision | — | 9,572 | 4,242 | 22,195 | |||||||||||||||||||
| Equity interest of depreciation of building and improvements - unconsolidated entities | — | — | — | 1,438 | |||||||||||||||||||
| Equity interest of amortization of intangible assets - unconsolidated entities | — | — | — | 1,751 | |||||||||||||||||||
| Loss (Gain) from disposition of assets | — | — | 326 | (4,268) | |||||||||||||||||||
| Impairment of unconsolidated entities | — | — | — | 1,906 | |||||||||||||||||||
| Equity interest of gain on sale - unconsolidated entities | — | — | (8) | — | |||||||||||||||||||
| FFO | 60,567 | 42,088 | 167,428 | 145,533 | |||||||||||||||||||
| Distribution to redeemable preferred shareholders | (2,464) | (2,255) | (7,182) | (6,349) | |||||||||||||||||||
| FFO attributable to common stockholders and limited partners | $ | 58,103 | $ | 39,833 | $ | 160,246 | $ | 139,184 | |||||||||||||||
| Reconciliation of FFO to AFFO: | |||||||||||||||||||||||
| FFO attributable to common stockholders and limited partners | $ | 58,103 | $ | 39,833 | $ | 160,246 | $ | 139,184 | |||||||||||||||
| Adjustments: | |||||||||||||||||||||||
| Revenues in excess of cash received, net | (4,876) | (7,001) | (11,419) | (19,441) | |||||||||||||||||||
| Amortization of share-based compensation | 1,888 | 992 | 5,718 | 3,116 | |||||||||||||||||||
| Deferred rent - ground lease | 516 | 516 | 1,548 | 1,548 | |||||||||||||||||||
| Unrealized loss (gain) on investments | 26 | (130) | (10) | (118) | |||||||||||||||||||
| Unconsolidated joint venture valuation adjustment | 4,452 | 4,452 | |||||||||||||||||||||
| Amortization of above/(below) market rent, net | (839) | (525) | (632) | (1,765) | |||||||||||||||||||
| Amortization of debt premium/(discount), net | 103 | 103 | 306 | 309 | |||||||||||||||||||
| Amortization of ground leasehold interests | (91) | (73) | (259) | (217) | |||||||||||||||||||
| Amortization of other intangibles | 377 | — | 876 | — | |||||||||||||||||||
| Non-cash earn-out adjustment | — | — | — | (2,581) | |||||||||||||||||||
| Financed termination fee payments received | — | 1,500 | — | 4,500 | |||||||||||||||||||
| Company's share of revenues in excess of cash received (straight-line rents) - unconsolidated entity | — | — | — | 505 | |||||||||||||||||||
| Company's share of amortization of above market rent - unconsolidated entity | — | — | — | 1,419 | |||||||||||||||||||
| Write-off of transaction costs | 16 | — | 62 | 52 | |||||||||||||||||||
| AFFO available to common stockholders and limited partners | $ | 55,223 | $ | 39,667 | $ | 156,436 | $ | 130,963 | |||||||||||||||
| FFO per share, basic and diluted | $ | 0.16 | $ | 0.15 | $ | 0.48 | $ | 0.53 | |||||||||||||||
| AFFO per share, basic and diluted | $ | 0.15 | $ | 0.15 | $ | 0.47 | $ | 0.50 | |||||||||||||||
| Weighted-average common shares outstanding - basic EPS | 324,479,039 | 230,159,620 | 304,211,053 | 229,950,613 | |||||||||||||||||||
| Weighted-average OP Units | 31,838,890 | 31,905,390 | 31,838,890 | 31,946,600 | |||||||||||||||||||
| Weighted-average common shares and OP Units outstanding - basic and diluted FFO/AFFO | 356,317,929 | 262,065,010 | 336,049,943 | 261,897,213 | |||||||||||||||||||
GRIFFIN REALTY TRUST, INC.
Net Debt as of September 30, 2021
(Unaudited; dollars in thousands)
Net debt is defined as the Company's consolidated debt, net, plus unamortized deferred financing costs and discounts, net, less the Company's unrestricted cash and cash equivalents. Net debt plus Perpetual Convertible Preferred Shares is defined as Net debt plus the Company's perpetual convertible preferred shares. The Company's management believes both of these are useful metrics for analyzing the Company's level of indebtedness as unrestricted cash and cash equivalents could potentially be used to pay down a portion of the Company's outstanding debt.
| Amount | ||||||||
| Debt, net (as reported) | $ | 2,534,003 | ||||||
| Add: unamortized deferred financing costs and discounts, net | 10,054 | |||||||
| Total consolidated debt | 2,544,057 | |||||||
| Less: Cash & cash equivalents - excl. restricted | (164,127) | |||||||
| Net debt | 2,379,930 | |||||||
| Perpetual convertible preferred shares | 125,000 | |||||||
| Net debt plus perpetual convertible preferred shares | $ | 2,504,930 | ||||||
GRIFFIN REALTY TRUST, INC.
Normalized EBITDAre & Adjusted EBITDA
(Unaudited; dollars in thousands)
The Company uses Normalized EBITDAre as a non-GAAP supplemental performance measure to evaluate the operating performance of the Company. Normalized EBITDAre, as defined by the Company, represents EBITDAre (as defined by NAREIT), modified to exclude nonroutine items such as acquisition-related expenses, employee separation expenses and other non-routine costs. Normalized EBITDAre also omits the Normalized EBITDAre impact of properties sold during the period and extrapolates the operations of acquired properties to estimate a full quarter of ownership. Management believes these adjustments to reconcile to Normalized EBITDAre provides investors with supplemental performance information that is consistent with the performance models and analysis used by management, and provides investors a view of the performance of our portfolio over time. Therefore, Normalized EBITDAre should not be considered as an alternative to net income, as computed in accordance with GAAP. Normalized EBITDAre may not be comparable to similarly titled measures of other companies.
Adjusted EBITDA, as defined in the Company's credit facility agreement, is calculated as net income before interest, taxes, depreciation and amortization (EBITDA), plus acquisition fees and expenses, asset and property management fees, straight-line rents and in-place lease amortization for the period, further adjusted for acquisitions that have closed during the quarter and certain reserves for capital expenditures. The Company believes that Adjusted EBITDA is helpful to investors as a supplemental measure of the Company's operating performance as a real estate company because it is a direct measure of the actual operating results of the Company's properties.
| Three Months Ended September 30, | Nine Months Ended September 30, | ||||||||||||||||||||||
| 2021 | 2020 | 2021 | 2020 | ||||||||||||||||||||
| Reconciliation of EBIDTA/EBIDTAre/Normalized EBIDTAre/Adjusted EBIDTA: | |||||||||||||||||||||||
| Reconciliation of Net income (loss) to EBITDAre | |||||||||||||||||||||||
| Net income (loss) | $ | 5,207 | $ | (7,475) | $ | 7,894 | $ | 1,347 | |||||||||||||||
| Depreciation and amortization | 55,269 | 39,918 | 154,716 | 120,947 | |||||||||||||||||||
| Interest expense | 21,485 | 20,314 | 63,662 | 59,321 | |||||||||||||||||||
| EBITDA | 81,961 | 52,757 | 226,272 | 181,615 | |||||||||||||||||||
| Loss/(Gain) on disposition of assets | — | — | 326 | (4,268) | |||||||||||||||||||
| Impairment provision | — | 9,572 | 4,242 | 22,195 | |||||||||||||||||||
| Proportion share of adjustments for unconsolidated entity | — | — | — | 4,629 | |||||||||||||||||||
| Impairment on investment in unconsolidated entity - DRJV | — | 4,453 | — | 6,359 | |||||||||||||||||||
| EBITDAre | 81,961 | 66,782 | 230,840 | 210,530 | |||||||||||||||||||
| Adjustment for acquisitions and dispositions | — | — | 12,378 | (4,833) | |||||||||||||||||||
| Write-off of transaction costs | 16 | — | 62 | 52 | |||||||||||||||||||
| Employee separation expense | — | — | — | — | |||||||||||||||||||
| Normalized EBITDAre | 81,977 | 66,782 | 243,280 | 205,749 | |||||||||||||||||||
| Reconciliation of Normalized EBITDAre to Adjusted EBITDA (per the credit facility) | |||||||||||||||||||||||
| Amortization of deferred financing costs | 807 | 548 | 2,374 | 1,620 | |||||||||||||||||||
| Amortization of debt premium/(discount), net | 103 | 103 | 306 | 309 | |||||||||||||||||||
| Amortization of above/(below) market rent, net | (839) | (525) | (632) | (1,765) | |||||||||||||||||||
| Income taxes | 238 | 540 | 1,090 | 806 | |||||||||||||||||||
| Amortization of Other Intangibles | 377 | — | 876 | — | |||||||||||||||||||
| Property management fees to non-affiliates | 1,017 | 1,032 | 3,015 | 2,781 | |||||||||||||||||||
| Deferred rent | (4,361) | (6,485) | (9,872) | (18,409) | |||||||||||||||||||
| Termination income (cash) | — | 1,500 | — | 4,500 | |||||||||||||||||||
| Equity percentage of net loss for the Parent’s non-wholly owned direct and indirect subsidiaries | — | — | (8) | 165 | |||||||||||||||||||
| Equity percentage of EBITDA for the Parent’s non-wholly owned direct and indirect subsidiaries | — | 3,080 | 20 | 7,909 | |||||||||||||||||||
| Adjustment to interest | (1,063) | (740) | (3,202) | (2,362) | |||||||||||||||||||
| Adjustment for write-off of transaction costs | (16) | — | (62) | (52) | |||||||||||||||||||
| Reversal of adjustment for acquisitions and disposition | — | — | (12,378) | 4,833 | |||||||||||||||||||
| Less: Proportion share adjustments for unconsolidated entities | — | — | — | (4,629) | |||||||||||||||||||
| Less: Capital reserves | (964) | (1,283) | (2,942) | (3,868) | |||||||||||||||||||
| Adjusted EBITDA (per credit facility agreement) | $ | 77,276 | $ | 64,552 | $ | 221,865 | $ | 197,587 | |||||||||||||||