UNITED STATES
SECURITIES AND EXCHANGE COMMISSION
Washington, DC 20549

FORM 8-K

CURRENT REPORT

 Pursuant to Section 13 or 15(d) of the Securities Exchange Act of 1934

Date of report (Date of earliest event reported) 
May 28, 2025


graphic

PHOTRONICS, INC.
(Exact name of registrant as specified in its charter)
 
Connecticut
0-15451
06-0854886
(State or Other Jurisdiction of) Incorporation
(Commission File Number)
(IRS Employer Identification No.)

15 Secor Road, Brookfield, CT

06804
(Address of principal executive offices)

(Zip Code)

Registrant’s Telephone Number, including area code
(203) 775-9000


(Former name or former address, if changed since last report)

Securities registered or to be registered pursuant to Section 12(b) of the Act:


Title of each class

Trading Symbol(s)

Name of each exchange on which registered

COMMON STOCK, $0.01 par value per share

PLAB

NASDAQ Global Select Market

Check the appropriate box below if the Form 8-K filing is intended to simultaneously satisfy the filing obligation of the registrant under any of the following provisions:


Written communications pursuant to Rule 425 under the Securities Act (17 CFR 230.425)

Soliciting material pursuant to Rule 14a-12 under the Exchange Act (17 CFR 240.14a-12)

Pre-commencement communications pursuant to Rule 14d-2(b) under the Exchange Act (17 CFR 240.14d-2(b))

Pre-commencement communications pursuant to Rule 13e-4(c) under the Exchange Act (17 CFR 240.13e-4(c))

Indicate by check mark whether the registrant is an emerging growth company as defined in Rule 405 of the Securities Act of 1933 (§230.405 of this chapter) or Rule 12b-2 of the Securities Exchange Act of 1934 (§240.12b-2 of this chapter).

Emerging growth company

If an emerging growth company, indicate by check mark if the registrant has elected not to use the extended transition period for complying with any new or revised financial accounting standards provided pursuant to Section 13(a) of the Exchange Act. ☐


Item 2.02.
Results of Operations and Financial Condition.
 
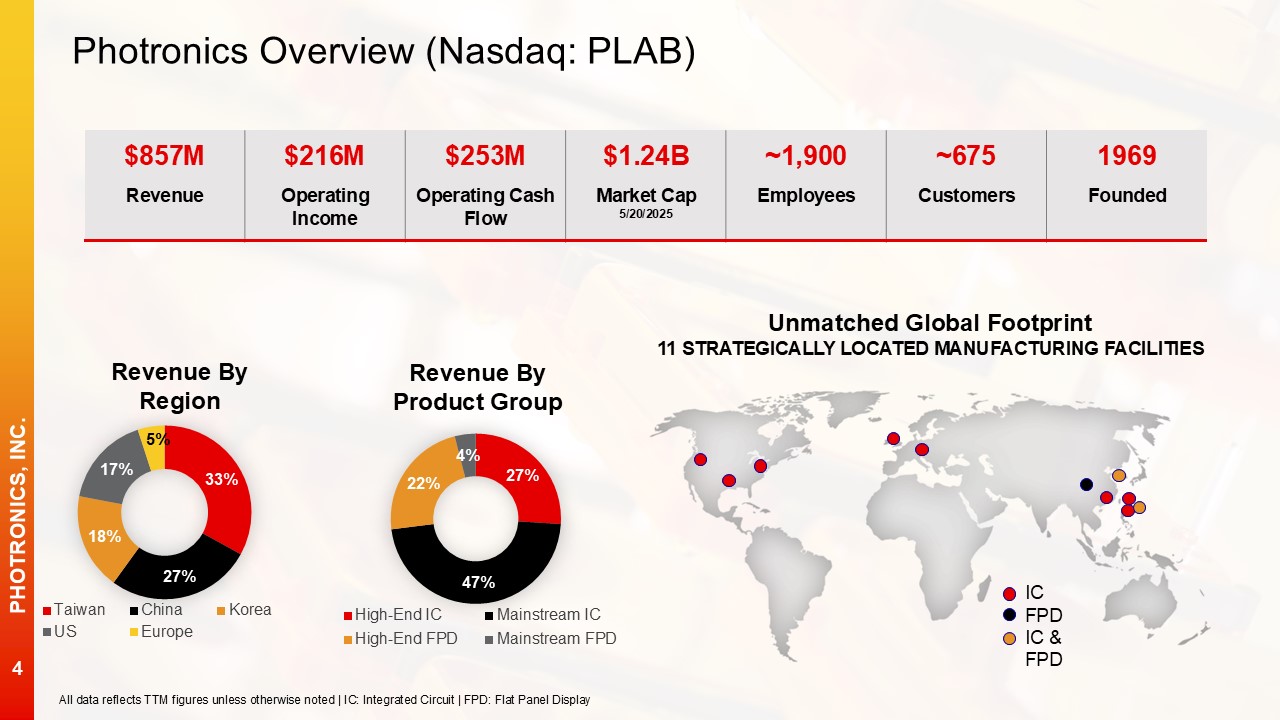
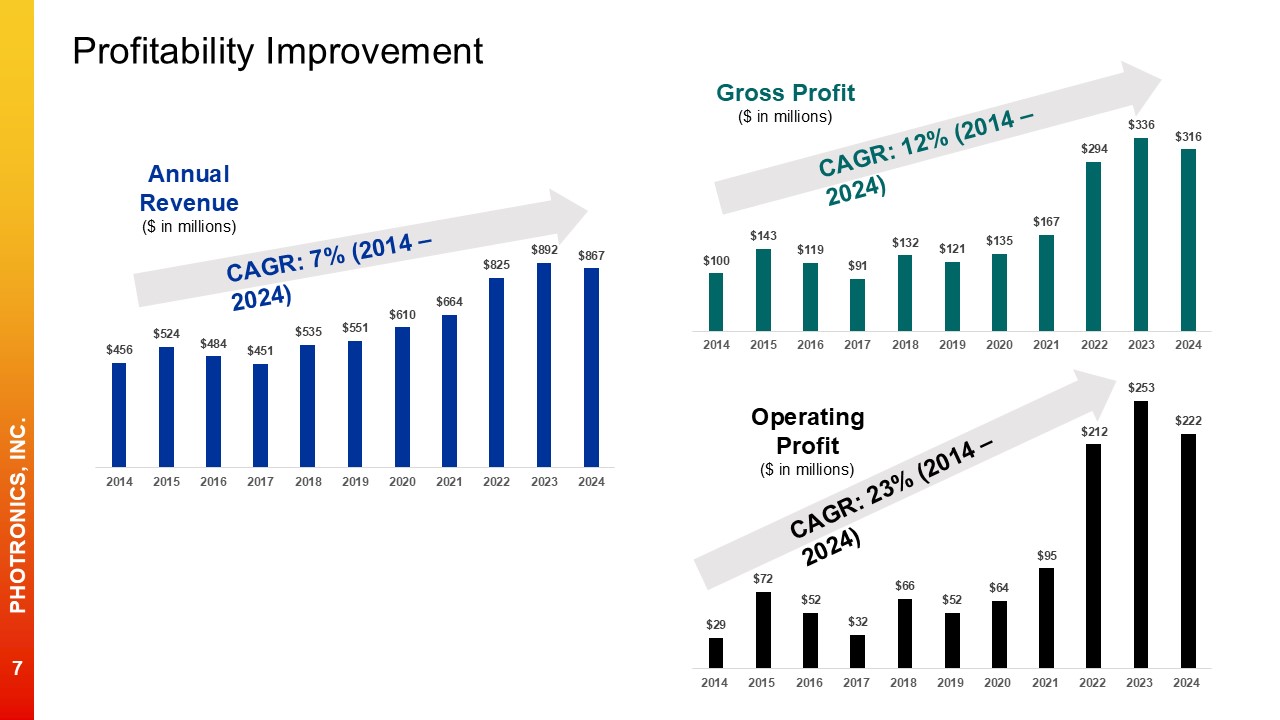
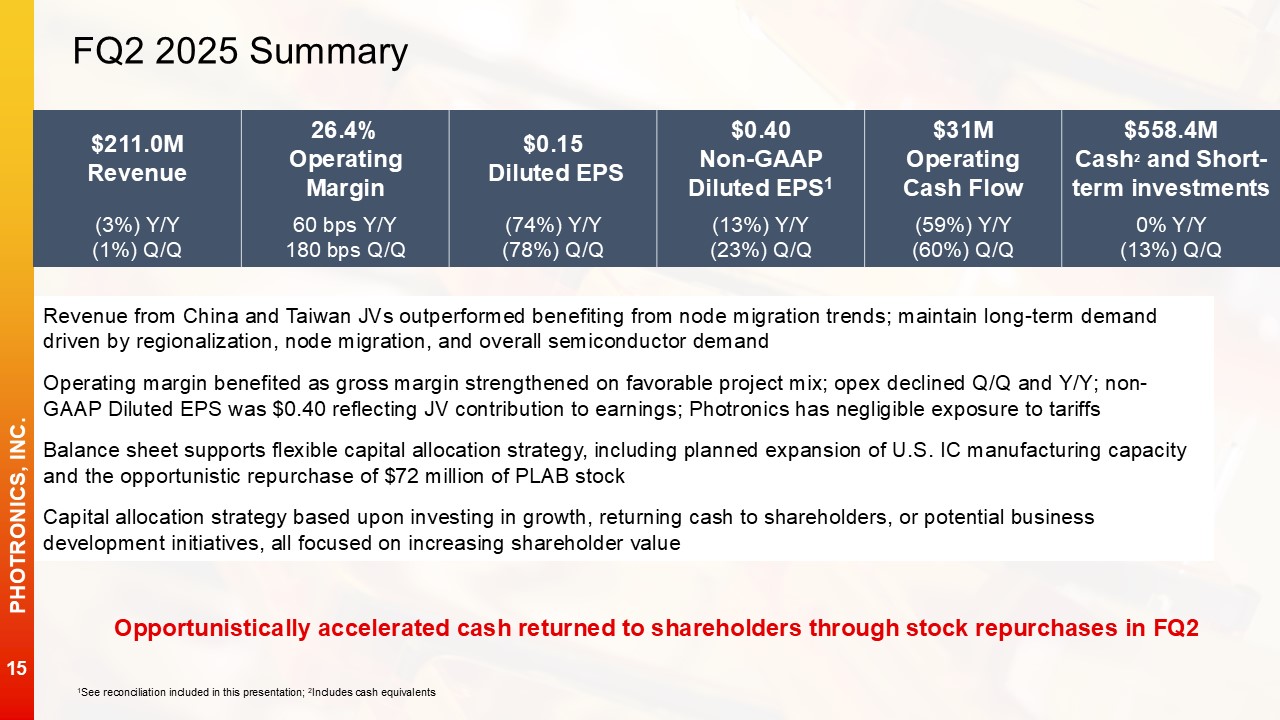
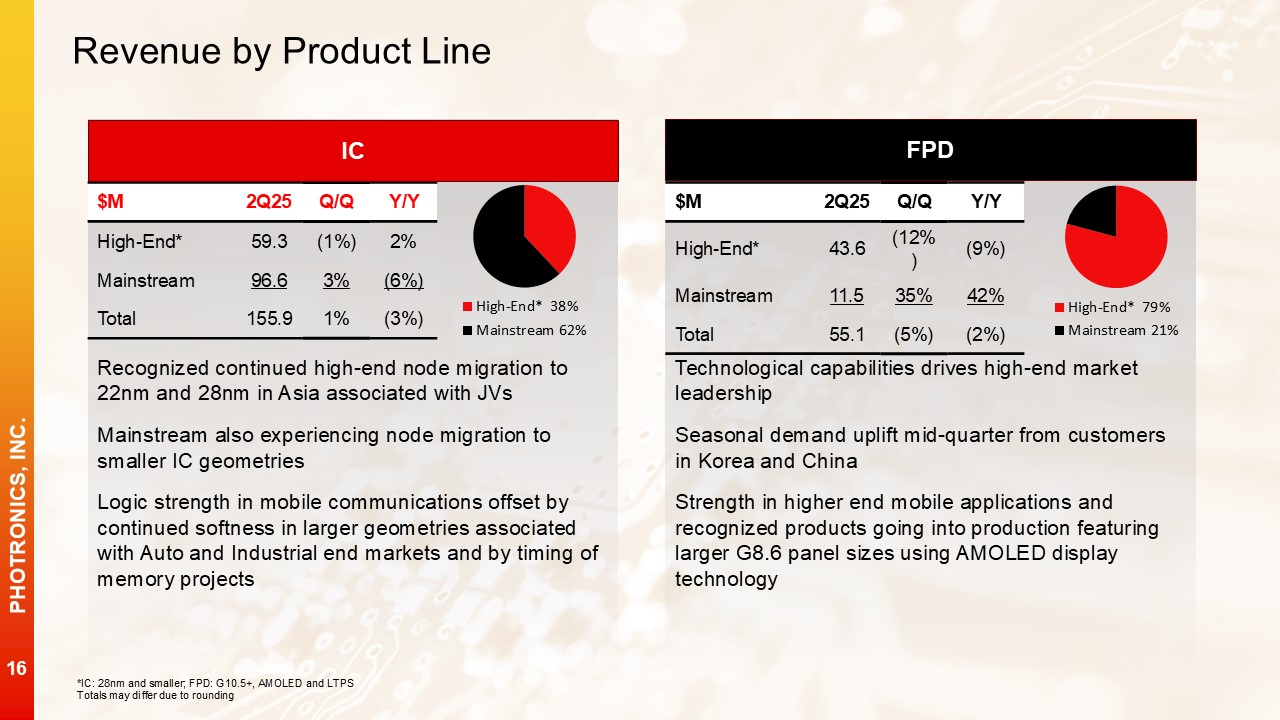
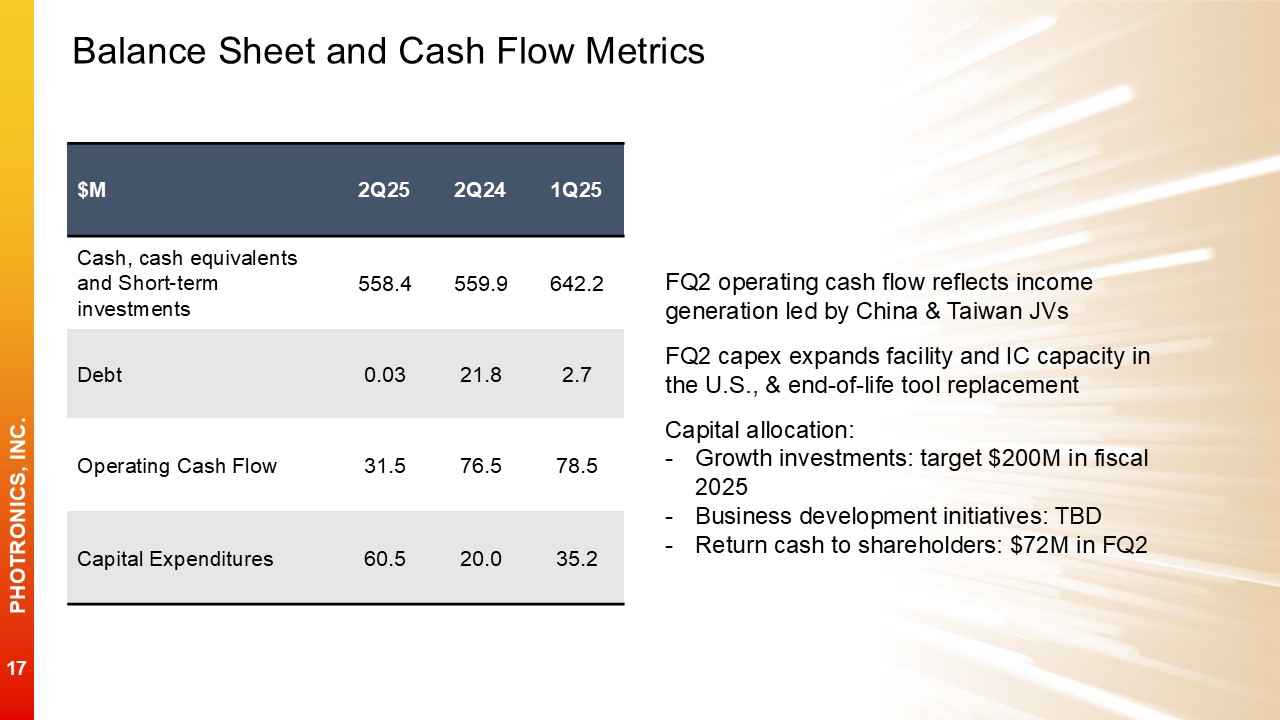
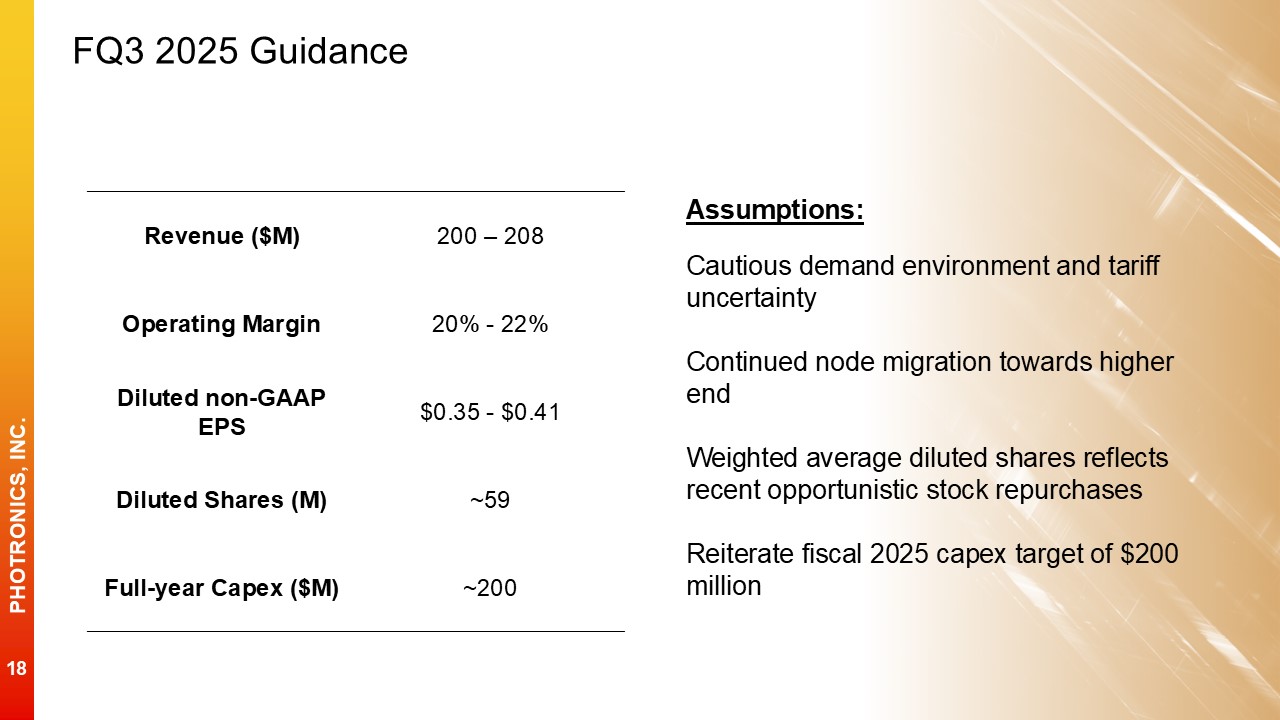
On May 28, 2025, Photronics, Inc. (the “Company”) issued a press release reporting second quarter fiscal 2025 results.

On May 28, 2025, the Company will conduct a conference call with respect to its financial results and other matters during which it will also disclose a slide presentation.

A copy of the press release is furnished as Exhibit 99.1 to this report and a copy of the slide presentation is furnished as Exhibit 99.2 to this report. The information contained in this Item 2.02 and the attached Exhibits 99.1 and 99.2 shall not be deemed “filed” for purposes of Section 18 of the Securities Exchange Act of 1934 and shall not be incorporated by reference in any filing under the Securities Act of 1933 except as shall be expressly set forth by specific reference in such filing.


Item 5.02.
Departure of Directors or Certain Officers; Election of Directors; Appointment of Certain Officers; Compensatory Arrangements of Certain Officers.
 
On May 24, 2025, Dr. Frank Lee informed the Photronics, Inc. Board of Directors of his plans to retire in the next year or two. In order to prepare for this transition, effective with the earnings release on May 28, 2025, Dr. Lee has stepped down from his role as CEO of Photronics, Inc. but will continue to focus on the company’s Asia operations and will remain Chairman and President of the Company's PDMC subsidiary in Taiwan, while also remaining on the Photronics, Inc. Board of Directors. Mr. George Macricostas will simultaneously assume the role of Chief Executive Officer of Photronics, Inc., while remaining Chairman of the Board. Mr. Macricostas has been a member of the Company’s Board of Directors since 2002, and was appointed to the position of Executive Chairman on January 6, 2025.

Mr. Macricostas, age 55, is an investor and entrepreneur. He was a Founder, Chairman and CEO of RagingWire Data Centers, Inc., a provider of mission critical data center colocation facilities, which is where the “Cloud” lives. Mr. Macricostas guided the company through an 80% sale to NTT of Japan in 2014 and completed the sale in 2018. Mr. Macricostas has over 30 years of technical and business management experience in business operations and information technology. From 2006, Mr. Macricostas has served as a director of the Jane Goodall Institute, a non-profit organization. Previously, he was a senior vice president at Photronics, Inc., where he was responsible for all aspects of the company’s IT infrastructure. Mr. Macricostas also serves as a Board Member of the Macricostas Family Foundation, a non-profit organization that funds philanthropic, educational and environmental causes. Mr. Macricostas brings industry, risk management, leadership and business experience to the Board. Mr. Macricostas is the son of Constantine ("Deno") Macricostas, the founder of Photronics, Inc., who also serves on the Photronics, Inc. Board of Directors.

The Company intends to amend its existing Employment Agreement with Mr. Macricostas to reflect his role as Chief Executive Officer on terms to be agreed with the Compensation Committee, which will be the subject of further disclosure upon execution.
 

Item 9.01.
Financial Statements and Exhibits.
 
(d)
 Exhibits
 Press Release dated May 28, 2025.
 Photronics Q2 2025 Financial Results Conference Call May 28, 2025 slides.


SIGNATURES
 
Pursuant to the requirements of the Securities Exchange Act of 1934, the Registrant has duly caused this report to be signed on its behalf by the undersigned hereunto duly authorized.


PHOTRONICS, INC.

(Registrant)


By:
/s/ Christopher J. Lutzo
   
Name:
Christopher J. Lutzo
   
Title:
Vice President,
     
General Counsel and Secretary
       
Date:
May 28, 2025


Exhibit 99.1

For Further Information:
Ted Moreau
VP, Investor Relations
469.395.8175


Photronics Reports Second Quarter Fiscal 2025 Results and Announces CEO Transition

BROOKFIELD, Conn. May 28, 2025 (GLOBE NEWSWIRE) — Photronics, Inc. (NASDAQ:PLAB), a worldwide leader in photomask technologies and solutions, today reported financial results for its second quarter of fiscal year 2025 ended May 4, 2025 and also announced that Dr. Frank Lee has informed Photronics of his plans to retire in the next year or two. In order to prepare for this transition, effective immediately, Dr. Lee has stepped down from his role as CEO of Photronics, but will continue to focus on the company’s Asia operations and will remain Chairman and President of Photronics’ PDMC subsidiary in Taiwan, while also remaining on the Photronics Board of Directors. Mr. George Macricostas will immediately assume the role of Chief Executive Officer of Photronics, Inc. while remaining Chairman of the Board.
 
“I would like to thank Frank for leading Photronics over the past three years as CEO,” said Mr. Macricostas. “For nearly twenty years he led and grew Photronics business in Asia including years of strong execution driving significant, profitable revenue growth. I look forward to working with Frank as he continues to manage the Asia operations until his retirement.”
 
Commenting on the second-quarter performance, Dr. Lee said, “Our business in Asia continued to perform at a strong level and I am extremely proud of what we continue to accomplish. Node migration remains a positive driver of our IC business at both the high end and the higher end of mainstream. Strategically, we took an aggressive approach to return cash to our shareholders during the quarter, repurchasing $72 million of our stock as an endorsement of our long-term business model.”
 
Second Quarter Fiscal 2025 Results


Revenue was $211.0 million, down 3% year-over-year and 1% sequentially.

GAAP Net income attributable to Photronics, Inc. shareholders was $8.9 million, or $0.15 per diluted share, compared with $36.3 million, or $0.58 per diluted share, in the second quarter of 2024 and $42.9 million, or $0.68 per diluted share, in the first quarter of 2025.

Non-GAAP Net income attributable to Photronics, Inc. shareholders was $24.3 million, or $0.40 per diluted share, compared with $28.7 million, or $0.46 per diluted share in the second quarter of 2024 and $32.4 million, or $0.52 per diluted share, in the first quarter of 2025.

IC revenue was $155.9 million, down 3% year-over-year and up 1% sequentially.

FPD revenue was $55.1 million, down 2% from the same quarter last year and 5% sequentially.


Cash generated from operating activities was $31.5 million, cash invested in organic growth through capital expenditures was $60.5 million, and cash returned to shareholders through share repurchases was $72.1 million.

Cash, cash equivalents and short-term investments at the end of the quarter was $558.4 million.
 
Third Quarter Fiscal 2025 Guidance
 
For the third quarter of fiscal 2025, Photronics expects Revenue to be between $200 million and $208 million and non-GAAP Net income attributable to Photronics, Inc. shareholders to be between $0.35 and $0.41 per diluted share.
 
Webcast
 
A webcast to discuss these results is scheduled for 8:30 a.m. Eastern time on May 28, 2025.  The call will be broadcast live and on-demand on the Events and Presentations link on the Photronics website. Analysts and investors who wish to participate in the Q&A portion of the call should click here. It is suggested that participants register fifteen minutes prior to the call's scheduled start time.
 
About Photronics
 
Photronics is a leading worldwide manufacturer of integrated circuit (IC) and flat panel display (FPD) photomasks. High precision quartz plates that contain microscopic images of electronic circuits, photomasks are a key element in the IC and FPD manufacturing process. Founded in 1969, Photronics has been a trusted photomask supplier for over 55 years. The company operates 11 strategically located manufacturing facilities in Asia, Europe, and North America. Additional information on the company can be accessed at www.photronics.com.
 
Forward-Looking Statements
 
Certain statements in this press release constitute “forward-looking statements” regarding our industry, our strategic position, and our financial and operating results.  These forward-looking statements are subject to a number of risks and uncertainties that could cause actual results, performance or achievements to differ materially.  Please refer to our Annual Report on Form 10-K for the fiscal year ended October 31, 2024 and other subsequent filings with the Securities and Exchange Commission. These documents contain and identify important factors that could cause our actual results to differ materially from those contained in these forward-looking statements. Although we believe that the expectations reflected in the forward-looking statements are reasonable, we cannot guarantee future results, levels of activity, performance, or achievements. We are under no duty to update any of the forward-looking statements after the date of this release to conform these statements to actual results.
 
Non-GAAP Financial Measures
 
Non-GAAP Net Income attributable to Photronics, Inc. shareholders and non-GAAP diluted earnings per share are "non-GAAP financial measures" as such term is defined by Regulation G of the Securities and Exchange Commission, and may differ from similarly named non-GAAP financial measures used by other companies. The attached financial supplement reconciles Photronics, Inc. financial results under GAAP to non-GAAP financial information. We believe these non-GAAP financial measures that exclude certain items are useful for analysts and investors to evaluate our on-going performance because they enable a more meaningful comparison of our projected performance with our historical results. These non-GAAP metrics are not a measure of consolidated operating results under U.S. GAAP and should not be considered as an alternative to Net income (loss), Net income (loss) per share, or any other measure of consolidated results under U.S. GAAP. The items excluded from these non-GAAP metrics, but included in the calculation of their closest GAAP equivalent, are significant components of the condensed consolidated statement of income and must be considered in performing a comprehensive assessment of overall financial performance. Please refer to the non-GAAP reconciliations below.
 

PHOTRONICS, INC.
Condensed Consolidated Statements of Income
(in thousands, except per share amounts)
(Unaudited)

   
Three Months Ended
   
Six Months Ended
 
   
May 4,
   
February 2,
   
April 28,
   
May 4,
   
April 28,
 
   
2025
   
2025
   
2024
   
2025
   
2024
 
                               
Revenue
 
$
210,992
   
$
212,138
   
$
217,000
   
$
423,130
   
$
433,334
 
                                         
Cost of goods sold
   
133,086
     
136,603
     
137,749
     
269,689
     
274,828
 
                                         
Gross Profit
   
77,906
     
75,535
     
79,251
     
153,441
     
158,506
 
Gross margin %
   
36.9
%
   
35.6
%
   
36.5
%
   
36.3
%
   
36.6
%
                                         
Operating Expenses:
                                       
                                         
Selling, general and administrative
   
18,099
     
19,101
     
18,996
     
37,201
     
37,317
 
                                         
Research and development
   
4,090
     
4,257
     
4,292
     
8,346
     
7,736
 
                                         
Total Operating Expenses
   
22,189
     
23,358
     
23,288
     
45,547
     
45,053
 
                                         
Other operating gain
   
-
     
-
     
89
     
-
     
89
 
                                         
Operating Income
   
55,717
     
52,177
     
56,052
     
107,894
     
113,542
 
Operating Margin
   
26.4
%
   
24.6
%
   
25.8
%
   
25.5
%
   
26.2
%
                                         
Non-operating (loss) income, net
   
(25,786
)
   
24,981
     
20,534
     
(805
)
   
16,786
 
                                         
Income Before Income Tax Provision
   
29,931
     
77,158
     
76,586
     
107,089
     
130,328
 
                                         
Income tax provision
   
5,714
     
18,901
     
20,214
     
24,615
     
34,874
 
                                         
Net Income
   
24,217
     
58,257
     
56,372
     
82,474
     
95,454
 
                                         
Net income attributable to noncontrolling interests
   
15,356
     
15,406
     
20,121
     
30,762
     
33,023
 
                                         
Net income attributable to Photronics, Inc. shareholders
 
$
8,861
   
$
42,851
   
$
36,251
   
$
51,712
   
$
62,431
 
                                         
Earnings per share attributed to Photronics, Inc. shareholders:
                                       
                                         
Basic
 
$
0.15
   
$
0.69
   
$
0.59
   
$
0.84
   
$
1.01
 
                                         
Diluted
 
$
0.15
   
$
0.68
   
$
0.58
   
$
0.84
   
$
1.00
 
                                         
Weighted-average number of common shares outstanding:
                                       
                                         
Basic
   
60,793
     
62,093
     
61,771
     
61,443
     
61,613
 
                                         
Diluted
   
60,974
     
62,661
     
62,409
     
61,817
     
62,346


PHOTRONICS, INC.
Condensed Consolidated Balance Sheets
(in thousands)
(Unaudited)

   
May 4,
   
October 31,
 
   
2025
   
2024
 
Assets
           
             
Current assets:
           
Cash and cash equivalents
 
$
530,708
   
$
598,485
 
Short-term investments
   
27,699
     
42,184
 
Accounts receivable
   
195,977
     
200,830
 
Inventories
   
61,201
     
56,527
 
Other current assets
   
40,221
     
33,036
 
                 
Total current assets
   
855,806
     
931,062
 
                 
Property, plant and equipment, net
   
807,558
     
745,257
 
Other assets
   
39,668
     
35,740
 
                 
Total assets
 
$
1,703,032
   
$
1,712,059
 
                 
Liabilities and Equity
               
                 
Current liabilities:
               
Current portion of long-term debt
 
$
11
   
$
17,972
 
Accounts payable and accrued liabilities
   
166,772
     
165,839
 
                 
Total current liabilities
   
166,783
     
183,811
 
                 
Long-term debt
   
19
     
25
 
Other liabilities
   
39,461
     
47,464
 
                 
Equity:
               
Photronics, Inc. shareholders' equity
   
1,100,920
     
1,120,864
 
Noncontrolling interests
   
395,849
     
359,895
 
Total equity
   
1,496,769
     
1,480,759
 
                 
Total liabilities and equity
 
$
1,703,032
   
$
1,712,059


PHOTRONICS, INC.
 Condensed Consolidated Statements of Cash Flows
 (in thousands)
(Unaudited)

   
Six Months Ended
 
   
May 4,
   
April 28,
 
   
2025
   
2024
 
             
Cash flows from operating activities:
           
Net income
 
$
82,474
   
$
95,454
 
Adjustments to reconcile net income to net cash provided by operating activities:
               
Depreciation and amortization
   
40,386
     
41,487
 
Share-based compensation
   
6,710
     
6,499
 
Changes in operating assets, liabilities and other
   
(19,651
)
   
(25,446
)
                 
Net cash provided by operating activities
   
109,919
     
117,994
 
                 
Cash flows from investing activities:
               
Purchases of property, plant and equipment
   
(95,749
)
   
(63,311
)
Purchases of short-term investments
   
(27,689
)
   
(66,040
)
Proceeds from maturities of short-term investments
   
41,482
     
13,234
 
Government incentives
   
1,166
     
1,419
 
Other
   
(57
)
   
(6
)
                 
Net cash used in investing activities
   
(80,847
)
   
(114,704
)
                 
Cash flows from financing activities:
               
Repayments of debt
   
(17,966
)
   
(2,844
)
Common stock repurchases
   
(76,682
)
   
-
 
Proceeds from share-based arrangements
   
1,583
     
1,055
 
Net settlements of restricted stock awards
   
(2,007
)
   
(2,938
)
                 
Net cash used in financing activities
   
(95,072
)
   
(4,727
)
                 
Effects of exchange rate changes on cash, cash equivalents, and restricted cash
   
(1,697
)
   
(3,839
)
                 
Net decrease in cash, cash equivalents, and restricted cash
   
(67,697
)
   
(5,276
)
Cash, cash equivalents, and restricted cash, beginning of period
   
601,243
     
501,867
 
                 
Cash, cash equivalents, and restricted cash, end of period
 
$
533,546
   
$
496,591


PHOTRONICS, INC.
Reconciliation of GAAP Net income and Earnings per Share attributable to Photronics, Inc. shareholders to Non-GAAP Net income and Earnings per Share attributable to Photronics, Inc. shareholders
(in thousands, except per share amounts)
(Unaudited)

   
Three Months ended
 
   
May 4,
   
February 2,
   
April 28,
 
   
2025
   
2025
   
2024


GAAP Net income attributable to Photronics, Inc. shareholders
 
$
8,861
   
$
42,851
   
$
36,251
 
FX (gain) loss
   
31,111
     
(18,443
)
   
(14,766
)
Estimated tax effects of FX (gain) loss
   
(8,337
)
   
5,152
     
3,743
 
Estimated noncontrolling interest effects of above
   
(7,376
)
   
2,823
     
3,489
 
Non-GAAP Net income attributable to Photronics, Inc. shareholders
 
$
24,259
   
$
32,383
   
$
28,717
 
                         
Weighted-average number of common shares outstanding - Diluted
   
60,974
     
62,661
     
62,409


GAAP Diluted earnings per share attributable to Photronics, Inc. shareholders
 
$
0.15
   
$
0.68
   
$
0.58
 
Effects of non-GAAP adjustments above
   
0.25
     
(0.16
)
   
(0.12
)
Non-GAAP Diluted earnings per share attributable to Photronics, Inc. shareholders
 
$
0.40
   
$
0.52
   
$
0.46


Exhibit 99.2

 May 2025  Investor Presentation 
 

 Safe Harbor Statement  This presentation and some of our comments during this presentation may contain projections or other forward-looking statements regarding future events, our future financial performance, and/or the future performance of the industry. These statements are predictions and contain risks and uncertainties. We refer you to the risk factors in our Annual Report on Form 10-K for the fiscal year ended October 31, 2024 and other subsequent filings with the Securities and Exchange Commission. These documents contain and identify important factors that could cause the actual results for the Company to differ materially from those contained in our projections or forward-looking statements. Although we believe that the expectations reflected in the forward-looking statements are reasonable, we cannot guarantee the accuracy of any forecasts or estimates, and we are not obligated to update any forward-looking statements if our expectations change. 
 

 Corporate Overview 
 

 Photronics Overview (Nasdaq: PLAB)  All data reflects TTM figures unless otherwise noted | IC: Integrated Circuit | FPD: Flat Panel Display  Revenue By Product Group  Revenue By Region  Unmatched Global Footprint  11 STRATEGICALLY LOCATED MANUFACTURING FACILITIES  IC  FPD  IC & FPD  $857M  $216M  $253M  $1.24B  ~1,900  ~675  1969  Revenue  Operating Income  Operating Cash Flow  Market Cap  5/20/2025  Employees  Customers  Founded 
 

 Photomasks: Critical Enabler for IC and FPD Manufacturing  Photomasks carry design information into an exposure system where light transfers the pattern to the wafer  Integrated Circuit (IC) photomasks are used to transfer circuit patterns onto semiconductor wafers during the fabrication of integrated circuits.  Flat Panel Display (FPD) photomasks are used in the fabrication of flat screen televisions, PC monitors, tablets, mobile devices and other flat panel displays. 
 

 Historical Phases of Photronics Revenue Growth  Phase I: 1969 – 1986  Technology Startup  Organic Growth  U.S. Concentration  Pre-IPO  Phase II: 1986 – 2002  M&A Growth  Merchant Consolidation  Global Expansion  Phase IV: 2018 and Beyond  Leverage China 1st Mover Advantage  Long-Term Purchase Agreements  Extend Technology Leadership  Increase Market Share  Strategic Capital Allocation  Phase III: 2003 – 2017  Enter High-End Market  Form Strategic Partnerships  Invest in High-End Capability  Establish FPD Presence  Improve Balance Sheet  A  B  C  D  A  G7.5 Display Substrate  B  High-End IC Memory  C  High-End IC Logic  D  G10.5+ Display Substrate  AMOLED Mobile  “Made In China 2025”  Technology inflections catalyze Future Demand: 
 

 Profitability Improvement  CAGR: 7% (2014 – 2024)  CAGR: 12% (2014 – 2024)  Gross Profit  ($ in millions)  Annual Revenue  ($ in millions)  Operating Profit  ($ in millions)  CAGR: 23% (2014 – 2024) 
 

 Compelling Investment Thesis  Industry expansion driving design activity across all nodes  Broad technology suite and geographicpresence has led to trusted supplier status  Deliver operational excellence through premier quality and rapid response times  Delivers sustainable cash flow for capital allocation flexibility  Close proximity supports response time advantages  Competitive advantage in an industry with high barriers to entry  GLOBAL LEADER in the merchant photomask industry  OPERATONAL EXECUTIONdriven by a culture ofsustainable performance  GEOGRAPHIC FOOTPRINTsupports customer regionalization expansion  Merchant market leader for higher end designs that require additional layers  Advanced displays leverage IC capabilities and leading mask technologies  NODE MIGRATIONenabled by technological advantages 
 

 Core Competencies Serve as Competitive Advantages  Global Footprint  Close to customer  Aligned with end markets  Flexible supply chain  Technology Leader  Process expertise  Advanced Process-of-Record  High barriers to entry  Commercial Excellence  Customer first  Trusted partner  Wafer yield enhancement  Technology roadmap enabler  Operational Excellence  Responsive delivery  High yields  Cost control  Supply chain optimization  Teamwork and execution 
 

 Semiconductor: design activity is leading driver of mask demand  Continued semiconductor industry growth and differentiation of semiconductor designs  Reshoring to the U.S. and regional diversification of semiconductor production throughout the world  Captives outsourcing trailing edge nodes as they focus on leading edge semiconductor innovation such as EUV  Display: advanced displays driving innovation  Global panel makers innovating to win market share  Growing panel competition drives innovation and greater mask value  Larger AMOLED G8.6 form factor substrates has entered manufacturing, requiring high-quality, advanced photomasks  Long-Term Trends Driving Photomask Demand 
 

 Supply Chain Regionalization Driving Global Semiconductor Investments  Concerns around national security and supply chain reliability are driving regional investments in semiconductor manufacturing  Semiconductor fabs are capitalizing on government incentives to build capacity in US, Europe, and Asia  Regionalization creates additional semiconductor production, increasing global demand for photomasks  Photronics has operations in 4 of the top 5 countries for semiconductor manufacturing and is expanding capacity in the United States  Our IC Manufacturing Footprint Aligns with Global Semiconductor Production  PLAB IC Locations  Top 5 Semiconductor Countries:  Taiwan, South Korea, Japan, China, US  Photronics Broad Geographic Presence Well Positioned for Regionalization Trend 
 

 Advanced Displays are Driving Innovation   Photronics Technological Leadership Enables Customers Innovation and Design Complexity  AMOLED displays increasingly being utilized in mobile displays, including smartphones, tablets, and PCs  Emerging panel makers releasing new AMOLED displays to gain market share against established incumbents  Panel makers incorporating additional functionality into displays (e.g., biometric sensors), increasing value and complexity of mask set  New form factors (e.g., flexible or rollable displays) requiring introduction of AMOLED technology  Panel makers are developing AMOLED production process to increase substrate size to G8.6, requiring larger, high-quality advanced masks 
 

 Strategic Investment Strategy Sustains Profitable Growth  13  Proven Approach to Profitably Grow Revenue, Capture Market Share, and Improve ROIC  Win market share in growing IC and FPD markets  Leverage global footprint to benefit from IC regionalization trends  Capitalize on FPD technology leadership to continue improving mix  Enter long-term purchase agreements and earn process-of-record  Improved pricing environment in high-end and mainstream IC   Dynamically align asset tool set to match end-market demand  Increasing benefit from operating leverage  GROW REVENUE IN EXCESS OF MARKET  OPERATIONAL LEVERAGE IMPROVES PROFITABILITY  Operational Excellence  Commercial Excellence  Technology Leader  Global Footprint  WINNING THROUGH COMPETITIVE ADVANTAGES  Organic growth through high-return targeted capacity expansionEnter LTPAs to mitigate investment risk and quickly ramp revenues  STRATEGIC APPROACH TO CAPITAL INVESTMENTS 
 

 Fiscal Q2 2025 Financial Results  May 28, 2025 
 

 FQ2 2025 Summary  Opportunistically accelerated cash returned to shareholders through stock repurchases in FQ2  $211.0M  Revenue  26.4%  Operating Margin  $0.15   Diluted EPS  $0.40  Non-GAAP Diluted EPS1  $31M  Operating Cash Flow  $558.4M  Cash2 and Short-term investments  (3%) Y/Y  (1%) Q/Q  60 bps Y/Y  180 bps Q/Q  (74%) Y/Y  (78%) Q/Q  (13%) Y/Y  (23%) Q/Q  (59%) Y/Y  (60%) Q/Q  0% Y/Y  (13%) Q/Q  Revenue from China and Taiwan JVs outperformed benefiting from node migration trends; maintain long-term demand driven by regionalization, node migration, and overall semiconductor demand  Operating margin benefited as gross margin strengthened on favorable project mix; opex declined Q/Q and Y/Y; non-GAAP Diluted EPS was $0.40 reflecting JV contribution to earnings; Photronics has negligible exposure to tariffs  Balance sheet supports flexible capital allocation strategy, including planned expansion of U.S. IC manufacturing capacity and the opportunistic repurchase of $72 million of PLAB stock  Capital allocation strategy based upon investing in growth, returning cash to shareholders, or potential business development initiatives, all focused on increasing shareholder value  1See reconciliation included in this presentation; 2Includes cash equivalents 
 

 Revenue by Product Line  $M  2Q25  Q/Q  Y/Y  High-End*  59.3  (1%)  2%  Mainstream  96.6  3%  (6%)  Total  155.9  1%  (3%)  Recognized continued high-end node migration to 22nm and 28nm in Asia associated with JVs   Mainstream also experiencing node migration to smaller IC geometries  Logic strength in mobile communications offset by continued softness in larger geometries associated with Auto and Industrial end markets and by timing of memory projects  *IC: 28nm and smaller; FPD: G10.5+, AMOLED and LTPS   Totals may differ due to rounding  Technological capabilities drives high-end market leadership  Seasonal demand uplift mid-quarter from customers in Korea and China  Strength in higher end mobile applications and recognized products going into production featuring larger G8.6 panel sizes using AMOLED display technology  $M  2Q25  Q/Q  Y/Y  High-End*  43.6  (12%)  (9%)  Mainstream  11.5  35%  42%  Total  55.1  (5%)  (2%)  IC  FPD 
 

 Balance Sheet and Cash Flow Metrics  $M  2Q25  2Q24  1Q25  Cash, cash equivalents and Short-term investments  558.4  559.9  642.2  Debt  0.03  21.8  2.7  Operating Cash Flow  31.5  76.5  78.5  Capital Expenditures  60.5  20.0  35.2  FQ2 operating cash flow reflects income generation led by China & Taiwan JVs  FQ2 capex expands facility and IC capacity in the U.S., & end-of-life tool replacement  Capital allocation:  Growth investments: target $200M in fiscal 2025  Business development initiatives: TBD  Return cash to shareholders: $72M in FQ2 
 

 FQ3 2025 Guidance   Revenue ($M)  200 – 208  Operating Margin  20% - 22%  Diluted non-GAAP EPS  $0.35 - $0.41  Diluted Shares (M)  ~59  Full-year Capex ($M)  ~200  Assumptions:  Cautious demand environment and tariff uncertainty  Continued node migration towards higher end  Weighted average diluted shares reflects recent opportunistic stock repurchases  Reiterate fiscal 2025 capex target of $200 million 
 

 Appendix 
 

 Non-GAAP Financial Measures  Non-GAAP Net Income attributable to Photronics, Inc. shareholders and non-GAAP diluted earnings per share attributable to Photronics, Inc. shareholders are "non-GAAP financial measures" as such term is defined by Regulation G of the Securities and Exchange Commission, and may differ from similarly named non-GAAP financial measures used by other companies. The attached financial supplement reconciles Photronics, Inc. financial results under GAAP to non-GAAP financial information. We believe these non-GAAP financial measures that exclude certain items are useful for analysts and investors to evaluate our on-going performance because they enable a more meaningful comparison of our projected performance with our historical results. These non-GAAP metrics are not a measure of consolidated operating results under U.S. GAAP and should not be considered as an alternative to Net income (loss), Net income (loss) per share, or any other measure of consolidated results under U.S. GAAP. The items excluded from these non-GAAP metrics, but included in the calculation of their closest GAAP equivalent, are significant components of the condensed consolidated statement of income and must be considered in performing a comprehensive assessment of overall financial performance. Please refer to the non-GAAP reconciliations on the following page.  
 

 Non-GAAP Financial Measures