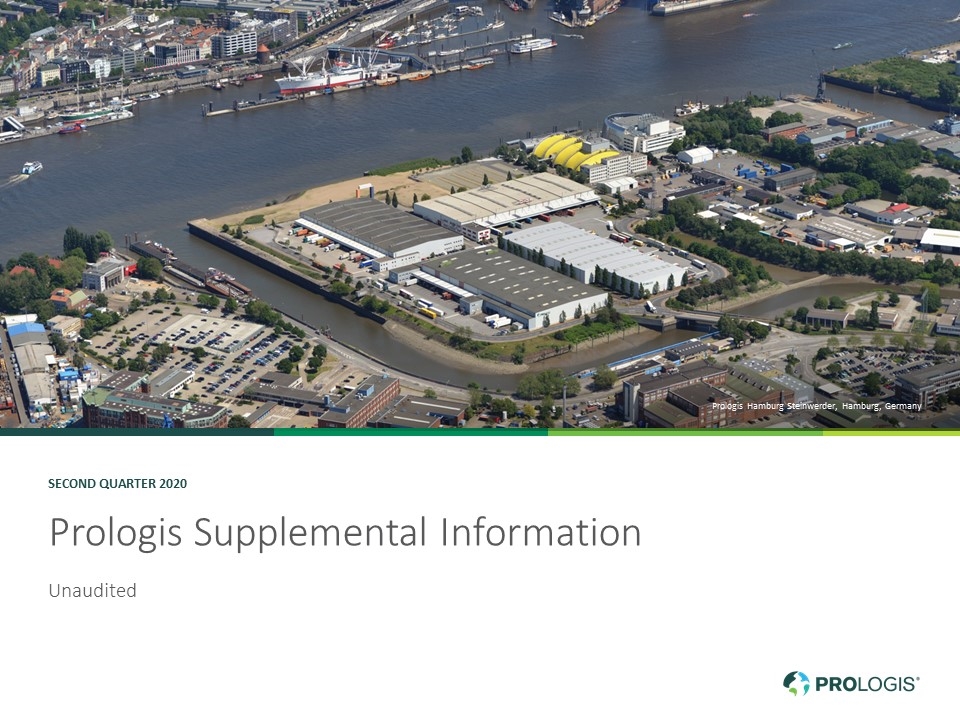
Prologis Supplemental Information second Quarter 2020 Unaudited Prologis Hamburg Steinwerder, Hamburg, Germany
2Q 2020 Supplemental Highlights 1Company Profile 3Company Performance 5Guidance Financial Information 6Consolidated Balance Sheets 7Consolidated Statements of Income 8Reconciliations of Net Earnings to FFO 9Reconciliations of Net Earnings to Adjusted EBITDA Strategic Capital 10Summary and Financial Highlights 11 Operating and Balance Sheet Information of the Unconsolidated Co-Investment Ventures 12 Non-GAAP Pro-Rata Financial Information Operations 13Overview 14Operating Metrics 16Operating Portfolio 19Customer Information Capital Deployment 20Overview 21Development Stabilizations 22Development Starts 23Development Portfolio 24Third Party Acquisitions 25Dispositions and Contributions 26Land Portfolio Capitalization 28Overview 29Debt Components - Consolidated 30Debt Components - Noncontrolling Interests and Unconsolidated Net Asset Value 31Components Notes and Definitions 33Notes and Definitions (A) Terms used throughout document are defined in the Notes and Definitions Copyright © 2020 Prologis
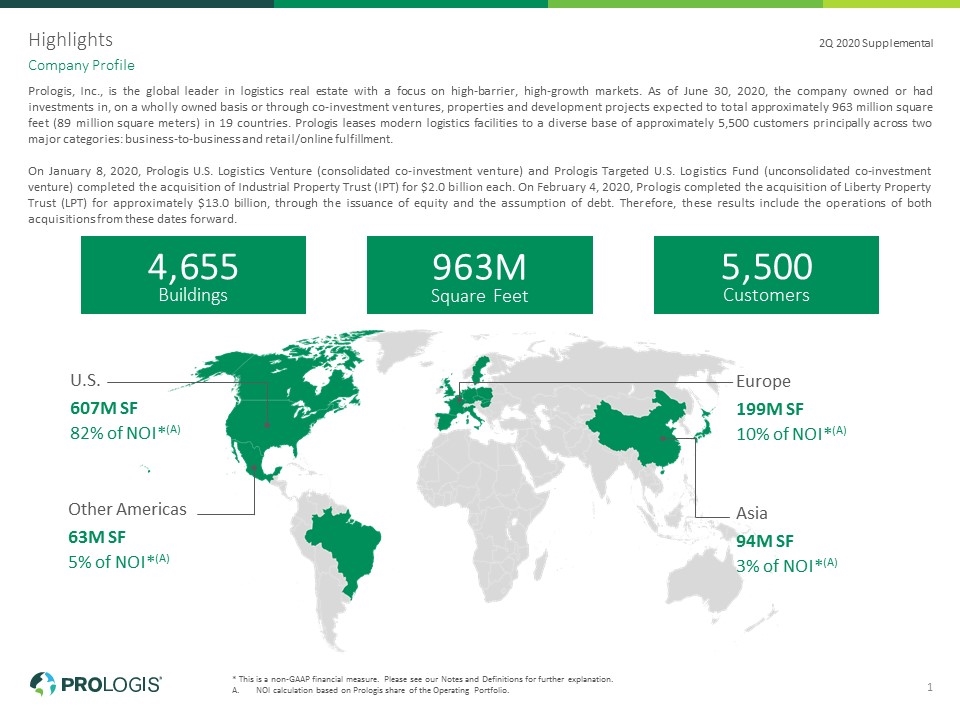
4,655 Buildings Highlights * This is a non-GAAP financial measure. Please see our Notes and Definitions for further explanation. NOI calculation based on Prologis share of the Operating Portfolio. Company Profile 2Q 2020 Supplemental 1 Prologis, Inc., is the global leader in logistics real estate with a focus on high-barrier, high-growth markets. As of June 30, 2020, the company owned or had investments in, on a wholly owned basis or through co-investment ventures, properties and development projects expected to total approximately 963 million square feet (89 million square meters) in 19 countries. Prologis leases modern logistics facilities to a diverse base of approximately 5,500 customers principally across two major categories: business-to-business and retail/online fulfillment. On January 8, 2020, Prologis U.S. Logistics Venture (consolidated co-investment venture) and Prologis Targeted U.S. Logistics Fund (unconsolidated co-investment venture) completed the acquisition of Industrial Property Trust (IPT) for $2.0 billion each. On February 4, 2020, Prologis completed the acquisition of Liberty Property Trust (LPT) for approximately $13.0 billion, through the issuance of equity and the assumption of debt. Therefore, these results include the operations of both acquisitions from these dates forward. 963M Square Feet 5,500 Customers U.S. 607M SF 82% of NOI*(A) Other Americas 63M SF 5% of NOI*(A) Europe 199M SF 10% of NOI*(A) Asia 94M SF 3% of NOI*(A)
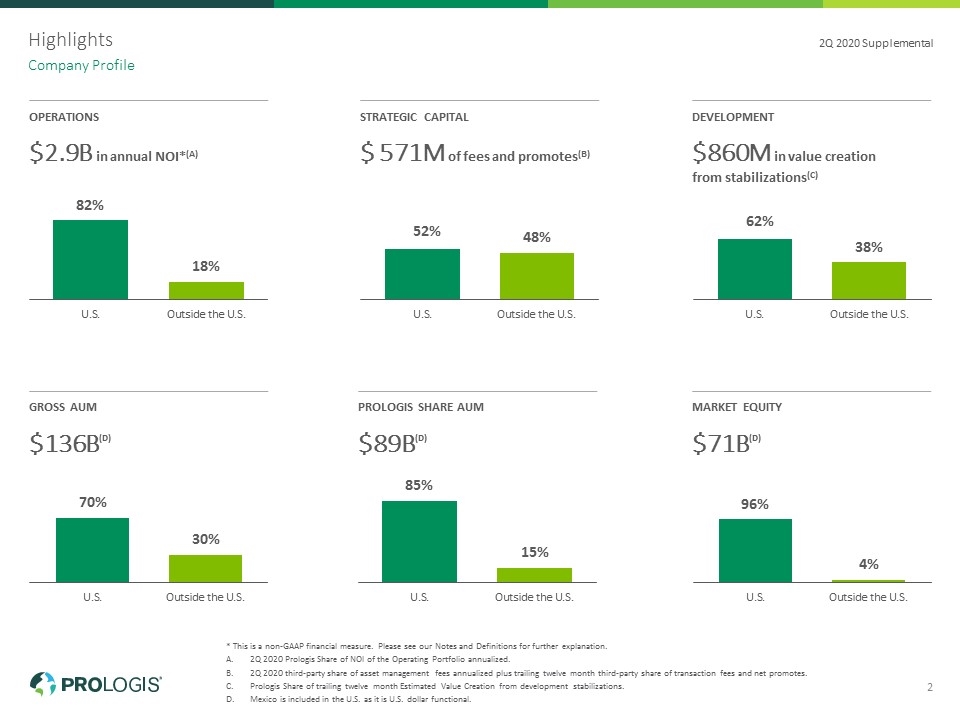
Highlights * This is a non-GAAP financial measure. Please see our Notes and Definitions for further explanation. 2Q 2020 Prologis Share of NOI of the Operating Portfolio annualized. 2Q 2020 third-party share of asset management fees annualized plus trailing twelve month third-party share of transaction fees and net promotes. Prologis Share of trailing twelve month Estimated Value Creation from development stabilizations. Mexico is included in the U.S. as it is U.S. dollar functional. Company Profile 2 2Q 2020 Supplemental Operations $2.9B in annual NOI*(A) Development $860M in value creation from stabilizations(C) Gross AUM $136B(D) Prologis Share AUM $89B(D) Market Equity $71B(D) Strategic capital $ 571M of fees and promotes(B)
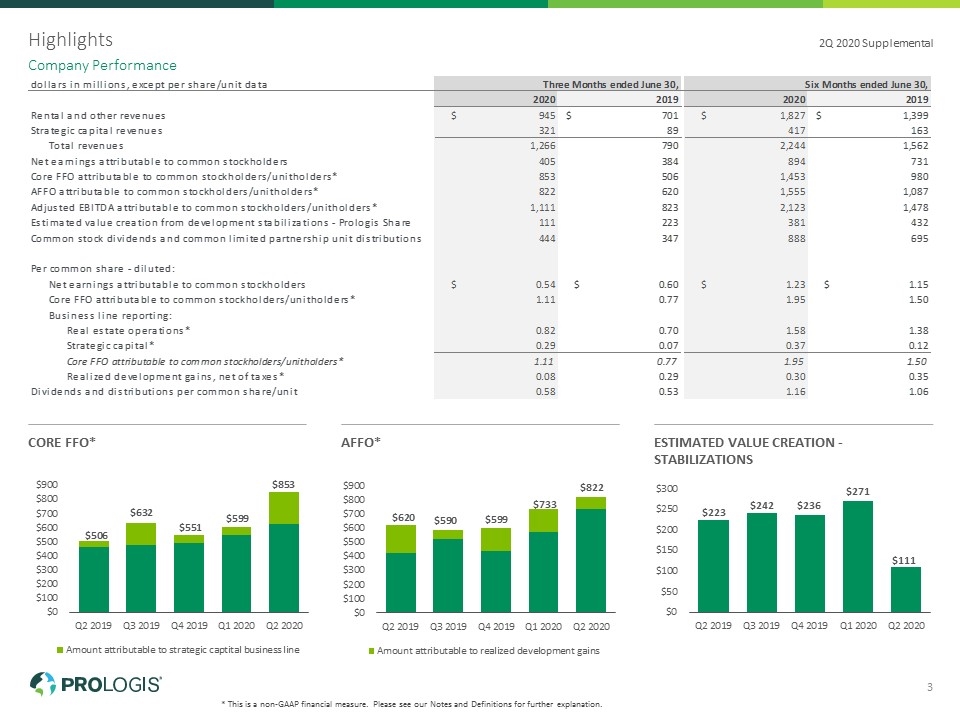
Highlights * This is a non-GAAP financial measure. Please see our Notes and Definitions for further explanation. Company Performance 2Q 2020 Supplemental 3 Core FFO* AFFO* Estimated Value Creation - Stabilizations
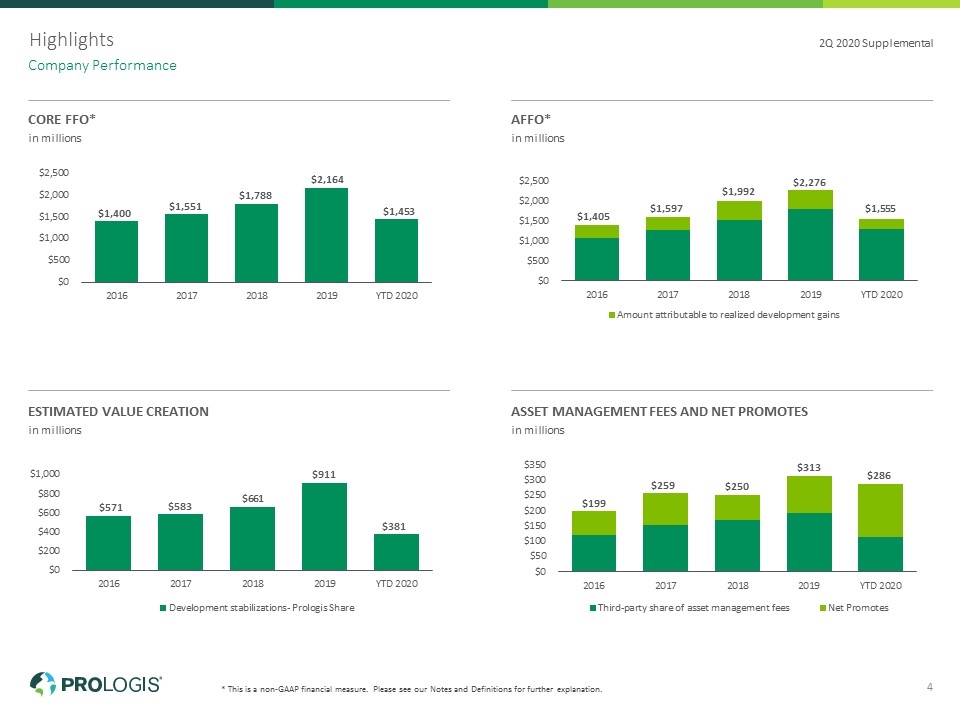
* This is a non-GAAP financial measure. Please see our Notes and Definitions for further explanation. Core FFO* in millions AFFO* in millions Estimated Value Creation in millions Asset Management Fees and Net Promotes in millions Highlights Company Performance 2Q 2020 Supplemental 4
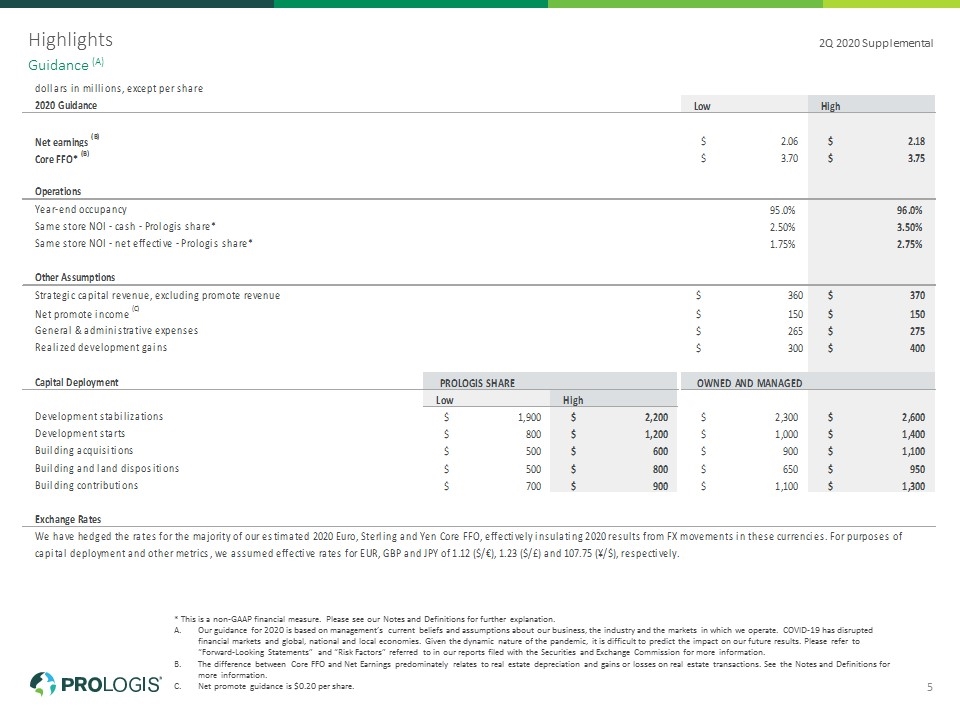
Highlights * This is a non-GAAP financial measure. Please see our Notes and Definitions for further explanation. Our guidance for 2020 is based on management’s current beliefs and assumptions about our business, the industry and the markets in which we operate. COVID-19 has disrupted financial markets and global, national and local economies. Given the dynamic nature of the pandemic, it is difficult to predict the impact on our future results. Please refer to “Forward-Looking Statements” and “Risk Factors” referred to in our reports filed with the Securities and Exchange Commission for more information. The difference between Core FFO and Net Earnings predominately relates to real estate depreciation and gains or losses on real estate transactions. See the Notes and Definitions for more information. Net promote guidance is $0.20 per share. Guidance (A) 2Q 2020 Supplemental 5
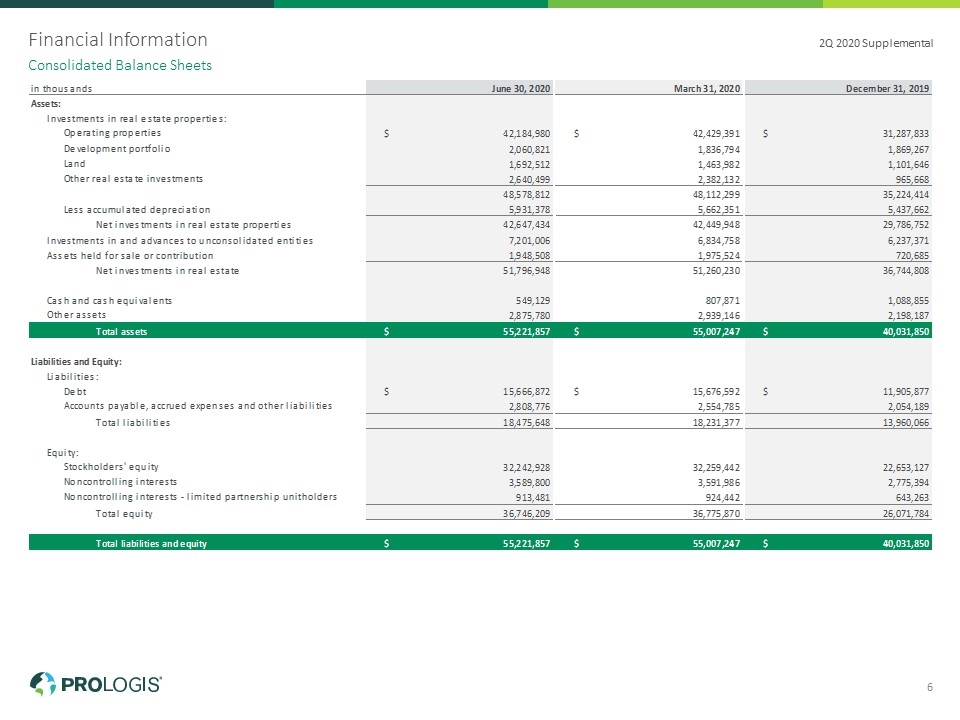
Financial Information Consolidated Balance Sheets 2Q 2020 Supplemental 6
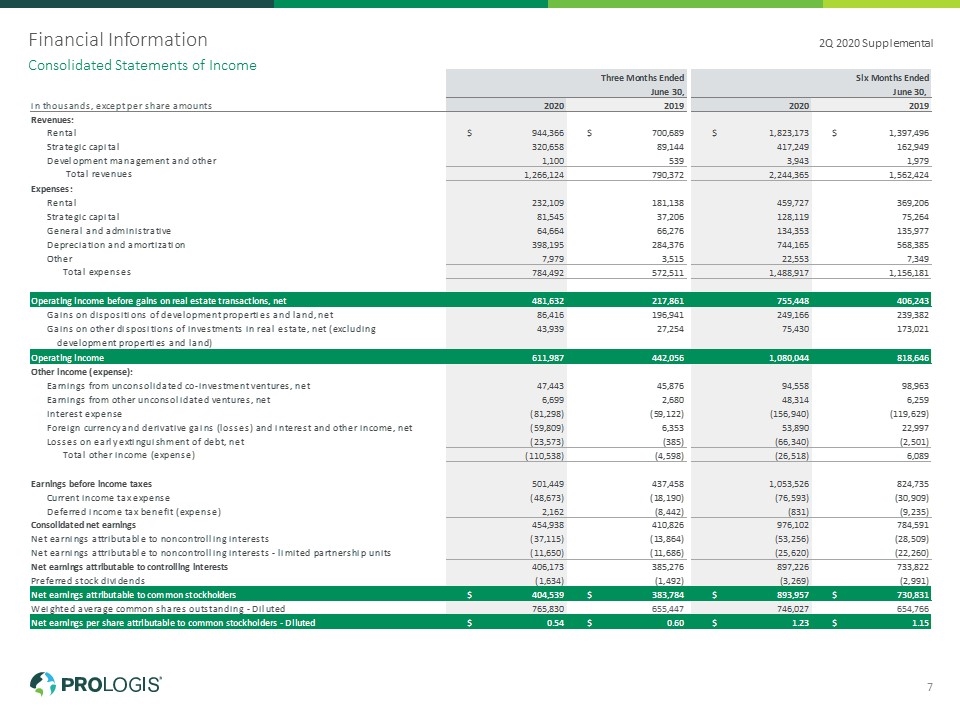
Financial Information Consolidated Statements of Income 2Q 2020 Supplemental 7
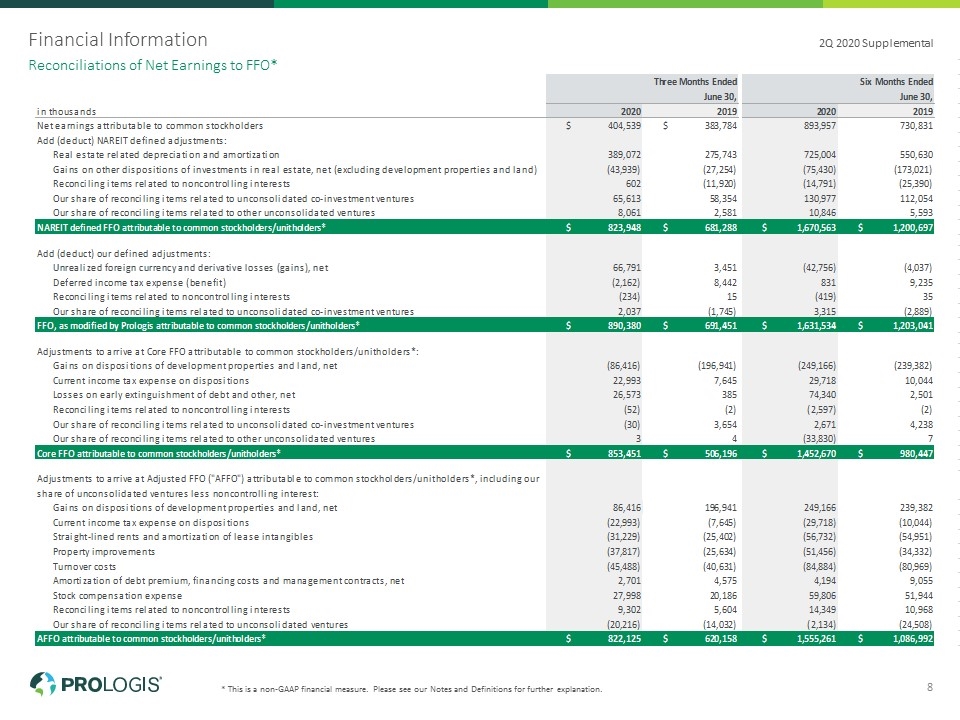
Financial Information * This is a non-GAAP financial measure. Please see our Notes and Definitions for further explanation. Reconciliations of Net Earnings to FFO* 2Q 2020 Supplemental 8
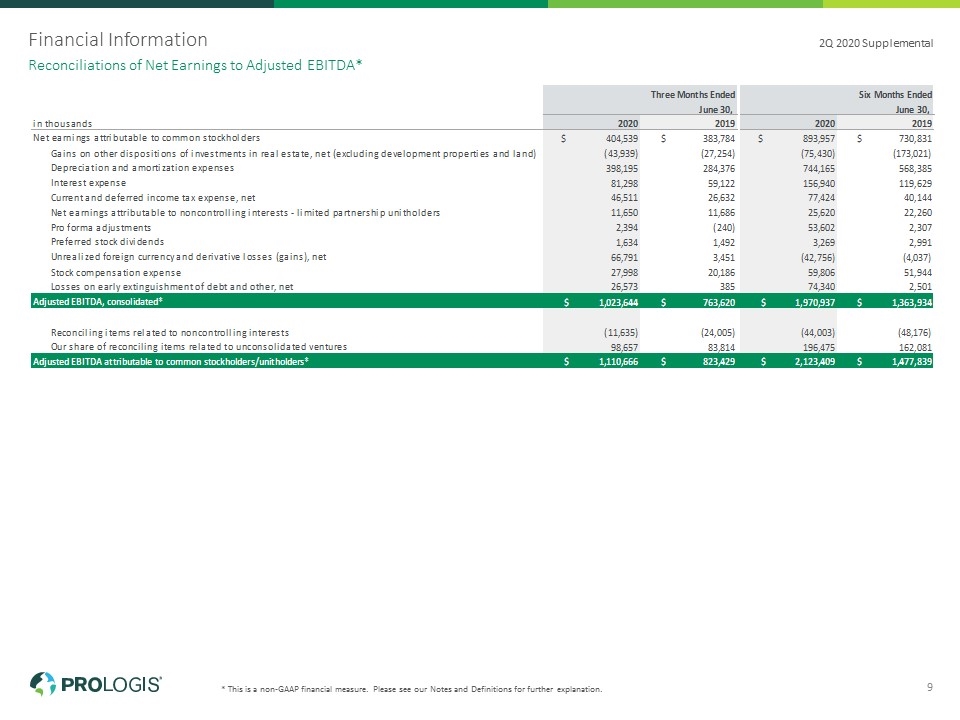
Financial Information * This is a non-GAAP financial measure. Please see our Notes and Definitions for further explanation. Reconciliations of Net Earnings to Adjusted EBITDA* 2Q 2020 Supplemental 9
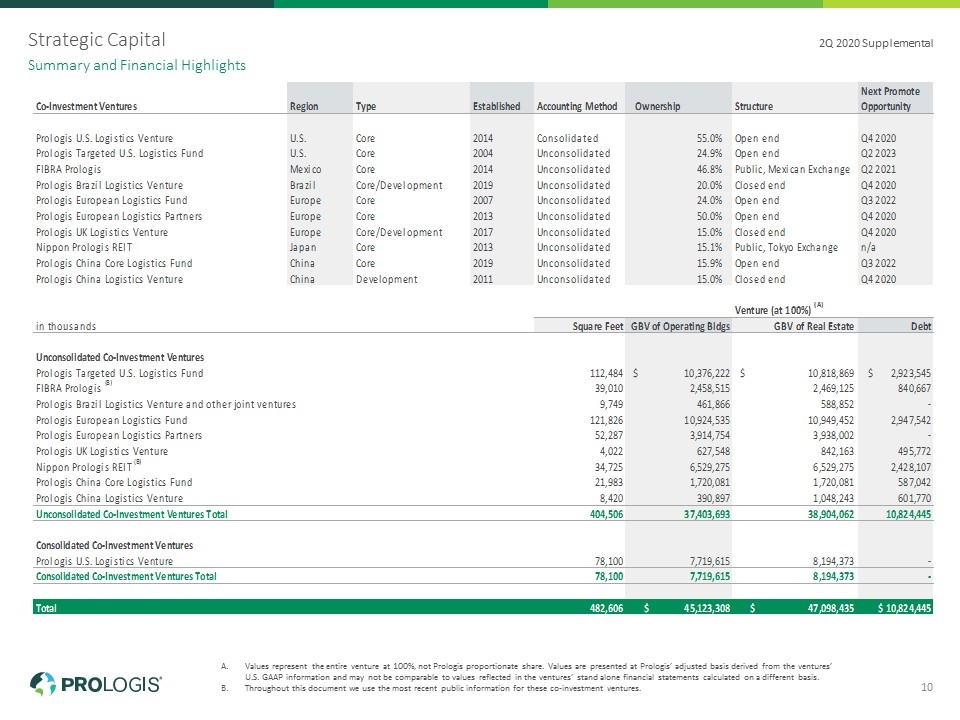
Strategic Capital Values represent the entire venture at 100%, not Prologis proportionate share. Values are presented at Prologis’ adjusted basis derived from the ventures’ U.S. GAAP information and may not be comparable to values reflected in the ventures’ stand alone financial statements calculated on a different basis. Throughout this document we use the most recent public information for these co-investment ventures. Summary and Financial Highlights 2Q 2020 Supplemental 10
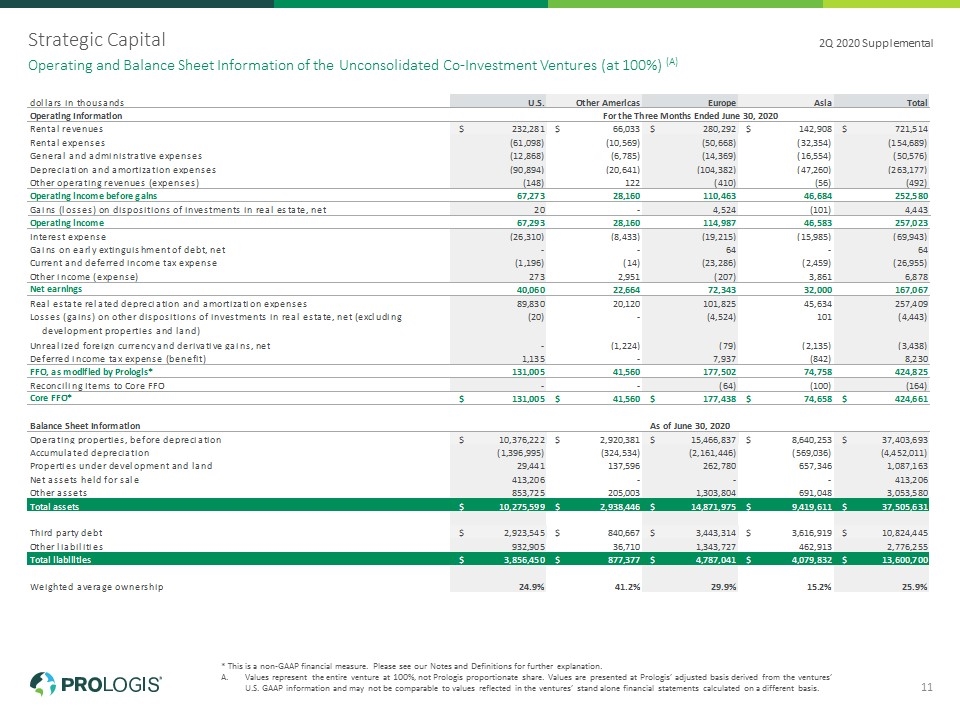
Strategic Capital * This is a non-GAAP financial measure. Please see our Notes and Definitions for further explanation. Values represent the entire venture at 100%, not Prologis proportionate share. Values are presented at Prologis’ adjusted basis derived from the ventures’ U.S. GAAP information and may not be comparable to values reflected in the ventures’ stand alone financial statements calculated on a different basis. Operating and Balance Sheet Information of the Unconsolidated Co-Investment Ventures (at 100%) (A) 2Q 2020 Supplemental 11
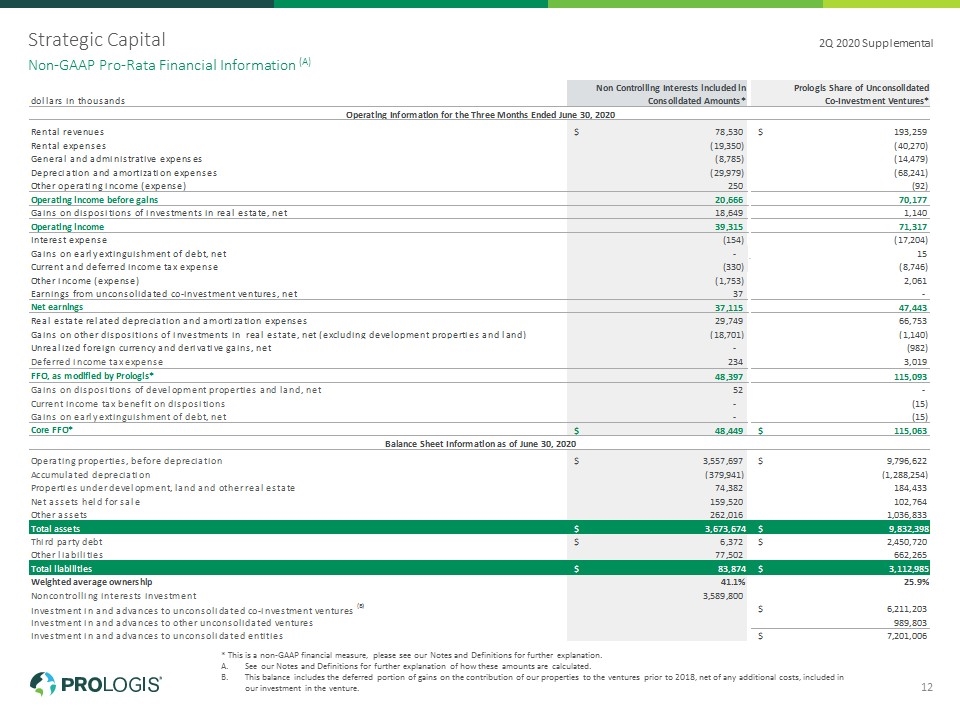
Strategic Capital * This is a non-GAAP financial measure, please see our Notes and Definitions for further explanation. See our Notes and Definitions for further explanation of how these amounts are calculated. This balance includes the deferred portion of gains on the contribution of our properties to the ventures prior to 2018, net of any additional costs, included in our investment in the venture. Non-GAAP Pro-Rata Financial Information (A) 2Q 2020 Supplemental 12
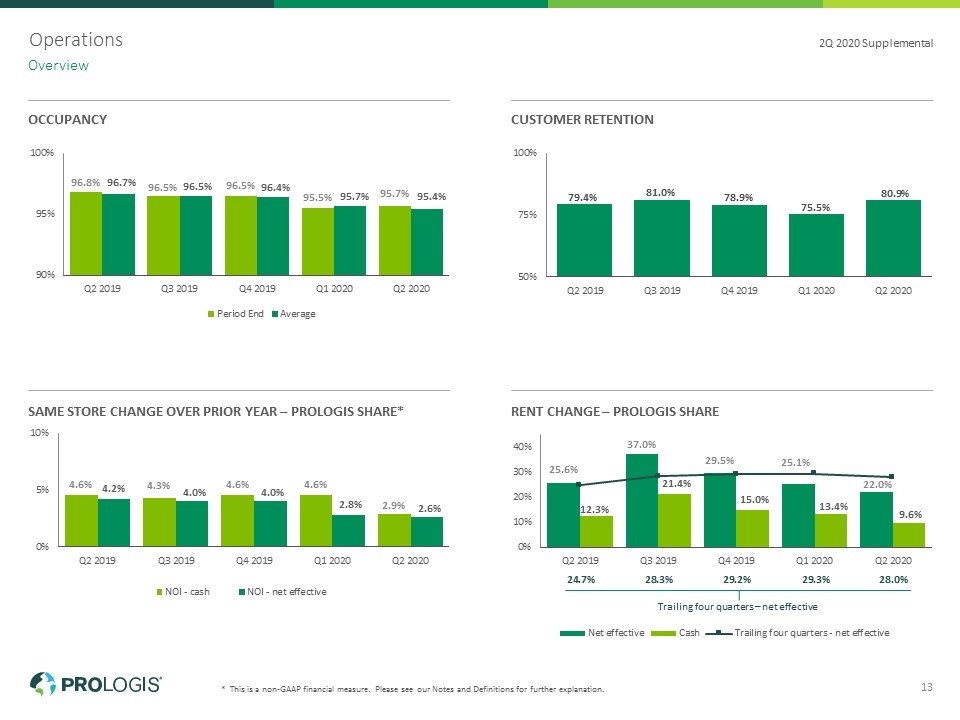
* This is a non-GAAP financial measure. Please see our Notes and Definitions for further explanation. Occupancy Customer Retention Same Store Change Over Prior Year – Prologis Share* Rent Change – Prologis Share Operations Overview 2Q 2020 Supplemental 13 Trailing four quarters – net effective
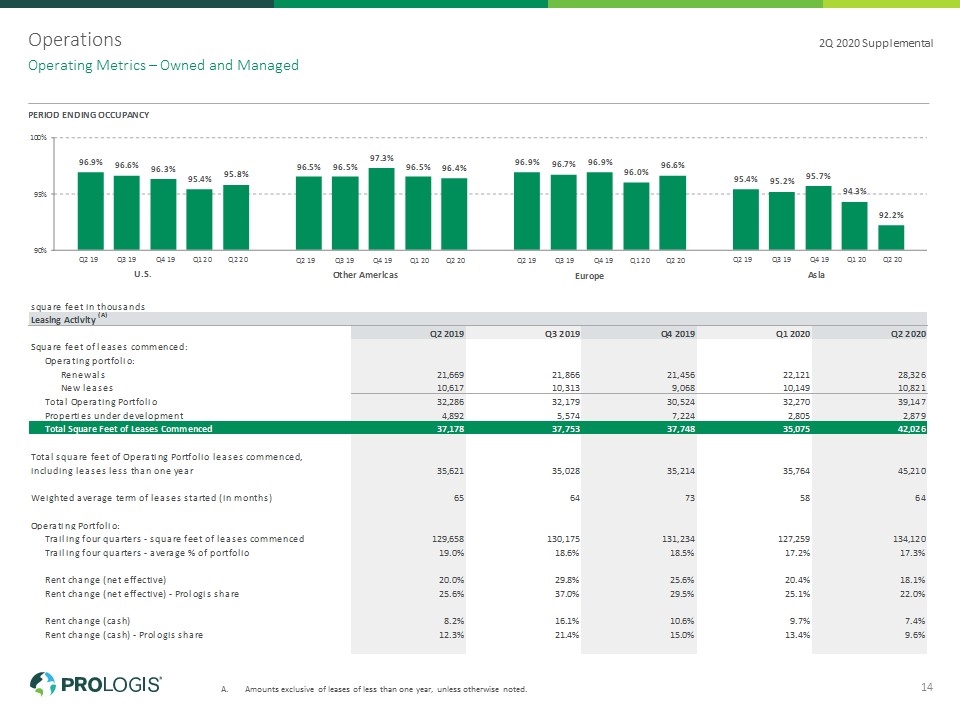
Operations Amounts exclusive of leases of less than one year, unless otherwise noted. Operating Metrics – Owned and Managed 2Q 2020 Supplemental 14
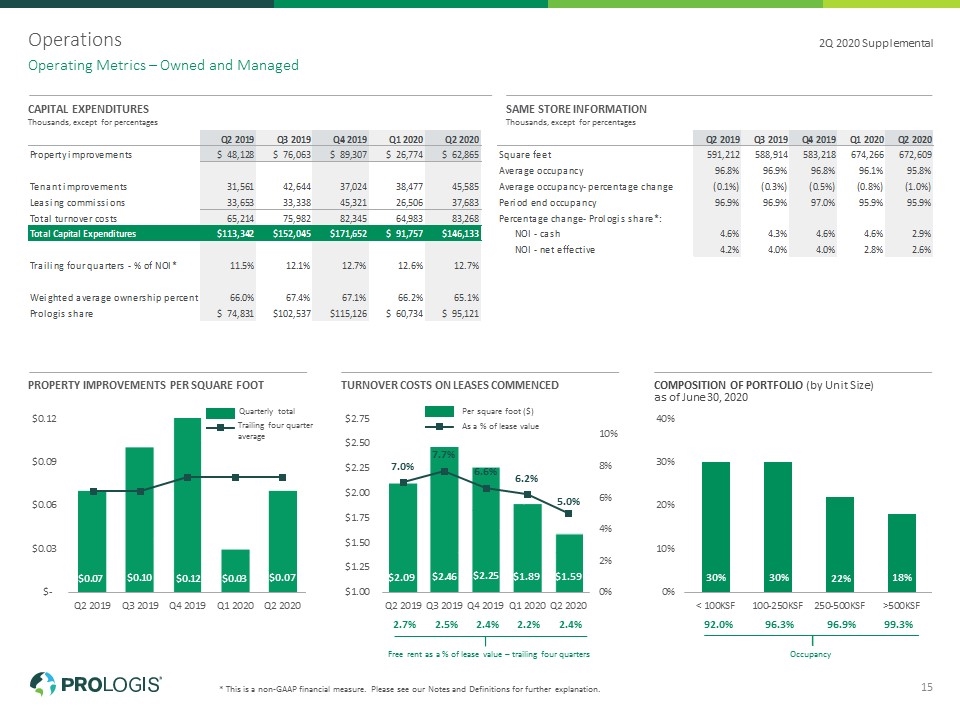
Operations * This is a non-GAAP financial measure. Please see our Notes and Definitions for further explanation. Operating Metrics – Owned and Managed 2Q 2020 Supplemental 15 CAPITAL EXPENDITURES Thousands, except for percentages SAME STORE INFORMATION Thousands, except for percentages PROPERTY IMPROVEMENTS PER SQUARE FOOT TURNOVER COSTS ON LEASES COMMENCED COMPOSITION OF PORTFOLIO (by Unit Size) Free rent as a % of lease value – trailing four quarters 2.7% 2.5% 2.4% 2.2% 2.4% Occupancy 92.0% 96.3% 96.9% 99.3% Trailing four quarter average Quarterly total As a % of lease value Per square foot ($) as of June 30, 2020
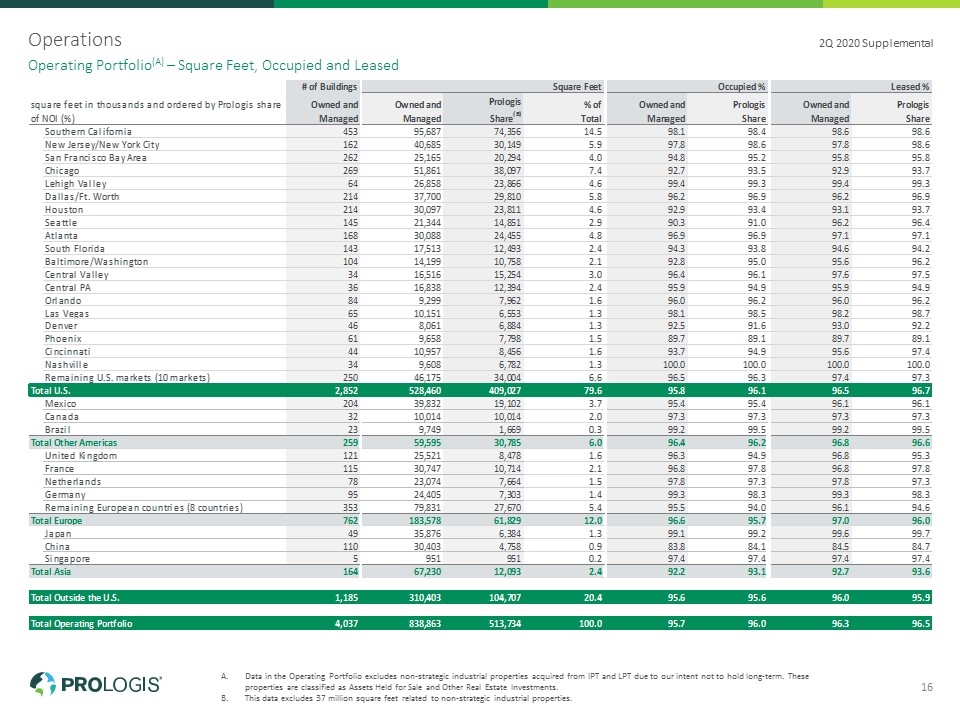
Operations Operating Portfolio(A) – Square Feet, Occupied and Leased 2Q 2020 Supplemental 16 Data in the Operating Portfolio excludes non-strategic industrial properties acquired from IPT and LPT due to our intent not to hold long-term. These properties are classified as Assets Held for Sale and Other Real Estate Investments. This data excludes 37 million square feet related to non-strategic industrial properties.
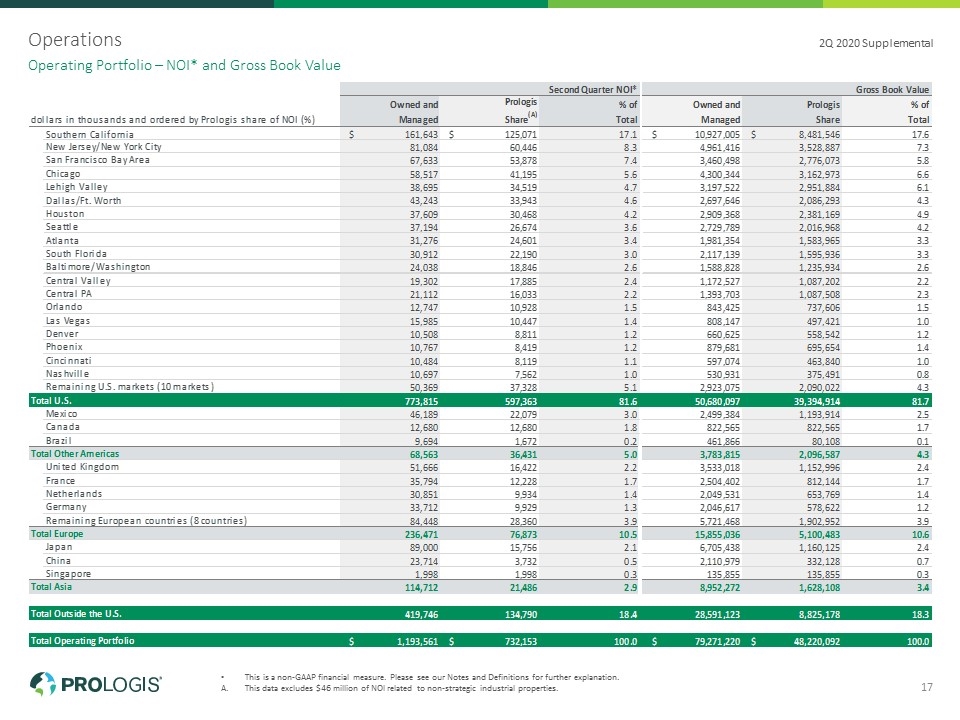
Operations This is a non-GAAP financial measure. Please see our Notes and Definitions for further explanation. This data excludes $46 million of NOI related to non-strategic industrial properties. Operating Portfolio – NOI* and Gross Book Value 2Q 2020 Supplemental 17
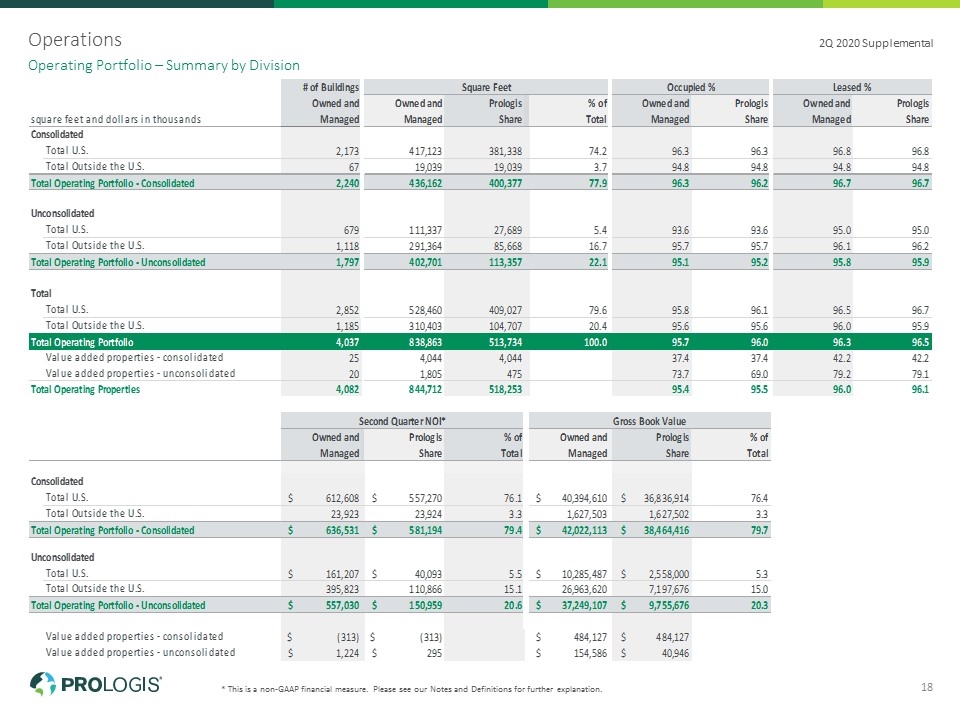
Operations * This is a non-GAAP financial measure. Please see our Notes and Definitions for further explanation. Operating Portfolio – Summary by Division 2Q 2020 Supplemental 18
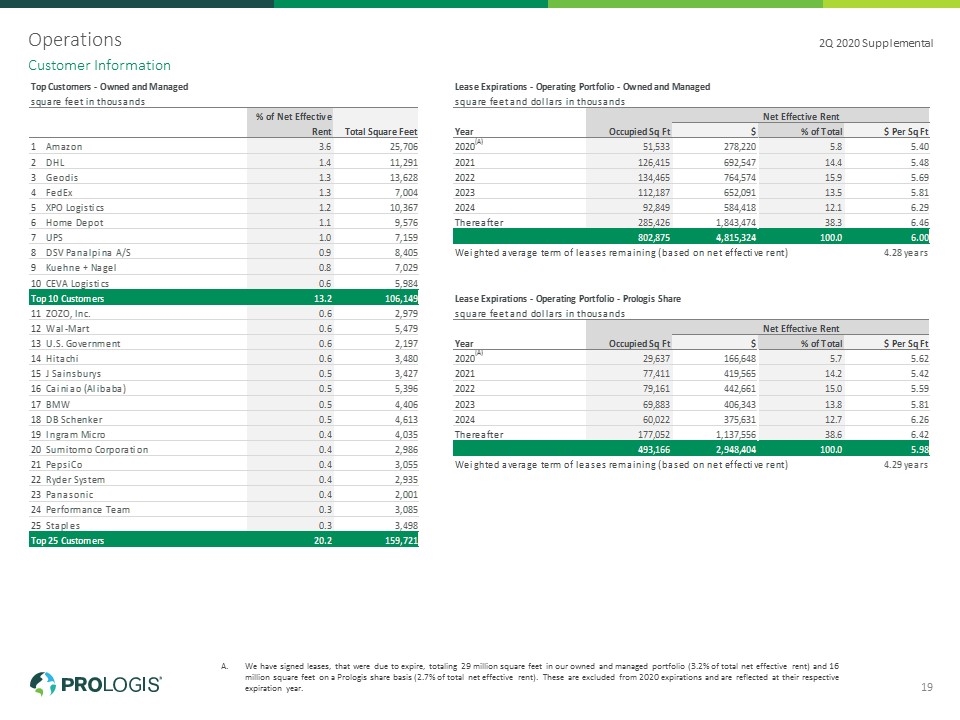
Operations We have signed leases, that were due to expire, totaling 29 million square feet in our owned and managed portfolio (3.2% of total net effective rent) and 16 million square feet on a Prologis share basis (2.7% of total net effective rent). These are excluded from 2020 expirations and are reflected at their respective expiration year. Customer Information 2Q 2020 Supplemental 19
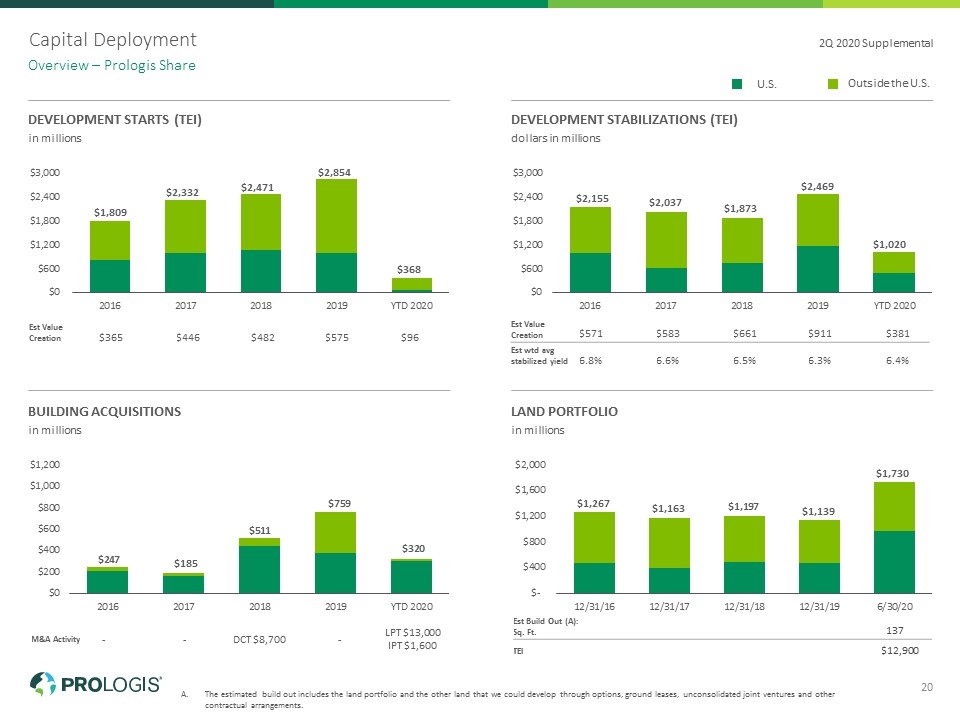
M&A Activity - - DCT $8,700 - LPT $13,000 IPT $1,600 Development Starts (TEI) in millions Development Stabilizations (TEI) dollars in millions Building Acquisitions in millions Land Portfolio in millions Capital Deployment Overview – Prologis Share 2Q 2020 Supplemental 20 Outside the U.S. U.S. Est Value Creation $571 $583 $661 $911 $381 Est wtd avg stabilized yield 6.8% 6.6% 6.5% 6.3% 6.4% Est Value Creation $365 $446 $482 $575 $96 The estimated build out includes the land portfolio and the other land that we could develop through options, ground leases, unconsolidated joint ventures and other contractual arrangements. Est Build Out (A): Sq. Ft. 137 TEI $12,900
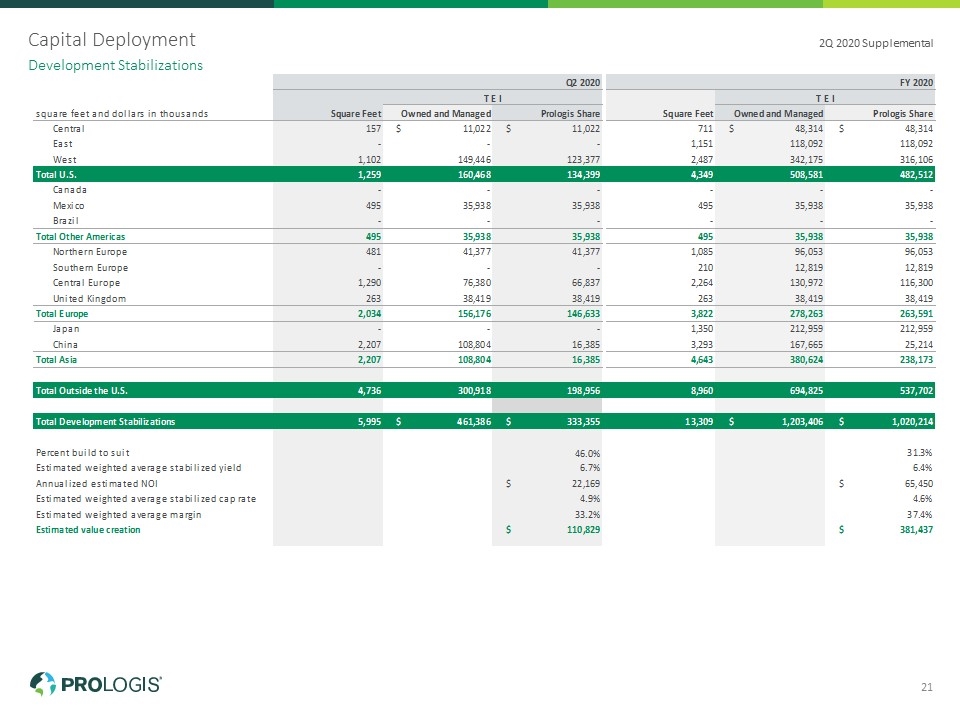
Capital Deployment Development Stabilizations 2Q 2020 Supplemental 21
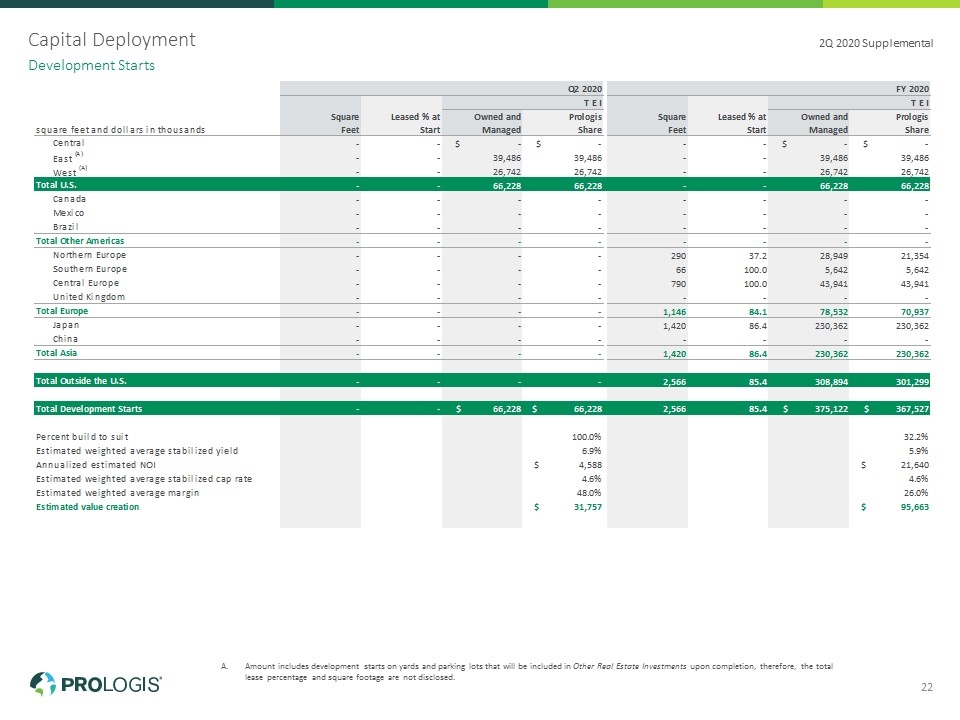
Capital Deployment Amount includes development starts on yards and parking lots that will be included in Other Real Estate Investments upon completion, therefore, the total lease percentage and square footage are not disclosed. Development Starts 2Q 2020 Supplemental 22
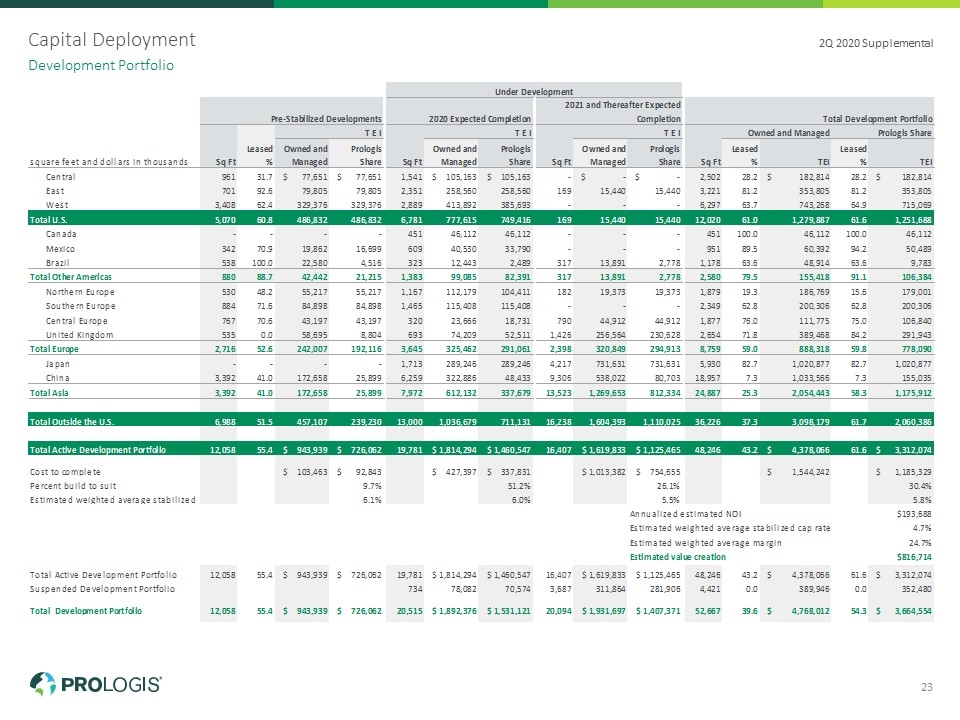
Capital Deployment Development Portfolio 2Q 2020 Supplemental 23
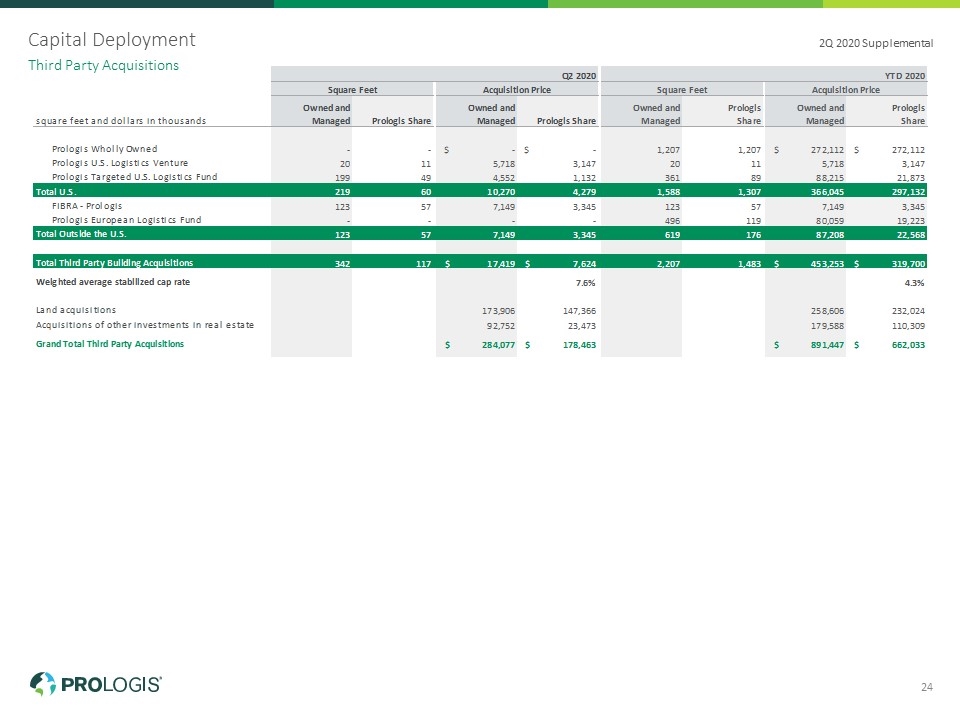
Capital Deployment Third Party Acquisitions 2Q 2020 Supplemental 24
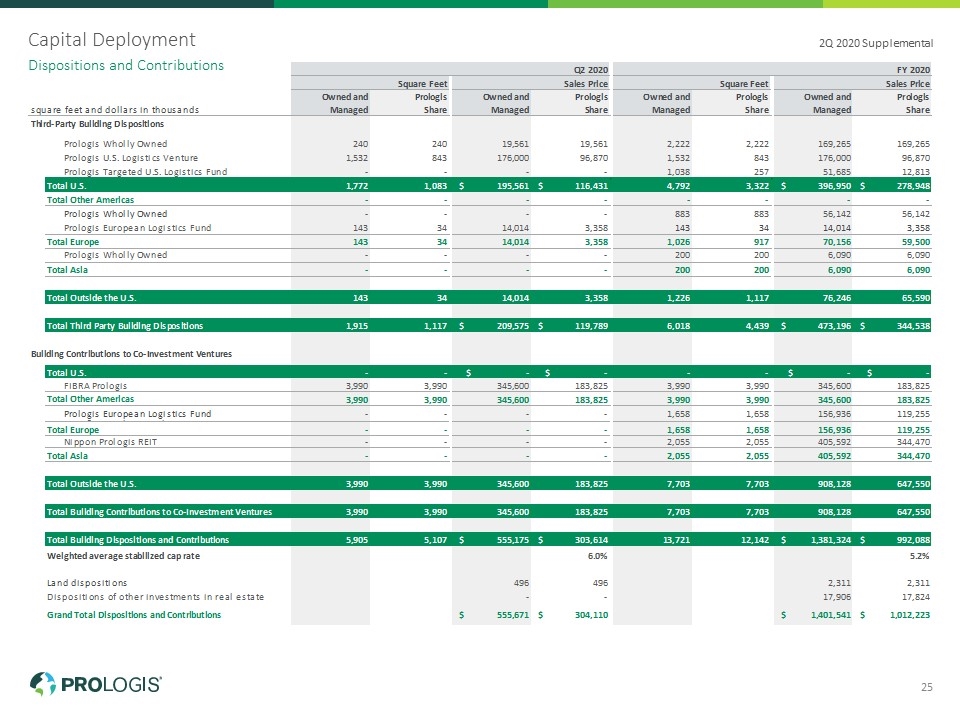
Capital Deployment Dispositions and Contributions 2Q 2020 Supplemental 25
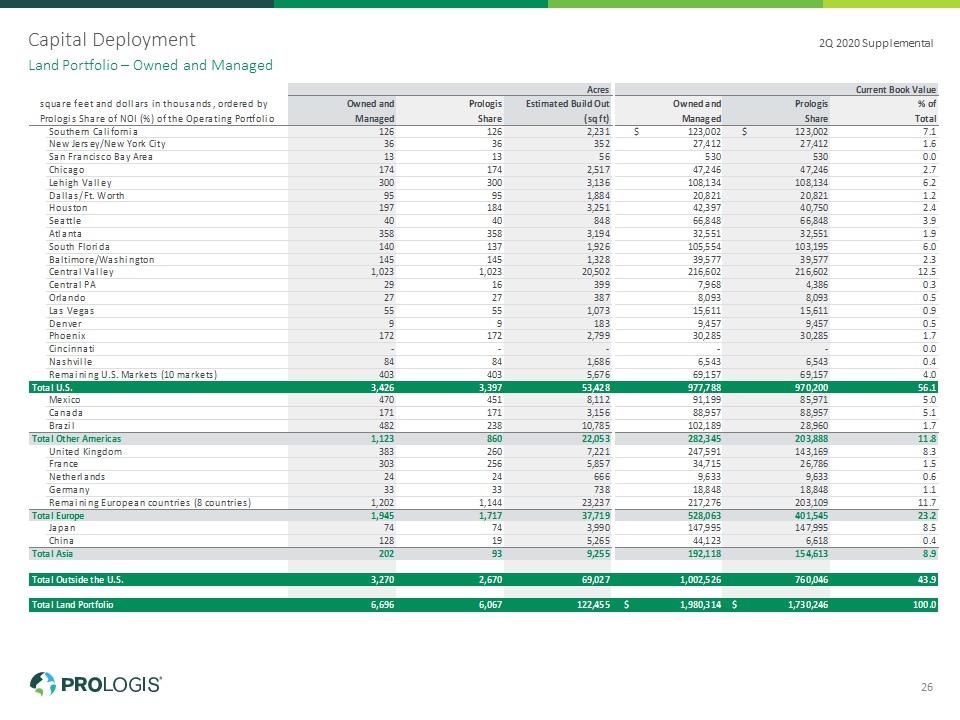
Capital Deployment Land Portfolio – Owned and Managed 2Q 2020 Supplemental 26
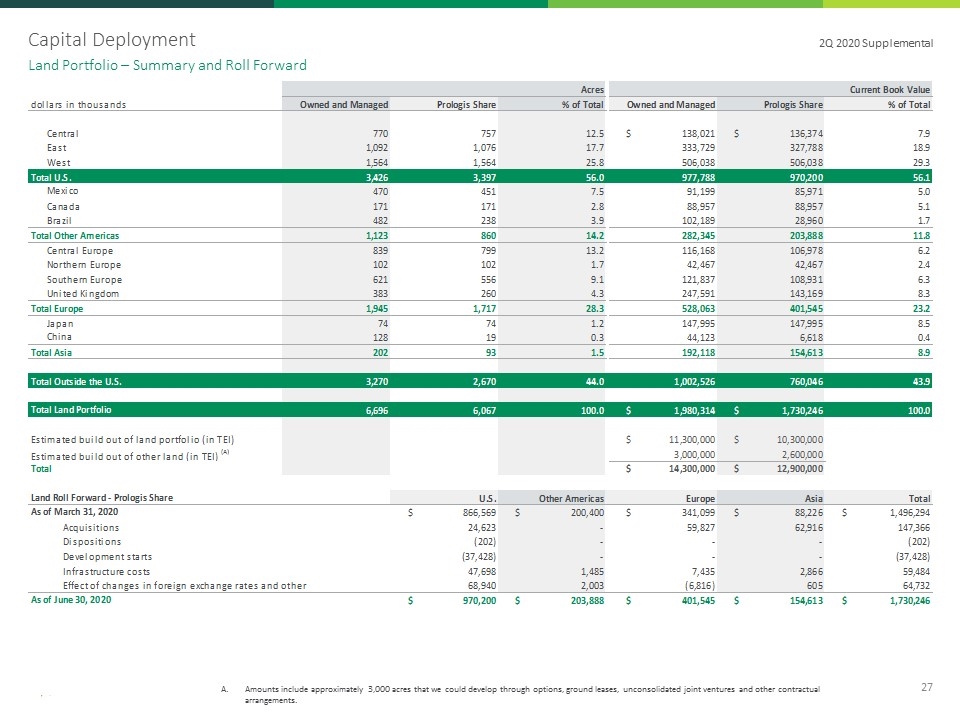
Capital Deployment Amounts include approximately 3,000 acres that we could develop through options, ground leases, unconsolidated joint ventures and other contractual arrangements. Land Portfolio – Summary and Roll Forward 2Q 2020 Supplemental 27
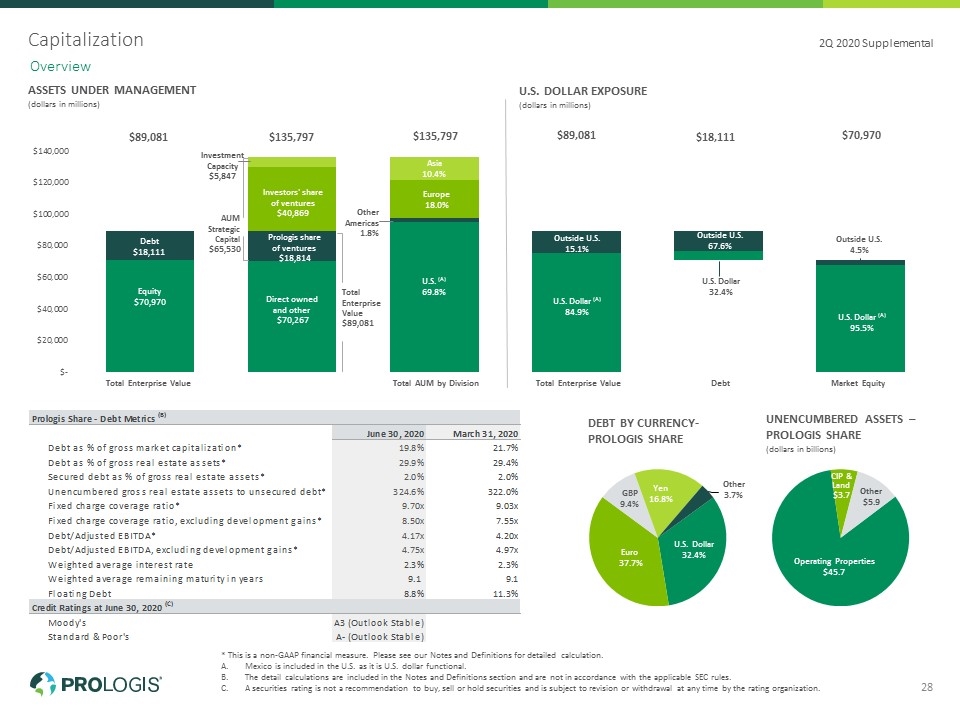
Capitalization * This is a non-GAAP financial measure. Please see our Notes and Definitions for detailed calculation. Mexico is included in the U.S. as it is U.S. dollar functional. The detail calculations are included in the Notes and Definitions section and are not in accordance with the applicable SEC rules. A securities rating is not a recommendation to buy, sell or hold securities and is subject to revision or withdrawal at any time by the rating organization. Overview 2Q 2020 Supplemental 28 ASSETS UNDER MANAGEMENT (dollars in millions) Total Enterprise Value Total AUM by Division Market Equity U.S. DOLLAR EXPOSURE (dollars in millions) Total Enterprise Value Debt U.S. Dollar 32.4% U.S. Dollar (A) 84.9% Outside U.S. 15.1% Outside U.S. 67.6% DEBT BY CURRENCY- PROLOGIS SHARE UNENCUMBERED ASSETS – PROLOGIS SHARE (dollars in billions)
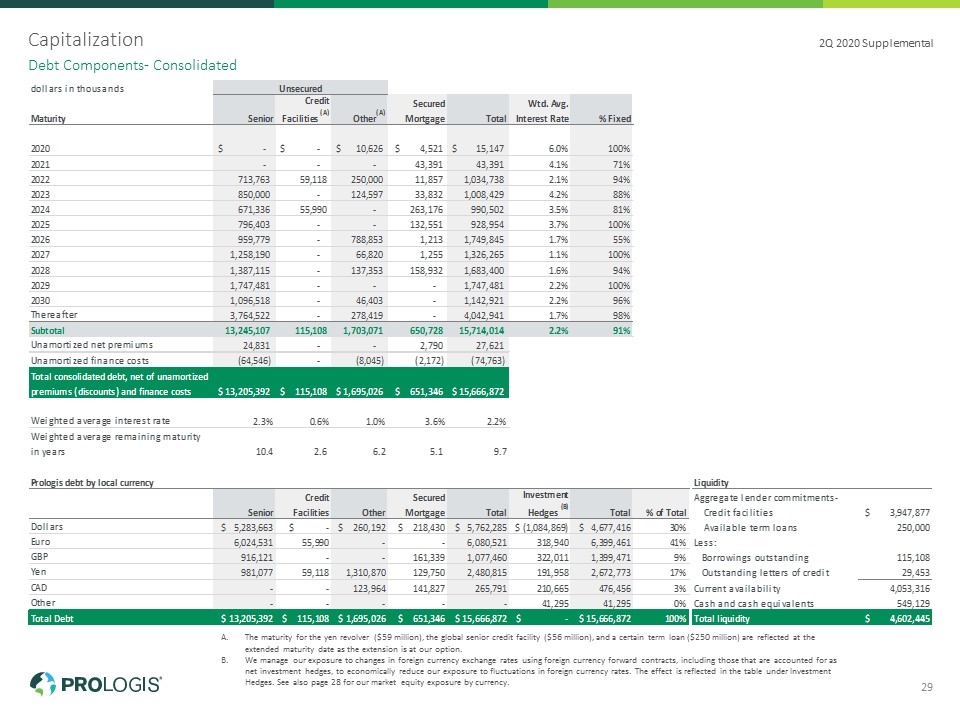
Capitalization The maturity for the yen revolver ($59 million), the global senior credit facility ($56 million), and a certain term loan ($250 million) are reflected at the extended maturity date as the extension is at our option. We manage our exposure to changes in foreign currency exchange rates using foreign currency forward contracts, including those that are accounted for as net investment hedges, to economically reduce our exposure to fluctuations in foreign currency rates. The effect is reflected in the table under Investment Hedges. See also page 28 for our market equity exposure by currency. Debt Components- Consolidated 2Q 2020 Supplemental 29
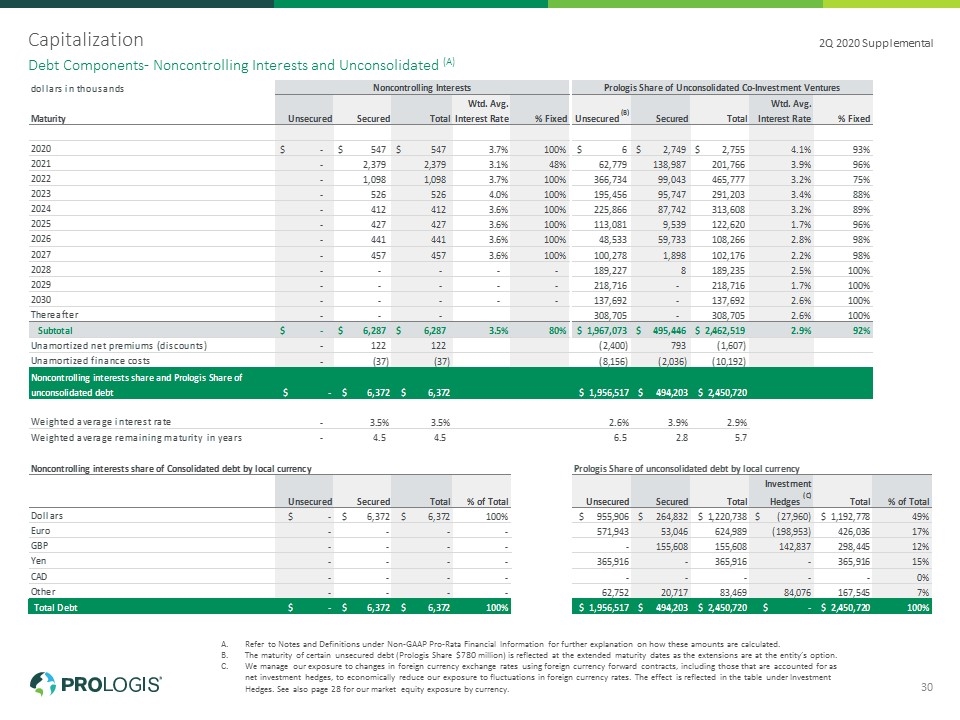
Capitalization Refer to Notes and Definitions under Non-GAAP Pro-Rata Financial Information for further explanation on how these amounts are calculated. The maturity of certain unsecured debt (Prologis Share $780 million) is reflected at the extended maturity dates as the extensions are at the entity’s option. We manage our exposure to changes in foreign currency exchange rates using foreign currency forward contracts, including those that are accounted for as net investment hedges, to economically reduce our exposure to fluctuations in foreign currency rates. The effect is reflected in the table under Investment Hedges. See also page 28 for our market equity exposure by currency. Debt Components- Noncontrolling Interests and Unconsolidated (A) 2Q 2020 Supplemental 30
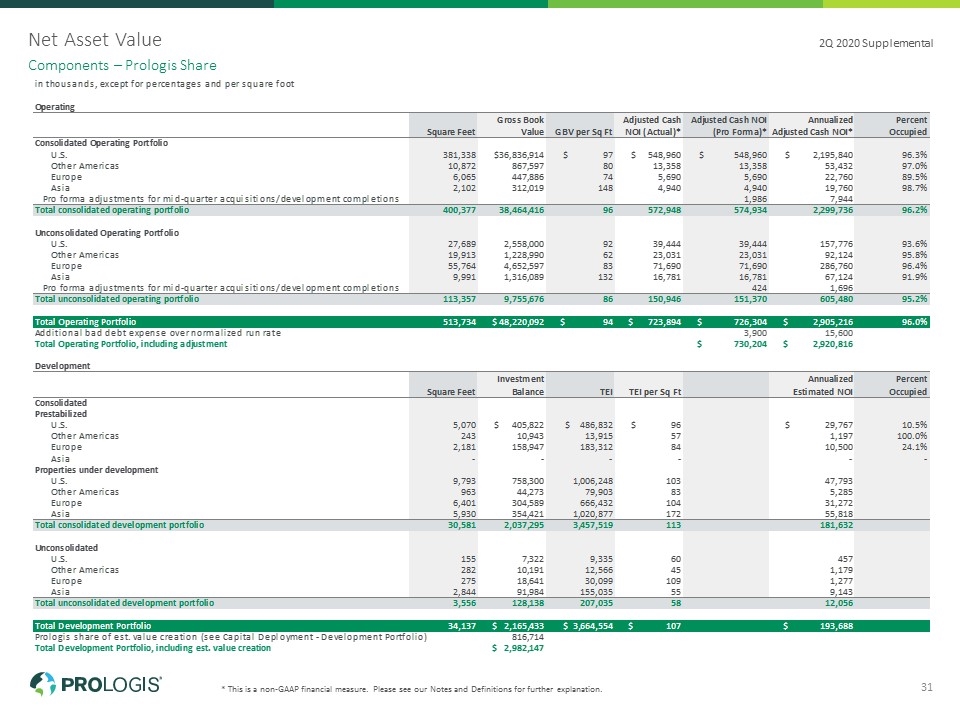
Net Asset Value * This is a non-GAAP financial measure. Please see our Notes and Definitions for further explanation. Components – Prologis Share 2Q 2020 Supplemental 31
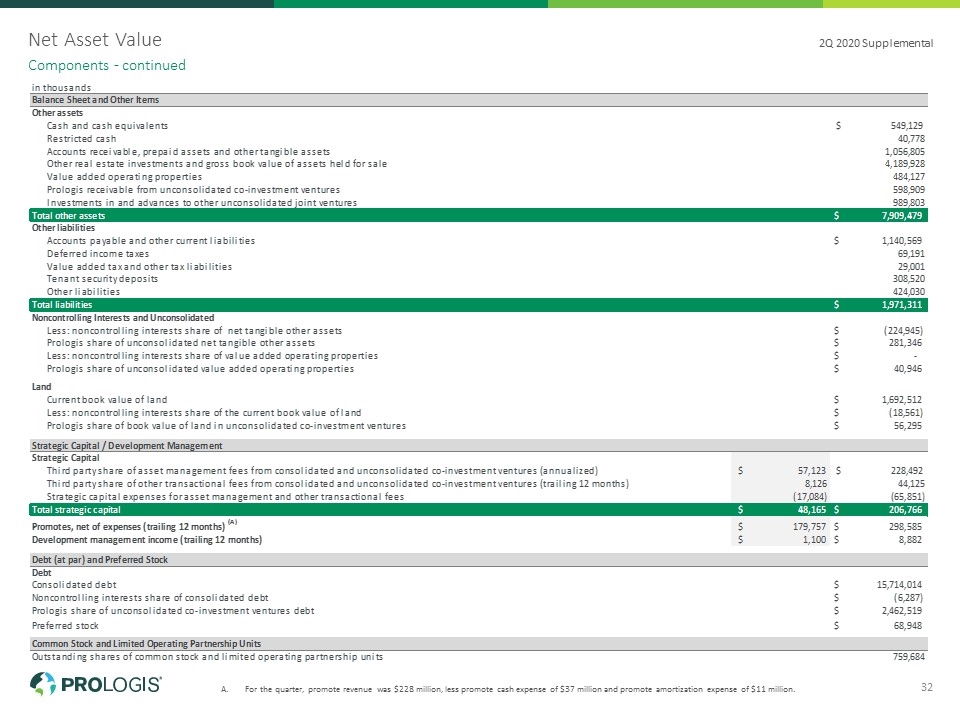
Net Asset Value For the quarter, promote revenue was $228 million, less promote cash expense of $37 million and promote amortization expense of $11 million. Components - continued 2Q 2020 Supplemental 32

Notes and Definitions Prologis Fokker Park, Oude Meer, the Netherlands
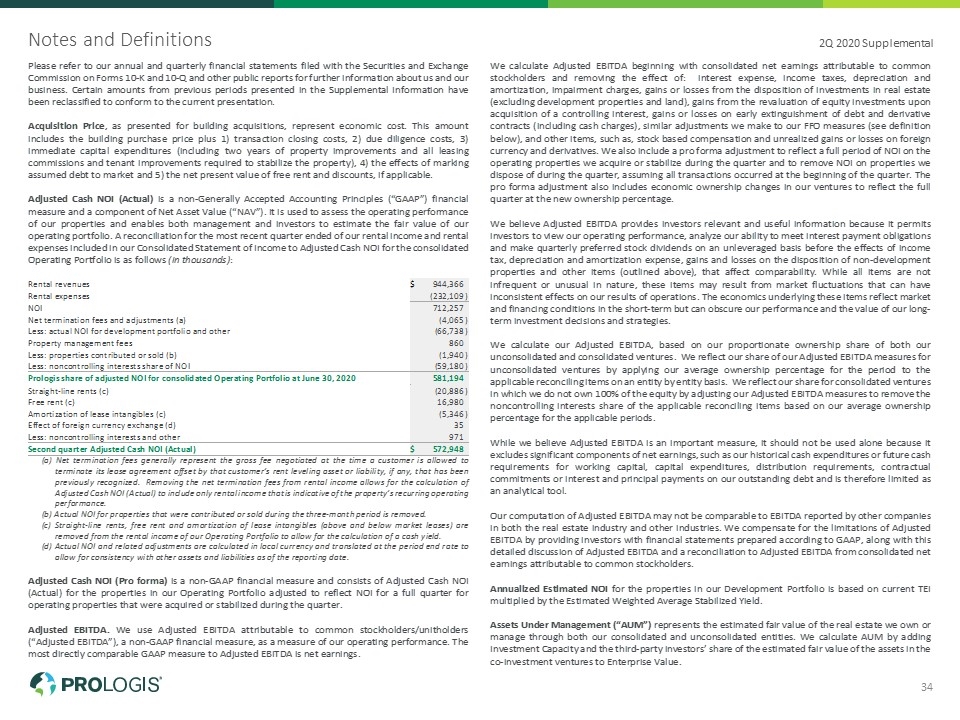
Notes and Definitions 2Q 2020 Supplemental 34
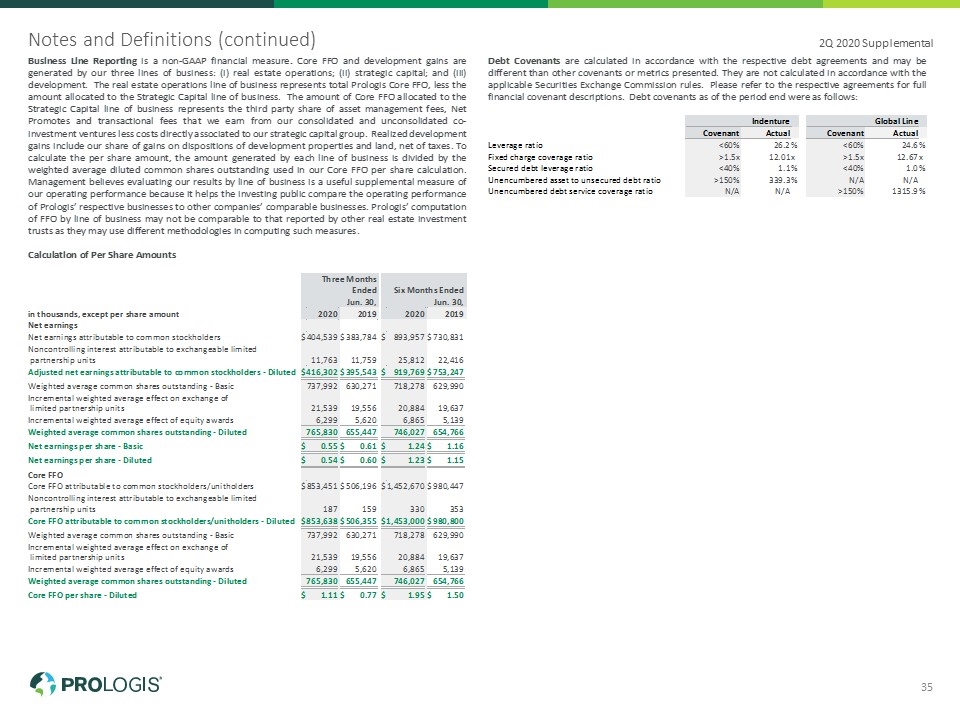
Notes and Definitions (continued) 2Q 2020 Supplemental 35
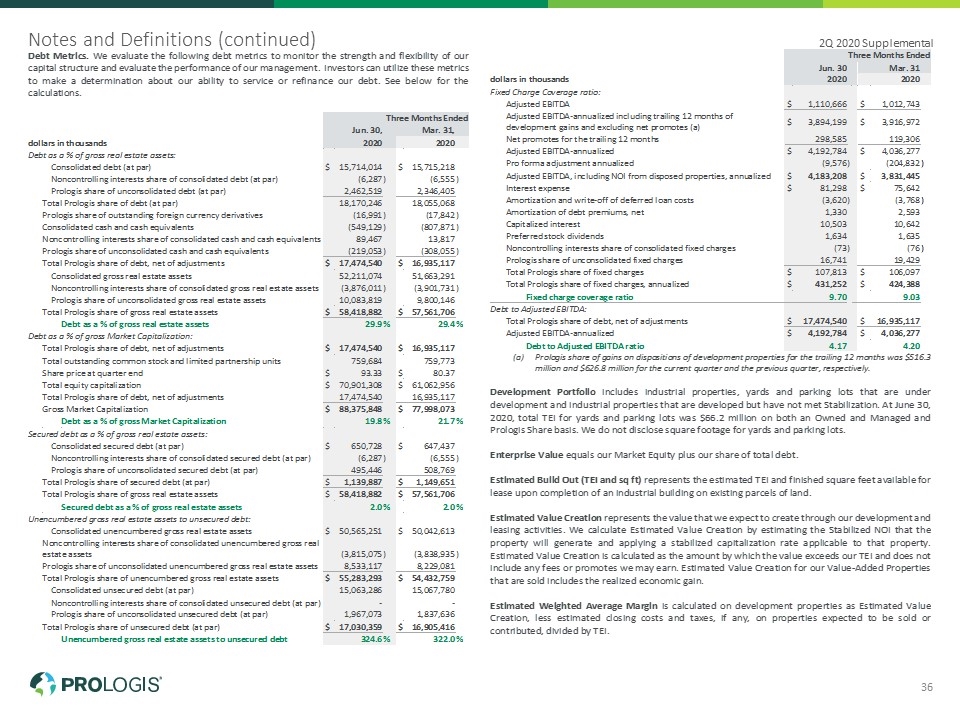
Notes and Definitions (continued) 2Q 2020 Supplemental 36
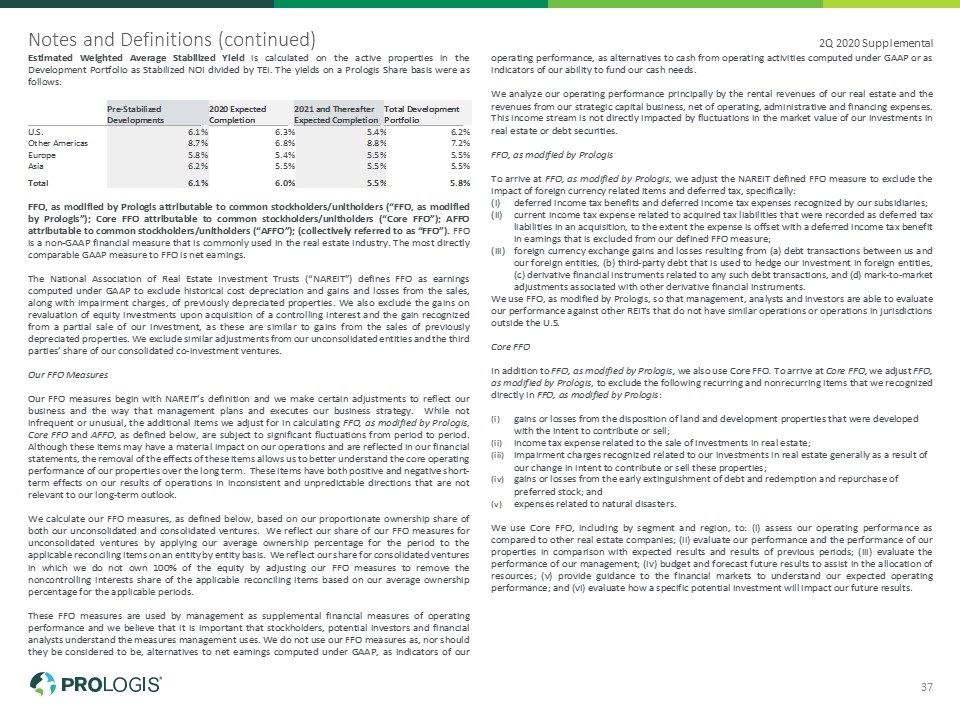
Notes and Definitions (continued) 2Q 2020 Supplemental 37
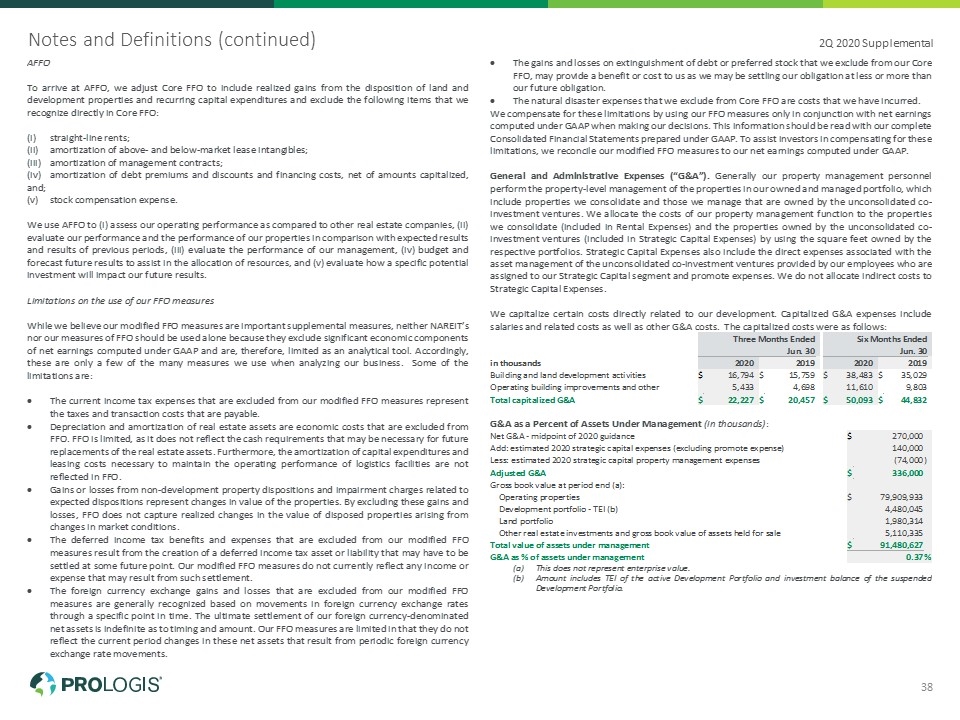
Notes and Definitions (continued) 2Q 2020 Supplemental 38
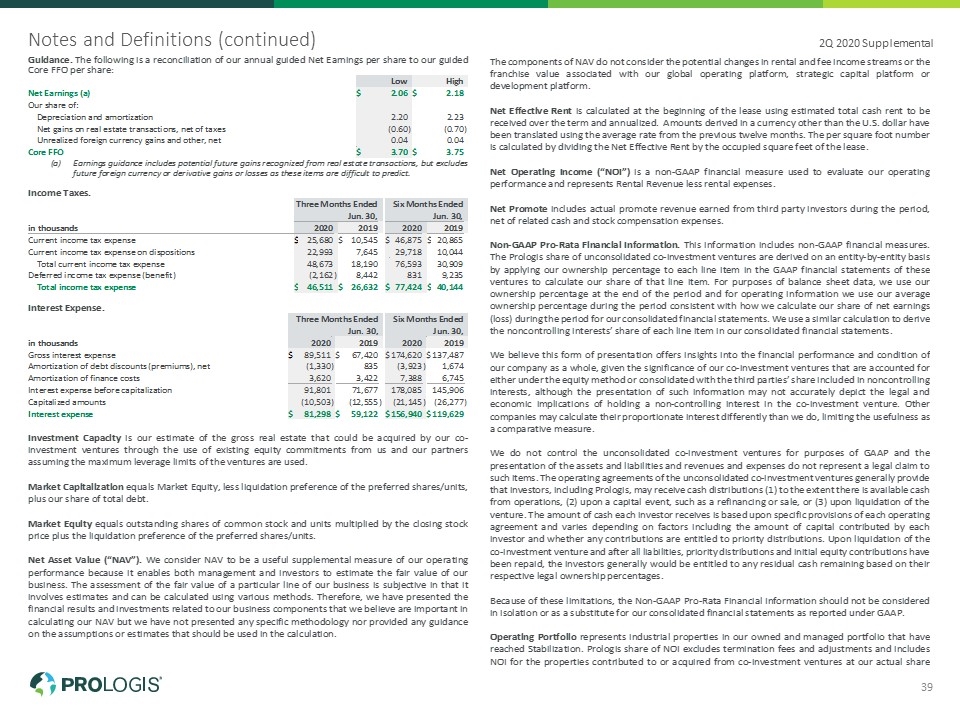
Notes and Definitions (continued) 2Q 2020 Supplemental 39
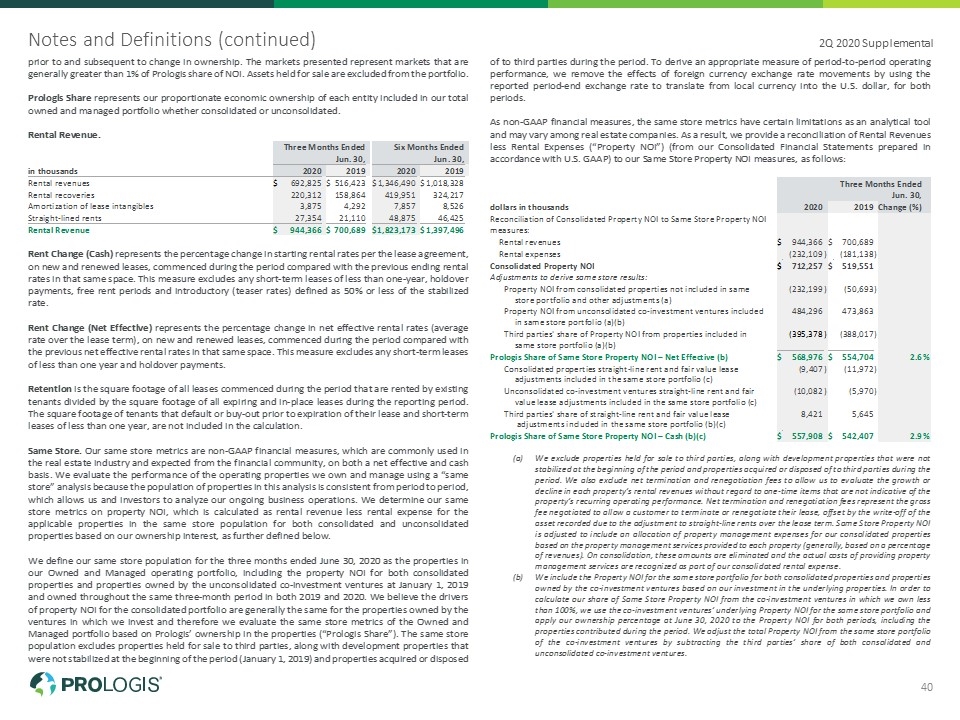
Notes and Definitions (continued) 2Q 2020 Supplemental 40
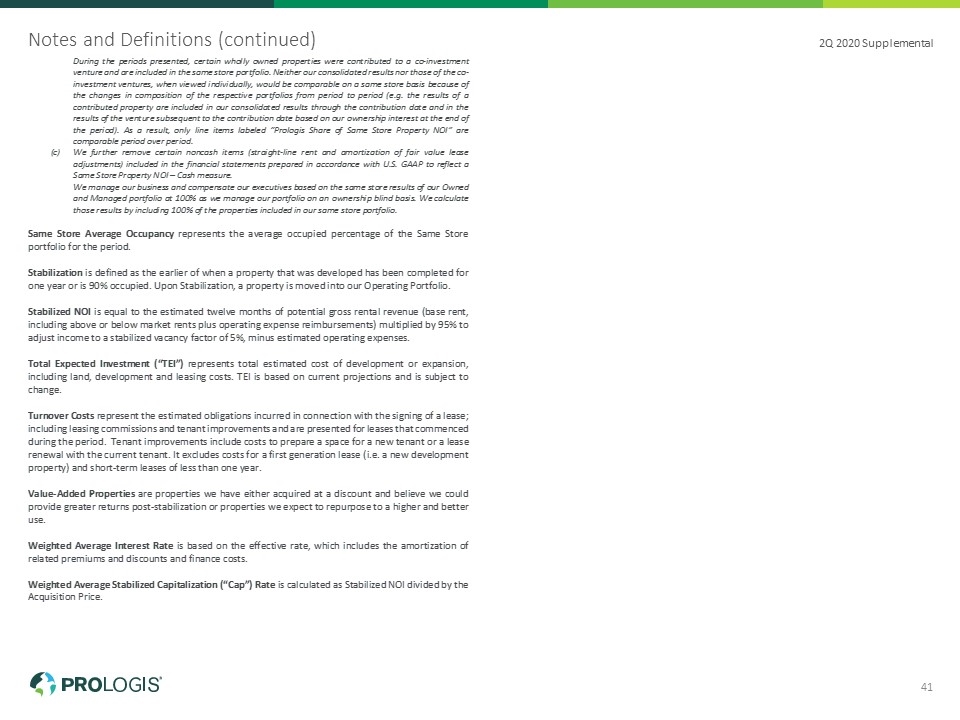
Notes and Definitions (continued) 2Q 2020 Supplemental 41

FOR IMMEDIATE RELEASE
Prologis Reports Second Quarter 2020 Earnings Results
SAN FRANCISCO (July 21, 2020) – Prologis, Inc. (NYSE: PLD), the global leader in logistics real estate, reported results for the second quarter of 2020.
Net earnings per diluted share was $0.54 for the quarter compared with $0.60 for the second quarter of 2019. Core funds from operations* per diluted share was $1.11 compared with $0.77 for the same period in 2019. The second quarter of 2020 included $0.23 of net promote income, while the same period in 2019 had no net promote income.
“Our results for the quarter were excellent, driven by strong operating performance and record promote income. I’m proud of our team who has worked tirelessly to navigate the current environment,” said Hamid R. Moghadam, chairman and CEO, Prologis. “While e-commerce is clearly a tailwind, demand is broad-based across a variety of categories—a trend we saw accelerate in June.”
OPERATING PERFORMANCE
|
|
|
|
Owned & Managed |
2Q20 |
Notes |
|
Period End Occupancy |
95.7% |
|
|
Leases Commenced |
42MSF |
39MSF operating portfolio and ~3MSF development portfolio. |
|
Retention |
80.9% |
Up 540bps from 1Q 2020 |
|
|
|
|
Prologis Share |
2Q20 |
Notes |
|
Net Effective Rent Change |
22.0% |
Led by U.S. at 27.7% |
|
Cash Rent Change |
9.6% |
|
|
Cash Same Store NOI* |
2.9% |
Impacted by 42bps of bad debt |
DEPLOYMENT ACTIVITY
|
|
|
Prologis Share |
2Q20 |
|
Building Acquisitions |
$8M |
|
Weighted avg stabilized cap rate |
7.6% |
|
Development Stabilizations |
$333M |
|
Estimated weighted avg yield |
6.7% |
|
Estimated weighted avg margin |
33.2% |
|
Estimated value creation |
$111M |
|
Development Starts |
$66M |
|
Estimated weighted avg margin |
48.0% |
|
Estimated value creation |
$32M |
|
% Build-to-suit |
100% |
|
Total Dispositions and Contributions |
$304M |
|
Weighted avg stabilized cap rate (excluding land and other real estate) |
6.0% |
1
BALANCE SHEET & LIQUIDITY
Prologis ended the quarter with $4.6 billion in liquidity, while debt as a percentage of total market capitalization was 20 percent. At June 30, the company’s unconsolidated co-investment ventures had liquidity of approximately $3.3 billion and a loan-to-value ratio of approximately 18 percent. The combined investment capacity of Prologis and its open-ended vehicles, at levels in line with their current credit ratings, is over $13 billion.
During the quarter, Prologis and its co-investment ventures completed $1.6 billion of debt activity at a weighted average rate of 1.8 percent and a weighted average term of almost 13 years. This activity excludes the previously announced €313 million principal amount of 2022 and 2024 notes tendered.
“While the credit markets were turbulent through much of the quarter, we again demonstrated our ability to raise very attractive debt across our co-investment ventures and global markets,” said Tim Arndt, treasurer, Prologis. “We issued over ¥40 billion of unsecured bonds in Japan for Prologis, raised $525 million of new private placement notes for USLF and completed a new €500 million green bond issuance in PELF. Our platform allows us to be agile and strategic when sourcing capital, even when there is significant dislocation.”
At quarter end, the company’s weighted average rate on its share of total debt was 2.3 percent with a weighted average remaining term of 9.1 years.
COMMUNITIES
Racial Justice: Prologis stands in solidarity with the Black community to end racial injustice, hatred and violence. To date, the Prologis Foundation has committed $1 million toward organizations engaged in the fight against systemic racism, with donations made to the Equal Justice Initiative, the NAACP Legal Defense and Educational Fund, the National Urban League, the Center for Policing Equity, Year Up and the Dream Corps.
COVID-19 Relief: In addition to the Prologis Foundation’s $5 million global relief fund to provide financial support to nonprofits and community-based organizations, the company has offered buildings and yard space to agencies and relief organizations through its Space for Good program. Year-to-date, Prologis has donated an additional $5.5 million of in-kind rent in 13 markets globally.
2020 GUIDANCE
“While the economic impact of COVID-19 remains unknown, the combination of what we see in our proprietary data, the pace of rent collections, and dialogue with our customers gives us a more positive outlook for the back half of the year,” said Thomas S. Olinger, chief financial officer, Prologis. “Year-over-year Core FFO growth at the midpoint, excluding promotes, is extremely strong, at over 12.5%, with leverage flat. Additionally, we continue to have significant dividend coverage of 1.6x and expect to generate free cash flow after dividends of $1 billion in 2020.”
2
2020 GUIDANCEJanuary 2020April 2020Current
Earnings (per diluted share)
|
|
|
|
|
Net Earnings |
$1.98 to $2.13 |
$1.81 to $1.88 |
$2.06 to $2.18 |
|
Core FFO* |
$3.67 to $3.75 |
$3.55 to $3.65 |
$3.70 to $3.75 |
Operations
|
|
|
|
|
Year-end occupancy |
96.0% to 97.0% |
94.5% to 96.0% |
95.0% to 96.0% |
|
Cash Same Store NOI* - Prologis share |
4.25% to 5.25% |
1.75% to 3.25%1 |
2.5% to 3.5%1 |
Capital Deployment – Prologis Share (in millions)
|
|
|
|
|
Development stabilizations |
$2,200 to $2,500 |
$1,900 to $2,200 |
$1,900 to $2,200 |
|
Development starts |
$2,000 to $2,400 |
$500 to $800 |
$800 to $1,200 |
|
Building acquisitions |
$500 to $700 |
$450 |
$500 to $600 |
|
Building contributions |
$600 to $900 |
$650 |
$700 to $900 |
|
Building and land dispositions |
$1,300 to $1,500 |
$250 |
$500 to $800 |
|
Realized Development gains |
$300 to $400 |
$280 |
$300 to $400 |
|
Net Proceeds (Uses) |
($600) to ($700) |
($50) to ($350) |
($100) |
Strategic Capital (in millions)
|
|
|
|
|
Strategic capital revenue,
excl promote revenue |
$350 to $360 |
$345 to $355 |
$360 to $370 |
|
Net promote income,
incl in Core FFO* range |
$115 |
$115 |
$150 |
G&A (in millions)
|
|
|
|
|
General & administrative expenses |
$275 to $285 |
$270 to $280 |
$265 to $275 |
|
|
1. |
At the midpoint, this includes an estimated 75 basis point decline in average occupancy and a total of 75 basis points of bad debt expense. |
|
|
|
* |
This is a non-GAAP financial measure. See the Notes and Definitions in our supplemental information for further explanation and a reconciliation to the most directly comparable GAAP measure. |
|
The earnings guidance described above includes potential gains recognized from real estate transactions but excludes any future or potential foreign currency or derivative gains or losses as our guidance assumes constant foreign currency rates. In reconciling from net earnings to Core FFO*, Prologis makes certain adjustments, including but not limited to real estate depreciation and amortization expense, gains (losses) recognized from real estate transactions and early extinguishment of debt, impairment charges, deferred taxes and unrealized gains or losses on foreign currency or derivative activity. The difference between the company's Core FFO* and net earnings guidance for 2020 relates predominantly to these items. Please refer to our second quarter Supplemental Information, which is available on our Investor Relations website at http://ir.prologis.com and on the SEC’s website at www.sec.gov for a definition of Core FFO* and other non-GAAP measures used by Prologis, along with reconciliations of these items to the closest GAAP measure for our results and guidance.
3
July 21, 2020, CALL DETAILS
The call will take place on Tuesday, July 21, 2020, at 9:00 a.m. PT/12:00 p.m. ET. To access a live broadcast of the call, please dial +1 (833) 968-2252 (toll-free from the United States and Canada) or +1 (778) 560-2807 (from all other countries) and enter conference code 6049156. A live webcast can be accessed from the Investor Relations section of www.prologis.com.
ABOUT PROLOGIS
Prologis, Inc. is the global leader in logistics real estate with a focus on high-barrier, high-growth markets. As of June 30, 2020, the company owned or had investments in, on a wholly owned basis or through co-investment ventures, properties and development projects expected to total approximately 963 million square feet (89 million square meters) in 19 countries. Prologis leases modern logistics facilities to a diverse base of approximately 5,500 customers principally across two major categories: business-to-business and retail/online fulfillment.
FORWARD-LOOKING STATEMENTS
The statements in this document that are not historical facts are forward-looking statements within the meaning of Section 27A of the Securities Act of 1933, as amended, and Section 21E of the Securities Exchange Act of 1934, as amended. These forward-looking statements are based on current expectations, estimates and projections about the industry and markets in which we operate as well as management's beliefs and assumptions. Such statements involve uncertainties that could significantly impact our financial results. Words such as "expects," "anticipates," "intends," "plans," "believes," "seeks," and "estimates," including variations of such words and similar expressions, are intended to identify such forward-looking statements, which generally are not historical in nature. All statements that address operating performance, events or developments that we expect or anticipate will occur in the future — including statements relating to rent and occupancy growth, development activity, contribution and disposition activity, general conditions in the geographic areas where we operate, our debt, capital structure and financial position, our ability to form new co-investment ventures and the availability of capital in existing or new co-investment ventures — are forward-looking statements. These statements are not guarantees of future performance and involve certain risks, uncertainties and assumptions that are difficult to predict. Although we believe the expectations reflected in any forward-looking statements are based on reasonable assumptions, we can give no assurance that our expectations will be attained and, therefore, actual outcomes and results may differ materially from what is expressed or forecasted in such forward-looking statements. Some of the factors that may affect outcomes and results include, but are not limited to: (i) national, international, regional and local economic and political climates; (ii) changes in global financial markets, interest rates and foreign currency exchange rates; (iii) increased or unanticipated competition for our properties; (iv) risks associated with acquisitions, dispositions and development of properties; (v) maintenance of real estate investment trust status, tax structuring and changes in income tax laws and rates; (vi) availability of financing and capital, the levels of debt that we maintain and our credit ratings; (vii) risks related to our investments in our co-investment ventures, including our ability to establish new co-investment ventures; (viii) risks of doing business internationally, including currency risks; (ix) environmental uncertainties, including risks of natural disasters; (x) risk related to the current coronavirus pandemic, and (xi) those additional factors discussed in reports filed with the Securities and Exchange Commission by us under the heading "Risk Factors." We undertake no duty to update any forward-looking statements appearing in this document except as may be required by law.
CONTACTS
Investors: Tracy Ward, +1 415 733 9565, [email protected], San Francisco
Media: Melissa Sachs, +1 415 733 9597, [email protected], San Francisco
