Document
false0000785786 0000785786 2020-04-22 2020-04-22


UNITED STATES
SECURITIES AND EXCHANGE COMMISSION
Washington, D.C. 20549
____________________________________________________________________________________________________________________________________

FORM 8-K
CURRENT REPORT
Pursuant to Section 13 or 15(d) of the Securities Exchange Act of 1934
____________________________________________________________________________________________________________________________________
Date of Report (Date of earliest event reported): April 22, 2020
____________________________________________________________________________________________________________________________________
plxslogo8ka05.gif
PLEXUS CORP.
(Exact name of registrant as specified in its charter)
____________________________________________________________________________________________________________________________________
Wisconsin
 
001-14423
 
39-1344447
(State or other jurisdiction
 of incorporation)
 
(Commission
File Number)
 
(IRS Employer
Identification No.)
One Plexus Way
Neenah, Wisconsin 54957
(Address of principal executive offices) (Zip Code)
Telephone Number (920969-6000
(Registrant’s telephone number, including Area Code) 

Check the appropriate box below if the Form 8-K filing is intended to simultaneously satisfy the filing obligation of the registrant under any of the following provisions (see General Instruction A.2. below):
Written communications pursuant to Rule 425 under the Securities Act (17 CFR 230.425)
Soliciting material pursuant to Rule 14a-12 under the Exchange Act (17 CFR 240.14a-12)
Pre-commencement communications pursuant to Rule 14d-2(b) under the Exchange Act (17 CFR 240.14d-2(b))
Pre-commencement communications pursuant to Rule 13e-4(c) under the Exchange Act (17 CFR 240.13e-4(c))
Securities registered pursuant to Section 12(b) of the Act:
Title of each class
Trading Symbol
Name of each exchange on which registered
Common Stock, $0.01 par value
PLXS
The Nasdaq Global Select Market
Indicate by check mark whether the registrant is an emerging growth company as defined in Rule 405 of the Securities Act of 1933 (§230.405 of this chapter) or Rule 12b-2 of the Securities Exchange Act of 1934 (§240.12b-2 of this chapter).
Emerging growth company    
If an emerging growth company, indicate by check mark if the registrant has elected not to use the extended transition period for complying with any new or revised financial accounting standards provided pursuant to Section 13(a) of the Exchange Act.    


Item 2.02    Results of Operations and Financial Condition.

On April 22, 2020, Plexus Corp. (“we” or the “Company”) announced results for the fiscal second quarter ended April 4, 2020. A copy of the Company’s related press release is furnished as Exhibit 99.1 to this report. A copy of the investor presentation that Plexus will present during the Company’s earnings call is furnished as Exhibit 99.2 to this report.

Item 8.01    Other Events.

Recent Developments

We have been actively monitoring the global outbreak and spread of COVID-19 and taking steps to mitigate the potential risks to us posed by its spread and related circumstances and impacts. The following is a summary of a variety of the actions we have taken and continue to take.

Governmental Actions
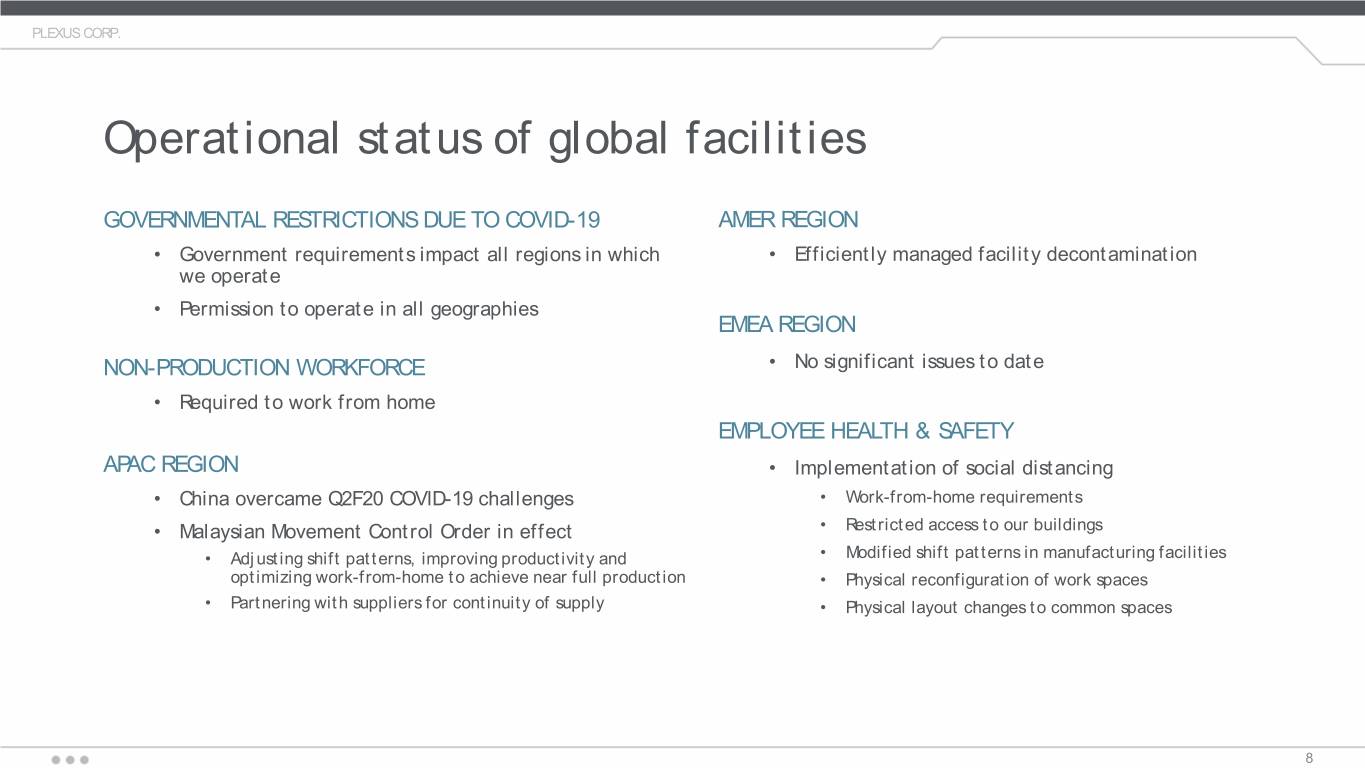
In all geographies in which we operate, regulatory authorities have imposed restrictions regarding the conduct of business and people movement. With the exception of our operations in Malaysia, we have been able to continue our operations because of the essential nature of the products we develop and manufacture. In China, at the onset of the COVID-19 outbreak in that country during our second fiscal quarter, our operations were significantly impacted for several weeks due to quarantines, travel restrictions, and other factors affecting us and our suppliers. In Malaysia, the government announced a Movement Control Order in March that limited our workforce to approximately 40% of previous levels. This order remains in effect until at least April 28; however, through an increase of this limitation by the Malaysian government to 50% and a combination of adjustments in our shift patterns, productivity improvements, and optimizing employee capability to work from home, we are currently near pre-COVID-19 production capacity levels in Malaysia.
In response to the pandemic, many governments have also recently enacted legislation designed to support businesses and workers impacted by COVID-19. While we will seek benefits under this legislation where available, we do not expect that such benefits will have a material impact on our operations and financial condition. We are also monitoring benefits available to our employees under this legislation, including government assistance for employees unable to work for COVID-19 reasons. We seek to understand whether these benefits apply to our employees, how they support their best interests, and how they may impact our business now and in the future as we return to more normalized operations. In turn, we have also evaluated and adjusted our employee compensation and leave practices to support certain needs of our employees and to protect them from risk of infection.

Workplace Safety
The health and safety of our employees is a priority for us. We have progressively implemented measures to safeguard our employees from COVID-19 infection and exposure, in alignment with guidelines established by the Centers for Disease Control. They consist of policies, procedures, protocols, and guidance related to, among other things, COVID-19 symptom awareness, effective hygiene practices, travel restrictions, visitor restrictions, social distancing, face covering expectations, temperature and health screening, work-from-home requirements, enhanced workplace cleaning, and large-scale decontamination.

Supply Chain
Our suppliers are also experiencing the impact of COVID-19 on their businesses. Because of our ability to continue to operate under government rules relating to essential or permitted businesses and services, our


suppliers also have generally been permitted to continue conducting business to the extent they support our work. However, our suppliers also have had challenges in maintaining an adequate workforce, securing materials from their own suppliers, implementing workplace safety practices, and have instituted periodic closures as a result of COVID-19. We are taking steps to validate our suppliers’ ability to deliver to us on time, which may also be affected by the impact of COVID-19 on their own financial condition.

Customers
Likewise, we remain in close contact with our customers to understand the impact of COVID-19 on their business and the resulting potential impact on our business. COVID-19 has introduced volatility and uncertainty to all of our customers, which has resulted in the need for us to react and respond. While COVID-19 has negatively impacted some of our customers and, therefore, our business with them, we have experienced opportunities with other customers, particularly in our Healthcare/Life Sciences Sector, to manufacture products in high demand to combat the effects of COVID-19.

Governance
We are conducting regular leadership calls with global and regional leaders to review the effectiveness of employee safety measures, monitor the spread of the virus in the geographies in which we operate, discuss the evolving availability of testing and therapeutic medicine, and assess the impact of the pandemic on our business. These meetings also serve to identify actions we must take to manage COVID-19 risks or opportunities on an enterprise-wide or on a regional basis, and to ensure that progress is made on actions to which we have previously committed. Moreover, through formal meetings and other communications, we are in regular contact with our Board of Directors and Committees of the Board of Directors on COVID-19 risks and opportunities to ensure they remain informed, can perform their duties of risk oversight, and to gain their valuable business and governance perspectives. Most importantly, we have been communicating with all employees at least weekly regarding, among other things, the steps we are taking to safeguard their health and safety, the flexible work and pay arrangements we have instituted as result of COVID-19, and the progress we are making in managing the effects of COVID-19 on our business.

Risk Factor Update
In light of the evolving impacts associated with the Covid-19 outbreak, we are supplementing as set forth below the risk factors disclosed in “Item 1A - Risk Factors” of its Annual Report on Form 10-K for the fiscal year ended September 28, 2019 and Quarterly Report on Form 10-Q for the fiscal quarter ended January 4, 2020.
Our financial condition and results of operations for fiscal year 2020 and beyond may be materially adversely affected by the ongoing coronavirus (COVID-19) pandemic.

The full extent to which the COVID-19 outbreak will impact our business and operating results will depend on future developments that are highly uncertain and cannot be accurately predicted, including new medical and other information that may emerge concerning COVID-19 and the actions by governmental entities or others to contain it or treat its impact. 
The COVID-19 pandemic poses the risk that we or our employees, suppliers, customers and others may be restricted or prevented from conducting business activities for indefinite or intermittent periods of time, including as a result of employee health and safety concerns, shutdowns, shelter in place orders, travel restrictions and other actions and restrictions that may be prudent or required by governmental authorities. For example, in China, at the onset of the COVID-19 outbreak in that country during our second fiscal quarter, our operations were significantly impacted for several weeks due to quarantines, travel restrictions,


and other factors affecting us and our suppliers. In addition, we experienced a temporary reduction of our operating capacity in Malaysia during our second quarter of fiscal 2020 as a result of government-mandated actions to control the spread of COVID-19. Finally, while our facilities have been classified as essential or otherwise permitted to operate in jurisdictions in which facility closures have been mandated, we can give no assurance that this will not change in the future or that we will continue to be permitted to conduct business in each of the jurisdictions in which we operate.
Additionally, we have modified our business practices for the continued health and safety of our employees. We may take further actions, or be required to take further actions, that are in the best interests of our employees. Our suppliers and customers have also implemented such measures, which has resulted in, and we expect it will continue to result in, disruptions or delays and higher costs. The implementation of health and safety practices by us, our suppliers, or our customers could impact customer demand, supplier deliveries, our productivity, and costs, which could have a material adverse impact on our business, financial condition, or results of operations.
While we currently believe we have ample liquidity to manage the financial impact of COVID-19, we can give no assurance that this will continue to be the case if the impact of COVID-19 is prolonged or if there is an extended impact on us or the economy generally. Further, the impacts of COVID-19 have caused significant uncertainty and volatility in the credit markets. If our liquidity or access to capital becomes significantly constrained, or if costs of capital increase significantly due to the impact of COVID-19 as result of volatility in the capital markets, a reduction in our creditworthiness or other factors, then our financial condition, results of operations and cash flows could be materially adversely affected.
Our management of the impact of COVID-19 has and will continue to require significant investment of time from our management and employees, as well as resources across our enterprise. The focus on managing and mitigating the impacts of COVID-19 on our business may cause us to divert or delay the application of our resources toward existing or new initiatives or investments, which could have a material adverse impact on our results of operations.
The foregoing and other continued disruptions to our business as a result of COVID-19 has had and could continue to have a material adverse effect on our business, results of operations, financial condition during 2020 and beyond.

Item 9.01    Financial Statements and Exhibits

(d) The following exhibits are filed herewith:

Exhibit Number
 
Description
99.1
 
99.2
 
104
 
Cover Page Interactive Data File (the cover page tags are embedded within the Inline XBRL document)


* * * * *
SIGNATURES
Pursuant to the requirements of the Securities Exchange Act of 1934, the Registrant has duly caused this report to be signed on its behalf by the undersigned hereunto duly authorized.

Date: April 22, 2020
 
PLEXUS CORP.
 
 
(Registrant)
 
 
By: /s/ Patrick J. Jermain
 
 
Patrick J. Jermain
 
 
Executive Vice President and Chief Financial Officer


plexuslogopra07.gif
Plexus Announces Fiscal Second Quarter Financial Results
Revenue of $767 million for the fiscal second quarter of 2020
GAAP diluted EPS of $0.43
Non-GAAP adjusted diluted EPS of $0.61, excluding $0.18 per share related to restructuring activities, net of tax, as a result of the previously announced closure of our Boulder Design Center
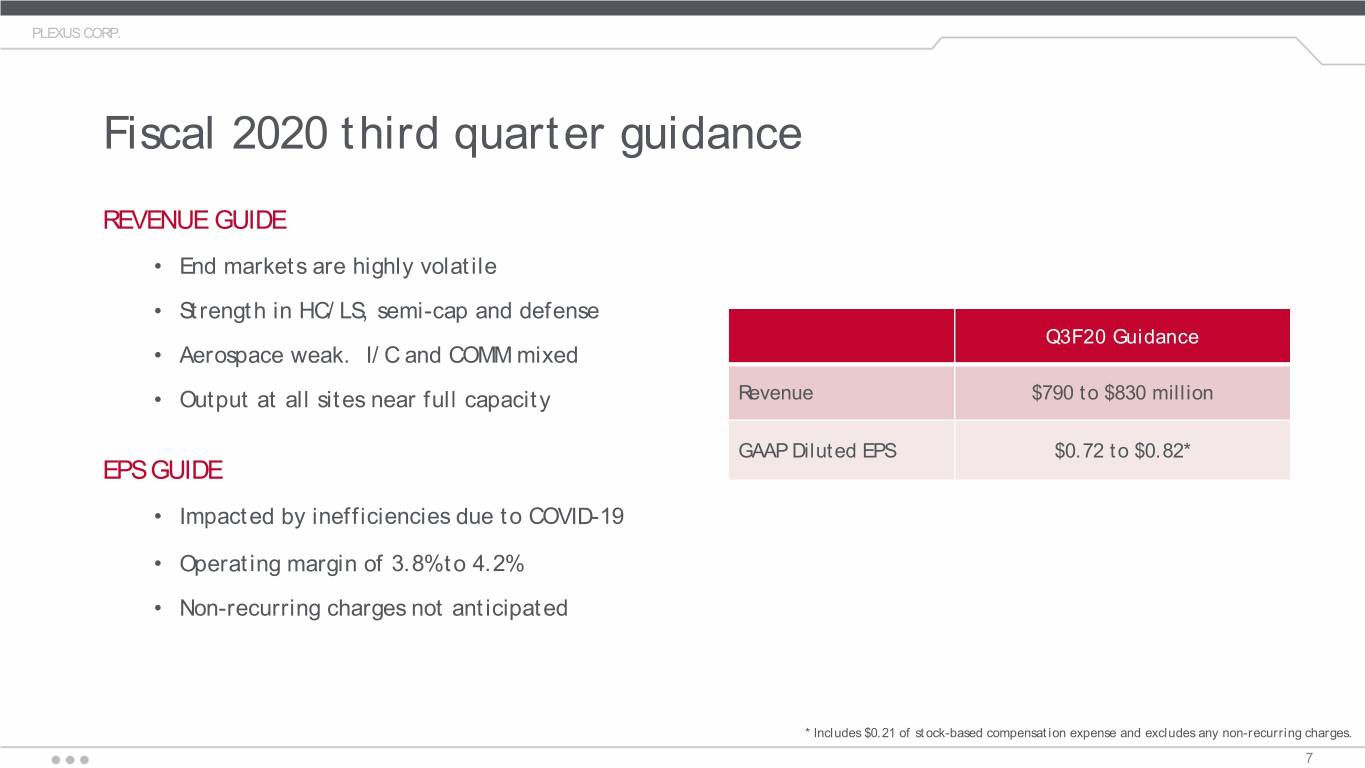
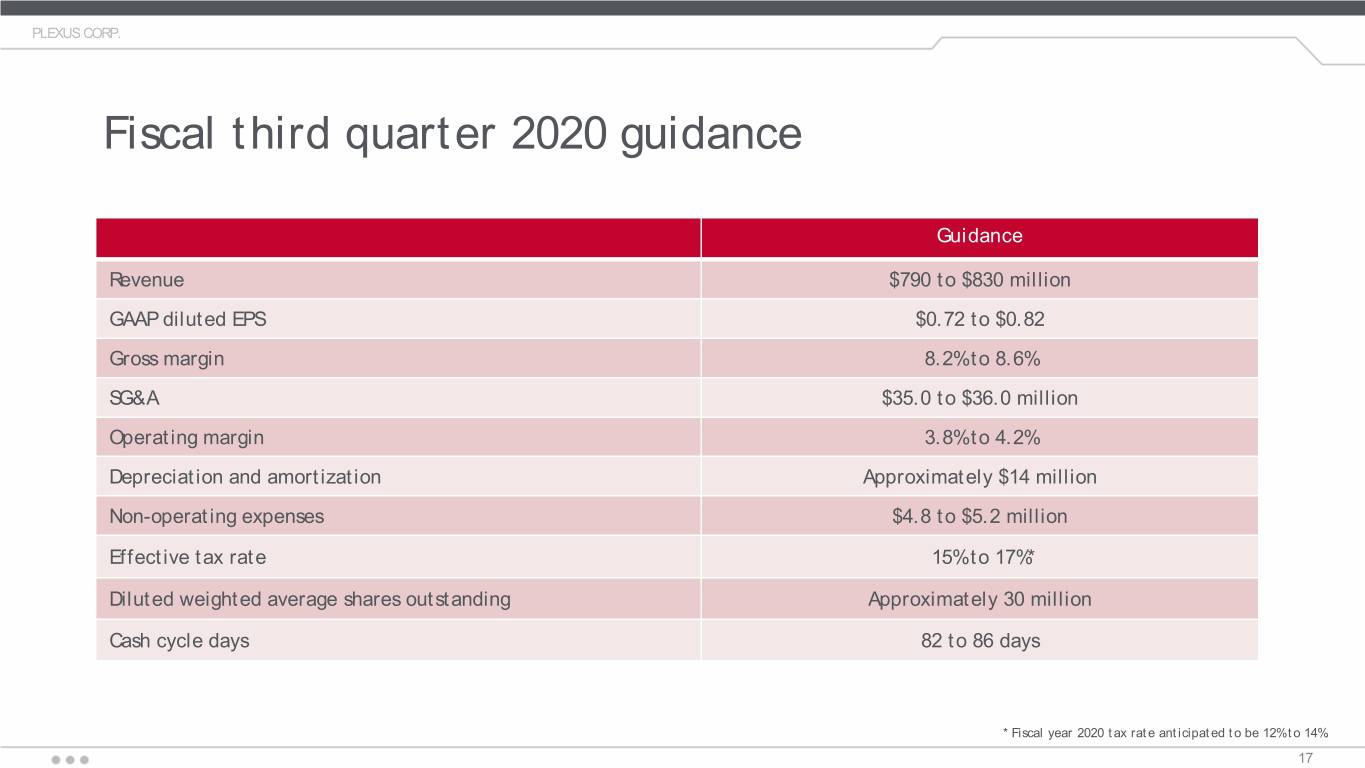
Initiates fiscal third quarter 2020 revenue guidance of $790 to $830 million with GAAP diluted EPS of $0.72 to $0.82, excluding unforeseen material impacts relating to COVID-19

NEENAH, WI – April 22, 2020 - Plexus (NASDAQ: PLXS) today announced financial results for its fiscal second quarter ended April 4, 2020, and guidance for its fiscal third quarter ending July 4, 2020.
 
 
Three Months Ended
 
 
Apr 4, 2020
 
Jul 4, 2020
 
 
Q2F20 Results (3)
 
Q3F20 Guidance
Summary GAAP Items


Revenue (in millions)

$767

 
$790 to $830
Operating margin
2.2
%
 
3.8% to 4.2%
Diluted EPS (1)

$0.43

 
$0.72 to $0.82


Summary Non-GAAP Items (2)


Adjusted operating margin
3.0
%
 
 
Adjusted diluted EPS (1)

$0.61


Return on invested capital (ROIC)
11.4
%
 
 
Economic return
2.6
%


(1)
Includes stock-based compensation expense of $0.19 for Q2F20 results and $0.21 for Q3F20 guidance.
(2)
Excludes $0.18 per share related to restructuring activities, net of tax, as a result of the previously announced closure of our Boulder Design Center. Refer to Non-GAAP Supplemental Information in Tables 1 and 2 for non-GAAP financial measures and a reconciliation to GAAP.
(3)
On March 2 and March 23, 2020, Plexus announced updates to its fiscal second quarter revenue outlook. The Company stated that it expected its fiscal second quarter revenue to fall below its previously issued guidance range as a result of COVID-19 impacts.
Fiscal Second Quarter 2020 Information
Won 36 manufacturing programs during the quarter representing $248 million in annualized revenue when fully ramped into production
Trailing four quarter wins total $844 million in annualized revenue when fully ramped into production
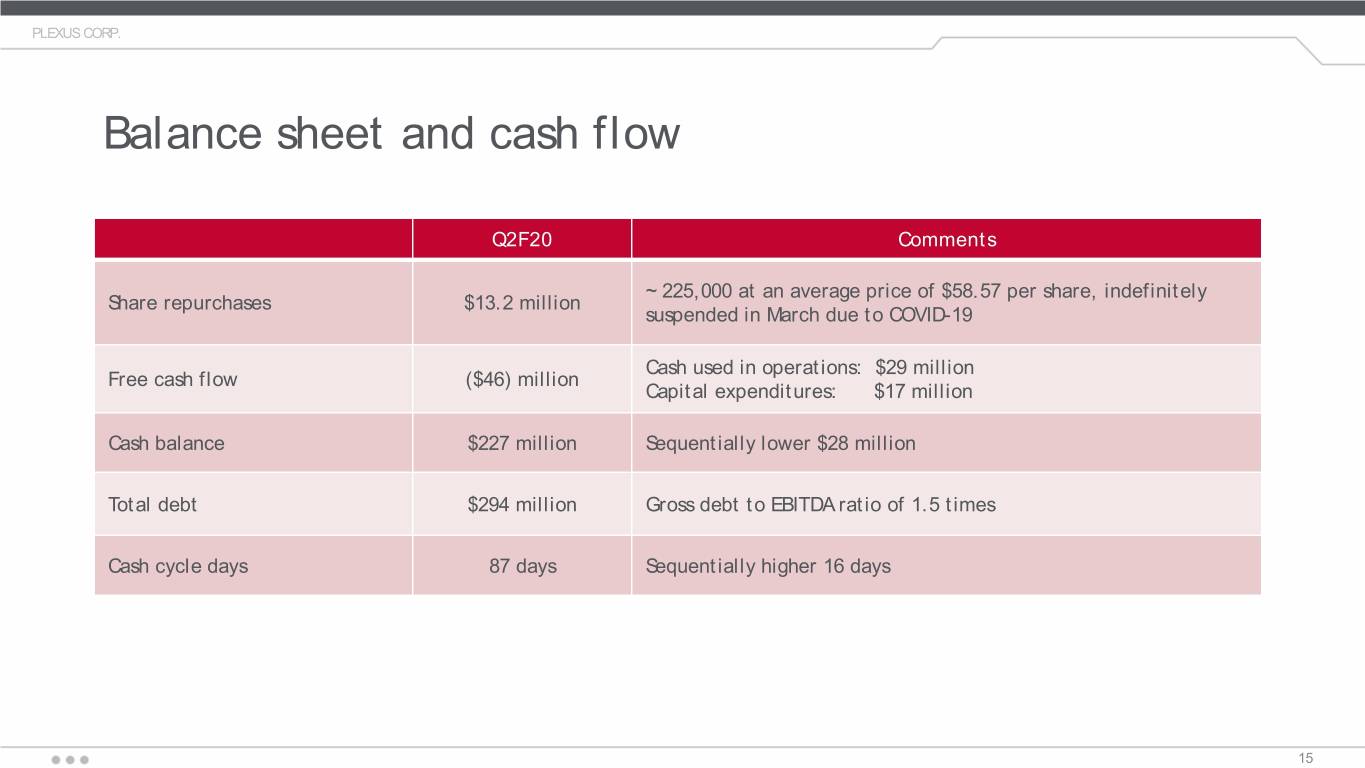
Purchased $13.2 million of our shares at an average price of $58.57 per share under our existing share repurchase program, which program we suspended indefinitely in March due to the COVID-19 pandemic


1


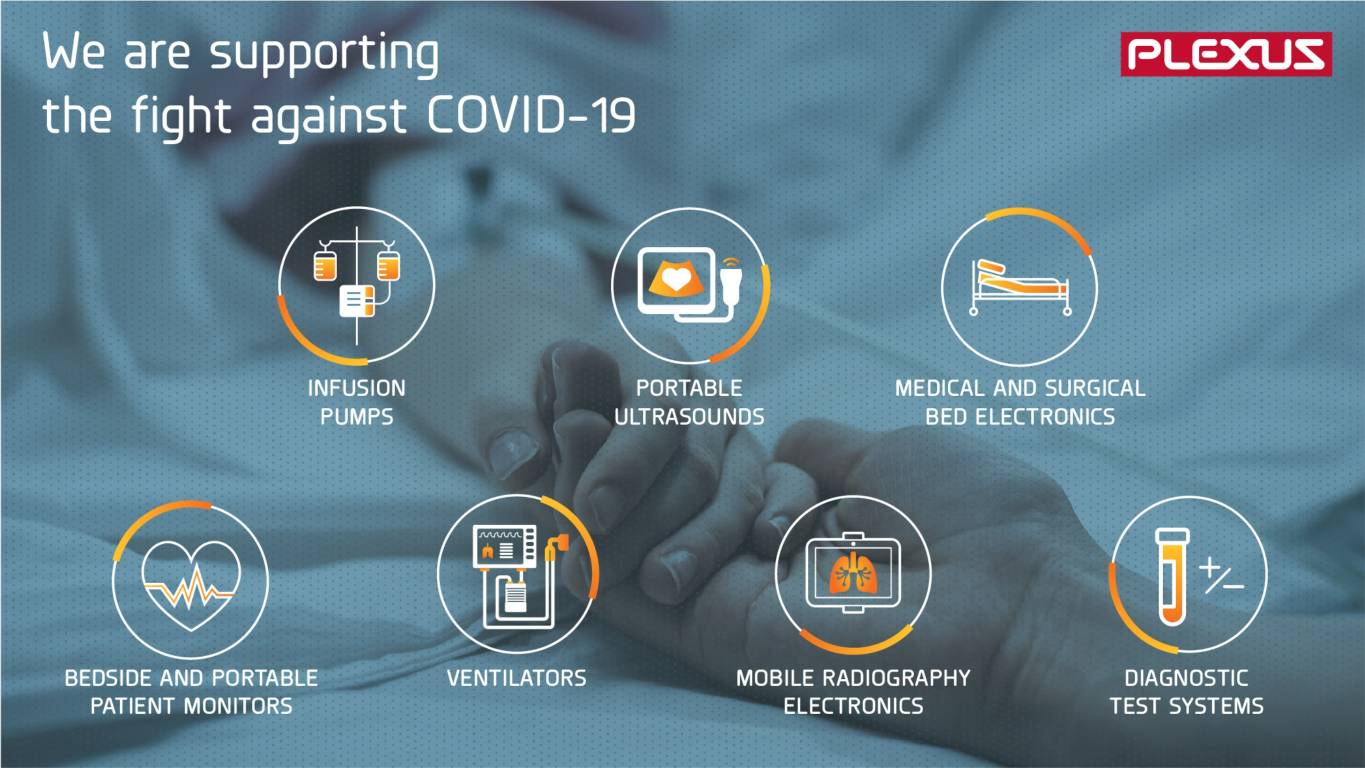
Todd Kelsey, President and CEO, commented, “We achieved fiscal second quarter revenue of $767 million and adjusted diluted EPS of $0.61, excluding $0.18 due to the previously announced closure of our Boulder Design Center. While our results were impacted by the COVID-19 outbreak, our teams demonstrated their ability and resolve to mitigate the challenges and complexities of COVID-19. We remain committed to delivering for our customers and helping to create the products that build a better world. These include critical medical products being used by healthcare workers on the frontline of the battle against COVID-19 and consist of: infusion pumps, portable ultrasounds, hospital bed electronics, portable patient monitors, ventilators, mobile x-ray electronics and diagnostic test systems. In addition to supporting the fight against COVID-19, Plexus continues to produce products that support the essential infrastructure needs of our communities."

Patrick Jermain, Executive Vice President and CFO, commented, “Despite the precipitous onset of COVID-19, we delivered a return on invested capital of 11.4% in the quarter. This generated an economic return of 260 basis points above our weighted average cost of capital, creating solid shareholder value. Further, we believe that Plexus is well-positioned with a strong balance sheet as we face the future challenges presented by COVID-19. As of April 4, 2020, cash totaled $227 million while debt totaled $294 million. In addition, we have significant funding availability through our revolving credit facility should future needs arise.”

Mr. Kelsey concluded, “We are dedicated to the health and safety of our team members. As such, we continue to invest in our policies and protocols to operate in the safest manner possible. As we look forward to our fiscal third quarter, we expect to deliver revenue in the range of $790 to $830 million and GAAP diluted EPS of $0.72 to $0.82. In providing this guidance, we have taken into consideration known constraints on the global supply chain, workforce challenges, as well as the potential operational inefficiencies that could occur due to COVID-19; however, our guidance assumes no large scale closures of our facilities, or those of our suppliers or customers, due to COVID-19, nor does it assume that the COVID-19 outbreak will materially impact end markets beyond what has already occurred. We commit to providing timely and transparent updates should negative material changes to our revenue and EPS expectations occur within the quarter.”


2


Quarterly Comparison
Three Months Ended
 
Apr 4, 2020
 
Jan 4, 2020
 
Mar 30, 2019
(in thousands, except EPS)
Q2F20
 
Q1F20
 
Q2F19
Revenue
$
767,364

 
$
852,409

 
$
789,051

Gross profit
61,445

 
79,190

 
70,636

Operating income
17,209

 
39,934

 
33,174

Net income
12,926

 
31,006

 
24,758

Diluted EPS
0.43

 
1.03

 
0.79

Adjusted net income (1)
18,299

 
30,192

 
24,758

Adjusted diluted EPS (1)
0.61

 
1.00

 
0.79


Gross margin
8.0
%
 
9.3
%
 
9.0
%
Operating margin
2.2
%
 
4.7
%
 
4.2
%
Adjusted operating margin (1)
3.0
%
 
4.7
%
 
4.2
%


ROIC (1)
11.4
%
 
14.7
%
 
13.3
%
Economic return (1)
2.6
%
 
5.9
%
 
4.3
%


(1) Refer to Non-GAAP Supplemental Information in Tables 1 and 2 for non-GAAP financial measures discussed and/or disclosed in this release, such as adjusted operating margin, adjusted net income, adjusted diluted EPS, ROIC and economic return, and a reconciliation of these measures to GAAP.


3


Business Segment and Market Sector Revenue
The Company measures operational performance and allocates resources on a geographic segment basis. The Company also reports revenue based on the market sector breakout set forth in the table below, which reflects the Company’s market sector focused strategy. Top 10 customers comprised 56% of revenue during the fiscal second quarter, up two percentage points from the fiscal first quarter of 2020.

Business Segments ($ in millions)
Three Months Ended
 
Apr 4, 2020
 
Jan 4, 2020
 
Mar 30, 2019
 
Q2F20
 
Q1F20
 
Q2F19
Americas
$
334

 
$
353

 
$
364

Asia-Pacific
388

 
451

 
378

Europe, Middle East, and Africa
74

 
85

 
76

Elimination of inter-segment sales
(29)

 
(37)

 
(29)

Total Revenue
$
767

 
$
852

 
$
789


Market Sectors ($ in millions)
Three Months Ended
 
Apr 4, 2020
 
Jan 4, 2020
 
Mar 30, 2019
 
Q2F20
 
Q1F20
 
Q2F19
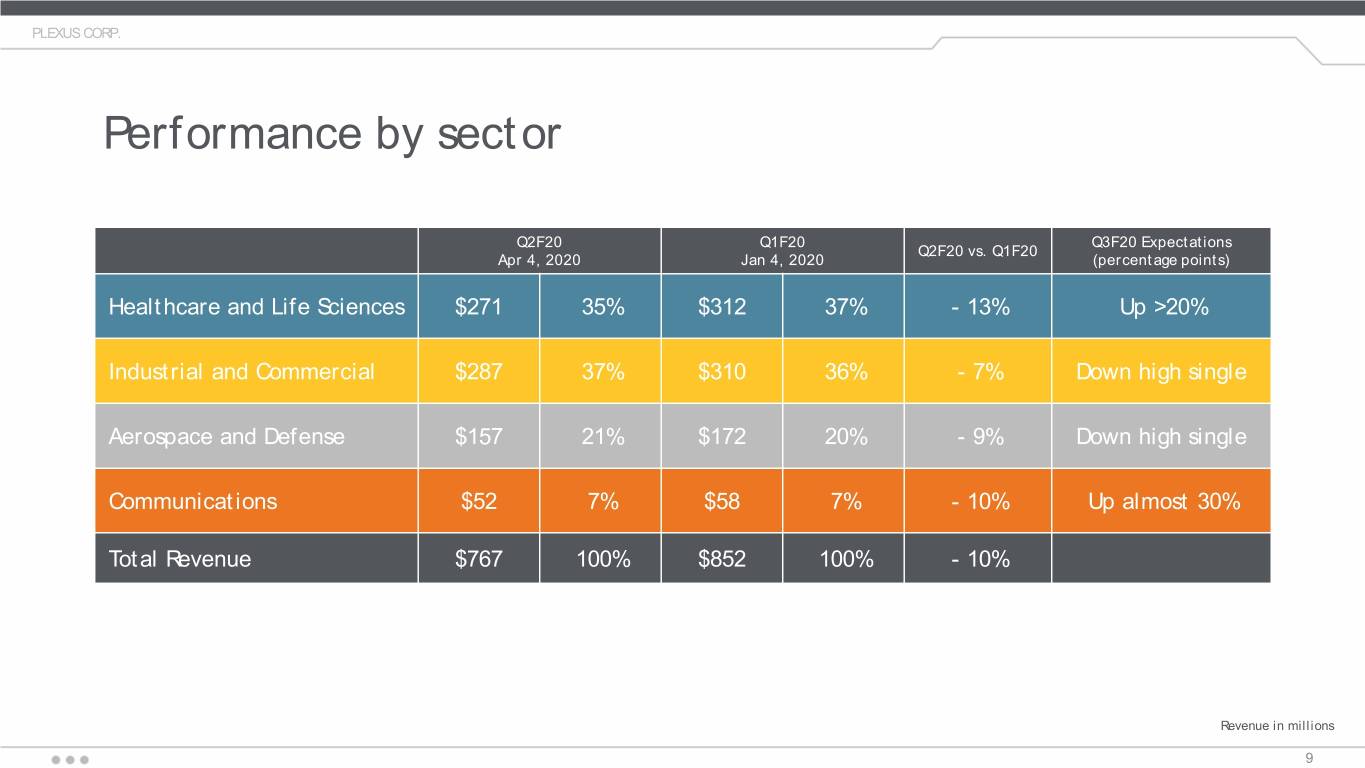
Healthcare/Life Sciences
$
271

35
%
 
$
312

37
%
 
$
300

38
%
Industrial/Commercial
287

37
%
 
310

36
%
 
250

32
%
Aerospace/Defense
157

21
%
 
172

20
%
 
140

18
%
Communications
52

7
%
 
58

7
%
 
99

12
%
Total Revenue
$
767


$
852


$
789


4


Non-GAAP Supplemental Information
Plexus provides non-GAAP supplemental information, such as ROIC, economic return, and free cash flow, because such measures are used for internal management goals and decision making, and because they provide management and investors with additional insight into financial performance. In addition, management uses these and other non-GAAP measures, such as adjusted operating income, adjusted operating margin, adjusted net income and adjusted diluted EPS, to provide a better understanding of core performance for purposes of period-to-period comparisons. Plexus believes that these measures are also useful to investors because they provide further insight by eliminating the effect of non-recurring items that are not reflective of continuing operations.  For a full reconciliation of non-GAAP measures to comparable GAAP measures, please refer to the attached Non-GAAP Supplemental Information Tables.

ROIC and Economic Return
ROIC for the fiscal second quarter was 11.4%. The Company defines ROIC as tax-effected annualized adjusted operating income divided by average invested capital over a three-quarter period for the fiscal second quarter. Invested capital is defined as equity plus debt and operating lease liabilities, less cash and cash equivalents. The Company’s weighted average cost of capital for fiscal 2020 is 8.8%. ROIC for the fiscal second quarter less the Company’s weighted average cost of capital resulted in an economic return of 2.6%.

Free Cash Flow
The Company defines free cash flow as cash flows provided by operations less capital expenditures. For the three months ended April 4, 2020, cash flows used by operations was $29.3 million, less capital expenditures of $17.0 million, resulting in negative free cash flow of $46.3 million.

Cash Cycle Days
Three Months Ended
 
Apr 4, 2020
Q2F20
 
Jan 4, 2020
Q1F20
 
Mar 30, 2019
Q2F19
Days in Accounts Receivable
55
 
49
 
51
Days in Contract Assets
13
 
12
 
10
Days in Inventory
99
 
87
 
102
Days in Accounts Payable
(62)
 
(61)
 
(61)
Days in Cash Deposits
(18)
 
(16)
 
(16)
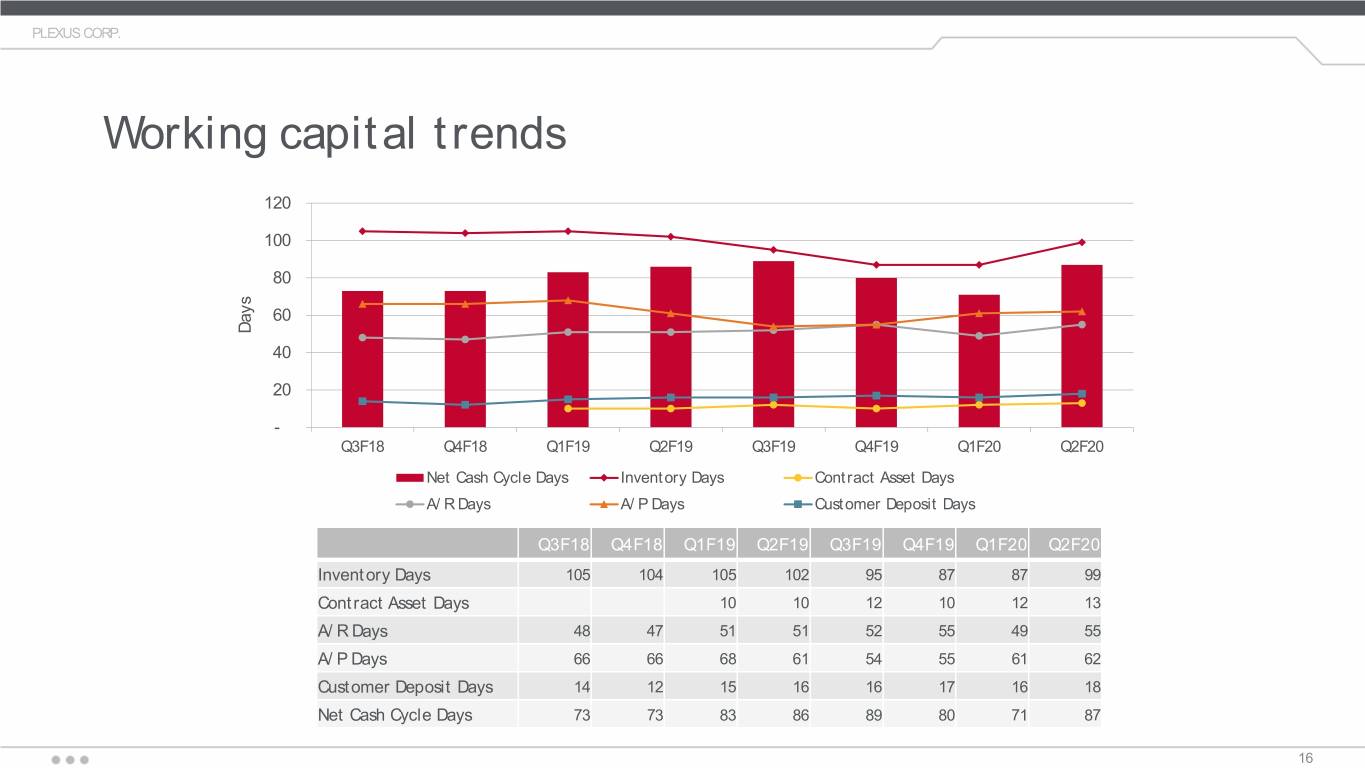
Annualized Cash Cycle *
87
 
71
 
86
* We calculate cash cycle as the sum of days in accounts receivable, days in contract assets and days in inventory, less days in accounts payable and days in cash deposits.


5


Conference Call and Webcast Information
What:   
Plexus Fiscal 2020 Q2 Earnings Conference Call and Webcast
When:   
Thursday, April 23, 2020 at 8:30 a.m. Eastern Time
Where:    
Participants are encouraged to join the live webcast at the investor relations section of the Plexus website, https://plexus.gcs-web.com/events-and-presentations/upcoming-events, where a slide presentation reviewing fiscal second quarter 2020 results will also be made available ahead of the conference call.

Conference call at +1.866.922.5180 with passcode: 2296280
Replay:   
The webcast will be archived on the Plexus website and available via telephone replay at +1.855.859.2056 or +1.404.537.3406 with passcode: 2296280
Investor and Media Contact
Heather Beresford
+1.920.751.3612
[email protected]
About Plexus
Since 1979, Plexus has been partnering with companies to create the products that build a better world.  We are a team of over 19,000 individuals who are dedicated to providing global Design and Development, Supply Chain Solutions, New Product Introduction, Manufacturing, and Aftermarket Services.  Plexus is a global leader that specializes in serving customers in industries with highly complex products and demanding regulatory environments.  Plexus delivers customer service excellence to leading global companies by providing innovative, comprehensive solutions throughout the product’s lifecycle.  For more information about Plexus, visit our website at www.plexus.com.
Safe Harbor and Fair Disclosure Statement
The statements contained in this press release that are guidance or which are not historical facts (such as statements in the future tense and statements including believe, expect, intend, plan, anticipate, goal, target and similar terms and concepts), including all discussions of periods which are not yet completed, are forward-looking statements that involve risks and uncertainties. These risks and uncertainties include the evolving effect, which may intensify, of COVID-19 on our employees, customers, suppliers, and logistics providers, including the impact of governmental actions being taken to curtail the spread of the virus. Other risks and uncertainties include, but are not limited to: the risk of customer delays, changes, cancellations or forecast inaccuracies in both ongoing and new programs; the lack of visibility of future orders, particularly in view of changing economic conditions; the economic performance of the industries, sectors and customers we serve; the effects of shortages and delays in obtaining components as a result of economic cycles, natural disasters or otherwise; the effects of tariffs, trade disputes, trade agreements and other trade protection measures; the effects of the volume of revenue from certain sectors or programs on our margins in particular periods; our ability to secure new customers, maintain our current customer base and deliver product on a timely basis; the risks of concentration of work for certain customers; the particular risks relative to new or recent customers, programs or services, which risks include customer and other delays, start-up costs, potential inability to execute, the establishment of appropriate terms of agreements, and the lack of a track record of order volume and timing; the effects of start-up costs of new programs and facilities or the costs associated with the closure or consolidation of facilities; possible unexpected costs and operating disruption in transitioning programs, including transitions between Company facilities; the risk that new program wins and/or customer demand may not result in the expected revenue or profitability; the fact that customer orders may not lead to long-term relationships; our ability to manage successfully and execute a complex business model characterized by high product mix and demanding quality, regulatory, and other requirements; the risks associated with excess and obsolete inventory, including the risk that inventory purchased on behalf of our customers may not be consumed or otherwise paid for by the customer, resulting in an inventory write-off; risks related to information technology systems and data security; the ability to realize anticipated savings from restructuring or similar actions, as well as the adequacy of related charges as compared to actual expenses; increasing regulatory and compliance requirements; the effects of U.S. Tax Reform and of related foreign jurisdiction tax developments; current or potential future barriers to the repatriation of funds that are currently held outside of the United States as a result of actions taken by other countries or otherwise; the potential effects of jurisdictional results on our taxes, tax rates, and our ability to use deferred tax assets and net operating losses; the weakness of areas of the global economy; the effect of changes in the pricing and margins of products; raw materials and component cost fluctuations; the potential effect of fluctuations in the value of the currencies in which we transact business; the effects of changes in economic conditions, political conditions and tax matters in the United States and in the other countries in which we do business (including as a result of the United Kingdom’s pending exit from the European Union); the potential effect of other world or local events or other events outside our control (such as changes in energy prices, terrorism and weather events); the impact of increased competition; an inability to successfully manage human capital; changes in financial accounting standards; and other risks detailed herein and in our other Securities and Exchange Commission filings, particularly in Risk Factors in our fiscal 2019 Form 10-K.

6


PLEXUS CORP. AND SUBSIDIARIES
CONDENSED CONSOLIDATED STATEMENTS OF OPERATIONS
(in thousands, except per share data)
(unaudited)


Three Months Ended
 
Six Months Ended
 
Apr 4,
 
Mar 30
 
Apr 4,
 
Mar 30
 
2020
 
2019
 
2020
 
2019
Net sales
$
767,364

 
$
789,051

 
$
1,619,773

 
$
1,554,595

Cost of sales
705,919

 
718,415

 
1,479,138

 
1,411,576

Gross profit
61,445

 
70,636

 
140,635

 
143,019

Operating expenses


Selling and administrative expenses
38,233

 
37,462

 
77,489

 
72,894

Restructuring and impairment charges
6,003


6,003


Operating income
17,209

 
33,174

 
57,143

 
70,125

Other income (expense):


Interest expense
(3,814
)
 
(3,145
)
 
(7,946
)
 
(5,394
)
Interest income
533

 
440

 
1,178

 
965

Miscellaneous
154

 
(1,773
)
 
(2,019
)
 
(2,885
)
Income before income taxes
14,082

 
28,696

 
48,356

 
62,811

Income tax expense
1,156

 
3,938

 
4,424

 
15,827

Net income
$
12,926

 
$
24,758

 
$
43,932

 
$
46,984

Earnings per share:


Basic
$
0.44

 
$
0.81

 
$
1.50

 
$
1.52

Diluted
$
0.43

 
$
0.79

 
$
1.46

 
$
1.48

Weighted average shares outstanding:


Basic
29,291

 
30,603

 
29,216

 
31,003

Diluted
29,925

 
31,385

 
29,999

 
31,836


7


PLEXUS CORP. AND SUBSIDIARIES
CONDENSED CONSOLIDATED BALANCE SHEETS
(in thousands, except per share data)
(unaudited)


Apr 4,
 
Sept 28,
 
2020
 
2019
ASSETS


Current assets:


Cash and cash equivalents
$
225,830

 
$
223,761

Restricted cash
1,458

 
2,493

Accounts receivable
462,812

 
488,284

Contract assets
111,277

 
90,841

Inventories
765,818

 
700,938

Prepaid expenses and other
27,537

 
31,974

Total current assets
1,594,732

 
1,538,291

Property, plant and equipment, net
381,668

 
384,224

Operating lease right-of-use asset
74,371


Deferred income taxes
14,071

 
13,654

Other
30,356

 
64,714

Total non-current assets
500,466

 
462,592

Total assets
$
2,095,198

 
$
2,000,883


LIABILITIES AND SHAREHOLDERS’ EQUITY


Current liabilities:


Current portion of long-term debt and finance lease obligations
$
107,880

 
$
100,702

Accounts payable
483,441

 
444,944

Customer deposits
136,545

 
139,841

Accrued salaries and wages
53,199

 
73,555

Other accrued liabilities
119,792

 
106,461

Total current liabilities
900,857

 
865,503

Long-term debt and finance lease obligations, net of current portion
186,327

 
187,278

Accrued income taxes payable
53,899

 
59,572

Long-term operating lease liabilities
39,617


Deferred income taxes
6,363

 
5,305

Other liabilities
15,577

 
17,649

Total non-current liabilities
301,783

 
269,804

Total liabilities
1,202,640

 
1,135,307

Shareholders’ equity:


Common stock, $.01 par value, 200,000 shares authorized,


53,414 and 52,917 shares issued, respectively,


and 29,186 and 29,004 shares outstanding, respectively
534

 
529

Additional paid-in-capital
607,446

 
597,401

Common stock held in treasury, at cost, 24,228 and 23,913, respectively
(912,731
)
 
(893,247
)
Retained earnings
1,221,532

 
1,178,677

Accumulated other comprehensive loss
(24,223
)
 
(17,784
)
Total shareholders’ equity
892,558

 
865,576

Total liabilities and shareholders’ equity
$
2,095,198

 
$
2,000,883


8


PLEXUS CORP. AND SUBSIDIARIES
NON-GAAP SUPPLEMENTAL INFORMATION Table 1
(in thousands, except per share data)
(unaudited)


Three Months Ended
 
Six Months Ended
 
 
Apr 4,
 
Jan 4,
 
Mar 30,
 
Apr 4,
 
Mar 30,
 
 
2020
 
2020
 
2019
 
2020
 
2019
Operating income, as reported
17,209

 
$
39,934

 
$
33,174

 
57,143

 
$
70,125

Operating margin, as reported
2.2
%
 
4.7
%
 
4.2
%
 
3.5
%
 
4.5
%


Non-GAAP adjustments:


Restructuring and impairment charges (1)
6,003


6,003


Adjusted operating income
$
23,212

 
$
39,934

 
$
33,174

 
$
63,146

 
$
70,125

Adjusted operating margin
3.0
%
 
4.7
%
 
4.2
%
 
3.9
%
 
4.5
%


Net income, as reported
$
12,926

 
$
31,006

 
$
24,758

 
$
43,932

 
$
46,984


Non-GAAP adjustments:


Special tax impacts (2)

 
(814
)


(814
)
 
7,035

Restructuring and impairment charges, net of tax (1)
5,373


5,373


Adjusted net income
$
18,299

 
$
30,192

 
$
24,758

 
$
48,491

 
$
54,019


Diluted earnings per share, as reported
$
0.43

 
$
1.03

 
$
0.79

 
$
1.46

 
$
1.48


Non-GAAP per share adjustments:


Special tax impacts (2)

 
(0.03
)


(0.02
)
 
0.22

Restructuring costs, net of tax (1)
0.18


0.18


Adjusted diluted earnings per share
$
0.61

 
$
1.00

 
$
0.79

 
$
1.62

 
$
1.70


(1)
During the three months ended April 4, 2020, restructuring costs of $6.0 million, or $5.4 million net of taxes, were incurred due to the previously announced closure of our Boulder Design Center.
(2)
During the three months ended January 4, 2020, there was $1.9 million in tax benefits related to US foreign tax credit regulations issued during the quarter, partially offset by $1.1 million of tax expense as a result of special tax items.

During the six months ended March 30, 2019, special tax expense of $7.0 million was recorded in accordance with new regulations issued in November 2018 under U.S. Tax Reform. These regulations impacted the treatment of foreign taxes paid.


9


PLEXUS CORP. AND SUBSIDIARIES
NON-GAAP SUPPLEMENTAL INFORMATION Table 2
 (in thousands)
(unaudited)


ROIC and Economic Return Calculations
Six Months Ended
 
Three Months Ended
 
Six Months Ended
 
Apr 4,
 
Jan 4,
 
Mar 30,
 
2020
 
2020
 
2019
Operating income, as reported
 
57,143


$
39,934


$
70,125

Restructuring costs
+
6,003

 
+

 
+

Adjusted operating income
 
$
63,146


$
39,934


$
70,125

 
x
2

 
x
4

 
x
2


Adjusted annualized operating income
 
$
126,292


$
159,736


$
140,250

Adjusted effective tax rate
x
13
%
 
x
13
%
 
x
15
%
Tax impact
 
16,418


20,766


21,038

Adjusted operating income (tax effected)
 
$
109,874


$
138,970


$
119,212


Average invested capital
÷
$
964,894

 
÷
$
942,793

 
÷
$
898,929


ROIC
 
11.4
%
 
 
14.7
%
 
 
13.3
%
Weighted average cost of capital
-
8.8
%
 
-
8.8
%
 
-
9.0
%
Economic return
 
2.6
%
 
 
5.9
%
 
 
4.3
%
 
Three Months Ended
Average Invested Capital
Apr 4,
 
Jan 4,
 
Sept 28,
 
Mar 30,
 
Dec 29,
 
Sept 29,
Calculations
2020
 
2020
 
2019
 
2019
 
2018
 
2018
Equity
$
892,558

 
$
908,372

 
$
865,576

 
$
875,444

 
$
905,163

 
$
921,143

Plus:


Debt and finance leases - current
107,880

 
67,847

 
100,702

 
93,197

 
8,633

 
5,532

Operating leases - current (1) (2)
8,546

 
9,185


Debt and finance leases - long-term
186,327

 
186,827

 
187,278

 
187,120

 
187,567

 
183,085

Operating leases - long-term (2)
39,617

 
36,473


Less:


Cash and cash equivalents
(225,830
)
 
(252,914)

 
(223,761)

 
(184,028)

 
(188,799)

 
(297,269)

 
$
1,009,098

 
$
955,790

 
$
929,795

 
$
971,733

 
$
912,564

 
$
812,491

(1)
Included in Other accrued liabilities on the Condensed Consolidated Balance Sheets.
(2)
In the fiscal first quarter of 2020, the Company adopted and applied Topic 842 to all leases using the modified retrospective method of adoption. The prior year comparative information has not been restated and continued to be reported under the accounting standards in effect for fiscal 2019 and 2018.


10
Fiscal second quarter 2020 financial results April 23, 2020


PLEXUS CORP. Safe harbor and fair disclosure statement Any statements made during our call today and information included in the supporting material that is not historical in nature, such as statements in the future tense and statements that include "believe," "expect," "intend," "plan," "anticipate," and similar terms and concepts, are forward-looking statements. Forward-looking statements are not guarantees since there are inherent difficulties in predicting future results, and actual results could differ materially from those expressed or implied in the forward- looking statements. For a list of factors that could cause actual results to differ materially from those discussed, please refer to the Company’s periodic SEC filings, particularly the risk factors in our Form 10-K filing for the fiscal year ended September 28, 2019, as supplemented by our form 8-K filed with the SEC yesterday, and the Safe Harbor and Fair Disclosure statement in yesterday’s press release. Plexus provides non-GAAP supplemental information, such as ROIC, economic return, and free cash flow, because those measures are used for internal management goals and decision making, and because they provide additional insight into financial performance. In addition, management uses these and other non-GAAP measures, such as adjusted operating income, adjusted operating margin, adjusted net income, and adjusted earnings per share, to provide a better understanding of core performance for purposes of period-to-period comparisons. For a full reconciliation of non-GAAP supplemental information please refer to yesterday’s press release and our periodic SEC filings. 2


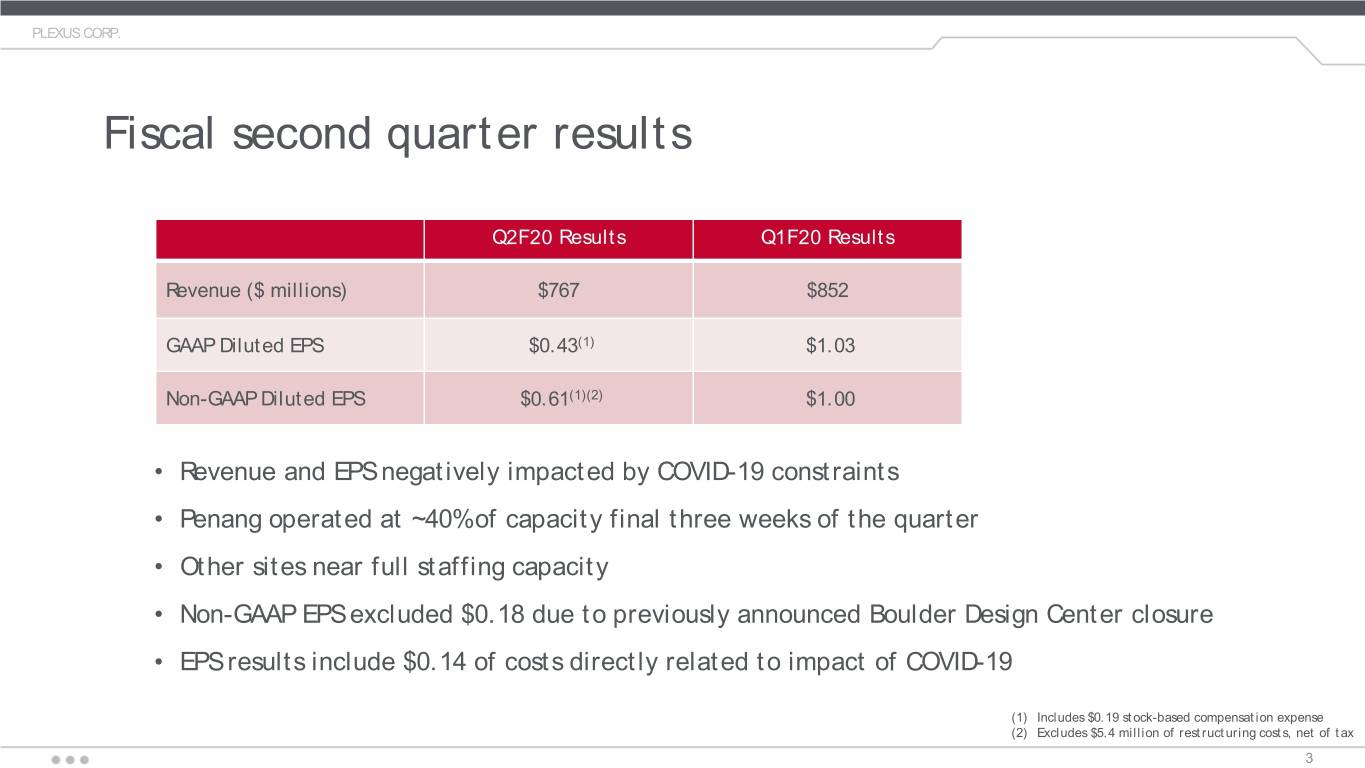
PLEXUS CORP. Fiscal second quarter results Q2F20 Results Q1F20 Results Revenue ($ millions) $767 $852 GAAP Diluted EPS $0.43(1) $1.03 Non-GAAP Diluted EPS $0.61(1)(2) $1.00 • Revenue and EPS negatively impacted by COVID-19 constraints • Penang operated at ~40% of capacity final three weeks of the quarter • Other sites near full staffing capacity • Non-GAAP EPS excluded $0.18 due to previously announced Boulder Design Center closure • EPS results include $0.14 of costs directly related to impact of COVID-19 (1) Includes $0.19 stock-based compensation expense (2) Excludes $5.4 million of restructuring costs, net of tax 3


PLEXUS CORP. PLEXUS INTERNAL USE ONLY


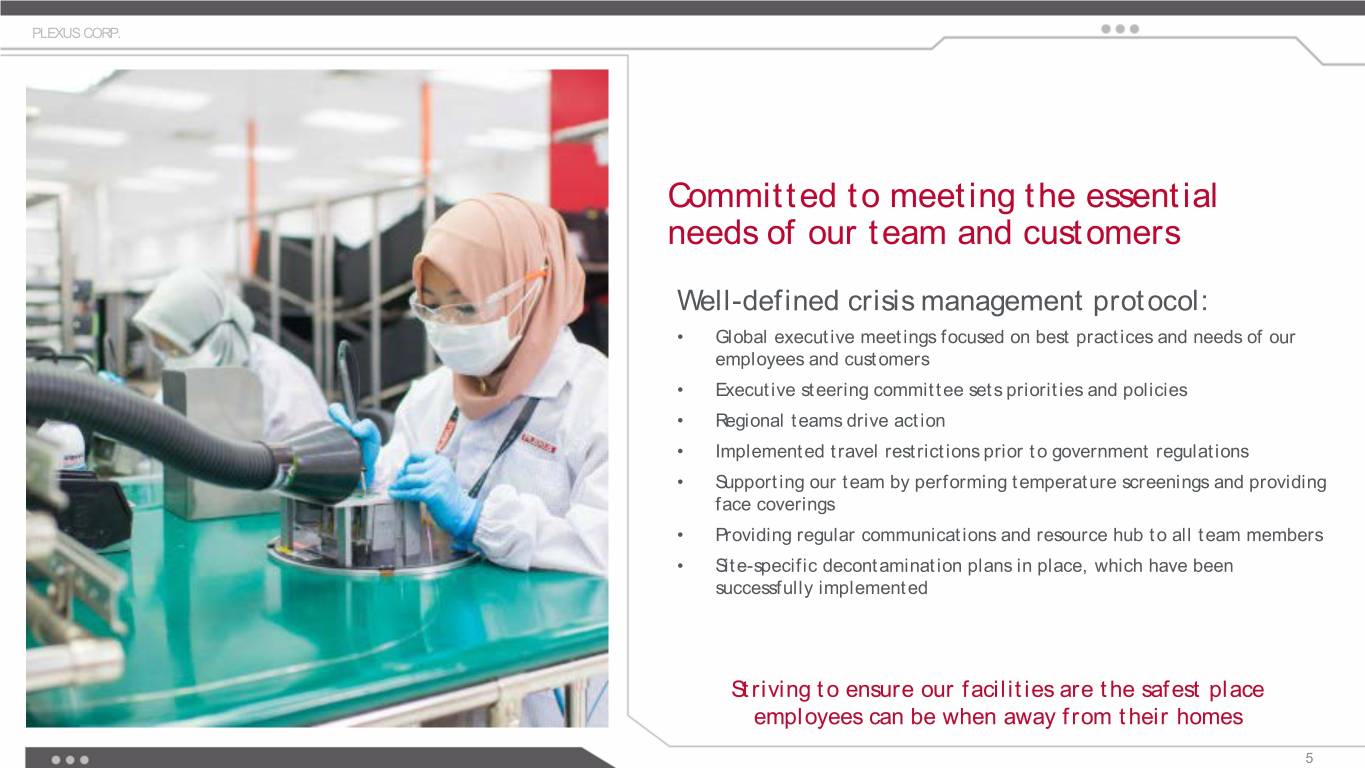
PLEXUS CORP. Committed to meeting the essential needs of our team and customers Well-defined crisis management protocol: • Global executive meetings focused on best practices and needs of our employees and customers • Executive steering committee sets priorities and policies • Regional teams drive action • Implemented travel restrictions prior to government regulations • Supporting our team by performing temperature screenings and providing face coverings • Providing regular communications and resource hub to all team members • Site-specific decontamination plans in place, which have been successfully implemented Striving to ensure our facilities are the safest place employees can be when away from their homes 5


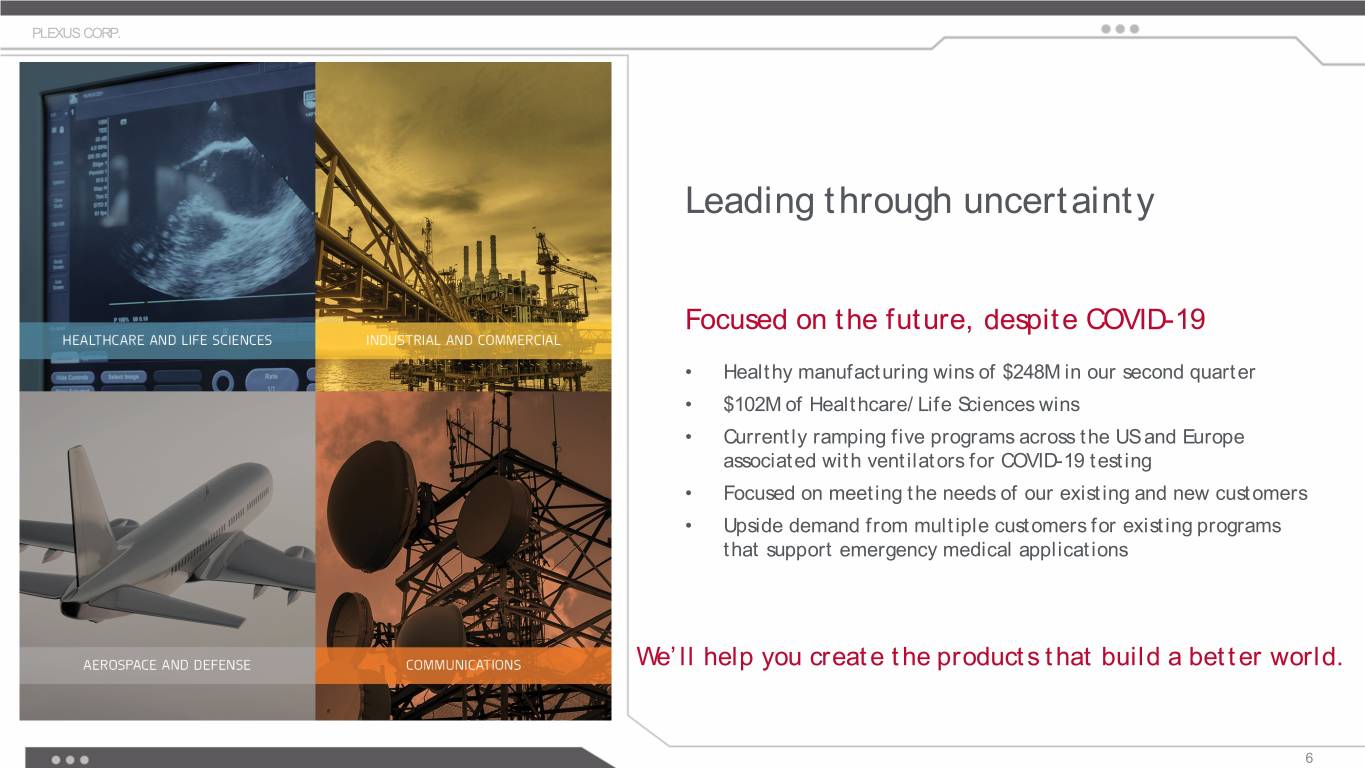
PLEXUS CORP. Leading through uncertainty Focused on the future, despite COVID-19 • Healthy manufacturing wins of $248M in our second quarter • $102M of Healthcare/Life Sciences wins • Currently ramping five programs across the US and Europe associated with ventilators for COVID-19 testing • Focused on meeting the needs of our existing and new customers • Upside demand from multiple customers for existing programs that support emergency medical applications We’ll help you create the products that build a better world. 6


PLEXUS CORP. Fiscal 2020 third quarter guidance REVENUE GUIDE • End markets are highly volatile • Strength in HC/LS, semi-cap and defense Q3F20 Guidance • Aerospace weak. I/C and COMM mixed • Output at all sites near full capacity Revenue $790 to $830 million GAAP Diluted EPS $0.72 to $0.82* EPS GUIDE • Impacted by inefficiencies due to COVID-19 • Operating margin of 3.8% to 4.2% • Non-recurring charges not anticipated * Includes $0.21 of stock-based compensation expense and excludes any non-recurring charges. 7


PLEXUS CORP. Operational status of global facilities GOVERNMENTAL RESTRICTIONS DUE TO COVID-19 AMER REGION • Government requirements impact all regions in which • Efficiently managed facility decontamination we operate • Permission to operate in all geographies EMEA REGION NON-PRODUCTION WORKFORCE • No significant issues to date • Required to work from home EMPLOYEE HEALTH & SAFETY APAC REGION • Implementation of social distancing • China overcame Q2F20 COVID-19 challenges • Work-from-home requirements • Malaysian Movement Control Order in effect • Restricted access to our buildings • Adjusting shift patterns, improving productivity and • Modified shift patterns in manufacturing facilities optimizing work-from-home to achieve near full production • Physical reconfiguration of work spaces • Partnering with suppliers for continuity of supply • Physical layout changes to common spaces 8


PLEXUS CORP. Performance by sector Q2F20 Q1F20 Q3F20 Expectations Q2F20 vs. Q1F20 Apr 4, 2020 Jan 4, 2020 (percentage points) Healthcare and Life Sciences $271 35% $312 37% - 13% Up >20% Industrial and Commercial $287 37% $310 36% - 7% Down high single Aerospace and Defense $157 21% $172 20% - 9% Down high single Communications $52 7% $58 7% - 10% Up almost 30% Total Revenue $767 100% $852 100% - 10% Revenue in millions 9


PLEXUS CORP. Manufacturing wins Q2F20 wins: $248M New programs: 36 TFQ Trailing Four Quarters (TFQ) Manufacturing Wins $844M $1,000 50% $900 45% $800 40% $700 35% $600 30% Goal $500 25% 25% $400 20% % of TFQ Sales% of New Wins $M $300 15% $200 10% $100 5% $0 0% Q2F19 Q3F19 Q4F19 Q1F20 Q2F20 TFQ Wins TFQ Wins % of TFQ Sales New Wins 10


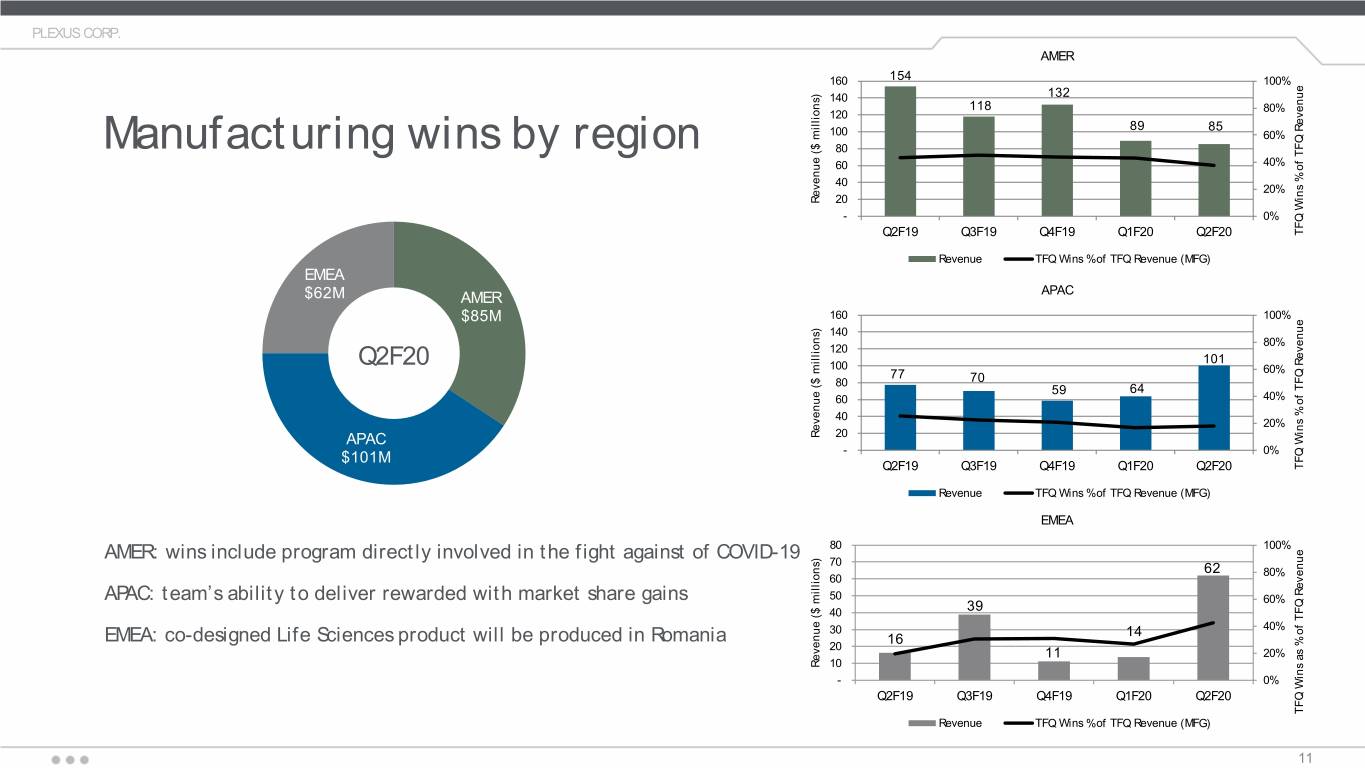
PLEXUS CORP. AMER 160 154 100% 140 132 118 80% 120 89 85 100 60% Manufacturing wins by region 80 60 40% 40 20% Revenue ($ ($ millions) Revenue 20 - 0% Q2F19 Q3F19 Q4F19 Q1F20 Q2F20 Revenue % TFQ of Wins TFQ Revenue TFQ Wins % of TFQ Revenue (MFG) EMEA $62M AMER APAC $85M 160 100% 140 80% 120 101 Q2F20 100 77 60% 80 70 59 64 60 40% 40 20% APAC ($ millions) Revenue 20 $101M - 0% Q2F19 Q3F19 Q4F19 Q1F20 Q2F20 Revenue % TFQ of Wins TFQ Revenue TFQ Wins % of TFQ Revenue (MFG) EMEA 80 100% AMER: wins include program directly involved in the fight against of COVID-19 70 62 80% 60 APAC: team’s ability to deliver rewarded with market share gains 50 60% 40 39 EMEA: co-designed Life Sciences product will be produced in Romania 30 14 40% 20 16 11 20% Revenue ($ ($ millions) Revenue 10 - 0% Q2F19 Q3F19 Q4F19 Q1F20 Q2F20 TFQ Wins as % of TFQ Revenue % TFQ as of Wins TFQ Revenue TFQ Wins % of TFQ Revenue (MFG) 11


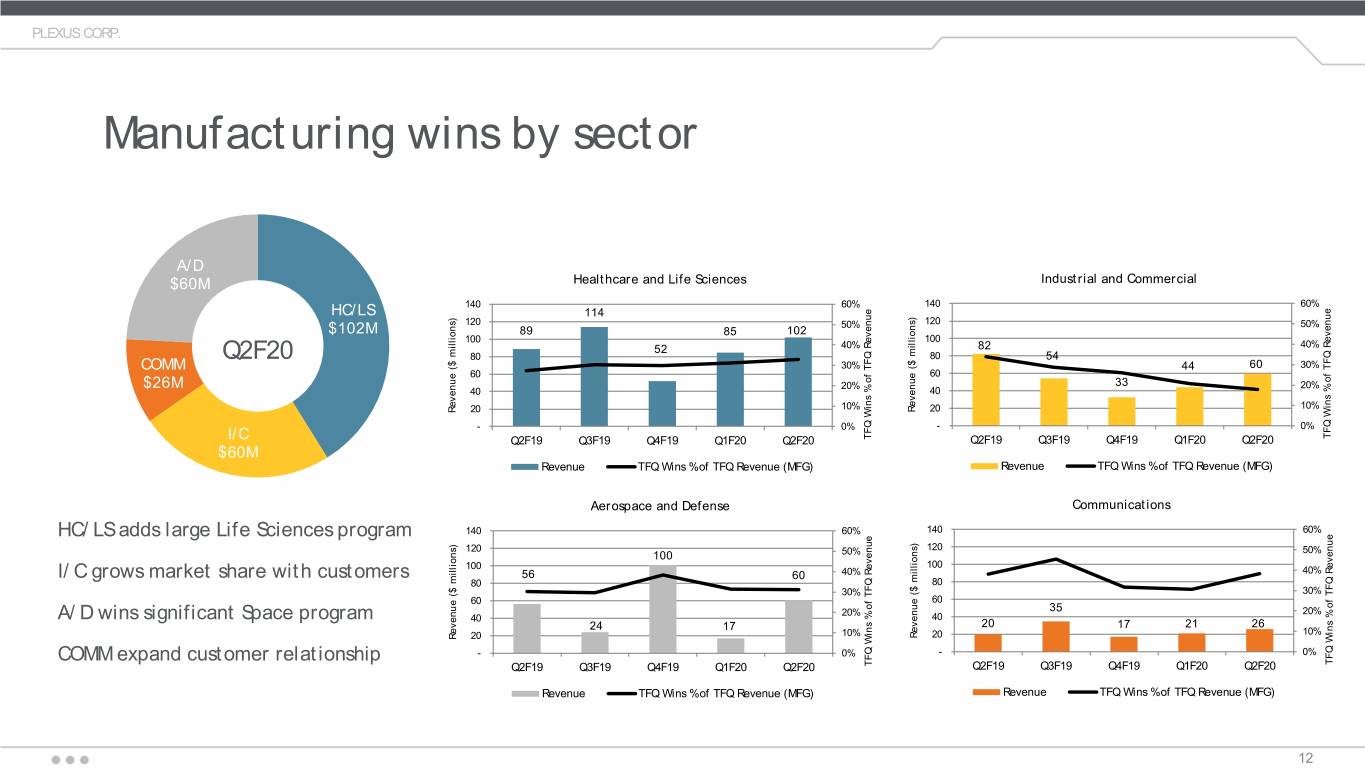
PLEXUS CORP. Manufacturing wins by sector A/D $60M Healthcare and Life Sciences Industrial and Commercial 140 60% 140 60% HC/LS 114 120 50% 120 50% $102M 89 85 102 100 100 52 40% 82 40% Q2F20 80 80 54 COMM 30% 44 60 30% 60 60 $26M 20% 33 20% 40 40 10% 10% Revenue ($ millions) Revenue ($ millions) 20 20 - 0% - 0% TFQTFQof Wins Revenue % I/C Q2F19 Q3F19 Q4F19 Q1F20 Q2F20 TFQTFQof Wins Revenue % Q2F19 Q3F19 Q4F19 Q1F20 Q2F20 $60M Revenue TFQ Wins % of TFQ Revenue (MFG) Revenue TFQ Wins % of TFQ Revenue (MFG) Aerospace and Defense Communications HC/LS adds large Life Sciences program 140 60% 140 60% 120 120 50% 100 50% 100 100 I/C grows market share with customers 56 60 40% 40% 80 80 30% 30% 60 60 20% 35 20% A/D wins significant Space program 40 40 20 17 21 26 24 17 10% 10% Revenue ($ millions) Revenue ($ millions) 20 20 - 0% - 0% COMM expand customer relationship TFQTFQof Wins Revenue % Q2F19 Q3F19 Q4F19 Q1F20 Q2F20 TFQTFQof Wins Revenue % Q2F19 Q3F19 Q4F19 Q1F20 Q2F20 Revenue TFQ Wins % of TFQ Revenue (MFG) Revenue TFQ Wins % of TFQ Revenue (MFG) 12


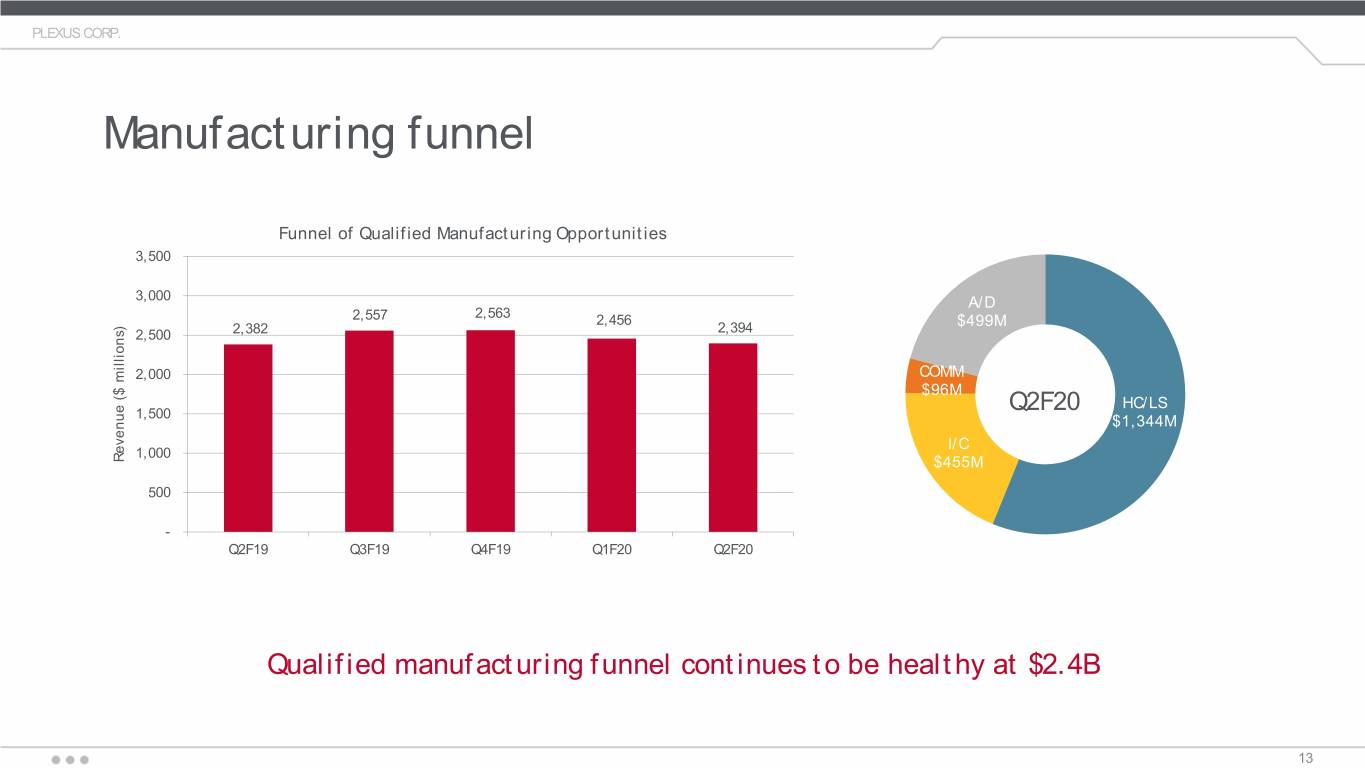
PLEXUS CORP. Manufacturing funnel Funnel of Qualified Manufacturing Opportunities 3,500 3,000 A/D 2,557 2,563 2,456 2,394 $499M 2,500 2,382 2,000 COMM $96M Q2F20 HC/LS 1,500 $1,344M I/C 1,000 Revenue ($ ($ millions) Revenue $455M 500 - Q2F19 Q3F19 Q4F19 Q1F20 Q2F20 Qualified manufacturing funnel continues to be healthy at $2.4B 13


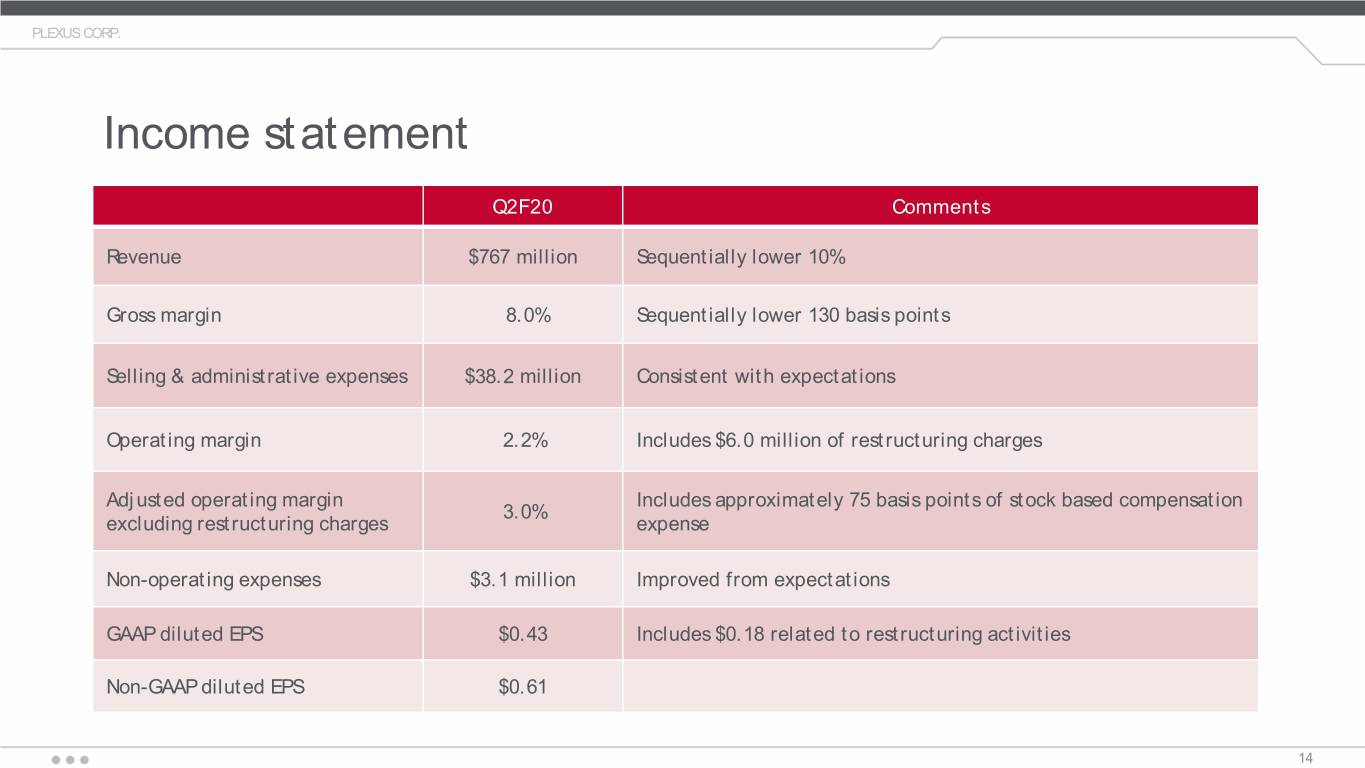
PLEXUS CORP. Income statement Q2F20 Comments Revenue $767 million Sequentially lower 10% Gross margin 8.0% Sequentially lower 130 basis points Selling & administrative expenses $38.2 million Consistent with expectations Operating margin 2.2% Includes $6.0 million of restructuring charges Adjusted operating margin Includes approximately 75 basis points of stock based compensation 3.0% excluding restructuring charges expense Non-operating expenses $3.1 million Improved from expectations GAAP diluted EPS $0.43 Includes $0.18 related to restructuring activities Non-GAAP diluted EPS $0.61 14


PLEXUS CORP. Balance sheet and cash flow Q2F20 Comments ~ 225,000 at an average price of $58.57 per share, indefinitely Share repurchases $13.2 million suspended in March due to COVID-19 Cash used in operations: $29 million Free cash flow ($46) million Capital expenditures: $17 million Cash balance $227 million Sequentially lower $28 million Total debt $294 million Gross debt to EBITDA ratio of 1.5 times Cash cycle days 87 days Sequentially higher 16 days 15


PLEXUS CORP. Working capital trends 120 100 80 60 Days 40 20 - Q3F18 Q4F18 Q1F19 Q2F19 Q3F19 Q4F19 Q1F20 Q2F20 Net Cash Cycle Days Inventory Days Contract Asset Days A/R Days A/P Days Customer Deposit Days Q3F18 Q4F18 Q1F19 Q2F19 Q3F19 Q4F19 Q1F20 Q2F20 Inventory Days 105 104 105 102 95 87 87 99 Contract Asset Days 10 10 12 10 12 13 A/R Days 48 47 51 51 52 55 49 55 A/P Days 66 66 68 61 54 55 61 62 Customer Deposit Days 14 12 15 16 16 17 16 18 Net Cash Cycle Days 73 73 83 86 89 80 71 87 16


PLEXUS CORP. Fiscal third quarter 2020 guidance Guidance Revenue $790 to $830 million GAAP diluted EPS $0.72 to $0.82 Gross margin 8.2% to 8.6% SG&A $35.0 to $36.0 million Operating margin 3.8% to 4.2% Depreciation and amortization Approximately $14 million Non-operating expenses $4.8 to $5.2 million Effective tax rate 15% to 17%* Diluted weighted average shares outstanding Approximately 30 million Cash cycle days 82 to 86 days * Fiscal year 2020 tax rate anticipated to be 12% to 14%. 17


Q&A Thank you. 18