| Exhibit 99.1 | ||||||||||||||
| PRESS RELEASE |  | |||||||||||||
| Investor Relations: | Media: | |||||||||||||
| New York: +1 (917) 663 2233 | Lausanne: +41 (0)58 242 4500 | |||||||||||||
| Lausanne: +41 (0)58 242 4666 | Email: [email protected] | |||||||||||||
| Email: [email protected] | ||||||||||||||
PHILIP MORRIS INTERNATIONAL INC. REPORTS 2021 SECOND-QUARTER
REPORTED DILUTED EPS OF $1.39—INCLUDING CHARGES FOR SAUDI ARABIA CUSTOMS ASSESSMENTS AND EXIT COSTS—AND ADJUSTED DILUTED EPS OF $1.57,
REFLECTING ORGANIC GROWTH OF 17.8%;
REVISES 2021 FULL-YEAR REPORTED DILUTED EPS FORECAST
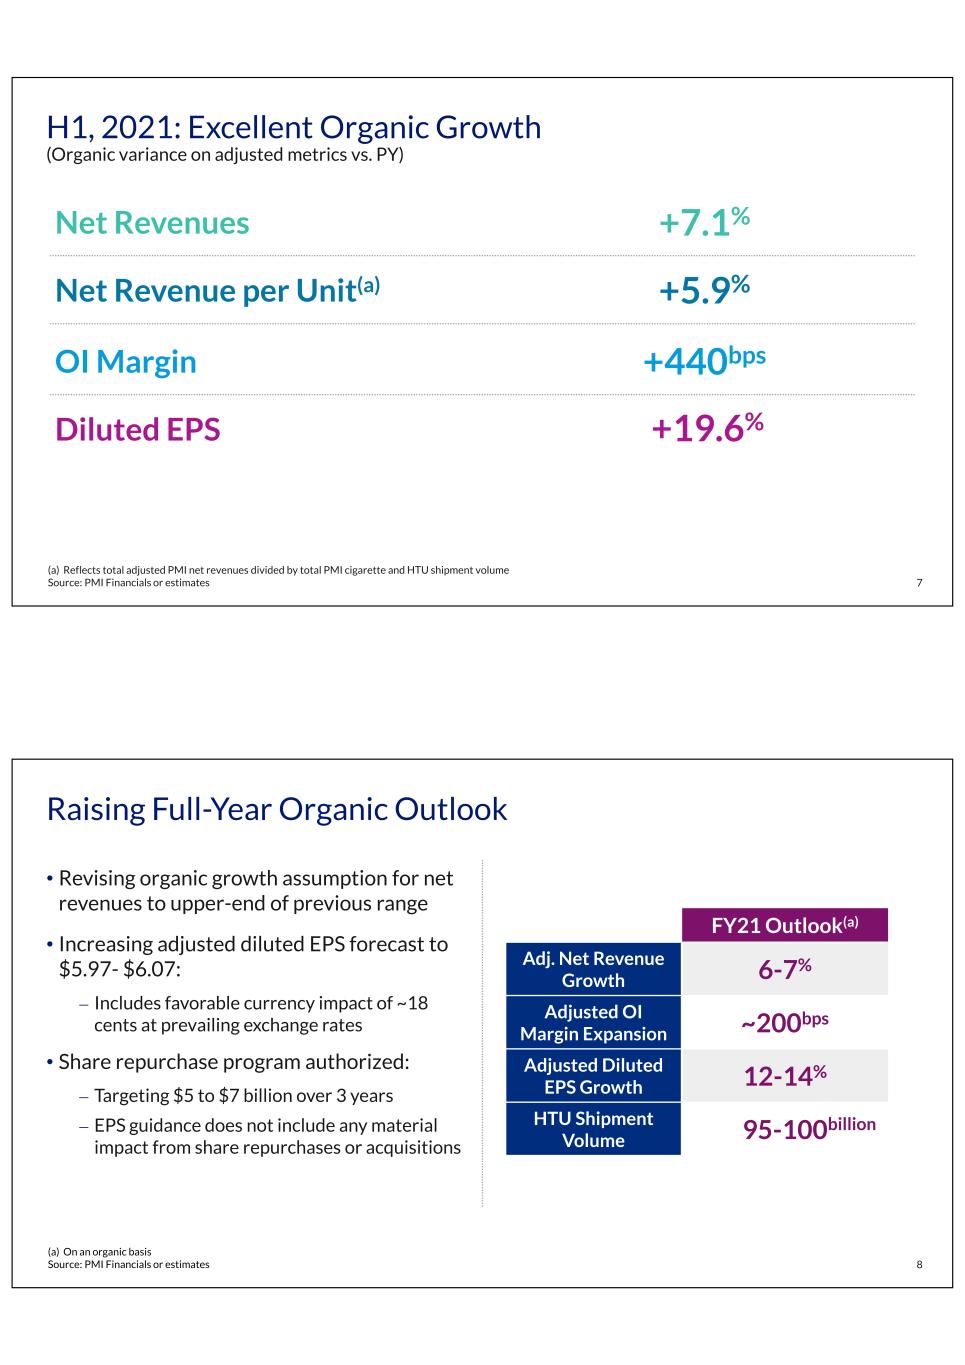
TO A RANGE OF $5.76 TO $5.86 AND RAISES ORGANIC GROWTH TO AROUND 12% TO 14%
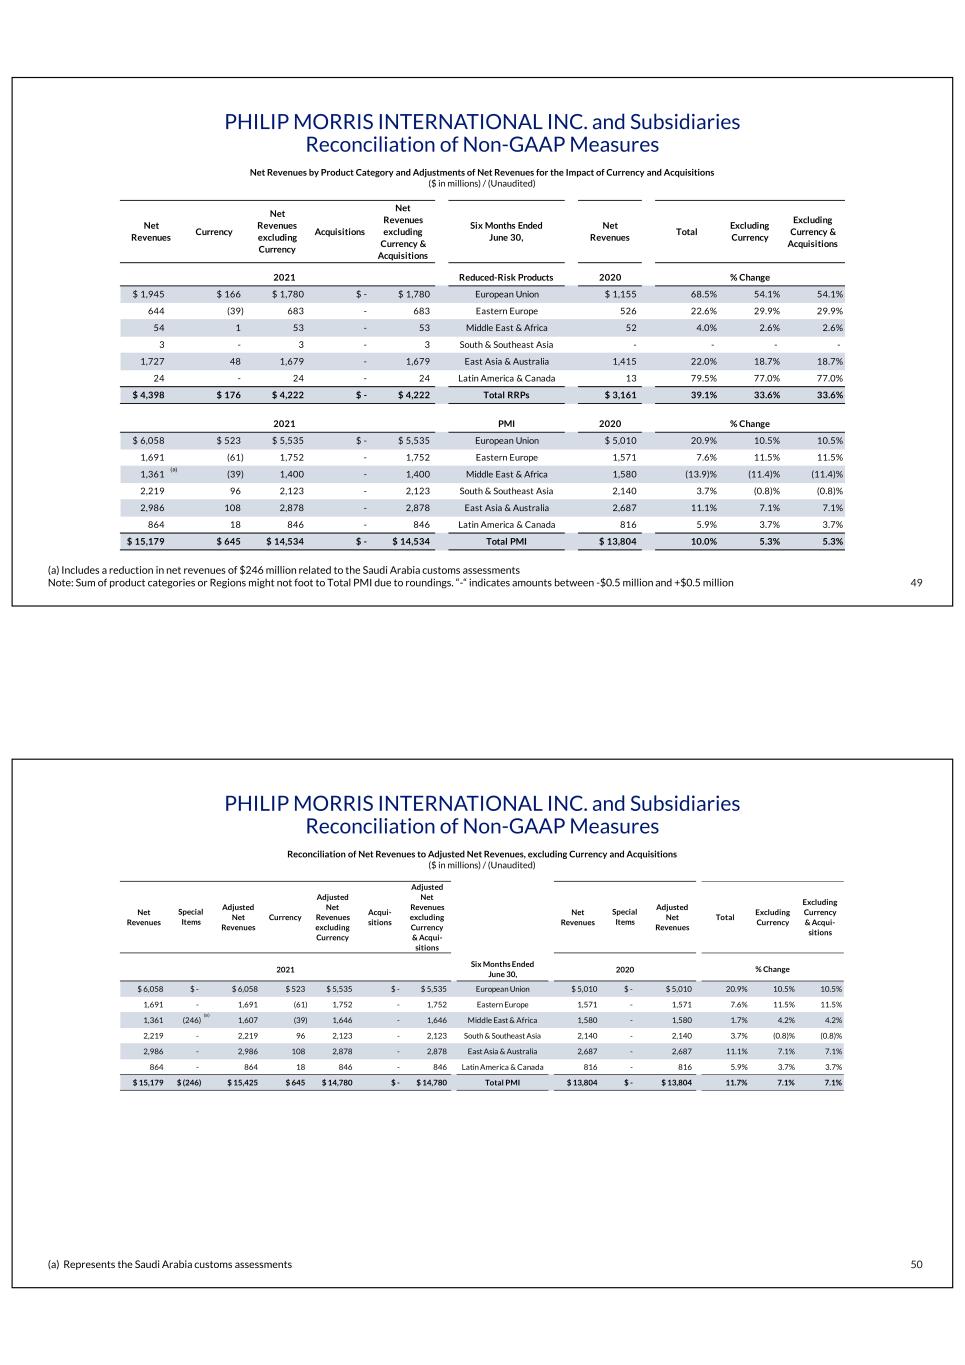
NEW YORK, July 20, 2021 – Philip Morris International Inc. (NYSE: PM) today announces its 2021 second-quarter results. Growth rates presented in this press release on an organic basis reflect currency-neutral underlying results. Adjusted net revenues exclude the impact related to the Saudi Arabia customs assessments. Adjustments, other calculations and reconciliations to the most directly comparable U.S. GAAP measures are included in the schedules to this press release.
2021 SECOND-QUARTER & YEAR-TO-DATE HIGHLIGHTS
2021 Second-Quarter
•Reported diluted EPS of $1.39, up by 11.2%; up by 7.2%, excluding currency
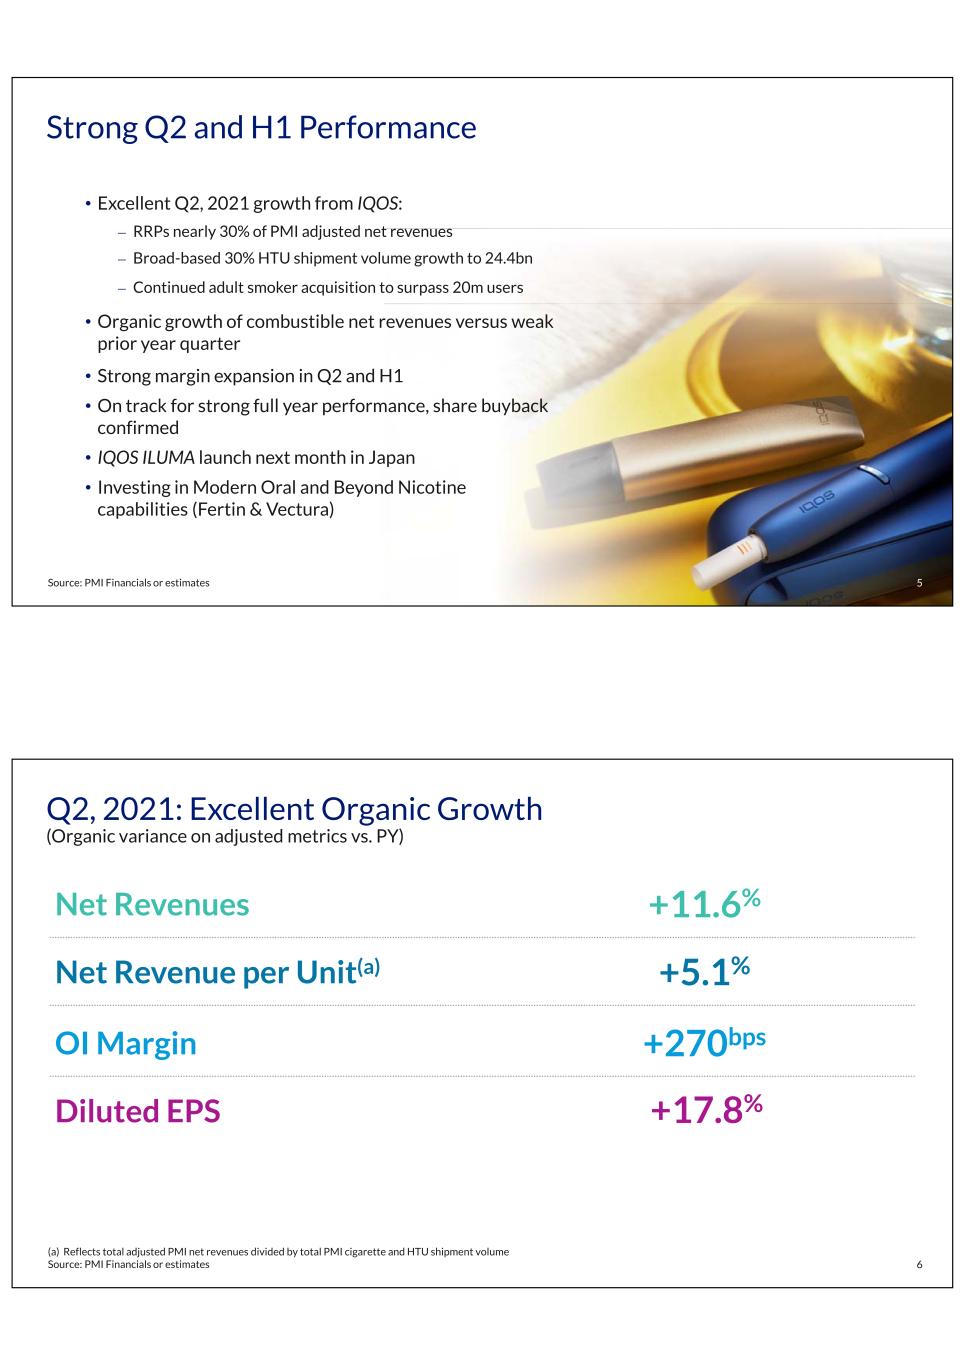
•Adjusted diluted EPS of $1.57, up by 21.7%; up by 17.8% on an organic basis
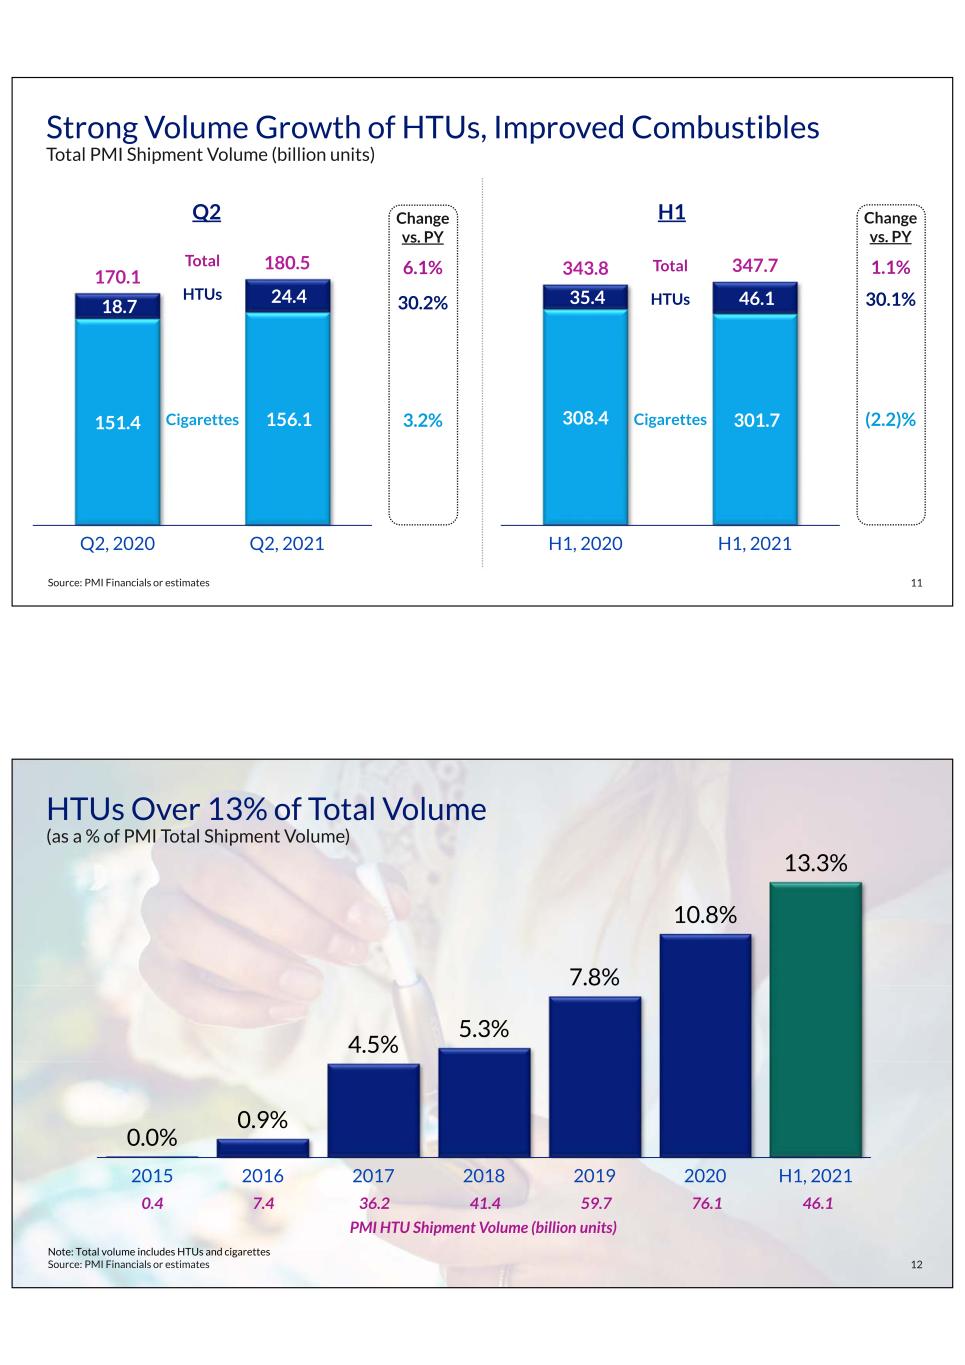
•Cigarette and heated tobacco unit shipment volume up by 6.1% (reflecting cigarette shipment volume up by 3.2%, and heated tobacco unit shipment volume up by 30.2% to 24.4 billion units)
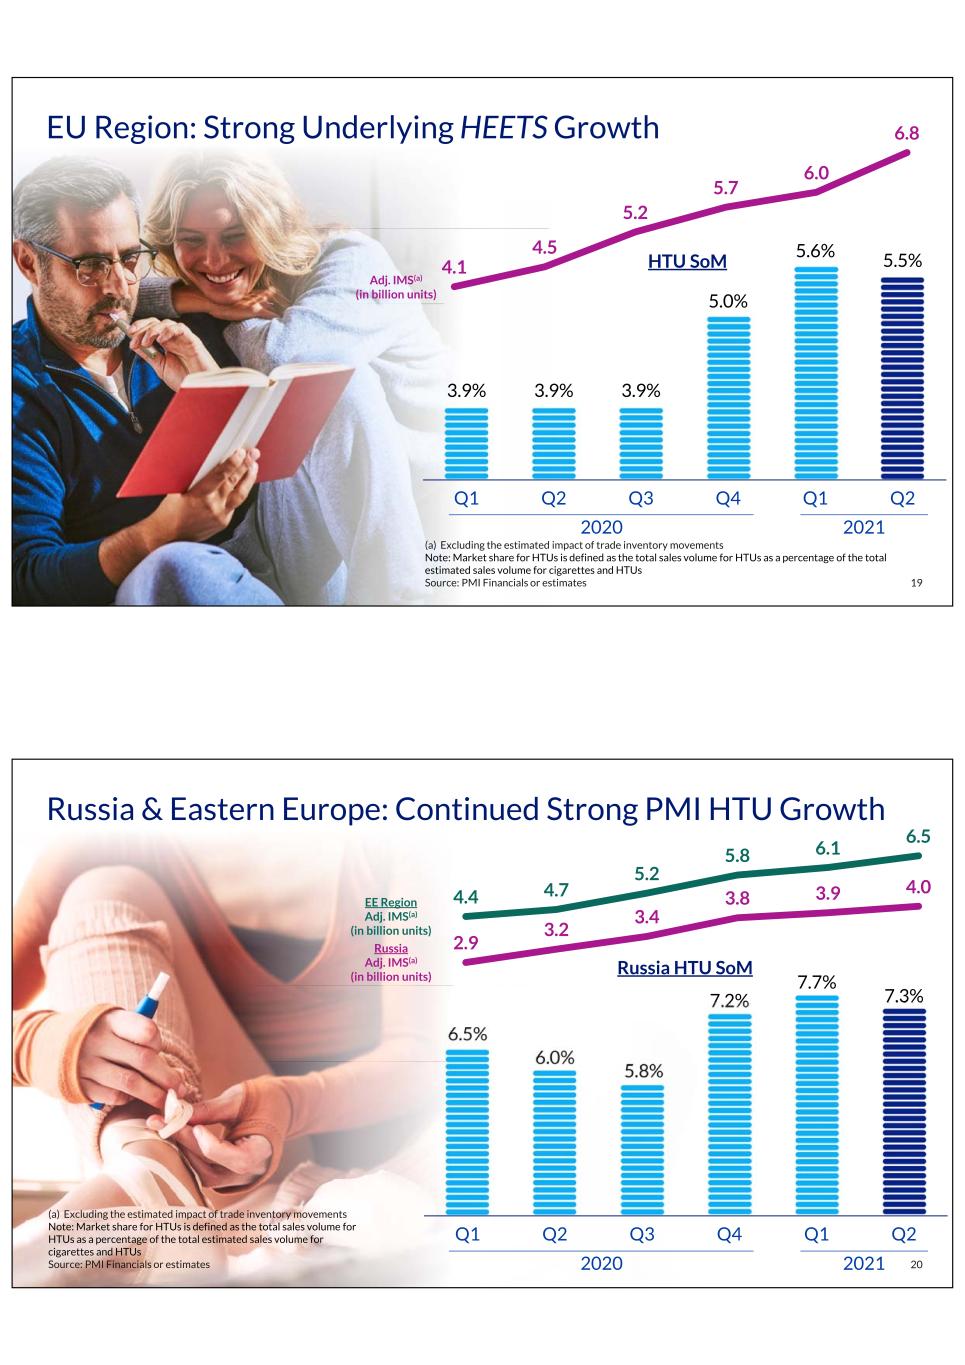
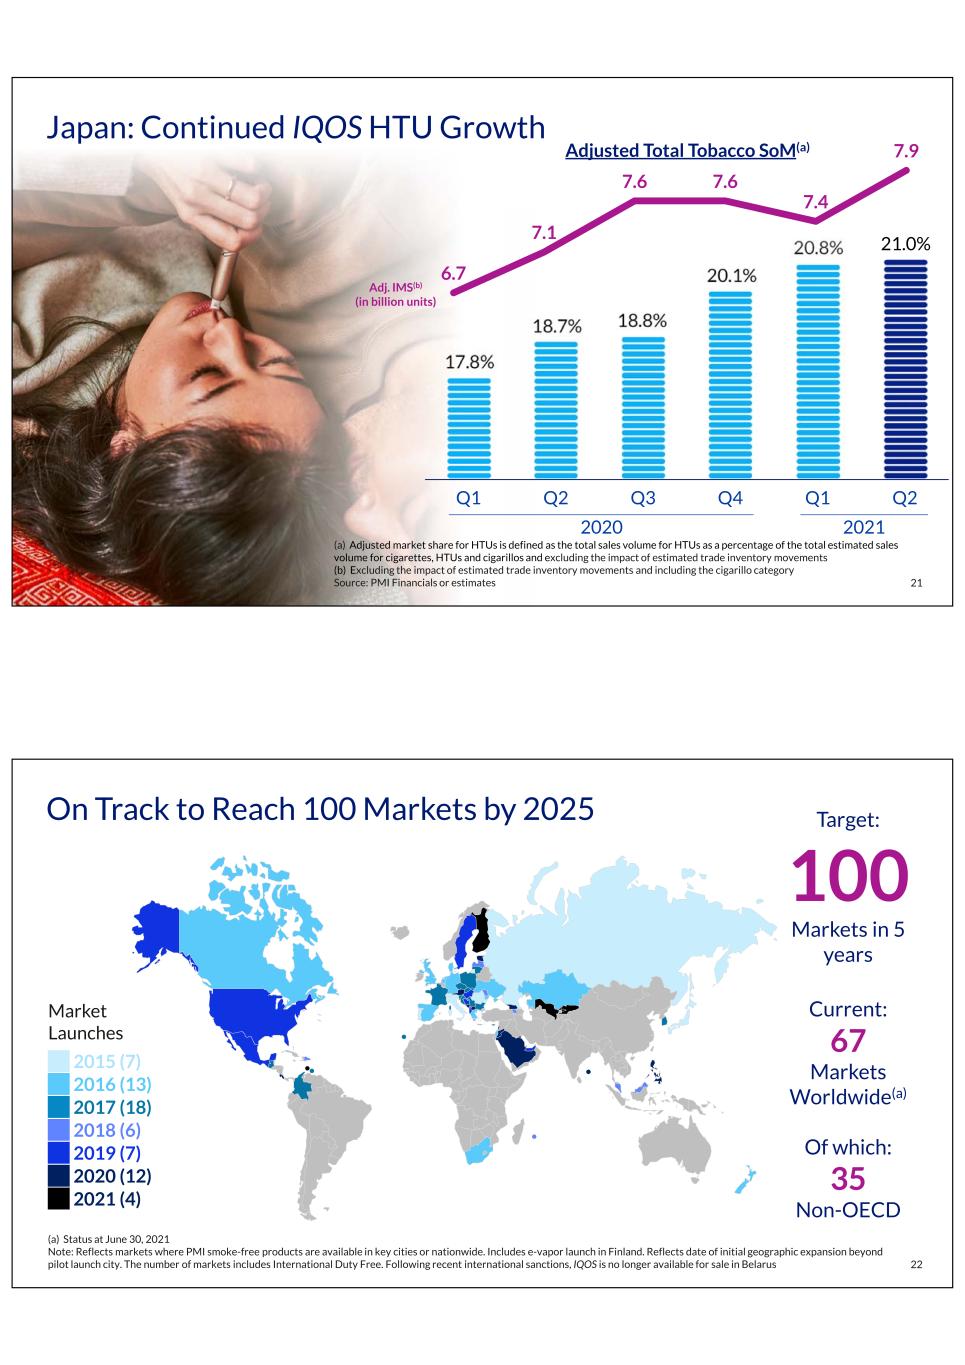
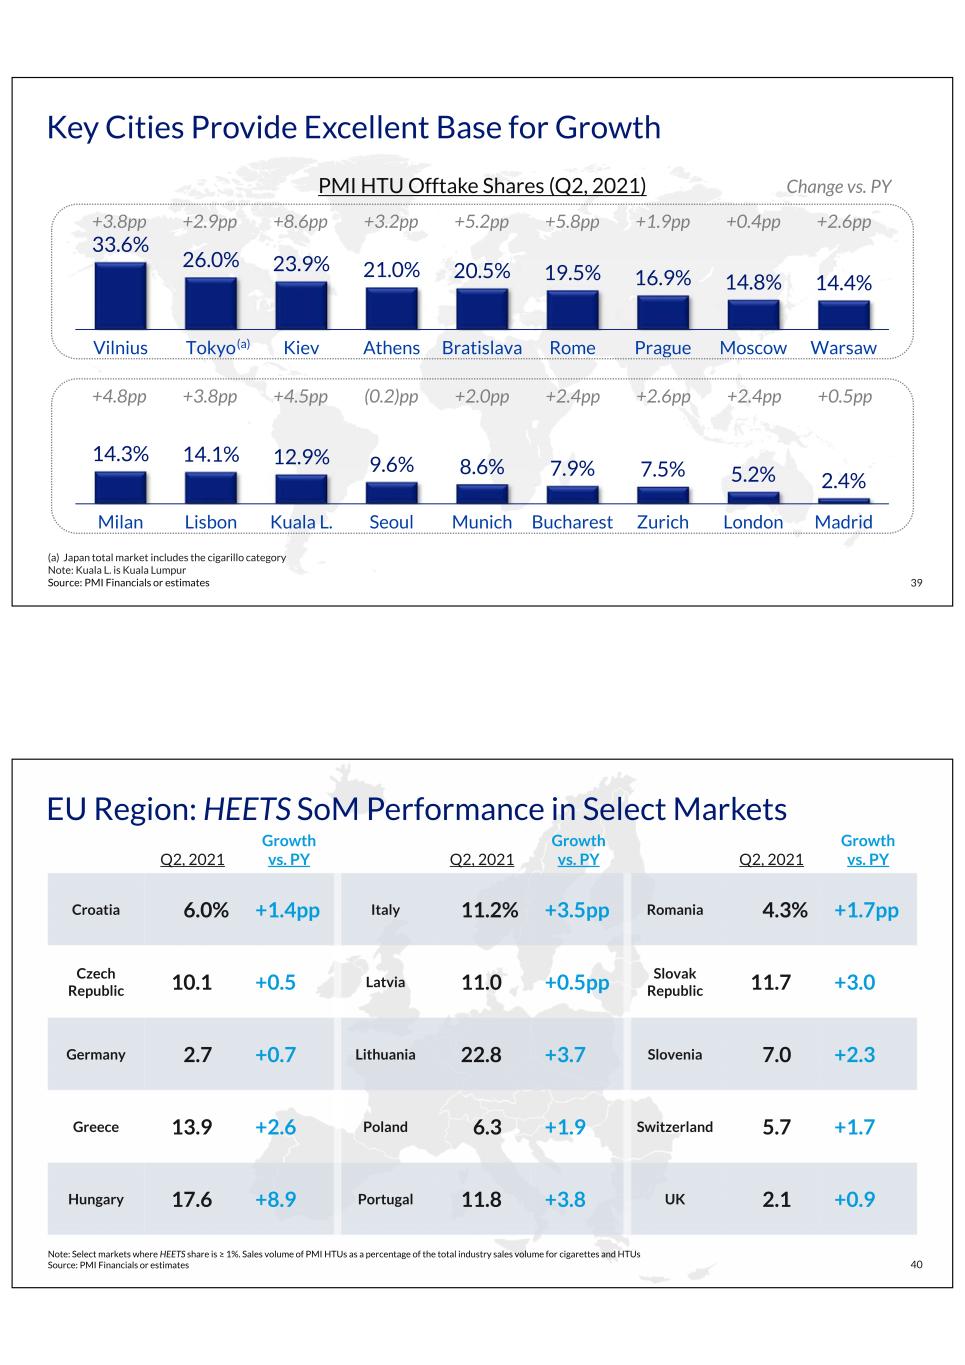
•Market share for heated tobacco units in IQOS markets, excluding the U.S., up by 1.4 points to 7.3%
•Net revenues up by 14.2%; up by 7.9%, excluding currency
•Adjusted net revenues up by 11.6% on an organic basis
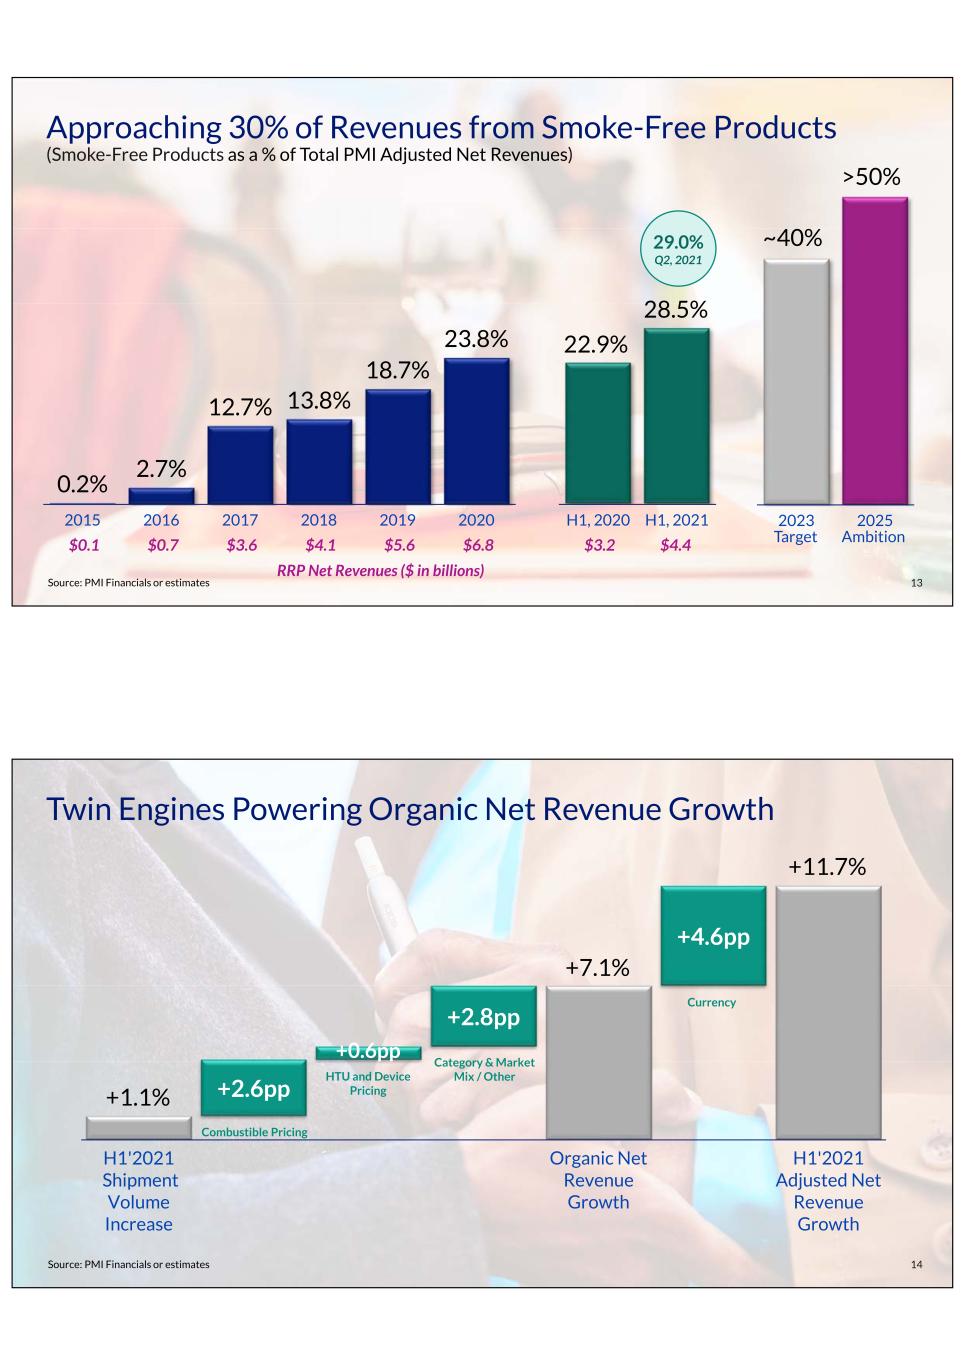
•Net revenues from smoke-free products accounted for 29.0% of total adjusted net revenues
•Operating income up by 14.6%; up by 9.9%, excluding currency
•Adjusted operating income up by 18.7% on an organic basis
•Adjusted operating income margin of 44.1% up by 2.0 points; up by 2.7 points on an organic basis
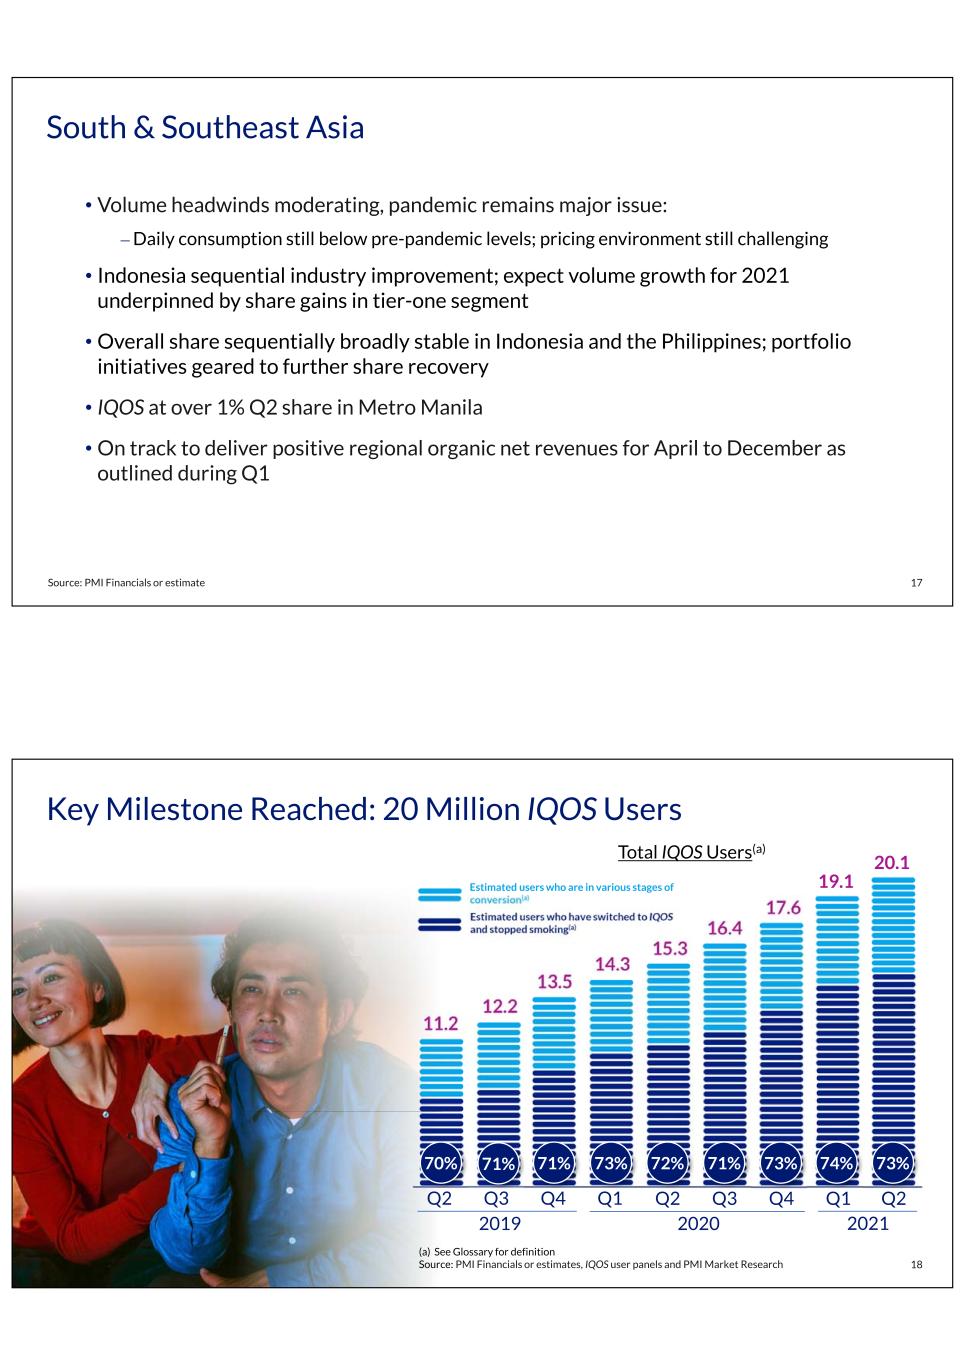
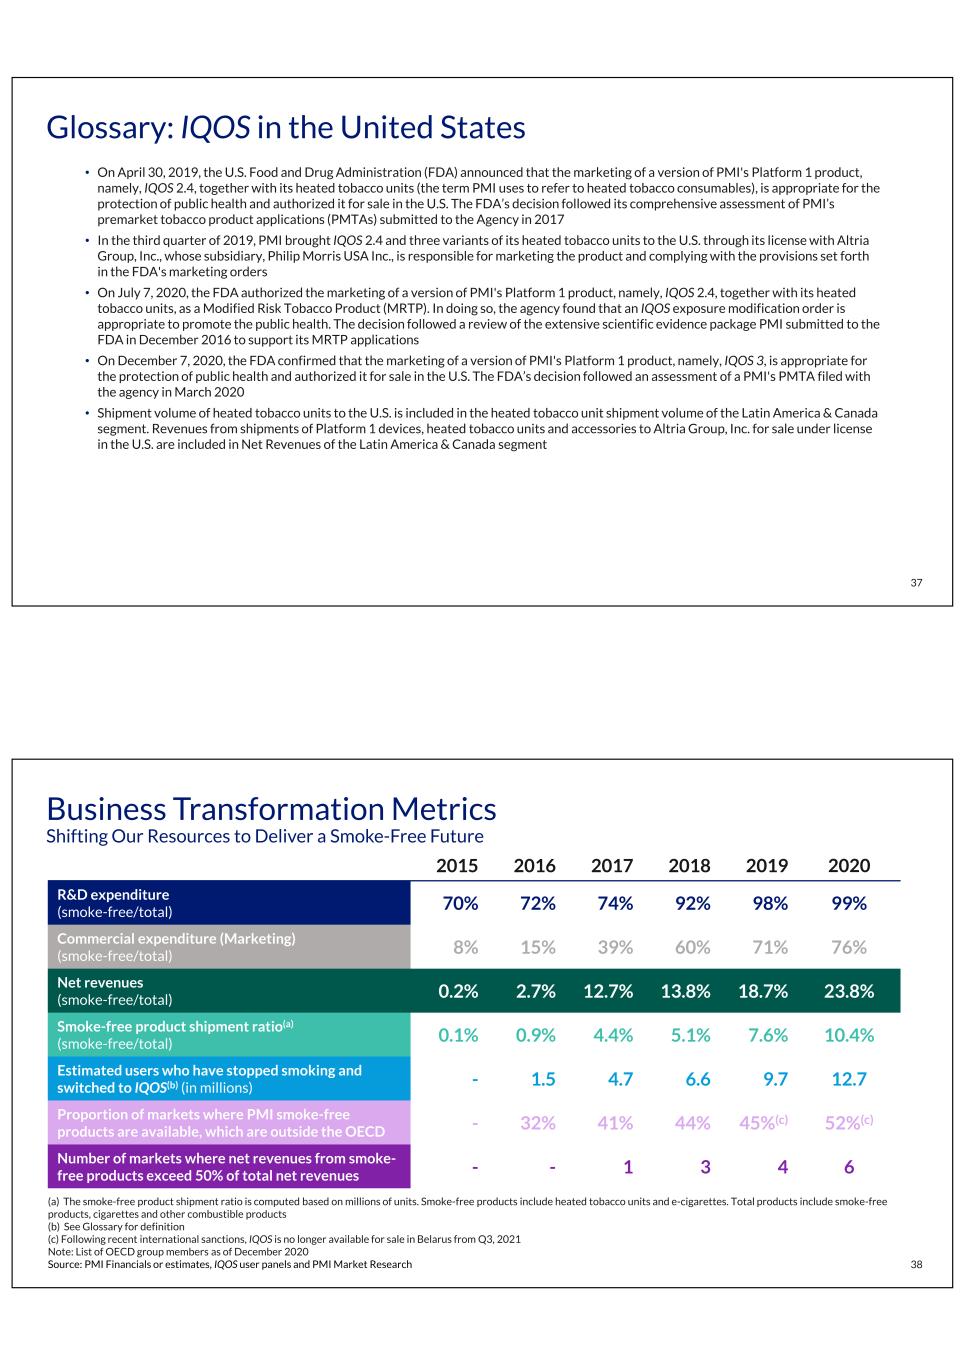
•Total IQOS users at quarter-end estimated at approximately 20.1 million, of which approximately 14.7 million have switched to IQOS and stopped smoking
•New share repurchase program of up to $7 billion authorized, with target spending of $5 to $7 billion over a three-year period that will commence in the third quarter of 2021
•Regular quarterly dividend of $1.20 per common share declared, representing an annualized rate of $4.80
2021 Six Months Year-to-Date
•Reported diluted EPS of $2.93, up by 21.1%; up by 14.9%, excluding currency
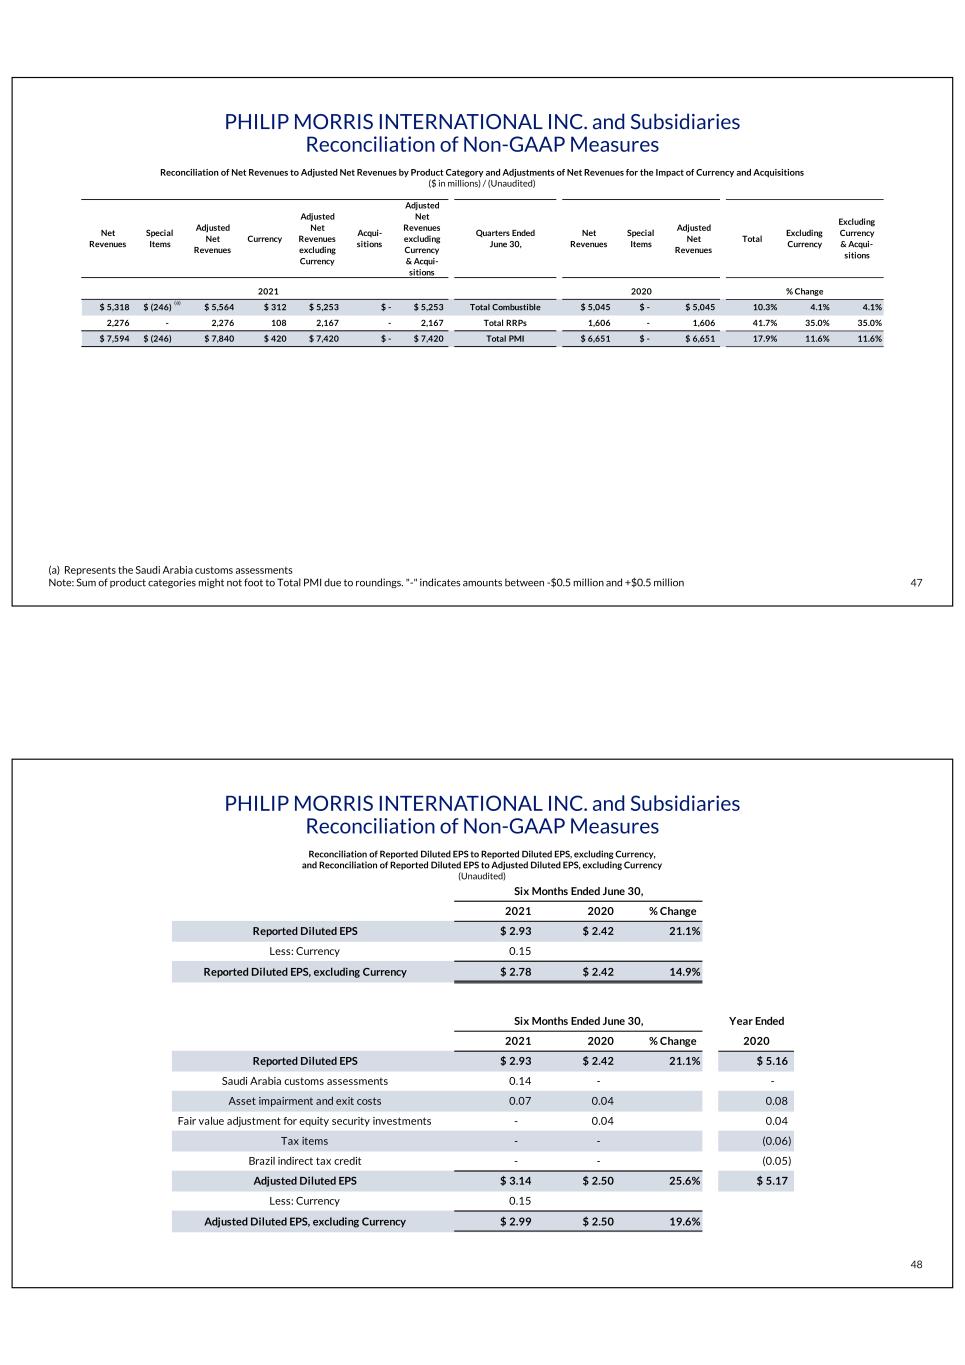
•Adjusted diluted EPS of $3.14, up by 25.6%; up by 19.6% on an organic basis
•Cigarette and heated tobacco unit shipment volume up by 1.1% (reflecting cigarette shipment volume down by 2.2%, and heated tobacco unit shipment volume up by 30.1% to 46.1 billion units)
•Market share for heated tobacco units in IQOS markets, excluding the U.S., up by 1.5 points to 7.4%
•Net revenues up by 10.0%; up by 5.3% excluding currency
•Adjusted net revenues up by 7.1% on an organic basis
•Net revenues from smoke-free products accounted for 28.5% of total adjusted net revenues
•Operating income up by 19.1%; up by 13.4%, excluding currency
•Adjusted operating income up by 18.6% on an organic basis
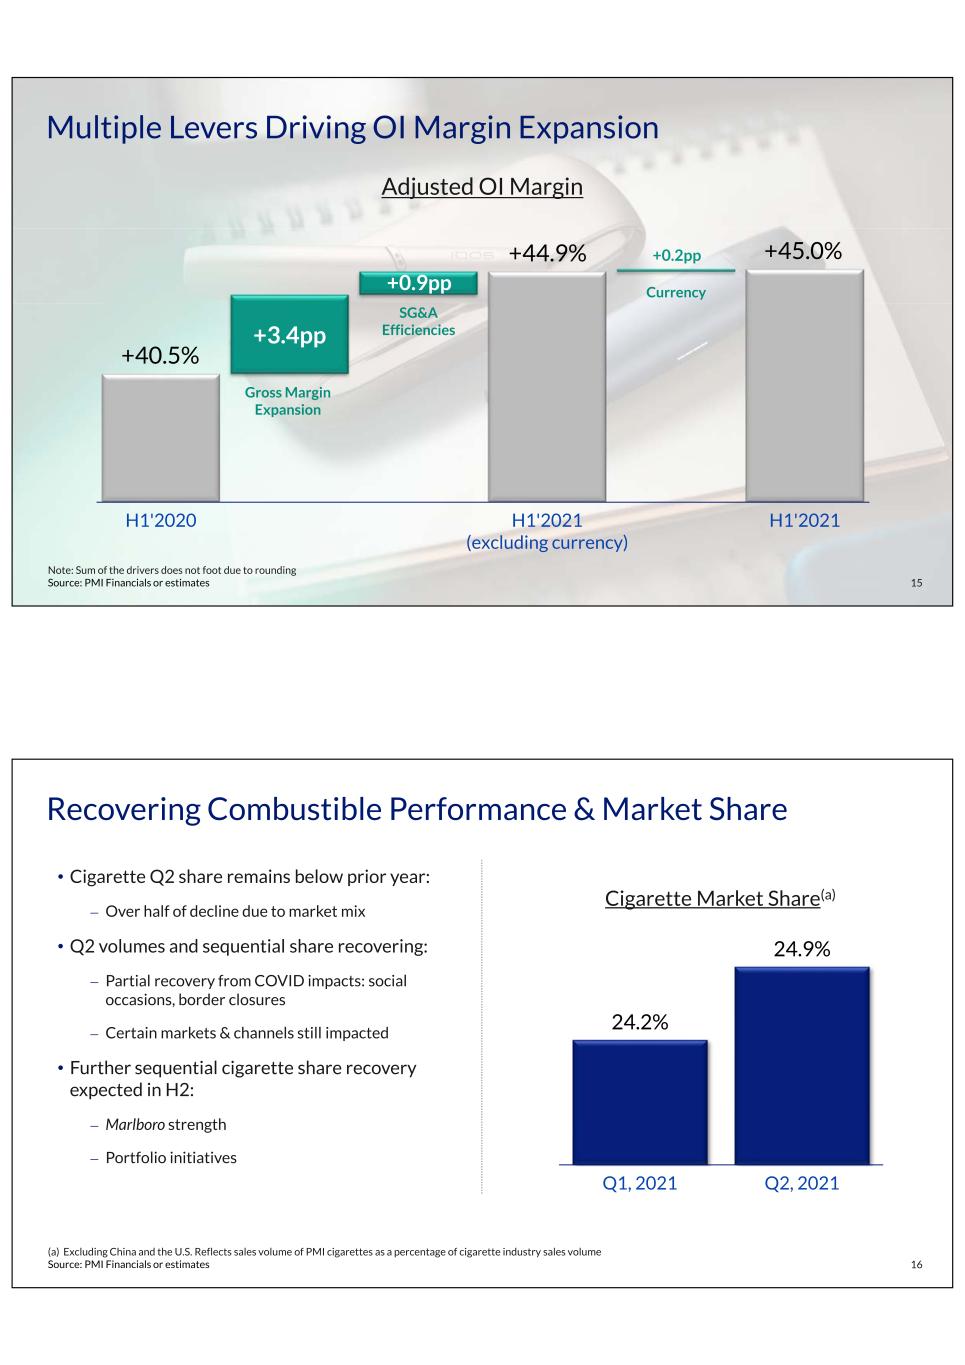
•Adjusted operating income margin of 45.0% up by 4.5 points; up by 4.4 points on an organic basis
"We delivered strong financial performance in the quarter, with adjusted diluted EPS of $1.57 up by 17.8% on an organic basis," said Jacek Olczak, Chief Executive Officer.
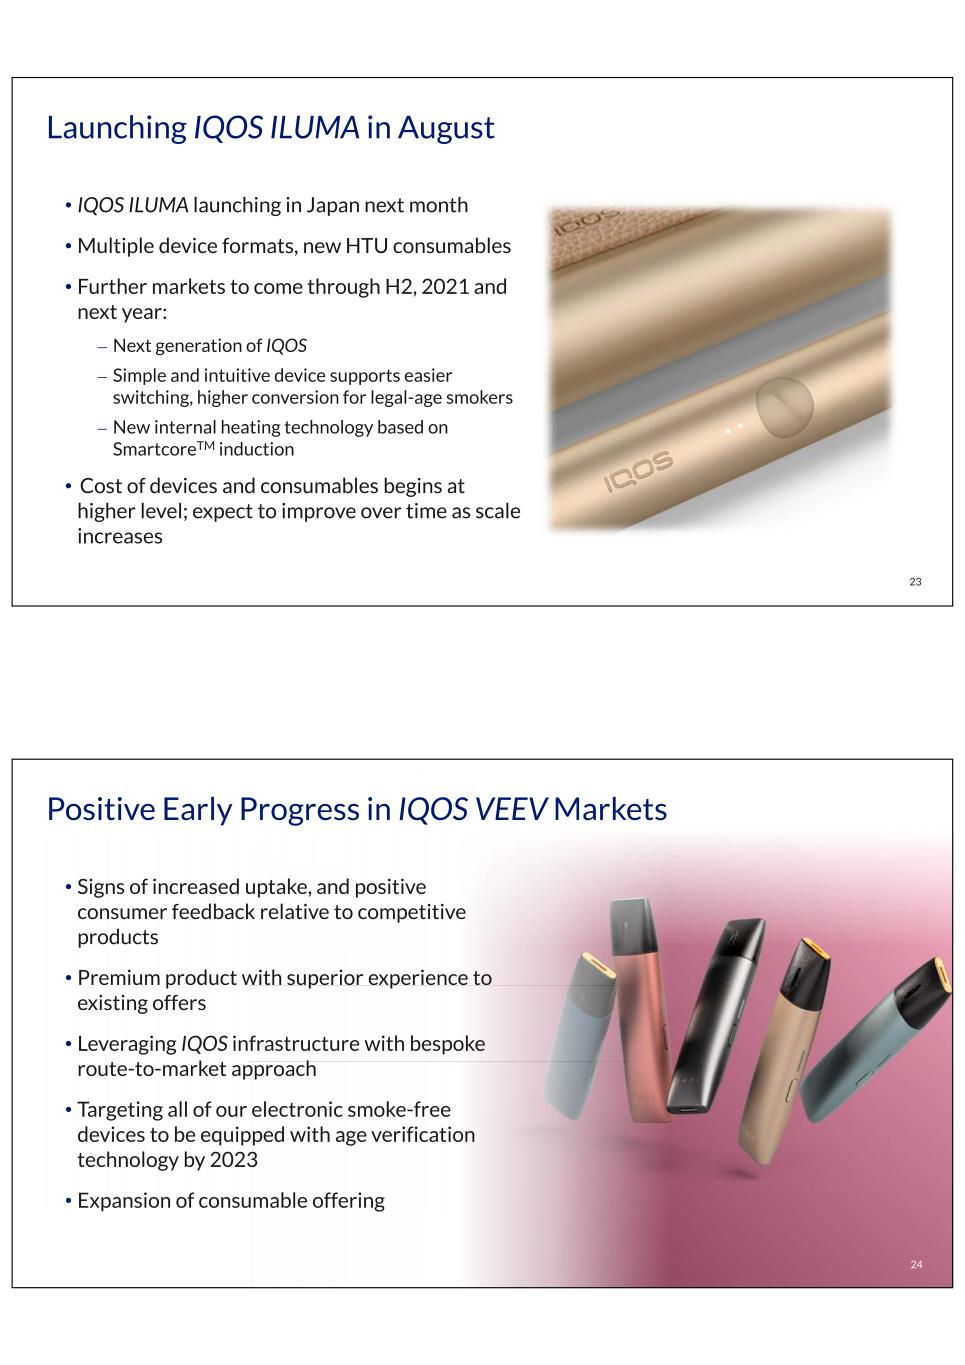
"IQOS continued its impressive growth, surpassing an estimated 20 million total users by quarter-end and driving sequential quarterly heated tobacco unit in-market sales volume growth of 8%. We expect this momentum to be bolstered by the launch of IQOS ILUMA, starting next month in Japan."
"We are increasing our full-year adjusted outlook, with organic net revenue growth of 6% to 7% and adjusted diluted EPS growth of 12% to 14% on the same basis, mainly reflecting improved total industry volume. This outlook further supports our recently announced three-year share repurchase program of up to $7 billion."
"In addition, the proposed acquisitions of Fertin Pharma and Vectura Group will reinforce our long-term growth potential in the beyond nicotine space."
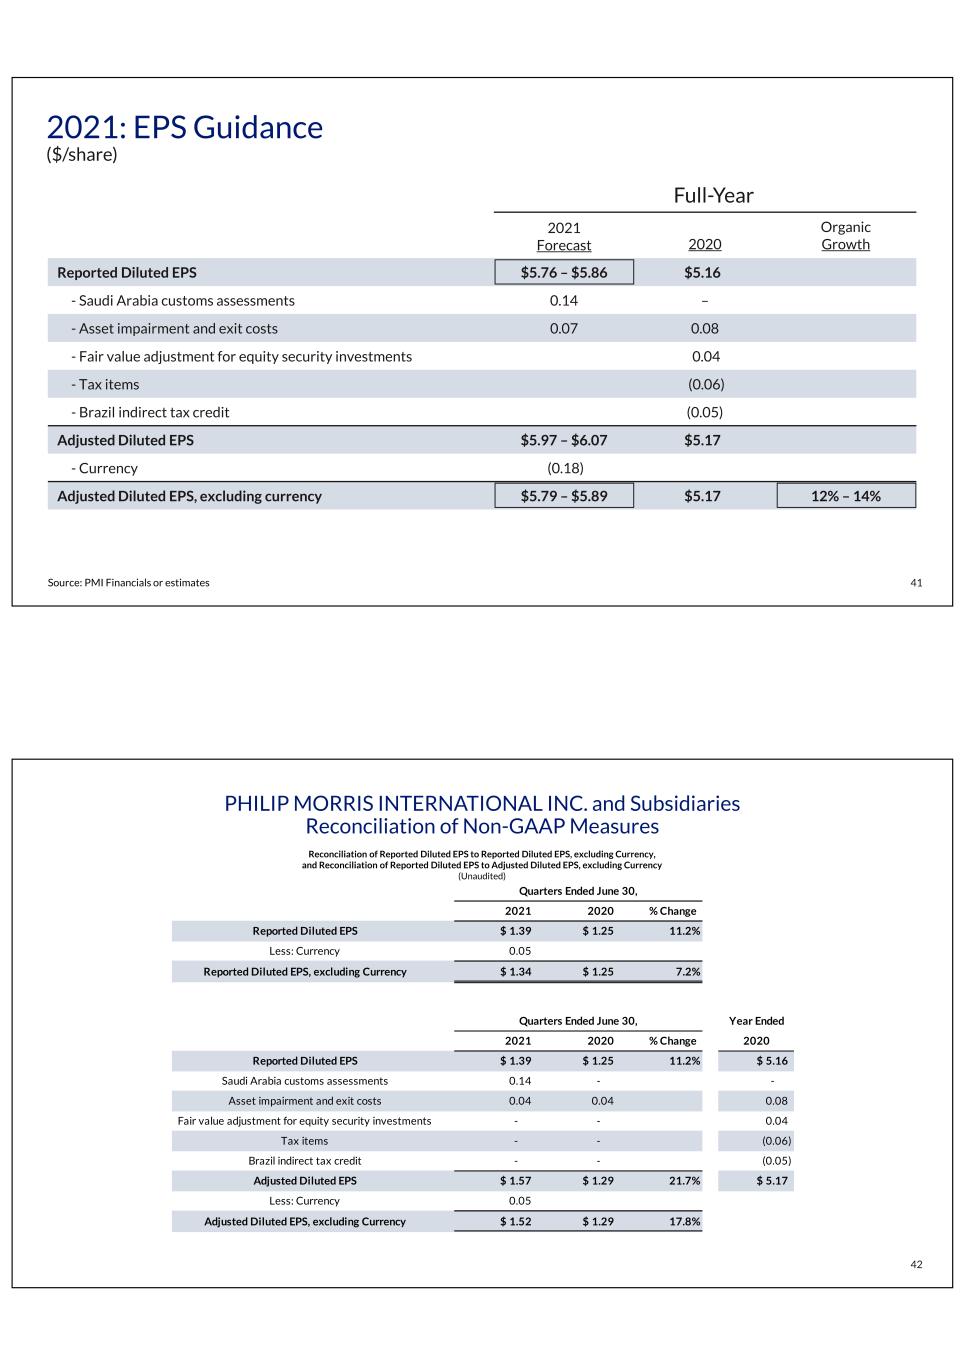
2021 FULL-YEAR FORECAST
| Full-Year | |||||||||||||||||||||||||||||
| 2021 Forecast | 2020 | Organic Growth | |||||||||||||||||||||||||||
| Reported Diluted EPS | $5.76 | - | $5.86 | $ 5.16 | |||||||||||||||||||||||||
| Saudi Arabia customs assessments | 0.14 | — | |||||||||||||||||||||||||||
| Asset impairment and exit costs | 0.07 | 0.08 | |||||||||||||||||||||||||||
| Fair value adjustment for equity security investments | 0.04 | ||||||||||||||||||||||||||||
| Tax items | (0.06) | ||||||||||||||||||||||||||||
| Brazil indirect tax credit | (0.05) | ||||||||||||||||||||||||||||
| Adjusted Diluted EPS | $5.97 | - | $6.07 | $ 5.17 | |||||||||||||||||||||||||
| Currency | (0.18) | ||||||||||||||||||||||||||||
| Adjusted Diluted EPS, excluding currency | $5.79 | - | $5.89 | $ 5.17 | 12% | - | 14% | ||||||||||||||||||||||
PMI revises its full-year reported diluted EPS forecast to a range of $5.76 to $5.86, at prevailing exchange rates, from a range of $5.93 to $6.03 previously, reflecting:
•An adverse impact of $0.14 per share, related to a reduction in net revenues for the Saudi Arabia customs assessments communicated previously;
- 2 -
•Asset impairment and exit costs of $0.07 per share, compared to $0.02 per share previously, mainly due to organizational design optimization;
•A favorable currency impact of $0.18 at prevailing exchange rates, compared to $0.20 per share, previously; and
•Better anticipated underlying business performance, primarily driven by an improved estimated industry volume progression (due to cigarettes) and the corresponding impact on PMI shipment volume.
On an organic basis, this forecast represents a projected increase of around 12% to 14% versus adjusted diluted EPS of $5.17 in 2020, as outlined in the table above.
2021 Full-Year Forecast Assumptions
This forecast assumes:
•A gradual improvement in the general operating environment, with potential volatility around the duration and effects of pandemic-related mobility restrictions across PMI's key markets;
•Lack of near-term recovery in PMI's duty-free business given the uncertain outlook for global travel, with current dynamics persisting through year end;
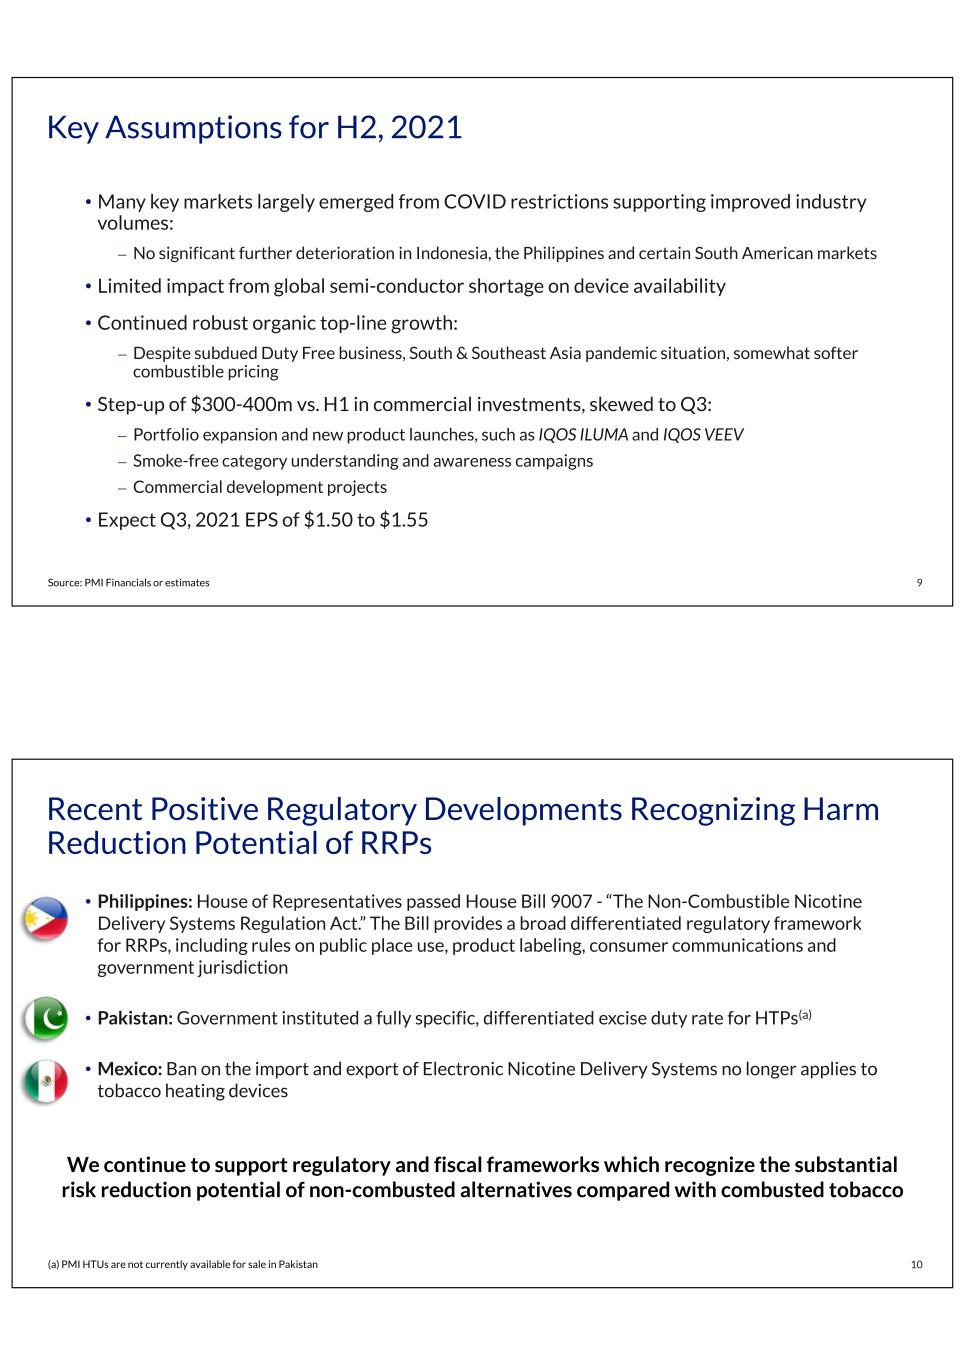
•A limited impact from the current global shortage of semiconductors on the supply of our electronic devices to consumers;
•An estimated total international industry volume progression, excluding China and the U.S., of approximately -1% to +1%, compared to approximately -3% to flat, previously;
•A total cigarette and heated tobacco unit shipment volume progression for PMI of approximately flat to +2%, compared to approximately -2% to +1%, previously;
•Heated tobacco unit shipment volume of 95 to 100 billion units;
•Adjusted net revenue growth of approximately 6% to 7% on an organic basis, compared to approximately 5% to 7%, previously;
•An increase in adjusted operating income margin of around 200 basis points on an organic basis;
•Operating cash flow of around $11 billion at prevailing exchange rates and subject to year-end working capital requirements;
•Capital expenditures of approximately $0.8 billion;
•An effective tax rate, excluding discrete tax events, of around 22%;
•No material impact of any share repurchases;
•No material impact related to the announced agreements to acquire Fertin Pharma A/S or Vectura Group plc;
•A second half of 2021 reflecting:
•The assumption that many of PMI's key markets will have largely emerged from pandemic-related restrictions;
•Continued robust organic net revenue growth; and
•Incremental commercial investments, compared to the first half of 2021, of approximately $300 to $400 million.
•Third-quarter reported diluted EPS in a range of $1.50 to $1.55, including a favorable currency impact, at prevailing exchange rates, of around $0.04 per share.
- 3 -
The foregoing is underpinned by the assumption that, even in the event of prolonged pandemic-related restrictions, there will not be a return to the depressed consumption levels of the second quarter of 2020. This assumption is consistent with the less severe impact on consumption levels observed in the second half of 2020 as COVID-19 spread in a number of markets.
This forecast excludes the impact of any future acquisitions, unanticipated or unquantifiable asset impairment and exit cost charges, future changes in currency exchange rates, further developments pertaining to the judgment in the two Québec Class Action lawsuits and the Companies’ Creditors Arrangement Act (CCAA) protection granted to PMI's Canadian subsidiary, Rothmans, Benson & Hedges, Inc. (RBH), any unusual events, any intensification of the global shortage of semiconductors and the related impact on the supply of our electronic devices, and any COVID-19-related developments different from the assumptions set forth in the company's forecast.
Factors described in the Forward-Looking and Cautionary Statements section of this release represent continuing risks to these projections.
Saudi Arabia Customs Assessments
As previously communicated, in June 2021, the Customs Appeal Committee in Riyadh notified our distributors in Saudi Arabia of its decisions to largely reject their challenges of the Saudi Arabia Customs General Authority assessments described in our Form 10-Q that was filed with the U.S. Securities and Exchange Commission for the quarter ended March 31, 2021.
On the basis of these decisions and in line with arrangements with the distributors, PMI recorded a pre-tax charge of $246 million in the second quarter of 2021, resulting in a $0.14 per share adverse impact on reported diluted EPS. In accordance with U.S. GAAP, the charge was recorded as a reduction of net revenues on the consolidated statement of earnings. These amounts are excluded from PMI's adjusted results.
COVID-19: Business Continuity Update
Since the onset of the COVID-19 pandemic, PMI has undertaken a number of business continuity measures to mitigate potential disruption to its operations and route-to-market in order to preserve the availability of products to its customers and adult consumers.
Currently:
•PMI has sufficient access to the inputs for its products and is not facing any significant business continuity issues with respect to key suppliers;
•All of PMI's cigarette and heated tobacco unit manufacturing facilities globally are operational;
•COVID-related restrictions do not have a significant impact on the availability of PMI’s products to its customers and adult consumers; and
•PMI has ample liquidity through cash on hand, the ongoing cash generation of its business, and its access to the commercial paper and debt markets.
- 4 -
Beyond Nicotine
In February 2021, PMI announced its ambition to generate at least $1 billion in annual net revenues from "Beyond Nicotine" products by 2025, leveraging its expertise—in life sciences, inhalation technology, natural ingredients, commercial deployment and ability to change consumer behavior—to explore, develop and grow new adjacent areas to deliver additional growth. The key focus areas identified by PMI include botanical well-being and respiratory drug delivery.
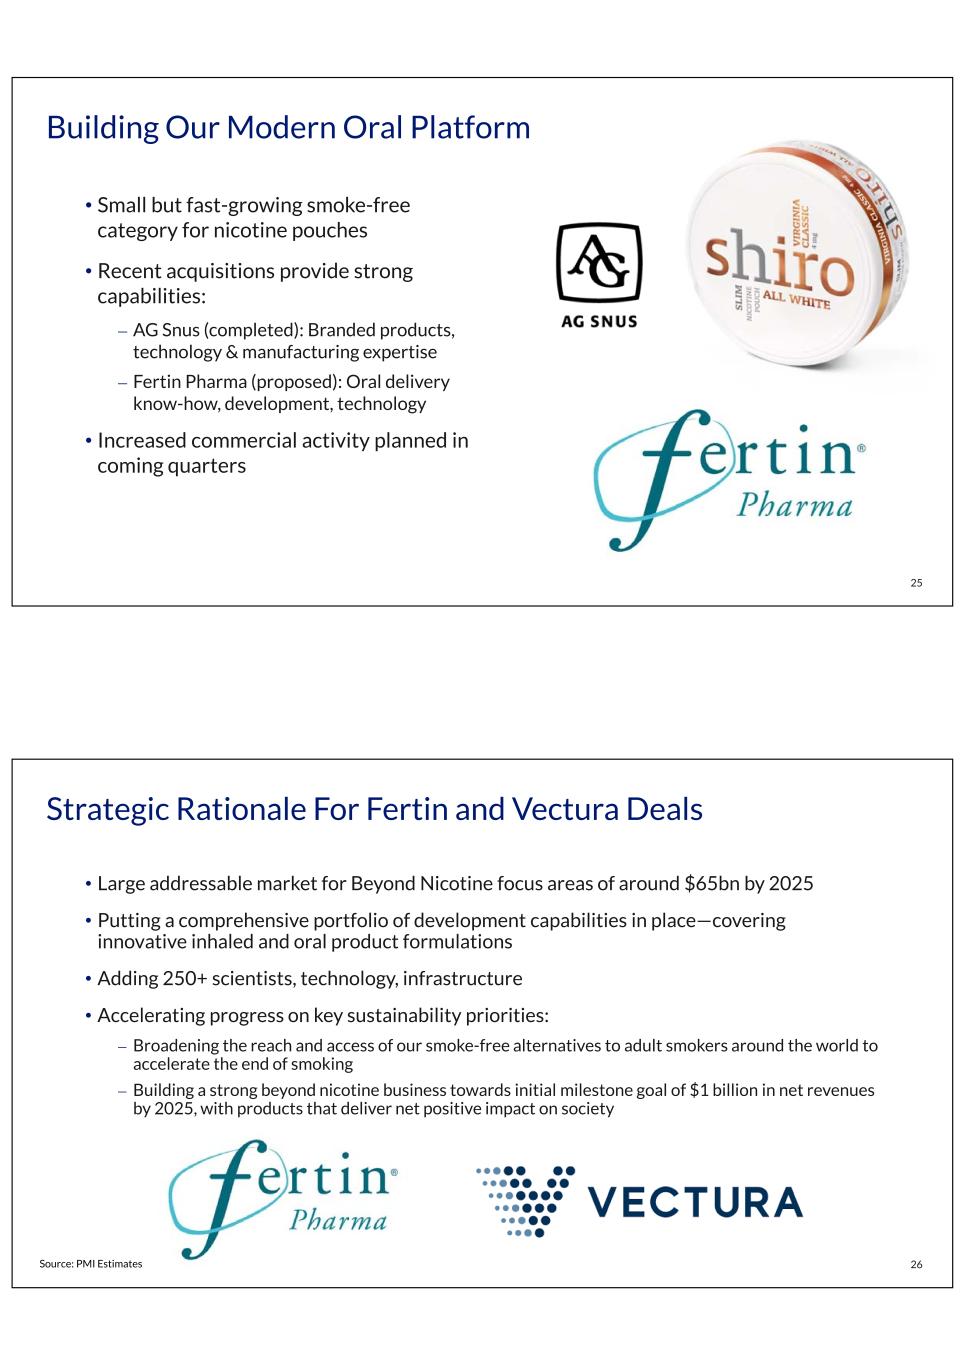
On July 1, 2021, PMI announced an agreement to acquire Fertin Pharma A/S, a leading developer and manufacturer of innovative pharmaceutical and well-being products based on oral and intra-oral delivery systems, for an enterprise value of DKK 5.1 billion (approximately $820 million based on then-prevailing exchange rates). PMI will fund the transaction with existing cash and expects it to close in the fourth quarter of 2021, subject to approval by the appropriate regulatory authorities.
On July 9, 2021, PMI announced it had agreed with the board of Vectura Group plc (Vectura) (LSE: VEC) on the terms of an all-cash, recommended offer to acquire Vectura for an enterprise value of GBP 852 million (calculated as per Appendix II of the Rule 2.7 offer announcement; approximately $1.2 billion based on then-prevailing exchange rates). Vectura is a provider of innovative inhaled drug delivery solutions that enable partners to bring their medicines to patients. The company has thirteen key inhaled products marketed by major global pharmaceutical partners, as well as a diverse portfolio of partnerships for drugs in clinical development. PMI will fund the transaction with existing cash and expects it to close in the second half of 2021, subject to a Vectura shareholder vote and approval by the appropriate regulatory authorities.
Conference Call
A conference call, hosted by Emmanuel Babeau, Chief Financial Officer, will be webcast at 9:00 a.m., Eastern Time, on July 20, 2021. Access is at www.pmi.com/2021Q2earnings.
- 5 -
CONSOLIDATED SHIPMENT VOLUME & MARKET SHARE
| PMI Shipment Volume by Region | Second-Quarter | Six Months Year-to-Date | ||||||||||||||||||||||||
| (million units) | 2021 | 2020 | Change | 2021 | 2020 | Change | ||||||||||||||||||||
| Cigarettes | ||||||||||||||||||||||||||
| European Union | 41,504 | 40,317 | 2.9 | % | 78,273 | 80,963 | (3.3) | % | ||||||||||||||||||
| Eastern Europe | 22,785 | 23,657 | (3.7) | % | 42,751 | 45,076 | (5.2) | % | ||||||||||||||||||
| Middle East & Africa | 30,347 | 27,188 | 11.6 | % | 57,989 | 57,184 | 1.4 | % | ||||||||||||||||||
| South & Southeast Asia | 35,321 | 33,346 | 5.9 | % | 70,209 | 70,941 | (1.0) | % | ||||||||||||||||||
| East Asia & Australia | 10,968 | 12,071 | (9.1) | % | 22,330 | 24,370 | (8.4) | % | ||||||||||||||||||
| Latin America & Canada | 15,213 | 14,780 | 2.9 | % | 30,098 | 29,843 | 0.9 | % | ||||||||||||||||||
| Total PMI | 156,138 | 151,359 | 3.2 | % | 301,650 | 308,377 | (2.2) | % | ||||||||||||||||||
| Heated Tobacco Units | ||||||||||||||||||||||||||
| European Union | 6,921 | 4,227 | 63.7 | % | 13,347 | 8,888 | 50.2 | % | ||||||||||||||||||
| Eastern Europe | 6,840 | 5,126 | 33.4 | % | 12,475 | 9,492 | 31.4 | % | ||||||||||||||||||
| Middle East & Africa | 512 | 185 | +100% | 908 | 655 | 38.6 | % | |||||||||||||||||||
| South & Southeast Asia | 39 | — | — | % | 72 | — | — | % | ||||||||||||||||||
| East Asia & Australia | 9,904 | 9,076 | 9.1 | % | 19,043 | 16,198 | 17.6 | % | ||||||||||||||||||
| Latin America & Canada | 140 | 94 | 48.9 | % | 245 | 202 | 21.3 | % | ||||||||||||||||||
| Total PMI | 24,356 | 18,708 | 30.2 | % | 46,090 | 35,435 | 30.1 | % | ||||||||||||||||||
| Cigarettes and Heated Tobacco Units | ||||||||||||||||||||||||||
| European Union | 48,425 | 44,544 | 8.7 | % | 91,620 | 89,851 | 2.0 | % | ||||||||||||||||||
| Eastern Europe | 29,625 | 28,783 | 2.9 | % | 55,226 | 54,568 | 1.2 | % | ||||||||||||||||||
| Middle East & Africa | 30,859 | 27,373 | 12.7 | % | 58,897 | 57,839 | 1.8 | % | ||||||||||||||||||
| South & Southeast Asia | 35,360 | 33,346 | 6.0 | % | 70,281 | 70,941 | (0.9) | % | ||||||||||||||||||
| East Asia & Australia | 20,872 | 21,147 | (1.3) | % | 41,373 | 40,568 | 2.0 | % | ||||||||||||||||||
| Latin America & Canada | 15,353 | 14,874 | 3.2 | % | 30,343 | 30,045 | 1.0 | % | ||||||||||||||||||
| Total PMI | 180,494 | 170,067 | 6.1 | % | 347,740 | 343,812 | 1.1 | % | ||||||||||||||||||
Second-Quarter
PMI's total shipment volume increased by 6.1%, driven by:
•the EU, reflecting higher heated tobacco unit shipment volume across the Region, notably in Italy, and higher cigarette shipment volume, notably in Italy and Spain, partly offset by Germany;
•Eastern Europe, reflecting higher heated tobacco unit shipment volume across the Region, primarily in Russia and Ukraine, partly offset by lower cigarette shipment volume, notably in Russia;
•Middle East & Africa, mainly reflecting higher cigarette shipment volume, primarily in North Africa (particularly Egypt), PMI Duty Free and Turkey, partly offset by the GCC (predominantly Saudi Arabia);
•South & Southeast Asia, primarily reflecting higher cigarette shipment volume, mainly in Indonesia and Thailand, partly offset by the Philippines; and
•Latin America & Canada, mainly reflecting higher cigarette shipment volume, notably in Mexico, partly offset by Argentina;
- 6 -
partly offset by
•East Asia & Australia, reflecting lower cigarette shipment volume, mainly in Japan, partly offset by higher heated tobacco unit shipment volume, primarily in Japan.
PMI's cigarette shipment volume increase in the quarter includes a favorable comparison versus the second quarter of 2020, when pandemic-related disruption across many key markets was at its peak.
Impact of Inventory Movements
Excluding the net favorable impact of estimated distributor inventory movements of approximately 3.2 billion units, PMI’s total in-market sales increased by 4.2%, driven by a 27.6% increase in heated tobacco units and a 1.5% increase in cigarettes.
The net favorable impact of approximately 3.2 billion units reflected:
•A net favorable impact of 2.5 billion cigarettes, mainly driven by inventory movements in the second quarter of 2020 related to lower shipments to distributors due to the pandemic; and
•A net favorable impact of 0.7 billion heated tobacco units, primarily reflecting the need to maintain inventory durations for the growing category.
PMI's total heated tobacco unit in-market sales volume in the quarter was 23.0 billion units, reflecting sequential growth of 8.0% compared to the first quarter of 2021. The company believes that the current level of heated tobacco unit inventory is appropriate based on anticipated sales.
Six Months Year-to-Date
PMI's total shipment volume increased by 1.1%, driven by:
•the EU, reflecting higher heated tobacco unit shipment volume across the Region, particularly in Italy and Poland, partly offset by lower cigarette shipment volume, notably in the Czech Republic, France and Germany, partly offset by Italy and Spain;
•Eastern Europe, reflecting higher heated tobacco unit shipment volume, notably in Russia and Ukraine, partly offset by lower cigarette shipment volume, mainly in Russia and Ukraine;
•Middle East & Africa, reflecting higher cigarette shipment volume (primarily in Turkey, partly offset by the GCC, North Africa and PMI Duty Free), as well as higher heated tobacco unit shipment volume (driven notably by the GCC and Lebanon, partly offset by PMI Duty Free);
•East Asia & Australia, reflecting higher heated tobacco unit shipment volume driven by Japan, partly offset by lower cigarette shipment volume, predominantly in Japan and South Korea; and
•Latin America & Canada, reflecting higher cigarette shipment volume, primarily in Brazil and Mexico, partially offset by Argentina;
partly offset by
•South & Southeast Asia, reflecting lower cigarette shipment volume, primarily in the Philippines, partially offset by Indonesia, Pakistan and Thailand.
Impact of Inventory Movements
The net impact of estimated distributor inventory movements for the first half of the year was immaterial to PMI's total shipment volume performance. PMI’s total in-market sales volume increased by 0.5%.
- 7 -
PMI Shipment Volume by Brand
| PMI Shipment Volume by Brand | Second-Quarter | Six Months Year-to-Date | ||||||||||||||||||||||||
| (million units) | 2021 | 2020 | Change | 2021 | 2020 | Change | ||||||||||||||||||||
| Cigarettes | ||||||||||||||||||||||||||
| Marlboro | 58,466 | 54,812 | 6.7 | % | 112,148 | 114,057 | (1.7) | % | ||||||||||||||||||
| L&M | 22,096 | 22,385 | (1.3) | % | 42,464 | 45,025 | (5.7) | % | ||||||||||||||||||
| Chesterfield | 14,269 | 12,604 | 13.2 | % | 27,027 | 25,507 | 6.0 | % | ||||||||||||||||||
| Philip Morris | 10,590 | 11,106 | (4.6) | % | 20,774 | 22,569 | (7.9) | % | ||||||||||||||||||
| Parliament | 10,023 | 8,462 | 18.4 | % | 18,980 | 16,035 | 18.4 | % | ||||||||||||||||||
| Sampoerna A | 9,186 | 7,254 | 26.6 | % | 17,884 | 15,802 | 13.2 | % | ||||||||||||||||||
| Dji Sam Soe | 5,422 | 5,797 | (6.5) | % | 11,126 | 11,972 | (7.1) | % | ||||||||||||||||||
| Bond Street | 4,630 | 6,428 | (28.0) | % | 9,158 | 12,041 | (23.9) | % | ||||||||||||||||||
| Lark | 3,882 | 4,189 | (7.3) | % | 7,781 | 8,213 | (5.3) | % | ||||||||||||||||||
| Sampoerna Hijau | 2,029 | 1,566 | 29.5 | % | 4,228 | 3,043 | 38.9 | % | ||||||||||||||||||
| Others | 15,545 | 16,756 | (7.2) | % | 30,080 | 34,113 | (11.8) | % | ||||||||||||||||||
| Total Cigarettes | 156,138 | 151,359 | 3.2 | % | 301,650 | 308,377 | (2.2) | % | ||||||||||||||||||
| Heated Tobacco Units | 24,356 | 18,708 | 30.2 | % | 46,090 | 35,435 | 30.1 | % | ||||||||||||||||||
| Total PMI | 180,494 | 170,067 | 6.1 | % | 347,740 | 343,812 | 1.1 | % | ||||||||||||||||||
Note: Sampoerna A includes Sampoerna; Philip Morris includes Philip Morris/Dubliss; and Lark includes Lark Harmony. | ||||||||||||||||||||||||||
Second-Quarter
PMI's cigarette shipment volume of the following brands increased:
•Marlboro, mainly driven by Italy, PMI Duty Free, Spain and Turkey, partly offset by the GCC and Japan;
•Chesterfield, primarily driven by Russia, partly offset by Saudi Arabia;
•Parliament, mainly driven by Saudi Arabia and Turkey;
•Sampoerna A in Indonesia, primarily driven by premium A Mild; and
•Sampoerna Hijau in Indonesia.
PMI's cigarette shipment volume of the following brands decreased:
•L&M, notably due to Germany, Saudi Arabia and Turkey, partly offset by North Africa, Spain and Thailand;
•Philip Morris, primarily due to Russia;
•Dji Sam Soe in Indonesia, mainly due to Dji Sam Soe Magnum Mild;
•Bond Street, primarily due to Russia;
•Lark, mainly due to Japan; and
•"Others," primarily due to: mid-price Fortune (Philippines) and Sampoerna U (Indonesia).
The increase in PMI's heated tobacco unit shipment volume was mainly driven by the EU (notably Italy), Eastern Europe (notably Russia and Ukraine) and Japan.
International Share of Market
PMI's total international market share (excluding China and the U.S.), defined as PMI's cigarette and heated tobacco unit sales volume as a percentage of total industry cigarette and heated tobacco unit sales volume, decreased by 0.8 points to 27.3%, reflecting:
•Total international market share for cigarettes of 23.8%, down by 1.3 points; and
•Total international market share for heated tobacco units of 3.5%, up by 0.5 points.
- 8 -
PMI's total international cigarette sales volume as a percentage of total industry cigarette sales volume was down by 1.1 points to 24.9%, mainly reflecting lower cigarette market share and/or an unfavorable geographic mix impact, notably in France, Germany, Japan, the Philippines and Russia, partly offset by Indonesia, PMI Duty Free and Turkey.
Six Months Year-to-Date
PMI's cigarette shipment volume of the following brands increased:
•Chesterfield, mainly due to Brazil, the Philippines and Russia, partly offset by Saudi Arabia;
•Parliament, primarily due to Russia, Saudi Arabia and Turkey, partly offset by Japan;
•Sampoerna A in Indonesia, mainly due to premium A Mild; and
•Sampoerna Hijau in Indonesia.
PMI's cigarette shipment volume of the following brands decreased:
•Marlboro, mainly due to France, Japan, Kuwait, the Philippines and PMI Duty Free, partly offset by Mexico and Turkey;
•L&M, notably due to Egypt, Germany, Poland and Turkey, partly offset by Spain and Thailand;
•Philip Morris, primarily due to Indonesia, Italy and Russia, partly offset by Japan;
•Dji Sam Soe in Indonesia, mainly due to Dji Sam Soe Magnum Mild;
•Bond Street, mainly due to Russia and Ukraine;
•Lark, primarily due to Japan; and
•"Others," notably due to: mid-price Fortune (Philippines), Hope (Philippines) and Sampoerna U (Indonesia); and low-price Jackpot (Philippines); partly offset by low-price Diana (Italy) and Morven (Pakistan).
The increase in PMI's heated tobacco unit shipment volume was mainly driven by the EU (notably Italy), Eastern Europe (notably Russia and Ukraine) and Japan.
International Share of Market
PMI's total international market share (excluding China and the U.S.) decreased by 0.8 points to 27.0%, reflecting:
•Total international market share for cigarettes of 23.5%, down by 1.4 points; and
•Total international market share for heated tobacco units of 3.5%, up by 0.6 points.
PMI's total international cigarette sales volume as a percentage of total industry cigarette sales volume was down by 1.2 points to 24.6%, mainly reflecting lower cigarette market share and/or an unfavorable geographic mix impact, notably in Japan, the Philippines and Russia, partly offset by Turkey.
- 9 -
CONSOLIDATED FINANCIAL SUMMARY
Second-Quarter
| Financial Summary - Quarters Ended June 30, | Change Fav./(Unfav.) | Variance Fav./(Unfav.) | ||||||||||||||||||||||||||||||||||||
| 2021 | 2020 | Total | Excl. Curr. | Total | Cur- rency | Price | Vol/ Mix | Cost/ Other | ||||||||||||||||||||||||||||||
| (in millions) | ||||||||||||||||||||||||||||||||||||||
| Net Revenues | $ 7,594 | $ 6,651 | 14.2 | % | 7.9 | % | 943 | 420 | 226 | 575 | (278) | |||||||||||||||||||||||||||
| Saudi Arabia Customs Assessments | (246) | — | — | % | — | % | (246) | — | — | — | (246) | |||||||||||||||||||||||||||
| Adjusted Net Revenues | $ 7,840 | $ 6,651 | 17.9 | % | 11.6 | % | 1,189 | 420 | 226 | 575 | (32) | |||||||||||||||||||||||||||
| Net Revenues (1) | $ 7,594 | $ 6,651 | 14.2 | % | 7.9 | % | 943 | 420 | 226 | 575 | (278) | |||||||||||||||||||||||||||
| Cost of Sales | (2,353) | (2,179) | (8.0) | % | (1.9) | % | (174) | (133) | — | (147) | 106 | |||||||||||||||||||||||||||
| Marketing, Administration and Research Costs | (2,093) | (1,722) | (21.5) | % | (12.3) | % | (371) | (159) | — | — | (212) | |||||||||||||||||||||||||||
| Amortization of Intangibles | (19) | (19) | — | % | 5.3 | % | — | (1) | — | — | 1 | |||||||||||||||||||||||||||
| Operating Income | $ 3,129 | $ 2,731 | 14.6 | % | 9.9 | % | 398 | 127 | 226 | 428 | (383) | |||||||||||||||||||||||||||
| Asset Impairment & Exit Costs (2) | (79) | (71) | (11.3) | % | (11.3) | % | (8) | — | — | — | (8) | |||||||||||||||||||||||||||
| Saudi Arabia Customs Assessments (3) | (246) | — | — | % | — | % | (246) | — | — | — | (246) | |||||||||||||||||||||||||||
| Adjusted Operating Income | $ 3,454 | $ 2,802 | 23.3 | % | 18.7 | % | 652 | 127 | 226 | 428 | (129) | |||||||||||||||||||||||||||
| Adjusted Operating Income Margin | 44.1 | % | 42.1 | % | 2.0pp | 2.7 | pp | |||||||||||||||||||||||||||||||
(1) Cost/Other variance includes a reduction in net revenues of $246 million in 2021 related to the Saudi Arabia customs assessments. | ||||||||||||||||||||||||||||||||||||||
(2) Included in Marketing, Administration and Research Costs above. | ||||||||||||||||||||||||||||||||||||||
(3) Included in Net Revenues above. | ||||||||||||||||||||||||||||||||||||||
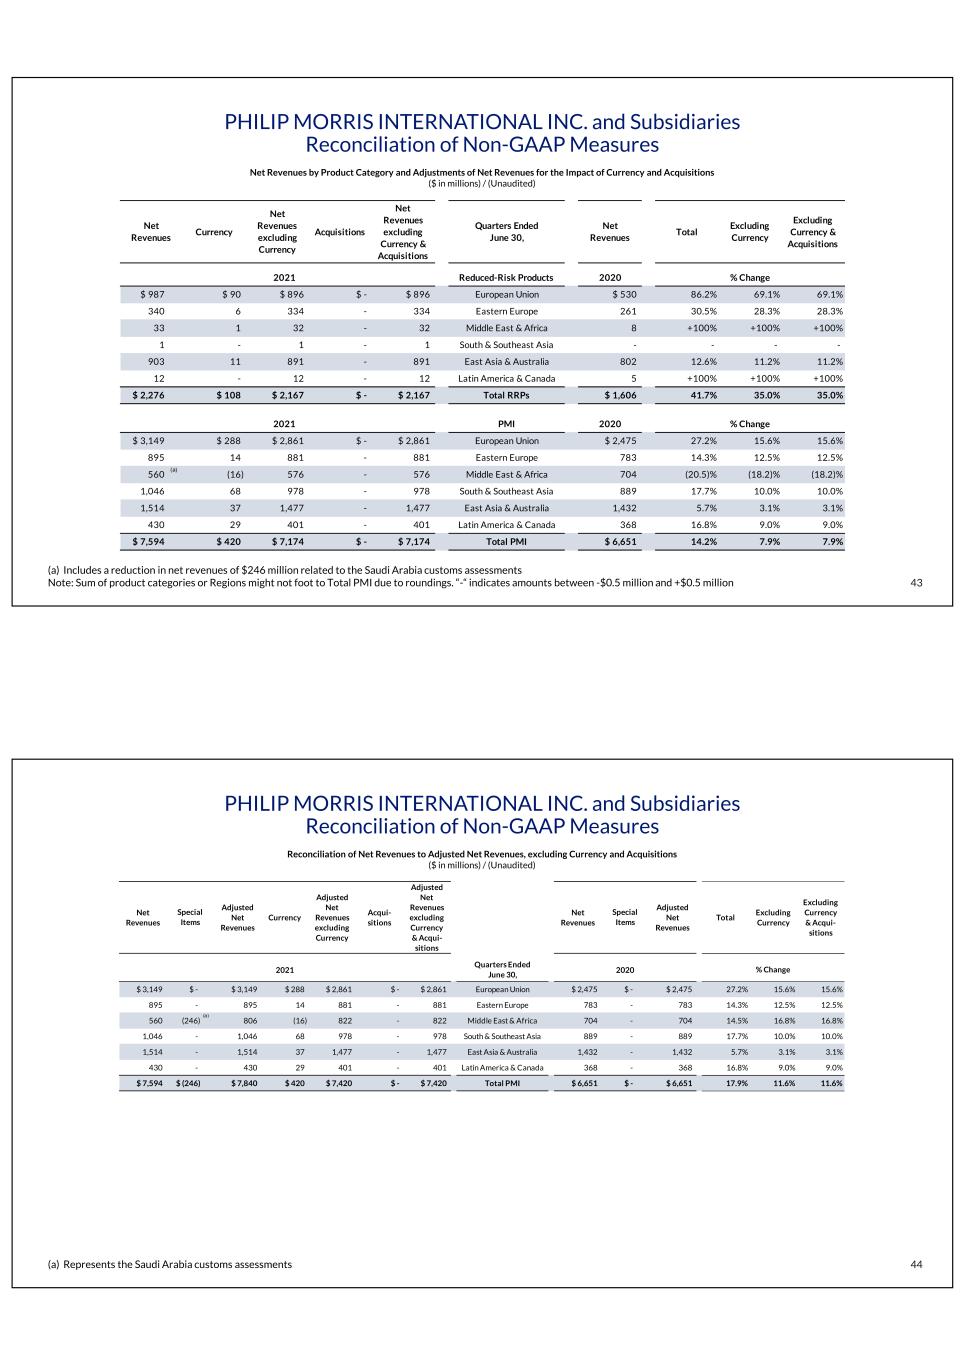
Net revenues increased by 7.9%, excluding currency, mainly reflecting: favorable volume/mix, primarily driven by higher heated tobacco unit volume (notably in the EU, particularly Italy and Poland, as well as Japan, Russia and Ukraine) and higher cigarette volume (mainly in Indonesia, Italy, PMI Duty Free and Spain, partly offset by the GCC, Germany, Japan and the Philippines); and a favorable pricing variance (notably driven by Germany, Japan, the Philippines, Russia and Turkey, partly offset by Indonesia); partly offset by the unfavorable impact of the Saudi Arabia customs assessments of $246 million, shown in "Cost/Other". Adjusted net revenues increased by 11.6% on an organic basis, as detailed above and in Schedule 5.
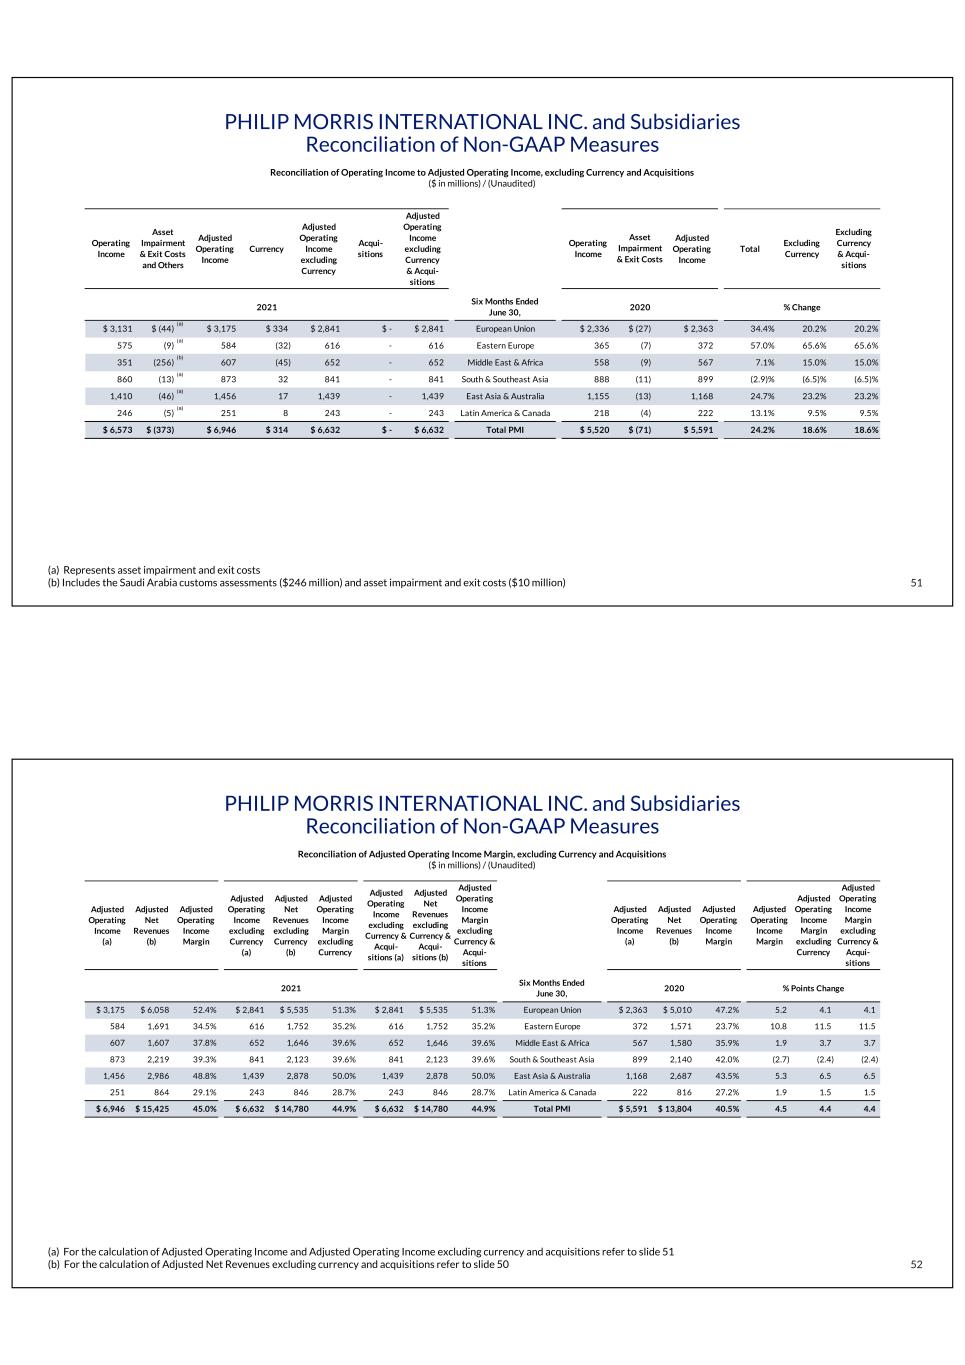
Operating income increased by 9.9%, excluding currency, primarily reflecting: favorable volume/mix, primarily driven by higher heated tobacco unit volume (reflecting the same geographies as for net revenues noted above); a favorable pricing variance; and lower manufacturing costs (driven by productivity gains related to reduced-risk and combustible products); partly offset by the unfavorable impact of the Saudi Arabia customs assessments (as noted above for net revenues); and higher marketing, administration and research costs.
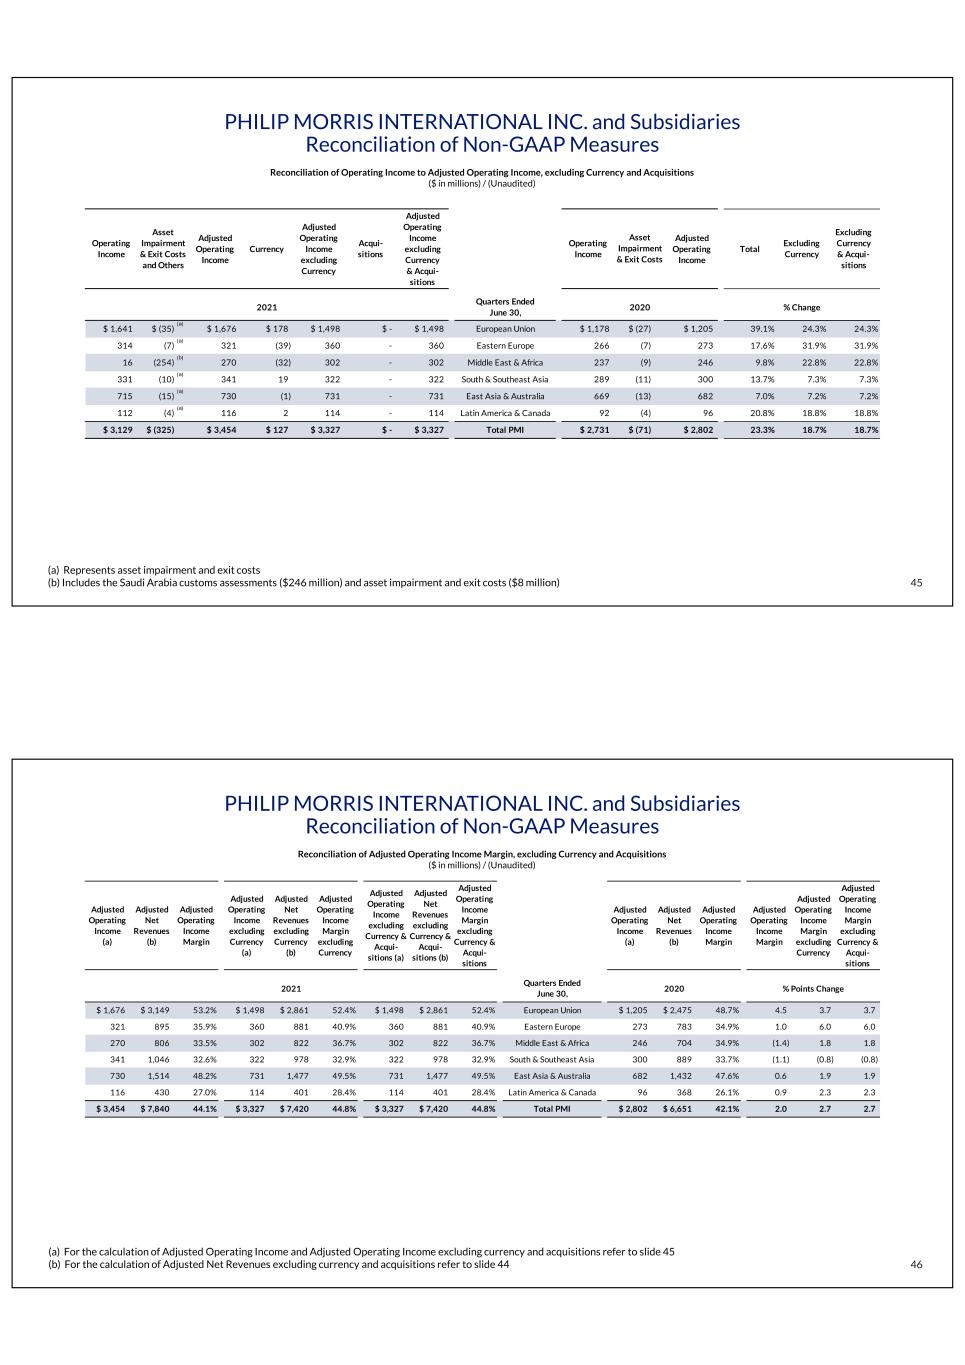
Adjusted operating income increased by 18.7% on an organic basis. Adjusted operating income margin increased by 2.7 points on the same basis, as detailed in Schedule 8.
- 10 -
Six Months Year-to-Date
| Financial Summary - Six Months Ended June 30, | Change Fav./(Unfav.) | Variance Fav./(Unfav.) | ||||||||||||||||||||||||||||||||||||
| 2021 | 2020 | Total | Excl. Curr. | Total | Cur- rency | Price | Vol/ Mix | Cost/ Other | ||||||||||||||||||||||||||||||
| (in millions) | ||||||||||||||||||||||||||||||||||||||
| Net Revenues | $ 15,179 | $ 13,804 | 10.0 | % | 5.3 | % | 1,375 | 645 | 432 | 544 | (246) | |||||||||||||||||||||||||||
| Saudi Arabia Customs Assessments | (246) | — | — | % | — | % | (246) | — | — | — | (246) | |||||||||||||||||||||||||||
| Adjusted Net Revenues | $ 15,425 | $ 13,804 | 11.7 | % | 7.1 | % | 1,621 | 645 | 432 | 544 | — | |||||||||||||||||||||||||||
| Net Revenues (1) | $ 15,179 | $ 13,804 | 10.0 | % | 5.3 | % | 1,375 | 645 | 432 | 544 | (246) | |||||||||||||||||||||||||||
| Cost of Sales | (4,627) | (4,581) | (1.0) | % | 3.8 | % | (46) | (220) | — | (118) | 292 | |||||||||||||||||||||||||||
| Marketing, Administration and Research Costs | (3,942) | (3,666) | (7.5) | % | (4.5) | % | (276) | (110) | — | — | (166) | |||||||||||||||||||||||||||
| Amortization of Intangibles | (37) | (37) | — | % | 2.7 | % | — | (1) | — | — | 1 | |||||||||||||||||||||||||||
| Operating Income | $ 6,573 | $ 5,520 | 19.1 | % | 13.4 | % | 1,053 | 314 | 432 | 426 | (119) | |||||||||||||||||||||||||||
| Asset Impairment & Exit Costs (2) | (127) | (71) | (78.9) | % | (78.9) | % | (56) | — | — | — | (56) | |||||||||||||||||||||||||||
| Saudi Arabia Customs Assessments (3) | (246) | — | — | % | — | % | (246) | — | — | — | (246) | |||||||||||||||||||||||||||
| Adjusted Operating Income | $ 6,946 | $ 5,591 | 24.2 | % | 18.6 | % | 1,355 | 314 | 432 | 426 | 183 | |||||||||||||||||||||||||||
| Adjusted Operating Income Margin | 45.0 | % | 40.5 | % | 4.5pp | 4.4pp | ||||||||||||||||||||||||||||||||
(1) Cost/Other variance includes a reduction in net revenues of $246 million in 2021 related to the Saudi Arabia customs assessments. | ||||||||||||||||||||||||||||||||||||||
(2) Included in Marketing, Administration and Research Costs above. | ||||||||||||||||||||||||||||||||||||||
(3) Included in Net Revenues above. | ||||||||||||||||||||||||||||||||||||||
Net revenues increased by 5.3%, excluding currency, mainly reflecting: favorable volume/mix, primarily driven by higher heated tobacco unit volume (notably in the EU, particularly Germany, Italy and Poland, as well as Japan, Russia and Ukraine), partly offset by lower cigarette volume (mainly in the EU Region, notably Germany, as well as Japan, Kuwait, North Africa, the Philippines and PMI Duty Free, partially offset by Indonesia and Turkey); and a favorable pricing variance (notably driven by Germany, Japan, North Africa, the Philippines, Russia and Turkey, partly offset by Indonesia and Poland); partially offset by the unfavorable impact of the Saudi Arabia customs assessments of $246 million, shown in "Cost/Other". Adjusted net revenues increased by 7.1% on an organic basis, as detailed above and in Schedule 5.
Operating income increased by 13.4%, excluding currency, primarily reflecting: a favorable pricing variance; favorable volume/mix, mainly driven by the same factors as for net revenues noted above; and lower manufacturing costs (driven by productivity gains related to reduced-risk and combustible products); partly offset by the unfavorable impact of the Saudi Arabia customs assessments (as noted above for net revenues); and higher marketing, administration and research costs, including higher asset impairment and exit costs (mainly related to organizational design optimization, as well as product distribution restructuring in South Korea).
Adjusted operating income increased by 18.6% on an organic basis. Adjusted operating income margin increased by 4.4 points on the same basis, as detailed in Schedule 8.
- 11 -
EUROPEAN UNION REGION
Second-Quarter
| Financial Summary - Quarters Ended June 30, | Change Fav./(Unfav.) | Variance Fav./(Unfav.) | ||||||||||||||||||||||||||||||||||||
| 2021 | 2020 | Total | Excl. Curr. | Total | Cur- rency | Price | Vol/ Mix | Cost/ Other | ||||||||||||||||||||||||||||||
| (in millions) | ||||||||||||||||||||||||||||||||||||||
| Net Revenues | $ 3,149 | $ 2,475 | 27.2 | % | 15.6 | % | 674 | 288 | 35 | 351 | — | |||||||||||||||||||||||||||
| Operating Income | $ 1,641 | $ 1,178 | 39.3 | % | 24.2 | % | 463 | 178 | 35 | 304 | (54) | |||||||||||||||||||||||||||
| Asset Impairment & Exit Costs (1) | (35) | (27) | (29.6) | % | (29.6) | % | (8) | — | — | — | (8) | |||||||||||||||||||||||||||
| Adjusted Operating Income | $ 1,676 | $ 1,205 | 39.1 | % | 24.3 | % | 471 | 178 | 35 | 304 | (46) | |||||||||||||||||||||||||||
| Adjusted Operating Income Margin | 53.2 | % | 48.7 | % | 4.5pp | 3.7pp | ||||||||||||||||||||||||||||||||
(1) Included in marketing, administration and research costs at the consolidated operating income level. | ||||||||||||||||||||||||||||||||||||||
Net revenues increased by 15.6% on an organic basis, reflecting: favorable volume/mix, mainly driven by higher heated tobacco unit volume (notably in Italy and Poland), partly offset by unfavorable cigarette volume/mix (notably unfavorable volume/mix in Germany, partly offset by higher volume in Italy and Spain); and a favorable pricing variance (driven by higher combustible pricing, particularly in Germany).
Operating income increased by 24.2%, excluding currency, primarily reflecting: favorable volume/mix, driven by the same factors as for net revenues noted above; lower manufacturing costs (driven mainly by combustible products); and a favorable pricing variance; partly offset by higher marketing, administration and research costs.
Adjusted operating income increased by 24.3% on an organic basis. Adjusted operating income margin increased by 3.7 points on the same basis, as detailed in Schedule 8.
Six Months Year-to-Date
| Financial Summary - Six Months Ended June 30, | Change Fav./(Unfav.) | Variance Fav./(Unfav.) | ||||||||||||||||||||||||||||||||||||
| 2021 | 2020 | Total | Excl. Curr. | Total | Cur- rency | Price | Vol/ Mix | Cost/ Other | ||||||||||||||||||||||||||||||
| (in millions) | ||||||||||||||||||||||||||||||||||||||
| Net Revenues | $ 6,058 | $ 5,010 | 20.9 | % | 10.5 | % | 1,048 | 523 | 72 | 453 | — | |||||||||||||||||||||||||||
| Operating Income | $ 3,131 | $ 2,336 | 34.0 | % | 19.7 | % | 795 | 334 | 72 | 405 | (16) | |||||||||||||||||||||||||||
| Asset Impairment & Exit Costs (1) | (44) | (27) | (63.0) | % | (63.0) | % | (17) | — | — | — | (17) | |||||||||||||||||||||||||||
| Adjusted Operating Income | $ 3,175 | $ 2,363 | 34.4 | % | 20.2 | % | 812 | 334 | 72 | 405 | 1 | |||||||||||||||||||||||||||
| Adjusted Operating Income Margin | 52.4 | % | 47.2 | % | 5.2pp | 4.1pp | ||||||||||||||||||||||||||||||||
(1) Included in marketing, administration and research costs at the consolidated operating income level. | ||||||||||||||||||||||||||||||||||||||
Net revenues increased by 10.5% on an organic basis, reflecting: favorable volume/mix, mainly driven by higher heated tobacco unit volume (notably in Germany, Italy and Poland), partly offset by lower cigarette volume (notably in the Czech Republic, France and Germany) and unfavorable cigarette mix (particularly in Germany); and a favorable pricing variance (driven by higher combustible pricing, primarily in Germany, partly offset by Poland).
- 12 -
Operating income increased by 19.7%, excluding currency, primarily reflecting: favorable volume/mix, driven by the same factors as for net revenues noted above; lower manufacturing costs (driven by combustible and reduced-risk products); and a favorable pricing variance; partly offset by higher marketing, administration and research costs.
Adjusted operating income increased by 20.2% on an organic basis. Adjusted operating income margin increased by 4.1 points on the same basis, as detailed in Schedule 8.
Total Market, PMI Shipment & Market Share Commentaries
| European Union Key Data | Second-Quarter | Six Months Year-to-Date | ||||||||||||||||||||||||
| Change | Change | |||||||||||||||||||||||||
| 2021 | 2020 | % / pp | 2021 | 2020 | % / pp | |||||||||||||||||||||
| Total Market (billion units) | 121.6 | 116.1 | 4.8 | % | 228.1 | 225.5 | 1.1 | % | ||||||||||||||||||
| PMI Shipment Volume (million units) | ||||||||||||||||||||||||||
| Cigarettes | 41,504 | 40,317 | 2.9 | % | 78,273 | 80,963 | (3.3) | % | ||||||||||||||||||
| Heated Tobacco Units | 6,921 | 4,227 | 63.7 | % | 13,347 | 8,888 | 50.2 | % | ||||||||||||||||||
| Total EU | 48,425 | 44,544 | 8.7 | % | 91,620 | 89,851 | 2.0 | % | ||||||||||||||||||
| PMI Market Share | ||||||||||||||||||||||||||
| Marlboro | 16.7 | % | 17.7 | % | (1.0) | 16.8 | % | 17.7 | % | (0.9) | ||||||||||||||||
| L&M | 5.7 | % | 6.5 | % | (0.8) | 5.7 | % | 6.5 | % | (0.8) | ||||||||||||||||
| Chesterfield | 5.4 | % | 5.5 | % | (0.1) | 5.4 | % | 5.6 | % | (0.2) | ||||||||||||||||
| Philip Morris | 2.2 | % | 2.6 | % | (0.4) | 2.2 | % | 2.6 | % | (0.4) | ||||||||||||||||
| HEETS | 5.5 | % | 3.9 | % | 1.6 | 5.6 | % | 3.9 | % | 1.7 | ||||||||||||||||
| Others | 3.1 | % | 3.0 | % | 0.1 | 3.2 | % | 3.0 | % | 0.2 | ||||||||||||||||
| Total EU | 38.6 | % | 39.2 | % | (0.6) | 38.9 | % | 39.3 | % | (0.4) | ||||||||||||||||
Note: HEETS includes HEETS Dimensions. | ||||||||||||||||||||||||||
Second-Quarter
The estimated total market in the EU increased by 4.8% to 121.6 billion units, mainly driven by:
•Denmark, up by +100%. Excluding the net favorable impact of estimated trade inventory movements, the total estimated market was down by 16.9%, primarily reflecting the impact of excise tax-driven price increases;
•Italy, up by 9.3%, mainly reflecting the impact on adult smoker average daily consumption of the easing of pandemic-related measures;
•Poland, up by 17.6%, primarily reflecting the impact on adult smoker average daily consumption and border sales of the easing of pandemic-related measures, as well as a lower prevalence of illicit trade; and
•Spain, up by 8.9%, or by 5.2% excluding the net favorable impact of estimated trade inventory movements, mainly reflecting the impact on in-bound tourism and border sales of the easing of pandemic-related measures;
partly offset by
•Germany, down by 7.2%, or by 1.9% excluding the net unfavorable impact of estimated trade inventory movements, primarily due to the impact of price increases.
- 13 -
PMI's total shipment volume increased by 8.7% to 48.4 billion units, primarily driven by:
•Italy, up by 25.8%, or by 11.4% excluding the net favorable impact of estimated distributor inventory movements, mainly reflecting the higher total market and a higher market share driven by heated tobacco units; and
•Spain, up by 51.5%, or by 8.3% excluding the net favorable impact of estimated distributor inventory movements, mainly reflecting the higher total market;
partly offset by
•Germany, down by 7.4%, mainly reflecting the lower total market.
Excluding the net favorable impact of estimated distributor inventory movements, PMI's total in-market sales volume increased by 3.2%.
Six Months Year-to-Date
The estimated total market in the EU increased by 1.1% to 228.1 billion units, primarily driven by:
•Italy, up by 5.4%, mainly reflecting the same factor as in the quarter; and
•Poland, up by 8.3%, primarily reflecting the same factors as in the quarter;
partly offset by
•Czech Republic, down by 10.8%, mainly reflecting the impact, in the first quarter of 2021, of lower border sales due to pandemic-related lockdown measures; and
•France, down by 5.1%, primarily reflecting the impact of excise tax-driven price increases and higher cross-border (non-domestic) purchases due to the easing of pandemic-related measures.
PMI's total shipment volume increased by 2.0% to 91.6 billion units, primarily driven by:
•Italy, up by 14.4%, or by 7.3% excluding the net favorable impact of estimated distributor inventory movements, mainly reflecting the same factors as in the quarter; and
•Spain, up by 7.0%, or by 0.5% excluding the net favorable impact of estimated distributor inventory movements, primarily reflecting the same factor as in the quarter;
partly offset by
•Czech Republic, down by 13.8%, mainly reflecting the lower total market and a lower market share (due to cigarettes, partly offset by heated tobacco units); and
•France, down by 7.1%, mainly reflecting the lower total market and a lower market share of cigarettes.
Excluding the net favorable impact of estimated distributor inventory movements, PMI's total in-market sales volume increased by 0.2%.
- 14 -
EASTERN EUROPE REGION
Second-Quarter
| Financial Summary - Quarters Ended June 30, | Change Fav./(Unfav.) | Variance Fav./(Unfav.) | ||||||||||||||||||||||||||||||||||||
| 2021 | 2020 | Total | Excl. Curr. | Total | Cur- rency | Price | Vol/ Mix | Cost/ Other | ||||||||||||||||||||||||||||||
| (in millions) | ||||||||||||||||||||||||||||||||||||||
| Net Revenues | $ 895 | $ 783 | 14.3 | % | 12.5 | % | 112 | 14 | 22 | 76 | — | |||||||||||||||||||||||||||
| Operating Income | $ 314 | $ 266 | 18.0 | % | 32.7 | % | 48 | (39) | 22 | 56 | 9 | |||||||||||||||||||||||||||
| Asset Impairment & Exit Costs (1) | (7) | (7) | — | % | — | % | — | — | — | — | — | |||||||||||||||||||||||||||
| Adjusted Operating Income | $ 321 | $ 273 | 17.6 | % | 31.9 | % | 48 | (39) | 22 | 56 | 9 | |||||||||||||||||||||||||||
| Adjusted Operating Income Margin | 35.9 | % | 34.9 | % | 1.0pp | 6.0pp | ||||||||||||||||||||||||||||||||
(1) Included in marketing, administration and research costs at the consolidated operating income level. | ||||||||||||||||||||||||||||||||||||||
Net revenues increased by 12.5% on an organic basis, reflecting: favorable volume/mix, driven by higher heated tobacco unit volume (primarily in Russia and Ukraine), partly offset by unfavorable cigarette volume/mix (primarily in Russia); and a favorable pricing variance, mainly driven by higher combustible pricing (primarily in Kazakhstan, Russia and Ukraine).
Operating income increased by 32.7%, excluding currency, primarily reflecting: favorable volume/mix, driven by the same factors as for net revenues noted above; a favorable pricing variance; and lower manufacturing costs (primarily related to reduced-risk products, mainly in Russia).
Adjusted operating income increased by 31.9% on an organic basis. Adjusted operating income margin increased by 6.0 points on the same basis, as detailed in Schedule 8.
Six Months Year-to-Date
| Financial Summary - Six Months Ended June 30, | Change Fav./(Unfav.) | Variance Fav./(Unfav.) | ||||||||||||||||||||||||||||||||||||
| 2021 | 2020 | Total | Excl. Curr. | Total | Cur- rency | Price | Vol/ Mix | Cost/ Other | ||||||||||||||||||||||||||||||
| (in millions) | ||||||||||||||||||||||||||||||||||||||
| Net Revenues | $ 1,691 | $ 1,571 | 7.6 | % | 11.5 | % | 120 | (61) | 46 | 135 | — | |||||||||||||||||||||||||||
| Operating Income | $ 575 | $ 365 | 57.5 | % | 66.3 | % | 210 | (32) | 46 | 113 | 83 | |||||||||||||||||||||||||||
| Asset Impairment & Exit Costs (1) | (9) | (7) | (28.6) | % | (28.6) | % | (2) | — | — | — | (2) | |||||||||||||||||||||||||||
| Adjusted Operating Income | $ 584 | $ 372 | 57.0 | % | 65.6 | % | 212 | (32) | 46 | 113 | 85 | |||||||||||||||||||||||||||
| Adjusted Operating Income Margin | 34.5 | % | 23.7 | % | 10.8pp | 11.5pp | ||||||||||||||||||||||||||||||||
(1) Included in marketing, administration and research costs at the consolidated operating income level. | ||||||||||||||||||||||||||||||||||||||
Net revenues increased by 11.5% on an organic basis, reflecting: favorable volume/mix, driven by higher heated tobacco unit volume (mainly in Russia and Ukraine), partly offset by unfavorable cigarette volume (primarily in Russia and Ukraine); and a favorable pricing variance, mainly driven by higher combustible pricing (primarily in Kazakhstan, Russia and Ukraine).
- 15 -
Operating income increased by 66.3%, excluding currency, primarily reflecting: favorable volume/mix, driven by the same factors as for net revenues noted above; lower manufacturing costs (mainly related to reduced-risk products, primarily in Russia); a favorable pricing variance; and lower marketing, administration and research costs.
Adjusted operating income increased by 65.6% on an organic basis. Adjusted operating income margin increased by 11.5 points on the same basis, as detailed in Schedule 8.
Total Market, PMI Shipment & Market Share Commentaries
| PMI Shipment Volume | Second-Quarter | Six Months Year-to-Date | ||||||||||||||||||||||||
| (million units) | 2021 | 2020 | Change | 2021 | 2020 | Change | ||||||||||||||||||||
| Cigarettes | 22,785 | 23,657 | (3.7) | % | 42,751 | 45,076 | (5.2) | % | ||||||||||||||||||
| Heated Tobacco Units | 6,840 | 5,126 | 33.4 | % | 12,475 | 9,492 | 31.4 | % | ||||||||||||||||||
| Total Eastern Europe | 29,625 | 28,783 | 2.9 | % | 55,226 | 54,568 | 1.2 | % | ||||||||||||||||||
Second-Quarter
The estimated total market in Eastern Europe decreased, mainly due to:
•Russia, down by 2.7%, primarily reflecting the impact of excise tax-driven price increases, partly offset by the impact on adult smoker average daily consumption of the easing of pandemic-related measures; and
•Ukraine, down by 3.7%, mainly reflecting the impact of excise tax-driven price increases and a higher prevalence of illicit trade, partly offset by the impact on adult smoker average daily consumption of the easing of pandemic-related measures.
PMI's total shipment volume increased by 2.9% to 29.6 billion units, notably driven by:
•Ukraine, up by 8.8%, or by 5.0% excluding the net favorable impact of estimated distributor inventory movements, mainly reflecting a higher market share driven by heated tobacco units, partially offset by the lower total market;
partly offset by
•Russia, down by 1.7%. Excluding the net favorable impact of estimated distributor inventory movements (primarily due to cigarettes), PMI's in-market sales decreased by 6.0%, mainly reflecting a lower market share due to cigarettes and the lower total market.
Excluding the net favorable impact of estimated distributor inventory movements, PMI's total in-market sales volume decreased by 0.8%.
Six Months Year-to-Date
The estimated total market in Eastern Europe decreased, notably due to:
•Ukraine, down by 9.5%, mainly reflecting the same factors as in the quarter;
partly offset by
•Russia, up by 0.6%. Excluding the net favorable impact of estimated trade inventory movements, the total estimated market was down by 1.0%, primarily reflecting: the impact of excise tax-driven price increases,
- 16 -
partly offset by the impact on adult smoker average daily consumption of the easing of pandemic-related measures, as well as a lower estimated prevalence of illicit trade.
PMI's total shipment volume increased by 1.2% to 55.2 billion units, mainly driven by:
•Russia, up by 1.0%. Excluding the net favorable impact of estimated distributor inventory movements, PMI’s total in-market sales volume was down by 3.1%, primarily reflecting a lower market share due to cigarettes.
Excluding the net favorable impact of estimated distributor inventory movements, PMI's total in-market sales volume decreased by 1.2%.
MIDDLE EAST & AFRICA REGION
Second-Quarter
| Financial Summary - Quarters Ended June 30, | Change Fav./(Unfav.) | Variance Fav./(Unfav.) | ||||||||||||||||||||||||||||||||||||
| 2021 | 2020 | Total | Excl. Curr. | Total | Cur- rency | Price | Vol/ Mix | Cost/ Other | ||||||||||||||||||||||||||||||
| (in millions) | ||||||||||||||||||||||||||||||||||||||
| Net Revenues | $ 560 | $ 704 | (20.5) | % | (18.2) | % | (144) | (16) | 50 | 100 | (278) | |||||||||||||||||||||||||||
| Saudi Arabia Customs Assessments | (246) | — | — | % | — | % | (246) | — | — | — | (246) | |||||||||||||||||||||||||||
| Adjusted Net Revenues | $ 806 | $ 704 | 14.5 | % | 16.8 | % | 102 | (16) | 50 | 100 | (32) | |||||||||||||||||||||||||||
| Net Revenues (1) | $ 560 | $ 704 | (20.5) | % | (18.2) | % | (144) | (16) | 50 | 100 | (278) | |||||||||||||||||||||||||||
| Operating Income | $ 16 | $ 237 | (93.2) | % | (79.7) | % | (221) | (32) | 50 | 65 | (304) | |||||||||||||||||||||||||||
| Asset Impairment & Exit Costs (2) | (8) | (9) | 11.1 | % | 11.1 | % | 1 | — | — | — | 1 | |||||||||||||||||||||||||||
| Saudi Arabia Customs Assessments (3) | (246) | — | — | % | — | % | (246) | — | — | — | (246) | |||||||||||||||||||||||||||
| Adjusted Operating Income | $ 270 | $ 246 | 9.8 | % | 22.8 | % | 24 | (32) | 50 | 65 | (59) | |||||||||||||||||||||||||||
| Adjusted Operating Income Margin | 33.5 | % | 34.9 | % | (1.4)pp | 1.8pp | ||||||||||||||||||||||||||||||||
(1) Cost/Other variance includes a reduction in net revenues of $246 million in 2021 related to the Saudi Arabia customs assessments. | ||||||||||||||||||||||||||||||||||||||
(2) Included in Marketing, Administration and Research Costs above. | ||||||||||||||||||||||||||||||||||||||
(3) Included in Net Revenues above. | ||||||||||||||||||||||||||||||||||||||
Net revenues decreased by 18.2%, excluding currency, predominantly due to the unfavorable impact of the Saudi Arabia customs assessments of $246 million, shown in "Cost/Other".
Adjusted net revenues increased by 16.8% on an organic basis, as detailed above and in Schedule 5, primarily reflecting: favorable volume/mix, mainly driven by higher cigarette volume (primarily in PMI Duty Free, South Africa and Turkey, partly offset by the GCC), as well as higher heated tobacco unit volume (mainly in PMI Duty Free); and a favorable pricing variance (driven by combustible pricing, mainly in Turkey); partly offset by lower fees for certain distribution rights billed to customers in certain markets, shown in "Cost/Other".
Operating income decreased by 79.7%, excluding currency, predominantly due to the unfavorable impact of the Saudi Arabia customs assessments, as noted above for net revenues.
Adjusted operating income increased by 22.8% on an organic basis, mainly reflecting: favorable volume/mix, due to the same factors as for net revenues noted above; and a favorable pricing variance; partly offset by higher
- 17 -
marketing, administration and research costs; and lower fees for certain distribution rights, as noted above for net revenues.
Adjusted operating income margin increased by 1.8 points on an organic basis, as detailed in Schedule 8.
Six Months Year-to-Date
| Financial Summary - Six Months Ended June 30, | Change Fav./(Unfav.) | Variance Fav./(Unfav.) | ||||||||||||||||||||||||||||||||||||
| 2021 | 2020 | Total | Excl. Curr. | Total | Cur- rency | Price | Vol/ Mix | Cost/ Other | ||||||||||||||||||||||||||||||
| (in millions) | ||||||||||||||||||||||||||||||||||||||
| Net Revenues | $ 1,361 | $ 1,580 | (13.9) | % | (11.4) | % | (219) | (39) | 127 | (59) | (248) | |||||||||||||||||||||||||||
| Saudi Arabia Customs Assessments | (246) | — | — | % | — | % | (246) | — | — | — | (246) | |||||||||||||||||||||||||||
| Adjusted Net Revenues | $ 1,607 | $ 1,580 | 1.7 | % | 4.2 | % | (27) | (39) | 127 | (59) | (2) | |||||||||||||||||||||||||||
| Net Revenues (1) | $ 1,361 | $ 1,580 | (13.9) | % | (11.4) | % | (219) | (39) | 127 | (59) | (248) | |||||||||||||||||||||||||||
| Operating Income | $ 351 | $ 558 | (37.1) | % | (29.0) | % | (207) | (45) | 127 | (65) | (224) | |||||||||||||||||||||||||||
| Asset Impairment & Exit Costs (2) | (10) | (9) | (11.1) | % | (11.1) | % | (1) | — | — | — | (1) | |||||||||||||||||||||||||||
| Saudi Arabia Customs Assessments (3) | (246) | — | — | % | — | % | (246) | — | — | — | (246) | |||||||||||||||||||||||||||
| Adjusted Operating Income | $ 607 | $ 567 | 7.1 | % | 15.0 | % | 40 | (45) | 127 | (65) | 23 | |||||||||||||||||||||||||||
| Adjusted Operating Income Margin | 37.8 | % | 35.9 | % | 1.9pp | 3.7pp | ||||||||||||||||||||||||||||||||
(1) Cost/Other variance includes a reduction in net revenues of $246 million in 2021 related to the Saudi Arabia customs assessments. | ||||||||||||||||||||||||||||||||||||||
(2) Included in Marketing, Administration and Research Costs above. | ||||||||||||||||||||||||||||||||||||||
(3) Included in Net Revenues above. | ||||||||||||||||||||||||||||||||||||||
Net revenues decreased by 11.4%, excluding currency, predominantly due to the unfavorable impact of the Saudi Arabia customs assessments of $246 million, shown in "Cost/Other".
Adjusted net revenues increased by 4.2% on an organic basis, as detailed above and in Schedule 5, primarily reflecting: a favorable pricing variance, driven by combustible pricing (mainly in Egypt and Turkey); partly offset by unfavorable volume/mix, mainly due to lower cigarette volume (primarily in Kuwait, North Africa and PMI Duty Free, partially offset by South Africa and Turkey), partly offset by favorable cigarette mix (primarily in PMI Duty Free, Saudi Arabia and Turkey).
Operating income decreased by 29.0%, excluding currency, predominantly due to the unfavorable impact of the Saudi Arabia customs assessments, as noted above for net revenues.
Adjusted operating income increased by 15.0% on an organic basis, mainly reflecting: a favorable pricing variance; and lower manufacturing costs; partly offset by unfavorable volume/mix, due to the same factors as for net revenues noted above.
Adjusted operating income margin increased by 3.7 points on an organic basis, as detailed in Schedule 8.
- 18 -
Total Market, PMI Shipment & Market Share Commentaries
| PMI Shipment Volume | Second-Quarter | Six Months Year-to-Date | ||||||||||||||||||||||||
| (million units) | 2021 | 2020 | Change | 2021 | 2020 | Change | ||||||||||||||||||||
| Cigarettes | 30,347 | 27,188 | 11.6 | % | 57,989 | 57,184 | 1.4 | % | ||||||||||||||||||
| Heated Tobacco Units | 512 | 185 | +100% | 908 | 655 | 38.6 | % | |||||||||||||||||||
| Total Middle East & Africa | 30,859 | 27,373 | 12.7 | % | 58,897 | 57,839 | 1.8 | % | ||||||||||||||||||
Second-Quarter
The estimated total market in the Middle East & Africa increased, mainly driven by:
•Egypt, up by 43.9%, or by 35.6% excluding the net favorable impact of estimated trade inventory movements, primarily reflecting: a favorable comparison due to pandemic-related supply-chain shortages involving competitors' products in the second quarter of 2020 and in-switching to cigarettes from other combustible tobacco products;
•International Duty Free, up by 54.1%, reflecting the impact of reduced government travel restrictions and increased passenger traffic in certain geographies;
•South Africa, reflecting a favorable comparison versus the second quarter of 2020, in which the total market was fully impacted by the pandemic-related ban on all tobacco sales from March 27, 2020, through August 17, 2020; and
•Turkey, up by 7.7%, mainly reflecting the impact on adult smoker average daily consumption of the easing of pandemic-related measures.
PMI's total shipment volume increased by 12.7% to 30.9 billion units, notably driven by:
•Egypt, up by 13.3%, primarily reflecting the higher total market, partly offset by a lower market share (due to an unfavorable comparison following pandemic-related supply-chain shortages involving competitors' products during the second quarter of 2020);
•PMI Duty Free, up by +100%, or by 89.3% excluding the net favorable impact of estimated distributor inventory movements, mainly reflecting the higher total market and a higher market share; and
•Turkey, up by 16.1%, primarily reflecting a higher market share, driven by the growth of Marlboro and Parliament, as well as the higher total market;
partly offset by
•Saudi Arabia, down by 27.1%, or by 5.7% excluding the net unfavorable impact of estimated distributor inventory movements, mainly reflecting a lower total market, partly offset by a higher market share of cigarettes (driven by Parliament) and heated tobacco units.
Six Months Year-to-Date
The estimated total market in the Middle East & Africa increased, mainly driven by:
•Egypt, up by 22.9%, or by 17.8% excluding the net favorable impact of estimated trade inventory movements, primarily reflecting the same factors as in the quarter;
•South Africa, up by 45.6%, primarily reflecting a favorable comparison versus the second quarter of 2020, in which the total market was fully impacted by the pandemic-related ban on all tobacco sales from March 27,
- 19 -
2020, through August 17, 2020, partly offset by a higher estimated prevalence of illicit trade stemming from the aforementioned ban; and
•Turkey, up by 2.8%, mainly reflecting the impact on adult smoker average daily consumption of the easing of pandemic-related measures, as well as a lower estimated prevalence of illicit trade related to cut tobacco (particularly in the first quarter of 2021);
partly offset by
•International Duty Free, down by 31.7%, primarily reflecting the impact of government travel restrictions and reduced passenger traffic since the start of the pandemic in March 2020.
PMI's total shipment volume increased by 1.8% to 58.9 billion units, notably driven by:
•Turkey, up by 12.2%, mainly reflecting a higher market share (driven by Marlboro and Parliament) and the higher total market;
partly offset by
•PMI Duty Free, down by 30.3%, or by 23.9% excluding the net unfavorable impact of estimated distributor inventory movements (principally due to cigarettes), mainly reflecting the lower total market, partly offset by a higher market share.
SOUTH & SOUTHEAST ASIA REGION
Second-Quarter
| Financial Summary - Quarters Ended June 30, | Change Fav./(Unfav.) | Variance Fav./(Unfav.) | ||||||||||||||||||||||||||||||||||||
| 2021 | 2020 | Total | Excl. Curr. | Total | Cur- rency | Price | Vol/ Mix | Cost/ Other | ||||||||||||||||||||||||||||||
| (in millions) | ||||||||||||||||||||||||||||||||||||||
| Net Revenues | $ 1,046 | $ 889 | 17.7 | % | 10.0 | % | 157 | 68 | 20 | 69 | — | |||||||||||||||||||||||||||
| Operating Income | $ 331 | $ 289 | 14.5 | % | 8.0 | % | 42 | 19 | 20 | 33 | (30) | |||||||||||||||||||||||||||
| Asset Impairment & Exit Costs (1) | (10) | (11) | 9.1 | % | 9.1 | % | 1 | — | — | — | 1 | |||||||||||||||||||||||||||
| Adjusted Operating Income | $ 341 | $ 300 | 13.7 | % | 7.3 | % | 41 | 19 | 20 | 33 | (31) | |||||||||||||||||||||||||||
| Adjusted Operating Income Margin | 32.6 | % | 33.7 | % | (1.1)pp | (0.8)pp | ||||||||||||||||||||||||||||||||
(1) Included in marketing, administration and research costs at the consolidated operating income level. | ||||||||||||||||||||||||||||||||||||||
Net revenues increased by 10.0% on an organic basis, reflecting: favorable volume/mix, due to higher cigarette volume (primarily in Indonesia, partly offset by the Philippines); and a favorable pricing variance (driven by combustible pricing mainly in the Philippines, partly offset by Indonesia).
Operating income increased by 8.0%, excluding currency, primarily reflecting: favorable volume/mix, due to the same factors as for net revenues noted above; and a favorable pricing variance; partly offset by higher marketing, administration and research costs (mainly related to combustible products in Indonesia and the Philippines).
Adjusted operating income increased by 7.3% on an organic basis. Adjusted operating income margin decreased by 0.8 points on the same basis, as detailed in Schedule 8.
- 20 -
Six Months Year-to-Date
| Financial Summary - Six Months Ended June 30, | Change Fav./(Unfav.) | Variance Fav./(Unfav.) | ||||||||||||||||||||||||||||||||||||
| 2021 | 2020 | Total | Excl. Curr. | Total | Cur- rency | Price | Vol/ Mix | Cost/ Other | ||||||||||||||||||||||||||||||
| (in millions) | ||||||||||||||||||||||||||||||||||||||
| Net Revenues | $ 2,219 | $ 2,140 | 3.7 | % | (0.8) | % | 79 | 96 | (18) | 1 | — | |||||||||||||||||||||||||||
| Operating Income | $ 860 | $ 888 | (3.2) | % | (6.8) | % | (28) | 32 | (18) | (39) | (3) | |||||||||||||||||||||||||||
| Asset Impairment & Exit Costs (1) | (13) | (11) | (18.2) | % | (18.2) | % | (2) | — | — | — | (2) | |||||||||||||||||||||||||||
| Adjusted Operating Income | $ 873 | $ 899 | (2.9) | % | (6.5) | % | (26) | 32 | (18) | (39) | (1) | |||||||||||||||||||||||||||
| Adjusted Operating Income Margin | 39.3 | % | 42.0 | % | (2.7)pp | (2.4)pp | ||||||||||||||||||||||||||||||||
(1) Included in marketing, administration and research costs at the consolidated operating income level. | ||||||||||||||||||||||||||||||||||||||
Net revenues decreased by 0.8% on an organic basis, reflecting: an unfavorable pricing variance, due to Indonesia, partially offset by the Philippines. Volume/mix was essentially stable, notably reflecting favorable cigarette mix (primarily in Indonesia and the Philippines), partly offset by lower cigarette volume (mainly in the Philippines, partially offset by Indonesia).
Operating income decreased by 6.8%, excluding currency, primarily reflecting: unfavorable volume/mix, due mainly to lower cigarette volume (primarily in the Philippines, partially offset by Indonesia), partly offset by favorable cigarette mix (mainly in Indonesia and the Philippines); and an unfavorable pricing variance.
Adjusted operating income decreased by 6.5% on an organic basis. Adjusted operating income margin decreased by 2.4 points on the same basis, as detailed in Schedule 8.
Total Market, PMI Shipment & Market Share Commentaries
| PMI Shipment Volume | Second-Quarter | Six Months Year-to-Date | ||||||||||||||||||||||||
| (million units) | 2021 | 2020 | Change | 2021 | 2020 | Change | ||||||||||||||||||||
| Cigarettes | 35,321 | 33,346 | 5.9 | % | 70,209 | 70,941 | (1.0) | % | ||||||||||||||||||
| Heated Tobacco Units | 39 | — | — | % | 72 | — | — | % | ||||||||||||||||||
| Total South & Southeast Asia | 35,360 | 33,346 | 6.0 | % | 70,281 | 70,941 | (0.9) | % | ||||||||||||||||||
Second-Quarter
The estimated total market in South & Southeast Asia increased, notably driven by:
•Bangladesh, up by 30.9%, primarily reflecting a favorable comparison versus the second quarter of 2020, during which pandemic-related restrictions impacted tobacco product availability;
•India, up by 35.7%, mainly reflecting a favorable comparison versus the second quarter of 2020, during which pandemic-related restrictions impacted the movement of certain products, including tobacco; and
•Indonesia, up by 12.4%, mainly reflecting the growth of the tax-advantaged 'below tier one' segment and the impact on adult smoker average daily consumption of the easing of pandemic-related measures.
PMI's total shipment volume increased by 6.0% to 35.4 billion units, notably driven by:
- 21 -
•Indonesia, up by 11.5%, primarily reflecting the higher total market, partly offset by a lower market share (mainly due to adult smoker down-trading to the 'below tier one' segment as a result of significantly lower retail prices, partly offset by share growth for PMI's premium and hand-rolled kretek portfolio); and
•Thailand, up by 28.0%, or by 12.6% excluding the net favorable impact of estimated distributor inventory movements, primarily due to a higher total market and a higher market share (driven by L&M 7.1);
partly offset by
•the Philippines, down by 12.0%, mainly reflecting a lower market share (primarily due to mid-price Fortune, reflecting the impact of price increases in the fourth quarter of 2020, partly offset by Marlboro), as well as a lower total market.
Six Months Year-to-Date
The estimated total market in South & Southeast Asia increased, mainly driven by:
•Bangladesh, up by 13.2%, primarily reflecting the same factor as in the quarter;
•India, up by 16.7%, mainly reflecting the same factor as in the quarter;
•Indonesia, up by 8.7%, primarily reflecting the same factors as in the quarter;
•Pakistan, up by 14.6%, or by 9.3% excluding the net favorable impact of estimated trade inventory movements, notably reflecting a lower prevalence of illicit trade (partly due to pandemic-related supply disruptions for illicit products); and
•Vietnam, up by 7.4%, mainly reflecting a lower prevalence of illicit trade due to pandemic-related supply disruptions for illicit products;
partly offset by:
•the Philippines, down by 9.0%, primarily reflecting the impact of industry-wide price increases in the fourth quarter of 2020.
PMI's total shipment volume decreased by 0.9% to 70.3 billion units, notably due to:
•the Philippines, down by 18.3%, mainly reflecting the same factors as in the quarter;
partly offset by:
•Indonesia, up by 3.9%, primarily reflecting the same factors as in the quarter;
•Pakistan, up by 12.8%, mainly reflecting the higher total market; and
•Thailand, up by 9.1%, primarily reflecting the same factors as in the quarter.
- 22 -
EAST ASIA & AUSTRALIA REGION
Second-Quarter
| Financial Summary - Quarters Ended June 30, | Change Fav./(Unfav.) | Variance Fav./(Unfav.) | ||||||||||||||||||||||||||||||||||||
| 2021 | 2020 | Total | Excl. Curr. | Total | Cur- rency | Price | Vol/ Mix | Cost/ Other | ||||||||||||||||||||||||||||||
| (in millions) | ||||||||||||||||||||||||||||||||||||||
| Net Revenues | $ 1,514 | $ 1,432 | 5.7 | % | 3.1 | % | 82 | 37 | 88 | (43) | — | |||||||||||||||||||||||||||
| Operating Income | $ 715 | $ 669 | 6.9 | % | 7.0 | % | 46 | (1) | 88 | (40) | (1) | |||||||||||||||||||||||||||
| Asset Impairment & Exit Costs (1) | (15) | (13) | (15.4) | % | (15.4) | % | (2) | — | — | — | (2) | |||||||||||||||||||||||||||
| Adjusted Operating Income | $ 730 | $ 682 | 7.0 | % | 7.2 | % | 48 | (1) | 88 | (40) | 1 | |||||||||||||||||||||||||||
| Adjusted Operating Income Margin | 48.2 | % | 47.6 | % | 0.6pp | 1.9pp | ||||||||||||||||||||||||||||||||
(1) Included in marketing, administration and research costs at the consolidated operating income level. | ||||||||||||||||||||||||||||||||||||||
Net revenues increased by 3.1% on an organic basis, reflecting: a favorable pricing variance, primarily driven by higher heated tobacco and combustible pricing in Japan; and unfavorable volume/mix, mainly due to lower cigarette volume (primarily in Japan), partly offset by higher heated tobacco unit volume (predominantly in Japan).
Operating income increased by 7.0%, excluding currency, mainly reflecting: a favorable pricing variance; and lower manufacturing costs (primarily related to reduced-risk products in Japan); partly offset by higher marketing, administration and research costs; and unfavorable volume/mix, due to the same factors as for net revenues noted above.
Adjusted operating income increased by 7.2% on an organic basis. Adjusted operating income margin increased by 1.9 points on the same basis, as detailed in Schedule 8.
Six Months Year-to-Date
| Financial Summary - Six Months Ended June 30, | Change Fav./(Unfav.) | Variance Fav./(Unfav.) | ||||||||||||||||||||||||||||||||||||
| 2021 | 2020 | Total | Excl. Curr. | Total | Cur- rency | Price | Vol/ Mix | Cost/ Other | ||||||||||||||||||||||||||||||
| (in millions) | ||||||||||||||||||||||||||||||||||||||
| Net Revenues | $ 2,986 | $ 2,687 | 11.1 | % | 7.1 | % | 299 | 108 | 193 | (2) | — | |||||||||||||||||||||||||||
| Operating Income | $ 1,410 | $ 1,155 | 22.1 | % | 20.6 | % | 255 | 17 | 193 | 18 | 27 | |||||||||||||||||||||||||||
| Asset Impairment & Exit Costs (1) | (46) | (13) | -(100)% | -(100)% | (33) | — | — | — | (33) | |||||||||||||||||||||||||||||
| Adjusted Operating Income | $ 1,456 | $ 1,168 | 24.7 | % | 23.2 | % | 288 | 17 | 193 | 18 | 60 | |||||||||||||||||||||||||||
| Adjusted Operating Income Margin | 48.8 | % | 43.5 | % | 5.3pp | 6.5pp | ||||||||||||||||||||||||||||||||
(1) Included in marketing, administration and research costs at the consolidated operating income level. | ||||||||||||||||||||||||||||||||||||||
Net revenues increased by 7.1% on an organic basis, mainly reflecting: a favorable pricing variance, primarily driven by higher heated tobacco and combustible pricing in Japan. Volume/mix was essentially stable, mainly reflecting: lower cigarette volume (primarily in Japan and South Korea), unfavorable cigarette mix (mainly in
- 23 -
Australia and Japan), lower device volume (primarily in Japan) and unfavorable heated tobacco unit mix in Japan, partly offset by higher heated tobacco unit volume in Japan.
Operating income increased by 20.6%, excluding currency, mainly reflecting: a favorable pricing variance; lower manufacturing costs (primarily related to reduced-risk products in Japan); and favorable volume/mix, driven by higher heated tobacco unit volume in Japan, partly offset by lower cigarette volume (mainly in Japan and South Korea), unfavorable cigarette mix (primarily in Australia and Japan) and unfavorable heated tobacco unit mix in Japan; partially offset by higher marketing, administration and research costs (mainly due to higher asset impairment and exit costs, primarily associated with product distribution restructuring in South Korea).
Adjusted operating income increased by 23.2%, on an organic basis. Adjusted operating income margin increased by 6.5 points on the same basis, as detailed in Schedule 8.
Total Market, PMI Shipment & Market Share Commentaries
| PMI Shipment Volume | Second-Quarter | Six Months Year-to-Date | ||||||||||||||||||||||||
| (million units) | 2021 | 2020 | Change | 2021 | 2020 | Change | ||||||||||||||||||||
| Cigarettes | 10,968 | 12,071 | (9.1) | % | 22,330 | 24,370 | (8.4) | % | ||||||||||||||||||
| Heated Tobacco Units | 9,904 | 9,076 | 9.1 | % | 19,043 | 16,198 | 17.6 | % | ||||||||||||||||||
| Total East Asia & Australia | 20,872 | 21,147 | (1.3) | % | 41,373 | 40,568 | 2.0 | % | ||||||||||||||||||
Second-Quarter
The estimated total market in East Asia & Australia, excluding China, decreased, primarily due to:
•Australia, down by 7.8%, or by 12.5% excluding the net favorable impact of estimated trade inventory movements, mainly reflecting the impact of the ending of the pandemic-related wage subsidy by the government; and
•South Korea, down by 1.6%, mainly reflecting the structural market trend.
PMI's total shipment volume decreased by 1.3% to 20.9 billion units, primarily due to:
•South Korea, down by 5.9%, mainly reflecting a lower market share (primarily due to the unfavorable impact of the growth of the cigarette new taste dimension segment, in which PMI has a relatively low share) and the lower total market.
Excluding the net unfavorable impact of estimated distributor inventory movements, PMI's total in-market sales volume was essentially stable.
Six Months Year-to-Date
The estimated total market in East Asia & Australia, excluding China, decreased, mainly due to:
•Japan, down by 4.2%, primarily reflecting the impact of excise tax-driven price increases.
PMI's total shipment volume increased by 2.0% to 41.4 billion units, notably driven by:
•Japan, up by 3.9%, mainly reflecting a higher market share driven by heated tobacco units, partially offset by the lower total market;
partly offset by
- 24 -
•South Korea, down by 5.0%, primarily reflecting a lower market share (due to the same factor as in the quarter).
Excluding the net unfavorable impact of estimated distributor inventory movements, PMI's total in-market sales volume was stable.
LATIN AMERICA & CANADA REGION
Second-Quarter
| Financial Summary - Quarters Ended June 30, | Change Fav./(Unfav.) | Variance Fav./(Unfav.) | ||||||||||||||||||||||||||||||||||||
| 2021 | 2020 | Total | Excl. Curr. | Total | Cur- rency | Price | Vol/ Mix | Cost/ Other | ||||||||||||||||||||||||||||||
| (in millions) | ||||||||||||||||||||||||||||||||||||||
| Net Revenues | $ 430 | $ 368 | 16.8 | % | 9.0 | % | 62 | 29 | 11 | 22 | — | |||||||||||||||||||||||||||
| Operating Income | $ 112 | $ 92 | 21.7 | % | 19.6 | % | 20 | 2 | 11 | 10 | (3) | |||||||||||||||||||||||||||
| Asset Impairment & Exit Costs (1) | (4) | (4) | — | % | — | % | — | — | — | — | — | |||||||||||||||||||||||||||
| Adjusted Operating Income | $ 116 | $ 96 | 20.8 | % | 18.8 | % | 20 | 2 | 11 | 10 | (3) | |||||||||||||||||||||||||||
| Adjusted Operating Income Margin | 27.0 | % | 26.1 | % | 0.9pp | 2.3pp | ||||||||||||||||||||||||||||||||
(1) Included in marketing, administration and research costs at the consolidated operating income level. | ||||||||||||||||||||||||||||||||||||||
Net revenues increased by 9.0% on an organic basis, reflecting: favorable volume/mix, mainly driven by higher cigarette volume (primarily in Mexico); and a favorable pricing variance (driven by combustible products).
Operating income increased by 19.6%, excluding currency, primarily reflecting: a favorable pricing variance; and favorable volume/mix, due to the same factor as for net revenues noted above.
Adjusted operating income increased by 18.8% on an organic basis. Adjusted operating income margin increased by 2.3 points on the same basis, as detailed in Schedule 8.
Six Months Year-to-Date
| Financial Summary - Six Months Ended June 30, | Change Fav./(Unfav.) | Variance Fav./(Unfav.) | ||||||||||||||||||||||||||||||||||||
| 2021 | 2020 | Total | Excl. Curr. | Total | Cur- rency | Price | Vol/ Mix | Cost/ Other | ||||||||||||||||||||||||||||||
| (in millions) | ||||||||||||||||||||||||||||||||||||||
| Net Revenues | $ 864 | $ 816 | 5.9 | % | 3.7 | % | 48 | 18 | 12 | 16 | 2 | |||||||||||||||||||||||||||
| Operating Income | $ 246 | $ 218 | 12.8 | % | 9.2 | % | 28 | 8 | 12 | (6) | 14 | |||||||||||||||||||||||||||
| Asset Impairment & Exit Costs (1) | (5) | (4) | (25.0) | % | (25.0) | % | (1) | — | — | — | (1) | |||||||||||||||||||||||||||
| Adjusted Operating Income | $ 251 | $ 222 | 13.1 | % | 9.5 | % | 29 | 8 | 12 | (6) | 15 | |||||||||||||||||||||||||||
| Adjusted Operating Income Margin | 29.1 | % | 27.2 | % | 1.9pp | 1.5pp | ||||||||||||||||||||||||||||||||
(1) Included in marketing, administration and research costs at the consolidated operating income level. | ||||||||||||||||||||||||||||||||||||||
- 25 -
Net revenues increased by 3.7% on an organic basis, mainly reflecting: favorable volume/mix, primarily driven by higher cigarette volume (mainly in Brazil and Mexico); and a favorable pricing variance, driven by higher combustible pricing (notably in Argentina and Colombia).
Operating income increased by 9.2%, excluding currency, primarily reflecting: lower marketing, administration and research costs; and a favorable pricing variance.
Adjusted operating income increased by 9.5% on an organic basis. Adjusted operating income margin increased by 1.5 points on the same basis, as detailed in Schedule 8.
Total Market, PMI Shipment & Market Share Commentaries
| PMI Shipment Volume | Second-Quarter | Six Months Year-to-Date | ||||||||||||||||||||||||
| (million units) | 2021 | 2020 | Change | 2021 | 2020 | Change | ||||||||||||||||||||
| Cigarettes | 15,213 | 14,780 | 2.9 | % | 30,098 | 29,843 | 0.9 | % | ||||||||||||||||||
| Heated Tobacco Units | 140 | 94 | 48.9 | % | 245 | 202 | 21.3 | % | ||||||||||||||||||
| Total Latin America & Canada | 15,353 | 14,874 | 3.2 | % | 30,343 | 30,045 | 1.0 | % | ||||||||||||||||||
Second-Quarter
The estimated total market in Latin America & Canada increased, mainly driven by:
•Argentina, up by 5.1%, or by 12.2% excluding the net unfavorable impact of estimated trade inventory movements, primarily reflecting a lower estimated prevalence of illicit trade and a favorable comparison related to retail out-of-stock in the second quarter of 2020 (due to temporary factory shutdowns related to the pandemic), partly offset by the impact of price increases;
•Brazil, up by 8.8%, mainly reflecting a lower estimated prevalence of illicit trade due to: reduced price gaps with legal products and the impact of border restrictions imposed as a result of the pandemic; and
•Mexico, up by 6.3%, primarily reflecting the impact on adult smoker consumption patterns of the easing of pandemic-related measures;
partly offset by
•Canada, down by 11.8%, notably reflecting the impact of price increases and out-switching from cigarettes to e-vapor products.
PMI's total shipment volume increased by 3.2% to 15.4 billion units, mainly driven by:
•Brazil, up by 7.3%, primarily reflecting the higher total market; and
•Mexico, up by 7.9%, mainly reflecting the higher total market and a higher market share (driven by Marlboro);
partly offset by
•Argentina, down by 4.8%, mainly reflecting a lower market share (primarily due to adult smoker down-trading to ultra-low-price brands produced by local manufacturers).
Six Months Year-to-Date
The estimated total market in Latin America & Canada increased, notably driven by:
- 26 -
•Argentina, up by 11.5%, primarily reflecting the same factors as in the quarter;
•Brazil, up by 8.5%, mainly reflecting the same factors as in the quarter; and
•Mexico, up by 4.2%, primarily reflecting the same factors as in the quarter;
partly offset by
•Canada, down by 5.8%, mainly reflecting the same factors as in the quarter.
PMI's total shipment volume increased by 1.0% to 30.3 billion units, primarily driven by:
•Brazil, up by 8.5%, mainly reflecting the higher total market; and
•Mexico, up by 3.9%, primarily reflecting the higher total market;
partly offset by
•Argentina, down by 2.4%, mainly reflecting a lower market share (primarily due to the same factor as in the quarter).
- 27 -
Philip Morris International: Delivering a Smoke-Free Future
Philip Morris International (PMI) is leading a transformation in the tobacco industry to create a smoke-free future and ultimately replace cigarettes with smoke-free products to the benefit of adults who would otherwise continue to smoke, society, the company and its shareholders. PMI is a leading international tobacco company engaged in the manufacture and sale of cigarettes, as well as smoke-free products, associated electronic devices and accessories, and other nicotine-containing products in markets outside the U.S. In addition, PMI ships versions of its IQOS Platform 1 device and consumables to Altria Group, Inc. for sale under license in the U.S., where these products have received marketing authorizations from the U.S. Food and Drug Administration (FDA) under the premarket tobacco product application (PMTA) pathway; the FDA has also authorized the marketing of a version of IQOS and its consumables as a Modified Risk Tobacco Product (MRTP), finding that an exposure modification order for these products is appropriate to promote the public health. PMI is building a future on a new category of smoke-free products that, while not risk-free, are a much better choice than continuing to smoke. Through multidisciplinary capabilities in product development, state-of-the-art facilities and scientific substantiation, PMI aims to ensure that its smoke-free products meet adult consumer preferences and rigorous regulatory requirements. PMI's smoke-free product portfolio includes heat-not-burn and nicotine-containing vapor products. As of June 30, 2021, PMI's smoke-free products are available for sale in 67 markets in key cities or nationwide, and PMI estimates that approximately 14.7 million adults around the world have already switched to IQOS and stopped smoking. For more information, please visit www.pmi.com and www.pmiscience.com.
Forward-Looking and Cautionary Statements
This press release contains projections of future results and other forward-looking statements. Achievement of future results is subject to risks, uncertainties and inaccurate assumptions. In the event that risks or uncertainties materialize, or underlying assumptions prove inaccurate, actual results could vary materially from those contained in such forward-looking statements. Pursuant to the “safe harbor” provisions of the Private Securities Litigation Reform Act of 1995, PMI is identifying important factors that, individually or in the aggregate, could cause actual results and outcomes to differ materially from those contained in any forward-looking statements made by PMI.
PMI's business risks include: excise tax increases and discriminatory tax structures; increasing marketing and regulatory restrictions that could reduce our competitiveness, eliminate our ability to communicate with adult consumers, or ban certain of our products; health concerns relating to the use of tobacco and other nicotine-containing products and exposure to environmental tobacco smoke; litigation related to tobacco use and intellectual property; intense competition; the effects of global and individual country economic, regulatory and political developments, natural disasters and conflicts; changes in adult smoker behavior; lost revenues as a result of counterfeiting, contraband and cross-border purchases; governmental investigations; unfavorable currency exchange rates and currency devaluations, and limitations on the ability to repatriate funds; adverse changes in applicable corporate tax laws; adverse changes in the cost, availability, and quality of tobacco and other agricultural products and raw materials, as well as components and materials for our electronic devices; and the integrity of its information systems and effectiveness of its data privacy policies. PMI's future profitability may also be adversely affected should it be unsuccessful in its attempts to produce and commercialize reduced-risk products or if regulation or taxation do not differentiate between such products and cigarettes; if it is unable to successfully introduce new products, promote brand equity, enter new markets or improve its margins through increased prices and productivity gains; if it is unable to expand its brand portfolio internally or through acquisitions and the development of strategic business relationships; or if it is unable to attract and retain the
- 28 -
best global talent. Future results are also subject to the lower predictability of our reduced-risk product category's performance.
In addition, PMI’s business risks also include risks and uncertainties related to PMI’s potential acquisitions of Fertin Pharma A/S (“Fertin”) and Vectura Group plc (“Vectura”), including, amongst other things: (1) the inability to consummate these acquisitions in a timely manner; (2) the inability to complete these acquisitions due to the failure to satisfy certain conditions to complete the acquisitions, including any required regulatory or stockholder approvals, as applicable; (3) the failure of these acquisitions to close for any other reason; (4) the possibility that the integration of the operations of Fertin and Vectura with those of PMI may be more difficult and/or take longer than anticipated, and may not accelerate PMI’s desired entry into additional smoke-free and beyond nicotine platforms as quickly as anticipated; (5) the possibility that the respective integrations of Fertin and Vectura into PMI may be more costly than anticipated and may have unanticipated adverse results relating to Fertin, Vectura or PMI’s existing businesses; (6) the inability to gain access to differentiated proprietary technology and pharmaceutical development expertise as anticipated by these acquisitions; (7) risks associated with third-party contracts containing consent and/or other provisions that may be triggered by the proposed acquisitions; (8) negative effects of the announcement or the consummation of the acquisitions on the market price of PMI’s common stock; and (9) the ability of PMI to retain and hire key personnel of Fertin and Vectura.
The COVID-19 pandemic has created significant societal and economic disruption, and resulted in closures of stores, factories and offices, and restrictions on manufacturing, distribution and travel, all of which will adversely impact our business, results of operations, cash flows and financial position during the continuation of the pandemic. Our business continuity plans and other safeguards may not be effective to mitigate the impact of the pandemic. Currently, significant risks include our diminished ability to convert adult smokers to our RRPs, significant volume declines in our duty-free business and certain other key markets, disruptions or delays in our manufacturing and supply chain, increased currency volatility, and delays in certain cost saving, transformation and restructuring initiatives. Our business could also be adversely impacted if key personnel or a significant number of employees or business partners become unavailable due to the COVID-19 outbreak. The significant adverse impact of COVID-19 on the economic or political conditions in markets in which we operate could result in changes to the preferences of our adult consumers and lower demand for our products, particularly for our mid-price or premium-price brands. Continuation of the pandemic could disrupt our access to the credit markets or increase our borrowing costs. Governments may temporarily be unable to focus on the development of science-based regulatory frameworks for the development and commercialization of RRPs or on the enforcement or implementation of regulations that are significant to our business. In addition, messaging about the potential negative impacts of the use of our products on COVID-19 risks may lead to increasingly restrictive regulatory measures on the sale and use of our products, negatively impact demand for our products, the willingness of adult consumers to switch to our RRPs and our efforts to advocate for the development of science-based regulatory frameworks for the development and commercialization of RRPs.
The impact of these risks also depends on factors beyond our knowledge or control, including the duration and severity of the pandemic, its recurrence in our key markets, actions taken to contain its spread and to mitigate its public health effects, and the ultimate economic consequences thereof.
PMI is further subject to other risks detailed from time to time in its publicly filed documents, including the Form 10-Q for the quarter ended March 31, 2021. PMI cautions that the foregoing list of important factors is not a complete discussion of all potential risks and uncertainties. PMI does not undertake to update any forward-
- 29 -
looking statement that it may make from time to time, except in the normal course of its public disclosure obligations.
Key Terms, Definitions and Explanatory Notes
General
•"PMI" refers to Philip Morris International Inc. and its subsidiaries. Trademarks and service marks that are the registered property of, or licensed by, the subsidiaries of PMI, are italicized.
•Comparisons are made to the same prior-year period unless otherwise stated.
•References to total industry, total market, PMI shipment volume and PMI market share performance reflect cigarettes and heated tobacco units, unless otherwise stated.
•References to total international market, defined as worldwide cigarette and heated tobacco unit volume excluding the U.S., total industry, total market and market shares are PMI estimates for tax-paid products based on the latest available data from a number of internal and external sources and may, in defined instances, exclude the People's Republic of China and/or PMI's duty free business.
•2020 and 2021 estimates for total industry volume and market share in certain geographies reflect limitations on the availability and accuracy of industry data during pandemic-related restrictions.
•"OTP" is defined as "other tobacco products," primarily roll-your-own and make-your-own cigarettes, pipe tobacco, cigars and cigarillos, and does not include reduced-risk products.
•"Combustible products" is the term PMI uses to refer to cigarettes and OTP, combined.
•In-market sales, or "IMS," is defined as sales to the retail channel, depending on the market and distribution model.
•"Total shipment volume" is defined as the combined total of cigarette shipment volume and heated tobacco unit shipment volume.
•In July 2021, the Latin America & Canada operating segment was renamed as the Americas operating segment.
•"North Africa" is defined as Algeria, Egypt, Libya, Morocco and Tunisia.
•"The GCC" (Gulf Cooperation Council) is defined as Bahrain, Kuwait, Oman, Qatar, Saudi Arabia and the United Arab Emirates (UAE).
•Following the deconsolidation of PMI's Canadian subsidiary, Rothmans, Benson & Hedges, Inc. (RBH) on March 22, 2019, PMI continues to report the volume of brands sold by RBH for which other PMI subsidiaries are the trademark owner. These include HEETS, Next, Philip Morris and Rooftop.
•From time to time, PMI’s shipment volumes are subject to the impact of distributor inventory movements, and estimated total industry/market volumes are subject to the impact of inventory movements in various trade channels that include estimated trade inventory movements of PMI’s competitors arising from market-specific factors that significantly distort reported volume disclosures. Such factors may include changes to the manufacturing supply chain, shipment methods, consumer demand, timing of excise tax increases or other influences that may affect the timing of sales to customers. In such instances, in addition to reviewing PMI shipment volumes and certain estimated total industry/market volumes on a reported basis, management reviews these measures on an adjusted basis that excludes the impact of distributor and/or estimated trade inventory movements. Management also believes that disclosing PMI shipment volumes and estimated total industry/market volumes in such circumstances on a basis that excludes the impact of distributor and/or estimated trade inventory movements, such as on an IMS basis, improves the comparability of performance and trends for these measures over different reporting periods.
Financial
•Net revenues related to combustible products refer to the operating revenues generated from the sale of these products, including shipping and handling charges billed to customers, net of sales and promotion incentives, and excise taxes. PMI recognizes revenue when control is transferred to the customer, typically either upon shipment or delivery of goods.
•Net revenues related to RRPs represent the sale of heated tobacco units, heat-not-burn devices and related accessories, and other nicotine-containing products, primarily e-vapor products, including shipping and handling charges billed to customers, net of sales and promotion incentives, and excise taxes. PMI
- 30 -
recognizes revenue when control is transferred to the customer, typically either upon shipment or delivery of goods.
•Adjusted net revenues exclude the impact related to the Saudi Arabia customs assessments.
•"Cost of sales" consists principally of: tobacco leaf, non-tobacco raw materials, labor and manufacturing costs; shipping and handling costs; and the cost of devices produced by third-party electronics manufacturing service providers. Estimated costs associated with device warranty programs are generally provided for in cost of sales in the period the related revenues are recognized.
•"Marketing, administration and research costs" include the costs of marketing and selling our products, other costs generally not related to the manufacture of our products (including general corporate expenses), and costs incurred to develop new products. The most significant components of our marketing, administration and research costs are marketing and sales expenses and general and administrative expenses.
•"Cost/Other" in the Consolidated Financial Summary table of total PMI and the six operating segments of this release reflects the currency-neutral variances of: cost of sales (excluding the volume/mix cost component); marketing, administration and research costs (including asset impairment and exit costs); and amortization of intangibles. “Cost/Other” also includes the currency-neutral net revenue variance, unrelated to volume/mix and price components, attributable to: fees for certain distribution rights billed to customers in certain markets in the ME&A Region and the Saudi Arabia customs assessment net revenue adjustment.
•"Adjusted Operating Income Margin" is calculated as adjusted operating income, divided by adjusted net revenues.
•"Adjusted EBITDA" is defined as earnings before interest, taxes, depreciation, amortization and equity (income)/loss in unconsolidated subsidiaries, excluding asset impairment and exit costs, and unusual items.
•"Net debt" is defined as total debt, less cash and cash equivalents.
•Growth rates presented on an organic basis reflect currency-neutral underlying results.
•Management reviews net revenues, operating income, operating income margin, operating cash flow and earnings per share, or "EPS," on an adjusted basis, which may exclude the impact of currency and other items such as acquisitions, asset impairment and exit costs, tax items and other special items. Organic growth rates reflect the way management views underlying performance for these measures. PMI believes that such measures provide useful insight into underlying business trends and results.
•Management reviews these measures because they exclude changes in currency exchange rates and other factors that may distort underlying business trends, thereby improving the comparability of PMI’s business performance between reporting periods. Furthermore, PMI uses several of these measures in its management compensation program to promote internal fairness and a disciplined assessment of performance against company targets. PMI discloses these measures to enable investors to view the business through the eyes of management.
•Non-GAAP measures used in this release should neither be considered in isolation nor as a substitute for the financial measures prepared in accordance with U.S. GAAP. For a reconciliation of non-GAAP measures to the most directly comparable U.S. GAAP measures, see the relevant schedules provided with this press release.
•U.S. GAAP Treatment of Argentina as a Highly Inflationary Economy. Following the categorization of Argentina by the International Practices Task Force of the Center for Audit Quality as a country with a three-year cumulative inflation rate greater than 100%, the country is considered highly inflationary in accordance with U.S. GAAP. Consequently, PMI began to account for the operations of its Argentinian affiliates as highly inflationary, and to treat the U.S. dollar as the functional currency of the affiliates, effective July 1, 2018.
•"Fair value adjustment for equity security investments" reflects the adjustment resulting from share price movements in passive investments for publicly traded entities that are not controlled or influenced by PMI. Under U.S. GAAP, such adjustments are required, since January 1, 2018, to be reflected directly in the income statement.
Reduced-Risk Products
•Reduced-risk products (“RRPs”) is the term PMI uses to refer to products that present, are likely to present, or have the potential to present less risk of harm to smokers who switch to these products versus continuing smoking. PMI has a range of RRPs in various stages of development, scientific assessment and commercialization. PMI's RRPs are smoke-free products that produce an aerosol that contains far lower quantities of harmful and potentially harmful constituents than found in cigarette smoke.
- 31 -
•"Heated tobacco units," or "HTUs," is the term PMI uses to refer to heated tobacco consumables, which include the company's HEETS, HEETS Creations, HEETS Dimensions, HEETS Marlboro and HEETS FROM MARLBORO (defined collectively as HEETS), Marlboro Dimensions, Marlboro HeatSticks and Parliament HeatSticks, as well as the KT&G-licensed brands, Fiit and Miix (outside of Korea).
•Market share for HTUs is defined as the total sales volume for HTUs as a percentage of the total estimated sales volume for cigarettes and HTUs.
•Unless otherwise stated, all references to IQOS are to PMI's Platform 1 IQOS devices and heated tobacco consumables.
•The IQOS heat-not-burn device is a precisely controlled heating device into which a specially designed and proprietary tobacco unit is inserted and heated to generate an aerosol.
•"PMI heat-not-burn products" include licensed KT&G heat-not-burn products.
•"PMI HTUs" include licensed KT&G HTUs.
•“Total IQOS users” is defined as the estimated number of Legal Age (minimum 18 years) users of PMI heat-not-burn products for which PMI HTUs represented at least 5% of their daily tobacco consumption over the past seven days. Note: as of December 2020, PMI heat-not-burn products and HTUs include licensed KT&G heat-not-burn products and HTUs, respectively.
•The estimated number of adults who have "switched to IQOS and stopped smoking" reflects:
◦for markets where there are no heat-not-burn products other than PMI heat-not-burn products: daily individual consumption of PMI HTUs represents the totality of their daily tobacco consumption in the past seven days;
◦for markets where PMI heat-not-burn products are among other heat-not-burn products: daily individual consumption of HTUs represents the totality of their daily tobacco consumption in the past seven days, of which at least 70% is PMI HTUs.
Note: as of December 2020, PMI heat-not-burn products and HTUs include licensed KT&G heat-not-burn products and HTUs, respectively.
IQOS in the United States
•On April 30, 2019, the U.S. Food and Drug Administration (FDA) announced that the marketing of a version of PMI's Platform 1 product, namely, IQOS 2.4, together with its heated tobacco units (the term PMI uses to refer to heated tobacco consumables), is appropriate for the protection of public health and authorized it for sale in the U.S. The FDA’s decision followed its comprehensive assessment of PMI’s premarket tobacco product applications (PMTAs) submitted to the Agency in 2017.
•In the third quarter of 2019, PMI brought IQOS 2.4 and three variants of its heated tobacco units to the U.S. through its license with Altria Group, Inc., whose subsidiary, Philip Morris USA Inc., is responsible for marketing the product and complying with the provisions set forth in the FDA's marketing orders.
•On July 7, 2020, the FDA authorized the marketing of a version of PMI's Platform 1 product, namely, IQOS 2.4, together with its heated tobacco units, as a Modified Risk Tobacco Product (MRTP). In doing so, the agency found that an IQOS exposure modification order is appropriate to promote the public health. The decision followed a review of the extensive scientific evidence package PMI submitted to the FDA in December 2016 to support its MRTP applications.
•On December 7, 2020, the FDA confirmed that the marketing of a version of PMI's Platform 1 product, namely, IQOS 3, is appropriate for the protection of public health and authorized it for sale in the U.S. The FDA’s decision followed an assessment of a PMI's PMTA filed with the agency in March 2020.
•Shipment volume of heated tobacco units to the U.S. is included in the heated tobacco unit shipment volume of the Latin America & Canada segment. Revenues from shipments of Platform 1 devices, heated tobacco units and accessories to Altria Group, Inc. for sale under license in the U.S. are included in Net Revenues of the Latin America & Canada segment.
- 32 -
| Appendix 1 | |||||||||||||||||||||||||||||||||||||||||||||||||||||||||||||||||||||||||||||
| PHILIP MORRIS INTERNATIONAL INC. and Subsidiaries | |||||||||||||||||||||||||||||||||||||||||||||||||||||||||||||||||||||||||||||
| Key Market Data | |||||||||||||||||||||||||||||||||||||||||||||||||||||||||||||||||||||||||||||
| Quarters Ended June 30, | |||||||||||||||||||||||||||||||||||||||||||||||||||||||||||||||||||||||||||||
| Market | Total Market, bio units | PMI Shipments, bio units | PMI Market Share, % (1) | ||||||||||||||||||||||||||||||||||||||||||||||||||||||||||||||||||||||||||
| Total | Cigarette | HTU | Total | HTU | |||||||||||||||||||||||||||||||||||||||||||||||||||||||||||||||||||||||||
| 2021 | 2020 | % Change | 2021 | 2020 | % Change | 2021 | 2020 | % Change | 2021 | 2020 | % Change | 2021 | 2020 | pp Change | 2021 | 2020 | pp Change | ||||||||||||||||||||||||||||||||||||||||||||||||||||||||||||
| Total | 649.9 | 607.4 | 7.0 | 180.5 | 170.1 | 6.1 | 156.1 | 151.4 | 3.2 | 24.4 | 18.7 | 30.2 | 27.3 | 28.1 | (0.8) | 3.5 | 3.0 | 0.5 | |||||||||||||||||||||||||||||||||||||||||||||||||||||||||||
| European Union | |||||||||||||||||||||||||||||||||||||||||||||||||||||||||||||||||||||||||||||
| France | 9.1 | 9.8 | (7.6) | 4.1 | 4.5 | (7.8) | 4.1 | 4.4 | (7.8) | — | — | — | 43.5 | 44.9 | (1.4) | 0.6 | 0.5 | 0.1 | |||||||||||||||||||||||||||||||||||||||||||||||||||||||||||
| Germany | 18.6 | 20.0 | (7.2) | 7.2 | 7.8 | (7.4) | 6.7 | 7.4 | (9.1) | 0.5 | 0.4 | 23.4 | 38.8 | 38.9 | (0.1) | 2.7 | 2.0 | 0.7 | |||||||||||||||||||||||||||||||||||||||||||||||||||||||||||
| Italy | 17.9 | 16.3 | 9.3 | 9.9 | 7.9 | 25.8 | 7.7 | 6.8 | 12.6 | 2.2 | 1.1 | +100 | 53.1 | 52.1 | 1.0 | 11.2 | 7.7 | 3.5 | |||||||||||||||||||||||||||||||||||||||||||||||||||||||||||
| Poland | 12.5 | 10.6 | 17.6 | 4.7 | 4.2 | 12.1 | 3.9 | 3.7 | 5.1 | 0.8 | 0.5 | 67.7 | 37.5 | 39.3 | (1.8) | 6.3 | 4.4 | 1.9 | |||||||||||||||||||||||||||||||||||||||||||||||||||||||||||
| Spain | 10.5 | 9.6 | 8.9 | 4.1 | 2.7 | 51.5 | 4.0 | 2.7 | 50.2 | 0.1 | 0.1 | +100 | 31.1 | 31.3 | (0.2) | 1.2 | 1.0 | 0.2 | |||||||||||||||||||||||||||||||||||||||||||||||||||||||||||
| Eastern Europe | |||||||||||||||||||||||||||||||||||||||||||||||||||||||||||||||||||||||||||||
| Russia | 55.1 | 56.7 | (2.7) | 17.6 | 17.9 | (1.7) | 13.3 | 14.3 | (7.1) | 4.3 | 3.6 | 19.6 | 31.6 | 32.7 | (1.1) | 7.3 | 6.0 | 1.3 | |||||||||||||||||||||||||||||||||||||||||||||||||||||||||||
| Middle East & Africa | |||||||||||||||||||||||||||||||||||||||||||||||||||||||||||||||||||||||||||||
| Saudi Arabia | 5.3 | 6.0 | (12.4) | 2.0 | 2.7 | (27.1) | 1.9 | 2.7 | (29.6) | 0.1 | — | — | 41.5 | 38.6 | 2.9 | 0.9 | 0.2 | 0.7 | |||||||||||||||||||||||||||||||||||||||||||||||||||||||||||
| Turkey | 30.5 | 28.3 | 7.7 | 13.5 | 11.7 | 16.1 | 13.5 | 11.7 | 16.1 | — | — | — | 44.3 | 41.1 | 3.2 | — | — | — | |||||||||||||||||||||||||||||||||||||||||||||||||||||||||||
| South & Southeast Asia | |||||||||||||||||||||||||||||||||||||||||||||||||||||||||||||||||||||||||||||
| Indonesia | 71.7 | 63.8 | 12.4 | 20.1 | 18.0 | 11.5 | 20.1 | 18.0 | 11.5 | — | — | — | 28.1 | 28.3 | (0.2) | — | — | — | |||||||||||||||||||||||||||||||||||||||||||||||||||||||||||
| Philippines | 13.8 | 14.2 | (3.0) | 8.6 | 9.7 | (12.0) | 8.5 | 9.7 | (12.4) | — | — | — | 62.0 | 68.4 | (6.4) | 0.3 | — | 0.3 | |||||||||||||||||||||||||||||||||||||||||||||||||||||||||||
| East Asia & Australia | |||||||||||||||||||||||||||||||||||||||||||||||||||||||||||||||||||||||||||||
| Australia | 2.4 | 2.6 | (7.8) | 0.7 | 0.8 | (7.6) | 0.7 | 0.8 | (7.6) | — | — | — | 30.8 | 30.8 | — | — | — | — | |||||||||||||||||||||||||||||||||||||||||||||||||||||||||||
| Japan | 35.0 | 35.1 | (0.2) | 14.2 | 14.1 | 0.4 | 5.5 | 6.3 | (12.3) | 8.6 | 7.8 | 10.6 | 38.3 | 36.8 | 1.5 | 22.7 | 20.2 | 2.5 | |||||||||||||||||||||||||||||||||||||||||||||||||||||||||||
| South Korea | 18.1 | 18.4 | (1.6) | 3.6 | 3.8 | (5.9) | 2.4 | 2.6 | (7.4) | 1.2 | 1.2 | (2.7) | 20.0 | 21.1 | (1.1) | 6.5 | 6.6 | (0.1) | |||||||||||||||||||||||||||||||||||||||||||||||||||||||||||
| Latin America & Canada | |||||||||||||||||||||||||||||||||||||||||||||||||||||||||||||||||||||||||||||
| Argentina | 8.1 | 7.7 | 5.1 | 4.5 | 4.8 | (4.8) | 4.5 | 4.8 | (4.8) | — | — | — | 56.2 | 62.0 | (5.8) | — | — | — | |||||||||||||||||||||||||||||||||||||||||||||||||||||||||||
| Mexico | 8.0 | 7.6 | 6.3 | 5.1 | 4.7 | 7.9 | 5.0 | 4.7 | 7.7 | — | — | — | 63.0 | 62.1 | 0.9 | 0.3 | 0.2 | 0.1 | |||||||||||||||||||||||||||||||||||||||||||||||||||||||||||
| (1) Market share estimates are calculated using IMS data | |||||||||||||||||||||||||||||||||||||||||||||||||||||||||||||||||||||||||||||
| Note: % change for Total Market and PMI shipments is computed based on millions of units. "-" indicates volume below 50 million units and market share below 0.1% | |||||||||||||||||||||||||||||||||||||||||||||||||||||||||||||||||||||||||||||
| Appendix 2 | |||||||||||||||||||||||||||||||||||||||||||||||||||||||||||||||||||||||||||||
| PHILIP MORRIS INTERNATIONAL INC. and Subsidiaries | |||||||||||||||||||||||||||||||||||||||||||||||||||||||||||||||||||||||||||||
| Key Market Data | |||||||||||||||||||||||||||||||||||||||||||||||||||||||||||||||||||||||||||||
| Six Months Ended June 30, | |||||||||||||||||||||||||||||||||||||||||||||||||||||||||||||||||||||||||||||
| Market | Total Market, bio units | PMI Shipments, bio units | PMI Market Share, % (1) | ||||||||||||||||||||||||||||||||||||||||||||||||||||||||||||||||||||||||||
| Total | Cigarette | HTU | Total | HTU | |||||||||||||||||||||||||||||||||||||||||||||||||||||||||||||||||||||||||
| 2021 | 2020 | % Change | 2021 | 2020 | % Change | 2021 | 2020 | % Change | 2021 | 2020 | % Change | 2021 | 2020 | pp Change | 2021 | 2020 | pp Change | ||||||||||||||||||||||||||||||||||||||||||||||||||||||||||||
| Total | 1,265.1 | 1,222.6 | 3.5 | 347.7 | 343.8 | 1.1 | 301.7 | 308.4 | (2.2) | 46.1 | 35.4 | 30.1 | 27.0 | 27.8 | (0.8) | 3.5 | 2.9 | 0.6 | |||||||||||||||||||||||||||||||||||||||||||||||||||||||||||
| European Union | |||||||||||||||||||||||||||||||||||||||||||||||||||||||||||||||||||||||||||||
| France | 17.3 | 18.2 | (5.1) | 7.9 | 8.5 | (7.1) | 7.8 | 8.4 | (7.3) | 0.1 | 0.1 | 13.2 | 43.6 | 44.7 | (1.1) | 0.6 | 0.4 | 0.2 | |||||||||||||||||||||||||||||||||||||||||||||||||||||||||||
| Germany | 36.0 | 36.0 | (0.2) | 14.3 | 14.5 | (1.6) | 13.2 | 13.7 | (4.1) | 1.1 | 0.8 | 41.4 | 39.8 | 40.4 | (0.6) | 3.1 | 2.2 | 0.9 | |||||||||||||||||||||||||||||||||||||||||||||||||||||||||||
| Italy | 33.8 | 32.0 | 5.4 | 19.5 | 17.1 | 14.4 | 15.1 | 14.6 | 3.9 | 4.4 | 2.5 | 75.7 | 52.9 | 52.0 | 0.9 | 11.2 | 7.5 | 3.7 | |||||||||||||||||||||||||||||||||||||||||||||||||||||||||||
| Poland | 23.2 | 21.5 | 8.3 | 8.6 | 8.5 | 1.4 | 7.3 | 7.6 | (4.1) | 1.4 | 0.9 | 46.5 | 37.1 | 39.7 | (2.6) | 5.9 | 4.3 | 1.6 | |||||||||||||||||||||||||||||||||||||||||||||||||||||||||||
| Spain | 20.1 | 20.0 | 0.3 | 6.8 | 6.4 | 7.0 | 6.6 | 6.2 | 6.7 | 0.2 | 0.2 | 14.3 | 31.1 | 31.1 | — | 1.2 | 1.0 | 0.2 | |||||||||||||||||||||||||||||||||||||||||||||||||||||||||||
| Eastern Europe | |||||||||||||||||||||||||||||||||||||||||||||||||||||||||||||||||||||||||||||
| Russia | 104.2 | 103.6 | 0.6 | 33.3 | 32.9 | 1.0 | 25.4 | 26.7 | (4.9) | 7.9 | 6.2 | 26.3 | 31.3 | 32.6 | (1.3) | 7.5 | 6.2 | 1.3 | |||||||||||||||||||||||||||||||||||||||||||||||||||||||||||
| Middle East & Africa | |||||||||||||||||||||||||||||||||||||||||||||||||||||||||||||||||||||||||||||
| Saudi Arabia | 10.7 | 10.3 | 4.1 | 4.2 | 3.8 | 11.4 | 4.1 | 3.8 | 9.0 | 0.1 | — | — | 41.8 | 39.4 | 2.4 | 0.8 | 0.1 | 0.7 | |||||||||||||||||||||||||||||||||||||||||||||||||||||||||||
| Turkey | 55.8 | 54.3 | 2.8 | 24.5 | 21.8 | 12.2 | 24.5 | 21.8 | 12.2 | — | — | — | 43.9 | 40.1 | 3.8 | — | — | — | |||||||||||||||||||||||||||||||||||||||||||||||||||||||||||
| South & Southeast Asia | |||||||||||||||||||||||||||||||||||||||||||||||||||||||||||||||||||||||||||||
| Indonesia | 142.7 | 131.3 | 8.7 | 40.0 | 38.5 | 3.9 | 40.0 | 38.5 | 3.9 | — | — | — | 28.0 | 29.3 | (1.3) | — | — | — | |||||||||||||||||||||||||||||||||||||||||||||||||||||||||||
| Philippines | 26.9 | 29.5 | (9.0) | 16.7 | 20.5 | (18.3) | 16.7 | 20.5 | (18.6) | 0.1 | — | — | 62.2 | 69.3 | (7.1) | 0.3 | — | 0.3 | |||||||||||||||||||||||||||||||||||||||||||||||||||||||||||
| East Asia & Australia | |||||||||||||||||||||||||||||||||||||||||||||||||||||||||||||||||||||||||||||
| Australia | 4.8 | 5.1 | (6.1) | 1.5 | 1.5 | 1.6 | 1.5 | 1.5 | 1.6 | — | — | — | 31.8 | 29.4 | 2.4 | — | — | — | |||||||||||||||||||||||||||||||||||||||||||||||||||||||||||
| Japan | 67.6 | 70.6 | (4.2) | 28.0 | 26.9 | 3.9 | 11.4 | 13.1 | (13.0) | 16.5 | 13.8 | 20.1 | 38.7 | 36.6 | 2.1 | 23.0 | 19.7 | 3.3 | |||||||||||||||||||||||||||||||||||||||||||||||||||||||||||
| South Korea | 34.9 | 34.6 | 0.8 | 7.0 | 7.4 | (5.0) | 4.7 | 5.1 | (7.9) | 2.3 | 2.3 | 1.2 | 20.0 | 21.4 | (1.4) | 6.6 | 6.6 | — | |||||||||||||||||||||||||||||||||||||||||||||||||||||||||||
| Latin America & Canada | |||||||||||||||||||||||||||||||||||||||||||||||||||||||||||||||||||||||||||||
| Argentina | 17.5 | 15.7 | 11.5 | 9.8 | 10.0 | (2.4) | 9.8 | 10.0 | (2.4) | — | — | — | 56.0 | 64.0 | (8.0) | — | — | — | |||||||||||||||||||||||||||||||||||||||||||||||||||||||||||
| Mexico | 14.8 | 14.2 | 4.2 | 9.1 | 8.8 | 3.9 | 9.1 | 8.7 | 3.7 | — | — | — | 61.4 | 61.6 | (0.2) | 0.3 | 0.2 | 0.1 | |||||||||||||||||||||||||||||||||||||||||||||||||||||||||||
| (1) Market share estimates are calculated using IMS data | |||||||||||||||||||||||||||||||||||||||||||||||||||||||||||||||||||||||||||||
| Note: % change for Total Market and PMI shipments is computed based on millions of units. "-" indicates volume below 50 million units and market share below 0.1% | |||||||||||||||||||||||||||||||||||||||||||||||||||||||||||||||||||||||||||||
| Schedule 1 | |||||||||||||||||||||||||||||||||||||||||||||||||||||
| PHILIP MORRIS INTERNATIONAL INC. and Subsidiaries | |||||||||||||||||||||||||||||||||||||||||||||||||||||
| Diluted Earnings Per Share (EPS) | |||||||||||||||||||||||||||||||||||||||||||||||||||||
| ($ in millions, except per share data) / (Unaudited) | |||||||||||||||||||||||||||||||||||||||||||||||||||||
| Quarters Ended | Diluted EPS | Six Months Ended | |||||||||||||||||||||||||||||||||||||||||||||||||||
| June 30, | June 30, | ||||||||||||||||||||||||||||||||||||||||||||||||||||
| $ | 1.39 | 2021 Diluted Earnings Per Share (1) | $ | 2.93 | |||||||||||||||||||||||||||||||||||||||||||||||||
| $ | 1.25 | 2020 Diluted Earnings Per Share (1) | $ | 2.42 | |||||||||||||||||||||||||||||||||||||||||||||||||
| $ | 0.14 | Change | $ | 0.51 | |||||||||||||||||||||||||||||||||||||||||||||||||
| 11.2 | % | % Change | 21.1 | % | |||||||||||||||||||||||||||||||||||||||||||||||||
| Reconciliation: | |||||||||||||||||||||||||||||||||||||||||||||||||||||
| $ | 1.25 | 2020 Diluted Earnings Per Share (1) | $ | 2.42 | |||||||||||||||||||||||||||||||||||||||||||||||||
| 0.04 | 2020 Asset impairment and exit costs | 0.04 | |||||||||||||||||||||||||||||||||||||||||||||||||||
| — | 2020 Fair value adjustment for equity security investments | 0.04 | |||||||||||||||||||||||||||||||||||||||||||||||||||
| — | 2020 Tax items | — | |||||||||||||||||||||||||||||||||||||||||||||||||||
| (0.04) | 2021 Asset impairment and exit costs | (0.07) | |||||||||||||||||||||||||||||||||||||||||||||||||||
| (0.14) | 2021 Saudi Arabia customs assessments | (0.14) | |||||||||||||||||||||||||||||||||||||||||||||||||||
| — | 2021 Tax items | — | |||||||||||||||||||||||||||||||||||||||||||||||||||
| 0.05 | Currency | 0.15 | |||||||||||||||||||||||||||||||||||||||||||||||||||
| — | Interest | (0.01) | |||||||||||||||||||||||||||||||||||||||||||||||||||
| (0.01) | Change in tax rate | 0.03 | |||||||||||||||||||||||||||||||||||||||||||||||||||
| 0.24 | Operations (2) | 0.47 | |||||||||||||||||||||||||||||||||||||||||||||||||||
| $ | 1.39 | 2021 Diluted Earnings Per Share (1) | $ | 2.93 | |||||||||||||||||||||||||||||||||||||||||||||||||
| (1) Basic and diluted EPS were calculated using the following (in millions): | |||||||||||||||||||||||||||||||||||||||||||||||||||||
| Quarters Ended | Six Months Ended | ||||||||||||||||||||||||||||||||||||||||||||||||||||
| June 30, | June 30, | ||||||||||||||||||||||||||||||||||||||||||||||||||||
| 2021 | 2020 | 2021 | 2020 | ||||||||||||||||||||||||||||||||||||||||||||||||||
| $ 2,172 | $ 1,947 | Net Earnings attributable to PMI | $ 4,590 | $ 3,773 | |||||||||||||||||||||||||||||||||||||||||||||||||
| 6 | 5 | Less: Distributed and undistributed earnings attributable to share-based payment awards | 14 | 10 | |||||||||||||||||||||||||||||||||||||||||||||||||
| $ 2,166 | $ 1,942 | Net Earnings for basic and diluted EPS | $ 4,576 | $ 3,763 | |||||||||||||||||||||||||||||||||||||||||||||||||
| 1,558 | 1,558 | Weighted-average shares for basic EPS | 1,558 | 1,557 | |||||||||||||||||||||||||||||||||||||||||||||||||
| 2 | — | Plus Contingently Issuable Performance Stock Units | 2 | — | |||||||||||||||||||||||||||||||||||||||||||||||||
| 1,560 | 1,558 | Weighted-average shares for diluted EPS | 1,560 | 1,557 | |||||||||||||||||||||||||||||||||||||||||||||||||
| (2) Includes the impact of shares outstanding and share-based payments | |||||||||||||||||||||||||||||||||||||||||||||||||||||
| Schedule 2 | |||||||||||||||||||||||||||||||||||
| PHILIP MORRIS INTERNATIONAL INC. and Subsidiaries | |||||||||||||||||||||||||||||||||||
| Reconciliation of Non-GAAP Measures | |||||||||||||||||||||||||||||||||||
| Reconciliation of Reported Diluted EPS to Reported Diluted EPS, excluding Currency, | |||||||||||||||||||||||||||||||||||
| and Reconciliation of Reported Diluted EPS to Adjusted Diluted EPS, excluding Currency | |||||||||||||||||||||||||||||||||||
| (Unaudited) | |||||||||||||||||||||||||||||||||||
| Quarters Ended June 30, | Six Months Ended June 30, | ||||||||||||||||||||||||||||||||||
| 2021 | 2020 | % Change | 2021 | 2020 | % Change | ||||||||||||||||||||||||||||||
| $ 1.39 | $ 1.25 | 11.2 | % | Reported Diluted EPS | $ 2.93 | $ 2.42 | 21.1 | % | |||||||||||||||||||||||||||
| 0.05 | Less: Currency | 0.15 | |||||||||||||||||||||||||||||||||
| $ 1.34 | $ 1.25 | 7.2 | % | Reported Diluted EPS, excluding Currency | $ 2.78 | $ 2.42 | 14.9 | % | |||||||||||||||||||||||||||
| Quarters Ended June 30, | Six Months Ended June 30, | Year Ended | |||||||||||||||||||||||||||||||||
| 2021 | 2020 | % Change | 2021 | 2020 | % Change | 2020 | |||||||||||||||||||||||||||||
| $ 1.39 | $ 1.25 | 11.2 | % | Reported Diluted EPS | $ 2.93 | $ 2.42 | 21.1 | % | $ 5.16 | ||||||||||||||||||||||||||
| 0.14 | — | Saudi Arabia customs assessments | 0.14 | — | — | ||||||||||||||||||||||||||||||
| 0.04 | 0.04 | Asset impairment and exit costs | 0.07 | 0.04 | 0.08 | ||||||||||||||||||||||||||||||
| — | — | Fair value adjustment for equity security investments | — | 0.04 | 0.04 | ||||||||||||||||||||||||||||||
| — | — | Tax items | — | — | (0.06) | ||||||||||||||||||||||||||||||
| — | — | Brazil indirect tax credit | — | — | (0.05) | ||||||||||||||||||||||||||||||
| $ 1.57 | $ 1.29 | 21.7 | % | Adjusted Diluted EPS | $ 3.14 | $ 2.50 | 25.6 | % | $ 5.17 | ||||||||||||||||||||||||||
| 0.05 | Less: Currency | 0.15 | |||||||||||||||||||||||||||||||||
| $ 1.52 | $ 1.29 | 17.8 | % | Adjusted Diluted EPS, excluding Currency | $ 2.99 | $ 2.50 | 19.6 | % | |||||||||||||||||||||||||||
| Schedule 3 | |||||||||||||||||||||||||||||||||||||||||
| PHILIP MORRIS INTERNATIONAL INC. and Subsidiaries | |||||||||||||||||||||||||||||||||||||||||
| Reconciliation of Non-GAAP Measures | |||||||||||||||||||||||||||||||||||||||||
| Net Revenues by Product Category and Adjustments of Net Revenues for the Impact of Currency and Acquisitions | |||||||||||||||||||||||||||||||||||||||||
| ($ in millions) / (Unaudited) | |||||||||||||||||||||||||||||||||||||||||
| Net Revenues | Currency | Net Revenues excluding Currency | Acquisitions | Net Revenues excluding Currency & Acquisitions | Quarters Ended June 30, | Net Revenues | Total | Excluding Currency | Excluding Currency & Acquisitions | ||||||||||||||||||||||||||||||||
| 2021 | Combustible Products | 2020 | % Change | ||||||||||||||||||||||||||||||||||||||
| $ 2,162 | $ 198 | $ 1,965 | $ — | $ 1,965 | European Union | $ 1,945 | 11.2 | % | 1.0 | % | 1.0 | % | |||||||||||||||||||||||||||||
| 555 | 8 | 547 | — | 547 | Eastern Europe | 522 | 6.2 | % | 4.6 | % | 4.6 | % | |||||||||||||||||||||||||||||
| 527 | (1) | (17) | 544 | — | 544 | Middle East & Africa | 696 | (24.2) | % | (21.9) | % | (21.9) | % | ||||||||||||||||||||||||||||
| 1,045 | 68 | 977 | — | 977 | South & Southeast Asia | 889 | 17.5 | % | 9.8 | % | 9.8 | % | |||||||||||||||||||||||||||||
| 611 | 26 | 586 | — | 586 | East Asia & Australia | 630 | (3.0) | % | (7.1) | % | (7.1) | % | |||||||||||||||||||||||||||||
| 418 | 29 | 389 | — | 389 | Latin America & Canada | 363 | 15.3 | % | 7.4 | % | 7.4 | % | |||||||||||||||||||||||||||||
| $ 5,318 | $ 312 | $ 5,007 | $ — | $ 5,007 | Total Combustible | $ 5,045 | 5.4 | % | (0.8) | % | (0.8) | % | |||||||||||||||||||||||||||||
| 2021 | Reduced-Risk Products | 2020 | % Change | ||||||||||||||||||||||||||||||||||||||
| $ 987 | $ 90 | $ 896 | $ — | $ 896 | European Union | $ 530 | 86.2 | % | 69.1 | % | 69.1 | % | |||||||||||||||||||||||||||||
| 340 | 6 | 334 | — | 334 | Eastern Europe | 261 | 30.5 | % | 28.3 | % | 28.3 | % | |||||||||||||||||||||||||||||
| 33 | 1 | 32 | — | 32 | Middle East & Africa | 8 | +100% | +100% | +100% | ||||||||||||||||||||||||||||||||
| 1 | — | 1 | — | 1 | South & Southeast Asia | — | — | % | — | % | — | % | |||||||||||||||||||||||||||||
| 903 | 11 | 891 | — | 891 | East Asia & Australia | 802 | 12.6 | % | 11.2 | % | 11.2 | % | |||||||||||||||||||||||||||||
| 12 | — | 12 | — | 12 | Latin America & Canada | 5 | +100% | +100% | +100% | ||||||||||||||||||||||||||||||||
| $ 2,276 | $ 108 | $ 2,167 | $ — | $ 2,167 | Total RRPs | $ 1,606 | 41.7 | % | 35.0 | % | 35.0 | % | |||||||||||||||||||||||||||||
| 2021 | PMI | 2020 | % Change | ||||||||||||||||||||||||||||||||||||||
| $ 3,149 | $ 288 | $ 2,861 | $ — | $ 2,861 | European Union | $ 2,475 | 27.2 | % | 15.6 | % | 15.6 | % | |||||||||||||||||||||||||||||
| 895 | 14 | 881 | — | 881 | Eastern Europe | 783 | 14.3 | % | 12.5 | % | 12.5 | % | |||||||||||||||||||||||||||||
| 560 | (1) | (16) | 576 | — | 576 | Middle East & Africa | 704 | (20.5) | % | (18.2) | % | (18.2) | % | ||||||||||||||||||||||||||||
| 1,046 | 68 | 978 | — | 978 | South & Southeast Asia | 889 | 17.7 | % | 10.0 | % | 10.0 | % | |||||||||||||||||||||||||||||
| 1,514 | 37 | 1,477 | — | 1,477 | East Asia & Australia | 1,432 | 5.7 | % | 3.1 | % | 3.1 | % | |||||||||||||||||||||||||||||
| 430 | 29 | 401 | — | 401 | Latin America & Canada | 368 | 16.8 | % | 9.0 | % | 9.0 | % | |||||||||||||||||||||||||||||
| $ 7,594 | $ 420 | $ 7,174 | $ — | $ 7,174 | Total PMI | $ 6,651 | 14.2 | % | 7.9 | % | 7.9 | % | |||||||||||||||||||||||||||||
| (1) Includes a reduction in net revenues of $246 million related to the Saudi Arabia customs assessments | |||||||||||||||||||||||||||||||||||||||||
| Note: Sum of product categories or Regions might not foot to Total PMI due to roundings. "-" indicates amounts between -$0.5 million and +$0.5 million | |||||||||||||||||||||||||||||||||||||||||
| Schedule 4 | |||||||||||||||||||||||||||||||||||||||||
| PHILIP MORRIS INTERNATIONAL INC. and Subsidiaries | |||||||||||||||||||||||||||||||||||||||||
| Reconciliation of Non-GAAP Measures | |||||||||||||||||||||||||||||||||||||||||
| Net Revenues by Product Category and Adjustments of Net Revenues for the Impact of Currency and Acquisitions | |||||||||||||||||||||||||||||||||||||||||
| ($ in millions) / (Unaudited) | |||||||||||||||||||||||||||||||||||||||||
| Net Revenues | Currency | Net Revenues excluding Currency | Acquisitions | Net Revenues excluding Currency & Acquisitions | Six Months Ended June 30, | Net Revenues | Total | Excluding Currency | Excluding Currency & Acquisitions | ||||||||||||||||||||||||||||||||
| 2021 | Combustible Products | 2020 | % Change | ||||||||||||||||||||||||||||||||||||||
| $ 4,113 | $ 357 | $ 3,755 | $ — | $ 3,755 | European Union | $ 3,855 | 6.7 | % | (2.6) | % | (2.6) | % | |||||||||||||||||||||||||||||
| 1,047 | (22) | 1,069 | — | 1,069 | Eastern Europe | 1,045 | 0.1 | % | 2.3 | % | 2.3 | % | |||||||||||||||||||||||||||||
| 1,307 | (1) | (40) | 1,347 | — | 1,347 | Middle East & Africa | 1,528 | (14.5) | % | (11.9) | % | (11.9) | % | ||||||||||||||||||||||||||||
| 2,216 | 96 | 2,120 | — | 2,120 | South & Southeast Asia | 2,140 | 3.5 | % | (0.9) | % | (0.9) | % | |||||||||||||||||||||||||||||
| 1,259 | 60 | 1,199 | — | 1,199 | East Asia & Australia | 1,272 | (1.0) | % | (5.7) | % | (5.7) | % | |||||||||||||||||||||||||||||
| 840 | 18 | 822 | — | 822 | Latin America & Canada | 803 | 4.6 | % | 2.4 | % | 2.4 | % | |||||||||||||||||||||||||||||
| $ 10,781 | $ 469 | $ 10,312 | $ — | $ 10,312 | Total Combustible | $ 10,643 | 1.3 | % | (3.1) | % | (3.1) | % | |||||||||||||||||||||||||||||
| 2021 | Reduced-Risk Products | 2020 | % Change | ||||||||||||||||||||||||||||||||||||||
| $ 1,945 | $ 166 | $ 1,780 | $ — | $ 1,780 | European Union | $ 1,155 | 68.5 | % | 54.1 | % | 54.1 | % | |||||||||||||||||||||||||||||
| 644 | (39) | 683 | — | 683 | Eastern Europe | 526 | 22.6 | % | 29.9 | % | 29.9 | % | |||||||||||||||||||||||||||||
| 54 | 1 | 53 | — | 53 | Middle East & Africa | 52 | 4.0 | % | 2.6 | % | 2.6 | % | |||||||||||||||||||||||||||||
| 3 | — | 3 | — | 3 | South & Southeast Asia | — | — | % | — | % | — | % | |||||||||||||||||||||||||||||
| 1,727 | 48 | 1,679 | — | 1,679 | East Asia & Australia | 1,415 | 22.0 | % | 18.7 | % | 18.7 | % | |||||||||||||||||||||||||||||
| 24 | — | 24 | — | 24 | Latin America & Canada | 13 | 79.5 | % | 77.0 | % | 77.0 | % | |||||||||||||||||||||||||||||
| $ 4,398 | $ 176 | $ 4,222 | $ — | $ 4,222 | Total RRPs | $ 3,161 | 39.1 | % | 33.6 | % | 33.6 | % | |||||||||||||||||||||||||||||
| 2021 | PMI | 2020 | % Change | ||||||||||||||||||||||||||||||||||||||
| $ 6,058 | $ 523 | $ 5,535 | $ — | $ 5,535 | European Union | $ 5,010 | 20.9 | % | 10.5 | % | 10.5 | % | |||||||||||||||||||||||||||||
| 1,691 | (61) | 1,752 | — | 1,752 | Eastern Europe | 1,571 | 7.6 | % | 11.5 | % | 11.5 | % | |||||||||||||||||||||||||||||
| 1,361 | (1) | (39) | 1,400 | — | 1,400 | Middle East & Africa | 1,580 | (13.9) | % | (11.4) | % | (11.4) | % | ||||||||||||||||||||||||||||
| 2,219 | 96 | 2,123 | — | 2,123 | South & Southeast Asia | 2,140 | 3.7 | % | (0.8) | % | (0.8) | % | |||||||||||||||||||||||||||||
| 2,986 | 108 | 2,878 | — | 2,878 | East Asia & Australia | 2,687 | 11.1 | % | 7.1 | % | 7.1 | % | |||||||||||||||||||||||||||||
| 864 | 18 | 846 | — | 846 | Latin America & Canada | 816 | 5.9 | % | 3.7 | % | 3.7 | % | |||||||||||||||||||||||||||||
| $ 15,179 | $ 645 | $ 14,534 | $ — | $ 14,534 | Total PMI | $ 13,804 | 10.0 | % | 5.3 | % | 5.3 | % | |||||||||||||||||||||||||||||
| (1) Includes a reduction in net revenues of $246 million related to the Saudi Arabia customs assessments | |||||||||||||||||||||||||||||||||||||||||
| Note: Sum of product categories or Regions might not foot to Total PMI due to roundings. "-" indicates amounts between -$0.5 million and +$0.5 million | |||||||||||||||||||||||||||||||||||||||||
| Schedule 5 | ||||||||||||||||||||||||||||||||||||||||||||||||||||||||
| PHILIP MORRIS INTERNATIONAL INC. and Subsidiaries | ||||||||||||||||||||||||||||||||||||||||||||||||||||||||
| Reconciliation of Non-GAAP Measures | ||||||||||||||||||||||||||||||||||||||||||||||||||||||||
| Reconciliation of Net Revenues to Adjusted Net Revenues, excluding Currency and Acquisitions | ||||||||||||||||||||||||||||||||||||||||||||||||||||||||
| ($ in millions) / (Unaudited) | ||||||||||||||||||||||||||||||||||||||||||||||||||||||||
| Net Revenues | Special Items | Adjusted Net Revenues | Currency | Adjusted Net Revenues excluding Currency | Acqui-sitions | Adjusted Net Revenues excluding Currency & Acqui-sitions | Net Revenues | Special Items | Adjusted Net Revenues | Total | Excluding Currency | Excluding Currency & Acqui-sitions | ||||||||||||||||||||||||||||||||||||||||||||
| 2021 | Quarters Ended June 30, | 2020 | % Change | |||||||||||||||||||||||||||||||||||||||||||||||||||||
| $ 3,149 | $ — | $ 3,149 | $ 288 | $ 2,861 | $ — | $ 2,861 | European Union | $ 2,475 | $ — | $ 2,475 | 27.2 | % | 15.6 | % | 15.6 | % | ||||||||||||||||||||||||||||||||||||||||
| 895 | — | 895 | 14 | 881 | — | 881 | Eastern Europe | 783 | — | 783 | 14.3 | % | 12.5 | % | 12.5 | % | ||||||||||||||||||||||||||||||||||||||||
| 560 | (246) | (1) | 806 | (16) | 822 | — | 822 | Middle East & Africa | 704 | — | 704 | 14.5 | % | 16.8 | % | 16.8 | % | |||||||||||||||||||||||||||||||||||||||
| 1,046 | — | 1,046 | 68 | 978 | — | 978 | South & Southeast Asia | 889 | — | 889 | 17.7 | % | 10.0 | % | 10.0 | % | ||||||||||||||||||||||||||||||||||||||||
| 1,514 | — | 1,514 | 37 | 1,477 | — | 1,477 | East Asia & Australia | 1,432 | — | 1,432 | 5.7 | % | 3.1 | % | 3.1 | % | ||||||||||||||||||||||||||||||||||||||||
| 430 | — | 430 | 29 | 401 | — | 401 | Latin America & Canada | 368 | — | 368 | 16.8 | % | 9.0 | % | 9.0 | % | ||||||||||||||||||||||||||||||||||||||||
| $ 7,594 | $ (246) | $ 7,840 | $ 420 | $ 7,420 | $ — | $ 7,420 | Total PMI | $ 6,651 | $ — | $ 6,651 | 17.9 | % | 11.6 | % | 11.6 | % | ||||||||||||||||||||||||||||||||||||||||
| 2021 | Six Months Ended June 30, | 2020 | % Change | |||||||||||||||||||||||||||||||||||||||||||||||||||||
| $ 6,058 | $ — | $ 6,058 | $ 523 | $ 5,535 | $ — | $ 5,535 | European Union | $ 5,010 | $ — | $ 5,010 | 20.9 | % | 10.5 | % | 10.5 | % | ||||||||||||||||||||||||||||||||||||||||
| 1,691 | — | 1,691 | (61) | 1,752 | — | 1,752 | Eastern Europe | 1,571 | — | 1,571 | 7.6 | % | 11.5 | % | 11.5 | % | ||||||||||||||||||||||||||||||||||||||||
| 1,361 | (246) | (1) | 1,607 | (39) | 1,646 | — | 1,646 | Middle East & Africa | 1,580 | — | 1,580 | 1.7 | % | 4.2 | % | 4.2 | % | |||||||||||||||||||||||||||||||||||||||
| 2,219 | — | 2,219 | 96 | 2,123 | — | 2,123 | South & Southeast Asia | 2,140 | — | 2,140 | 3.7 | % | (0.8) | % | (0.8) | % | ||||||||||||||||||||||||||||||||||||||||
| 2,986 | — | 2,986 | 108 | 2,878 | — | 2,878 | East Asia & Australia | 2,687 | — | 2,687 | 11.1 | % | 7.1 | % | 7.1 | % | ||||||||||||||||||||||||||||||||||||||||
| 864 | — | 864 | 18 | 846 | — | 846 | Latin America & Canada | 816 | — | 816 | 5.9 | % | 3.7 | % | 3.7 | % | ||||||||||||||||||||||||||||||||||||||||
| $ 15,179 | $ (246) | $ 15,425 | $ 645 | $ 14,780 | $ — | $ 14,780 | Total PMI | $ 13,804 | $ — | $ 13,804 | 11.7 | % | 7.1 | % | 7.1 | % | ||||||||||||||||||||||||||||||||||||||||
| (1) Represents the Saudi Arabia customs assessments | ||||||||||||||||||||||||||||||||||||||||||||||||||||||||
| Schedule 6 | ||||||||||||||||||||||||||||||||||||||||||||
| PHILIP MORRIS INTERNATIONAL INC. and Subsidiaries | ||||||||||||||||||||||||||||||||||||||||||||
| Reconciliation of Non-GAAP Measures | ||||||||||||||||||||||||||||||||||||||||||||
| Adjustments of Operating Income for the Impact of Currency and Acquisitions | ||||||||||||||||||||||||||||||||||||||||||||
| ($ in millions) / (Unaudited) | ||||||||||||||||||||||||||||||||||||||||||||
| Operating Income | Currency | Operating Income excluding Currency | Acquisitions | Operating Income excluding Currency & Acquisitions | Operating Income | Total | Excluding Currency | Excluding Currency & Acquisitions | ||||||||||||||||||||||||||||||||||||
| 2021 | Quarters Ended June 30, | 2020 | % Change | |||||||||||||||||||||||||||||||||||||||||
| $ 1,641 | (1) | $ 178 | $ 1,463 | $ — | $ 1,463 | European Union | $ 1,178 | (3) | 39.3 | % | 24.2 | % | 24.2 | % | ||||||||||||||||||||||||||||||
| 314 | (1) | (39) | 353 | — | 353 | Eastern Europe | 266 | (3) | 18.0 | % | 32.7 | % | 32.7 | % | ||||||||||||||||||||||||||||||
| 16 | (2) | (32) | 48 | — | 48 | Middle East & Africa | 237 | (3) | (93.2) | % | (79.7) | % | (79.7) | % | ||||||||||||||||||||||||||||||
| 331 | (1) | 19 | 312 | — | 312 | South & Southeast Asia | 289 | (3) | 14.5 | % | 8.0 | % | 8.0 | % | ||||||||||||||||||||||||||||||
| 715 | (1) | (1) | 716 | — | 716 | East Asia & Australia | 669 | (3) | 6.9 | % | 7.0 | % | 7.0 | % | ||||||||||||||||||||||||||||||
| 112 | (1) | 2 | 110 | — | 110 | Latin America & Canada | 92 | (3) | 21.7 | % | 19.6 | % | 19.6 | % | ||||||||||||||||||||||||||||||
| $ 3,129 | $ 127 | $ 3,002 | $ — | $ 3,002 | Total PMI | $ 2,731 | 14.6 | % | 9.9 | % | 9.9 | % | ||||||||||||||||||||||||||||||||
| 2021 | Six Months Ended June 30, | 2020 | % Change | |||||||||||||||||||||||||||||||||||||||||
| $ 3,131 | (4) | $ 334 | $ 2,797 | $ — | $ 2,797 | European Union | $ 2,336 | (3) | 34.0 | % | 19.7 | % | 19.7 | % | ||||||||||||||||||||||||||||||
| 575 | (4) | (32) | 607 | — | 607 | Eastern Europe | 365 | (3) | 57.5 | % | 66.3 | % | 66.3 | % | ||||||||||||||||||||||||||||||
| 351 | (5) | (45) | 396 | — | 396 | Middle East & Africa | 558 | (3) | (37.1) | % | (29.0) | % | (29.0) | % | ||||||||||||||||||||||||||||||
| 860 | (4) | 32 | 828 | — | 828 | South & Southeast Asia | 888 | (3) | (3.2) | % | (6.8) | % | (6.8) | % | ||||||||||||||||||||||||||||||
| 1,410 | (4) | 17 | 1,393 | — | 1,393 | East Asia & Australia | 1,155 | (3) | 22.1 | % | 20.6 | % | 20.6 | % | ||||||||||||||||||||||||||||||
| 246 | (4) | 8 | 238 | — | 238 | Latin America & Canada | 218 | (3) | 12.8 | % | 9.2 | % | 9.2 | % | ||||||||||||||||||||||||||||||
| $ 6,573 | $ 314 | $ 6,259 | $ — | $ 6,259 | Total PMI | $ 5,520 | 19.1 | % | 13.4 | % | 13.4 | % | ||||||||||||||||||||||||||||||||
| (1) Includes asset impairment and exit costs: EU ($35 million), EE ($7 million), S&SA ($10 million), EA&A ($15 million) and LA&C ($4 million) | ||||||||||||||||||||||||||||||||||||||||||||
| (2) Includes the Saudi Arabia customs assessments ($246 million) and asset impairment and exit costs ($8 million) | ||||||||||||||||||||||||||||||||||||||||||||
| (3) Includes asset impairment and exit costs ($71 million): EU ($27 million), EE ($7 million), ME&A ($9 million), S&SA ($11 million), EA&A ($13 million) and LA&C ($4 million) | ||||||||||||||||||||||||||||||||||||||||||||
| (4) Includes asset impairment and exit costs: EU ($44 million), EE ($9 million), S&SA ($13 million), EA&A ($46 million) and LA&C ($5 million) | ||||||||||||||||||||||||||||||||||||||||||||
| (5) Includes the Saudi Arabia customs assessments ($246 million) and asset impairment and exit costs ($10 million) | ||||||||||||||||||||||||||||||||||||||||||||
| Schedule 7 | ||||||||||||||||||||||||||||||||||||||||||||||||||||||||
| PHILIP MORRIS INTERNATIONAL INC. and Subsidiaries | ||||||||||||||||||||||||||||||||||||||||||||||||||||||||
| Reconciliation of Non-GAAP Measures | ||||||||||||||||||||||||||||||||||||||||||||||||||||||||
| Reconciliation of Operating Income to Adjusted Operating Income, excluding Currency and Acquisitions | ||||||||||||||||||||||||||||||||||||||||||||||||||||||||
| ($ in millions) / (Unaudited) | ||||||||||||||||||||||||||||||||||||||||||||||||||||||||
| Operating Income | Asset Impairment & Exit Costs and Others | Adjusted Operating Income | Currency | Adjusted Operating Income excluding Currency | Acqui-sitions | Adjusted Operating Income excluding Currency & Acqui-sitions | Operating Income | Asset Impairment & Exit Costs | Adjusted Operating Income | Total | Excluding Currency | Excluding Currency & Acqui-sitions | ||||||||||||||||||||||||||||||||||||||||||||
| 2021 | Quarters Ended June 30, | 2020 | % Change | |||||||||||||||||||||||||||||||||||||||||||||||||||||
| $ 1,641 | $ (35) | (1) | $ 1,676 | $ 178 | $ 1,498 | $ — | $ 1,498 | European Union | $ 1,178 | $ (27) | $ 1,205 | 39.1 | % | 24.3 | % | 24.3 | % | |||||||||||||||||||||||||||||||||||||||
| 314 | (7) | (1) | 321 | (39) | 360 | — | 360 | Eastern Europe | 266 | (7) | 273 | 17.6 | % | 31.9 | % | 31.9 | % | |||||||||||||||||||||||||||||||||||||||
| 16 | (254) | (2) | 270 | (32) | 302 | — | 302 | Middle East & Africa | 237 | (9) | 246 | 9.8 | % | 22.8 | % | 22.8 | % | |||||||||||||||||||||||||||||||||||||||
| 331 | (10) | (1) | 341 | 19 | 322 | — | 322 | South & Southeast Asia | 289 | (11) | 300 | 13.7 | % | 7.3 | % | 7.3 | % | |||||||||||||||||||||||||||||||||||||||
| 715 | (15) | (1) | 730 | (1) | 731 | — | 731 | East Asia & Australia | 669 | (13) | 682 | 7.0 | % | 7.2 | % | 7.2 | % | |||||||||||||||||||||||||||||||||||||||
| 112 | (4) | (1) | 116 | 2 | 114 | — | 114 | Latin America & Canada | 92 | (4) | 96 | 20.8 | % | 18.8 | % | 18.8 | % | |||||||||||||||||||||||||||||||||||||||
| $ 3,129 | $ (325) | $ 3,454 | $ 127 | $ 3,327 | $ — | $ 3,327 | Total PMI | $ 2,731 | $ (71) | $ 2,802 | 23.3 | % | 18.7 | % | 18.7 | % | ||||||||||||||||||||||||||||||||||||||||
| 2021 | Six Months Ended June 30, | 2020 | % Change | |||||||||||||||||||||||||||||||||||||||||||||||||||||
| $ 3,131 | $ (44) | (1) | $ 3,175 | $ 334 | $ 2,841 | $ — | $ 2,841 | European Union | $ 2,336 | $ (27) | $ 2,363 | 34.4 | % | 20.2 | % | 20.2 | % | |||||||||||||||||||||||||||||||||||||||
| 575 | (9) | (1) | 584 | (32) | 616 | — | 616 | Eastern Europe | 365 | (7) | 372 | 57.0 | % | 65.6 | % | 65.6 | % | |||||||||||||||||||||||||||||||||||||||
| 351 | (256) | (3) | 607 | (45) | 652 | — | 652 | Middle East & Africa | 558 | (9) | 567 | 7.1 | % | 15.0 | % | 15.0 | % | |||||||||||||||||||||||||||||||||||||||
| 860 | (13) | (1) | 873 | 32 | 841 | — | 841 | South & Southeast Asia | 888 | (11) | 899 | (2.9) | % | (6.5) | % | (6.5) | % | |||||||||||||||||||||||||||||||||||||||
| 1,410 | (46) | (1) | 1,456 | 17 | 1,439 | — | 1,439 | East Asia & Australia | 1,155 | (13) | 1,168 | 24.7 | % | 23.2 | % | 23.2 | % | |||||||||||||||||||||||||||||||||||||||
| 246 | (5) | (1) | 251 | 8 | 243 | — | 243 | Latin America & Canada | 218 | (4) | 222 | 13.1 | % | 9.5 | % | 9.5 | % | |||||||||||||||||||||||||||||||||||||||
| $ 6,573 | $ (373) | $ 6,946 | $ 314 | $ 6,632 | $ — | $ 6,632 | Total PMI | $ 5,520 | $ (71) | $ 5,591 | 24.2 | % | 18.6 | % | 18.6 | % | ||||||||||||||||||||||||||||||||||||||||
| (1) Represents asset impairment and exit costs | ||||||||||||||||||||||||||||||||||||||||||||||||||||||||
| (2) Includes the Saudi Arabia customs assessments ($246 million) and asset impairment and exit costs ($8 million) | ||||||||||||||||||||||||||||||||||||||||||||||||||||||||
| (3) Includes the Saudi Arabia customs assessments ($246 million) and asset impairment and exit costs ($10 million) | ||||||||||||||||||||||||||||||||||||||||||||||||||||||||
| Schedule 8 | ||||||||||||||||||||||||||||||||||||||||||||||||||||||||||||||
| PHILIP MORRIS INTERNATIONAL INC. and Subsidiaries | ||||||||||||||||||||||||||||||||||||||||||||||||||||||||||||||
| Reconciliation of Non-GAAP Measures | ||||||||||||||||||||||||||||||||||||||||||||||||||||||||||||||
| Reconciliation of Adjusted Operating Income Margin, excluding Currency and Acquisitions | ||||||||||||||||||||||||||||||||||||||||||||||||||||||||||||||
| ($ in millions) / (Unaudited) | ||||||||||||||||||||||||||||||||||||||||||||||||||||||||||||||
| Adjusted Operating Income (1) | Adjusted Net Revenues (2) | Adjusted Operating Income Margin | Adjusted Operating Income excluding Currency (1) | Adjusted Net Revenues excluding Currency (2) | Adjusted Operating Income Margin excluding Currency | Adjusted Operating Income excluding Currency & Acqui-sitions (1) | Adjusted Net Revenues excluding Currency & Acqui-sitions (2) | Adjusted Operating Income Margin excluding Currency & Acqui-sitions | Adjusted Operating Income (1) | Adjusted Net Revenues (2) | Adjusted Operating Income Margin | Adjusted Operating Income Margin | Adjusted Operating Income Margin excluding Currency | Adjusted Operating Income Margin excluding Currency & Acqui-sitions | ||||||||||||||||||||||||||||||||||||||||||||||||
| 2021 | Quarters Ended June 30, | 2020 | % Points Change | |||||||||||||||||||||||||||||||||||||||||||||||||||||||||||
| $ 1,676 | $ 3,149 | 53.2 | % | $ 1,498 | $ 2,861 | 52.4 | % | $ 1,498 | $ 2,861 | 52.4 | % | European Union | $ 1,205 | $ 2,475 | 48.7 | % | 4.5 | 3.7 | 3.7 | |||||||||||||||||||||||||||||||||||||||||||
| 321 | 895 | 35.9 | % | 360 | 881 | 40.9 | % | 360 | 881 | 40.9 | % | Eastern Europe | 273 | 783 | 34.9 | % | 1.0 | 6.0 | 6.0 | |||||||||||||||||||||||||||||||||||||||||||
| 270 | 806 | 33.5 | % | 302 | 822 | 36.7 | % | 302 | 822 | 36.7 | % | Middle East & Africa | 246 | 704 | 34.9 | % | (1.4) | 1.8 | 1.8 | |||||||||||||||||||||||||||||||||||||||||||
| 341 | 1,046 | 32.6 | % | 322 | 978 | 32.9 | % | 322 | 978 | 32.9 | % | South & Southeast Asia | 300 | 889 | 33.7 | % | (1.1) | (0.8) | (0.8) | |||||||||||||||||||||||||||||||||||||||||||
| 730 | 1,514 | 48.2 | % | 731 | 1,477 | 49.5 | % | 731 | 1,477 | 49.5 | % | East Asia & Australia | 682 | 1,432 | 47.6 | % | 0.6 | 1.9 | 1.9 | |||||||||||||||||||||||||||||||||||||||||||
| 116 | 430 | 27.0 | % | 114 | 401 | 28.4 | % | 114 | 401 | 28.4 | % | Latin America & Canada | 96 | 368 | 26.1 | % | 0.9 | 2.3 | 2.3 | |||||||||||||||||||||||||||||||||||||||||||
| $ 3,454 | $ 7,840 | 44.1 | % | $ 3,327 | $ 7,420 | 44.8 | % | $ 3,327 | $ 7,420 | 44.8 | % | Total PMI | $ 2,802 | $ 6,651 | 42.1 | % | 2.0 | 2.7 | 2.7 | |||||||||||||||||||||||||||||||||||||||||||
| 2021 | Six Months Ended June 30, | 2020 | % Points Change | |||||||||||||||||||||||||||||||||||||||||||||||||||||||||||
| $ 3,175 | $ 6,058 | 52.4 | % | $ 2,841 | $ 5,535 | 51.3 | % | $ 2,841 | $ 5,535 | 51.3 | % | European Union | $ 2,363 | $ 5,010 | 47.2 | % | 5.2 | 4.1 | 4.1 | |||||||||||||||||||||||||||||||||||||||||||
| 584 | 1,691 | 34.5 | % | 616 | 1,752 | 35.2 | % | 616 | 1,752 | 35.2 | % | Eastern Europe | 372 | 1,571 | 23.7 | % | 10.8 | 11.5 | 11.5 | |||||||||||||||||||||||||||||||||||||||||||
| 607 | 1,607 | 37.8 | % | 652 | 1,646 | 39.6 | % | 652 | 1,646 | 39.6 | % | Middle East & Africa | 567 | 1,580 | 35.9 | % | 1.9 | 3.7 | 3.7 | |||||||||||||||||||||||||||||||||||||||||||
| 873 | 2,219 | 39.3 | % | 841 | 2,123 | 39.6 | % | 841 | 2,123 | 39.6 | % | South & Southeast Asia | 899 | 2,140 | 42.0 | % | (2.7) | (2.4) | (2.4) | |||||||||||||||||||||||||||||||||||||||||||
| 1,456 | 2,986 | 48.8 | % | 1,439 | 2,878 | 50.0 | % | 1,439 | 2,878 | 50.0 | % | East Asia & Australia | 1,168 | 2,687 | 43.5 | % | 5.3 | 6.5 | 6.5 | |||||||||||||||||||||||||||||||||||||||||||
| 251 | 864 | 29.1 | % | 243 | 846 | 28.7 | % | 243 | 846 | 28.7 | % | Latin America & Canada | 222 | 816 | 27.2 | % | 1.9 | 1.5 | 1.5 | |||||||||||||||||||||||||||||||||||||||||||
| $ 6,946 | $ 15,425 | 45.0 | % | $ 6,632 | $ 14,780 | 44.9 | % | $ 6,632 | $ 14,780 | 44.9 | % | Total PMI | $ 5,591 | $ 13,804 | 40.5 | % | 4.5 | 4.4 | 4.4 | |||||||||||||||||||||||||||||||||||||||||||
| (1) For the calculation of Adjusted Operating Income and Adjusted Operating Income excluding currency and acquisitions refer to Schedule 7 | ||||||||||||||||||||||||||||||||||||||||||||||||||||||||||||||
| (2) For the calculation of Adjusted Net Revenues excluding currency and acquisitions refer to Schedule 5 | ||||||||||||||||||||||||||||||||||||||||||||||||||||||||||||||
| Schedule 9 | ||||||||||||||||||||||||||
| PHILIP MORRIS INTERNATIONAL INC. and Subsidiaries | ||||||||||||||||||||||||||
| Condensed Statements of Earnings | ||||||||||||||||||||||||||
| ($ in millions, except per share data) / (Unaudited) | ||||||||||||||||||||||||||
| Quarters Ended June 30, | Six Months Ended June 30, | |||||||||||||||||||||||||
| 2021 | 2020 | Change Fav./(Unfav.) | 2021 | 2020 | Change Fav./(Unfav.) | |||||||||||||||||||||
| $ 20,421 | $ 17,819 | 14.6 | % | Revenues including Excise Taxes (1) | $ 39,776 | $ 36,072 | 10.3 | % | ||||||||||||||||||
| 12,827 | 11,168 | (14.9) | % | Excise Taxes on products | 24,597 | 22,268 | (10.5) | % | ||||||||||||||||||
| 7,594 | 6,651 | 14.2 | % | Net Revenues (1) | 15,179 | 13,804 | 10.0 | % | ||||||||||||||||||
| 2,353 | 2,179 | (8.0) | % | Cost of sales | 4,627 | 4,581 | (1.0) | % | ||||||||||||||||||
| 5,241 | 4,472 | 17.2 | % | Gross profit | 10,552 | 9,223 | 14.4 | % | ||||||||||||||||||
| 2,093 | 1,722 | (21.5) | % | Marketing, administration and research costs (2) | 3,942 | 3,666 | (7.5) | % | ||||||||||||||||||
| 19 | 19 | Amortization of intangibles | 37 | 37 | ||||||||||||||||||||||
| 3,129 | 2,731 | 14.6 | % | Operating Income | 6,573 | 5,520 | 19.1 | % | ||||||||||||||||||
| 161 | 162 | 0.6 | % | Interest expense, net | 328 | 291 | (12.7) | % | ||||||||||||||||||
| 27 | 22 | (22.7) | % | Pension and other employee benefit costs | 55 | 45 | (22.2) | % | ||||||||||||||||||
| 2,941 | 2,547 | 15.5 | % | Earnings before income taxes | 6,190 | 5,184 | 19.4 | % | ||||||||||||||||||
| 646 | 528 | (22.3) | % | Provision for income taxes | 1,343 | 1,124 | (19.5) | % | ||||||||||||||||||
| (3) | (30) | Equity investments and securities (income)/loss, net | (46) | 24 | ||||||||||||||||||||||
| 2,298 | 2,049 | 12.2 | % | Net Earnings | 4,893 | 4,036 | 21.2 | % | ||||||||||||||||||
| 126 | 102 | Net Earnings attributable to noncontrolling interests | 303 | 263 | ||||||||||||||||||||||
| $ 2,172 | $ 1,947 | 11.6 | % | Net Earnings attributable to PMI | $ 4,590 | $ 3,773 | 21.7 | % | ||||||||||||||||||
| Per share data (3): | ||||||||||||||||||||||||||
| $ 1.39 | $ 1.25 | 11.2 | % | Basic Earnings Per Share | $ 2.94 | $ 2.42 | 21.5 | % | ||||||||||||||||||
| $ 1.39 | $ 1.25 | 11.2 | % | Diluted Earnings Per Share | $ 2.93 | $ 2.42 | 21.1 | % | ||||||||||||||||||
| (1) Six months ended and quarter ended June 30, 2021 includes a reduction in net revenues of $246 million related to the Saudi Arabia customs assessments | ||||||||||||||||||||||||||
| (2) Six months ended June 30, 2021 includes asset impairment and exit costs ($127 million). Quarter ended June 30, 2021 includes asset impairment and exit costs ($79 million). Six months ended and quarter ended June 30, 2020 includes asset impairment and exit costs ($71 million). | ||||||||||||||||||||||||||
| (3) Net Earnings and weighted-average shares used in the basic and diluted Earnings Per Share computations for the quarters and for the six months ended June 30, 2021 and 2020 are shown on Schedule 1, Footnote 1 | ||||||||||||||||||||||||||
| Schedule 10 | ||||||||||||||||||||
| PHILIP MORRIS INTERNATIONAL INC. and Subsidiaries | ||||||||||||||||||||
| Condensed Balance Sheets | ||||||||||||||||||||
| ($ in millions, except ratios) / (Unaudited) | ||||||||||||||||||||
| June 30, | December 31, | |||||||||||||||||||
| 2021 | 2020 | |||||||||||||||||||
| Assets | ||||||||||||||||||||
| Cash and cash equivalents | $ | 4,915 | $ | 7,280 | ||||||||||||||||
| All other current assets | 13,828 | 14,212 | ||||||||||||||||||
| Property, plant and equipment, net | 5,975 | 6,365 | ||||||||||||||||||
| Goodwill | 5,842 | 5,964 | ||||||||||||||||||
| Other intangible assets, net | 1,958 | 2,019 | ||||||||||||||||||
| Equity investments | 4,633 | 4,798 | ||||||||||||||||||
| Other assets | 3,535 | 4,177 | ||||||||||||||||||
| Total assets | $ | 40,686 | $ | 44,815 | ||||||||||||||||
| Liabilities and Stockholders' (Deficit) Equity | ||||||||||||||||||||
| Short-term borrowings | $ | 136 | $ | 244 | ||||||||||||||||
| Current portion of long-term debt | 1,608 | 3,124 | ||||||||||||||||||
| All other current liabilities | 14,140 | 16,247 | ||||||||||||||||||
| Long-term debt | 27,414 | 28,168 | ||||||||||||||||||
| Deferred income taxes | 505 | 684 | ||||||||||||||||||
| Other long-term liabilities | 6,083 | 6,979 | ||||||||||||||||||
| Total liabilities | 49,886 | 55,446 | ||||||||||||||||||
| Total PMI stockholders' deficit | (11,113) | (12,567) | ||||||||||||||||||
| Noncontrolling interests | 1,913 | 1,936 | ||||||||||||||||||
| Total stockholders' (deficit) equity | (9,200) | (10,631) | ||||||||||||||||||
| Total liabilities and stockholders' (deficit) equity | $ | 40,686 | $ | 44,815 | ||||||||||||||||
| Schedule 11 | |||||||||||||||||||||||||||||
| PHILIP MORRIS INTERNATIONAL INC. and Subsidiaries | |||||||||||||||||||||||||||||
| Reconciliation of Non-GAAP Measures | |||||||||||||||||||||||||||||
| Calculation of Total Debt to Adjusted EBITDA and Net Debt to Adjusted EBITDA Ratios | |||||||||||||||||||||||||||||
| ($ in millions, except ratios) / (Unaudited) | |||||||||||||||||||||||||||||
| Year Ended June 30, 2021 | Year Ended December 31, 2020 | ||||||||||||||||||||||||||||
| July ~ December | January ~ June | 12 months | |||||||||||||||||||||||||||
| 2020 | 2021 | rolling | |||||||||||||||||||||||||||
| Net Earnings | $ | 4,556 | $ | 4,893 | $ | 9,449 | $ | 8,592 | |||||||||||||||||||||
| Equity investments and securities (income)/loss, net | (40) | (46) | (86) | (16) | |||||||||||||||||||||||||
| Provision for income taxes | 1,253 | 1,343 | 2,596 | 2,377 | |||||||||||||||||||||||||
| Interest expense, net | 327 | 328 | 655 | 618 | |||||||||||||||||||||||||
| Depreciation and amortization | 511 | 484 | 995 | 981 | |||||||||||||||||||||||||
| Asset impairment and exit costs and Others (1) | (41) | 373 | 332 | 30 | |||||||||||||||||||||||||
| Adjusted EBITDA | $ | 6,566 | $ | 7,375 | $ | 13,941 | $ | 12,582 | |||||||||||||||||||||
| June 30, | December 31, | ||||||||||||||||||||||||||||
| 2021 | 2020 | ||||||||||||||||||||||||||||
| Short-term borrowings | $ | 136 | $ | 244 | |||||||||||||||||||||||||
| Current portion of long-term debt | 1,608 | 3,124 | |||||||||||||||||||||||||||
| Long-term debt | 27,414 | 28,168 | |||||||||||||||||||||||||||
| Total Debt | $ | 29,158 | $ | 31,536 | |||||||||||||||||||||||||
| Cash and cash equivalents | 4,915 | 7,280 | |||||||||||||||||||||||||||
| Net Debt | $ | 24,243 | $ | 24,256 | |||||||||||||||||||||||||
| Ratios: | |||||||||||||||||||||||||||||
| Total Debt to Adjusted EBITDA | 2.09 | 2.51 | |||||||||||||||||||||||||||
| Net Debt to Adjusted EBITDA | 1.74 | 1.93 | |||||||||||||||||||||||||||
| (1) For the period January 2021 to June 2021 "Others" includes a reduction in net revenues of $246 million related to the Saudi Arabia customs assessments that was recorded in the second quarter of 2021. For the period July 2020 to December 2020 and for the year ended December 31, 2020, "Others" include the Brazil indirect tax credit $119 million that was recorded in the fourth quarter of 2020. | |||||||||||||||||||||||||||||
| Schedule 12 | ||||||||||||||||||||||||||
| PHILIP MORRIS INTERNATIONAL INC. and Subsidiaries | ||||||||||||||||||||||||||
| Reconciliation of Non-GAAP Measures | ||||||||||||||||||||||||||
| Reconciliation of Operating Cash Flow to Operating Cash Flow, excluding Currency | ||||||||||||||||||||||||||
| ($ in millions) / (Unaudited) | ||||||||||||||||||||||||||
| Quarters Ended June 30, | Six Months Ended June 30, | |||||||||||||||||||||||||
| 2021 | 2020 | % Change | 2021 | 2020 | % Change | |||||||||||||||||||||
| $ 3,630 | $ 1,925 | 88.6 | % | Net cash provided by operating activities (1) | $ 4,065 | $ 3,036 | 33.9 | % | ||||||||||||||||||
| 442 | Less: Currency | 619 | ||||||||||||||||||||||||
| $ 3,188 | $ 1,925 | 65.6 | % | Net cash provided by operating activities, excluding currency | $ 3,446 | $ 3,036 | 13.5 | % | ||||||||||||||||||
| (1) Operating cash flow | ||||||||||||||||||||||||||