UNITED STATES
SECURITIES AND EXCHANGE COMMISSION
Washington, D.C. 20549
FORM
CURRENT REPORT
Pursuant to Section 13 or 15(d)
of the Securities Exchange Act of 1934
Date of Report (Date of earliest event reported):
(Exact name of registrant as specified in its charter)
| (State or other jurisdiction | (Commission | (IRS Employer | ||
| of incorporation) | File Number) | Identification No.) |
| (Address of principal executive offices) | (Zip Code) | |||
(Registrant’s telephone number, including area code)
Not Applicable
(Former name or former address, if changed since last report)
Check the appropriate box below if the Form 8-K filing is intended to simultaneously satisfy the filing obligation of the registrant under any of the following provisions:
| Written communications pursuant to Rule 425 under the Securities Act (17 CFR 230.425) |
| Soliciting material pursuant to Rule 14a-12 under the Exchange Act (17 CFR 240.14a-12) |
| Pre-commencement communications pursuant to Rule 14d-2(b) under the Exchange Act (17 CFR 240.14d-2(b)) |
| Pre-commencement communications pursuant to Rule 13e-4(c) under the Exchange Act (17 CFR 240.13e-4(c)) |
Securities registered pursuant to Section 12(b) of the Act:
| Title of each class |
Trading |
Name of each exchange | ||
Indicate by check mark whether the registrant is an emerging growth company as defined in Rule 405 of the Securities Act of 1933 (§230.405 of this chapter) or Rule 12b-2 of the Securities Exchange Act of 1934 (§240.12b-2 of this chapter).
Emerging growth company
If an emerging growth company, indicate by check mark if the registrant has elected not to use the extended transition period for complying with any new or revised financial accounting standards provided pursuant to Section 13(a) of the Exchange Act. ☐
| Item 2.02 | Results of Operations and Financial Condition. |
On May 5, 2026, PennyMac Mortgage Investment Trust (the “Company”) issued a press release and a slide presentation announcing its financial results for the fiscal quarter ended March 31, 2026. Copies of the press release and the slide presentation used in connection with the Company’s presentation of financial results were made available on May 5, 2026 and are furnished as Exhibit 99.1 and Exhibit 99.2, respectively. In addition, the Company has made other supplemental financial information for the fiscal quarter ended March 31, 2026 available on its website at pmt.pennymac.com.
The information in Item 2.02 of this report, including the exhibits hereto, shall not be deemed “filed” for purposes of Section 18 of the Securities Exchange Act of 1934, or otherwise subject to the liabilities of Section 18, nor shall it be deemed incorporated by reference into any disclosure document relating to the Company, except to the extent, if any, expressly set forth by specific reference in such document.
| Item 9.01 | Financial Statements and Exhibits. |
(d) Exhibits.
| Exhibit |
Description | |
| 99.1 | Press Release, dated May 5, 2026, issued by PennyMac Mortgage Investment Trust pertaining to its financial results for the fiscal quarter ended March 31, 2026. | |
| 99.2 | Slide Presentation for use beginning on May 5, 2026 in connection with a presentation of financial results for the fiscal quarter ended March 31, 2026. | |
| 104 | Cover Page Interactive Data File (embedded within the Inline XBRL document). | |
SIGNATURE
Pursuant to the requirements of the Securities Exchange Act of 1934, the registrant has duly caused this report to be signed on its behalf by the undersigned hereunto duly authorized.
| PENNYMAC MORTGAGE INVESTMENT TRUST | ||||||
| Dated: May 5, 2026 | /s/ Daniel S. Perotti | |||||
| Daniel S. Perotti Senior Managing Director and Chief Financial Officer | ||||||
Exhibit 99.1
PennyMac Mortgage Investment Trust
Reports First Quarter 2026 Results
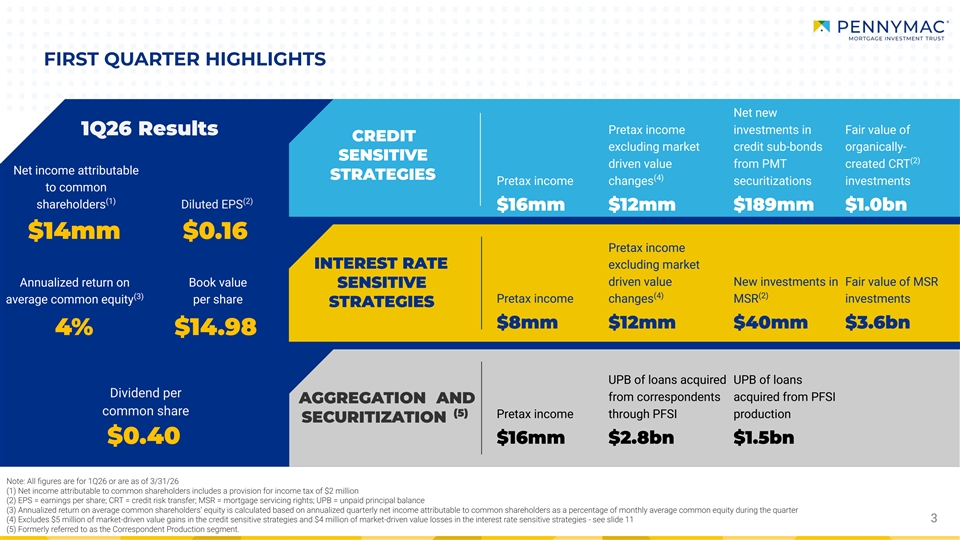
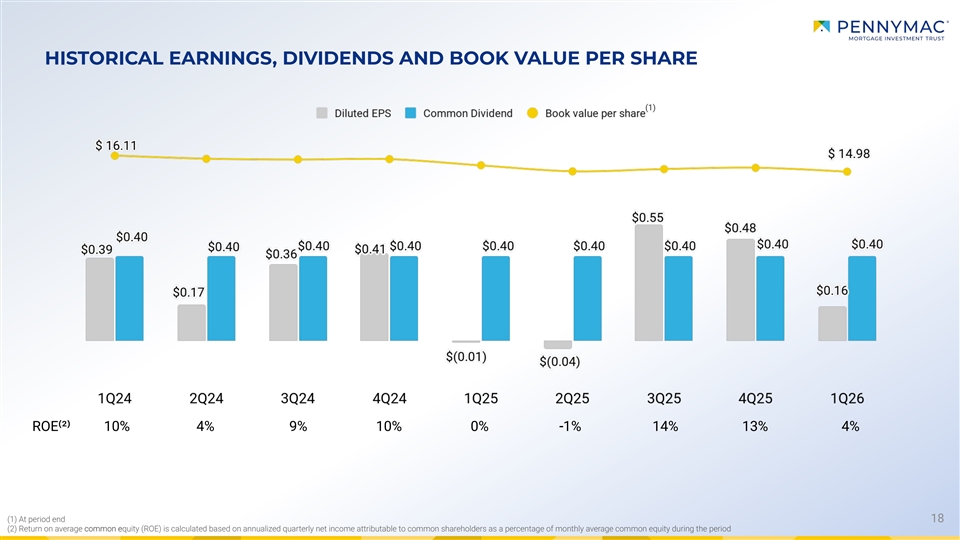
WESTLAKE VILLAGE, Calif. – May 5, 2026 – PennyMac Mortgage Investment Trust (NYSE: PMT) today reported net income attributable to common shareholders of $14.2 million, or $0.16 per common share for the first quarter of 2026, on net investment income of $82.1 million. PMT previously announced a cash dividend for the first quarter of 2026 of $0.40 per common share of beneficial interest, which was declared on March 11, 2026, and was paid on April 24, 2026, to common shareholders of record as of April 9, 2026.
First Quarter 2026 Highlights
Financial results:
| • | Net income attributable to common shareholders of $14.2 million; annualized return on average common shareholders’ equity of 4%1 |
| • | Lower contribution from the interest rate sensitive strategies, primarily due to increased mortgage servicing rights (MSR) runoff related to higher coupon loans, partially offset by improved results in the aggregation and securitization2 segment |
| • | Book value per common share was $14.98 at March 31, 2026, down from $15.25 at December 31, 2025 |
Other investment highlights:
| • | Investment activity driven by acquisition volumes |
| • | Loans acquired totaled $4.3 billion in unpaid principal balance (UPB), down 21% from the prior quarter |
| • | Acquired $2.8 billion in UPB of conventional conforming and nonconforming correspondent loan volume from PennyMac Financial Services, Inc. (NYSE: PFSI) through the correspondent fulfillment arrangement, down 24% from the prior quarter |
| 1 | Return on average common equity is calculated based on net income attributable to common shareholders as a percentage of monthly average common equity during the quarter |
| 2 | Formerly referred to as the correspondent production segment |
1
| • | Resulted in the creation of $40 million in new mortgage servicing rights (MSRs) |
| • | Also acquired $1.5 billion in UPB of loans from PFSI’s production, down 15% from the prior quarter |
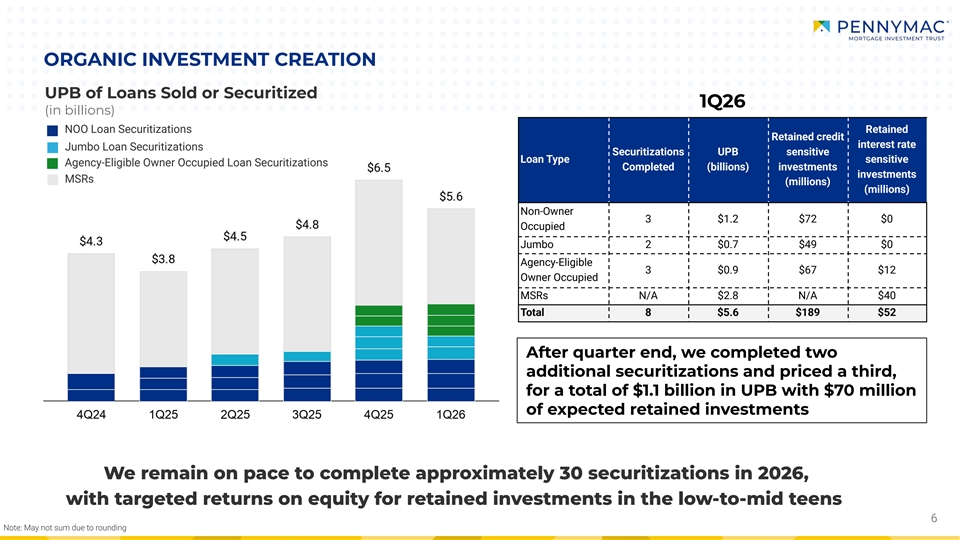
| • | Closed three Agency-eligible investor loan securitizations, two jumbo loan securitizations, and three Agency-eligible owner occupied loan securitizations with a combined UPB of $2.8 billion |
| • | Generated $189 million of net new investments in non-Agency subordinate bonds and $12 million of net new investments in non-Agency senior bonds3 |
| • | Sold $477 million of Agency fixed-rate mortgage-backed securities (MBS) |
Other highlights:
| • | Redeemed $345 million of exchangeable senior notes due March 2026 |
Notable activity after quarter end:
| • | Completed one Agency-eligible investor loan securitization, one Agency-eligible owner occupied loan securitization, and priced another Agency-eligible investor loan securitization with a combined UPB of $1.1 billion |
| • | Generated $70 million of net new investments in non-Agency subordinate bonds2 |
“PMT’s first quarter net income of $14 million, or $0.16 in diluted earnings per share was impacted by lower contributions from our interest rate sensitive strategies partially offset by improved results in our aggregation and securitization segment,” said Chairman and CEO David Spector. “While these factors contributed to a decline in book value per share, the underlying fundamentals of our investments remain strong. We are particularly enthusiastic about the continued success of our private label securitization program, highlighted by the completion of eight transactions during the quarter totaling $2.8 billion in UPB. This activity drove continued organic investment creation and we retained more than $200 million of new investments, reinforcing our ability to create high-quality credit assets in a challenging environment. We remain on pace to complete approximately 30 securitizations in 2026, which we expect will build a substantial foundation of investments with attractive returns to support PMT’s future earnings.”
| 3 | We consolidate the assets and liabilities of the trust that issued the subordinate and senior bonds; accordingly, these investments are shown as Loans held for investment at fair value and Asset-backed financing of variable interest entities at fair value on our consolidated balance sheets |
2
Mr. Spector continued, “Our ability to successfully pivot toward credit-sensitive strategies underscores the depth and agility of our investment platform. The shift into private label securitizations has allowed us to deploy capital into new, high-quality credit investments that we anticipate will produce low-to-mid teens returns on equity. We remain focused on the continued expansion of our securitization program and disciplined capital allocation. As a result, we are confident that our strategy and diversified portfolio of investments will drive the returns necessary to support our dividend and create value for our shareholders over the long-term.”
The following table presents the contributions of PMT’s segments to pretax income:
| Quarter ended March 31, 2026 |
Credit sensitive strategies |
Interest rate sensitive strategies |
Aggregation and securitization |
Reportable segment total |
Corporate | Total | ||||||||||||||||||
| (in thousands) | ||||||||||||||||||||||||
| Net investment income: |
||||||||||||||||||||||||
| Net loan servicing fees |
$ | — | $ | 83,586 | $ | — | $ | 83,586 | $ | — | $ | 83,586 | ||||||||||||
| Net gains on loans held for sale |
— | — | 22,910 | 22,910 | — | 22,910 | ||||||||||||||||||
| Net (losses) gains on investments and financings |
||||||||||||||||||||||||
| Mortgage-backed securities |
— | (33,407 | ) | — | (33,407 | ) | — | (33,407 | ) | |||||||||||||||
| Loans held for investment |
2,191 | (5,758 | ) | — | (3,567 | ) | — | (3,567 | ) | |||||||||||||||
| CRT investments |
13,911 | — | — | 13,911 | — | 13,911 | ||||||||||||||||||
|
|
|
|
|
|
|
|
|
|
|
|
|
|||||||||||||
| Net gains (losses) on investments and financings |
16,102 | (39,165 | ) | — | (23,063 | ) | — | (23,063 | ) | |||||||||||||||
| Net interest income (expense): |
||||||||||||||||||||||||
| Interest income |
19,229 | 214,630 | 39,531 | 273,390 | 2,701 | 276,091 | ||||||||||||||||||
| Interest expense |
18,727 | 227,557 | 31,554 | 277,838 | 1,912 | 279,750 | ||||||||||||||||||
|
|
|
|
|
|
|
|
|
|
|
|
|
|||||||||||||
| Net interest income (expense) |
502 | (12,927 | ) | 7,977 | (4,448 | ) | 789 | (3,659 | ) | |||||||||||||||
| Other |
(48 | ) | — | 2,408 | 2,360 | — | 2,360 | |||||||||||||||||
|
|
|
|
|
|
|
|
|
|
|
|
|
|||||||||||||
| Net investment income |
16,556 | 31,494 | 33,295 | 81,345 | 789 | 82,134 | ||||||||||||||||||
|
|
|
|
|
|
|
|
|
|
|
|
|
|||||||||||||
| Expenses: |
||||||||||||||||||||||||
| Earned by PennyMac Financial Services, Inc.: |
||||||||||||||||||||||||
| Loan servicing fees |
2 | 19,721 | — | 19,723 | — | 19,723 | ||||||||||||||||||
| Management fees |
— | — | — | — | 6,762 | 6,762 | ||||||||||||||||||
| Loan fulfillment fees |
— | — | 5,737 | 5,737 | — | 5,737 | ||||||||||||||||||
| Professional services |
— | — | 10,844 | 10,844 | 2,657 | 13,501 | ||||||||||||||||||
| Compensation |
— | — | — | — | 2,976 | 2,976 | ||||||||||||||||||
| Loan collection and liquidation |
17 | 2,107 | — | 2,124 | — | 2,124 | ||||||||||||||||||
| Safekeeping |
— | 802 | 53 | 855 | — | 855 | ||||||||||||||||||
| Mortgage loan origination Fees |
— | — | 213 | 213 | — | 213 | ||||||||||||||||||
| Other |
77 | 873 | 31 | 981 | 2,367 | 3,348 | ||||||||||||||||||
|
|
|
|
|
|
|
|
|
|
|
|
|
|||||||||||||
| Total expenses |
96 | 23,503 | 16,878 | 40,477 | 14,762 | 55,239 | ||||||||||||||||||
|
|
|
|
|
|
|
|
|
|
|
|
|
|||||||||||||
| Pretax income (loss) |
$ | 16,460 | $ | 7,991 | $ | 16,417 | $ | 40,868 | $ | (13,973 | ) | $ | 26,895 | |||||||||||
|
|
|
|
|
|
|
|
|
|
|
|
|
|||||||||||||
Credit Sensitive Strategies Segment
The Credit Sensitive Strategies segment primarily includes results from PMT’s organically-created GSE CRT investments and investments in non-Agency subordinate bonds from private-label securitizations of PMT’s production. Pretax income for the segment was $16.5 million on net investment income of $16.6 million, compared to pretax income of $23.5 million on net investment income of $23.6 million in the prior quarter.
3
Net gains on investments in the segment were $16.1 million, compared to $24.8 million in the prior quarter. These net gains included $13.9 million of gains from PMT’s organically-created GSE CRT investments and $2.2 million of gains from non-Agency subordinate bonds from PMT’s production.
Net gains on PMT’s organically-created CRT investments for the quarter were $13.9 million, compared to $16.2 million in the prior quarter. These net gains included $2.8 million in valuation-related gains, which reflected the impact of credit spread tightening in the first quarter, down from $3.6 million in the prior quarter. Net gains on PMT’s organically-created CRT investments also included $12.5 million in realized gains and carry, compared to $13.3 million in the prior quarter. Realized losses during the quarter were $1.4 million, up from $0.7 million in the prior quarter.
Net interest income for the segment totaled $0.5 million, compared to $1.3 million of net interest expense in the prior quarter. Interest income totaled $19.2 million, up from $17.5 million in the prior quarter. Interest expense totaled $18.7 million, down from $18.9 million in the prior quarter.
Interest Rate Sensitive Strategies Segment
The Interest Rate Sensitive Strategies segment includes results from investments in MSRs, Agency MBS, non-Agency senior MBS and interest rate hedges. The segment includes investments that typically have offsetting fair value exposures to changes in interest rates. For example, in a period with increasing interest rates, MSRs are expected to increase in fair value, whereas Agency pass-through and non-Agency senior MBS are expected to decrease in fair value. The results in the Interest Rate Sensitive Strategies segment consist of net loan servicing fees, net gains and losses on investments, and net interest expense, as well as associated expenses.
Pretax income for the segment was $8.0 million on net investment income of $31.5 million, compared to pretax income of $28.5 million on net investment income of $52.7 million in the prior quarter.
Net loan servicing fees were $83.6 million, compared to $36.8 million in the prior quarter. Net loan servicing fees included contractually specified servicing fees of $147.6 million and $3.4 million in other fees, reduced by $106.9 million in realization of MSR cash flows, which was up slightly from $103.9 million in the prior quarter due to increased prepayment activity on higher coupon loans. Net loan servicing fees also included $45.6 million in fair value gains on MSRs, $11.9 million in hedging losses, and $5.8 million of MSR recapture income.
4
Net losses on investments for the segment were $39.2 million, primarily consisting of $33.4 million in losses on MBS. PMT’s hedging activities are intended to manage its net exposure across all interest rate sensitive strategies, which include MSRs, MBS and related tax effects.
The following schedule details net loan servicing fees:
| Quarter ended | ||||||||||||
| March 31, 2026 | December 31, 2025 | March 31, 2025 | ||||||||||
| (in thousands) | ||||||||||||
| From nonaffiliates: |
||||||||||||
| Contractually specified |
$ | 147,592 | $ | 151,320 | $ | 152,199 | ||||||
| Other fees |
3,367 | 3,958 | 3,917 | |||||||||
| Effect of MSRs: |
||||||||||||
| Change in fair value |
||||||||||||
| Realization of cashflows |
(106,886 | ) | (103,859 | ) | (88,759 | ) | ||||||
| Market changes |
45,587 | 26,247 | (55,831 | ) | ||||||||
|
|
|
|
|
|
|
|||||||
| (61,299 | ) | (77,612 | ) | (144,590 | ) | |||||||
| Hedging results |
(11,881 | ) | (44,990 | ) | (39,944 | ) | ||||||
|
|
|
|
|
|
|
|||||||
| (73,180 | ) | (122,602 | ) | (184,534 | ) | |||||||
|
|
|
|
|
|
|
|||||||
| Net servicing fees from nonaffiliates |
77,779 | 32,676 | (28,418 | ) | ||||||||
| From PFSI—MSR recapture income |
5,807 | 4,090 | 1,208 | |||||||||
|
|
|
|
|
|
|
|||||||
| Net loan servicing fees |
$ | 83,586 | $ | 36,766 | $ | (27,210 | ) | |||||
|
|
|
|
|
|
|
|||||||
Net interest expense for the segment was $12.9 million versus $12.3 million in the prior quarter. Interest income totaled $214.6 million, up from $189.0 million in the prior quarter primarily due to a higher amount of retained investments from private label securitizations. Interest expense totaled $227.6 million, up from $201.3 million in the prior quarter, due to higher financing balances, including additional non-recourse asset-backed financing resulting from securitization activity.
Segment expenses were $23.5 million, down slightly from the prior quarter.
Aggregation and Securitization Segment
Through its Aggregation and Securitization Segment, PMT aggregates loans, either through participation in correspondent activity or direct purchases of PFSI’s production. These loans are aggregated for execution in the secondary market primarily to the Government-Sponsored Enterprises or via private label securitizations to drive organic creation of assets for long-term investment, which results in current period income. For correspondent production volumes initially acquired by PFSI, PMT retains the right to purchase up to 100% of the non-government loan production, and pays PFSI a fulfillment fee for those loans it purchases. PMT also acquires additional non-government loans from PFSI for inclusion in private label securitizations. Through these activities, PMT’s Aggregation and Securitization segment generated pretax income of $16.4 million in the first quarter, compared to $1.0 million of pretax loss in the prior quarter.
5
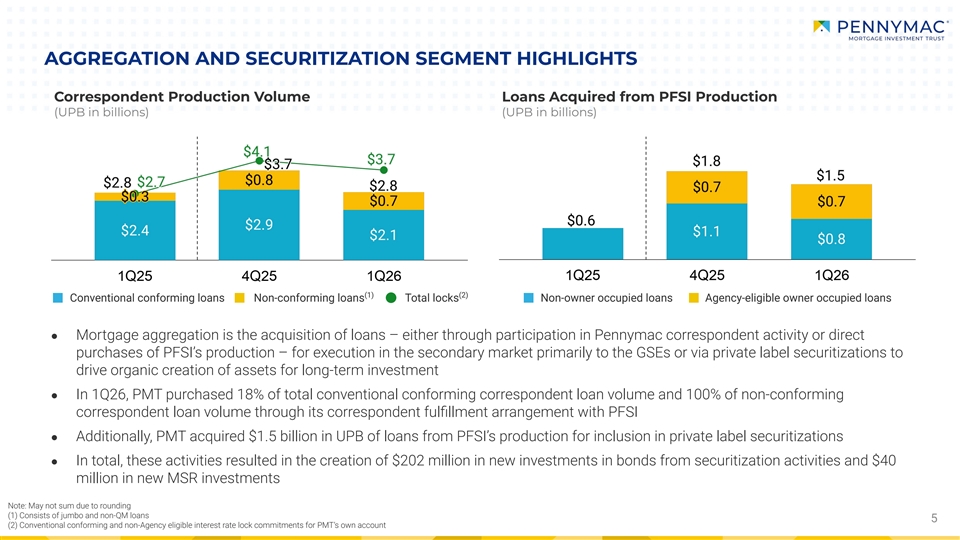
PMT purchased a total of $2.8 billion in UPB of conventional conforming and nonconforming loans through its purchase agreement that PFSI acquired from correspondent sellers, down 24% from the prior quarter. PMT acquired 18% of total conventional conforming correspondent production and 100% of nonconforming correspondent production in the first quarter. Interest rate lock commitments on loans for PMT’s account totaled $3.7 billion, down 9% from the prior quarter. Additionally, PMT acquired $1.5 billion in UPB of loans from PFSI’s production for inclusion in private label securitizations, down from $1.8 billion in the prior quarter.
Segment revenues were $33.3 million and included net gains on loans acquired for sale of $22.9 million, net interest income of $8.0 million, and other income of $2.4 million, which primarily consists of volume-based origination fees. Net gains on loans acquired for sale increased $15.7 million from the prior quarter, which included losses related to spread widening on jumbo loans held for sale during aggregation. Interest income was $39.5 million, up slightly from $39.4 million in the prior quarter, and interest expense was $31.6 million, down from $33.1 million in the prior quarter.
Segment expenses were $16.9 million, down from $17.4 million in the prior quarter due to lower volumes. The weighted average fulfillment fee rate in the first quarter was 21 basis points, up from 18 basis points in the prior quarter.
Corporate
Corporate includes interest income from cash and short-term investments, management fees, and corporate expenses.
Corporate revenues were $0.8 million, down from $0.9 million in the prior quarter. Corporate expenses were $14.8 million, down from $15.7 million in the prior quarter, and consisted of management fees of $6.8 million and $8.0 million of other corporate expenses.
Taxes
PMT recorded a provision for tax expense of $2.3 million, driven primarily by income from mortgage aggregation and securitization, and gains on MSR held in its taxable REIT subsidiary.
6
***
Management’s slide presentation and accompanying materials will be available in the Investor Relations section of the Company’s website at pmt.pennymac.com after the market closes on Tuesday, May 5, 2026. Management will also host a conference call and live audio webcast at 6:00 p.m. Eastern Time to review the Company’s financial results. The webcast can be accessed at pmt.pennymac.com, and a replay will be available shortly after its conclusion.
Individuals who are unable to access the website but would like to receive a copy of the materials should contact the Company’s Investor Relations department at 818.224.7028.
About PennyMac Mortgage Investment Trust
PennyMac Mortgage Investment Trust is a mortgage real estate investment trust (REIT) that invests primarily in residential mortgage loans and mortgage-related assets. PMT is externally managed by PNMAC Capital Management, LLC, a wholly-owned subsidiary of PennyMac Financial Services, Inc. (NYSE: PFSI). Additional information about PennyMac Mortgage Investment Trust is available at pmt.pennymac.com.
| Media |
Investors | |
| Kristyn Clark |
Kevin Chamberlain | |
| Isaac Garden | ||
| 805.395.9943 |
||
| 818.224.7028 |
7
Forward-Looking Statements
This press release contains forward-looking statements within the meaning of Section 21E of the Securities Exchange Act of 1934, as amended, regarding management’s beliefs, estimates, projections and assumptions with respect to, among other things, the Company’s financial results, future operations, business plans and investment strategies, as well as industry and market conditions, all of which are subject to change. Words like “believe,” “expect,” “anticipate,” “promise,” “plan,” and other expressions or words of similar meanings, as well as future or conditional verbs such as “will,” “would,” “should,” “could,” or “may” are generally intended to identify forward-looking statements. Actual results and operations for any future period may vary materially from those projected herein and from past results discussed herein. Factors which could cause actual results to differ materially from historical results or those anticipated include, but are not limited to: interest rate changes; changes in macroeconomic, consumer and real estate market conditions; changes in housing prices, housing sales and real estate values; rising homeownership costs negatively impacting housing affordability; compliance with changing federal, state and local laws and regulations that govern its business; the general economy or the real estate finance and real estate markets; events or circumstances which undermine confidence in the financial and housing markets or otherwise have a broad impact on financial and housing markets; the degree and nature of the Company’s competition; the availability of, and level of competition for, attractive risk adjusted investment opportunities in mortgage loans and mortgage related assets that satisfy the Company’s investment objectives; the concentration of credit risks to which the Company is exposed; the Company’s dependence on and potential conflicts with its manager, servicer and their affiliates; the Company’s ability to mitigate cybersecurity risks, cyber incidents and technology disruptions; the development of artificial intelligence; the availability, terms and deployment of short term and long term capital; the adequacy of the Company’s cash reserves and working capital; the Company’s ability to maintain the desired relationship between its financing and the interest rates and maturities of its assets; the timing and amount of cash flows, if any, from the Company’s investments; the Company’s engagement in private loan securitizations; the Company’s substantial amount of indebtedness; the performance, financial condition and liquidity of borrowers; the Company’s exposure to risks of loss and disruptions in operations from severe weather events, man-made or other natural conditions, including climate change and pandemics; the ability of the Company’s servicer, which also provides the Company with fulfillment services, to approve and monitor correspondent sellers and underwrite loans to investor standards; incomplete or inaccurate information or documentation provided by customers or counterparties, or adverse changes in the financial condition of the Company’s customers and counterparties; the Company’s indemnification and repurchase obligations in connection with mortgage loans it purchases and later sells or securitizes; the quality and enforceability of the collateral documentation evidencing the Company’s ownership and rights in the assets in which it invests; increased rates of delinquency, defaults and forbearances and/or decreased recovery rates on the Company’s investments; the performance of mortgage loans underlying mortgage backed securities or other investments in which the Company retains credit risk; the Company’s ability to foreclose on its investments in a timely manner or at all; increased prepayments of the mortgages and other loans underlying the Company’s mortgage backed securities or relating to the Company’s mortgage servicing rights and other investments; risks associated with the discontinuation of LIBOR; the degree to which the Company’s hedging strategies may or may not protect it from interest rate volatility; the accuracy or changes in the estimates the Company makes about uncertainties, contingencies and asset and liability valuations; the Company’s ability to maintain appropriate internal control over financial reporting; the Company’s ability to detect misconduct and fraud; developments in the secondary markets for the Company’s mortgage loan products; legislative and regulatory changes that impact the mortgage loan industry or housing market; regulatory or other changes that impact government agencies or government sponsored entities, or such changes that increase the cost of doing business with such agencies or entities; federal and state mortgage regulations and enforcement; changes in government support of homeownership and affordability programs; changes in the Company’s investment objectives or investment or operational strategies; limitations imposed on the Company’s business and its ability to satisfy complex rules for it to qualify as a REIT for U.S. federal income tax purposes and qualify for an exclusion from the Investment Company Act of 1940 and the ability of certain of the Company’s subsidiaries to qualify as REITs or as taxable REIT subsidiaries for U.S. federal income tax purposes; changes in governmental regulations, accounting treatment, tax rates and similar matters; the Company’s ability to make distributions to its shareholders in the future; the Company’s failure to deal appropriately with issues that may give rise to reputational risk; and the Company’s organizational structure and certain requirements in its charter documents. You should not place undue reliance on any forward-looking statement and should consider all of the uncertainties and risks described above, as well as those more fully discussed in reports and other documents filed by the Company with the Securities and Exchange Commission from time to time. The Company undertakes no obligation to publicly update or revise any forward-looking statements or any other information contained herein, and the statements made in this press release are current as of the date of this release only.
8
PENNYMAC MORTGAGE INVESTMENT TRUST AND SUBSIDIARIES
CONSOLIDATED BALANCE SHEETS (UNAUDITED)
| March 31, 2026 | December 31, 2025 | March 31, 2025 | ||||||||||
| (in thousands except share amounts) | ||||||||||||
| ASSETS |
||||||||||||
| Cash |
$ | 213,958 | $ | 271,970 | $ | 247,941 | ||||||
| Short-term investments at fair value |
187,689 | 190,518 | 204,158 | |||||||||
| Mortgage-backed securities at fair value |
3,765,539 | 4,452,859 | 4,035,862 | |||||||||
| Loans held for sale at fair value |
2,349,895 | 2,699,398 | 2,002,207 | |||||||||
| Loans held for investment at fair value |
10,867,942 | 8,532,644 | 3,228,991 | |||||||||
| Derivative assets |
54,589 | 55,943 | 45,162 | |||||||||
| Deposits securing credit risk transfer arrangements |
969,725 | 1,009,334 | 1,087,949 | |||||||||
| Mortgage servicing rights at fair value |
3,623,979 | 3,644,702 | 3,770,034 | |||||||||
| Servicing advances |
79,200 | 96,830 | 84,733 | |||||||||
| Due from PennyMac Financial Services, Inc. |
16,152 | 19,100 | 15,155 | |||||||||
| Other |
374,024 | 373,584 | 154,034 | |||||||||
|
|
|
|
|
|
|
|||||||
| Total assets |
$ | 22,502,692 | $ | 21,346,882 | $ | 14,876,226 | ||||||
|
|
|
|
|
|
|
|||||||
| LIABILITIES |
||||||||||||
| Assets sold under agreements to repurchase |
$ | 7,300,692 | $ | 8,018,601 | $ | 6,202,539 | ||||||
| Mortgage loan participation and sale agreements |
— | — | 4,576 | |||||||||
| Notes payable secured by credit risk transfer |
2,396,545 | 2,258,128 | 2,683,368 | |||||||||
| Unsecured senior notes |
684,506 | 1,028,300 | 773,122 | |||||||||
| Asset-backed financing of variable interest entities |
9,903,515 | 7,789,303 | 2,967,631 | |||||||||
| Interest-only security payable at fair value |
34,232 | 37,650 | 35,954 | |||||||||
| Derivative and credit risk transfer strip liabilities |
27,215 | 9,189 | 17,941 | |||||||||
| Accounts payable and accrued liabilities |
137,102 | 168,498 | 105,451 | |||||||||
| Due to PennyMac Financial Services, Inc. |
17,500 | 17,122 | 29,198 | |||||||||
| Income taxes payable |
129,677 | 127,476 | 147,773 | |||||||||
| Liability for losses under representations and warranties |
5,152 | 5,284 | 5,955 | |||||||||
|
|
|
|
|
|
|
|||||||
| Total liabilities |
20,636,136 | 19,459,551 | 12,973,508 | |||||||||
|
|
|
|
|
|
|
|||||||
| SHAREHOLDERS’ EQUITY |
||||||||||||
| Preferred shares of beneficial interest |
541,482 | 541,482 | 541,482 | |||||||||
| Common shares of beneficial interest—authorized, 500,000,000 common shares of $0.01 par value; issued and outstanding 87,191,663, 87,016,604 and 87,010,608 common shares, respectively |
872 | 870 | 870 | |||||||||
| Additional paid-in capital |
1,927,759 | 1,927,804 | 1,924,902 | |||||||||
| Accumulated deficit |
(603,557 | ) | (582,825 | ) | (564,536 | ) | ||||||
|
|
|
|
|
|
|
|||||||
| Total shareholders’ equity |
1,866,556 | 1,887,331 | 1,902,718 | |||||||||
|
|
|
|
|
|
|
|||||||
| Total liabilities and shareholders’ equity |
$ | 22,502,692 | $ | 21,346,882 | $ | 14,876,226 | ||||||
|
|
|
|
|
|
|
|||||||
9
PENNYMAC MORTGAGE INVESTMENT TRUST AND SUBSIDIARIES
CONSOLIDATED STATEMENTS OF OPERATIONS (UNAUDITED)
| For the Quarterly Periods Ended | ||||||||||||
| March 31, 2026 | December 31, 2025 | March 31, 2025 | ||||||||||
| (in thousands, except earnings per common share) | ||||||||||||
| Investment Income |
||||||||||||
| Net loan servicing fees: |
||||||||||||
| From nonaffiliates |
||||||||||||
| Servicing fees |
$ | 150,959 | $ | 155,278 | $ | 156,116 | ||||||
| Change in fair value of mortgage servicing rights |
(61,299 | ) | (77,612 | ) | (144,590 | ) | ||||||
| Hedging results |
(11,881 | ) | (44,990 | ) | (39,944 | ) | ||||||
|
|
|
|
|
|
|
|||||||
| 77,779 | 32,676 | (28,418 | ) | |||||||||
| From PennyMac Financial Services, Inc. |
5,807 | 4,090 | 1,208 | |||||||||
|
|
|
|
|
|
|
|||||||
| Net loan servicing fees |
83,586 | 36,766 | (27,210 | ) | ||||||||
| Net gains on loans held for sale |
22,910 | 7,187 | 12,344 | |||||||||
| Loan origination fees |
2,375 | 2,893 | 3,152 | |||||||||
| Net (losses) gains on investments and financings |
(23,063 | ) | 53,033 | 62,313 | ||||||||
| Net interest expense |
||||||||||||
| Interest income |
276,091 | 248,252 | 176,091 | |||||||||
| Interest expense |
279,750 | 254,714 | 182,137 | |||||||||
|
|
|
|
|
|
|
|||||||
| Net interest expense |
(3,659 | ) | (6,462 | ) | (6,046 | ) | ||||||
| Other |
(15 | ) | 146 | (88 | ) | |||||||
|
|
|
|
|
|
|
|||||||
| Net investment income |
82,134 | 93,563 | 44,465 | |||||||||
|
|
|
|
|
|
|
|||||||
| Expenses |
||||||||||||
| Earned by PennyMac Financial Services, Inc.: |
||||||||||||
| Loan servicing fees |
19,723 | 20,046 | 21,729 | |||||||||
| Management fees |
6,762 | 6,856 | 7,012 | |||||||||
| Loan fulfillment fees |
5,737 | 6,538 | 5,290 | |||||||||
| Professional services |
13,501 | 13,822 | 6,982 | |||||||||
| Compensation |
2,976 | 3,263 | 2,970 | |||||||||
| Loan collection and liquidation |
2,124 | 2,428 | 1,969 | |||||||||
| Safekeeping |
855 | 1,098 | 1,110 | |||||||||
| Loan origination |
213 | 132 | 686 | |||||||||
| Other |
3,348 | 3,267 | 3,016 | |||||||||
|
|
|
|
|
|
|
|||||||
| Total expenses |
55,239 | 57,450 | 50,764 | |||||||||
|
|
|
|
|
|
|
|||||||
| Income (loss) before provision for (benefit from) income taxes |
26,895 | 36,113 | (6,299 | ) | ||||||||
| Provision for (benefit from) income taxes |
2,279 | (16,249 | ) | (15,979 | ) | |||||||
|
|
|
|
|
|
|
|||||||
| Net income |
24,616 | 52,362 | 9,680 | |||||||||
| Dividends on preferred shares |
10,455 | 10,455 | 10,455 | |||||||||
|
|
|
|
|
|
|
|||||||
| Net income (loss) attributable to common shareholders |
$ | 14,161 | $ | 41,907 | $ | (775 | ) | |||||
|
|
|
|
|
|
|
|||||||
| Earnings (losses) per common share |
||||||||||||
| Basic |
$ | 0.16 | $ | 0.48 | $ | (0.01 | ) | |||||
| Diluted |
$ | 0.16 | $ | 0.48 | $ | (0.01 | ) | |||||
| Weighted average shares outstanding |
||||||||||||
| Basic |
87,082 | 87,017 | 86,907 | |||||||||
| Diluted |
87,082 | 87,017 | 86,907 | |||||||||
10
Exhibit 99.2 1Q26 EARNINGS REPORT PennyMac Mortgage Investment Trust May 2026

FORWARD LOOKING STATEMENTS This presentation contains forward-looking statements within the meaning of Section 21E of the Securities Exchange Act of 1934, as amended, regarding management’s beliefs, estimates, projections and assumptions with respect to, among other things, the Company’s financial results, future operations, business plans and investment strategies, as well as industry and market conditions, all of which are subject to change. Words like “believe,” “expect,” “anticipate,” “promise,” “plan,” and other expressions or words of similar meanings, as well as future or conditional verbs such as “will,” “would,” “should,” “could,” or “may” are generally intended to identify forward-looking statements. Actual results and operations for any future period may vary materially from those projected herein and from past results discussed herein. These forward-looking statements include, but are not limited to, statements regarding future changes in interest rates, housing, and prepayment rates; future loan originations and production; future loan delinquencies, defaults and forbearances; future investment and hedge expenses; future investment strategies, future earnings and return on equity as well as other business and financial expectations. Factors which could cause actual results to differ materially from historical results or those anticipated include, but are not limited to: interest rate changes; changes in macroeconomic, consumer and real estate market conditions; changes in housing prices, housing sales and real estate values; rising homeownership costs negatively impacting housing affordability; compliance with changing federal, state and local laws and regulations that govern its business; the general economy or the real estate finance and real estate markets; events or circumstances which undermine confidence in the financial and housing markets or otherwise have a broad impact on financial and housing markets; the degree and nature of the Company’s competition; the availability of, and level of competition for, attractive risk adjusted investment opportunities in mortgage loans and mortgage related assets that satisfy the Company’s investment objectives; the concentration of credit risks to which the Company is exposed; the Company’s dependence on and potential conflicts with its manager, servicer and their affiliates; the Company’s ability to mitigate cybersecurity risks, cyber incidents and technology disruptions; the development of artificial intelligence; the availability, terms and deployment of short term and long term capital; the adequacy of the Company’s cash reserves and working capital; the Company’s ability to maintain the desired relationship between its financing and the interest rates and maturities of its assets; the timing and amount of cash flows, if any, from the Company’s investments; the Company’s engagement in private loan securitizations; the Company’s substantial amount of indebtedness; the performance, financial condition and liquidity of borrowers; the Company’s exposure to risks of loss and disruptions in operations from severe weather events, man-made or other natural conditions, including climate change and pandemics; the ability of the Company’s servicer, which also provides the Company with fulfillment services, to approve and monitor correspondent sellers and underwrite loans to investor standards; incomplete or inaccurate information or documentation provided by customers or counterparties, or adverse changes in the financial condition of the Company’s customers and counterparties; the Company’s indemnification and repurchase obligations in connection with mortgage loans it purchases and later sells or securitizes; the quality and enforceability of the collateral documentation evidencing the Company’s ownership and rights in the assets in which it invests; increased rates of delinquency, defaults and forbearances and/or decreased recovery rates on the Company’s investments; the performance of mortgage loans underlying mortgage backed securities or other investments in which the Company retains credit risk; the Company’s ability to foreclose on its investments in a timely manner or at all; increased prepayments of the mortgages and other loans underlying the Company’s mortgage backed securities or relating to the Company’s mortgage servicing rights and other investments; risks associated with the discontinuation of LIBOR; the degree to which the Company’s hedging strategies may or may not protect it from interest rate volatility; the accuracy or changes in the estimates the Company makes about uncertainties, contingencies and asset and liability valuations; the Company’s ability to maintain appropriate internal control over financial reporting; the Company’s ability to detect misconduct and fraud; developments in the secondary markets for the Company’s mortgage loan products; legislative and regulatory changes that impact the mortgage loan industry or housing market; regulatory or other changes that impact government agencies or government sponsored entities, or such changes that increase the cost of doing business with such agencies or entities; federal and state mortgage regulations and enforcement; changes in government support of homeownership and affordability programs; changes in the Company’s investment objectives or investment or operational strategies; limitations imposed on the Company’s business and its ability to satisfy complex rules for it to qualify as a REIT for U.S. federal income tax purposes and qualify for an exclusion from the Investment Company Act of 1940 and the ability of certain of the Company’s subsidiaries to qualify as REITs or as taxable REIT subsidiaries for U.S. federal income tax purposes; changes in governmental regulations, accounting treatment, tax rates and similar matters; the Company’s ability to make distributions to its shareholders in the future; the Company’s failure to deal appropriately with issues that may give rise to reputational risk; and the Company’s organizational structure and certain requirements in its charter documents. You should not place undue reliance on any forward-looking statement and should consider all of the uncertainties and risks described above, as well as those more fully discussed in reports and other documents filed by the Company with the Securities and Exchange Commission from time to time. The Company undertakes no obligation to publicly update or revise any forward-looking statements or any other information contained herein, and the statements made in this presentation are current as of the date of this presentation only. This presentation contains financial information calculated other than in accordance with U.S. generally accepted accounting principles (“GAAP”), such as income excluding market driven value changes and leverage ratios that provide a meaningful perspective on the Company’s business results since the Company utilizes this information to evaluate and manage the business. Non-GAAP disclosures have limitations as an analytical tool and should not be viewed as a substitute for financial information determined in accordance with GAAP. 2

FIRST QUARTER HIGHLIGHTS Net new Net new Pr Pretax income etax income inv investments in estments in F Fair v air value of alue of 1Q 1Q26 26 Results Results CREDIT CREDIT ex excluding mark cluding market et cr credit sub-bonds edit sub-bonds or organically- ganically- SENSITI SENSITIV VE E (2) (2) driv driven v en value alue fr from PM om PMT T cr created CR eated CRT T Net income attributable S STRA TRATEGIES TEGIES (4) (4) Pr Pretax income etax income changes changes securitizations securitizations inv investments estments Net income attributable to common (1) (2) shar to common eholders Diluted EPS $ $16mm 16mm $ $11mm 12mm $ $189mm 189mm $ $1. 1.0bn 0bn (2) shareholders(1) Diluted EPS $14mm $0.16 Pr Pretax income etax income $14mm $0.16 INTERES INTEREST RA T RATE TE ex excluding mark cluding market et Annualized return on Book value driv driven v en value alue New inv New investments in estments in F Fair v air value of MSR alue of MSR SENSITI SENSITIV VE E (4) (4) (2) (3) Pr Pretax income etax income changes changes MSR(2) MSR inv investments estments average common equity per share S STRA TRATEGIES TEGIES Annualized return on Book value average common equity(3) per share $8mm $8mm $ $11mm 12mm $ $40mm 40mm $3. $3.6bn 6bn 4% $14.98 4% $14.98 UPB of loans acquir UPB of loans acquired ed UPB of loans UPB of loans Dividend per Dividend per fr from PFSI om correspondents acquir acquired fr ed from PFSI om PFSI A CGGREGA ORRESPONDENT TION AND common shar common share e (5) Pr Pretax income etax income corr through PFSI espondents pr production oduction SEC PURITIZA RODUCTION TION $0 $0. .40 40 $ $16mm 16mm $2 $2. .8bn 8bn $ $1.5bn 1.5bn Note: All figures are for 1Q26 or are as of 3/31/26 (1) Net income attributable to common shareholders includes a provision for income tax of $2 million (2) EPS = earnings per share; CRT = credit risk transfer; MSR = mortgage servicing rights; UPB = unpaid principal balance (3) Annualized return on average common shareholders’ equity is calculated based on annualized quarterly net income attributable to common shareholders as a percentage of monthly average common equity during the quarter (4) Excludes $5 million of market-driven value gains in the credit sensitive strategies and $4 million of market-driven value losses in the interest rate sensitive strategies - see slide 11 3 3 3 (5) Formerly referred to as the Correspondent Production segment.

1Q26 STRATEGIC UPDATE

AGGREGATION AND SECURITIZATION SEGMENT HIGHLIGHTS Correspondent Production Volume Loans Acquired from PFSI Production (UPB in billions) (UPB in billions) (1) (2) Conventional conforming loans Non-conforming loans Total locks Non-owner occupied loans Agency-eligible owner occupied loans ● Mortgage aggregation is the acquisition of loans – either through participation in Pennymac correspondent activity or direct purchases of PFSI’s production – for execution in the secondary market primarily to the GSEs or via private label securitizations to drive organic creation of assets for long-term investment ● In 1Q26, PMT purchased 18% of total conventional conforming correspondent loan volume and 100% of non-conforming correspondent loan volume through its correspondent fulfillment arrangement with PFSI ● Additionally, PMT acquired $1.5 billion in UPB of loans from PFSI’s production for inclusion in private label securitizations ● In total, these activities resulted in the creation of $202 million in new investments in bonds from securitization activities and $40 million in new MSR investments Note: May not sum due to rounding (1) Consists of jumbo and non-QM loans 5 (2) Conventional conforming and non-Agency eligible interest rate lock commitments for PMT’s own account

ORGANIC INVESTMENT CREATION UPB of Loans Sold or Securitized 1Q26 (in billions) NOO Loan Securitizations Retained Retained credit interest rate Jumbo Loan Securitizations Securitizations UPB sensitive Loan Type sensitive Agency-Eligible Owner Occupied Loan Securitizations Completed (billions) investments investments MSRs (millions) (millions) Non-Owner 3 $1.2 $72 $0 Occupied Jumbo 2 $0.7 $49 $0 Agency-Eligible 3 $0.9 $67 $12 Owner Occupied MSRs N/A $2.8 N/A $40 Total 8 $5.6 $189 $52 After quarter end, we completed two additional securitizations and priced a third, for a total of $1.1 billion in UPB with $70 million of expected retained investments We remain on pace to complete approximately 30 securitizations in 2026, with targeted returns on equity for retained investments in the low-to-mid teens 6 Note: May not sum due to rounding

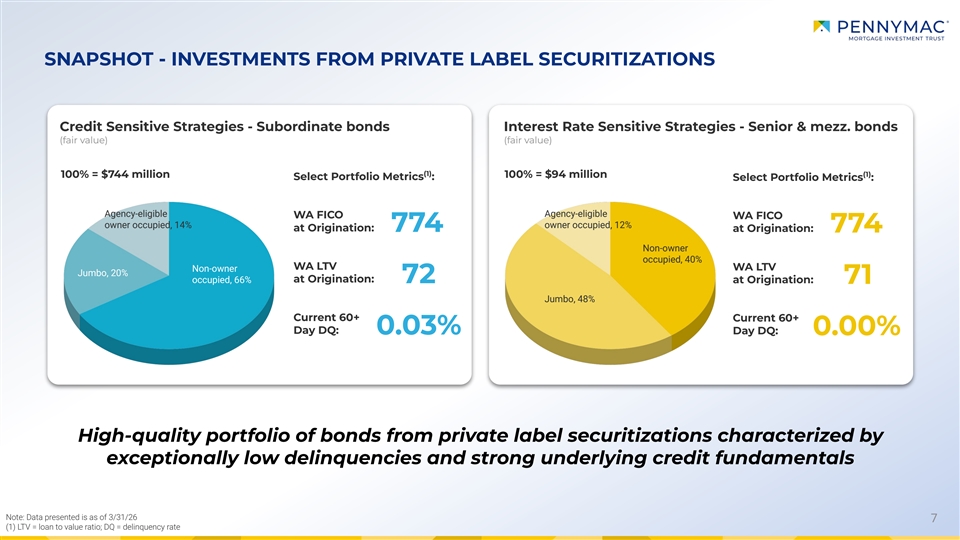
SNAPSHOT - INVESTMENTS FROM PRIVATE LABEL SECURITIZATIONS Credit Sensitive Strategies - Subordinate bonds Interest Rate Sensitive Strategies - Senior & mezz. bonds (fair value) (fair value) (1) (1) 100% = $744 million 100% = $94 million Select Portfolio Metrics : Select Portfolio Metrics : Agency-eligible Agency-eligible WA FICO WA FICO owner occupied, 14% owner occupied, 12% at Origination: 774 at Origination: 774 Non-owner occupied, 40% WA LTV WA LTV Non-owner Jumbo, 20% occupied, 66% at Origination: 72 at Origination: 71 Jumbo, 48% Current 60+ Current 60+ Day DQ: 0.03% Day DQ: 0.00% High-quality portfolio of bonds from private label securitizations characterized by exceptionally low delinquencies and strong underlying credit fundamentals Note: Data presented is as of 3/31/26 7 (1) LTV = loan to value ratio; DQ = delinquency rate

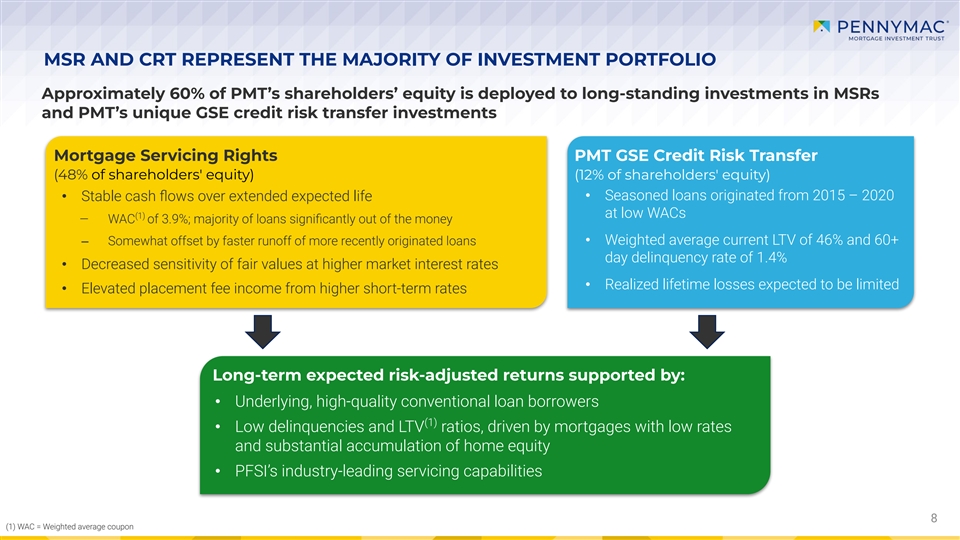
MSR AND CRT REPRESENT THE MAJORITY OF INVESTMENT PORTFOLIO Approximately 60% of PMT’s shareholders’ equity is deployed to long-standing investments in MSRs and PMT’s unique GSE credit risk transfer investments Mortgage Servicing Rights PMT GSE Credit Risk Transfer (48% of shareholders' equity) (12% of shareholders' equity) • Seasoned loans originated from 2015 – 2020 • Stable cash flows over extended expected life (1) at low WACs ‒ WAC of 3.9%; majority of loans significantly out of the money ‒ Somewhat offset by faster runoff of more recently originated loans• Weighted average current LTV of 46% and 60+ day delinquency rate of 1.4% • Decreased sensitivity of fair values at higher market interest rates • Realized lifetime losses expected to be limited • Elevated placement fee income from higher short-term rates Long-term expected risk-adjusted returns supported by: • Underlying, high-quality conventional loan borrowers (1) • Low delinquencies and LTV ratios, driven by mortgages with low rates and substantial accumulation of home equity • PFSI’s industry-leading servicing capabilities 8 (1) WAC = Weighted average coupon

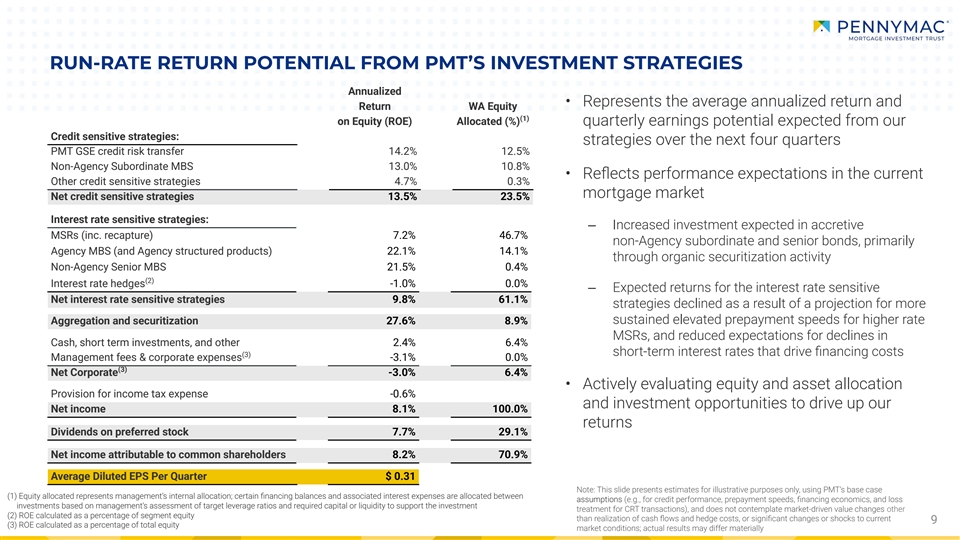
RUN-RATE RETURN POTENTIAL FROM PMT’S INVESTMENT STRATEGIES Annualized • Represents the average annualized return and Return WA Equity (1) on Equity (ROE) Allocated (%) quarterly earnings potential expected from our Credit sensitive strategies: strategies over the next four quarters PMT GSE credit risk transfer 14.2% 12.5% Non-Agency Subordinate MBS 13.0% 10.8% • Reflects performance expectations in the current Other credit sensitive strategies 4.7% 0.3% mortgage market Net credit sensitive strategies 13.5% 23.5% Interest rate sensitive strategies: ‒ Increased investment expected in accretive MSRs (inc. recapture) 7.2% 46.7% non-Agency subordinate and senior bonds, primarily Agency MBS (and Agency structured products) 22.1% 14.1% through organic securitization activity Non-Agency Senior MBS 21.5% 0.4% (2) Interest rate hedges -1.0% 0.0% ‒ Expected returns for the interest rate sensitive Net interest rate sensitive strategies 9.8% 61.1% strategies declined as a result of a projection for more sustained elevated prepayment speeds for higher rate Aggregation and securitization 27.6% 8.9% MSRs, and reduced expectations for declines in Cash, short term investments, and other 2.4% 6.4% short-term interest rates that drive financing costs (3) Management fees & corporate expenses -3.1% 0.0% (3) Net Corporate -3.0% 6.4% • Actively evaluating equity and asset allocation Provision for income tax expense -0.6% and investment opportunities to drive up our Net income 8.1% 100.0% returns Dividends on preferred stock 7.7% 29.1% Net income attributable to common shareholders 8.2% 70.9% Average Diluted EPS Per Quarter $ 0.31 Note: This slide presents estimates for illustrative purposes only, using PMT’s base case (1) Equity allocated represents management’s internal allocation; certain financing balances and associated interest expenses are allocated between assumptions (e.g., for credit performance, prepayment speeds, financing economics, and loss investments based on management’s assessment of target leverage ratios and required capital or liquidity to support the investment treatment for CRT transactions), and does not contemplate market-driven value changes other (2) ROE calculated as a percentage of segment equity than realization of cash flows and hedge costs, or significant changes or shocks to current 9 (3) ROE calculated as a percentage of total equity market conditions; actual results may differ materially

KEY OPERATING METRICS & OTHER FINANCIAL SCHEDULES

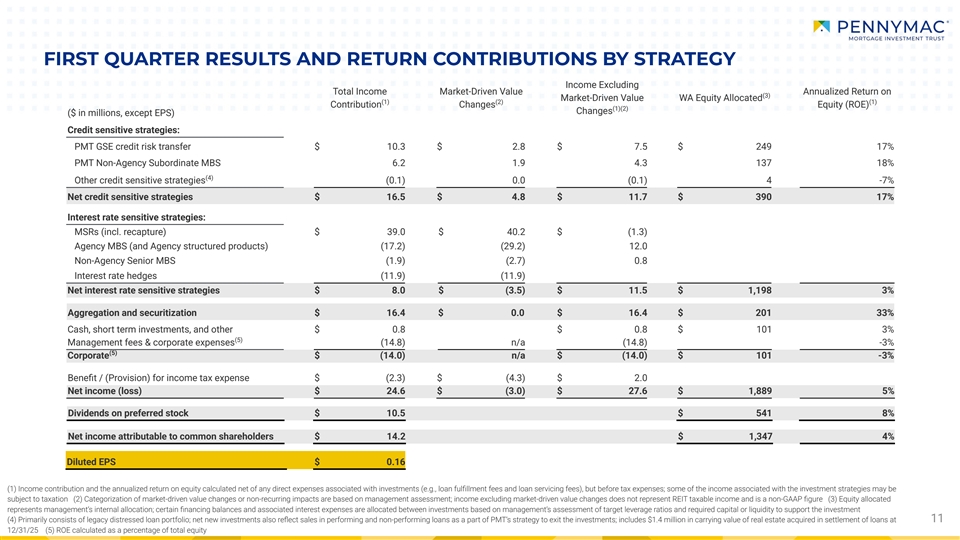
FIRST QUARTER RESULTS AND RETURN CONTRIBUTIONS BY STRATEGY Income Excluding Total Income Market-Driven Value Annualized Return on (3) Market-Driven Value WA Equity Allocated (1) (2) (1) Contribution Changes Equity (ROE) (1)(2) Changes ($ in millions, except EPS) Credit sensitive strategies: PMT GSE credit risk transfer $ 10.3 $ 2.8 $ 7.5 $ 249 17% PMT Non-Agency Subordinate MBS 6.2 1.9 4.3 137 18% (4) Other credit sensitive strategies (0.1) 0.0 (0.1) 4 -7% Net credit sensitive strategies $ 16.5 $ 4.8 $ 11.7 $ 390 17% Interest rate sensitive strategies: MSRs (incl. recapture) $ 39.0 $ 40.2 $ (1.3) Agency MBS (and Agency structured products) (17.2) (29.2) 12.0 Non-Agency Senior MBS (1.9) (2.7) 0.8 Interest rate hedges (11.9) (11.9) Net interest rate sensitive strategies $ 8.0 $ (3.5) $ 11.5 $ 1,198 3% Aggregation and securitization $ 16.4 $ 0.0 $ 16.4 $ 201 33% Cash, short term investments, and other $ 0.8 $ 0.8 $ 101 3% (5) Management fees & corporate expenses (14.8) n/a (14.8) -3% (5) Corporate $ (14.0) n/a $ (14.0) $ 101 -3% Benefit / (Provision) for income tax expense $ (2.3) $ (4.3) $ 2.0 Net income (loss) $ 24.6 $ (3.0) $ 27.6 $ 1,889 5% Dividends on preferred stock $ 10.5 $ 541 8% Net income attributable to common shareholders $ 14.2 $ 1,347 4% Diluted EPS $ 0.16 (1) Income contribution and the annualized return on equity calculated net of any direct expenses associated with investments (e.g., loan fulfillment fees and loan servicing fees), but before tax expenses; some of the income associated with the investment strategies may be subject to taxation (2) Categorization of market-driven value changes or non-recurring impacts are based on management assessment; income excluding market-driven value changes does not represent REIT taxable income and is a non-GAAP figure (3) Equity allocated represents management’s internal allocation; certain financing balances and associated interest expenses are allocated between investments based on management’s assessment of target leverage ratios and required capital or liquidity to support the investment (4) Primarily consists of legacy distressed loan portfolio; net new investments also reflect sales in performing and non-performing loans as a part of PMT’s strategy to exit the investments; includes $1.4 million in carrying value of real estate acquired in settlement of loans at 11 12/31/25 (5) ROE calculated as a percentage of total equity

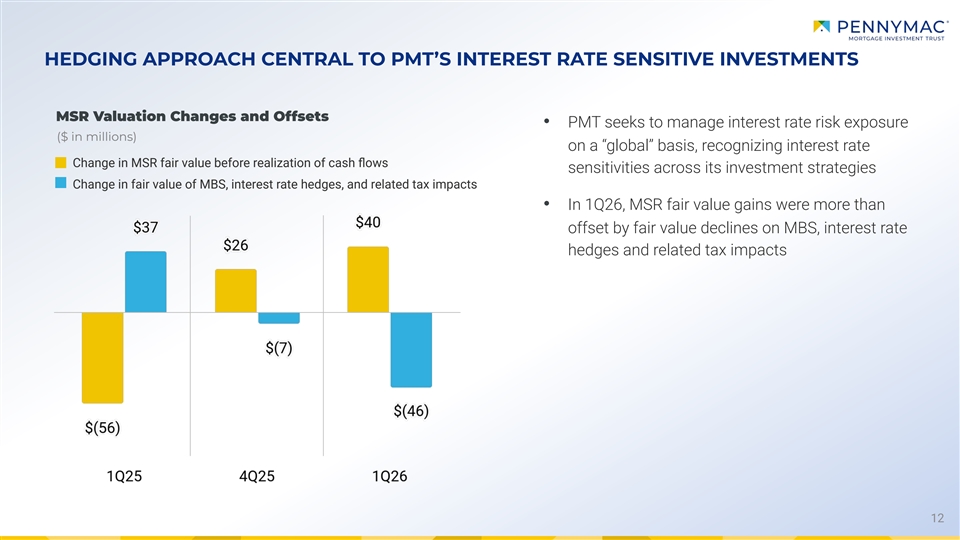
HEDGING APPROACH CENTRAL TO PMT’S INTEREST RATE SENSITIVE INVESTMENTS MSR Valuation Changes and Offsets • PMT seeks to manage interest rate risk exposure ($ in millions) on a “global” basis, recognizing interest rate Change in MSR fair value before realization of cash flows sensitivities across its investment strategies Change in fair value of MBS, interest rate hedges, and related tax impacts • In 1Q26, MSR fair value gains were more than offset by fair value declines on MBS, interest rate hedges and related tax impacts 12

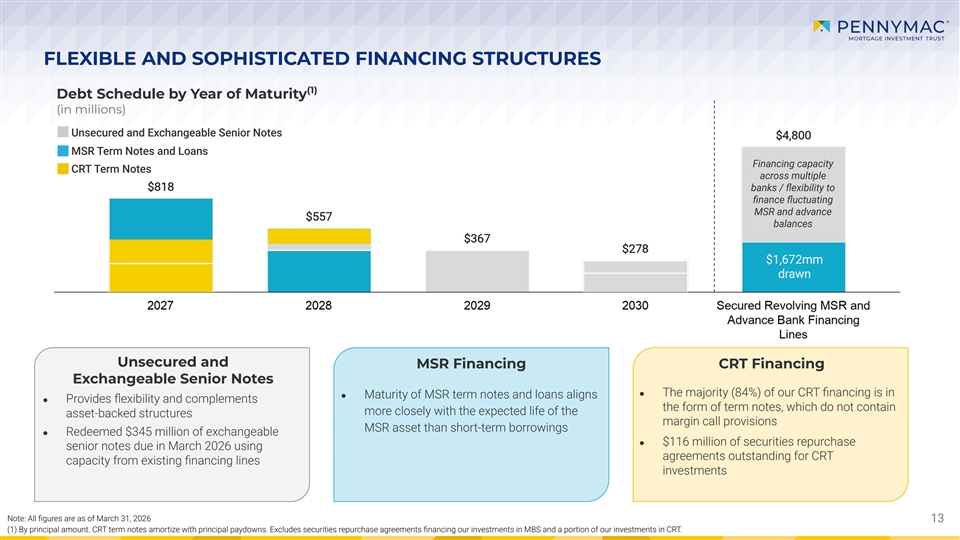
FLEXIBLE AND SOPHISTICATED FINANCING STRUCTURES (1) Debt Schedule by Year of Maturity (in millions) Unsecured and Exchangeable Senior Notes MSR Term Notes and Loans Financing capacity CRT Term Notes across multiple banks / flexibility to finance fluctuating MSR and advance balances $1,672mm drawn Unsecured and MSR Financing CRT Financing Exchangeable Senior Notes ● The majority (84%) of our CRT financing is in ● Maturity of MSR term notes and loans aligns ● Provides flexibility and complements the form of term notes, which do not contain more closely with the expected life of the asset-backed structures margin call provisions MSR asset than short-term borrowings ● Redeemed $345 million of exchangeable ● $116 million of securities repurchase senior notes due in March 2026 using agreements outstanding for CRT capacity from existing financing lines investments Note: All figures are as of March 31, 2026 13 13 (1) By principal amount. CRT term notes amortize with principal paydowns. Excludes securities repurchase agreements financing our investments in MBS and a portion of our investments in CRT.

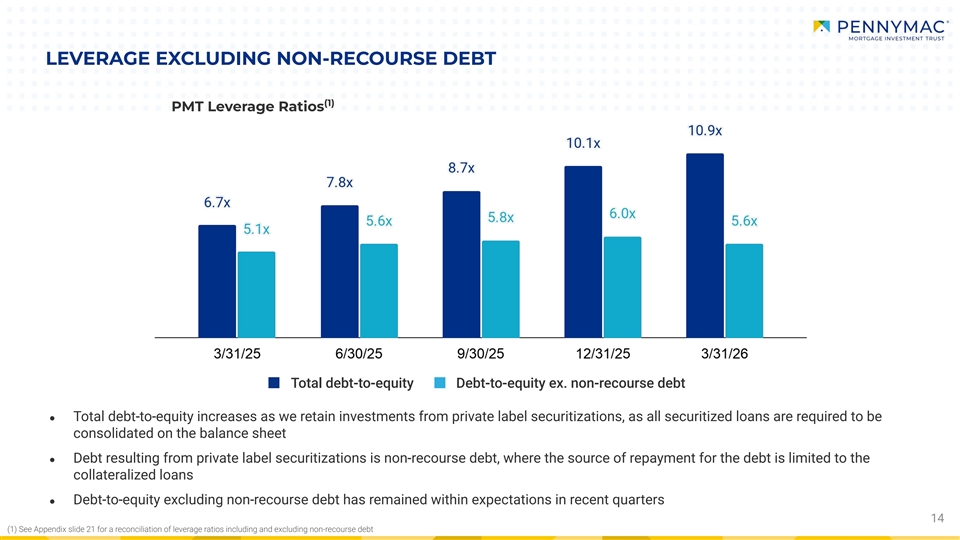
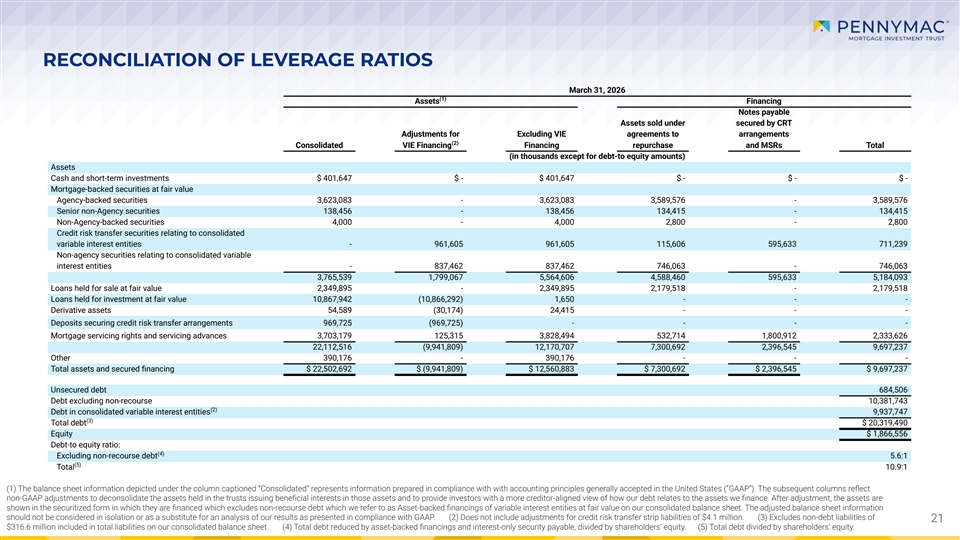
(1) See Appendix slide 21 for a reconciliation of leverage ratios including and excluding non-recourse debt LEVERAGE EXCLUDING NON-RECOURSE DEBT (1) PMT Leverage Ratios Total debt-to-equity Debt-to-equity ex. non-recourse debt ● Total debt-to-equity increases as we retain investments from private label securitizations, as all securitized loans are required to be consolidated on the balance sheet ● Debt resulting from private label securitizations is non-recourse debt, where the source of repayment for the debt is limited to the collateralized loans ● Debt-to-equity excluding non-recourse debt has remained within expectations in recent quarters 14

APPENDIX

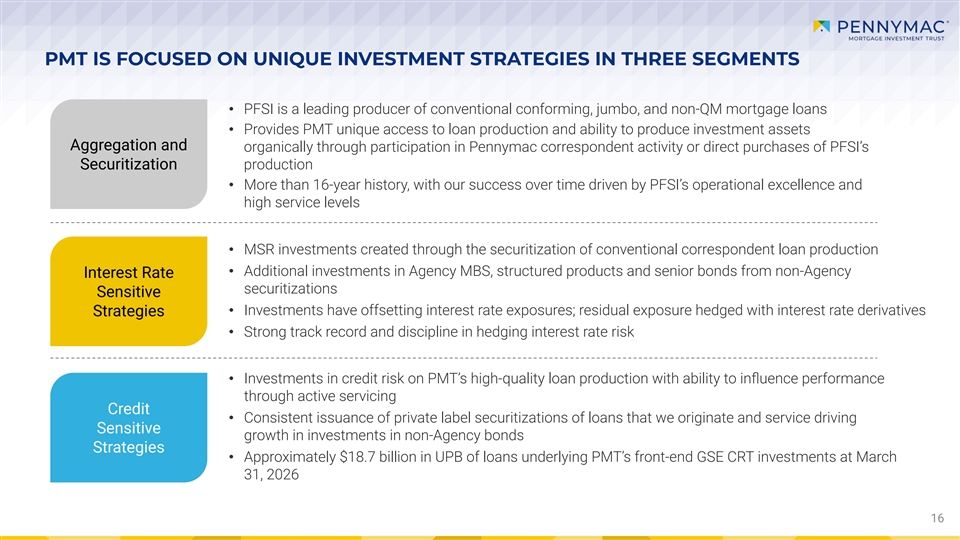
PMT IS FOCUSED ON UNIQUE INVESTMENT STRATEGIES IN THREE SEGMENTS • PFSI is a leading producer of conventional conforming, jumbo, and non-QM mortgage loans • Provides PMT unique access to loan production and ability to produce investment assets Aggregation and organically through participation in Pennymac correspondent activity or direct purchases of PFSI’s Securitization production • More than 16-year history, with our success over time driven by PFSI’s operational excellence and high service levels • MSR investments created through the securitization of conventional correspondent loan production • Additional investments in Agency MBS, structured products and senior bonds from non-Agency Interest Rate securitizations Sensitive Strategies• Investments have offsetting interest rate exposures; residual exposure hedged with interest rate derivatives • Strong track record and discipline in hedging interest rate risk • Investments in credit risk on PMT’s high-quality loan production with ability to influence performance through active servicing Credit • Consistent issuance of private label securitizations of loans that we originate and service driving Sensitive growth in investments in non-Agency bonds Strategies • Approximately $18.7 billion in UPB of loans underlying PMT’s front-end GSE CRT investments at March 31, 2026 16

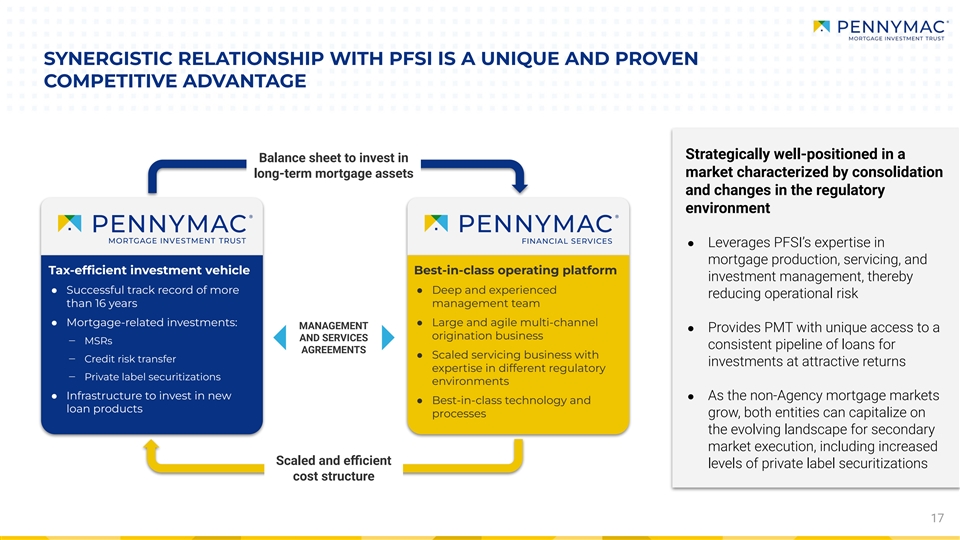
SYNERGISTIC RELATIONSHIP WITH PFSI IS A UNIQUE AND PROVEN COMPETITIVE ADVANTAGE Strategically well-positioned in a Balance sheet to invest in market characterized by consolidation long-term mortgage assets and changes in the regulatory environment ● Leverages PFSI’s expertise in mortgage production, servicing, and Tax-efficient investment vehicle Best-in-class operating platform investment management, thereby ● Successful track record of more ● Deep and experienced reducing operational risk than 16 years management team ● Mortgage-related investments:● Large and agile multi-channel MANAGEMENT ● Provides PMT with unique access to a origination business AND SERVICES ‒ MSRs consistent pipeline of loans for AGREEMENTS ● Scaled servicing business with ‒ Credit risk transfer investments at attractive returns expertise in different regulatory ‒ Private label securitizations environments ● Infrastructure to invest in new ● As the non-Agency mortgage markets ● Best-in-class technology and loan products processes grow, both entities can capitalize on the evolving landscape for secondary market execution, including increased Scaled and efficient levels of private label securitizations cost structure 17

(1) At period end (2) Return on average common equity (ROE) is calculated based on annualized quarterly net income attributable to common shareholders as a percentage of monthly average common equity during the period HISTORICAL EARNINGS, DIVIDENDS AND BOOK VALUE PER SHARE (1) ROE⁽²⁾ 10% 4% 9% 10% 0% -1% 14% 13% 4% 18

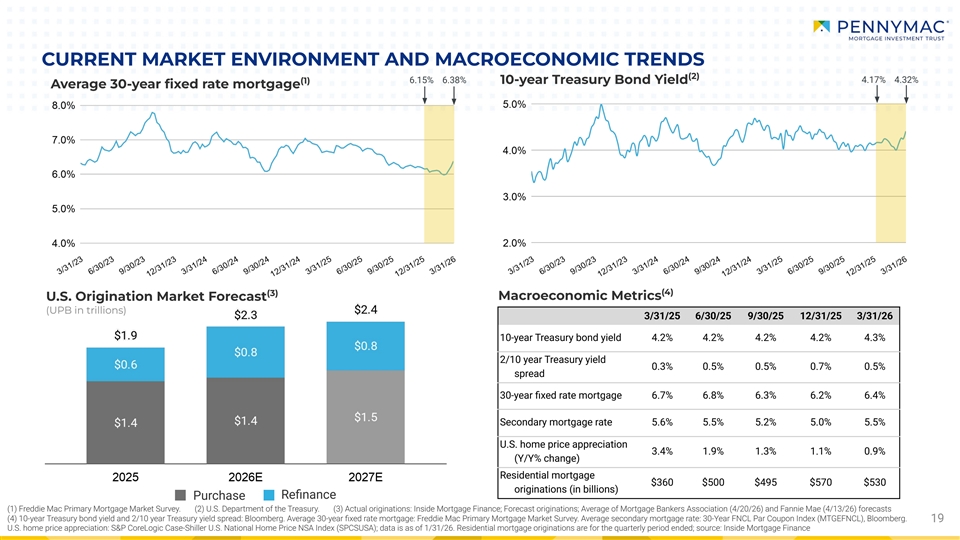
CURRENT MARKET ENVIRONMENT AND MACROECONOMIC TRENDS (2) 4.17% 4.32% (1) 6.15% 6.38% 10-year Treasury Bond Yield Average 30-year fixed rate mortgage (3) (4) Macroeconomic Metrics U.S. Origination Market Forecast (UPB in trillions) 3/31/25 6/30/25 9/30/25 12/31/25 3/31/26 10-year Treasury bond yield 4.2% 4.2% 4.2% 4.2% 4.3% 2/10 year Treasury yield 0.3% 0.5% 0.5% 0.7% 0.5% spread 30-year fixed rate mortgage 6.7% 6.8% 6.3% 6.2% 6.4% Secondary mortgage rate 5.6% 5.5% 5.2% 5.0% 5.5% U.S. home price appreciation 3.4% 1.9% 1.3% 1.1% 0.9% (Y/Y% change) Residential mortgage $360 $500 $495 $570 $530 originations (in billions) Refinance Purchase (1) Freddie Mac Primary Mortgage Market Survey. (2) U.S. Department of the Treasury. (3) Actual originations: Inside Mortgage Finance; Forecast originations; Average of Mortgage Bankers Association (4/20/26) and Fannie Mae (4/13/26) forecasts (4) 10-year Treasury bond yield and 2/10 year Treasury yield spread: Bloomberg. Average 30-year fixed rate mortgage: Freddie Mac Primary Mortgage Market Survey. Average secondary mortgage rate: 30-Year FNCL Par Coupon Index (MTGEFNCL), Bloomberg. 19 U.S. home price appreciation: S&P CoreLogic Case-Shiller U.S. National Home Price NSA Index (SPCSUSA); data is as of 1/31/26. Residential mortgage originations are for the quarterly period ended; source: Inside Mortgage Finance

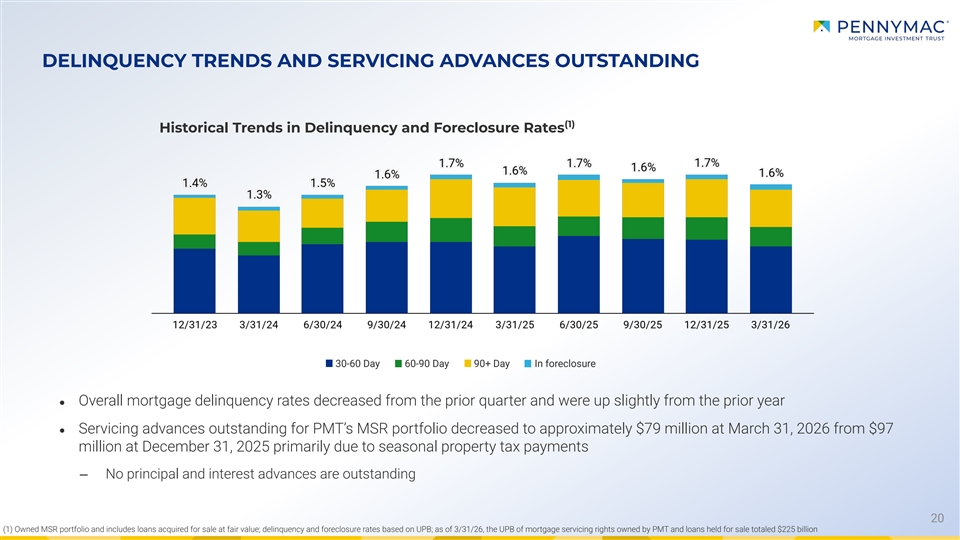
DELINQUENCY TRENDS AND SERVICING ADVANCES OUTSTANDING (1) Historical Trends in Delinquency and Foreclosure Rates 30-60 Day 60-90 Day 90+ Day In foreclosure ● Overall mortgage delinquency rates decreased from the prior quarter and were up slightly from the prior year ● Servicing advances outstanding for PMT’s MSR portfolio decreased to approximately $79 million at March 31, 2026 from $97 million at December 31, 2025 primarily due to seasonal property tax payments ‒ No principal and interest advances are outstanding 20 (1) Owned MSR portfolio and includes loans acquired for sale at fair value; delinquency and foreclosure rates based on UPB; as of 3/31/26, the UPB of mortgage servicing rights owned by PMT and loans held for sale totaled $225 billion

RECONCILIATION OF LEVERAGE RATIOS March 31, 2026 (1) Assets Financing Notes payable Assets sold under secured by CRT Adjustments for Excluding VIE agreements to arrangements (2) Consolidated VIE Financing Financing repurchase and MSRs Total (in thousands except for debt-to equity amounts) Assets Cash and short-term investments $ 401,647 $ - $ 401,647 $ - $ - $ - Mortgage-backed securities at fair value Agency-backed securities 3,623,083 - 3,623,083 3,589,576 - 3,589,576 Senior non-Agency securities 138,456 - 138,456 134,415 - 134,415 Non-Agency-backed securities 4,000 - 4,000 2,800 - 2,800 Credit risk transfer securities relating to consolidated variable interest entities - 961,605 961,605 115,606 595,633 711,239 Non-agency securities relating to consolidated variable interest entities - 837,462 837,462 746,063 - 746,063 3,765,539 1,799,067 5,564,606 4,588,460 595,633 5,184,093 Loans held for sale at fair value 2,349,895 - 2,349,895 2,179,518 - 2,179,518 Loans held for investment at fair value 10,867,942 (10,866,292) 1,650 - - - Derivative assets 54,589 (30,174) 24,415 - - - Deposits securing credit risk transfer arrangements 969,725 (969,725) - - - - Mortgage servicing rights and servicing advances 3,703,179 125,315 3,828,494 532,714 1,800,912 2,333,626 22,112,516 (9,941,809) 12,170,707 7,300,692 2,396,545 9,697,237 Other 390,176 - 390,176 - - - Total assets and secured financing $ 22,502,692 $ (9,941,809) $ 12,560,883 $ 7,300,692 $ 2,396,545 $ 9,697,237 Unsecured debt 684,506 Debt excluding non-recourse 10,381,743 (2) Debt in consolidated variable interest entities 9,937,747 (3) Total debt $ 20,319,490 Equity $ 1,866,556 Debt-to equity ratio: (4) Excluding non-recourse debt 5.6:1 (5) Total 10.9:1 (1) The balance sheet information depicted under the column captioned “Consolidated” represents information prepared in compliance with with accounting principles generally accepted in the United States (“GAAP”). The subsequent columns reflect non-GAAP adjustments to deconsolidate the assets held in the trusts issuing beneficial interests in those assets and to provide investors with a more creditor-aligned view of how our debt relates to the assets we finance. After adjustment, the assets are shown in the securitized form in which they are financed which excludes non-recourse debt which we refer to as Asset-backed financings of variable interest entities at fair value on our consolidated balance sheet. The adjusted balance sheet information should not be considered in isolation or as a substitute for an analysis of our results as presented in compliance with GAAP. (2) Does not include adjustments for credit risk transfer strip liabilities of $4.1 million. (3) Excludes non-debt liabilities of 21 21 $316.6 million included in total liabilities on our consolidated balance sheet. (4) Total debt reduced by asset-backed financings and interest-only security payable, divided by shareholders’ equity. (5) Total debt divided by shareholders’ equity.

22