
Exhibit 99.2 PENNYMAC MORTGAGE INVESTMENT TRUST 2Q21 EARNINGS REPORT
August 2021Exhibit 99.2 PENNYMAC MORTGAGE INVESTMENT TRUST 2Q21 EARNINGS REPORT August 2021

FORWARD-LOOKING STATEMENTS This presentation contains forward-looking
statements within the meaning of Section 21E of the Securities Exchange Act of 1934, as amended, regarding management’s beliefs, estimates, projections and assumptions with respect to, among other things, the Company’s financial results,
future operations, business plans and investment strategies, as well as industry and market conditions, all of which are subject to change. Words like “believe,” “expect,” “anticipate,” “promise,”
“plan,” and other expressions or words of similar meanings, as well as future or conditional verbs such as “will,” “would,” “should,” “could,” or “may” are generally intended to
identify forward- looking statements. Actual results and operations for any future period may vary materially from those projected herein and from past results discussed herein. These forward-looking statements include, but are not limited to,
statements regarding the future impact of the COVID-19 pandemic of our business; future loan originations, servicing and production; future loan delinquencies, forbearances and servicing advances; future investment strategies; elimination of the
FHFA’s adverse market refinance fee and other business and financial expectations. Factors which could cause actual results to differ materially from historical results or those anticipated include, but are not limited to: our exposure to
risks of loss and disruptions in operations resulting from adverse weather conditions, man-made or natural disasters, climate change and pandemics such as COVID-19; the impact to our CRT agreements of increased borrower requests for forbearance
under the CARES Act; changes in the Company’s investment objectives or investment or operational strategies, including any new lines of business or new products and services that may subject it to additional risks; volatility in the
Company’s industry, the debt or equity markets, the general economy or the real estate finance and real estate markets specifically, whether the result of market events or otherwise; events or circumstances which undermine confidence in the
financial and housing markets or otherwise have a broad impact on financial and housing markets, such as the sudden instability or collapse of large depository institutions or other significant corporations, terrorist attacks, natural or manmade
disasters, or threatened or actual armed conflicts; elimination of the FHFA’s adverse market refinance fee; changes in general business, economic, market, employment and domestic and international political conditions, or in consumer
confidence and spending habits from those expected; declines in real estate or significant changes in U.S. housing prices or activity in the U.S. housing market; the availability of, and level of competition for, attractive risk-adjusted investment
opportunities in mortgage loans and mortgage-related assets that satisfy the Company’s investment objectives; the inherent difficulty in winning bids to acquire mortgage loans, and the Company’s success in doing so; the concentration of
credit risks to which the Company is exposed; the degree and nature of the Company’s competition; the Company’s dependence on its manager and servicer, potential conflicts of interest with such entities and their affiliates, and the
performance of such entities; changes in personnel and lack of availability of qualified personnel at its manager, servicer or their affiliates; the availability, terms and deployment of short-term and long-term capital; the adequacy of the
Company’s cash reserves and working capital; the Company’s ability to maintain the desired relationship between its financing and the interest rates and maturities of its assets; the timing and amount of cash flows, if any, from the
Company’s investments; unanticipated increases or volatility in financing and other costs, including changes in interest rates; our substantial amount of indebtedness; the performance, financial condition and liquidity of borrowers; the
ability of the Company’s servicer, which also provides the Company with fulfillment services, to approve and monitor correspondent sellers and underwrite loans to investor standards; incomplete or inaccurate information or documentation
provided by customers or counterparties, or adverse changes in the financial condition of the Company’s customers and counterparties; the Company’s indemnification and repurchase obligations in connection with mortgage loans it purchases
and later sells or securitizes; the quality and enforceability of the collateral documentation evidencing the Company’s ownership and rights in the assets in which it invests; increased rates of delinquency, default and/or decreased recovery
rates on the Company’s investments; the performance of mortgage loans underlying mortgage-backed securities in which the Company retains credit risk; the Company’s ability to foreclose on its investments in a timely manner or at all;
increased prepayments of the mortgages and other loans underlying the Company’s mortgage-backed securities or relating to the Company’s mortgage servicing rights and other investments; the degree to which the Company’s hedging
strategies may or may not protect it from interest rate volatility; the effect of the accuracy of or changes in the estimates the Company makes about uncertainties, contingencies and asset and liability valuations when measuring and reporting upon
the Company’s financial condition and results of operations; the Company’s ability to maintain appropriate internal control over financial reporting; technologies for loans and the Company’s ability to mitigate security risks and
cyber intrusions; the Company’s ability to obtain and/or maintain licenses and other approvals in those jurisdictions where required to conduct its business; the Company’s ability to detect misconduct and fraud; the Company’s
ability to comply with various federal, state and local laws and regulations that govern its business; developments in the secondary markets for the Company’s mortgage loan products; legislative and regulatory changes that impact the mortgage
loan industry or housing market; changes in regulations or the occurrence of other events that impact the business, operations or prospects of government agencies such as the Government National Mortgage Association, the Federal Housing
Administration or the Veterans Administration, the U.S. Department of Agriculture, or government-sponsored entities such as the Federal National Mortgage Association or the Federal Home Loan Mortgage Corporation, or such changes that increase the
cost of doing business with such entities; the Dodd-Frank Wall Street Reform and Consumer Protection Act and its implementing regulations and regulatory agencies, and any other legislative and regulatory changes that impact the business, operations
or governance of mortgage lenders and/or publicly-traded companies; the Consumer Financial Protection Bureau and its issued and future rules and the enforcement thereof; changes in government support of homeownership; changes in government or
government-sponsored home affordability programs; limitations imposed on the Company’s business and its ability to satisfy complex rules for it to qualify as a REIT for U.S. federal income tax purposes and qualify for an exclusion from the
Investment Company Act of 1940 and the ability of certain of the Company’s subsidiaries to qualify as REITs or as taxable REIT subsidiaries for U.S. federal income tax purposes, as applicable, and the Company’s ability and the ability of
its subsidiaries to operate effectively within the limitations imposed by these rules; changes in governmental regulations, accounting treatment, tax rates and similar matters (including changes to laws governing the taxation of REITs, or the
exclusions from registration as an investment company); the Company’s ability to make distributions to its shareholders in the future; the Company’s failure to deal appropriately with issues that may give rise to reputational risk; and
the Company’s organizational structure and certain requirements in its charter documents. You should not place undue reliance on any forward-looking statement and should consider all of the uncertainties and risks described above, as well as
those more fully discussed in reports and other documents filed by the Company with the Securities and Exchange Commission from time to time. The Company undertakes no obligation to publicly update or revise any forward-looking statements or any
other information contained herein, and the statements made in this presentation are current as of the date of this presentation only. 2FORWARD-LOOKING STATEMENTS This presentation contains forward-looking statements within the meaning of Section
21E of the Securities Exchange Act of 1934, as amended, regarding management’s beliefs, estimates, projections and assumptions with respect to, among other things, the Company’s financial results, future operations, business plans and
investment strategies, as well as industry and market conditions, all of which are subject to change. Words like “believe,” “expect,” “anticipate,” “promise,” “plan,” and other expressions
or words of similar meanings, as well as future or conditional verbs such as “will,” “would,” “should,” “could,” or “may” are generally intended to identify forward- looking statements.
Actual results and operations for any future period may vary materially from those projected herein and from past results discussed herein. These forward-looking statements include, but are not limited to, statements regarding the future impact of
the COVID-19 pandemic of our business; future loan originations, servicing and production; future loan delinquencies, forbearances and servicing advances; future investment strategies; elimination of the FHFA’s adverse market refinance fee and
other business and financial expectations. Factors which could cause actual results to differ materially from historical results or those anticipated include, but are not limited to: our exposure to risks of loss and disruptions in operations
resulting from adverse weather conditions, man-made or natural disasters, climate change and pandemics such as COVID-19; the impact to our CRT agreements of increased borrower requests for forbearance under the CARES Act; changes in the
Company’s investment objectives or investment or operational strategies, including any new lines of business or new products and services that may subject it to additional risks; volatility in the Company’s industry, the debt or equity
markets, the general economy or the real estate finance and real estate markets specifically, whether the result of market events or otherwise; events or circumstances which undermine confidence in the financial and housing markets or otherwise have
a broad impact on financial and housing markets, such as the sudden instability or collapse of large depository institutions or other significant corporations, terrorist attacks, natural or manmade disasters, or threatened or actual armed conflicts;
elimination of the FHFA’s adverse market refinance fee; changes in general business, economic, market, employment and domestic and international political conditions, or in consumer confidence and spending habits from those expected; declines
in real estate or significant changes in U.S. housing prices or activity in the U.S. housing market; the availability of, and level of competition for, attractive risk-adjusted investment opportunities in mortgage loans and mortgage-related assets
that satisfy the Company’s investment objectives; the inherent difficulty in winning bids to acquire mortgage loans, and the Company’s success in doing so; the concentration of credit risks to which the Company is exposed; the degree and
nature of the Company’s competition; the Company’s dependence on its manager and servicer, potential conflicts of interest with such entities and their affiliates, and the performance of such entities; changes in personnel and lack of
availability of qualified personnel at its manager, servicer or their affiliates; the availability, terms and deployment of short-term and long-term capital; the adequacy of the Company’s cash reserves and working capital; the Company’s
ability to maintain the desired relationship between its financing and the interest rates and maturities of its assets; the timing and amount of cash flows, if any, from the Company’s investments; unanticipated increases or volatility in
financing and other costs, including changes in interest rates; our substantial amount of indebtedness; the performance, financial condition and liquidity of borrowers; the ability of the Company’s servicer, which also provides the Company
with fulfillment services, to approve and monitor correspondent sellers and underwrite loans to investor standards; incomplete or inaccurate information or documentation provided by customers or counterparties, or adverse changes in the financial
condition of the Company’s customers and counterparties; the Company’s indemnification and repurchase obligations in connection with mortgage loans it purchases and later sells or securitizes; the quality and enforceability of the
collateral documentation evidencing the Company’s ownership and rights in the assets in which it invests; increased rates of delinquency, default and/or decreased recovery rates on the Company’s investments; the performance of mortgage
loans underlying mortgage-backed securities in which the Company retains credit risk; the Company’s ability to foreclose on its investments in a timely manner or at all; increased prepayments of the mortgages and other loans underlying the
Company’s mortgage-backed securities or relating to the Company’s mortgage servicing rights and other investments; the degree to which the Company’s hedging strategies may or may not protect it from interest rate volatility; the
effect of the accuracy of or changes in the estimates the Company makes about uncertainties, contingencies and asset and liability valuations when measuring and reporting upon the Company’s financial condition and results of operations; the
Company’s ability to maintain appropriate internal control over financial reporting; technologies for loans and the Company’s ability to mitigate security risks and cyber intrusions; the Company’s ability to obtain and/or maintain
licenses and other approvals in those jurisdictions where required to conduct its business; the Company’s ability to detect misconduct and fraud; the Company’s ability to comply with various federal, state and local laws and regulations
that govern its business; developments in the secondary markets for the Company’s mortgage loan products; legislative and regulatory changes that impact the mortgage loan industry or housing market; changes in regulations or the occurrence of
other events that impact the business, operations or prospects of government agencies such as the Government National Mortgage Association, the Federal Housing Administration or the Veterans Administration, the U.S. Department of Agriculture, or
government-sponsored entities such as the Federal National Mortgage Association or the Federal Home Loan Mortgage Corporation, or such changes that increase the cost of doing business with such entities; the Dodd-Frank Wall Street Reform and
Consumer Protection Act and its implementing regulations and regulatory agencies, and any other legislative and regulatory changes that impact the business, operations or governance of mortgage lenders and/or publicly-traded companies; the Consumer
Financial Protection Bureau and its issued and future rules and the enforcement thereof; changes in government support of homeownership; changes in government or government-sponsored home affordability programs; limitations imposed on the
Company’s business and its ability to satisfy complex rules for it to qualify as a REIT for U.S. federal income tax purposes and qualify for an exclusion from the Investment Company Act of 1940 and the ability of certain of the Company’s
subsidiaries to qualify as REITs or as taxable REIT subsidiaries for U.S. federal income tax purposes, as applicable, and the Company’s ability and the ability of its subsidiaries to operate effectively within the limitations imposed by these
rules; changes in governmental regulations, accounting treatment, tax rates and similar matters (including changes to laws governing the taxation of REITs, or the exclusions from registration as an investment company); the Company’s ability to
make distributions to its shareholders in the future; the Company’s failure to deal appropriately with issues that may give rise to reputational risk; and the Company’s organizational structure and certain requirements in its charter
documents. You should not place undue reliance on any forward-looking statement and should consider all of the uncertainties and risks described above, as well as those more fully discussed in reports and other documents filed by the Company with
the Securities and Exchange Commission from time to time. The Company undertakes no obligation to publicly update or revise any forward-looking statements or any other information contained herein, and the statements made in this presentation are
current as of the date of this presentation only. 2
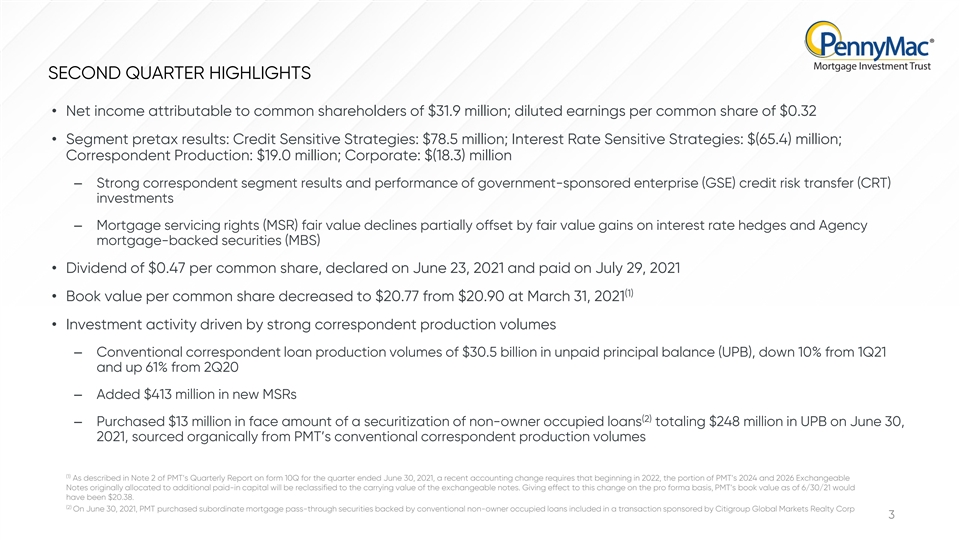
SECOND QUARTER HIGHLIGHTS • Net income attributable to common
shareholders of $31.9 million; diluted earnings per common share of $0.32 • Segment pretax results: Credit Sensitive Strategies: $78.5 million; Interest Rate Sensitive Strategies: $(65.4) million; Correspondent Production: $19.0 million;
Corporate: $(18.3) million ‒ Strong correspondent segment results and performance of government-sponsored enterprise (GSE) credit risk transfer (CRT) investments ‒ Mortgage servicing rights (MSR) fair value declines partially offset by
fair value gains on interest rate hedges and Agency mortgage-backed securities (MBS) • Dividend of $0.47 per common share, declared on June 23, 2021 and paid on July 29, 2021 (1) • Book value per common share decreased to $20.77 from
$20.90 at March 31, 2021 • Investment activity driven by strong correspondent production volumes ‒ Conventional correspondent loan production volumes of $30.5 billion in unpaid principal balance (UPB), down 10% from 1Q21 and up 61% from
2Q20 ‒ Added $413 million in new MSRs (2) ‒ Purchased $13 million in face amount of a securitization of non-owner occupied loans totaling $248 million in UPB on June 30, 2021, sourced organically from PMT’s conventional
correspondent production volumes (1) As described in Note 2 of PMT’s Quarterly Report on form 10Q for the quarter ended June 30, 2021, a recent accounting change requires that beginning in 2022, the portion of PMT’s 2024 and 2026
Exchangeable Notes originally allocated to additional paid-in capital will be reclassified to the carrying value of the exchangeable notes. Giving effect to this change on the pro forma basis, PMT’s book value as of 6/30/21 would have been
$20.38. (2) On June 30, 2021, PMT purchased subordinate mortgage pass-through securities backed by conventional non-owner occupied loans included in a transaction sponsored by Citigroup Global Markets Realty Corp 3SECOND QUARTER HIGHLIGHTS •
Net income attributable to common shareholders of $31.9 million; diluted earnings per common share of $0.32 • Segment pretax results: Credit Sensitive Strategies: $78.5 million; Interest Rate Sensitive Strategies: $(65.4) million;
Correspondent Production: $19.0 million; Corporate: $(18.3) million ‒ Strong correspondent segment results and performance of government-sponsored enterprise (GSE) credit risk transfer (CRT) investments ‒ Mortgage servicing rights (MSR)
fair value declines partially offset by fair value gains on interest rate hedges and Agency mortgage-backed securities (MBS) • Dividend of $0.47 per common share, declared on June 23, 2021 and paid on July 29, 2021 (1) • Book value per
common share decreased to $20.77 from $20.90 at March 31, 2021 • Investment activity driven by strong correspondent production volumes ‒ Conventional correspondent loan production volumes of $30.5 billion in unpaid principal balance
(UPB), down 10% from 1Q21 and up 61% from 2Q20 ‒ Added $413 million in new MSRs (2) ‒ Purchased $13 million in face amount of a securitization of non-owner occupied loans totaling $248 million in UPB on June 30, 2021, sourced organically
from PMT’s conventional correspondent production volumes (1) As described in Note 2 of PMT’s Quarterly Report on form 10Q for the quarter ended June 30, 2021, a recent accounting change requires that beginning in 2022, the portion of
PMT’s 2024 and 2026 Exchangeable Notes originally allocated to additional paid-in capital will be reclassified to the carrying value of the exchangeable notes. Giving effect to this change on the pro forma basis, PMT’s book value as of
6/30/21 would have been $20.38. (2) On June 30, 2021, PMT purchased subordinate mortgage pass-through securities backed by conventional non-owner occupied loans included in a transaction sponsored by Citigroup Global Markets Realty Corp 3
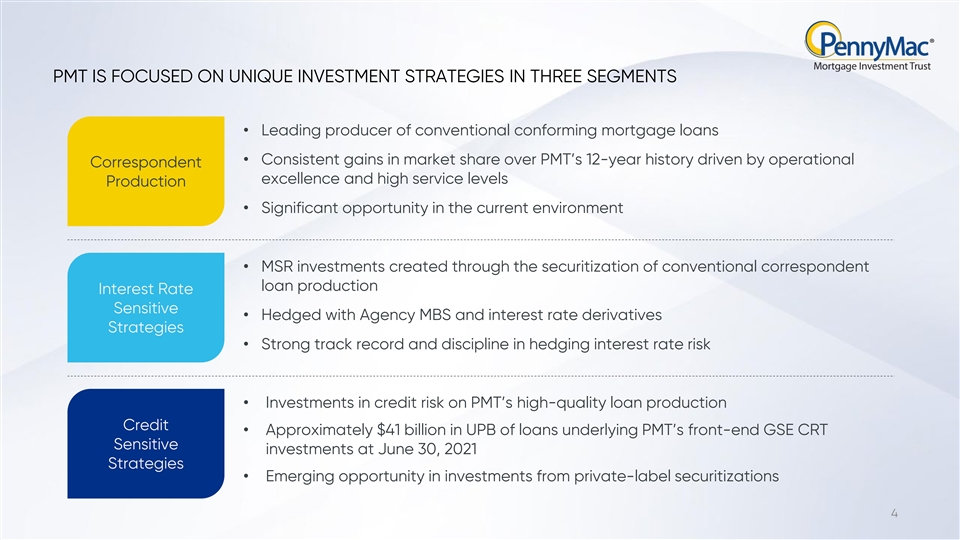
PMT IS FOCUSED ON UNIQUE INVESTMENT STRATEGIES IN THREE SEGMENTS •
Leading producer of conventional conforming mortgage loans • Consistent gains in market share over PMT’s 12-year history driven by operational Correspondent excellence and high service levels Production • Significant opportunity in
the current environment • MSR investments created through the securitization of conventional correspondent loan production Interest Rate Sensitive • Hedged with Agency MBS and interest rate derivatives Strategies • Strong track
record and discipline in hedging interest rate risk • Investments in credit risk on PMT’s high-quality loan production Credit • Approximately $41 billion in UPB of loans underlying PMT’s front-end GSE CRT Sensitive
investments at June 30, 2021 Strategies • Emerging opportunity in investments from private-label securitizations 4PMT IS FOCUSED ON UNIQUE INVESTMENT STRATEGIES IN THREE SEGMENTS • Leading producer of conventional conforming mortgage
loans • Consistent gains in market share over PMT’s 12-year history driven by operational Correspondent excellence and high service levels Production • Significant opportunity in the current environment • MSR investments
created through the securitization of conventional correspondent loan production Interest Rate Sensitive • Hedged with Agency MBS and interest rate derivatives Strategies • Strong track record and discipline in hedging interest rate risk
• Investments in credit risk on PMT’s high-quality loan production Credit • Approximately $41 billion in UPB of loans underlying PMT’s front-end GSE CRT Sensitive investments at June 30, 2021 Strategies • Emerging
opportunity in investments from private-label securitizations 4
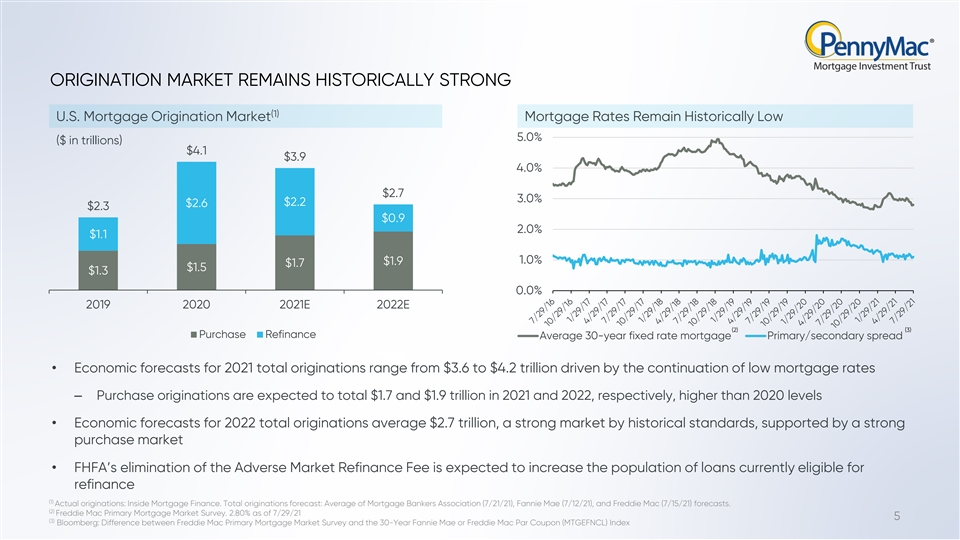
ORIGINATION MARKET REMAINS HISTORICALLY STRONG (1) U.S. Mortgage
Origination Market Mortgage Rates Remain Historically Low 5.0% ($ in trillions) $4.1 $3.9 4.0% $2.7 3.0% $2.2 $2.6 $2.3 $0.9 2.0% $1.1 1.0% $1.9 $1.7 $1.5 $1.3 0.0% 2019 2020 2021E 2022E (2) (3) Purchase Refinance Average 30-year fixed rate mortgage
Primary/secondary spread • Economic forecasts for 2021 total originations range from $3.6 to $4.2 trillion driven by the continuation of low mortgage rates ‒ Purchase originations are expected to total $1.7 and $1.9 trillion in 2021 and
2022, respectively, higher than 2020 levels • Economic forecasts for 2022 total originations average $2.7 trillion, a strong market by historical standards, supported by a strong purchase market • FHFA’s elimination of the Adverse
Market Refinance Fee is expected to increase the population of loans currently eligible for refinance (1) Actual originations: Inside Mortgage Finance. Total originations forecast: Average of Mortgage Bankers Association (7/21/21), Fannie Mae
(7/12/21), and Freddie Mac (7/15/21) forecasts. (2) Freddie Mac Primary Mortgage Market Survey. 2.80% as of 7/29/21 5 (3) Bloomberg: Difference between Freddie Mac Primary Mortgage Market Survey and the 30-Year Fannie Mae or Freddie Mac Par Coupon
(MTGEFNCL) Index ORIGINATION MARKET REMAINS HISTORICALLY STRONG (1) U.S. Mortgage Origination Market Mortgage Rates Remain Historically Low 5.0% ($ in trillions) $4.1 $3.9 4.0% $2.7 3.0% $2.2 $2.6 $2.3 $0.9 2.0% $1.1 1.0% $1.9 $1.7 $1.5 $1.3 0.0%
2019 2020 2021E 2022E (2) (3) Purchase Refinance Average 30-year fixed rate mortgage Primary/secondary spread • Economic forecasts for 2021 total originations range from $3.6 to $4.2 trillion driven by the continuation of low mortgage rates
‒ Purchase originations are expected to total $1.7 and $1.9 trillion in 2021 and 2022, respectively, higher than 2020 levels • Economic forecasts for 2022 total originations average $2.7 trillion, a strong market by historical standards,
supported by a strong purchase market • FHFA’s elimination of the Adverse Market Refinance Fee is expected to increase the population of loans currently eligible for refinance (1) Actual originations: Inside Mortgage Finance. Total
originations forecast: Average of Mortgage Bankers Association (7/21/21), Fannie Mae (7/12/21), and Freddie Mac (7/15/21) forecasts. (2) Freddie Mac Primary Mortgage Market Survey. 2.80% as of 7/29/21 5 (3) Bloomberg: Difference between Freddie Mac
Primary Mortgage Market Survey and the 30-Year Fannie Mae or Freddie Mac Par Coupon (MTGEFNCL) Index
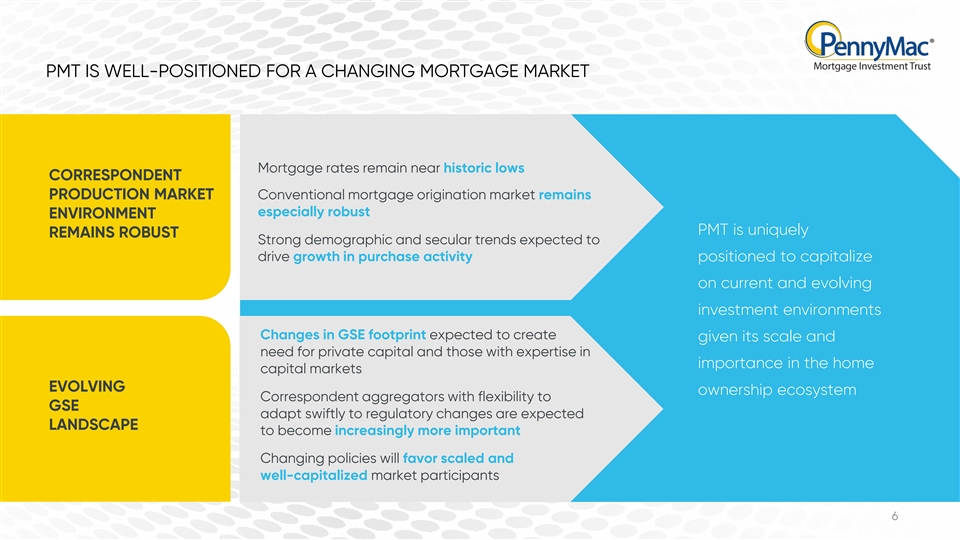
PMT IS WELL-POSITIONED FOR A CHANGING MORTGAGE MARKET Mortgage rates
remain near historic lows CORRESPONDENT PRODUCTION MARKET Conventional mortgage origination market remains especially robust ENVIRONMENT PMT is uniquely REMAINS ROBUST Strong demographic and secular trends expected to drive growth in purchase
activity positioned to capitalize on current and evolving investment environments Changes in GSE footprint expected to create given its scale and need for private capital and those with expertise in importance in the home capital markets EVOLVING
ownership ecosystem Correspondent aggregators with flexibility to GSE adapt swiftly to regulatory changes are expected LANDSCAPE to become increasingly more important Changing policies will favor scaled and well-capitalized market participants
6
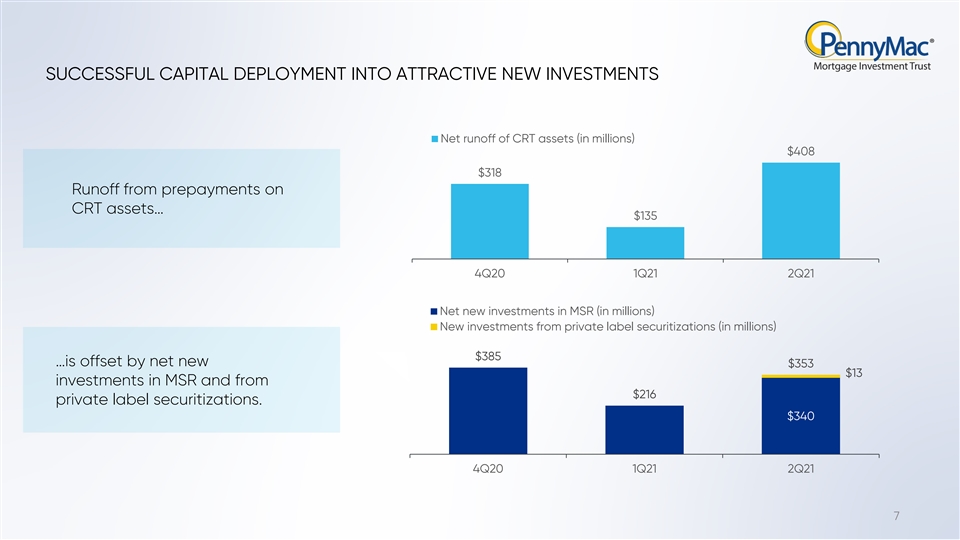
SUCCESSFUL CAPITAL DEPLOYMENT INTO ATTRACTIVE NEW INVESTMENTS Net runoff
of CRT assets (in millions) $408 $318 Runoff from prepayments on CRT assets… $135 4Q20 1Q21 2Q21 Net new investments in MSR (in millions) New investments from private label securitizations (in millions) $385 …is offset by net new $353
$13 investments in MSR and from $216 private label securitizations. $340 4Q20 1Q21 2Q21 7SUCCESSFUL CAPITAL DEPLOYMENT INTO ATTRACTIVE NEW INVESTMENTS Net runoff of CRT assets (in millions) $408 $318 Runoff from prepayments on CRT assets… $135
4Q20 1Q21 2Q21 Net new investments in MSR (in millions) New investments from private label securitizations (in millions) $385 …is offset by net new $353 $13 investments in MSR and from $216 private label securitizations. $340 4Q20 1Q21 2Q21
7
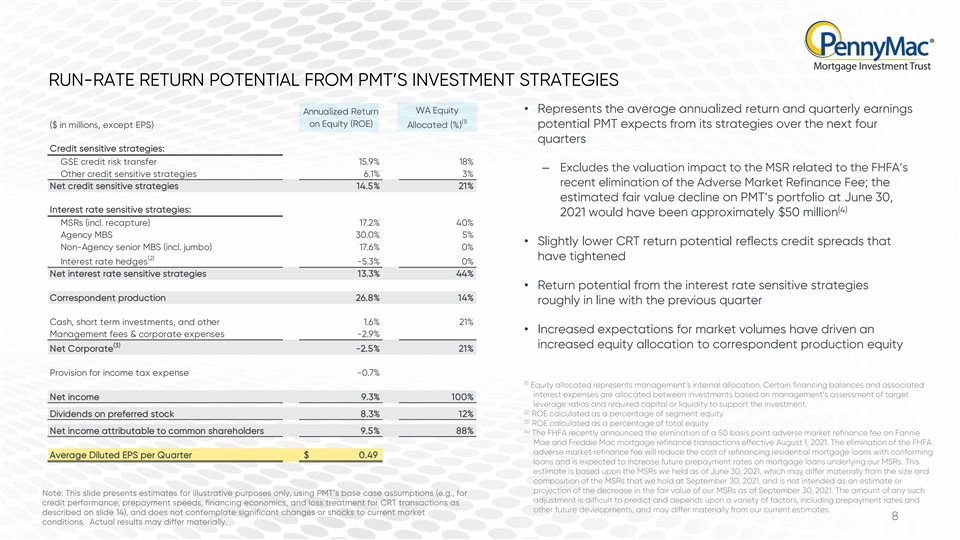
RUN-RATE RETURN POTENTIAL FROM PMT’S INVESTMENT STRATEGIES WA
Equity • Represents the average annualized return and quarterly earnings Annualized Return (1) on Equity (ROE) ($ in millions, except EPS) Allocated (%) potential PMT expects from its strategies over the next four quarters Credit sensitive
strategies: GSE credit risk transfer 15.9% 18% ‒ Excludes the valuation impact to the MSR related to the FHFA’s Other credit sensitive strategies 6.1% 3% recent elimination of the Adverse Market Refinance Fee; the Net credit sensitive
strategies 14.5% 21% estimated fair value decline on PMT’s portfolio at June 30, Interest rate sensitive strategies: (4) 2021 would have been approximately $50 million MSRs (incl. recapture) 17.2% 40% Agency MBS 30.0% 5% • Slightly lower
CRT return potential reflects credit spreads that Non-Agency senior MBS (incl. jumbo) 17.6% 0% (2) have tightened Interest rate hedges -5.3% 0% Net interest rate sensitive strategies 13.3% 44% • Return potential from the interest rate
sensitive strategies Correspondent production 26.8% 14% roughly in line with the previous quarter Cash, short term investments, and other 1.6% 21% • Increased expectations for market volumes have driven an Management fees & corporate
expenses -2.9% (3) increased equity allocation to correspondent production equity Net Corporate -2.5% 21% Provision for income tax expense -0.7% (1) Equity allocated represents management’s internal allocation. Certain financing balances and
associated interest expenses are allocated between investments based on management’s assessment of target Net income 9.3% 100% leverage ratios and required capital or liquidity to support the investment. (2) ROE calculated as a percentage of
segment equity Dividends on preferred stock 8.3% 12% (3) ROE calculated as a percentage of total equity (4) Net income attributable to common shareholders 9.5% 88% The FHFA recently announced the elimination of a 50 basis point adverse market
refinance fee on Fannie Mae and Freddie Mac mortgage refinance transactions effective August 1, 2021. The elimination of the FHFA adverse market refinance fee will reduce the cost of refinancing residential mortgage loans with conforming Average
Diluted EPS per Quarter $ 0.49 loans and is expected to increase future prepayment rates on mortgage loans underlying our MSRs. This estimate is based upon the MSRs we held as of June 30, 2021, which may differ materially from the size and
composition of the MSRs that we hold at September 30, 2021, and is not intended as an estimate or projection of the decrease in the fair value of our MSRs as of September 30, 2021. The amount of any such Note: This slide presents estimates for
illustrative purposes only, using PMT’s base case assumptions (e.g., for adjustment is difficult to predict and depends upon a variety of factors, including prepayment rates and credit performance, prepayment speeds, financing economics, and
loss treatment for CRT transactions as other future developments, and may differ materially from our current estimates. described on slide 14), and does not contemplate significant changes or shocks to current market 8 conditions. Actual results may
differ materially.RUN-RATE RETURN POTENTIAL FROM PMT’S INVESTMENT STRATEGIES WA Equity • Represents the average annualized return and quarterly earnings Annualized Return (1) on Equity (ROE) ($ in millions, except EPS) Allocated (%)
potential PMT expects from its strategies over the next four quarters Credit sensitive strategies: GSE credit risk transfer 15.9% 18% ‒ Excludes the valuation impact to the MSR related to the FHFA’s Other credit sensitive strategies 6.1%
3% recent elimination of the Adverse Market Refinance Fee; the Net credit sensitive strategies 14.5% 21% estimated fair value decline on PMT’s portfolio at June 30, Interest rate sensitive strategies: (4) 2021 would have been approximately $50
million MSRs (incl. recapture) 17.2% 40% Agency MBS 30.0% 5% • Slightly lower CRT return potential reflects credit spreads that Non-Agency senior MBS (incl. jumbo) 17.6% 0% (2) have tightened Interest rate hedges -5.3% 0% Net interest rate
sensitive strategies 13.3% 44% • Return potential from the interest rate sensitive strategies Correspondent production 26.8% 14% roughly in line with the previous quarter Cash, short term investments, and other 1.6% 21% • Increased
expectations for market volumes have driven an Management fees & corporate expenses -2.9% (3) increased equity allocation to correspondent production equity Net Corporate -2.5% 21% Provision for income tax expense -0.7% (1) Equity allocated
represents management’s internal allocation. Certain financing balances and associated interest expenses are allocated between investments based on management’s assessment of target Net income 9.3% 100% leverage ratios and required
capital or liquidity to support the investment. (2) ROE calculated as a percentage of segment equity Dividends on preferred stock 8.3% 12% (3) ROE calculated as a percentage of total equity (4) Net income attributable to common shareholders 9.5% 88%
The FHFA recently announced the elimination of a 50 basis point adverse market refinance fee on Fannie Mae and Freddie Mac mortgage refinance transactions effective August 1, 2021. The elimination of the FHFA adverse market refinance fee will reduce
the cost of refinancing residential mortgage loans with conforming Average Diluted EPS per Quarter $ 0.49 loans and is expected to increase future prepayment rates on mortgage loans underlying our MSRs. This estimate is based upon the MSRs we held
as of June 30, 2021, which may differ materially from the size and composition of the MSRs that we hold at September 30, 2021, and is not intended as an estimate or projection of the decrease in the fair value of our MSRs as of September 30, 2021.
The amount of any such Note: This slide presents estimates for illustrative purposes only, using PMT’s base case assumptions (e.g., for adjustment is difficult to predict and depends upon a variety of factors, including prepayment rates and
credit performance, prepayment speeds, financing economics, and loss treatment for CRT transactions as other future developments, and may differ materially from our current estimates. described on slide 14), and does not contemplate significant
changes or shocks to current market 8 conditions. Actual results may differ materially.

MORTGAGE INVESTMENT ACTIVITIESMORTGAGE INVESTMENT ACTIVITIES
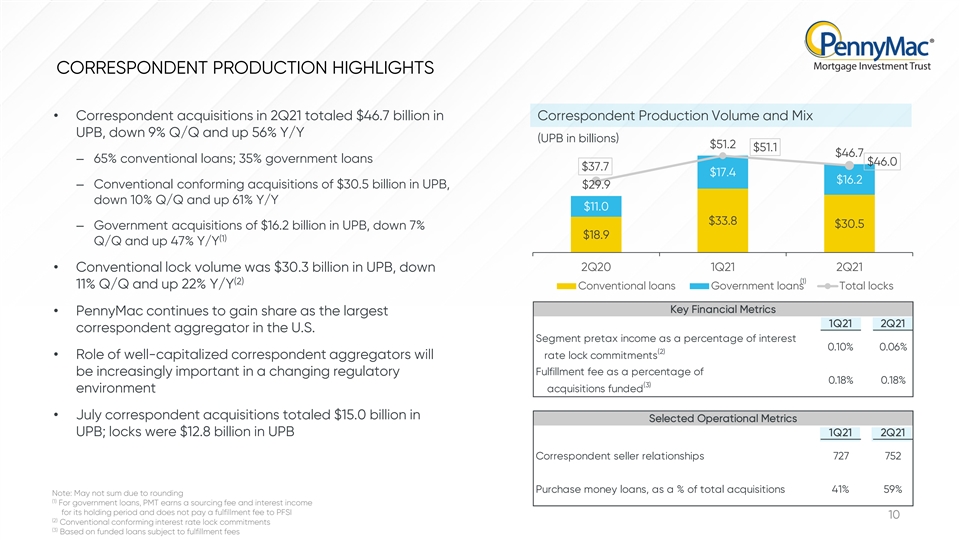
CORRESPONDENT PRODUCTION HIGHLIGHTS • Correspondent acquisitions
in 2Q21 totaled $46.7 billion in Correspondent Production Volume and Mix UPB, down 9% Q/Q and up 56% Y/Y (UPB in billions) $51.2 $51.1 $46.7 ‒ 65% conventional loans; 35% government loans $46.0 $37.7 $17.4 $16.2 ‒ Conventional conforming
acquisitions of $30.5 billion in UPB, $29.9 down 10% Q/Q and up 61% Y/Y $11.0 $33.8 $30.5 ‒ Government acquisitions of $16.2 billion in UPB, down 7% $18.9 (1) Q/Q and up 47% Y/Y 2Q20 1Q21 2Q21 • Conventional lock volume was $30.3 billion
in UPB, down (2) (1) 11% Q/Q and up 22% Y/Y Conventional loans Government loans Total locks Key Financial Metrics • PennyMac continues to gain share as the largest 1Q21 2Q21 correspondent aggregator in the U.S. Segment pretax income as a
percentage of interest 0.10% 0.06% (2) • Role of well-capitalized correspondent aggregators will rate lock commitments Fulfillment fee as a percentage of be increasingly important in a changing regulatory 0.18% 0.18% (3) acquisitions funded
environment • July correspondent acquisitions totaled $15.0 billion in Selected Operational Metrics UPB; locks were $12.8 billion in UPB 1Q21 2Q21 Correspondent seller relationships 727 752 Purchase money loans, as a % of total acquisitions
41% 59% Note: May not sum due to rounding (1) For government loans, PMT earns a sourcing fee and interest income for its holding period and does not pay a fulfillment fee to PFSI 10 (2) Conventional conforming interest rate lock commitments (3)
Based on funded loans subject to fulfillment feesCORRESPONDENT PRODUCTION HIGHLIGHTS • Correspondent acquisitions in 2Q21 totaled $46.7 billion in Correspondent Production Volume and Mix UPB, down 9% Q/Q and up 56% Y/Y (UPB in billions) $51.2
$51.1 $46.7 ‒ 65% conventional loans; 35% government loans $46.0 $37.7 $17.4 $16.2 ‒ Conventional conforming acquisitions of $30.5 billion in UPB, $29.9 down 10% Q/Q and up 61% Y/Y $11.0 $33.8 $30.5 ‒ Government acquisitions of
$16.2 billion in UPB, down 7% $18.9 (1) Q/Q and up 47% Y/Y 2Q20 1Q21 2Q21 • Conventional lock volume was $30.3 billion in UPB, down (2) (1) 11% Q/Q and up 22% Y/Y Conventional loans Government loans Total locks Key Financial Metrics •
PennyMac continues to gain share as the largest 1Q21 2Q21 correspondent aggregator in the U.S. Segment pretax income as a percentage of interest 0.10% 0.06% (2) • Role of well-capitalized correspondent aggregators will rate lock commitments
Fulfillment fee as a percentage of be increasingly important in a changing regulatory 0.18% 0.18% (3) acquisitions funded environment • July correspondent acquisitions totaled $15.0 billion in Selected Operational Metrics UPB; locks were $12.8
billion in UPB 1Q21 2Q21 Correspondent seller relationships 727 752 Purchase money loans, as a % of total acquisitions 41% 59% Note: May not sum due to rounding (1) For government loans, PMT earns a sourcing fee and interest income for its holding
period and does not pay a fulfillment fee to PFSI 10 (2) Conventional conforming interest rate lock commitments (3) Based on funded loans subject to fulfillment fees
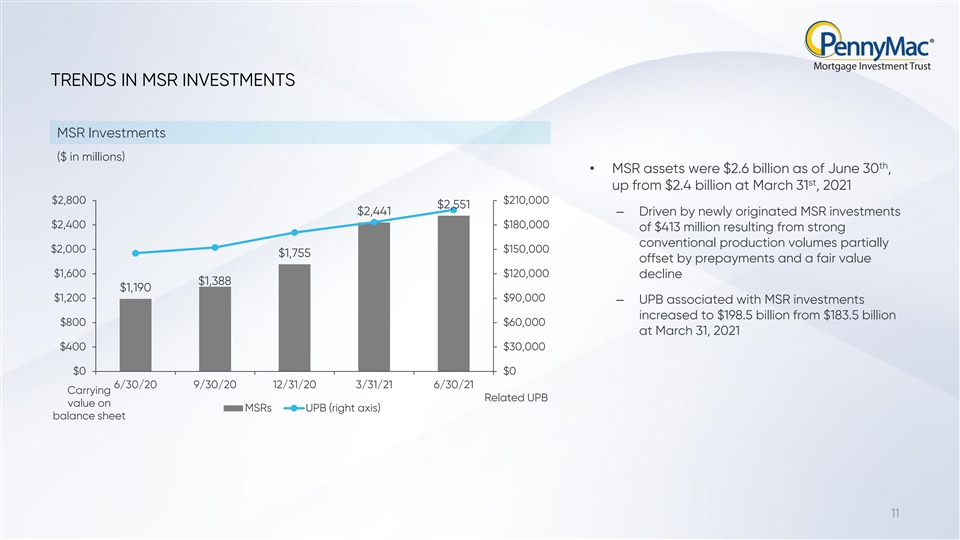
TRENDS IN MSR INVESTMENTS MSR Investments ($ in millions) th •
MSR assets were $2.6 billion as of June 30 , st up from $2.4 billion at March 31 , 2021 $2,800 $210,000 $2,551 $2,441 ‒ Driven by newly originated MSR investments $2,400 $180,000 of $413 million resulting from strong conventional production
volumes partially $2,000 $150,000 $1,755 offset by prepayments and a fair value $1,600 $120,000 decline $1,388 $1,190 $1,200 $90,000 ‒ UPB associated with MSR investments increased to $198.5 billion from $183.5 billion $800 $60,000 at March
31, 2021 $400 $30,000 $0 $0 6/30/20 9/30/20 12/31/20 3/31/21 6/30/21 Carrying Related UPB value on MSRs UPB (right axis) balance sheet 11TRENDS IN MSR INVESTMENTS MSR Investments ($ in millions) th • MSR assets were $2.6 billion as of June 30
, st up from $2.4 billion at March 31 , 2021 $2,800 $210,000 $2,551 $2,441 ‒ Driven by newly originated MSR investments $2,400 $180,000 of $413 million resulting from strong conventional production volumes partially $2,000 $150,000 $1,755
offset by prepayments and a fair value $1,600 $120,000 decline $1,388 $1,190 $1,200 $90,000 ‒ UPB associated with MSR investments increased to $198.5 billion from $183.5 billion $800 $60,000 at March 31, 2021 $400 $30,000 $0 $0 6/30/20 9/30/20
12/31/20 3/31/21 6/30/21 Carrying Related UPB value on MSRs UPB (right axis) balance sheet 11
HEDGING APPROACH CENTRAL TO PMT’S INTEREST RATE SENSITIVE
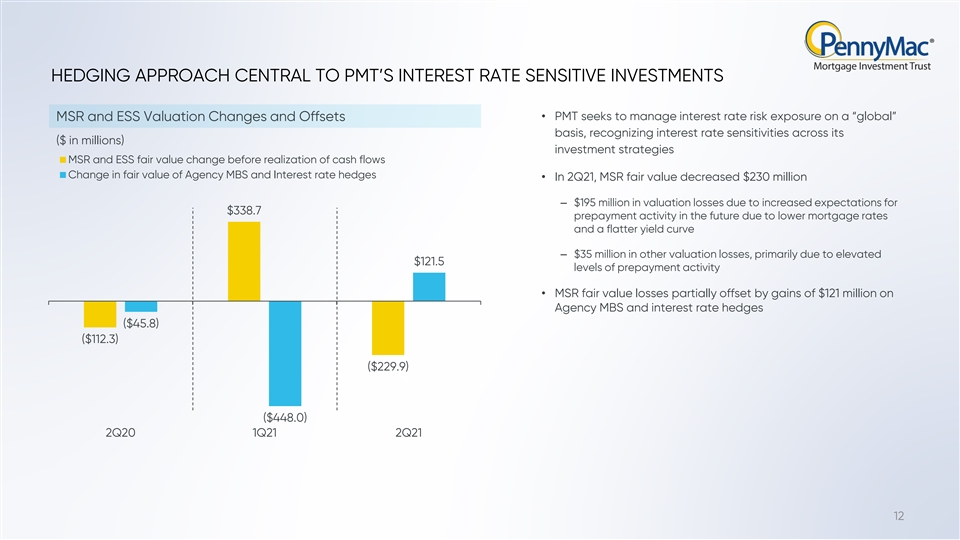
INVESTMENTS • PMT seeks to manage interest rate risk exposure on a “global” MSR and ESS Valuation Changes and Offsets basis, recognizing interest rate sensitivities across its ($ in millions) investment strategies MSR and ESS fair
value change before realization of cash flows Change in fair value of Agency MBS and Interest rate hedges • In 2Q21, MSR fair value decreased $230 million ‒ $195 million in valuation losses due to increased expectations for $338.7
prepayment activity in the future due to lower mortgage rates and a flatter yield curve ‒ $35 million in other valuation losses, primarily due to elevated $121.5 levels of prepayment activity • MSR fair value losses partially offset by
gains of $121 million on Agency MBS and interest rate hedges ($45.8) ($112.3) ($229.9) ($448.0) 2Q20 1Q21 2Q21 12
TRENDS IN PMT'S INVESTMENTS IN GSE CREDIT RISK TRANSFER (CRT) (1)
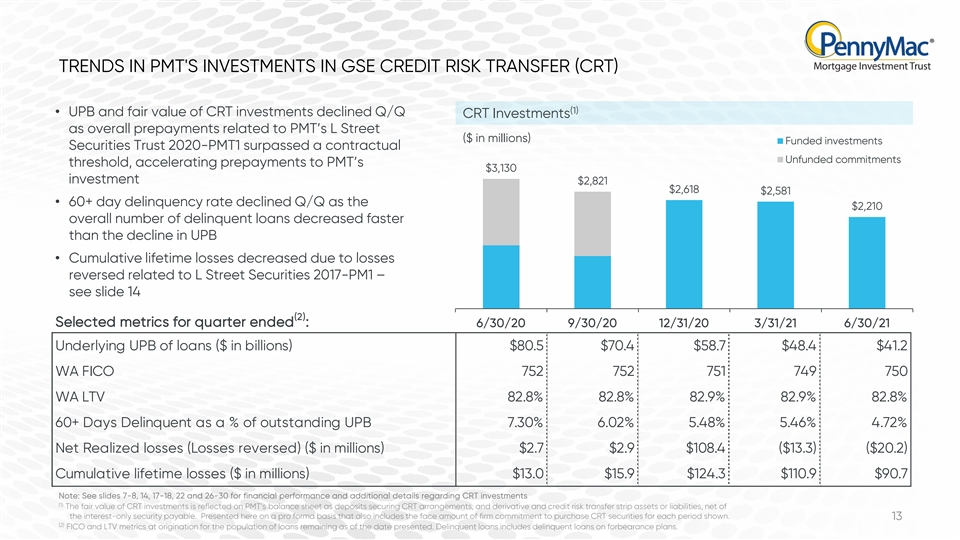
• UPB and fair value of CRT investments declined Q/Q CRT Investments as overall prepayments related to PMT’s L Street ($ in millions) Funded investments Securities Trust 2020-PMT1 surpassed a contractual Unfunded commitments threshold,
accelerating prepayments to PMT’s $3,130 investment $2,821 $2,618 $2,581 • 60+ day delinquency rate declined Q/Q as the $2,210 overall number of delinquent loans decreased faster than the decline in UPB • Cumulative lifetime losses
decreased due to losses reversed related to L Street Securities 2017-PM1 – see slide 14 (2) Selected metrics for quarter ended : 6/30/20 9/30/20 12/31/20 3/31/21 6/30/21 Underlying UPB of loans ($ in billions) $80.5 $70.4 $58.7 $48.4 $41.2 WA
FICO 752 752 751 749 750 WA LTV 82.8% 82.8% 82.9% 82.9% 82.8% 60+ Days Delinquent as a % of outstanding UPB 7.30% 6.02% 5.48% 5.46% 4.72% Net Realized losses (Losses reversed) ($ in millions) $2.7 $2.9 $108.4 ($13.3) ($20.2) Cumulative lifetime
losses ($ in millions) $13.0 $15.9 $124.3 $110.9 $90.7 Note: See slides 7-8, 14, 17-18, 22 and 26-30 for financial performance and additional details regarding CRT investments (1) The fair value of CRT investments is reflected on PMT’s balance
sheet as deposits securing CRT arrangements, and derivative and credit risk transfer strip assets or liabilities, net of the interest-only security payable. Presented here on a pro forma basis that also includes the face amount of firm commitment to
purchase CRT securities for each period shown. 13 (2) FICO and LTV metrics at origination for the population of loans remaining as of the date presented. Delinquent loans includes delinquent loans on forbearance plans. TRENDS IN PMT'S INVESTMENTS IN
GSE CREDIT RISK TRANSFER (CRT) (1) • UPB and fair value of CRT investments declined Q/Q CRT Investments as overall prepayments related to PMT’s L Street ($ in millions) Funded investments Securities Trust 2020-PMT1 surpassed a
contractual Unfunded commitments threshold, accelerating prepayments to PMT’s $3,130 investment $2,821 $2,618 $2,581 • 60+ day delinquency rate declined Q/Q as the $2,210 overall number of delinquent loans decreased faster than the
decline in UPB • Cumulative lifetime losses decreased due to losses reversed related to L Street Securities 2017-PM1 – see slide 14 (2) Selected metrics for quarter ended : 6/30/20 9/30/20 12/31/20 3/31/21 6/30/21 Underlying UPB of loans
($ in billions) $80.5 $70.4 $58.7 $48.4 $41.2 WA FICO 752 752 751 749 750 WA LTV 82.8% 82.8% 82.9% 82.9% 82.8% 60+ Days Delinquent as a % of outstanding UPB 7.30% 6.02% 5.48% 5.46% 4.72% Net Realized losses (Losses reversed) ($ in millions) $2.7
$2.9 $108.4 ($13.3) ($20.2) Cumulative lifetime losses ($ in millions) $13.0 $15.9 $124.3 $110.9 $90.7 Note: See slides 7-8, 14, 17-18, 22 and 26-30 for financial performance and additional details regarding CRT investments (1) The fair value of CRT
investments is reflected on PMT’s balance sheet as deposits securing CRT arrangements, and derivative and credit risk transfer strip assets or liabilities, net of the interest-only security payable. Presented here on a pro forma basis that
also includes the face amount of firm commitment to purchase CRT securities for each period shown. 13 (2) FICO and LTV metrics at origination for the population of loans remaining as of the date presented. Delinquent loans includes delinquent loans
on forbearance plans.
PERFORMANCE UPDATE AND LOSS MITIGATION ACTIVITY RELATED TO PMT’S
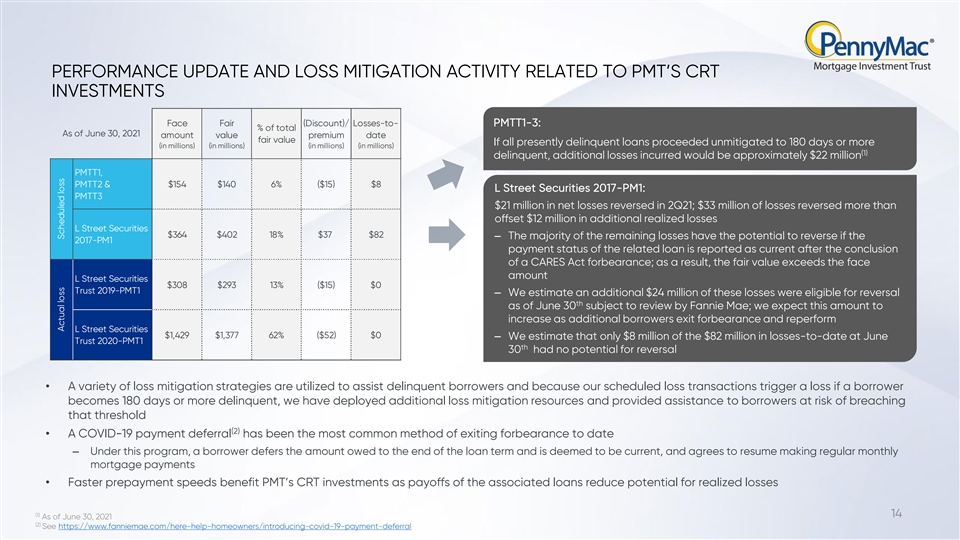
CRT INVESTMENTS Face Fair (Discount)/ Losses-to- PMTT1-3: % of total As of June 30, 2021 amount value premium date fair value If all presently delinquent loans proceeded unmitigated to 180 days or more (in millions) (in millions) (in millions) (in
millions) (1) delinquent, additional losses incurred would be approximately $22 million PMTT1, PMTT2 & $154 $140 6% ($15) $8 L Street Securities 2017-PM1: PMTT3 $21 million in net losses reversed in 2Q21; $33 million of losses reversed more than
offset $12 million in additional realized losses L Street Securities $364 $402 18% $37 $82 ‒ The majority of the remaining losses have the potential to reverse if the 2017-PM1 payment status of the related loan is reported as current after the
conclusion of a CARES Act forbearance; as a result, the fair value exceeds the face amount L Street Securities $308 $293 13% ($15) $0 Trust 2019-PMT1 ‒ We estimate an additional $24 million of these losses were eligible for reversal th as of
June 30 subject to review by Fannie Mae; we expect this amount to increase as additional borrowers exit forbearance and reperform L Street Securities $1,429 $1,377 62% ($52) $0 ‒ We estimate that only $8 million of the $82 million in
losses-to-date at June Trust 2020-PMT1 th 30 had no potential for reversal • A variety of loss mitigation strategies are utilized to assist delinquent borrowers and because our scheduled loss transactions trigger a loss if a borrower becomes
180 days or more delinquent, we have deployed additional loss mitigation resources and provided assistance to borrowers at risk of breaching that threshold (2) • A COVID-19 payment deferral has been the most common method of exiting
forbearance to date ‒ Under this program, a borrower defers the amount owed to the end of the loan term and is deemed to be current, and agrees to resume making regular monthly mortgage payments • Faster prepayment speeds benefit
PMT’s CRT investments as payoffs of the associated loans reduce potential for realized losses (1) 14 As of June 30, 2021 (2) See https://www.fanniemae.com/here-help-homeowners/introducing-covid-19-payment-deferral Actual loss Scheduled
lossPERFORMANCE UPDATE AND LOSS MITIGATION ACTIVITY RELATED TO PMT’S CRT INVESTMENTS Face Fair (Discount)/ Losses-to- PMTT1-3: % of total As of June 30, 2021 amount value premium date fair value If all presently delinquent loans proceeded
unmitigated to 180 days or more (in millions) (in millions) (in millions) (in millions) (1) delinquent, additional losses incurred would be approximately $22 million PMTT1, PMTT2 & $154 $140 6% ($15) $8 L Street Securities 2017-PM1: PMTT3 $21
million in net losses reversed in 2Q21; $33 million of losses reversed more than offset $12 million in additional realized losses L Street Securities $364 $402 18% $37 $82 ‒ The majority of the remaining losses have the potential to reverse if
the 2017-PM1 payment status of the related loan is reported as current after the conclusion of a CARES Act forbearance; as a result, the fair value exceeds the face amount L Street Securities $308 $293 13% ($15) $0 Trust 2019-PMT1 ‒ We
estimate an additional $24 million of these losses were eligible for reversal th as of June 30 subject to review by Fannie Mae; we expect this amount to increase as additional borrowers exit forbearance and reperform L Street Securities $1,429
$1,377 62% ($52) $0 ‒ We estimate that only $8 million of the $82 million in losses-to-date at June Trust 2020-PMT1 th 30 had no potential for reversal • A variety of loss mitigation strategies are utilized to assist delinquent borrowers
and because our scheduled loss transactions trigger a loss if a borrower becomes 180 days or more delinquent, we have deployed additional loss mitigation resources and provided assistance to borrowers at risk of breaching that threshold (2) •
A COVID-19 payment deferral has been the most common method of exiting forbearance to date ‒ Under this program, a borrower defers the amount owed to the end of the loan term and is deemed to be current, and agrees to resume making regular
monthly mortgage payments • Faster prepayment speeds benefit PMT’s CRT investments as payoffs of the associated loans reduce potential for realized losses (1) 14 As of June 30, 2021 (2) See
https://www.fanniemae.com/here-help-homeowners/introducing-covid-19-payment-deferral Actual loss Scheduled loss
CHANGES IN THE MORTGAGE LANDSCAPE CREATE INCREASED OPPORTUNITIES FOR
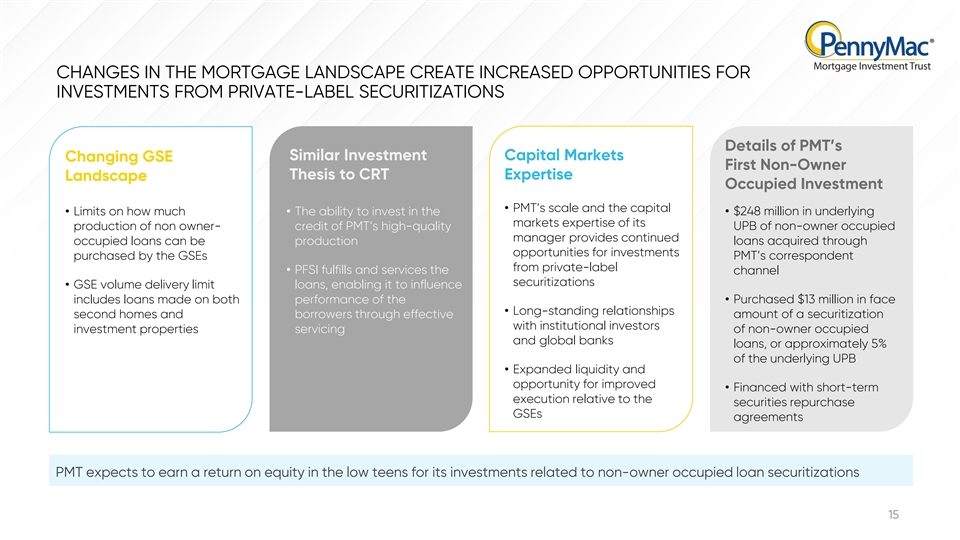
INVESTMENTS FROM PRIVATE-LABEL SECURITIZATIONS Details of PMT’s Similar Investment Capital Markets Changing GSE First Non-Owner Thesis to CRT Expertise Landscape Occupied Investment • PMT’s scale and the capital • Limits on
how much • The ability to invest in the • $248 million in underlying markets expertise of its production of non owner- credit of PMT’s high-quality UPB of non-owner occupied manager provides continued occupied loans can be
production loans acquired through opportunities for investments purchased by the GSEs PMT’s correspondent from private-label • PFSI fulfills and services the channel securitizations • GSE volume delivery limit loans, enabling it to
influence includes loans made on both performance of the • Purchased $13 million in face • Long-standing relationships second homes and borrowers through effective amount of a securitization with institutional investors investment
properties servicing of non-owner occupied and global banks loans, or approximately 5% of the underlying UPB • Expanded liquidity and opportunity for improved • Financed with short-term execution relative to the securities repurchase
GSEs agreements PMT expects to earn a return on equity in the low teens for its investments related to non-owner occupied loan securitizations 15CHANGES IN THE MORTGAGE LANDSCAPE CREATE INCREASED OPPORTUNITIES FOR INVESTMENTS FROM PRIVATE-LABEL
SECURITIZATIONS Details of PMT’s Similar Investment Capital Markets Changing GSE First Non-Owner Thesis to CRT Expertise Landscape Occupied Investment • PMT’s scale and the capital • Limits on how much • The ability to
invest in the • $248 million in underlying markets expertise of its production of non owner- credit of PMT’s high-quality UPB of non-owner occupied manager provides continued occupied loans can be production loans acquired through
opportunities for investments purchased by the GSEs PMT’s correspondent from private-label • PFSI fulfills and services the channel securitizations • GSE volume delivery limit loans, enabling it to influence includes loans made on
both performance of the • Purchased $13 million in face • Long-standing relationships second homes and borrowers through effective amount of a securitization with institutional investors investment properties servicing of non-owner
occupied and global banks loans, or approximately 5% of the underlying UPB • Expanded liquidity and opportunity for improved • Financed with short-term execution relative to the securities repurchase GSEs agreements PMT expects to earn a
return on equity in the low teens for its investments related to non-owner occupied loan securitizations 15

FINANCIAL RESULTSFINANCIAL RESULTS
SECOND QUARTER RESULTS AND RETURN CONTRIBUTIONS BY STRATEGY Income
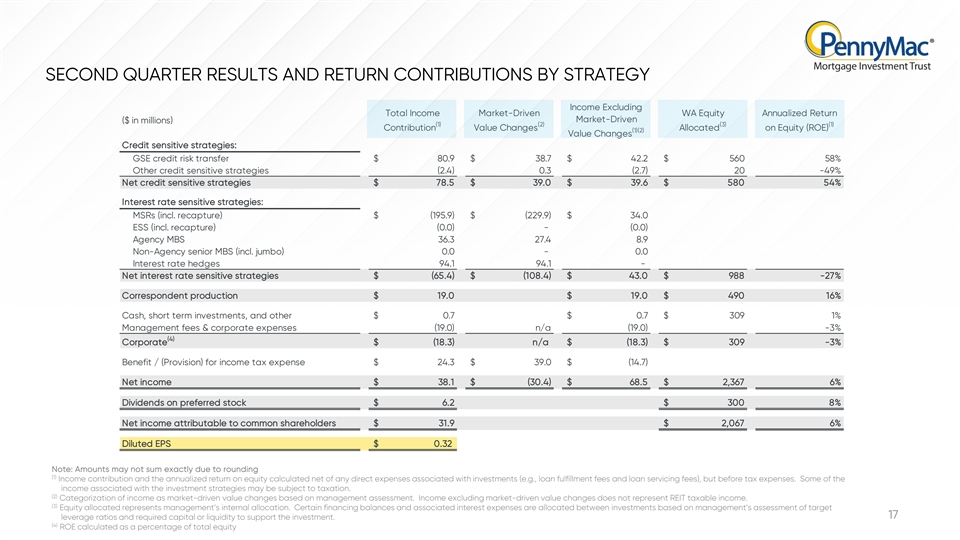
Excluding Total Income Market-Driven WA Equity Annualized Return Market-Driven ($ in millions) (1) (2) (3) (1) Contribution Value Changes Allocated on Equity (ROE) (1)(2) Value Changes Credit sensitive strategies: GSE credit risk transfer $ 80.9 $ 3
8.7 $ 42.2 $ 560 58% Other credit sensitive strategies (2.4) 0.3 ( 2.7) 20 -49% Net credit sensitive strategies $ 78.5 $ 39.0 $ 39.6 $ 580 54% Interest rate sensitive strategies: MSRs (incl. recapture) $ (195.9) $ (229.9) $ 34.0 ESS (incl.
recapture) (0.0) - (0.0) Agency MBS 36.3 27.4 8.9 Non-Agency senior MBS (incl. jumbo) 0.0 - 0.0 Interest rate hedges 94.1 94.1 - Net interest rate sensitive strategies $ (65.4) $ (108.4) $ 43.0 $ 988 -27% Correspondent production $ 19.0 $ 19.0 $ 490
16% Cash, short term investments, and other $ 0.7 $ 0.7 $ 309 1% Management fees & corporate expenses (19.0) n/a (19.0) -3% (4) Corporate $ (18.3) n/a $ (18.3) $ 309 -3% Benefit / (Provision) for income tax expense $ 24.3 $ 39.0 $ (14.7) Net
income $ 38.1 $ (30.4) $ 68.5 $ 2,367 6% Dividends on preferred stock $ 6.2 $ 300 8% Net income attributable to common shareholders $ 31.9 $ 2,067 6% Diluted EPS $ 0.32 Note: Amounts may not sum exactly due to rounding (1) Income contribution and
the annualized return on equity calculated net of any direct expenses associated with investments (e.g., loan fulfillment fees and loan servicing fees), but before tax expenses. Some of the income associated with the investment strategies may be
subject to taxation. (2) Categorization of income as market-driven value changes based on management assessment. Income excluding market-driven value changes does not represent REIT taxable income. (3) Equity allocated represents management’s
internal allocation. Certain financing balances and associated interest expenses are allocated between investments based on management’s assessment of target 17 leverage ratios and required capital or liquidity to support the investment. (4)
ROE calculated as a percentage of total equitySECOND QUARTER RESULTS AND RETURN CONTRIBUTIONS BY STRATEGY Income Excluding Total Income Market-Driven WA Equity Annualized Return Market-Driven ($ in millions) (1) (2) (3) (1) Contribution Value
Changes Allocated on Equity (ROE) (1)(2) Value Changes Credit sensitive strategies: GSE credit risk transfer $ 80.9 $ 3 8.7 $ 42.2 $ 560 58% Other credit sensitive strategies (2.4) 0.3 ( 2.7) 20 -49% Net credit sensitive strategies $ 78.5 $ 39.0 $
39.6 $ 580 54% Interest rate sensitive strategies: MSRs (incl. recapture) $ (195.9) $ (229.9) $ 34.0 ESS (incl. recapture) (0.0) - (0.0) Agency MBS 36.3 27.4 8.9 Non-Agency senior MBS (incl. jumbo) 0.0 - 0.0 Interest rate hedges 94.1 94.1 - Net
interest rate sensitive strategies $ (65.4) $ (108.4) $ 43.0 $ 988 -27% Correspondent production $ 19.0 $ 19.0 $ 490 16% Cash, short term investments, and other $ 0.7 $ 0.7 $ 309 1% Management fees & corporate expenses (19.0) n/a (19.0) -3% (4)
Corporate $ (18.3) n/a $ (18.3) $ 309 -3% Benefit / (Provision) for income tax expense $ 24.3 $ 39.0 $ (14.7) Net income $ 38.1 $ (30.4) $ 68.5 $ 2,367 6% Dividends on preferred stock $ 6.2 $ 300 8% Net income attributable to common shareholders $
31.9 $ 2,067 6% Diluted EPS $ 0.32 Note: Amounts may not sum exactly due to rounding (1) Income contribution and the annualized return on equity calculated net of any direct expenses associated with investments (e.g., loan fulfillment fees and loan
servicing fees), but before tax expenses. Some of the income associated with the investment strategies may be subject to taxation. (2) Categorization of income as market-driven value changes based on management assessment. Income excluding
market-driven value changes does not represent REIT taxable income. (3) Equity allocated represents management’s internal allocation. Certain financing balances and associated interest expenses are allocated between investments based on
management’s assessment of target 17 leverage ratios and required capital or liquidity to support the investment. (4) ROE calculated as a percentage of total equity
PERFORMANCE OF THE GSE CREDIT RISK TRANSFER INVESTMENTS IN 2Q21 (Loss)
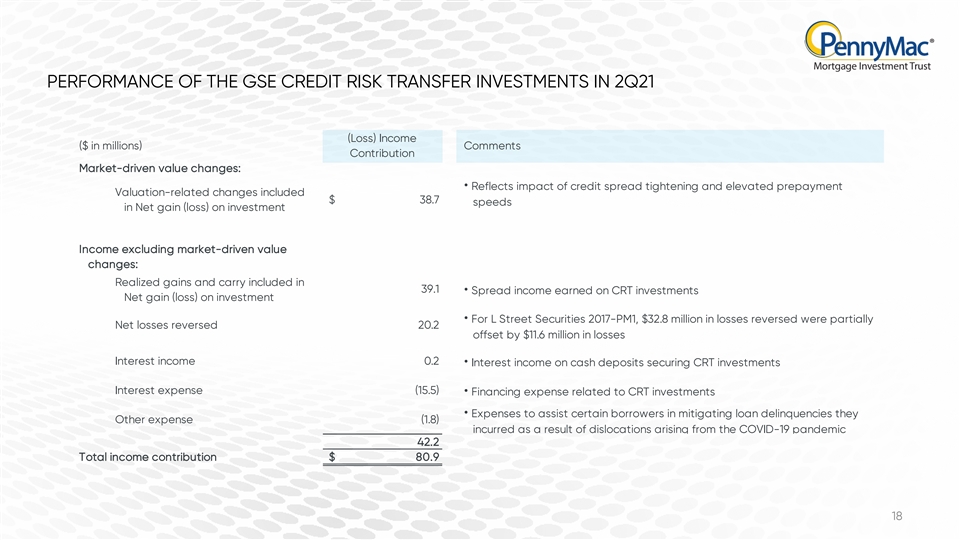
Income ($ in millions) Comments Contribution Market-driven value changes: • Reflects impact of credit spread tightening and elevated prepayment Valuation-related changes included $ 38.7 speeds in Net gain (loss) on investment Income excluding
market-driven value changes: Realized gains and carry included in 39.1 • Spread income earned on CRT investments Net gain (loss) on investment • For L Street Securities 2017-PM1, $32.8 million in losses reversed were partially Net losses
reversed 20.2 offset by $11.6 million in losses Interest income 0.2 • Interest income on cash deposits securing CRT investments Interest expense (15.5) • Financing expense related to CRT investments • Expenses to assist certain
borrowers in mitigating loan delinquencies they Other expense (1.8) incurred as a result of dislocations arising from the COVID-19 pandemic 42.2 Total income contribution $ 80.9 18PERFORMANCE OF THE GSE CREDIT RISK TRANSFER INVESTMENTS IN 2Q21
(Loss) Income ($ in millions) Comments Contribution Market-driven value changes: • Reflects impact of credit spread tightening and elevated prepayment Valuation-related changes included $ 38.7 speeds in Net gain (loss) on investment Income
excluding market-driven value changes: Realized gains and carry included in 39.1 • Spread income earned on CRT investments Net gain (loss) on investment • For L Street Securities 2017-PM1, $32.8 million in losses reversed were partially
Net losses reversed 20.2 offset by $11.6 million in losses Interest income 0.2 • Interest income on cash deposits securing CRT investments Interest expense (15.5) • Financing expense related to CRT investments • Expenses to assist
certain borrowers in mitigating loan delinquencies they Other expense (1.8) incurred as a result of dislocations arising from the COVID-19 pandemic 42.2 Total income contribution $ 80.9 18

APPENDIX
CURRENT MARKET ENVIRONMENT AND MACROECONOMIC TRENDS (1) (2) Average
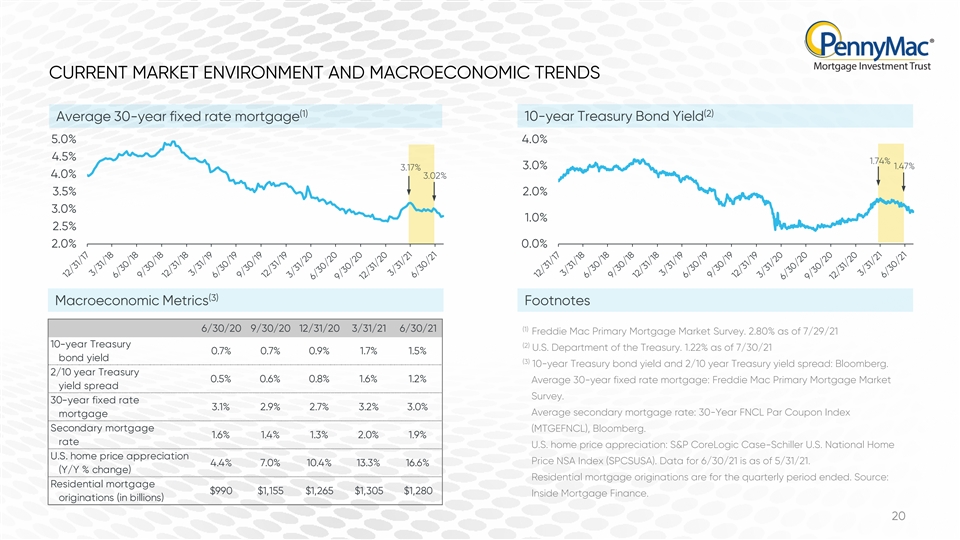
30-year fixed rate mortgage 10-year Treasury Bond Yield 5.0% 4.0% 4.5% 1.74% 3.0% 1.47% 3.17% 4.0% 3.02% 3.5% 2.0% 3.0% 1.0% 2.5% 2.0% 0.0% (3) Macroeconomic Metrics Footnotes 6/30/20 9/30/20 12/31/20 3/31/21 6/30/21 (1) Freddie Mac Primary Mortgage
Market Survey. 2.80% as of 7/29/21 10-year Treasury (2) U.S. Department of the Treasury. 1.22% as of 7/30/21 0.7% 0.7% 0.9% 1.7% 1.5% bond yield (3) 10-year Treasury bond yield and 2/10 year Treasury yield spread: Bloomberg. 2/10 year Treasury 0.5%
0.6% 0.8% 1.6% 1.2% Average 30-year fixed rate mortgage: Freddie Mac Primary Mortgage Market yield spread Survey. 30-year fixed rate 3.1% 2.9% 2.7% 3.2% 3.0% Average secondary mortgage rate: 30-Year FNCL Par Coupon Index mortgage Secondary mortgage
(MTGEFNCL), Bloomberg. 1.6% 1.4% 1.3% 2.0% 1.9% rate U.S. home price appreciation: S&P CoreLogic Case-Schiller U.S. National Home U.S. home price appreciation Price NSA Index (SPCSUSA). Data for 6/30/21 is as of 5/31/21. 4.4% 7.0% 10.4% 13.3%
16.6% (Y/Y % change) Residential mortgage originations are for the quarterly period ended. Source: Residential mortgage $990 $1,155 $1,265 $1,305 $1,280 Inside Mortgage Finance. originations (in billions) 20CURRENT MARKET ENVIRONMENT AND
MACROECONOMIC TRENDS (1) (2) Average 30-year fixed rate mortgage 10-year Treasury Bond Yield 5.0% 4.0% 4.5% 1.74% 3.0% 1.47% 3.17% 4.0% 3.02% 3.5% 2.0% 3.0% 1.0% 2.5% 2.0% 0.0% (3) Macroeconomic Metrics Footnotes 6/30/20 9/30/20 12/31/20 3/31/21
6/30/21 (1) Freddie Mac Primary Mortgage Market Survey. 2.80% as of 7/29/21 10-year Treasury (2) U.S. Department of the Treasury. 1.22% as of 7/30/21 0.7% 0.7% 0.9% 1.7% 1.5% bond yield (3) 10-year Treasury bond yield and 2/10 year Treasury yield
spread: Bloomberg. 2/10 year Treasury 0.5% 0.6% 0.8% 1.6% 1.2% Average 30-year fixed rate mortgage: Freddie Mac Primary Mortgage Market yield spread Survey. 30-year fixed rate 3.1% 2.9% 2.7% 3.2% 3.0% Average secondary mortgage rate: 30-Year FNCL
Par Coupon Index mortgage Secondary mortgage (MTGEFNCL), Bloomberg. 1.6% 1.4% 1.3% 2.0% 1.9% rate U.S. home price appreciation: S&P CoreLogic Case-Schiller U.S. National Home U.S. home price appreciation Price NSA Index (SPCSUSA). Data for
6/30/21 is as of 5/31/21. 4.4% 7.0% 10.4% 13.3% 16.6% (Y/Y % change) Residential mortgage originations are for the quarterly period ended. Source: Residential mortgage $990 $1,155 $1,265 $1,305 $1,280 Inside Mortgage Finance. originations (in
billions) 20
HISTORICAL EARNINGS, DIVIDENDS AND BOOK VALUE PER SHARE (1) Diluted EPS
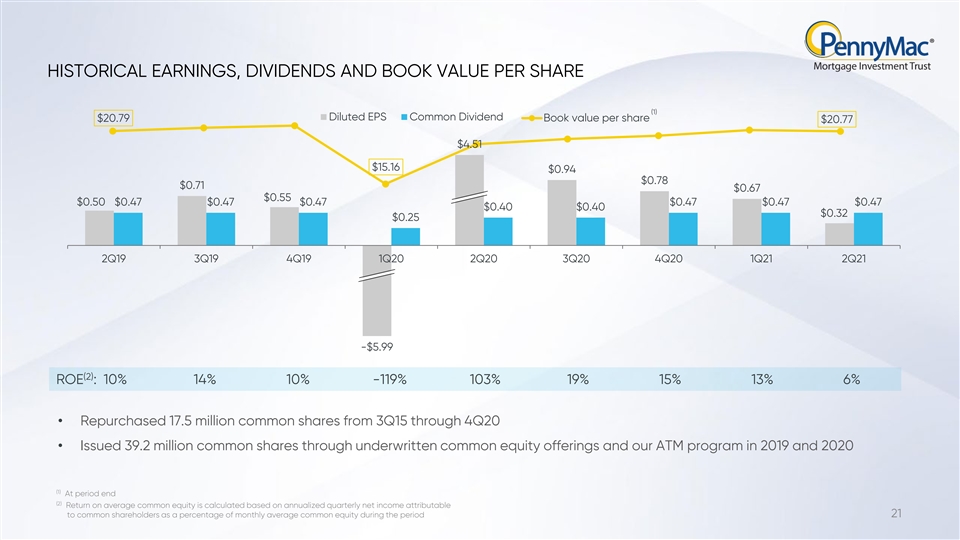
Common Dividend $20.79 Book value per share $20.77 $4.51 $15.16 $0.94 $0.78 $0.71 $0.67 $0.55 $0.50 $0.47 $0.47 $0.47 $0.47 $0.47 $0.47 $0.40 $0.40 $0.32 $0.25 2Q19 3Q19 4Q19 1Q20 2Q20 3Q20 4Q20 1Q21 2Q21 -$5.99 (2) ROE : 10% 14% 10% -119% 103% 19%
15% 13% 6% • Repurchased 17.5 million common shares from 3Q15 through 4Q20 • Issued 39.2 million common shares through underwritten common equity offerings and our ATM program in 2019 and 2020 (1) At period end (2) Return on average
common equity is calculated based on annualized quarterly net income attributable to common shareholders as a percentage of monthly average common equity during the period 21HISTORICAL EARNINGS, DIVIDENDS AND BOOK VALUE PER SHARE (1) Diluted EPS
Common Dividend $20.79 Book value per share $20.77 $4.51 $15.16 $0.94 $0.78 $0.71 $0.67 $0.55 $0.50 $0.47 $0.47 $0.47 $0.47 $0.47 $0.47 $0.40 $0.40 $0.32 $0.25 2Q19 3Q19 4Q19 1Q20 2Q20 3Q20 4Q20 1Q21 2Q21 -$5.99 (2) ROE : 10% 14% 10% -119% 103% 19%
15% 13% 6% • Repurchased 17.5 million common shares from 3Q15 through 4Q20 • Issued 39.2 million common shares through underwritten common equity offerings and our ATM program in 2019 and 2020 (1) At period end (2) Return on average
common equity is calculated based on annualized quarterly net income attributable to common shareholders as a percentage of monthly average common equity during the period 21
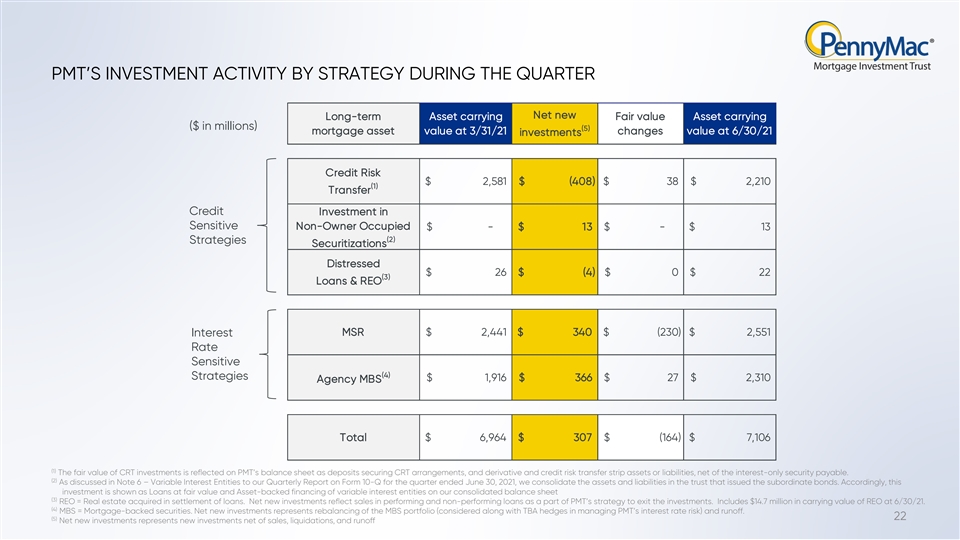
PMT’S INVESTMENT ACTIVITY BY STRATEGY DURING THE QUARTER Net new
Long-term Asset carrying Fair value Asset carrying ($ in millions) (5) mortgage asset value at 3/31/21 changes value at 6/30/21 investments Credit Risk $ 2 ,581 $ (408) $ 38 $ 2,210 (1) Transfer Credit Investment in Sensitive Non-Owner Occupied $ -
$ 13 $ - $ 13 (2) Strategies Securitizations Distressed $ 26 $ (4) $ 0 $ 22 (3) Loans & REO MSR $ 2,441 $ 34 0 $ (230) $ 2 ,551 Interest Rate Sensitive (4) Strategies $ 1,916 $ 366 $ 27 $ 2,310 Agency MBS Total $ 6, 964 $ 30 7 $ (164) $ 7 ,106
(1) The fair value of CRT investments is reflected on PMT’s balance sheet as deposits securing CRT arrangements, and derivative and credit risk transfer strip assets or liabilities, net of the interest-only security payable. (2) As discussed
in Note 6 – Variable Interest Entities to our Quarterly Report on Form 10-Q for the quarter ended June 30, 2021, we consolidate the assets and liabilities in the trust that issued the subordinate bonds. Accordingly, this investment is shown as
Loans at fair value and Asset-backed financing of variable interest entities on our consolidated balance sheet (3) REO = Real estate acquired in settlement of loans. Net new investments reflect sales in performing and non-performing loans as a part
of PMT’s strategy to exit the investments. Includes $14.7 million in carrying value of REO at 6/30/21. (4) MBS = Mortgage-backed securities. Net new investments represents rebalancing of the MBS portfolio (considered along with TBA hedges in
managing PMT’s interest rate risk) and runoff. 22 (5) Net new investments represents new investments net of sales, liquidations, and runoffPMT’S INVESTMENT ACTIVITY BY STRATEGY DURING THE QUARTER Net new Long-term Asset carrying Fair
value Asset carrying ($ in millions) (5) mortgage asset value at 3/31/21 changes value at 6/30/21 investments Credit Risk $ 2 ,581 $ (408) $ 38 $ 2,210 (1) Transfer Credit Investment in Sensitive Non-Owner Occupied $ - $ 13 $ - $ 13 (2) Strategies
Securitizations Distressed $ 26 $ (4) $ 0 $ 22 (3) Loans & REO MSR $ 2,441 $ 34 0 $ (230) $ 2 ,551 Interest Rate Sensitive (4) Strategies $ 1,916 $ 366 $ 27 $ 2,310 Agency MBS Total $ 6, 964 $ 30 7 $ (164) $ 7 ,106 (1) The fair value of CRT
investments is reflected on PMT’s balance sheet as deposits securing CRT arrangements, and derivative and credit risk transfer strip assets or liabilities, net of the interest-only security payable. (2) As discussed in Note 6 – Variable
Interest Entities to our Quarterly Report on Form 10-Q for the quarter ended June 30, 2021, we consolidate the assets and liabilities in the trust that issued the subordinate bonds. Accordingly, this investment is shown as Loans at fair value and
Asset-backed financing of variable interest entities on our consolidated balance sheet (3) REO = Real estate acquired in settlement of loans. Net new investments reflect sales in performing and non-performing loans as a part of PMT’s strategy
to exit the investments. Includes $14.7 million in carrying value of REO at 6/30/21. (4) MBS = Mortgage-backed securities. Net new investments represents rebalancing of the MBS portfolio (considered along with TBA hedges in managing PMT’s
interest rate risk) and runoff. 22 (5) Net new investments represents new investments net of sales, liquidations, and runoff
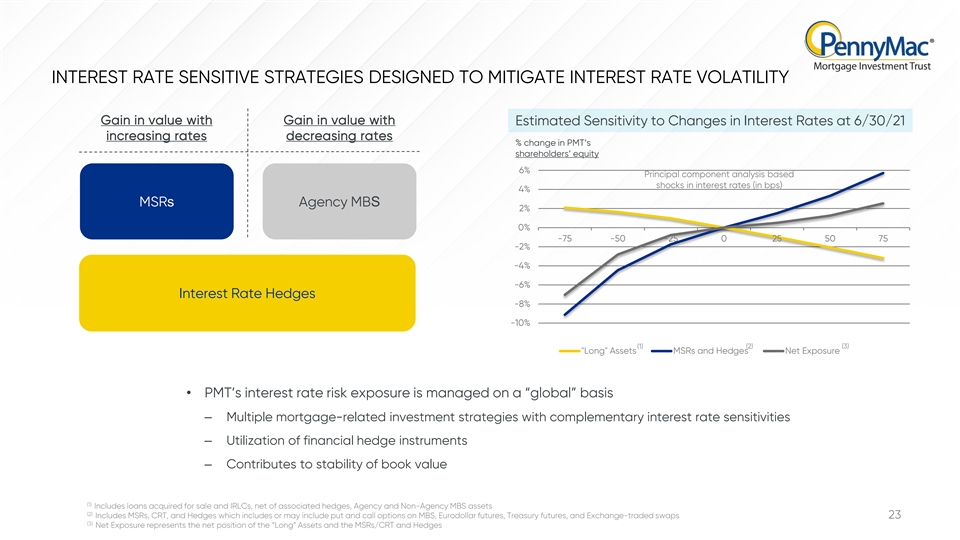
INTEREST RATE SENSITIVE STRATEGIES DESIGNED TO MITIGATE INTEREST RATE
VOLATILITY Gain in value with Gain in value with Estimated Sensitivity to Changes in Interest Rates at 6/30/21 increasing rates decreasing rates % change in PMT’s shareholders’ equity 6% Principal component analysis based shocks in
interest rates (in bps) 4% MSRs Agency MBS 2% 0% -75 -50 -25 0 25 50 75 -2% -4% -6% Interest Rate Hedges -8% -10% (2) (3) (1) Long Assets MSRs and Hedges Net Exposure • PMT’s interest rate risk exposure is managed on a
“global” basis – Multiple mortgage-related investment strategies with complementary interest rate sensitivities – Utilization of financial hedge instruments – Contributes to stability of book value (1) Includes loans
acquired for sale and IRLCs, net of associated hedges, Agency and Non-Agency MBS assets (2) Includes MSRs, CRT, and Hedges which includes or may include put and call options on MBS, Eurodollar futures, Treasury futures, and Exchange-traded swaps 23
(3) Net Exposure represents the net position of the “Long” Assets and the MSRs/CRT and Hedges INTEREST RATE SENSITIVE STRATEGIES DESIGNED TO MITIGATE INTEREST RATE VOLATILITY Gain in value with Gain in value with Estimated Sensitivity to
Changes in Interest Rates at 6/30/21 increasing rates decreasing rates % change in PMT’s shareholders’ equity 6% Principal component analysis based shocks in interest rates (in bps) 4% MSRs Agency MBS 2% 0% -75 -50 -25 0 25 50 75 -2% -4%
-6% Interest Rate Hedges -8% -10% (2) (3) (1) Long Assets MSRs and Hedges Net Exposure • PMT’s interest rate risk exposure is managed on a “global” basis – Multiple mortgage-related investment strategies with
complementary interest rate sensitivities – Utilization of financial hedge instruments – Contributes to stability of book value (1) Includes loans acquired for sale and IRLCs, net of associated hedges, Agency and Non-Agency MBS assets
(2) Includes MSRs, CRT, and Hedges which includes or may include put and call options on MBS, Eurodollar futures, Treasury futures, and Exchange-traded swaps 23 (3) Net Exposure represents the net position of the “Long” Assets and the
MSRs/CRT and Hedges
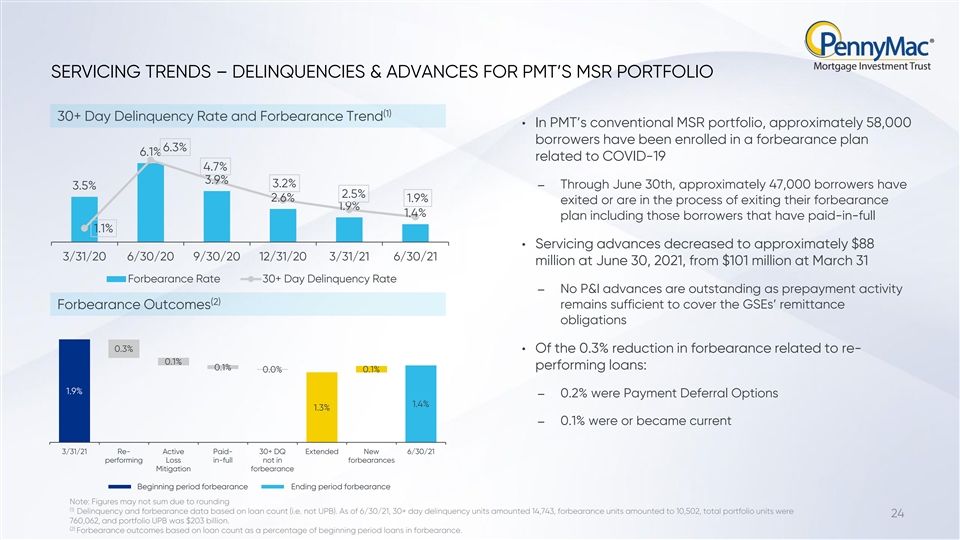
SERVICING TRENDS – DELINQUENCIES & ADVANCES FOR PMT’S
MSR PORTFOLIO (1) 30+ Day Delinquency Rate and Forbearance Trend • In PMT’s conventional MSR portfolio, approximately 58,000 borrowers have been enrolled in a forbearance plan 6.3% 6.1% related to COVID-19 4.7% 3.9% 3.2% ‒ Through
June 30th, approximately 47,000 borrowers have 3.5% 2.5% 2.6% 1.9% exited or are in the process of exiting their forbearance 1.9% 1.4% plan including those borrowers that have paid-in-full 1.1% • Servicing advances decreased to approximately
$88 3/31/20 6/30/20 9/30/20 12/31/20 3/31/21 6/30/21 million at June 30, 2021, from $101 million at March 31 Forbearance Rate 30+ Day Delinquency Rate ‒ No P&I advances are outstanding as prepayment activity (2) Forbearance Outcomes
remains sufficient to cover the GSEs’ remittance obligations 0.3% • Of the 0.3% reduction in forbearance related to re- 0.1% 0.1% performing loans: 0.1% 0.0% 1.9% ‒ 0.2% were Payment Deferral Options 1.4% 1.3% ‒ 0.1% were or
became current 3/31/21 Re- Active Paid- 30+ DQ Extended New 6/30/21 performing Loss in-full not in forbearances Mitigation forbearance Beginning period forbearance Ending period forbearance Note: Figures may not sum due to rounding (1) Delinquency
and forbearance data based on loan count (i.e. not UPB). As of 6/30/21, 30+ day delinquency units amounted 14,743, forbearance units amounted to 10,502, total portfolio units were 24 760,062, and portfolio UPB was $203 billion. (2) Forbearance
outcomes based on loan count as a percentage of beginning period loans in forbearance. SERVICING TRENDS – DELINQUENCIES & ADVANCES FOR PMT’S MSR PORTFOLIO (1) 30+ Day Delinquency Rate and Forbearance Trend • In PMT’s
conventional MSR portfolio, approximately 58,000 borrowers have been enrolled in a forbearance plan 6.3% 6.1% related to COVID-19 4.7% 3.9% 3.2% ‒ Through June 30th, approximately 47,000 borrowers have 3.5% 2.5% 2.6% 1.9% exited or are in the
process of exiting their forbearance 1.9% 1.4% plan including those borrowers that have paid-in-full 1.1% • Servicing advances decreased to approximately $88 3/31/20 6/30/20 9/30/20 12/31/20 3/31/21 6/30/21 million at June 30, 2021, from $101
million at March 31 Forbearance Rate 30+ Day Delinquency Rate ‒ No P&I advances are outstanding as prepayment activity (2) Forbearance Outcomes remains sufficient to cover the GSEs’ remittance obligations 0.3% • Of the 0.3%
reduction in forbearance related to re- 0.1% 0.1% performing loans: 0.1% 0.0% 1.9% ‒ 0.2% were Payment Deferral Options 1.4% 1.3% ‒ 0.1% were or became current 3/31/21 Re- Active Paid- 30+ DQ Extended New 6/30/21 performing Loss in-full
not in forbearances Mitigation forbearance Beginning period forbearance Ending period forbearance Note: Figures may not sum due to rounding (1) Delinquency and forbearance data based on loan count (i.e. not UPB). As of 6/30/21, 30+ day delinquency
units amounted 14,743, forbearance units amounted to 10,502, total portfolio units were 24 760,062, and portfolio UPB was $203 billion. (2) Forbearance outcomes based on loan count as a percentage of beginning period loans in forbearance.
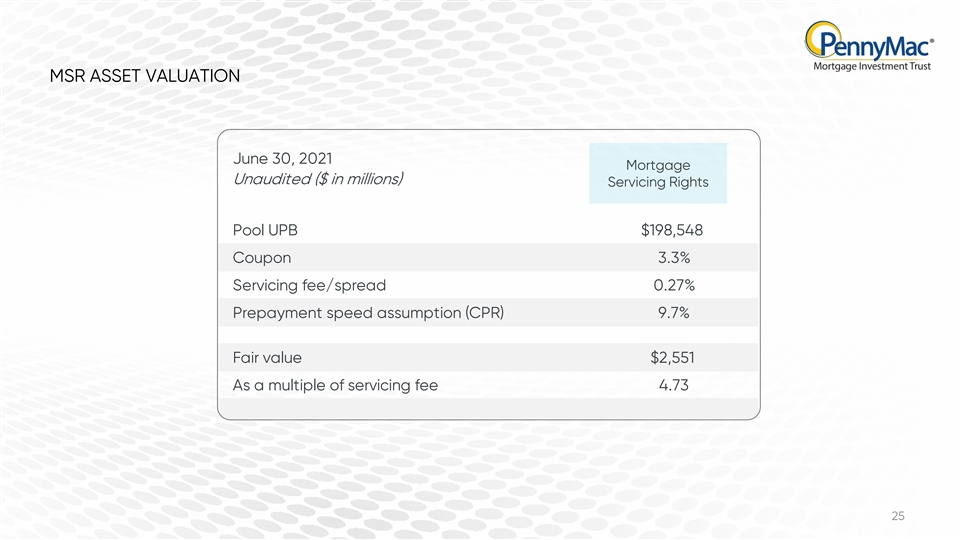
MSR ASSET VALUATION June 30, 2021 Mortgage Unaudited ($ in millions)
Servicing Rights Pool UPB $198,548 Coupon 3.3% Servicing fee/spread 0.27% Prepayment speed assumption (CPR) 9.7% Fair value $2,551 As a multiple of servicing fee 4.73 25MSR ASSET VALUATION June 30, 2021 Mortgage Unaudited ($ in millions) Servicing
Rights Pool UPB $198,548 Coupon 3.3% Servicing fee/spread 0.27% Prepayment speed assumption (CPR) 9.7% Fair value $2,551 As a multiple of servicing fee 4.73 25
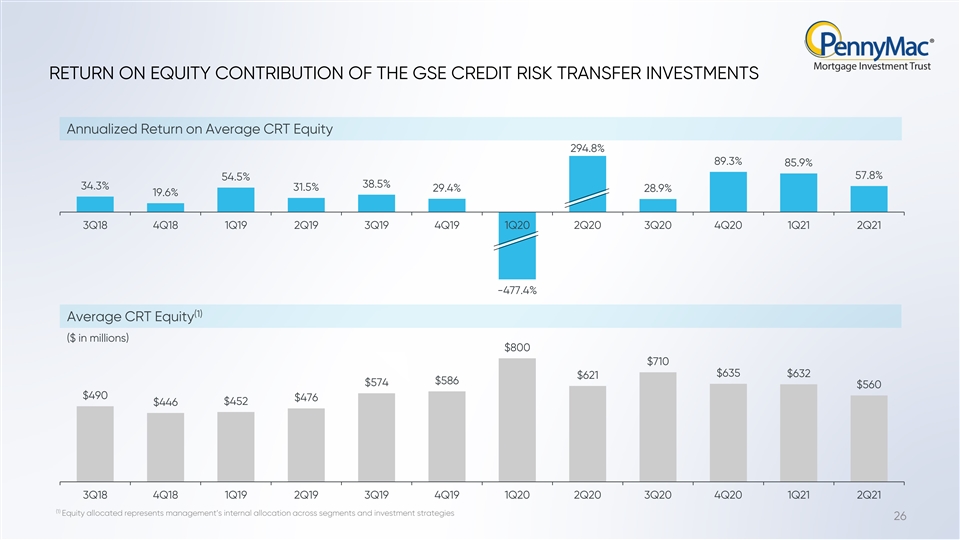
RETURN ON EQUITY CONTRIBUTION OF THE GSE CREDIT RISK TRANSFER
INVESTMENTS Annualized Return on Average CRT Equity 294.8% 89.3% 85.9% 57.8% 54.5% 38.5% 34.3% 31.5% 29.4% 28.9% 19.6% 3Q18 4Q18 1Q19 2Q19 3Q19 4Q19 1Q20 2Q20 3Q20 4Q20 1Q21 2Q21 -477.4% (1) Average CRT Equity ($ in millions) $800 $710 $635 $632
$621 $586 $574 $560 $490 $476 $452 $446 3Q18 4Q18 1Q19 2Q19 3Q19 4Q19 1Q20 2Q20 3Q20 4Q20 1Q21 2Q21 (1) Equity allocated represents management’s internal allocation across segments and investment strategies 26
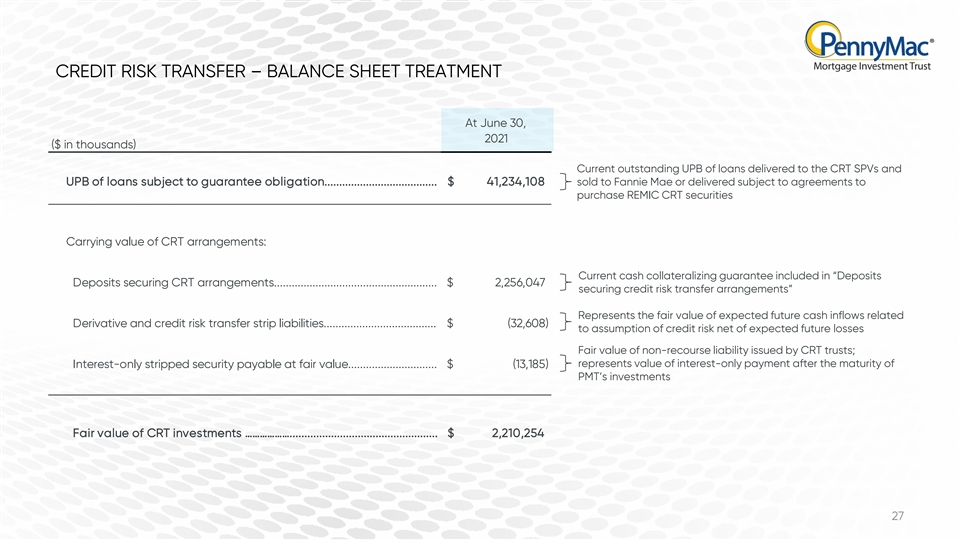
CREDIT RISK TRANSFER – BALANCE SHEET TREATMENT At June 30, 2021
($ in thousands) Current outstanding UPB of loans delivered to the CRT SPVs and UPB of loans subject to guarantee obligation...................................... $ 4 1,234,108 sold to Fannie Mae or delivered subject to agreements to purchase REMIC
CRT securities Carrying value of CRT arrangements: Current cash collateralizing guarantee included in “Deposits Deposits securing CRT arrangements....................................................... $ 2, 256,047 securing credit risk
transfer arrangements” Represents the fair value of expected future cash inflows related Derivative and credit risk transfer strip liabilities...................................... $ (32,608) to assumption of credit risk net of expected future
losses Fair value of non-recourse liability issued by CRT trusts; represents value of interest-only payment after the maturity of Interest-only stripped security payable at fair value.............................. $ ( 13,185) PMT’s investments
Fair value of CRT investments ……………….................................................. $ 2,210,254 27CREDIT RISK TRANSFER – BALANCE SHEET TREATMENT At June 30, 2021 ($ in thousands) Current outstanding UPB
of loans delivered to the CRT SPVs and UPB of loans subject to guarantee obligation...................................... $ 4 1,234,108 sold to Fannie Mae or delivered subject to agreements to purchase REMIC CRT securities Carrying value of CRT
arrangements: Current cash collateralizing guarantee included in “Deposits Deposits securing CRT arrangements....................................................... $ 2, 256,047 securing credit risk transfer arrangements” Represents the
fair value of expected future cash inflows related Derivative and credit risk transfer strip liabilities...................................... $ (32,608) to assumption of credit risk net of expected future losses Fair value of non-recourse liability
issued by CRT trusts; represents value of interest-only payment after the maturity of Interest-only stripped security payable at fair value.............................. $ ( 13,185) PMT’s investments Fair value of CRT investments
……………….................................................. $ 2,210,254 27
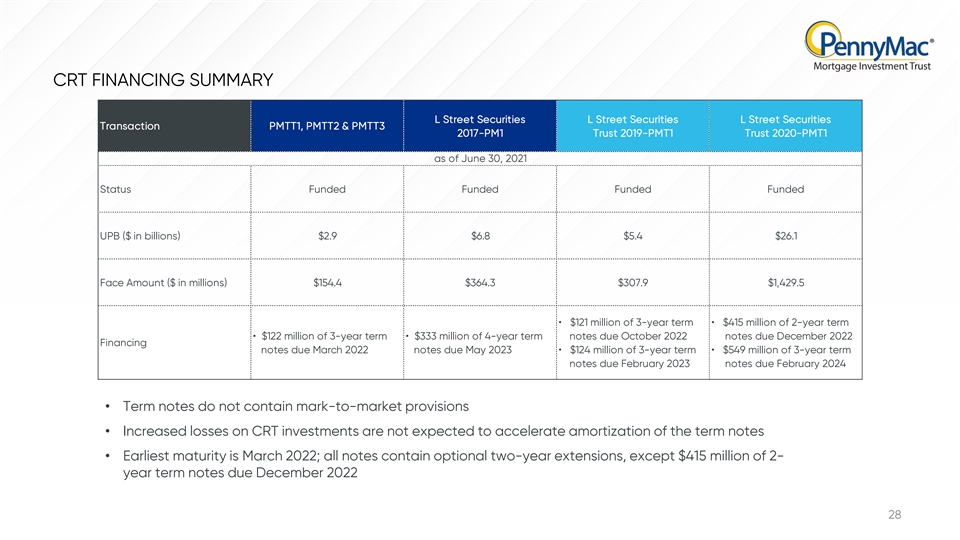
CRT FINANCING SUMMARY L Street Securities L Street Securities L Street
Securities Transaction PMTT1, PMTT2 & PMTT3 2017-PM1 Trust 2019-PMT1 Trust 2020-PMT1 as of June 30, 2021 Status Funded Funded Funded Funded UPB ($ in billions) $2.9 $6.8 $5.4 $26.1 Face Amount ($ in millions) $154.4 $364.3 $307.9 $1,429.5
• $121 million of 3-year term • $415 million of 2-year term • $122 million of 3-year term • $333 million of 4-year term notes due October 2022 notes due December 2022 Financing notes due March 2022 notes due May 2023 •
$124 million of 3-year term • $549 million of 3-year term notes due February 2023 notes due February 2024 • Term notes do not contain mark-to-market provisions • Increased losses on CRT investments are not expected to accelerate
amortization of the term notes • Earliest maturity is March 2022; all notes contain optional two-year extensions, except $415 million of 2- year term notes due December 2022 28CRT FINANCING SUMMARY L Street Securities L Street Securities L
Street Securities Transaction PMTT1, PMTT2 & PMTT3 2017-PM1 Trust 2019-PMT1 Trust 2020-PMT1 as of June 30, 2021 Status Funded Funded Funded Funded UPB ($ in billions) $2.9 $6.8 $5.4 $26.1 Face Amount ($ in millions) $154.4 $364.3 $307.9 $1,429.5
• $121 million of 3-year term • $415 million of 2-year term • $122 million of 3-year term • $333 million of 4-year term notes due October 2022 notes due December 2022 Financing notes due March 2022 notes due May 2023 •
$124 million of 3-year term • $549 million of 3-year term notes due February 2023 notes due February 2024 • Term notes do not contain mark-to-market provisions • Increased losses on CRT investments are not expected to accelerate
amortization of the term notes • Earliest maturity is March 2022; all notes contain optional two-year extensions, except $415 million of 2- year term notes due December 2022 28
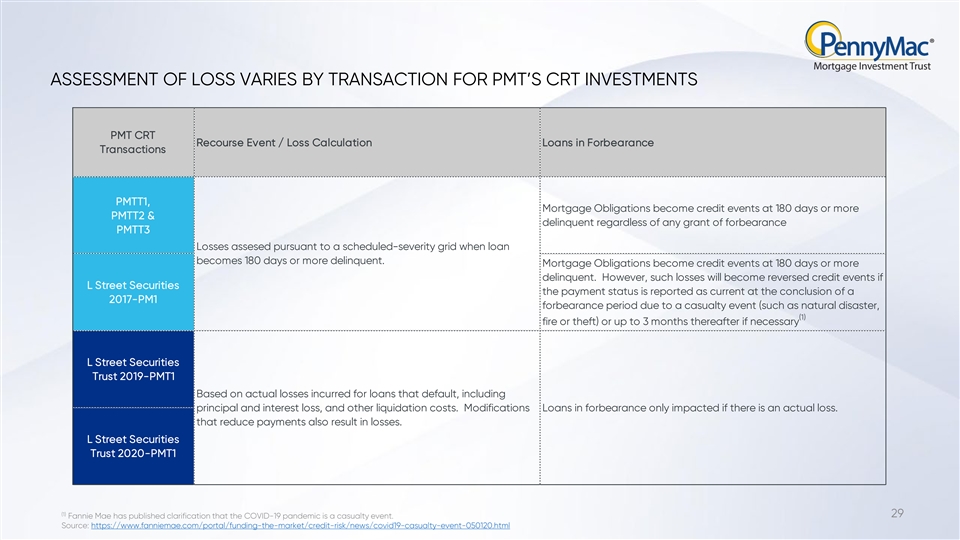
ASSESSMENT OF LOSS VARIES BY TRANSACTION FOR PMT’S CRT
INVESTMENTS PMT CRT Recourse Event / Loss Calculation Loans in Forbearance Transactions PMTT1, Mortgage Obligations become credit events at 180 days or more PMTT2 & delinquent regardless of any grant of forbearance PMTT3 Losses assesed pursuant
to a scheduled-severity grid when loan becomes 180 days or more delinquent. Mortgage Obligations become credit events at 180 days or more delinquent. However, such losses will become reversed credit events if L Street Securities the payment status
is reported as current at the conclusion of a 2017-PM1 forbearance period due to a casualty event (such as natural disaster, (1) fire or theft) or up to 3 months thereafter if necessary L Street Securities Trust 2019-PMT1 Based on actual losses
incurred for loans that default, including principal and interest loss, and other liquidation costs. Modifications Loans in forbearance only impacted if there is an actual loss. that reduce payments also result in losses. L Street Securities Trust
2020-PMT1 (1) 29 Fannie Mae has published clarification that the COVID-19 pandemic is a casualty event. Source: https://www.fanniemae.com/portal/funding-the-market/credit-risk/news/covid19-casualty-event-050120.htmlASSESSMENT OF LOSS VARIES BY
TRANSACTION FOR PMT’S CRT INVESTMENTS PMT CRT Recourse Event / Loss Calculation Loans in Forbearance Transactions PMTT1, Mortgage Obligations become credit events at 180 days or more PMTT2 & delinquent regardless of any grant of
forbearance PMTT3 Losses assesed pursuant to a scheduled-severity grid when loan becomes 180 days or more delinquent. Mortgage Obligations become credit events at 180 days or more delinquent. However, such losses will become reversed credit events
if L Street Securities the payment status is reported as current at the conclusion of a 2017-PM1 forbearance period due to a casualty event (such as natural disaster, (1) fire or theft) or up to 3 months thereafter if necessary L Street Securities
Trust 2019-PMT1 Based on actual losses incurred for loans that default, including principal and interest loss, and other liquidation costs. Modifications Loans in forbearance only impacted if there is an actual loss. that reduce payments also result
in losses. L Street Securities Trust 2020-PMT1 (1) 29 Fannie Mae has published clarification that the COVID-19 pandemic is a casualty event. Source:
https://www.fanniemae.com/portal/funding-the-market/credit-risk/news/covid19-casualty-event-050120.html
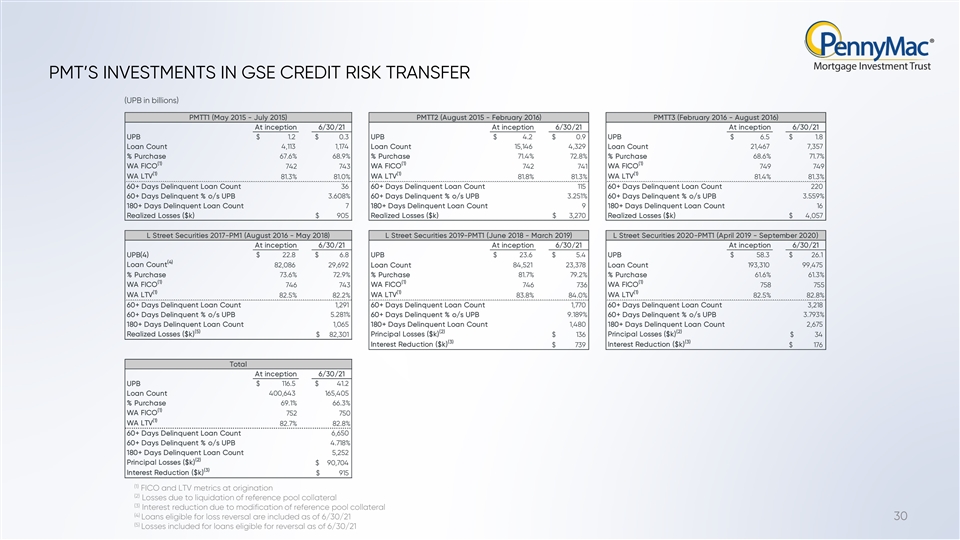
PMT’S INVESTMENTS IN GSE CREDIT RISK TRANSFER (UPB in billions)
PMTT1 (May 2015 - July 2015) PMTT2 (August 2015 - February 2016) PMTT3 (February 2016 - August 2016) At inception 6/30/21 At inception 6/30/21 At inception 6/30/21 UPB $ 1.2 $ 0.3 UPB $ 4 .2 $ 0.9 UPB $ 6.5 $ 1. 8 Loan Count 4,113 1,174 Loan Count
15,146 4,329 Loan Count 21,467 7,357 % Purchase 67.6% 68.9% % Purchase 71.4% 72.8% % Purchase 68.6% 71.7% (1) (1) (1) WA FICO WA FICO WA FICO 742 743 742 741 749 749 (1) (1) (1) WA LTV 81.3% 81.0% WA LTV 81.8% 81.3% WA LTV 81.4% 81.3% 60+ Days
Delinquent Loan Count 36 60+ Days Delinquent Loan Count 115 60+ Days Delinquent Loan Count 220 60+ Days Delinquent % o/s UPB 3.608% 60+ Days Delinquent % o/s UPB 3.251% 60+ Days Delinquent % o/s UPB 3.559% 180+ Days Delinquent Loan Count 7 180+ Days
Delinquent Loan Count 9 180+ Days Delinquent Loan Count 16 Realized Losses ($k) $ 9 05 Realized Losses ($k) $ 3 ,270 Realized Losses ($k) $ 4 ,057 L Street Securities 2017-PM1 (August 2016 - May 2018) L Street Securities 2019-PMT1 (June 2018 - March
2019) L Street Securities 2020-PMT1 (April 2019 - September 2020) At inception 6/30/21 At inception 6/30/21 At inception 6/30/21 UPB(4) $ 2 2.8 $ 6 .8 UPB $ 2 3.6 $ 5.4 UPB $ 5 8.3 $ 26.1 (4) Loan Count 82,086 29,692 Loan Count 84,521 23,378 Loan
Count 1 93,310 99,475 % Purchase 73.6% 72.9% % Purchase 81.7% 79.2% % Purchase 61.6% 61.3% (1) (1) (1) WA FICO 746 743 WA FICO 746 736 WA FICO 758 755 (1) (1) (1) WA LTV WA LTV WA LTV 82.5% 82.2% 83.8% 84.0% 82.5% 82.8% 60+ Days Delinquent Loan
Count 1,291 60+ Days Delinquent Loan Count 1 ,770 60+ Days Delinquent Loan Count 3,218 60+ Days Delinquent % o/s UPB 5.281% 60+ Days Delinquent % o/s UPB 9.189% 60+ Days Delinquent % o/s UPB 3.793% 180+ Days Delinquent Loan Count 1,065 180+ Days
Delinquent Loan Count 1 ,480 180+ Days Delinquent Loan Count 2 ,675 (5) (2) (2) Realized Losses ($k) Principal Losses ($k) Principal Losses ($k) $ 8 2,301 $ 136 $ 3 4 (3) (3) Interest Reduction ($k) $ 7 39 Interest Reduction ($k) $ 17 6 Total At
inception 6/30/21 UPB $ 116.5 $ 41.2 Loan Count 4 00,643 165,405 % Purchase 69.1% 66.3% (1) WA FICO 752 750 (1) WA LTV 82.7% 82.8% 60+ Days Delinquent Loan Count 6,650 60+ Days Delinquent % o/s UPB 4.718% 180+ Days Delinquent Loan Count 5,252 (2)
Principal Losses ($k) $ 9 0,704 (3) Interest Reduction ($k) $ 9 15 (1) FICO and LTV metrics at origination (2) Losses due to liquidation of reference pool collateral (3) Interest reduction due to modification of reference pool collateral (4) Loans
eligible for loss reversal are included as of 6/30/21 30 (5) Losses included for loans eligible for reversal as of 6/30/21PMT’S INVESTMENTS IN GSE CREDIT RISK TRANSFER (UPB in billions) PMTT1 (May 2015 - July 2015) PMTT2 (August 2015 -
February 2016) PMTT3 (February 2016 - August 2016) At inception 6/30/21 At inception 6/30/21 At inception 6/30/21 UPB $ 1.2 $ 0.3 UPB $ 4 .2 $ 0.9 UPB $ 6.5 $ 1. 8 Loan Count 4,113 1,174 Loan Count 15,146 4,329 Loan Count 21,467 7,357 % Purchase
67.6% 68.9% % Purchase 71.4% 72.8% % Purchase 68.6% 71.7% (1) (1) (1) WA FICO WA FICO WA FICO 742 743 742 741 749 749 (1) (1) (1) WA LTV 81.3% 81.0% WA LTV 81.8% 81.3% WA LTV 81.4% 81.3% 60+ Days Delinquent Loan Count 36 60+ Days Delinquent Loan
Count 115 60+ Days Delinquent Loan Count 220 60+ Days Delinquent % o/s UPB 3.608% 60+ Days Delinquent % o/s UPB 3.251% 60+ Days Delinquent % o/s UPB 3.559% 180+ Days Delinquent Loan Count 7 180+ Days Delinquent Loan Count 9 180+ Days Delinquent Loan
Count 16 Realized Losses ($k) $ 9 05 Realized Losses ($k) $ 3 ,270 Realized Losses ($k) $ 4 ,057 L Street Securities 2017-PM1 (August 2016 - May 2018) L Street Securities 2019-PMT1 (June 2018 - March 2019) L Street Securities 2020-PMT1 (April 2019 -
September 2020) At inception 6/30/21 At inception 6/30/21 At inception 6/30/21 UPB(4) $ 2 2.8 $ 6 .8 UPB $ 2 3.6 $ 5.4 UPB $ 5 8.3 $ 26.1 (4) Loan Count 82,086 29,692 Loan Count 84,521 23,378 Loan Count 1 93,310 99,475 % Purchase 73.6% 72.9% %
Purchase 81.7% 79.2% % Purchase 61.6% 61.3% (1) (1) (1) WA FICO 746 743 WA FICO 746 736 WA FICO 758 755 (1) (1) (1) WA LTV WA LTV WA LTV 82.5% 82.2% 83.8% 84.0% 82.5% 82.8% 60+ Days Delinquent Loan Count 1,291 60+ Days Delinquent Loan Count 1 ,770
60+ Days Delinquent Loan Count 3,218 60+ Days Delinquent % o/s UPB 5.281% 60+ Days Delinquent % o/s UPB 9.189% 60+ Days Delinquent % o/s UPB 3.793% 180+ Days Delinquent Loan Count 1,065 180+ Days Delinquent Loan Count 1 ,480 180+ Days Delinquent
Loan Count 2 ,675 (5) (2) (2) Realized Losses ($k) Principal Losses ($k) Principal Losses ($k) $ 8 2,301 $ 136 $ 3 4 (3) (3) Interest Reduction ($k) $ 7 39 Interest Reduction ($k) $ 17 6 Total At inception 6/30/21 UPB $ 116.5 $ 41.2 Loan Count 4
00,643 165,405 % Purchase 69.1% 66.3% (1) WA FICO 752 750 (1) WA LTV 82.7% 82.8% 60+ Days Delinquent Loan Count 6,650 60+ Days Delinquent % o/s UPB 4.718% 180+ Days Delinquent Loan Count 5,252 (2) Principal Losses ($k) $ 9 0,704 (3) Interest
Reduction ($k) $ 9 15 (1) FICO and LTV metrics at origination (2) Losses due to liquidation of reference pool collateral (3) Interest reduction due to modification of reference pool collateral (4) Loans eligible for loss reversal are included as of
6/30/21 30 (5) Losses included for loans eligible for reversal as of 6/30/21
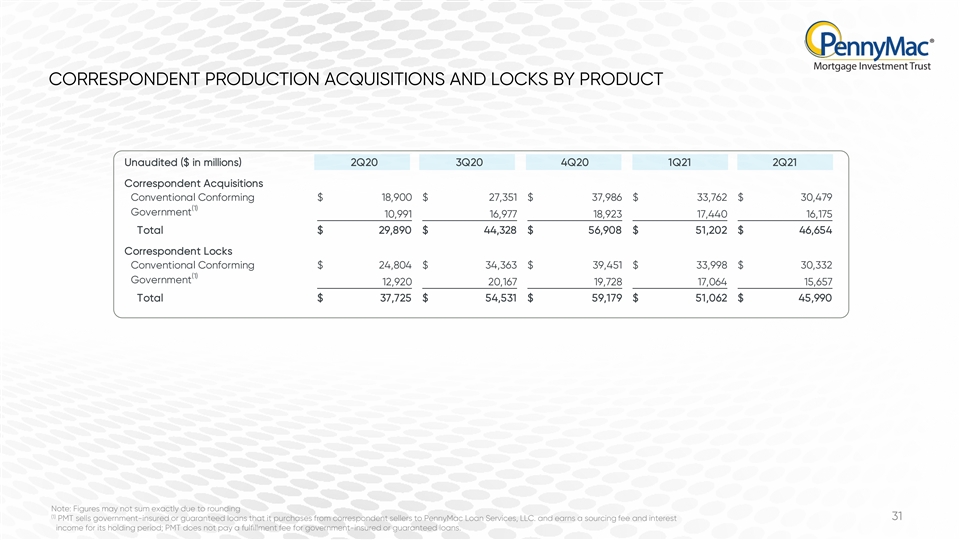
CORRESPONDENT PRODUCTION ACQUISITIONS AND LOCKS BY PRODUCT Unaudited ($
in millions) 2Q20 3Q20 4Q20 1Q21 2Q21 Correspondent Acquisitions Conventional Conforming $ 1 8,900 $ 27,351 $ 37 ,986 $ 33, 762 $ 30,479 (1) Government 1 0,991 16,977 18,923 17,440 16,175 Total $ 29,890 $ 44,328 $ 56,908 $ 51,202 $ 46,654
Correspondent Locks Conventional Conforming $ 2 4,804 $ 34,363 $ 39,451 $ 33,998 $ 30,332 (1) Government 12,920 20,167 19,728 17,064 15,657 Total $ 37,725 $ 54,531 $ 59,179 $ 51,062 $ 45,990 Note: Figures may not sum exactly due to rounding (1) 31
PMT sells government-insured or guaranteed loans that it purchases from correspondent sellers to PennyMac Loan Services, LLC. and earns a sourcing fee and interest income for its holding period; PMT does not pay a fulfillment fee for
government-insured or guaranteed loans.CORRESPONDENT PRODUCTION ACQUISITIONS AND LOCKS BY PRODUCT Unaudited ($ in millions) 2Q20 3Q20 4Q20 1Q21 2Q21 Correspondent Acquisitions Conventional Conforming $ 1 8,900 $ 27,351 $ 37 ,986 $ 33, 762 $ 30,479
(1) Government 1 0,991 16,977 18,923 17,440 16,175 Total $ 29,890 $ 44,328 $ 56,908 $ 51,202 $ 46,654 Correspondent Locks Conventional Conforming $ 2 4,804 $ 34,363 $ 39,451 $ 33,998 $ 30,332 (1) Government 12,920 20,167 19,728 17,064 15,657 Total $
37,725 $ 54,531 $ 59,179 $ 51,062 $ 45,990 Note: Figures may not sum exactly due to rounding (1) 31 PMT sells government-insured or guaranteed loans that it purchases from correspondent sellers to PennyMac Loan Services, LLC. and earns a sourcing
fee and interest income for its holding period; PMT does not pay a fulfillment fee for government-insured or guaranteed loans.