pmt-8k_20200806.htm
false 0001464423 0001464423 2020-08-06 2020-08-06 0001464423 us-gaap:CommonStockMember 2020-08-06 2020-08-06 0001464423 pmt:SeriesAAndBPreferredStockMember 2020-08-06 2020-08-06 0001464423 us-gaap:SeriesBPreferredStockMember 2020-08-06 2020-08-06


UNITED STATES

SECURITIES AND EXCHANGE COMMISSION

WASHINGTON, D.C. 20549


FORM 8-K


CURRENT REPORT

Pursuant to Section 13 or 15(d) of the Securities Exchange Act of 1934

Date of Report (Date of earliest event reported): August 6, 2020


PennyMac Mortgage Investment Trust

(Exact name of registrant as specified in its charter)


Maryland

001-34416

27-0186273

(State or Other Jurisdiction

of Incorporation)

(Commission File Number)

(IRS Employer

Identification No.)


3043 Townsgate Road

Westlake Village, California


91361

(Address of Principal Executive Offices)


(Zip Code)

Registrant’s Telephone Number, Including Area Code: (818) 224-7442

Not Applicable

(Former name or former address, if changed since last report)


Check the appropriate box below if the Form 8-K filing is intended to simultaneously satisfy the filing obligation of the registrant under any of the following provisions:


Written communications pursuant to Rule 425 under the Securities Act (17 CFR 230.425)

Soliciting material pursuant to Rule 14a-12 under the Exchange Act (17 CFR 240.14a-12)

Pre-commencement communications pursuant to Rule 14d-2(b) under the Exchange Act (17 CFR 240.14d-2(b))

Pre-commencement communications pursuant to Rule 13e-4(c) under the Exchange Act (17 CFR 240.13e-4(c))

Securities registered pursuant to Section 12(b) of the Act:


Title of each class


Trading

Symbol(s)


Name of each exchange on which registered

Common Shares of Beneficial Interest, $0.01 par value


PMT


New York Stock Exchange

8.125% Series A Cumulative Redeemable
Preferred Shares of Beneficial Interest, $0.01 par value


PMT/PA


New York Stock Exchange

8.00% Series B Cumulative Redeemable
Preferred Shares of Beneficial Interest, $0.01 par value


PMT/PB


New York Stock Exchange

Indicate by check mark whether the registrant is an emerging growth company as defined in Rule 405 of the Securities Act of 1933 (§ 230.405 of this chapter) or Rule 12b-2 of the Securities Exchange Act of 1934 (§ 240.12b-2 of this chapter).

Emerging growth company 

If an emerging growth company, indicate by check mark if the registrant has elected not to use the extended transition period for complying with any new or revised financial accounting standards provided pursuant to Section 13(a) of the Exchange Act. 


Item 2.02

Results of Operations and Financial Condition.

On August 6, 2020, PennyMac Mortgage Investment Trust (the “Company”) issued a press release announcing its financial results for the fiscal quarter ended June 30, 2020.  A copy of the press release and the slide presentation used in connection with the Company’s recorded presentation of financial results were made available on August 6, 2020 and are furnished as Exhibits 99.1 and Exhibit 99.2, respectively.

The information in Item 2.02 of this report, including the exhibits hereto, shall not be deemed “filed” for purposes of Section 18 of the Securities Exchange Act of 1934, or otherwise subject to the liabilities of Section 18, nor shall it be deemed incorporated by reference into any disclosure document relating to the Company, except to the extent, if any, expressly set forth by specific reference in such filing.

Item 9.01

Financial Statements and Exhibits.

(d)  Exhibits.


Exhibit No.

Description


99.1

Press Release, dated August 6, 2020, issued by PennyMac Mortgage Investment Trust pertaining to its financial results for the fiscal quarter ended June 30, 2020.


99.2

Slide Presentation for use beginning on August 6, 2020 in connection with a recorded presentation of financial results for the fiscal quarter ended June 30, 2020.


104

Cover Page Interactive Data File (embedded within the Inline XBRL document)


1


SIGNATURES

Pursuant to the requirements of the Securities Exchange Act of 1934, the registrant has duly caused this report to be signed on its behalf by the undersigned thereunto duly authorized.


PENNYMAC MORTGAGE INVESTMENT TRUST


Dated:  August 6, 2020

/s/ Andrew S. Chang


Andrew S. Chang

Senior Managing Director and Chief Financial Officer


2

Exhibit 99.1


Media


Investors

Janis Allen


Isaac Garden

(805) 330-4899


(818) 224-7028


PennyMac Mortgage Investment Trust Reports

Second Quarter 2020 Results

Westlake Village, CA, August 6, 2020 – PennyMac Mortgage Investment Trust (NYSE: PMT) today reported net income attributable to common shareholders of $458.4 million, or $4.51 per common share on a diluted basis for the second quarter of 2020, on net investment income of $558.3 million. PMT previously announced a cash dividend for the second quarter of 2020 of $0.40 per common share of beneficial interest, which was declared on June 19, 2020 and paid on July 30, 2020 to common shareholders of record as of July 15, 2020.

Second Quarter 2020 Highlights

Financial results:


Net income attributable to common shareholders of $458.4 million, up from a net loss attributable to common shareholders of $600.9 million in the prior quarter


o

Driven by record Correspondent Production segment results and partial recovery in the fair value of government-sponsored enterprised (GSE) credit risk transfer (CRT) investments from depressed levels at March 31, 2020 as a result of market dislocations related to COVID-19


Partially offset by fair value losses on mortgage servicing rights (MSR) as a result of higher than anticipated prepayments during the quarter and expectations for higher prepayments in the future driven by lower rates, and losses on interest rate hedges driven by elevated hedge costs and fair value losses on options used to hedge MSRs as volatility decreased by June 30, 2020


Book value per common share of $19.39 at June 30, 2020, up from $15.16 at March 31, 2020

Other investment and financing highlights:


Investment activity driven by elevated correspondent production volumes


o

Conventional correspondent loan production totaled $18.9 billion in unpaid principal balance (UPB), up 17 percent from the prior quarter and up 76 percent from the second quarter of 2019


o

Added $203 million of new MSR investments


o

CRT deliveries totaled $1.8 billion in UPB resulting in a firm commitment to purchase $48 million of new CRT securities


Repurchased approximately 566,000 common shares of PMT at a weighted average price of $13.36, or a total cost of $7.6 million


“PMT delivered record earnings in the second quarter, rebounding from the significant first quarter loss, which drove a substantial recovery in book value from the prior quarter,” said President and CEO David Spector. “As a result of our manager’s commitment to risk management and operational discipline, PMT not only protected the value of its assets in a volatile year-to-date period, but was able to continually acquire, fund and settle loans throughout the crisis as others retreated. This led to record profitability in the Correspondent Production segment. Additionally, PMT’s CRT investments recorded substantial fair value gains as they benefited from the significant recovery in the value of risk assets and elevated prepayments throughout the quarter.  At the same time, our manager and service provider, PFSI, continues to closely work with borrowers affected by the pandemic to help them successfully refinance or modify their loans to emerge from forbearance plans. Looking ahead, we project book value growth as we expect the earnings potential of PMT’s investment strategies to exceed the current dividend level.”


The following table presents the contributions of PMT’s segments, consisting of Credit Sensitive Strategies, Interest Rate Sensitive Strategies, Correspondent Production, and Corporate:


Quarter ended June 30, 2020


Credit sensitive stratgies


Interest rate sensitive strategies


Correspondent production


Corporate

Activities


Consolidated


(in thousands)


Net investment income:


Net gain on investments:


CRT investments


$

488,198


$

-


$

-


$

-


$

488,198


Loans at fair value


(121

)


-


-


-


(121

)

Loans held by variable interest entity net of

   asset-backed secured financing


-


633


-


-


633


Mortgage-backed securities


(2,564

)


19,628


-


-


17,064


Hedging derivatives


(13,245

)


(3,494

)


-


-


(16,739

)

Excess servicing spread investments


-


(101

)


-


-


(101

)


472,268


16,666


-


-


488,934


Net loan servicing fees


-


(102,660

)


-


-


(102,660

)

Net gain on loans acquired for sale


(7,573

)


-


169,787


-


162,214


Net interest income (expense):


Interest income


1,133


23,585


15,957


137


40,812


Interest expense


8,796


38,093


13,502


657


61,048


(7,663

)


(14,508

)


2,455


(520

)


(20,236

)

Other income


3,014


-


25,318


1,737


30,069


460,046


(100,502

)


197,560


1,217


558,321


Expenses:


Loan fulfillment and servicing fees

   payable to PennyMac Financial Services, Inc.


240


15,294


52,814


-


68,348


Management fees payable to

   PennyMac Financial Services, Inc.


-


-


-


8,288


8,288


Other


1,014


1,691


5,168


5,749


13,622


$

1,254


$

16,985


$

57,982


$

14,037


$

90,258


Pretax income (loss)


$

458,792


$

(117,487

)


$

139,578


$

(12,820

)


$

468,063


Credit Sensitive Strategies Segment

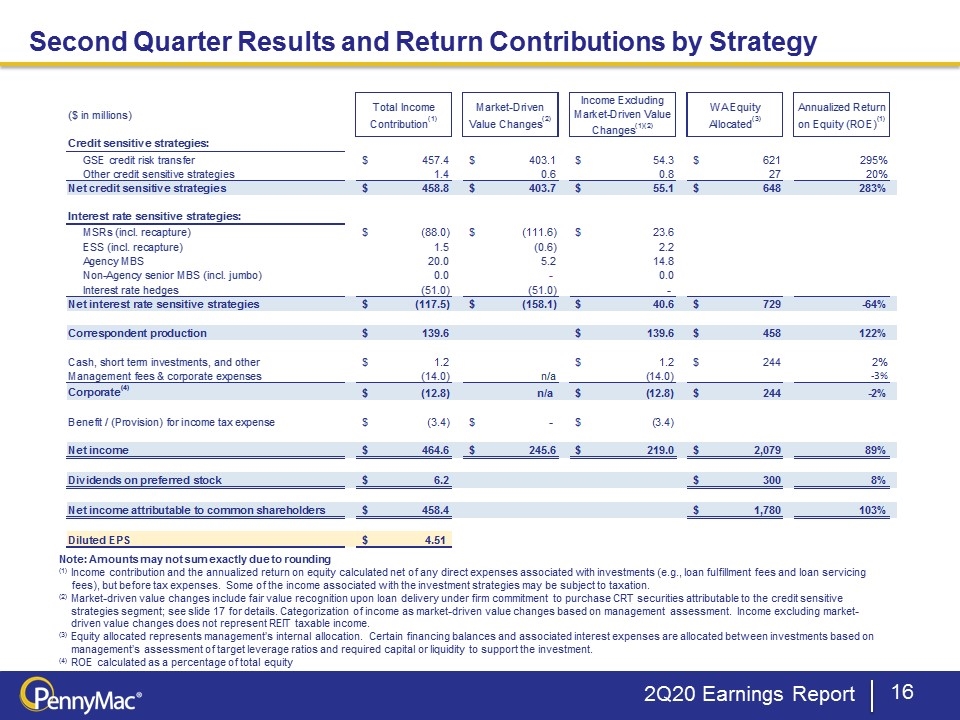
The Credit Sensitive Strategies segment primarily includes results from CRT, and also includes distressed loans and non-Agency subordinated bonds.  Pretax income for the segment was $458.8 million on net investment income of $460.0 million, versus pretax loss of $960.5 million on a net investment loss of $959.3 million in the prior quarter.

Net gain on investments in the segment was $472.3 million, versus a net loss on investments of $919.1 million in the prior quarter.  


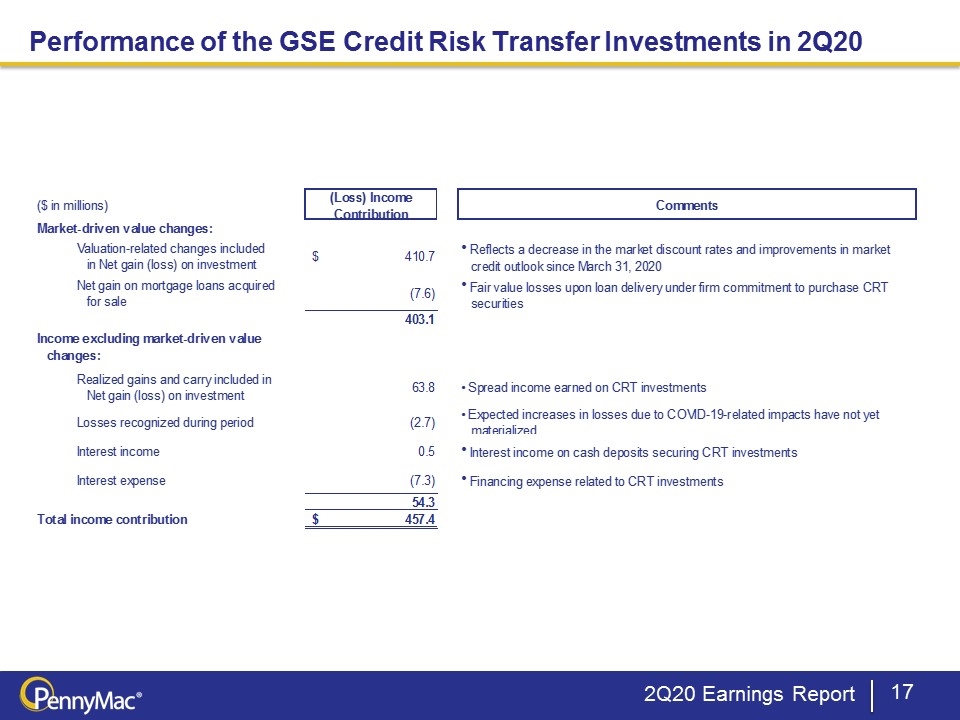
Net gain on CRT investments for the quarter was $488.2 million, versus a net loss of $979.8 million in the prior quarter, and included $410.7 million in valuation-related gains reflecting a decrease in market discount rates and improvement in market credit outlook since the end of the prior quarter.  Net gain on CRT investments also included $63.8 million in realized gains and carry, up from $55.9 million in the prior quarter.  Recognized losses were $2.7 million, as the expected increases in realized losses due to impacts related to COVID-19 have yet to materialize.

In alignment with the Agencies’ wind down of front-end lender risk share transactions, CRT deliveries totaled $1.8 billion in UPB for the second quarter.  

The Credit Sensitive Strategies segment also recorded a net loss on loans acquired for sale of $7.6 million versus $32.3 million in the prior quarter.  These amounts represent the recognition of the fair value of the firm commitment to acquire CRT securities for deliveries during the second quarter.

Net interest expense for the segment totaled $7.7 million, down from $8.0 million in the prior quarter.  Interest income totaled $1.1 million, down from $6.6 million in the prior quarter and interest expense totaled $8.8 million, down from $14.6 million in the prior quarter, driven primarily by lower short-term interest rates.

Segment expenses were $1.3 million, up slightly from the prior quarter.

Interest Rate Sensitive Strategies Segment

The Interest Rate Sensitive Strategies segment includes results from investments in MSRs, excess servicing spread (ESS), Agency mortgage-backed securities (MBS), non-Agency senior MBS and interest rate hedges.  Pretax loss for the segment was $117.5 million on net investment loss of $100.5 million, compared to pretax income of $324.8 million on revenues of $340.2 million in the prior quarter.  The segment includes investments that typically have offsetting fair value exposures to changes in interest rates.  For example, in a period with decreasing interest rates, MSRs and ESS typically decrease in fair value whereas Agency MBS typically increase in fair value.


The results in the Interest Rate Sensitive Strategies segment consist of net gains and losses on investments, net interest income and net loan servicing fees, as well as associated expenses.

Net gain on investments for the segment was $16.7 million, and consisted of $19.6 million of gains on MBS and $0.6 million of gains on loans held by a variable interest entity net of asset-backed secured financing, partially offset by $3.5 million of losses in the fair value of hedging derivatives, and $0.1 million of losses in the fair value of ESS investments.

Net loan servicing fees resulted in a loss of $102.7 million, compared to gains of $244.6 million in the prior quarter.  Net loan servicing fees included servicing fees of $101.8 million, up 8 percent from the prior quarter primarily driven by a larger portfolio, and $11.9 million in other fees, reduced by $59.2 million in realization of MSR cash flows.  Net loan servicing fees also included $111.6 million in fair value losses of MSRs, $50.7 million in related hedging losses, and $5.1 million of MSR recapture income.  PMT’s hedging activities are intended to manage the Company’s net exposure across all interest rate sensitive strategies, which include MSRs, ESS and MBS.  

The following schedule details net loan servicing fees:


Quarter ended


June 30, 2020


March 31, 2020


June 30, 2019


(in thousands)


From non-affiliates:


Servicing fees(1)


$

101,823


$

94,469


$

66,919


Other fees


11,887


7,191


6,408


Effect of MSRs:


Carried at fair value—change in fair value


Realization of cashflows


(59,199

)


(63,955

)


(46,580

)

Other


(111,649

)


(563,246

)


(136,887

)


(170,848

)


(627,201

)


(183,467

)

Loss on sale


-


-


-


Gain on sale


-


-


-


Gains (losses) on hedging derivatives


(50,650

)


767,186


55,536


(221,498

)


139,985


(127,931

)


(107,788

)


241,645


(54,604

)

From PFSI—MSR recapture income


5,128


2,927


1,015


Net loan servicing fees


$

(102,660

)


$

244,572


$

(53,589

)

(1) Includes contractually specified servicing fees


MSR and ESS valuation losses were primarily driven by expectations for increased prepayment activity in the future related to lower interest rates and higher-than-modeled actual prepayments during the quarter.  PMT benefited from higher recapture income from PFSI for elevated prepayments during the quarter.  PMT generally benefits from recapture income when the prepayment of a loan underlying PMT’s MSR or ESS results from refinancing by PFSI.

Net interest expense for the segment was $14.5 million, compared to net interest expense of $8.4 million in the prior quarter.  Interest income totaled $23.6 million, down from $33.2 million in the prior quarter, primarily driven by decreased income from custodial deposits due to lower earnings rates.  Interest expense totaled $38.1 million, down from $41.6 million in the prior quarter, primarily driven by reduced financing expenses related to a smaller MBS portfolio.

Segment expenses were $17.0 million, up 10 percent from the prior quarter.

Correspondent Production Segment

PMT acquires newly originated loans from correspondent sellers and typically sells or securitizes the loans, resulting in current-period income and additions to its investments in MSRs and CRT related to a portion of its production.  PMT’s Correspondent Production segment generated record pretax income of $139.6 million, up from $65.3 million in the prior quarter.  

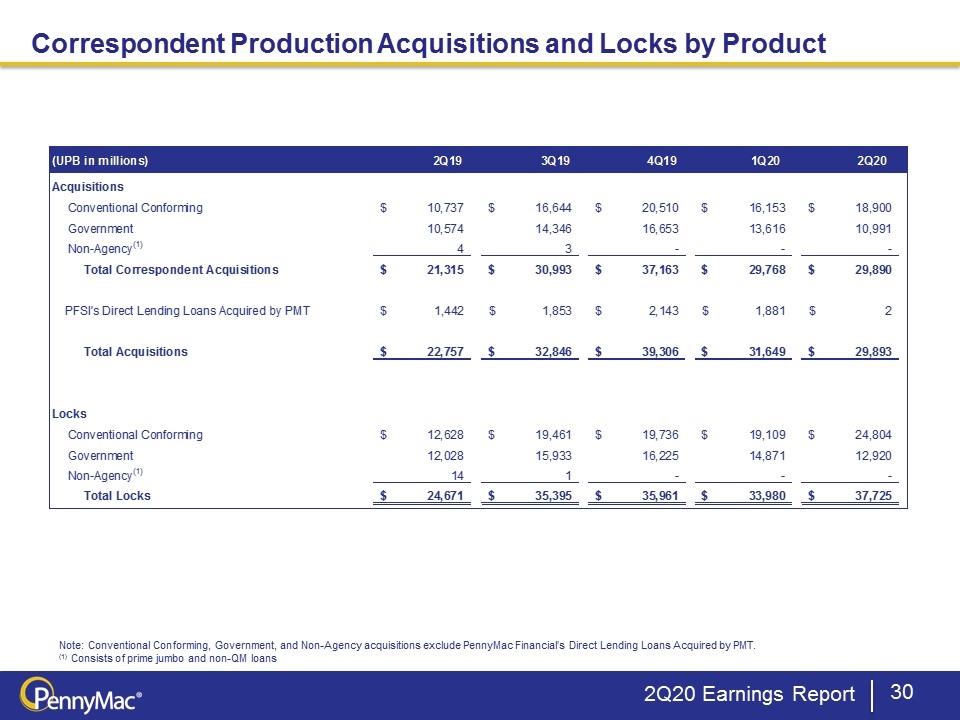
Through its correspondent production activities, PMT acquired $29.9 billion in UPB of loans originated by nonaffiliates, up slightly from the prior quarter and up 40 percent from the second quarter of 2019.  Of total correspondent acquisitions, conventional conforming and jumbo acquisitions from nonaffiliates totaled $18.9 billion, and government-insured or guaranteed acquisitions totaled $11.0 billion, compared to $16.2 billion and $13.6 billion, respectively, in the prior quarter.  Interest rate lock commitments on conventional loans were a record $24.8 billion, up from $19.1 billion in the prior quarter and $12.6 billion in the second quarter of 2019.

Segment revenues were $197.6 million, a 76 percent increase from the prior quarter and included net gain on loans acquired for sale of $169.8 million, other income of $25.3 million, which primarily consists of volume-based origination fees, and net interest income of $2.5 million.  Net gain on loans acquired for sale in the quarter increased by $88.7 million from the prior quarter,


driven by higher conventional correspondent margins early in the second quarter, which have returned to normalized levels faster than originally anticipated.  Interest income was $16.0 million, down from $31.4 million in the prior quarter and interest expense was $13.5 million, down from $24.3 million in the prior quarter driven by lower short-term interest rates.

Segment expenses were $58.0 million, up from $46.9 million in the prior quarter driven by the increase in production volumes and an increase in the weighted average fulfillment fee during the quarter. The weighted average fulfillment fee rate in the second quarter was 28 basis points, up from 26 basis points in the prior quarter.

Corporate Segment

The Corporate segment includes interest income from cash and short-term investments, management fees, and corporate expenses.

Segment net investment income was $1.2 million, up from $0.4 million in the prior quarter.

Management fees were $8.3 million, down 8 percent from the prior quarter primarily driven by the decrease in average shareholders’ equity versus the prior quarter.

Other segment expenses were $5.7 million, up from $5.4 million in the prior quarter.

Taxes

PMT recorded income tax expense of $3.4 million down from $10.2 million in the prior quarter.

***

Management’s slide presentation will be available in the Investor Relations section of the Company’s website at www.pennymac-REIT.com beginning at 1:30 p.m. (Pacific Time) on Thursday, August 6, 2020.


About PennyMac Mortgage Investment Trust

PennyMac Mortgage Investment Trust is a mortgage real estate investment trust (REIT) that invests primarily in residential mortgage loans and mortgage-related assets.  PMT is externally managed by PNMAC Capital Management, LLC, a wholly-owned subsidiary of PennyMac Financial Services, Inc. (NYSE: PFSI).  Additional information about PennyMac Mortgage Investment Trust is available at www.PennyMac-REIT.com.

Forward-Looking Statements

This press release contains forward-looking statements within the meaning of Section 21E of the Securities Exchange Act of 1934, as amended, regarding management’s beliefs, estimates, projections and assumptions with respect to, among other things, the Company’s financial results, future operations, business plans and investment strategies, as well as industry and market conditions, all of which are subject to change. Words like “believe,” “expect,” “anticipate,” “promise,” “plan,” and other expressions or words of similar meanings, as well as future or conditional verbs such as “will,” “would,” “should,” “could,” or “may” are generally intended to identify forward-looking statements. Actual results and operations for any future period may vary materially from those projected herein and from past results discussed herein. Factors which could cause actual results to differ materially from historical results or those anticipated include, but are not limited to: our exposure to risks of loss and disruptions in operations resulting from adverse weather conditions, civil unrest, man-made or natural disasters, climate change and pandemics such as COVID-19; the impact to our CRT agreements of increased borrower requests for forbearance under the CARES Act; changes in the Company’s investment objectives or investment or operational strategies, including any new lines of business or new products and services that may subject it to additional risks; volatility in the Company’s industry, the debt or equity markets, the general economy or the real estate finance and real estate markets specifically, whether the result of market events or otherwise; events or circumstances which undermine confidence in the financial and housing markets or otherwise have a broad impact on financial and housing markets, such as the sudden instability or collapse of large depository institutions or other significant corporations, terrorist attacks, natural or manmade disasters, or threatened or actual armed conflicts; changes in general business, economic, market, employment and domestic and international political conditions, or in consumer confidence and spending habits from those expected; declines in real estate or significant changes in U.S. housing prices or activity in the U.S. housing market; the availability of, and level of competition for, attractive risk-adjusted investment opportunities in mortgage loans and mortgage-related assets that satisfy the Company’s investment objectives; the inherent difficulty in winning bids to acquire mortgage loans, and the Company’s success in doing so; the  concentration of credit risks to which the Company is exposed; the degree and nature of the Company’s competition; the Company’s dependence on its manager and servicer, potential conflicts of interest with such entities and their affiliates, and the performance of such entities; changes in personnel and lack of availability of qualified personnel at its manager, servicer or their affiliates; the availability, terms and deployment of short-term and long-term capital; the adequacy of the Company’s cash reserves and working capital; the Company’s ability to


maintain the desired relationship between its financing and the interest rates and maturities of its assets; the timing and amount of cash flows, if any, from the Company’s investments; unanticipated increases or volatility in financing and other costs, including a rise in interest rates; the performance, financial condition and liquidity of borrowers; the ability of the Company’s servicer, which also provides the Company with fulfillment services, to approve and monitor correspondent sellers and underwrite loans to investor standards; incomplete or inaccurate information or documentation provided by customers or counterparties, or adverse changes in the financial condition of the Company’s customers and counterparties; the Company’s indemnification and repurchase obligations in connection with mortgage loans it purchases and later sells or securitizes; the quality and enforceability of the collateral documentation evidencing the Company’s ownership and rights in the assets in which it invests; increased rates of delinquency, default and/or decreased recovery rates on the Company’s investments; the performance of mortgage loans underlying mortgage-backed securities in which the Company retains credit risk; the Company’s ability to foreclose on its investments in a timely manner or at all; increased prepayments of the mortgages and other loans underlying the Company’s mortgage-backed securities or relating to the Company’s mortgage servicing rights, excess servicing spread and other investments; the degree to which the Company’s hedging strategies may or may not protect it from interest rate volatility; the effect of the accuracy of or changes in the estimates the Company makes about uncertainties, contingencies and asset and liability valuations when measuring and reporting upon the Company’s financial condition and results of operations; the Company’s ability to maintain appropriate internal control over financial reporting; technologies for loans and the Company’s ability to mitigate security risks and cyber intrusions; the Company’s ability to obtain and/or maintain licenses and other approvals in those jurisdictions where required to conduct its business; the Company’s ability to detect misconduct and fraud; the Company’s ability to comply with various federal, state and local laws and regulations that govern its business; developments in the secondary markets for the Company’s mortgage loan products; legislative and regulatory changes that impact the mortgage loan industry or housing market; changes in regulations or the occurrence of other events that impact the business, operations or prospects of government agencies such as the Government National Mortgage Association, the Federal Housing Administration or the Veterans Administration, the U.S. Department of Agriculture, or government-sponsored entities such as the Federal National Mortgage Association or the Federal Home Loan Mortgage Corporation, or such changes that increase the cost of doing business with such entities; the Dodd-Frank Wall Street Reform and Consumer Protection Act and its implementing regulations and regulatory agencies, and any other legislative and regulatory changes that impact the business, operations or governance of mortgage lenders and/or publicly-traded companies; the Consumer Financial Protection Bureau and its issued and future rules and the enforcement thereof; changes in government support of homeownership; changes in government or government-sponsored home affordability programs; limitations imposed on the Company’s business and its ability to satisfy complex rules for it to qualify as a REIT for U.S. federal income tax purposes and qualify for an exclusion from the Investment Company Act of 1940 and the ability of certain of the Company’s subsidiaries to qualify as REITs or as taxable REIT subsidiaries for U.S. federal income tax purposes, as applicable, and the Company’s ability and the ability of its subsidiaries to operate effectively within the limitations imposed by these rules; changes in governmental regulations, accounting treatment, tax rates and similar matters (including changes to laws governing the taxation of REITs, or the exclusions from registration as an investment company); the Company’s ability to


make distributions to its shareholders in the future; the Company’s failure to deal appropriately with issues that may give rise to reputational risk; and the Company’s organizational structure and certain requirements in its charter documents. You should not place undue reliance on any forward-looking statement and should consider all of the uncertainties and risks described above, as well as those more fully discussed in reports and other documents filed by the Company with the Securities and Exchange Commission from time to time. The Company undertakes no obligation to publicly update or revise any forward-looking statements or any other information contained herein, and the statements made in this press release are current as of the date of this release only.


PENNYMAC MORTGAGE INVESTMENT TRUST AND SUBSIDIARIES

CONSOLIDATED BALANCE SHEETS (UNAUDITED)


June 30, 2020


March 31, 2020


June 30, 2019


(in thousands except share amounts)


ASSETS


Cash


$

346,007


$

1,099,380


$

77,676


Short-term investments


273,592


137,960


76,731


Mortgage-backed securities at fair value


2,612,986


3,947,420


2,600,357


Loans acquired for sale at fair value


2,179,962


2,856,042


2,477,267


Loans at fair value


230,660


251,423


358,570


Excess servicing spread received from

   PennyMac Financial Services, Inc.


151,206


157,109


194,156


Derivative and credit risk transfer strip assets


114,346


173,310


258,782


Firm commitment to purchase credit risk transfer

   securities at fair value


-


-


15,581


Real estate acquired in settlement of loans


43,559


50,838


97,808


Deposits securing credit risk transfer arrangements


1,666,449


1,855,936


2,060,612


Mortgage servicing rights


1,189,605


1,157,326


1,126,427


Servicing advances


38,254


39,030


35,143


Due from PennyMac Financial Services, Inc.


3,458


3,512


1,485


Other


233,635


189,202


85,194


     Total assets


$

9,083,719


$

11,918,488


$

9,465,789


LIABILITIES


Assets sold under agreements to repurchase


3,981,761


6,348,192


5,364,551


Mortgage loan participation and sale agreements


93,117


-


-


Exchangeable senior notes


195,333


444,525


248,958


Notes payable secured by credit risk transfer

   and mortgage servicing assets


1,810,845


1,967,526


1,370,074


Asset-backed financing of a variable interest entity at fair value


212,170


232,565


270,077


Interest-only security payable at fair value


14,981


14,134


26,356


Assets sold to PennyMac Financial Services, Inc.

   under agreement to repurchase


90,101


99,766


118,716


Derivative liabilities


140,201


462,639


22,454


Firm commitment to purchase credit risk transfer

   securities at fair value


191,193


409,649


-


Accounts payable and accrued liabilities


48,735


40,534


36,373


Due to PennyMac Financial Services, Inc.


44,329


56,223


34,695


Income taxes payable


15,451


12,067


21,873


Liability for losses under representations and warranties


10,225


7,300


7,728


     Total liabilities


6,848,442


10,095,120


7,521,855


SHAREHOLDERS' EQUITY


Preferred shares of beneficial interest


299,707


299,707


299,707


Common shares of beneficial interest—authorized, 500,000,000

     common shares of $0.01 par value; issued and outstanding

     99,275,258, 99,841,390, and 78,607,436 common shares,

     respectively


993


998


786


Additional paid-in capital


2,119,577


2,126,264


1,647,186


Accumulated deficit


(185,000

)


(603,601

)


(3,745

)

     Total shareholders' equity


2,235,277


1,823,368


1,943,934


     Total liabilities and shareholders' equity


$

9,083,719


$

11,918,488


$

9,465,789


PENNYMAC MORTGAGE INVESTMENT TRUST AND SUBSIDIARIES

CONSOLIDATED STATEMENTS OF OPERATIONS (UNAUDITED)


For the Quarterly Periods Ended


June 30, 2020


March 31, 2020


June 30, 2019


(in thousands, except per share amounts)


Investment Income (Loss)


Net gain (loss) on investments


$

488,934


$

(815,131

)


$

87,754


Net loan servicing fees:


From nonaffiliates


Contractually specified


106,951


97,396


67,934


Other fees


11,887


7,191


6,408


Servicing fees


118,838


104,587


74,342


Change in fair value of mortgage servicing rights


(170,848

)


(627,201

)


(183,467

)

Hedging results


(50,650

)


767,186


55,536


(102,660

)


244,572


(53,589

)

Net gain on loans acquired for sale:


162,214


48,775


34,244


Loan origination fees


25,208


23,928


17,630


Interest income


40,812


72,123


71,793


Interest expense


61,048


81,068


65,896


Net interest (expense) income


(20,236

)


(8,945

)


5,897


Results of real estate acquired in settlement of loans


2,856


32


2,075


Other


2,005


252


2,390


Net investment income (loss)


558,321


(506,517

)


96,401


Expenses


Earned by PennyMac Financial Services, Inc.:


Loan fulfillment fees


52,815


41,940


29,590


Loan servicing fees


15,533


14,521


11,568


Management fees


8,288


9,055


8,832


Loan origination


4,468


4,249


3,118


Safekeeping


1,905


1,658


1,000


Professional services


1,492


1,496


1,733


Loan collection and liquidation


864


750


1,247


Compensation


1,200


519


1,771


Other


3,693


3,720


4,172


Total expenses


90,258


77,908


63,031


Income (Loss) before provision for (benefit from)

       income taxes


468,063


(584,425

)


33,370


Provision for (benefit from) income taxes


3,443


10,248


(10,863

)

Net income (loss)


464,620


(594,673

)


44,233


Dividends on preferred shares


6,235


6,234


6,234


Net income (loss) attributable to common shareholders


$

458,385


$

(600,907

)


$

37,999


Earnings per share


Basic


$

4.59


$

(5.99

)


$

0.52


Diluted


$

4.51


$

(5.99

)


$

0.50


Weighted average shares outstanding


Basic


99,689


100,245


73,425


Diluted


101,592


100,245


81,892


Dividends declared per common share


$

0.40


$

0.25


$

0.47


Slide 1

PennyMac Mortgage Investment Trust August 6, 2020 Second Quarter 2020 Earnings Report Exhibit 99.2

Slide 2

This presentation contains forward-looking statements within the meaning of Section 21E of the Securities Exchange Act of 1934, as amended, regarding management’s beliefs, estimates, projections and assumptions with respect to, among other things, the Company’s financial results, future operations, business plans and investment strategies, as well as industry and market conditions, all of which are subject to change. Words like “believe,” “expect,” “anticipate,” “promise,” “project,” “plan,” and other expressions or words of similar meanings, as well as future or conditional verbs such as “will,” “would,” “should,” “could,” or “may” are generally intended to identify forward-looking statements. Actual results and operations for any future period may vary materially from those projected herein, from past results discussed herein, or illustrative examples provided herein. These forward-looking statements include, but are not limited to, statements regarding the future impact of COVID-19 on our business, financial operations and our GSE credit risk transfer (CRT) investments, future loan delinquencies and forbearances, future investment returns, projected servicing advances requirements and other business and financial expectations. Factors which could cause actual results to differ materially from historical results or those anticipated include, but are not limited to: our exposure to risks of loss and disruptions in operations resulting from adverse weather conditions, civil unrest, man-made or natural disasters, climate change and pandemics such as COVID-19; the impact to our CRT agreements of increased borrower requests for forbearance under the CARES Act; changes in our investment objectives or investment or operational strategies, including any new lines of business or new products and services that may subject us to additional risks; volatility in our industry, the debt or equity markets, the general economy or the real estate finance and real estate markets specifically, whether the result of market events or otherwise; events or circumstances which undermine confidence in the financial markets or otherwise have a broad impact on financial markets, such as the sudden instability or collapse of large depository institutions or other significant corporations, terrorist attacks, natural or man-made disasters, or threatened or actual armed conflicts; changes in general business, economic, market, employment and political conditions, or in consumer confidence and spending habits from those expected; declines in real estate or significant changes in U.S. housing prices or activity in the U.S. housing market; the availability of, and level of competition for, attractive risk-adjusted investment opportunities in mortgage loans and mortgage-related assets that satisfy our investment objectives; the inherent difficulty in winning bids to acquire mortgage loans, and our success in doing so; the concentration of credit risks to which we are exposed; the degree and nature of our competition; our dependence on our manager and servicer, potential conflicts of interest with such entities and their affiliates, and the performance of such entities; changes in personnel and lack of availability of qualified personnel at our manager, servicer or their affiliates; the availability, terms and deployment of short-term and long-term capital; the adequacy of our cash reserves and working capital; our ability to maintain the desired relationship between our financing and the interest rates and maturities of our assets; the timing and amount of cash flows, if any, from our investments; unanticipated increases or volatility in financing and other costs, including a rise in interest rates; the performance, financial condition and liquidity of borrowers; the ability of our servicer, which also provides us with fulfillment services, to approve and monitor correspondent sellers and underwrite loans to investor standards; incomplete or inaccurate information or documentation provided by customers or counterparties, or adverse changes in the financial condition of our customers and counterparties; our indemnification and repurchase obligations in connection with mortgage loans we purchase and later sell or securitize; the quality and enforceability of the collateral documentation evidencing our ownership and rights in the assets in which we invest; increased rates of delinquency, default and/or decreased recovery rates on our investments; our ability to foreclose on our investments in a timely manner or at all; increased prepayments of the mortgages and other loans underlying our mortgage-backed securities or relating to our mortgage servicing rights , excess servicing spread and other investments; the degree to which our hedging strategies may or may not protect us from interest rate volatility; the effect of the accuracy of or changes in the estimates we make about uncertainties, contingencies and asset and liability valuations when measuring and reporting upon our financial condition and results of income; our failure to maintain appropriate internal controls over financial reporting; technologies for loans and our ability to mitigate security risks and cyber intrusions; our ability to obtain and/or maintain licenses and other approvals in those jurisdictions where required to conduct our business; our ability to detect misconduct and fraud; our ability to comply with various federal, state and local laws and regulations that govern our business; developments in the secondary markets for our mortgage loan products; legislative and regulatory changes that impact the mortgage loan industry or housing market; changes in regulations or the occurrence of other events that impact the business, operations or prospects of government agencies or government-sponsored entities, or such changes that increase the cost of doing business with such entities; the Dodd-Frank Wall Street Reform and Consumer Protection Act and its implementing regulations and regulatory agencies, and any other legislative and regulatory changes that impact the business, operations or governance of mortgage lenders and/or publicly-traded companies; the Consumer Financial Protection Bureau and its issued and future rules and the enforcement thereof; changes in government support of homeownership; changes in government or government-sponsored home affordability programs; limitations imposed on our business and our ability to satisfy complex rules for us to qualify as a real estate investment trust (REIT) for U.S. federal income tax purposes and qualify for an exclusion from the Investment Company Act of 1940 and the ability of certain of our subsidiaries to qualify as REITs or as taxable REIT subsidiaries for U.S. federal income tax purposes, as applicable, and our ability and the ability of our subsidiaries to operate effectively within the limitations imposed by these rules; changes in governmental regulations, accounting treatment, tax rates and similar matters (including changes to laws governing the taxation of REITs, or the exclusions from registration as an investment company); the effect of public opinion on our reputation and our organizational structure and certain requirements in our charter documents.   You should not place undue reliance on any forward-looking statement and should consider all of the uncertainties and risks described above, as well as those more fully discussed in reports and other documents filed by the Company with the Securities and Exchange Commission from time to time. The Company undertakes no obligation to publicly update or revise any forward-looking statements or any other information contained herein, and the statements made in this presentation are current as of the date of this presentation only. Forward-Looking Statements 2Q20 Earnings Report

Slide 3

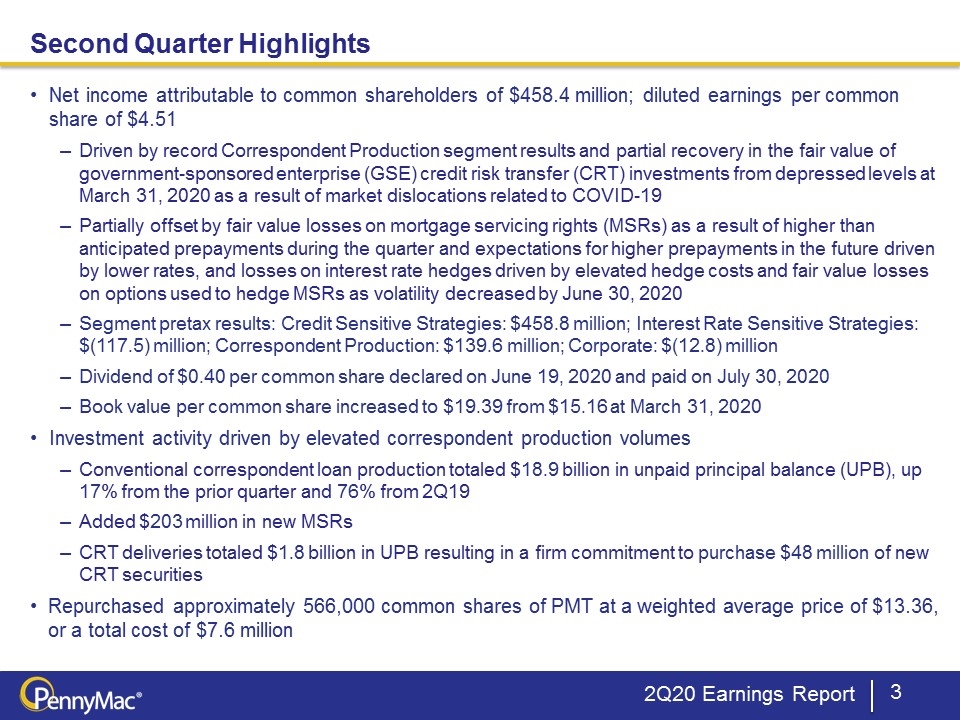
2Q20 Earnings Report Second Quarter Highlights Net income attributable to common shareholders of $458.4 million; diluted earnings per common share of $4.51 Driven by record Correspondent Production segment results and partial recovery in the fair value of government-sponsored enterprise (GSE) credit risk transfer (CRT) investments from depressed levels at March 31, 2020 as a result of market dislocations related to COVID-19 Partially offset by fair value losses on mortgage servicing rights (MSRs) as a result of higher than anticipated prepayments during the quarter and expectations for higher prepayments in the future driven by lower rates, and losses on interest rate hedges driven by elevated hedge costs and fair value losses on options used to hedge MSRs as volatility decreased by June 30, 2020 Segment pretax results: Credit Sensitive Strategies: $458.8 million; Interest Rate Sensitive Strategies: $(117.5) million; Correspondent Production: $139.6 million; Corporate: $(12.8) million Dividend of $0.40 per common share declared on June 19, 2020 and paid on July 30, 2020 Book value per common share increased to $19.39 from $15.16 at March 31, 2020 Investment activity driven by elevated correspondent production volumes Conventional correspondent loan production totaled $18.9 billion in unpaid principal balance (UPB), up 17% from the prior quarter and 76% from 2Q19 Added $203 million in new MSRs CRT deliveries totaled $1.8 billion in UPB resulting in a firm commitment to purchase $48 million of new CRT securities Repurchased approximately 566,000 common shares of PMT at a weighted average price of $13.36, or a total cost of $7.6 million

Slide 4

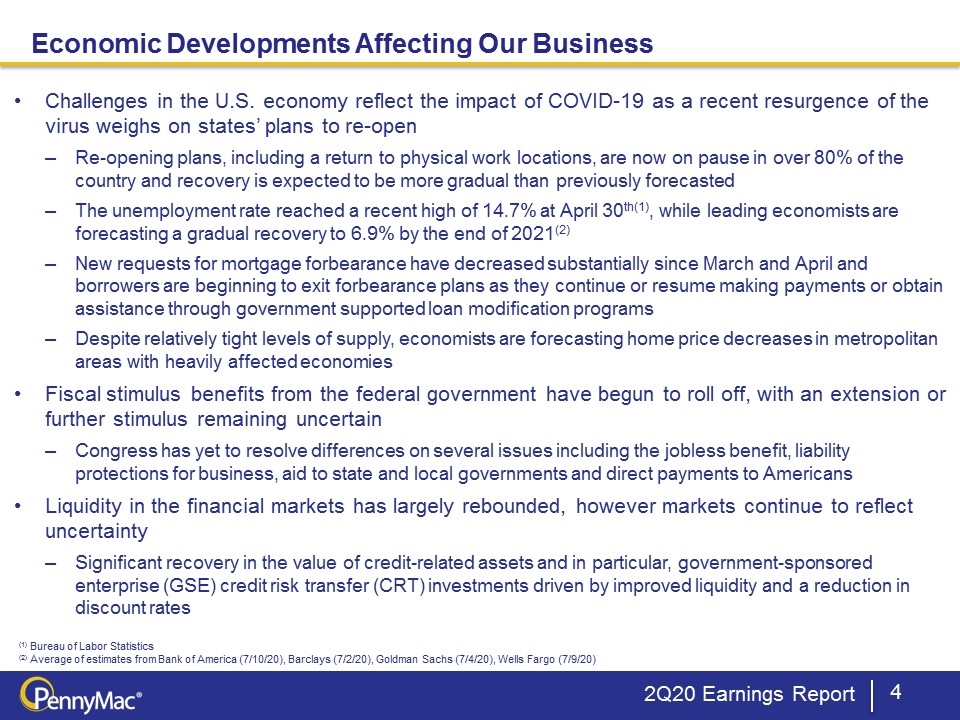
2Q20 Earnings Report Economic Developments Affecting Our Business Challenges in the U.S. economy reflect the impact of COVID-19 as a recent resurgence of the virus weighs on states’ plans to re-open Re-opening plans, including a return to physical work locations, are now on pause in over 80% of the country and recovery is expected to be more gradual than previously forecasted The unemployment rate reached a recent high of 14.7% at April 30th(1), while leading economists are forecasting a gradual recovery to 6.9% by the end of 2021(2) New requests for mortgage forbearance have decreased substantially since March and April and borrowers are beginning to exit forbearance plans as they continue or resume making payments or obtain assistance through government supported loan modification programs Despite relatively tight levels of supply, economists are forecasting home price decreases in metropolitan areas with heavily affected economies Fiscal stimulus benefits from the federal government have begun to roll off, with an extension or further stimulus remaining uncertain Congress has yet to resolve differences on several issues including the jobless benefit, liability protections for business, aid to state and local governments and direct payments to Americans Liquidity in the financial markets has largely rebounded, however markets continue to reflect uncertainty Significant recovery in the value of credit-related assets and in particular, government-sponsored enterprise (GSE) credit risk transfer (CRT) investments driven by improved liquidity and a reduction in discount rates (1) Bureau of Labor Statistics (2) Average of estimates from Bank of America (7/10/20), Barclays (7/2/20), Goldman Sachs (7/4/20), Wells Fargo (7/9/20)

Slide 5

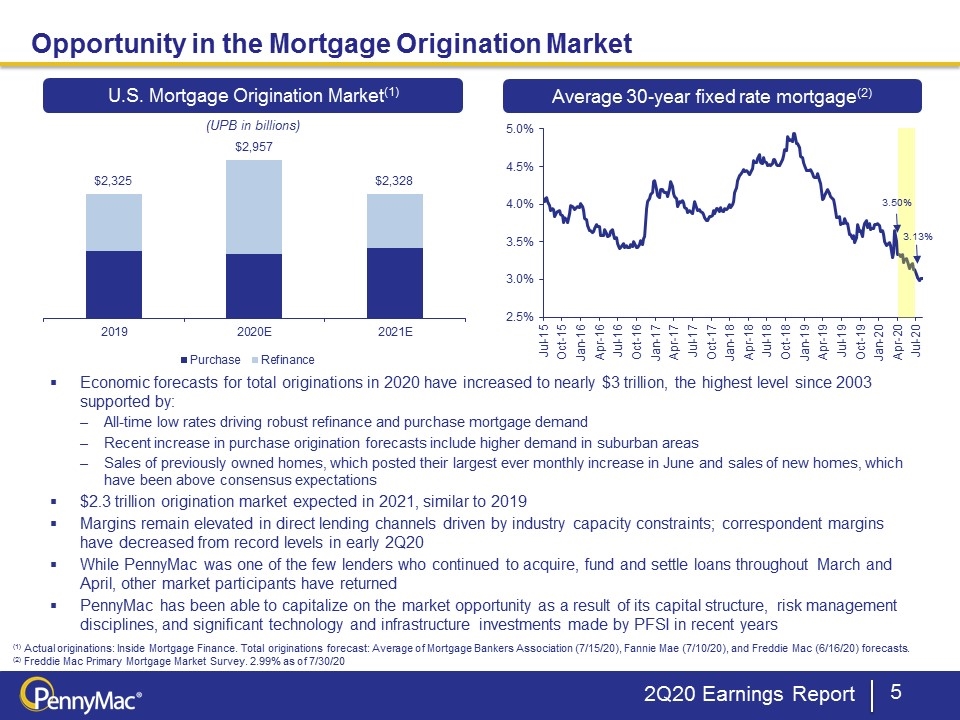
2Q20 Earnings Report Opportunity in the Mortgage Origination Market (1) Actual originations: Inside Mortgage Finance. Total originations forecast: Average of Mortgage Bankers Association (7/15/20), Fannie Mae (7/10/20), and Freddie Mac (6/16/20) forecasts. (2) Freddie Mac Primary Mortgage Market Survey. 2.99% as of 7/30/20 U.S. Mortgage Origination Market(1) (UPB in billions) Average 30-year fixed rate mortgage(2) 3.50% 3.13% Economic forecasts for total originations in 2020 have increased to nearly $3 trillion, the highest level since 2003 supported by: All-time low rates driving robust refinance and purchase mortgage demand Recent increase in purchase origination forecasts include higher demand in suburban areas Sales of previously owned homes, which posted their largest ever monthly increase in June and sales of new homes, which have been above consensus expectations $2.3 trillion origination market expected in 2021, similar to 2019 Margins remain elevated in direct lending channels driven by industry capacity constraints; correspondent margins have decreased from record levels in early 2Q20 While PennyMac was one of the few lenders who continued to acquire, fund and settle loans throughout March and April, other market participants have returned PennyMac has been able to capitalize on the market opportunity as a result of its capital structure, risk management disciplines, and significant technology and infrastructure investments made by PFSI in recent years

Slide 6

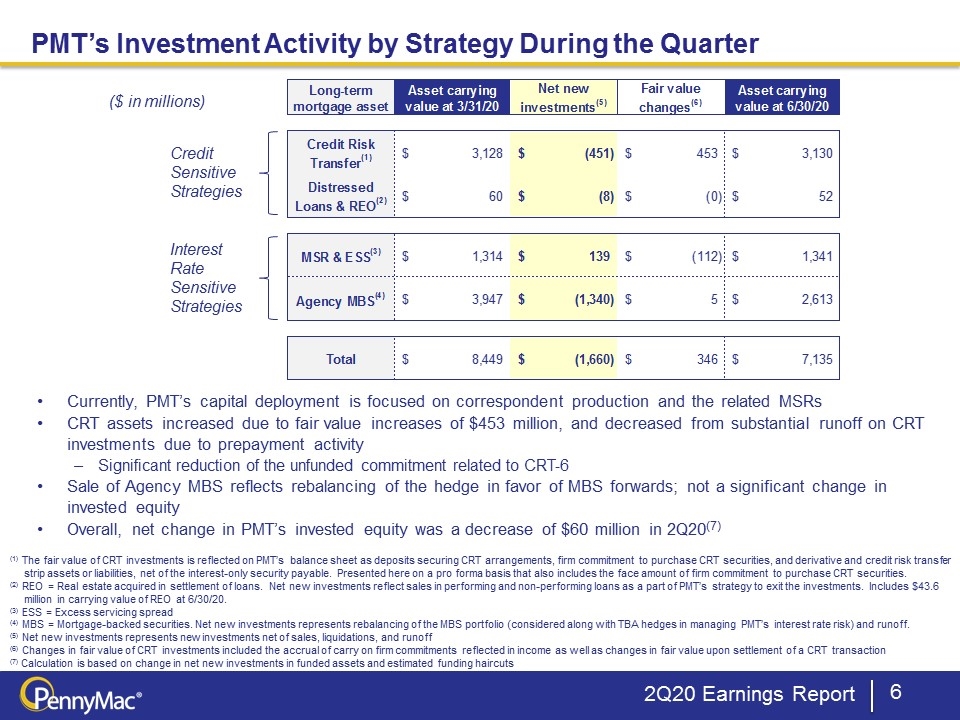
2Q20 Earnings Report PMT’s Investment Activity by Strategy During the Quarter Credit Sensitive Strategies Interest Rate Sensitive Strategies ($ in millions) Currently, PMT’s capital deployment is focused on correspondent production and the related MSRs CRT assets increased due to fair value increases of $453 million, and decreased from substantial runoff on CRT investments due to prepayment activity Significant reduction of the unfunded commitment related to CRT-6 Sale of Agency MBS reflects rebalancing of the hedge in favor of MBS forwards; not a significant change in invested equity Overall, net change in PMT’s invested equity was a decrease of $60 million in 2Q20(7) (1) The fair value of CRT investments is reflected on PMT’s balance sheet as deposits securing CRT arrangements, firm commitment to purchase CRT securities, and derivative and credit risk transfer strip assets or liabilities, net of the interest-only security payable. Presented here on a pro forma basis that also includes the face amount of firm commitment to purchase CRT securities. (2) REO = Real estate acquired in settlement of loans. Net new investments reflect sales in performing and non-performing loans as a part of PMT’s strategy to exit the investments. Includes $43.6 million in carrying value of REO at 6/30/20. (3) ESS = Excess servicing spread (4) MBS = Mortgage-backed securities. Net new investments represents rebalancing of the MBS portfolio (considered along with TBA hedges in managing PMT’s interest rate risk) and runoff. (5) Net new investments represents new investments net of sales, liquidations, and runoff (6) Changes in fair value of CRT investments included the accrual of carry on firm commitments reflected in income as well as changes in fair value upon settlement of a CRT transaction (7) Calculation is based on change in net new investments in funded assets and estimated funding haircuts

Slide 7

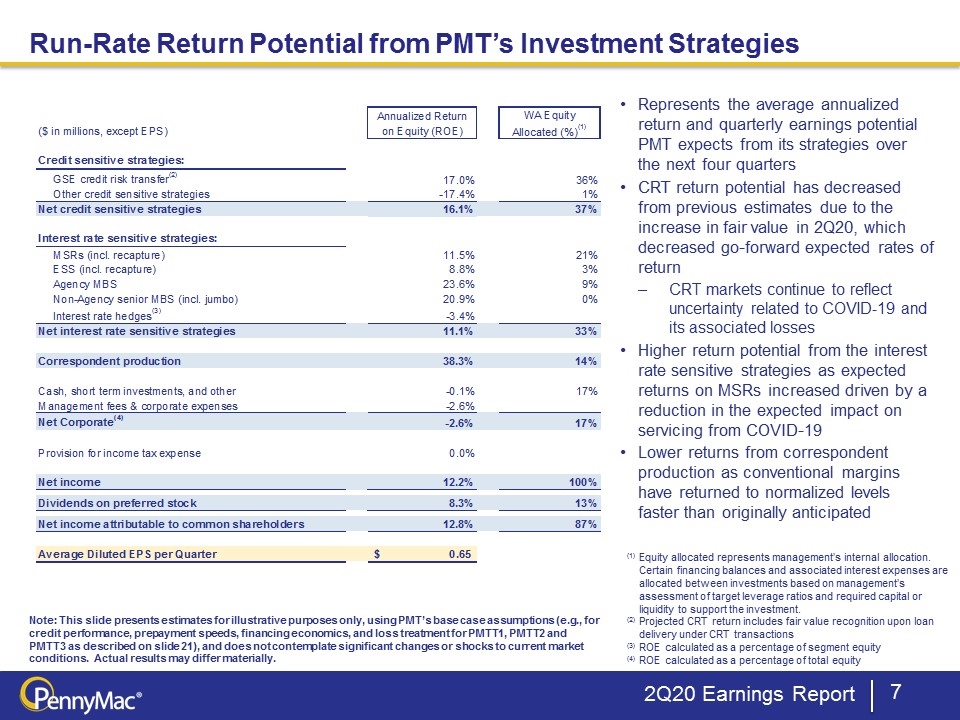
2Q20 Earnings Report Run-Rate Return Potential from PMT’s Investment Strategies Note: This slide presents estimates for illustrative purposes only, using PMT’s base case assumptions (e.g., for credit performance, prepayment speeds, financing economics, and loss treatment for PMTT1, PMTT2 and PMTT3 as described on slide 21), and does not contemplate significant changes or shocks to current market conditions. Actual results may differ materially.  (1) Equity allocated represents management’s internal allocation. Certain financing balances and associated interest expenses are allocated between investments based on management’s assessment of target leverage ratios and required capital or liquidity to support the investment. (2) Projected CRT return includes fair value recognition upon loan delivery under CRT transactions (3) ROE calculated as a percentage of segment equity (4) ROE calculated as a percentage of total equity Represents the average annualized return and quarterly earnings potential PMT expects from its strategies over the next four quarters CRT return potential has decreased from previous estimates due to the increase in fair value in 2Q20, which decreased go-forward expected rates of return CRT markets continue to reflect uncertainty related to COVID-19 and its associated losses Higher return potential from the interest rate sensitive strategies as expected returns on MSRs increased driven by a reduction in the expected impact on servicing from COVID-19 Lower returns from correspondent production as conventional margins have returned to normalized levels faster than originally anticipated

Slide 8

Mortgage Investment Activities

Slide 9

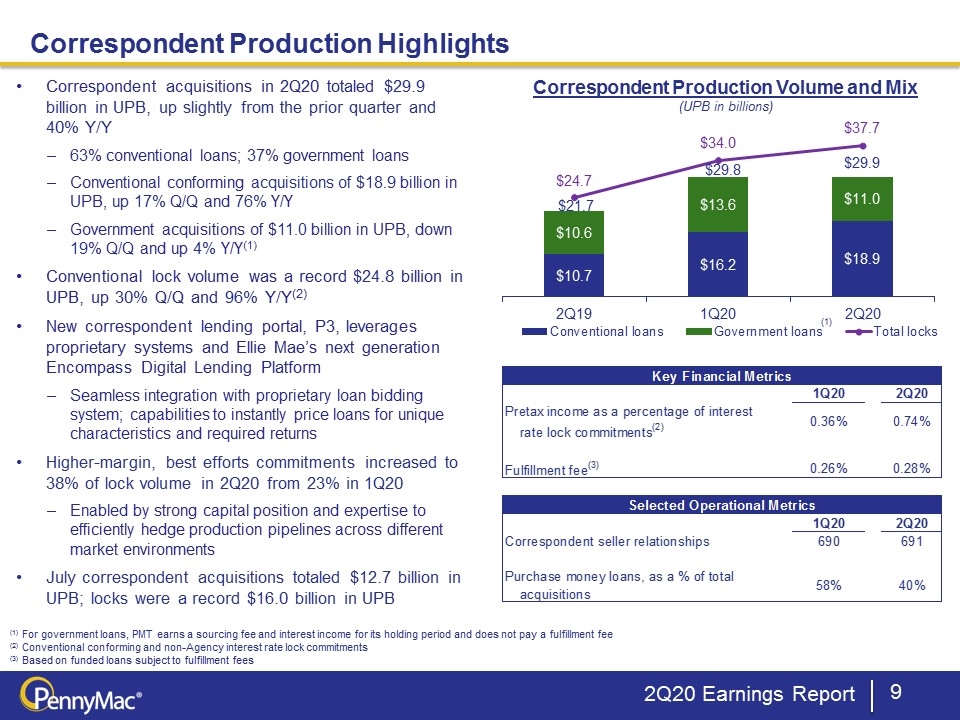
2Q20 Earnings Report Correspondent Production Highlights Correspondent Production Volume and Mix (UPB in billions) (1) For government loans, PMT earns a sourcing fee and interest income for its holding period and does not pay a fulfillment fee (2) Conventional conforming and non-Agency interest rate lock commitments (3) Based on funded loans subject to fulfillment fees (1) Correspondent acquisitions in 2Q20 totaled $29.9 billion in UPB, up slightly from the prior quarter and 40% Y/Y 63% conventional loans; 37% government loans Conventional conforming acquisitions of $18.9 billion in UPB, up 17% Q/Q and 76% Y/Y Government acquisitions of $11.0 billion in UPB, down 19% Q/Q and up 4% Y/Y(1) Conventional lock volume was a record $24.8 billion in UPB, up 30% Q/Q and 96% Y/Y(2) New correspondent lending portal, P3, leverages proprietary systems and Ellie Mae’s next generation Encompass Digital Lending Platform Seamless integration with proprietary loan bidding system; capabilities to instantly price loans for unique characteristics and required returns Higher-margin, best efforts commitments increased to 38% of lock volume in 2Q20 from 23% in 1Q20 Enabled by strong capital position and expertise to efficiently hedge production pipelines across different market environments July correspondent acquisitions totaled $12.7 billion in UPB; locks were a record $16.0 billion in UPB

Slide 10

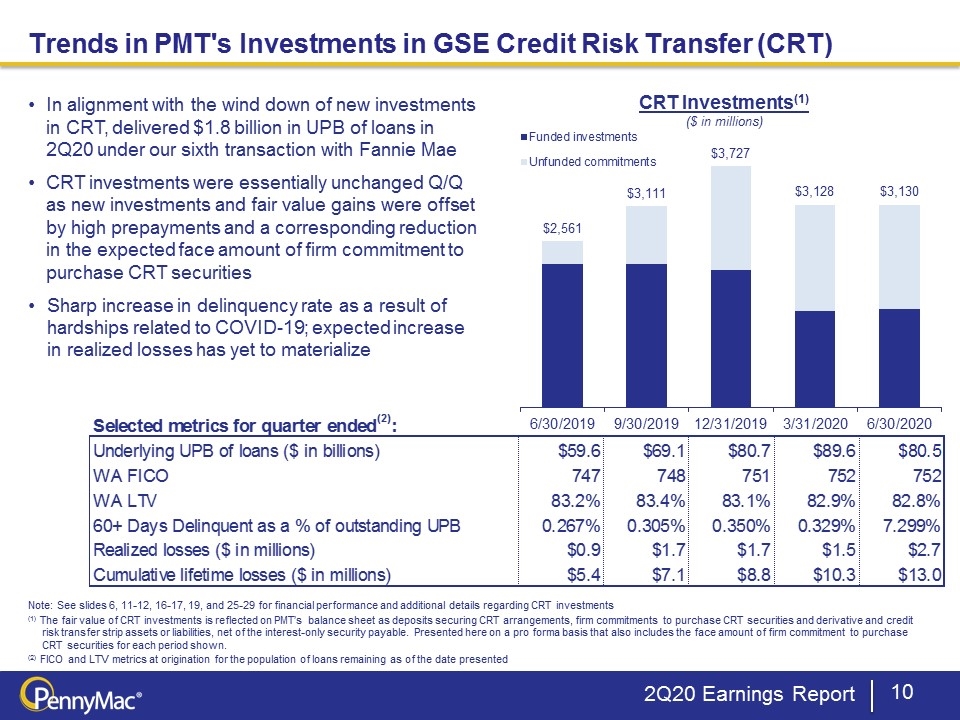
2Q20 Earnings Report Trends in PMT's Investments in GSE Credit Risk Transfer (CRT) In alignment with the wind down of new investments in CRT, delivered $1.8 billion in UPB of loans in 2Q20 under our sixth transaction with Fannie Mae CRT investments were essentially unchanged Q/Q as new investments and fair value gains were offset by high prepayments and a corresponding reduction in the expected face amount of firm commitment to purchase CRT securities Sharp increase in delinquency rate as a result of hardships related to COVID-19; expected increase in realized losses has yet to materialize Note: See slides 6, 11-12, 16-17, 19, and 25-29 for financial performance and additional details regarding CRT investments (1) The fair value of CRT investments is reflected on PMT’s balance sheet as deposits securing CRT arrangements, firm commitments to purchase CRT securities and derivative and credit risk transfer strip assets or liabilities, net of the interest-only security payable. Presented here on a pro forma basis that also includes the face amount of firm commitment to purchase CRT securities for each period shown. (2) FICO and LTV metrics at origination for the population of loans remaining as of the date presented CRT Investments(1) ($ in millions)

Slide 11

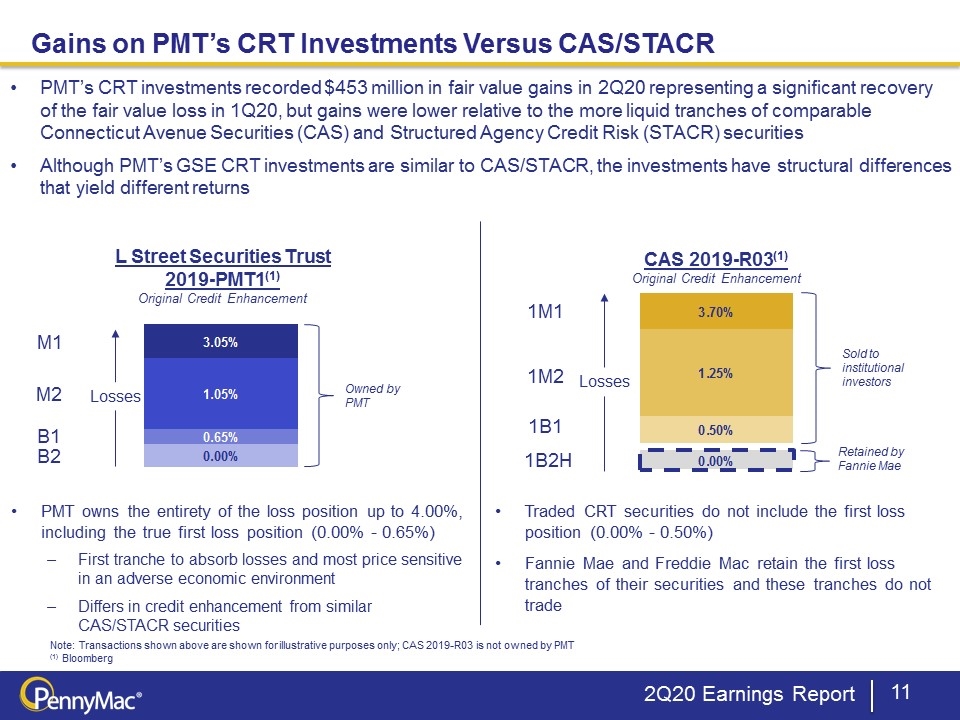
2Q20 Earnings Report Gains on PMT’s CRT Investments Versus CAS/STACR PMT’s CRT investments recorded $453 million in fair value gains in 2Q20 representing a significant recovery of the fair value loss in 1Q20, but gains were lower relative to the more liquid tranches of comparable Connecticut Avenue Securities (CAS) and Structured Agency Credit Risk (STACR) securities Although PMT’s GSE CRT investments are similar to CAS/STACR, the investments have structural differences that yield different returns L Street Securities Trust 2019-PMT1(1) Original Credit Enhancement M1 M2 B1 B2 CAS 2019-R03(1) Original Credit Enhancement 1M1 1M2 1B1 1B2H Losses Note: Transactions shown above are shown for illustrative purposes only; CAS 2019-R03 is not owned by PMT (1) Bloomberg Losses Owned by PMT Sold to institutional investors Retained by Fannie Mae PMT owns the entirety of the loss position up to 4.00%, including the true first loss position (0.00% - 0.65%) First tranche to absorb losses and most price sensitive in an adverse economic environment Differs in credit enhancement from similar CAS/STACR securities Traded CRT securities do not include the first loss position (0.00% - 0.50%) Fannie Mae and Freddie Mac retain the first loss tranches of their securities and these tranches do not trade

Slide 12

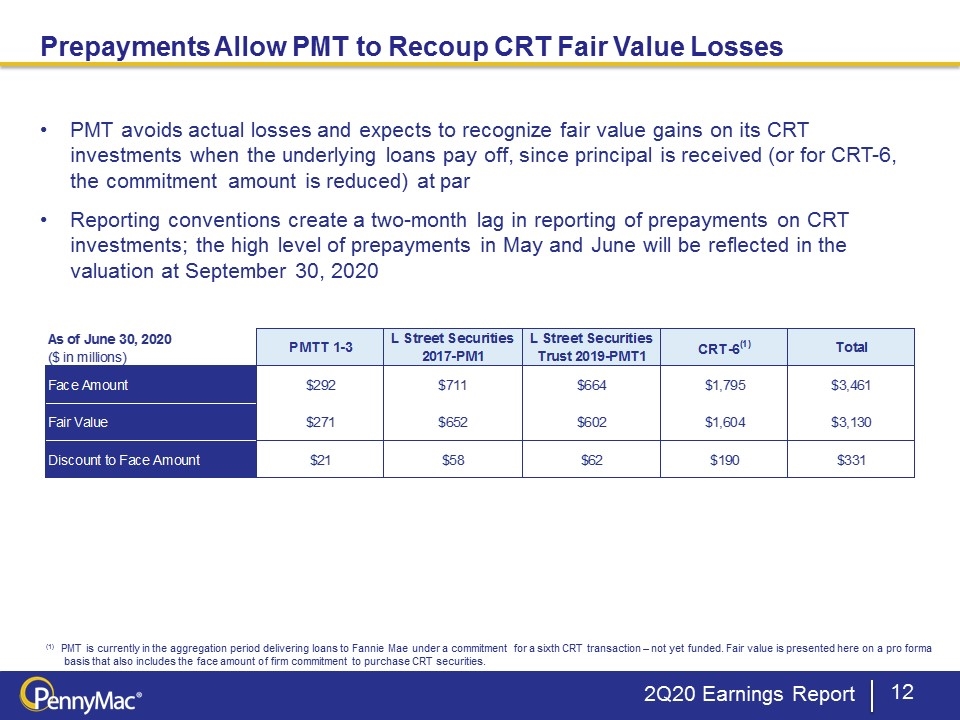
2Q20 Earnings Report Prepayments Allow PMT to Recoup CRT Fair Value Losses PMT avoids actual losses and expects to recognize fair value gains on its CRT investments when the underlying loans pay off, since principal is received (or for CRT-6, the commitment amount is reduced) at par Reporting conventions create a two-month lag in reporting of prepayments on CRT investments; the high level of prepayments in May and June will be reflected in the valuation at September 30, 2020 (1) PMT is currently in the aggregation period delivering loans to Fannie Mae under a commitment for a sixth CRT transaction – not yet funded. Fair value is presented here on a pro forma basis that also includes the face amount of firm commitment to purchase CRT securities.

Slide 13

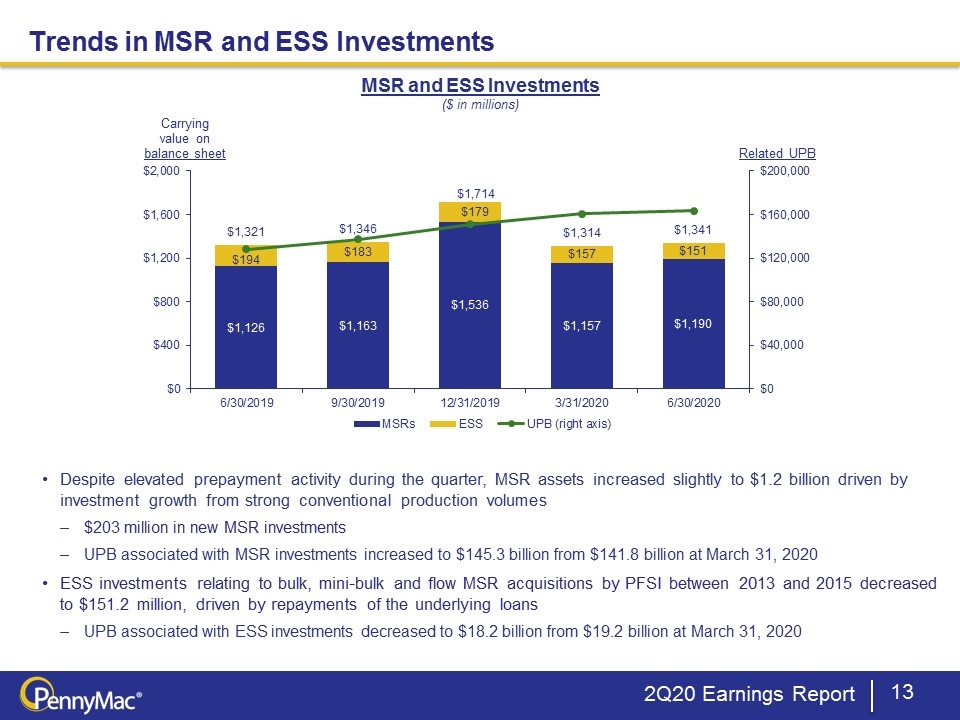
2Q20 Earnings Report Despite elevated prepayment activity during the quarter, MSR assets increased slightly to $1.2 billion driven by investment growth from strong conventional production volumes $203 million in new MSR investments UPB associated with MSR investments increased to $145.3 billion from $141.8 billion at March 31, 2020 ESS investments relating to bulk, mini-bulk and flow MSR acquisitions by PFSI between 2013 and 2015 decreased to $151.2 million, driven by repayments of the underlying loans UPB associated with ESS investments decreased to $18.2 billion from $19.2 billion at March 31, 2020 MSR and ESS Investments ($ in millions) Trends in MSR and ESS Investments

Slide 14

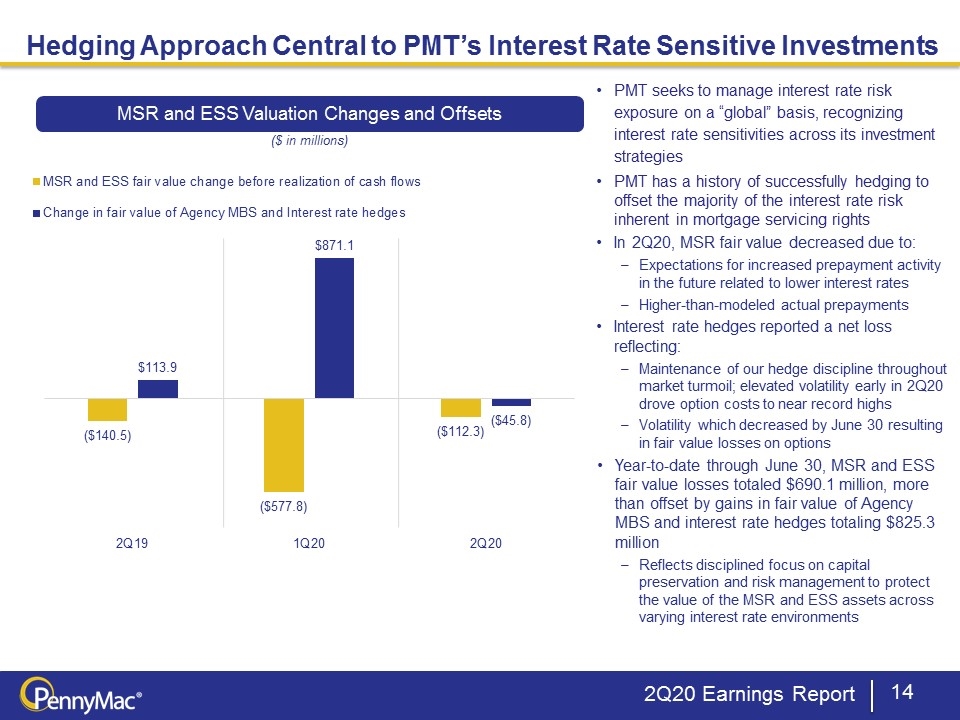
2Q20 Earnings Report Hedging Approach Central to PMT’s Interest Rate Sensitive Investments PMT seeks to manage interest rate risk exposure on a “global” basis, recognizing interest rate sensitivities across its investment strategies PMT has a history of successfully hedging to offset the majority of the interest rate risk inherent in mortgage servicing rights In 2Q20, MSR fair value decreased due to: Expectations for increased prepayment activity in the future related to lower interest rates Higher-than-modeled actual prepayments Interest rate hedges reported a net loss reflecting: Maintenance of our hedge discipline throughout market turmoil; elevated volatility early in 2Q20 drove option costs to near record highs Volatility which decreased by June 30 resulting in fair value losses on options Year-to-date through June 30, MSR and ESS fair value losses totaled $690.1 million, more than offset by gains in fair value of Agency MBS and interest rate hedges totaling $825.3 million Reflects disciplined focus on capital preservation and risk management to protect the value of the MSR and ESS assets across varying interest rate environments MSR and ESS Valuation Changes and Offsets ($ in millions)

Slide 15

Financial Results

Slide 16

2Q20 Earnings Report Note: Amounts may not sum exactly due to rounding (1) Income contribution and the annualized return on equity calculated net of any direct expenses associated with investments (e.g., loan fulfillment fees and loan servicing fees), but before tax expenses. Some of the income associated with the investment strategies may be subject to taxation. (2) Market-driven value changes include fair value recognition upon loan delivery under firm commitment to purchase CRT securities attributable to the credit sensitive strategies segment; see slide 17 for details. Categorization of income as market-driven value changes based on management assessment. Income excluding market-driven value changes does not represent REIT taxable income. (3) Equity allocated represents management’s internal allocation. Certain financing balances and associated interest expenses are allocated between investments based on management’s assessment of target leverage ratios and required capital or liquidity to support the investment. (4) ROE calculated as a percentage of total equity Second Quarter Results and Return Contributions by Strategy

Slide 17

2Q20 Earnings Report Performance of the GSE Credit Risk Transfer Investments in 2Q20

Slide 18

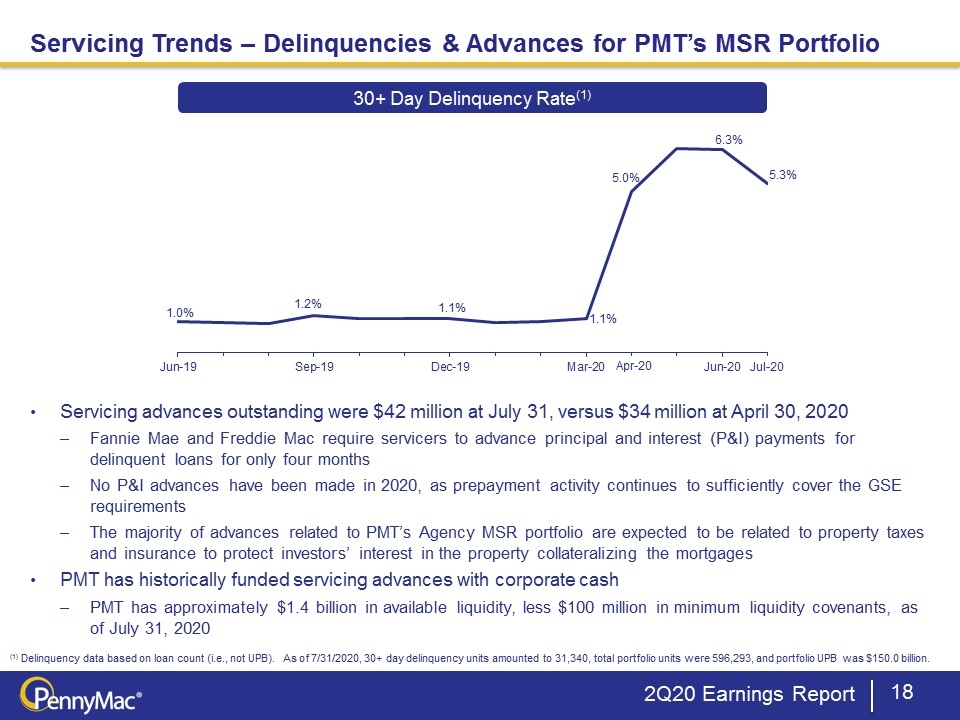
Servicing Trends – Delinquencies & Advances for PMT’s MSR Portfolio 2Q20 Earnings Report Servicing advances outstanding were $42 million at July 31, versus $34 million at April 30, 2020 Fannie Mae and Freddie Mac require servicers to advance principal and interest (P&I) payments for delinquent loans for only four months No P&I advances have been made in 2020, as prepayment activity continues to sufficiently cover the GSE requirements The majority of advances related to PMT’s Agency MSR portfolio are expected to be related to property taxes and insurance to protect investors’ interest in the property collateralizing the mortgages PMT has historically funded servicing advances with corporate cash PMT has approximately $1.4 billion in available liquidity, less $100 million in minimum liquidity covenants, as of July 31, 2020 (1) Delinquency data based on loan count (i.e., not UPB). As of 7/31/2020, 30+ day delinquency units amounted to 31,340, total portfolio units were 596,293, and portfolio UPB was $150.0 billion. 30+ Day Delinquency Rate(1) Apr-20 Jul-20

Slide 19

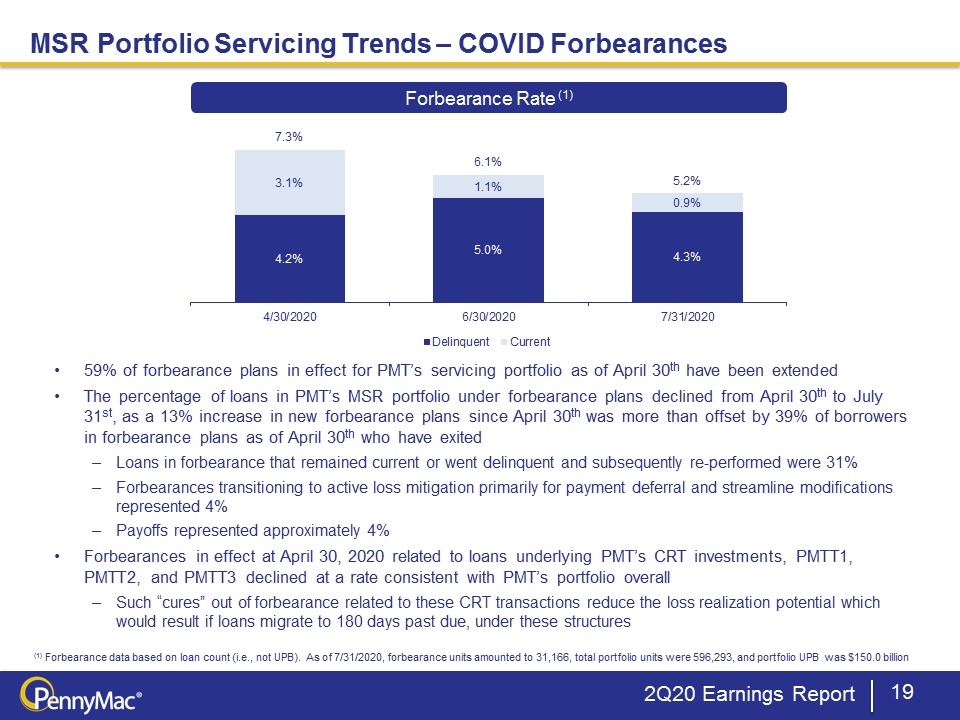
MSR Portfolio Servicing Trends – COVID Forbearances 2Q20 Earnings Report Forbearance Rate (1) 59% of forbearance plans in effect for PMT’s servicing portfolio as of April 30th have been extended The percentage of loans in PMT’s MSR portfolio under forbearance plans declined from April 30th to July 31st, as a 13% increase in new forbearance plans since April 30th was more than offset by 39% of borrowers in forbearance plans as of April 30th who have exited Loans in forbearance that remained current or went delinquent and subsequently re-performed were 31% Forbearances transitioning to active loss mitigation primarily for payment deferral and streamline modifications represented 4% Payoffs represented approximately 4% Forbearances in effect at April 30, 2020 related to loans underlying PMT’s CRT investments, PMTT1, PMTT2, and PMTT3 declined at a rate consistent with PMT’s portfolio overall Such “cures” out of forbearance related to these CRT transactions reduce the loss realization potential which would result if loans migrate to 180 days past due, under these structures (1) Forbearance data based on loan count (i.e., not UPB). As of 7/31/2020, forbearance units amounted to 31,166, total portfolio units were 596,293, and portfolio UPB was $150.0 billion

Slide 20

Appendix

Slide 21

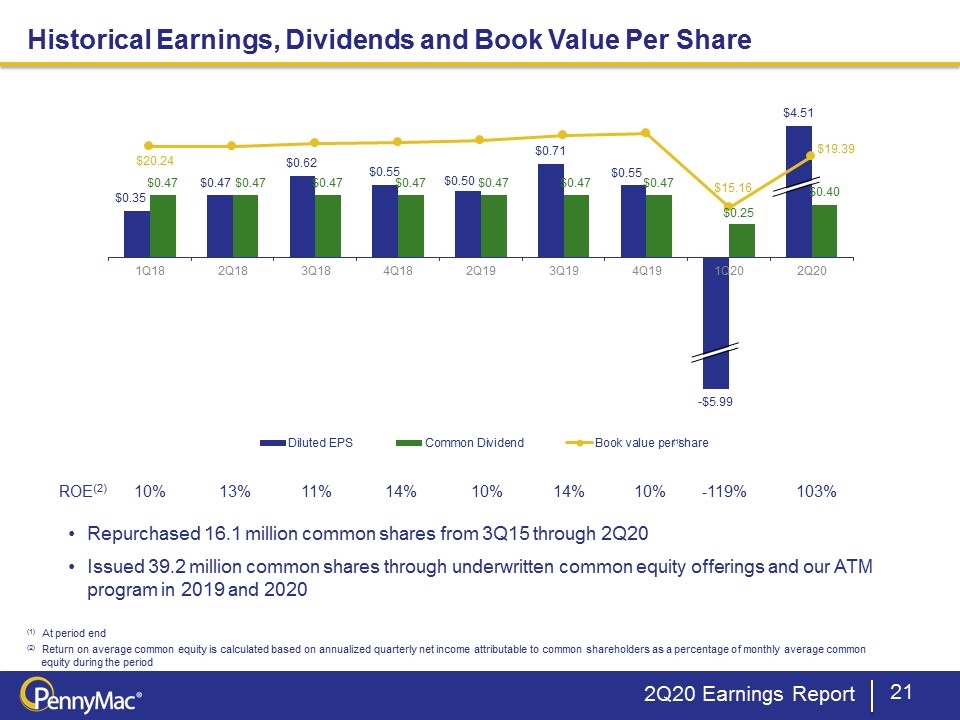
2Q20 Earnings Report (1) At period end (2) Return on average common equity is calculated based on annualized quarterly net income attributable to common shareholders as a percentage of monthly average common equity during the period Historical Earnings, Dividends and Book Value Per Share Repurchased 16.1 million common shares from 3Q15 through 2Q20 Issued 39.2 million common shares through underwritten common equity offerings and our ATM program in 2019 and 2020 ROE(2) 10% 13% 11% 14% 10% 14% 10% -119% 103% (1)

Slide 22

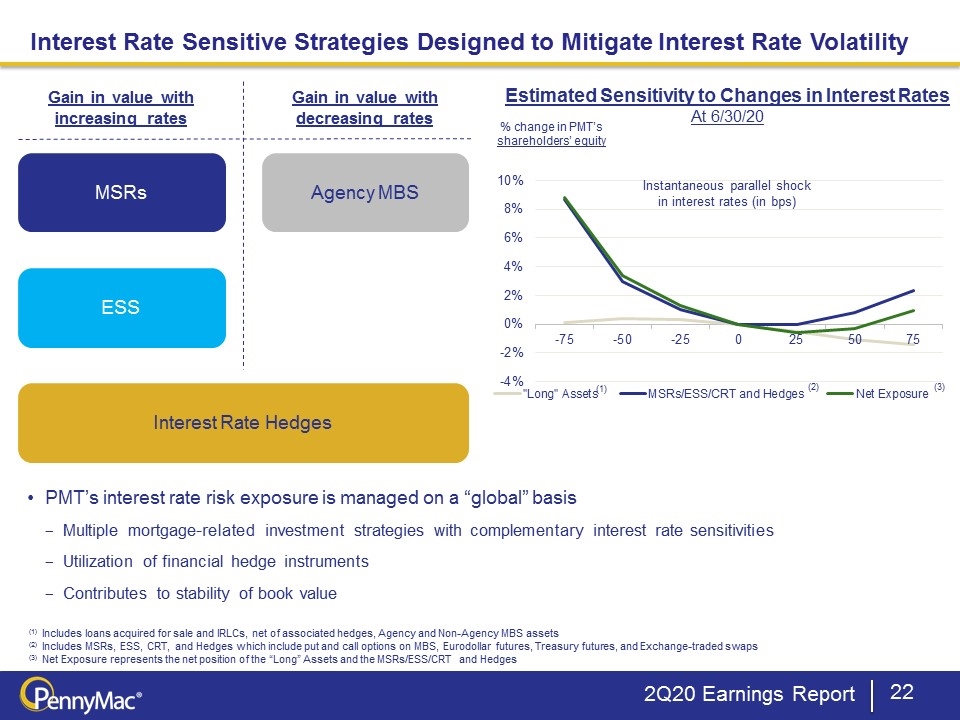
2Q20 Earnings Report Estimated Sensitivity to Changes in Interest Rates At 6/30/20 Instantaneous parallel shock in interest rates (in bps) Interest Rate Sensitive Strategies Designed to Mitigate Interest Rate Volatility % change in PMT’s shareholders’ equity (1) (2) (3) Gain in value with increasing rates Gain in value with decreasing rates MSRs ESS Agency MBS Interest Rate Hedges PMT’s interest rate risk exposure is managed on a “global” basis Multiple mortgage-related investment strategies with complementary interest rate sensitivities Utilization of financial hedge instruments Contributes to stability of book value (1) Includes loans acquired for sale and IRLCs, net of associated hedges, Agency and Non-Agency MBS assets (2) Includes MSRs, ESS, CRT, and Hedges which include put and call options on MBS, Eurodollar futures, Treasury futures, and Exchange-traded swaps (3) Net Exposure represents the net position of the “Long” Assets and the MSRs/ESS/CRT and Hedges

Slide 23

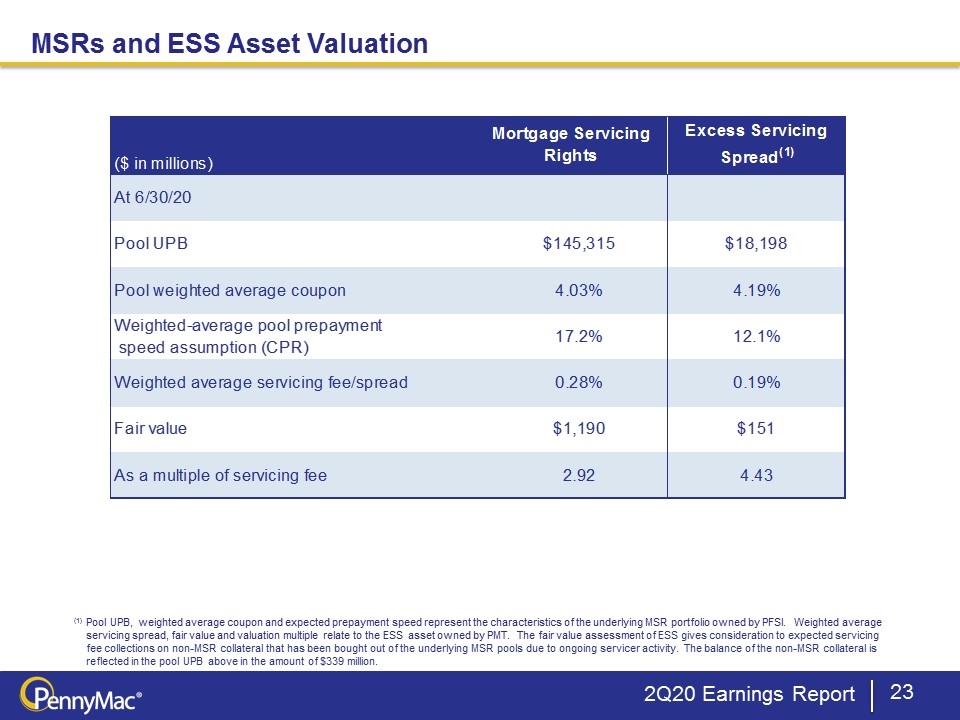
MSRs and ESS Asset Valuation Unaudited (1) Pool UPB, weighted average coupon and expected prepayment speed represent the characteristics of the underlying MSR portfolio owned by PFSI. Weighted average servicing spread, fair value and valuation multiple relate to the ESS asset owned by PMT. The fair value assessment of ESS gives consideration to expected servicing fee collections on non-MSR collateral that has been bought out of the underlying MSR pools due to ongoing servicer activity. The balance of the non-MSR collateral is reflected in the pool UPB above in the amount of $339 million. 2Q20 Earnings Report

Slide 24

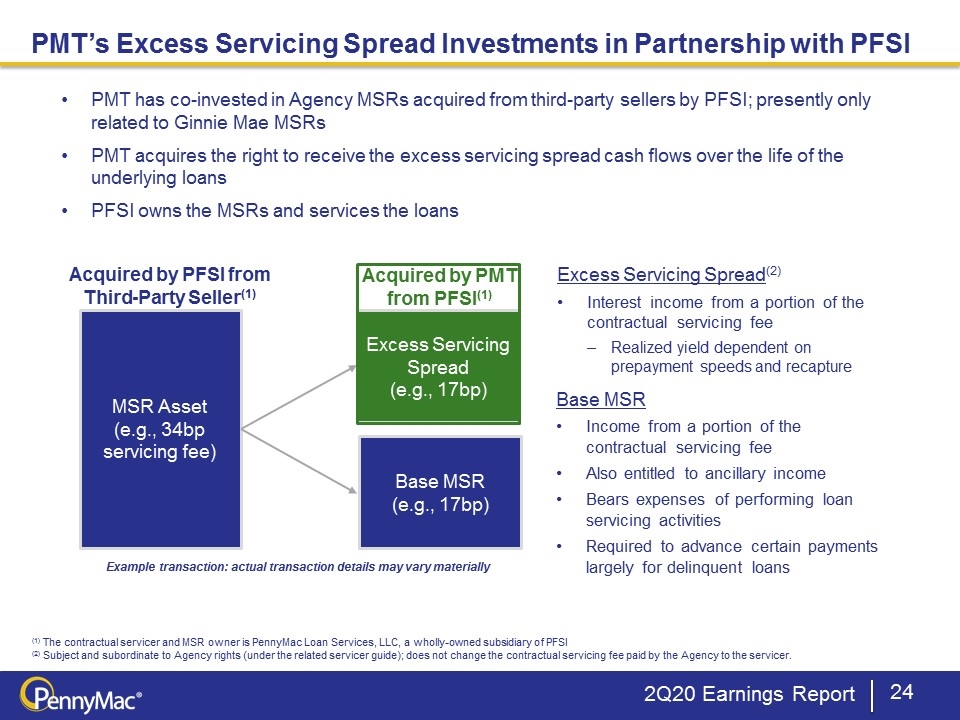
(1) The contractual servicer and MSR owner is PennyMac Loan Services, LLC, a wholly-owned subsidiary of PFSI (2) Subject and subordinate to Agency rights (under the related servicer guide); does not change the contractual servicing fee paid by the Agency to the servicer. Excess Servicing Spread (e.g., 17bp) MSR Asset (e.g., 34bp servicing fee) Acquired by PFSI from Third-Party Seller(1) PMT has co-invested in Agency MSRs acquired from third-party sellers by PFSI; presently only related to Ginnie Mae MSRs PMT acquires the right to receive the excess servicing spread cash flows over the life of the underlying loans PFSI owns the MSRs and services the loans Excess Servicing Spread(2) Interest income from a portion of the contractual servicing fee Realized yield dependent on prepayment speeds and recapture Base MSR Income from a portion of the contractual servicing fee Also entitled to ancillary income Bears expenses of performing loan servicing activities Required to advance certain payments largely for delinquent loans Base MSR (e.g., 17bp) Acquired by PMT from PFSI(1) Example transaction: actual transaction details may vary materially PMT’s Excess Servicing Spread Investments in Partnership with PFSI 2Q20 Earnings Report

Slide 25

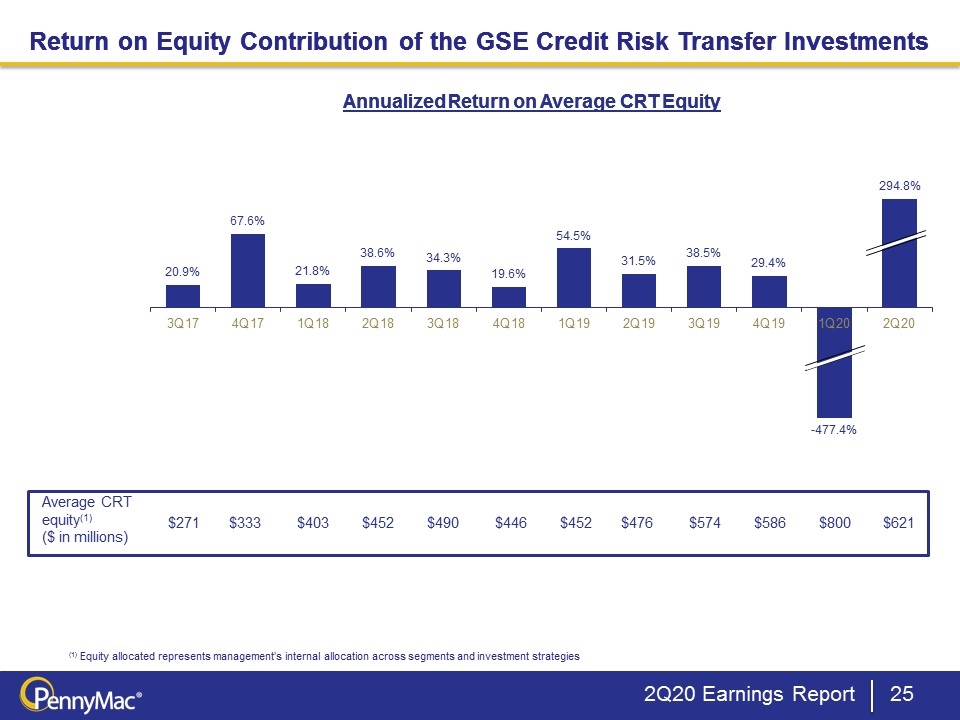
Return on Equity Contribution of the GSE Credit Risk Transfer Investments 2Q20 Earnings Report Annualized Return on Average CRT Equity (1) Equity allocated represents management’s internal allocation across segments and investment strategies Return on Equity Contribution of the GSE Credit Risk Transfer Investments Annualized Return on Average CRT Equity Average CRT equity(1) ($ in millions) $271 $333 $403 $452 $490 $446 $452 $476 $574 $586 $800 $621

Slide 26

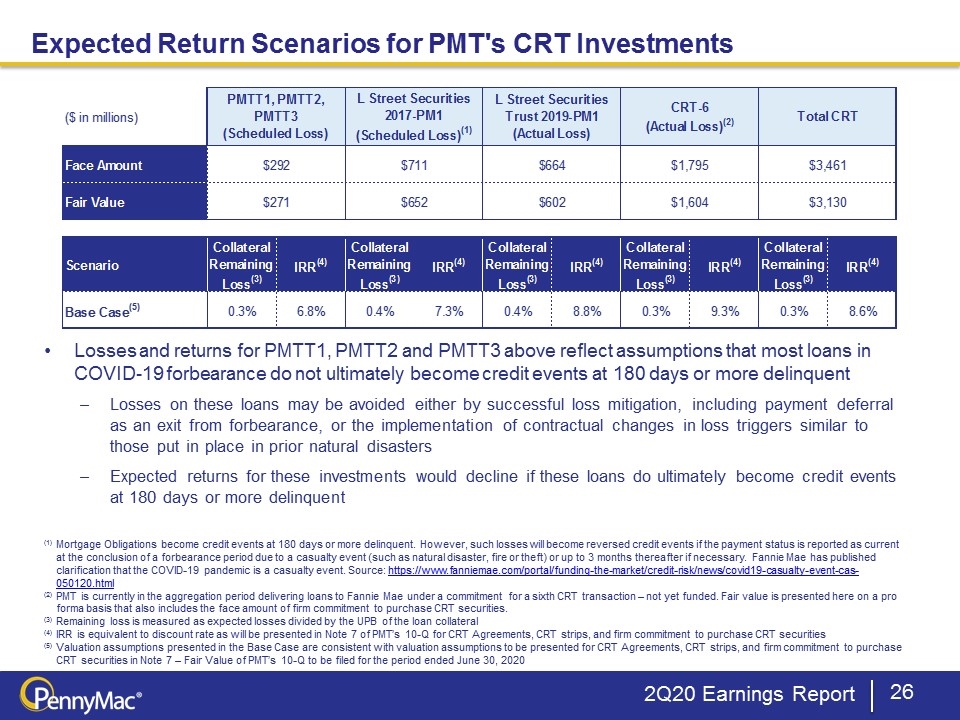
2Q20 Earnings Report Expected Return Scenarios for PMT's CRT Investments Losses and returns for PMTT1, PMTT2 and PMTT3 above reflect assumptions that most loans in COVID-19 forbearance do not ultimately become credit events at 180 days or more delinquent Losses on these loans may be avoided either by successful loss mitigation, including payment deferral as an exit from forbearance, or the implementation of contractual changes in loss triggers similar to those put in place in prior natural disasters Expected returns for these investments would decline if these loans do ultimately become credit events at 180 days or more delinquent (1) Mortgage Obligations become credit events at 180 days or more delinquent. However, such losses will become reversed credit events if the payment status is reported as current at the conclusion of a forbearance period due to a casualty event (such as natural disaster, fire or theft) or up to 3 months thereafter if necessary. Fannie Mae has published clarification that the COVID-19 pandemic is a casualty event. Source: https://www.fanniemae.com/portal/funding-the-market/credit-risk/news/covid19-casualty-event-cas-050120.html (2) PMT is currently in the aggregation period delivering loans to Fannie Mae under a commitment for a sixth CRT transaction – not yet funded. Fair value is presented here on a pro forma basis that also includes the face amount of firm commitment to purchase CRT securities. (3) Remaining loss is measured as expected losses divided by the UPB of the loan collateral (4) IRR is equivalent to discount rate as will be presented in Note 7 of PMT’s 10-Q for CRT Agreements, CRT strips, and firm commitment to purchase CRT securities (5) Valuation assumptions presented in the Base Case are consistent with valuation assumptions to be presented for CRT Agreements, CRT strips, and firm commitment to purchase CRT securities in Note 7 – Fair Value of PMT’s 10-Q to be filed for the period ended June 30, 2020

Slide 27

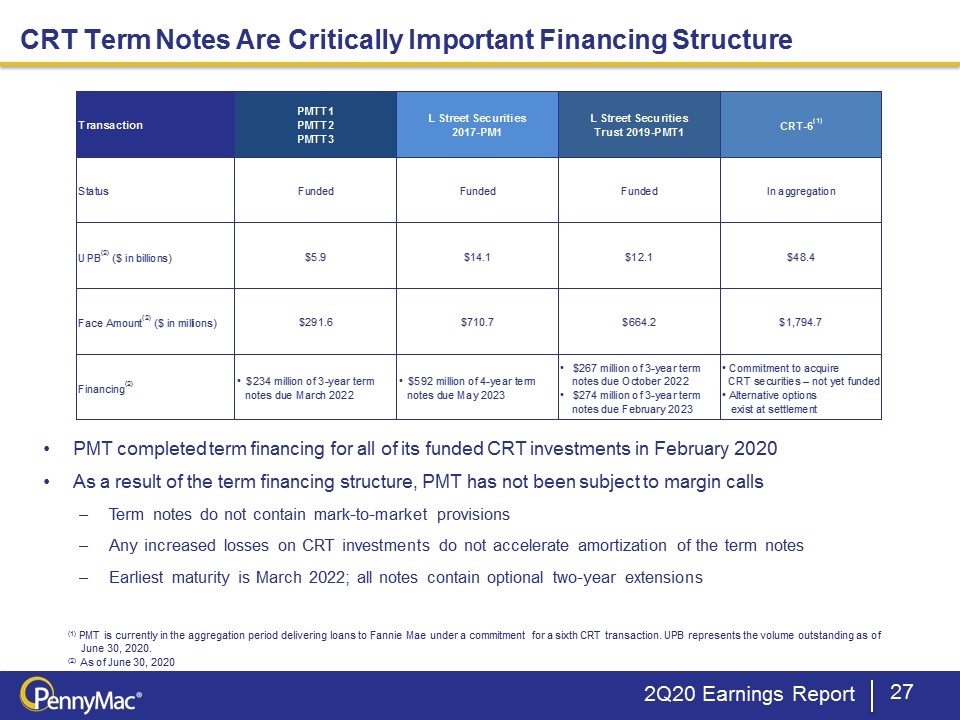
2Q20 Earnings Report CRT Term Notes Are Critically Important Financing Structure (1) PMT is currently in the aggregation period delivering loans to Fannie Mae under a commitment for a sixth CRT transaction. UPB represents the volume outstanding as of June 30, 2020. (2) As of June 30, 2020 PMT completed term financing for all of its funded CRT investments in February 2020 As a result of the term financing structure, PMT has not been subject to margin calls Term notes do not contain mark-to-market provisions Any increased losses on CRT investments do not accelerate amortization of the term notes Earliest maturity is March 2022; all notes contain optional two-year extensions

Slide 28

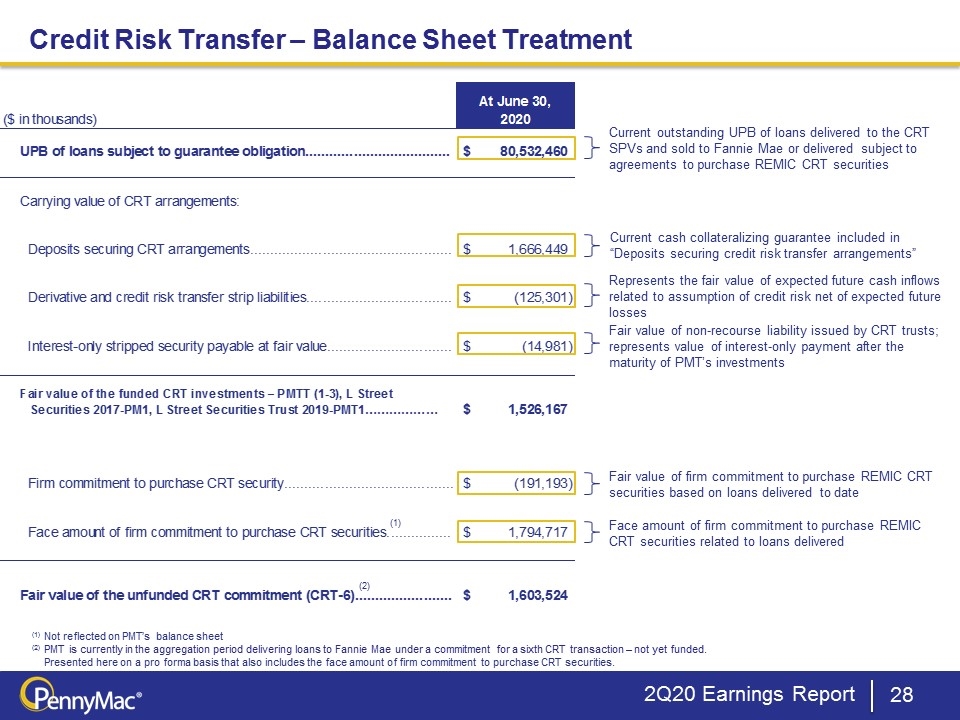
Current outstanding UPB of loans delivered to the CRT SPVs and sold to Fannie Mae or delivered subject to agreements to purchase REMIC CRT securities Credit Risk Transfer – Balance Sheet Treatment Current cash collateralizing guarantee included in “Deposits securing credit risk transfer arrangements” Represents the fair value of expected future cash inflows related to assumption of credit risk net of expected future losses Fair value of firm commitment to purchase REMIC CRT securities based on loans delivered to date Face amount of firm commitment to purchase REMIC CRT securities related to loans delivered 2Q20 Earnings Report Fair value of non-recourse liability issued by CRT trusts; represents value of interest-only payment after the maturity of PMT’s investments (1) (1) Not reflected on PMT’s balance sheet (2) PMT is currently in the aggregation period delivering loans to Fannie Mae under a commitment for a sixth CRT transaction – not yet funded. Presented here on a pro forma basis that also includes the face amount of firm commitment to purchase CRT securities. (2)

Slide 29

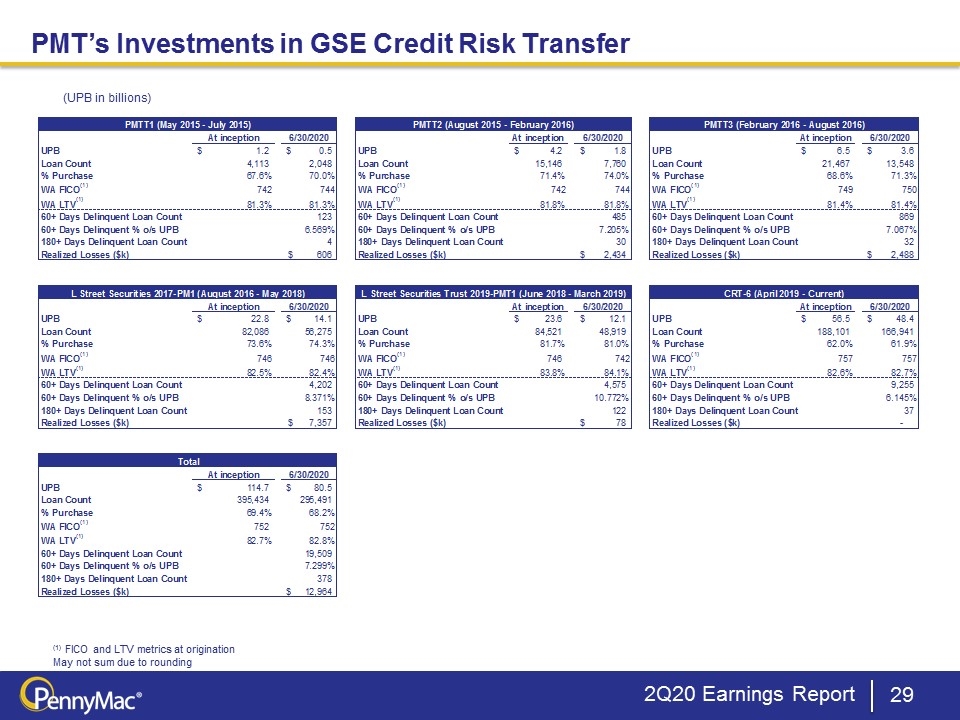
PMT’s Investments in GSE Credit Risk Transfer 2Q20 Earnings Report (1) FICO and LTV metrics at origination May not sum due to rounding (UPB in billions)

Slide 30

2Q20 Earnings Report Correspondent Production Acquisitions and Locks by Product Note: Conventional Conforming, Government, and Non-Agency acquisitions exclude PennyMac Financial’s Direct Lending Loans Acquired by PMT. (1) Consists of prime jumbo and non-QM loans