pnw-20210505
0000764622falseAZ00000072868-KMay 5, 2021falseAZfalsefalsefalsefalsefalse00007646222021-05-052021-05-050000764622pnw:ArizonaPublicServiceCompanyMember2021-05-052021-05-05

UNITED STATES
SECURITIES AND EXCHANGE COMMISSION
WASHINGTON, DC 20549 
 
FORM 8-K 
 
CURRENT REPORT
Pursuant to Section 13 or 15(d) of the
Securities Exchange Act of 1934
Date of report (Date of earliest event reported):
May 5, 2021
Commission File
Number
 Exact Name of Each Registrant as specified in its
charter; State of Incorporation; Address; and
Telephone Number
IRS Employer
Identification No.
1-8962 PINNACLE WEST CAPITAL CORPORATION86-0512431
(an Arizona corporation)
400 North Fifth Street, P.O. Box 53999
PhoenixArizona85072-3999
(602) 250-1000
1-4473 ARIZONA PUBLIC SERVICE COMPANY86-0011170
(an Arizona corporation)
400 North Fifth Street, P.O. Box 53999
PhoenixArizona85072-3999
(602)250-1000

Check the appropriate box below if the Form 8-K filing is intended to simultaneously satisfy the filing obligation of the registrant under any of the following provisions:
Written communications pursuant to Rule 425 under the Securities Act (17 CFR 230.425)
Soliciting material pursuant to Rule 14a-12 under the Exchange Act (17 CFR 240.14a-12)
Pre-commencement communications pursuant to Rule 14d-2(b) under the Exchange Act (17 CFR 240.14d-2(b))
Pre-commencement communications pursuant to Rule 13e-4(c) under the Exchange Act (17 CFR 240.13e-4(c))

Securities registered pursuant to Section 12(b) of the Act:
Title of each class
Trading Symbol(s)
Name of each exchange on which registered
Common Stock
PNW
The New York Stock Exchange

Indicate by check mark whether the registrant is an emerging growth company as defined in Rule 405 of the Securities Act of 1933 (17 CFR §230.405) or Rule 12b-2 of the Securities Exchange Act of 1934 (17 CFR §240.12b-2).
Emerging growth company

If an emerging growth company, indicate by check mark if the registrant has elected not to use the extended transition period for complying with any new or revised financial accounting standards provided pursuant to Section 13(a) of the Exchange Act. ¨

This combined Form 8-K is separately filed or furnished by Pinnacle West Capital Corporation and Arizona Public Service Company. Each registrant is filing or furnishing on its own behalf all of the information contained in this Form 8-K that relates to such registrant and, where required, its subsidiaries. Except as stated in the preceding sentence, neither registrant is filing or furnishing any information that does not relate to such registrant, and therefore makes no representation as to any such information.


Item 2.02. Results of Operations and Financial Condition.

    The following information is furnished pursuant to Item 2.02.

    On May 5, 2021, Pinnacle West Capital Corporation (“Pinnacle West”) issued a press release regarding its financial results for the fiscal quarter ended March 31, 2021. A copy of the press release is attached hereto as Exhibit 99.1.

Item 7.01. Regulation FD Disclosure.

    The following information is furnished pursuant to Item 7.01.

    Pinnacle West is providing a copy of the slide presentation made in connection with the quarterly earnings conference call on May 5, 2021. This information contains Pinnacle West operating results for the fiscal quarter ended March 31, 2021 and a quarterly consolidated statistical summary. The slide presentation is attached hereto as Exhibit 99.2 and is concurrently being posted to Pinnacle West’s website at www.pinnaclewest.com.

Item 9.01.    Financial Statements and Exhibits.

    (d)    Exhibits
Exhibit No.Registrant(s)Description
99.1Pinnacle West
Arizona Public Service Company
99.2Pinnacle West
Arizona Public Service Company


SIGNATURES

    Pursuant to the requirements of the Securities Exchange Act of 1934, each registrant has duly caused this report to be signed on its behalf by the undersigned hereunto duly authorized.

PINNACLE WEST CAPITAL CORPORATION
(Registrant)
Dated: May 5, 2021By: /s/ Theodore N. Geisler    
Theodore N. Geisler
Senior Vice President and
Chief Financial Officer
ARIZONA PUBLIC SERVICE COMPANY
(Registrant)
Dated: May 5, 2021By: /s/ Theodore N. Geisler    
Theodore N. Geisler
Senior Vice President and
Chief Financial Officer


a2q2020earningsfinal0_imag.jpg
FOR IMMEDIATE RELEASEMay 5, 2021
Media Contact:
Analyst Contact:
Alan Bunnell (602) 250-3376
Stefanie Layton (602) 250-4541
Website:pinnaclewest.com

PINNACLE WEST REPORTS 2021 FIRST-QUARTER EARNINGS

•    Quarterly results in line with company’s expectations
•    Customer growth at 2.1% for quarter as Arizona growth remains robust
•    Company well prepared to deliver reliable service through Arizona’s extreme summer temperatures
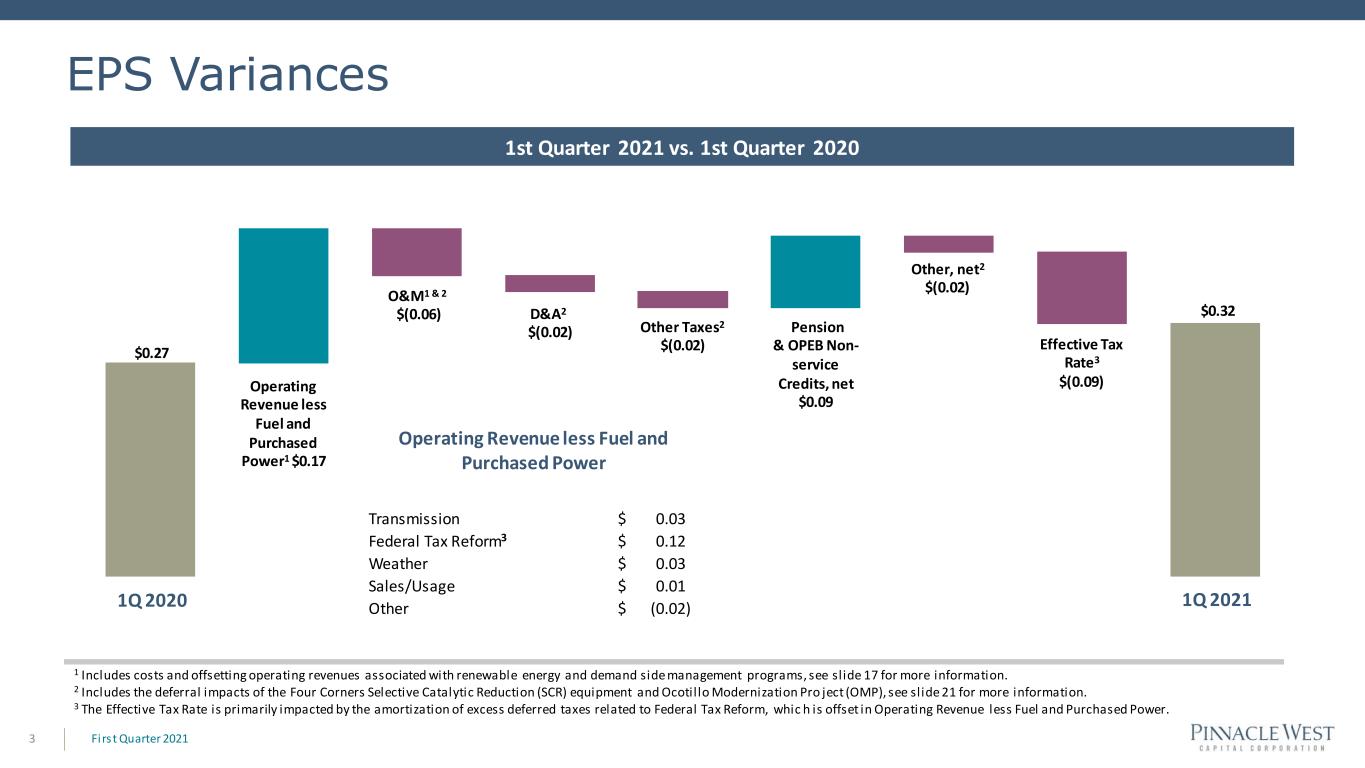
PHOENIX – Pinnacle West Capital Corp. (NYSE: PNW) today reported consolidated net income attributable to common shareholders of $35.6 million, or $0.32 per diluted share of common stock, for the quarter ended March 31, 2021. This result compares with $30.0 million, or $0.27 per diluted share, for the same period in 2020.

First-quarter 2021 results were positively impacted by weather, higher transmission revenues, and higher pension and other postretirement non-service credits. These factors offset a moderate increase in operations and maintenance expenses, due largely to higher planned plant outages to perform seasonal maintenance ahead of summer demand.

“We began 2021 on solid footing with first-quarter results in line with expectations and strong customer growth of 2.1% as families and businesses continue to choose to put down roots in Arizona,” said Pinnacle West Chairman, President and Chief Executive Officer Jeff Guldner. “With temperatures already heating up here, our employees are focused on critical preparations to deliver reliable, affordable power over our peak summer season – when customers need it most to cool their homes and businesses.”

Employees work year-round to prepare for summer demand
Key elements of the company’s summer readiness include resource planning, sufficient reserve margins, customer partnerships to manage peak demand, fire mitigation, and operational preparedness.

The company is projecting peak demand of 7,521 megawatts this year – lower than last summer’s record-breaking 7,660 megawatts, but 406 megawatts higher than 2019. This summer, the company’s diverse resource mix includes innovative demand response programs – including Peak Solutions for commercial and industrial customers and Cool Rewards for residential customers – that it can call upon to reduce load by up to about 127 megawatts, if needed. Customer demand response proved to be an effective tool for reducing system demand during 2020’s historic heat wave. Additionally, the company is in the process of procuring 450 megawatts of seasonal peaking capacity, including hydro power, to support summer preparedness.

Seasonal readiness procedures at the company’s power plants include walkdowns to ensure good material conditions and critical control system surveys – all while continuing to adhere to COVID-19 safety protocols. On the transmission and distribution side, preventative maintenance, fire mitigation patrols and summer-specific substation maintenance help support customer reliability through even the


hottest days. The company also plans for the unexpected – conducting emergency operations drills and coordinating on fire and emergency management with federal, state and local agencies.

The company’s focus on summer readiness extends to its work to deliver an industry-leading customer experience. Customer touchpoints – including an interactive outage map and email and text alerts – are being enhanced ahead of Arizona’s monsoon season, which starts in mid-June. In conjunction with a shift to a 24/7 call center in August 2020, these upgrades will help keep customers better informed during any outages.

Conference Call and Webcast
Pinnacle West invites interested parties to listen to the live webcast of management’s conference call to discuss the company’s 2021 first-quarter results, as well as recent developments, at noon ET (9 a.m. Arizona time) today, May 5. A replay of the webcast can be accessed at pinnaclewest.com/presentations for 30 days. To access the live conference call by telephone, dial (877) 407-8035 or (201) 689-8035 for international callers. A replay of the call also will be available until 11:59 p.m. ET, Wednesday, May 12, 2021, by calling (877) 481-4010 in the U.S. and Canada or (919) 882-2331 internationally and entering passcode 40595.

General Information
Pinnacle West Capital Corp., an energy holding company based in Phoenix, has consolidated assets of approximately $20 billion, about 6,300 megawatts of generating capacity and slightly more than 6,000 employees in Arizona and New Mexico. Through its principal subsidiary, Arizona Public Service, the company provides retail electricity service to more than 1.3 million Arizona homes and businesses. For more information about Pinnacle West, visit the company’s website at pinnaclewest.com.

Dollar amounts in this news release are after income taxes. Earnings per share amounts are based on average diluted common shares outstanding. For more information on Pinnacle West’s operating statistics and earnings, please visit pinnaclewest.com/investors.

FORWARD-LOOKING STATEMENTS

This press release contains forward-looking statements based on current expectations. These forward-looking statements are often identified by words such as "estimate," "predict," "may," "believe," "plan," "expect," "require," "intend," "assume," "project," "anticipate," "goal," "seek," "strategy," "likely," "should," "will," "could," and similar words. Because actual results may differ materially from expectations, we caution readers not to place undue reliance on these statements. A number of factors could cause future results to differ materially from historical results, or from outcomes currently expected or sought by Pinnacle West or APS. These factors include, but are not limited to:

•    the potential effects of the continued Coronavirus pandemic, including, but not limited to, demand for energy, economic growth, our employees and contractors, supply chain, expenses, capital markets, capital projects, operations and maintenance activities, uncollectable accounts, liquidity, cash flows or other unpredictable events;
•    our ability to manage capital expenditures and operations and maintenance costs while maintaining reliability and customer service levels;
•    variations in demand for electricity, including those due to weather, seasonality, the general economy or social conditions, customer and sales growth (or decline), the effects of energy conservation measures and distributed generation, and technological advancements;
•    power plant and transmission system performance and outages;
•    competition in retail and wholesale power markets;
•    regulatory and judicial decisions, developments and proceedings;
•    new legislation, ballot initiatives and regulation, including those relating to environmental requirements, regulatory and energy policy, nuclear plant operations and potential deregulation of retail electric markets;


•    fuel and water supply availability;
•    our ability to achieve timely and adequate rate recovery of our costs through our rates and adjustor recovery mechanisms, including returns on and of debt and equity capital investment;
•    our ability to meet renewable energy and energy efficiency mandates and recover related costs;
•    the ability of APS to achieve its clean energy goals (including a goal by 2050 of 100% clean, carbon-free electricity) and, if these goals are achieved, the impact of such achievement on APS, its customers, and its business, financial condition and results of operations;
•    risks inherent in the operation of nuclear facilities, including spent fuel disposal uncertainty;
•    current and future economic conditions in Arizona, including in real estate markets;
•    the direct or indirect effect on our facilities or business from cybersecurity threats or intrusions, data security breaches, terrorist attack, physical attack, severe storms, droughts, or other catastrophic events, such as fires, explosions, pandemic health events, or similar occurrences;
•    the development of new technologies which may affect electric sales or delivery;
•    the cost of debt and equity capital and the ability to access capital markets when required;
•    environmental, economic and other concerns surrounding coal-fired generation, including regulation of greenhouse gas emissions;
•    volatile fuel and purchased power costs;
•    the investment performance of the assets of our nuclear decommissioning trust, pension, and other postretirement benefit plans and the resulting impact on future funding requirements;
•    the liquidity of wholesale power markets and the use of derivative contracts in our business;
•    potential shortfalls in insurance coverage;
•    new accounting requirements or new interpretations of existing requirements;
•    generation, transmission and distribution facility and system conditions and operating costs;
•    the ability to meet the anticipated future need for additional generation and associated transmission facilities in our region;
•    the willingness or ability of our counterparties, power plant participants and power plant landowners to meet contractual or other obligations or extend the rights for continued power plant operations; and
•    restrictions on dividends or other provisions in our credit agreements and Arizona Corporation Commission orders.

These and other factors are discussed in Risk Factors described in Part 1, Item 1A of the Pinnacle West/APS Annual Report on Form 10-K for the fiscal year ended December 31, 2020, which readers should review carefully before placing any reliance on our financial statements or disclosures. Neither Pinnacle West nor APS assumes any obligation to update these statements, even if our internal estimates change, except as required by law.


# # #


PINNACLE WEST CAPITAL CORPORATION
CONSOLIDATED STATEMENTS OF INCOME
(unaudited)
(dollars and shares in thousands, except per share amounts)
 THREE MONTHS ENDED
 MARCH 31,
20212020
Operating Revenues$696,475 $661,930 
Operating Expenses
Fuel and purchased power198,227 188,521 
Operations and maintenance230,055 221,318 
Depreciation and amortization157,820 154,079 
Taxes other than income taxes59,483 56,768 
Other expenses3,356 822 
    Total648,941 621,508 
Operating Income47,534 40,422 
Other Income (Deductions)
Allowance for equity funds used during construction 9,207 7,697 
Pension and other postretirement non-service credits - net27,791 13,911 
Other income12,429 12,569 
Other expense(3,853)(4,784)
   Total45,574 29,393 
Interest Expense
Interest charges61,938 59,234 
Allowance for borrowed funds used during construction (4,994)(4,076)
   Total56,944 55,158 
Income Before Income Taxes36,164 14,657 
Income Taxes(4,350)(20,209)
Net Income 40,514 34,866 
Less: Net income attributable to noncontrolling interests4,873 4,873 
Net Income Attributable To Common Shareholders$35,641$29,993
Weighted-Average Common Shares Outstanding - Basic112,829 112,594 
Weighted-Average Common Shares Outstanding - Diluted113,093 112,862 
Earnings Per Weighted-Average Common Share Outstanding
Net income attributable to common shareholders - basic$0.32$0.27
Net income attributable to common shareholders - diluted$0.32$0.27

POWERING GROWTH DELIVERING VALUE First Quarter 2021 Results May 5, 2021 1


Forward Looking Statements 2 This presentation contains forward-looking statements based on current expectations, including statements regarding our earnings guidance and financial outlook and goals. These forward-looking statements are often identified by words such as “estimate,” “predict,” “may,” “believe,” “plan,” “expect,” “require,” “intend,” “assume,” “project,” "anticipate," "goal," "seek," "strategy," "likely," "should," "will," "could," and similar words. Because actual results may differ materially from expectations, we caution you not to place undue reliance on these statements. A number of factors could cause future results to differ materially from historical results, or from outcomes currently expected or sought by Pinnacle West or APS. These factors include, but are not limited to: the potential effects of the continued COVID-19 pandemic, including, but not limited to, demand for energy, economic growth, our employees and contractors, supply chain, expenses, capital markets, capital projects, operations and maintenance activities, uncollectable accounts, liquidity, cash flows, or other unpredictable events; our ability to manage capital expenditures and operations and maintenance costs while maintaining reliability and customer service levels; variations in demand for electricity, including those due to weather seasonality, the general economy or social conditions, customer and sales growth (or decline), the effects of energy conservation measures and distributed generation, and technological advancements; power plant and transmission system performance and outages; competition in retail and wholesale power markets; regulatory and judicial decisions, developments and proceedings; new legislation, ballot initiatives and regulation, including those relating to environmental requirements, regulatory and energy policy, nuclear plant operations and potential deregulation of retail electric markets; fuel and water supply availability; our ability to achieve timely and adequate rate recovery of our costs through our rates and adjustor recovery mechanisms, including returns on and of debt and equity capital investments; our ability to meet renewable energy and energy efficiency mandates and recover related costs; the ability of APS to achieve its clean energy goals (including a goal by 2050 of 100% clean, carbon-free electricity) and, if these goals are achieved, the impact of such achievement on APS, its customers, and its business, financial condition and results of operations; risks inherent in the operation of nuclear facilities, including spent fuel disposal uncertainty; current and future economic conditions in Arizona, including in real estate markets; the direct or indirect effect on our facilities or business from cybersecurity threats or intrusions, data security breaches, terrorist attack, physical attack, severe storms, droughts, or other catastrophic events, such as fires, explosions, pandemic health events, or similar occurrences; the development of new technologies which may affect electric sales or delivery; the cost of debt and equity capital and the ability to access capital markets when required; environmental, economic and other concerns surrounding coal-fired generation, including regulation of greenhouse gas emissions; volatile fuel and purchased power costs; the investment performance of the assets of our nuclear decommissioning trust, pension, and other postretirement benefit plans and the resulting impact on future funding requirements; the liquidity of wholesale power markets and the use of derivative contracts in our business; potential shortfalls in insurance coverage; new accounting requirements or new interpretations of existing requirements; generation, transmission and distribution facility and system conditions and operating costs; the ability to meet the anticipated future need for additional generation and associated transmission facilities in our region; the willingness or ability of our counterparties, power plant participants and power plant land owners to meet contractual or other obligations or continue or extend the rights for continued power plant operations; and restrictions on dividends or other provisions in our credit agreements and ACC orders. These and other factors are discussed in Risk Factors described in Part I, Item 1A of the Pinnacle West/APS Annual Report on Form 10-K for the fiscal year ended December 31, 2020, which you should review carefully before placing any reliance on our financial statements, disclosures or earnings outlook. Neither Pinnacle West nor APS assumes any obligation to update these statements, even if our internal estimates change, except as required by law. In this presentation, references to net income and earnings per share (EPS) refer to amounts attributable to common shareholders. Firs t Quarter 2021


EPS Variances Firs t Quarter 20213 1 Includes costs and offsetting operating revenues associated with renewable energy and demand side management programs, see slide 17 for more information. 2 Includes the deferral impacts of the Four Corners Selective Catalytic Reduction (SCR) equipment and Ocotil lo Modernization Pro ject (OMP), see slide 21 for more information. 3 The Effective Tax Rate is primarily impacted by the amortization of excess deferred taxes related to Federal Tax Reform, whic h is offset in Operating Revenue less Fuel and Purchased Power. 1Q 2020 1Q 2021 O&M1 & 2 $(0.06) $0.27 $0.32 Operating Revenue less Fuel and Purchased Power1 $0.17 Pension & OPEB Non- service Credits, net $0.09 Effective Tax Rate3 $(0.09) Other, net2 $(0.02) D&A2 $(0.02) Other Taxes 2 $(0.02) 1st Quarter 2021 vs. 1st Quarter 2020 Operating Revenue less Fuel and Purchased Power Transmission Federal Tax Reform3 Weather Sales/Usage Other $ $ $ $ $ 0.03 0.12 0.03 0.01 (0.02)


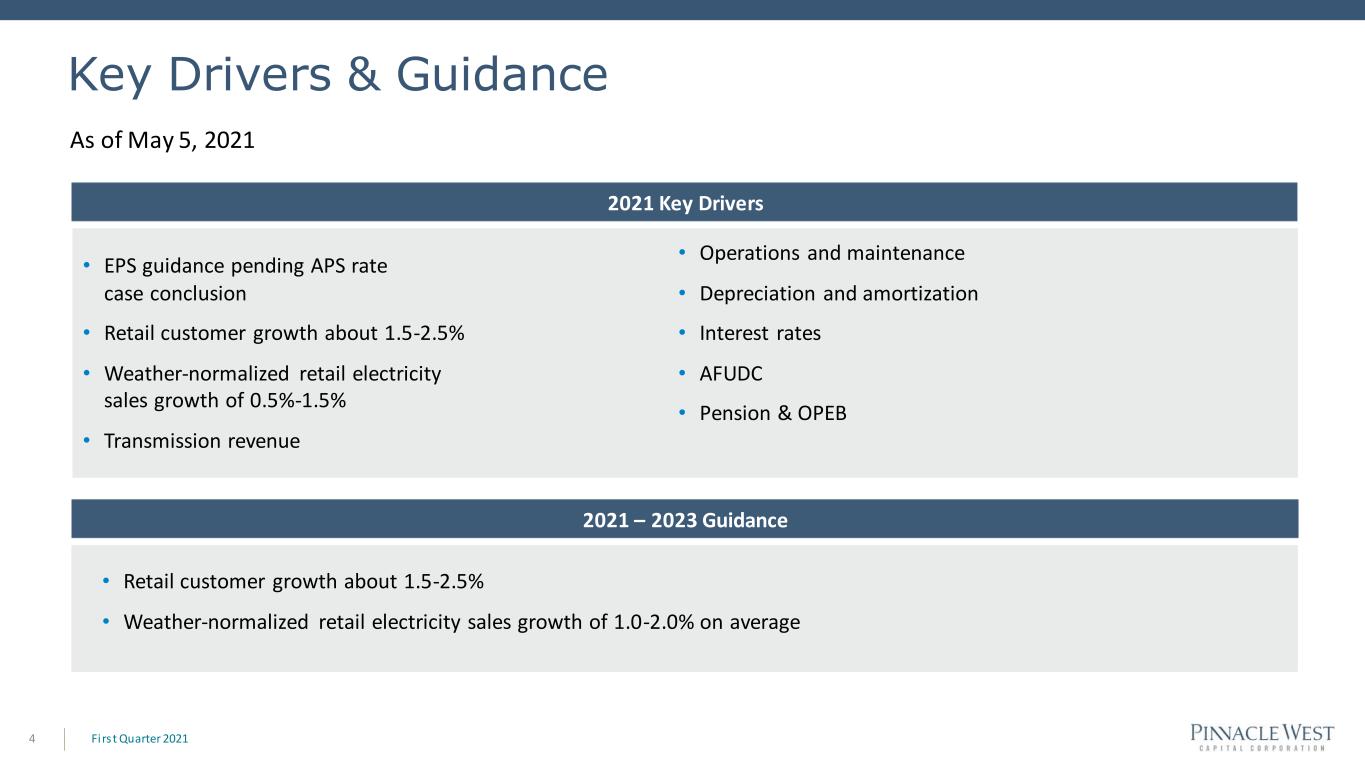
Key Drivers & Guidance Firs t Quarter 20214 As of May 5, 2021 • Retail customer growth about 1.5-2.5% • Weather-normalized retail electricity sales growth of 1.0-2.0% on average 2021 – 2023 Guidance 2021 Key Drivers • EPS guidance pending APS rate case conclusion • Retail customer growth about 1.5-2.5% • Weather-normalized retail electricity sales growth of 0.5%-1.5% • Transmission revenue • Operations and maintenance • Depreciation and amortization • Interest rates • AFUDC • Pension & OPEB


Long-Term Debt Maturity Profile Firs t Quarter 20215 0 250 500 750 1,000 1,250 2021 2023 2025 2027 2029 2031 2033 2035 2037 2039 2041 2043 2045 2047 2049 APS Long-Term Debt PNW Long-Term Debt($MM) As of March 31, 2021


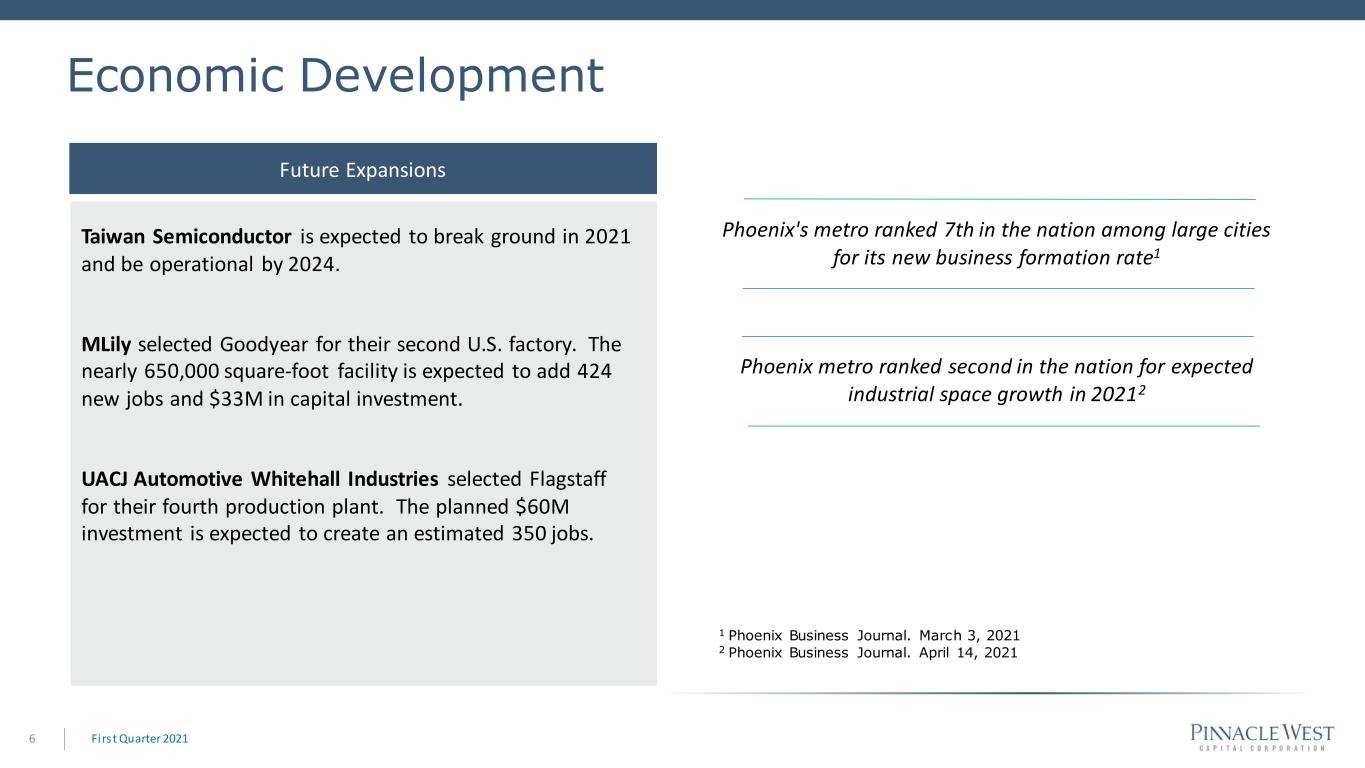
Economic Development Firs t Quarter 20216 Phoenix's metro ranked 7th in the nation among large cities for its new business formation rate1 Phoenix metro ranked second in the nation for expected industrial space growth in 20212 Future Expansions Taiwan Semiconductor is expected to break ground in 2021 and be operational by 2024. MLily selected Goodyear for their second U.S. factory. The nearly 650,000 square-foot facility is expected to add 424 new jobs and $33M in capital investment. UACJ Automotive Whitehall Industries selected Flagstaff for their fourth production plant. The planned $60M investment is expected to create an estimated 350 jobs. 1 Phoenix Business Journal. March 3, 2021 2 Phoenix Business Journal. April 14, 2021


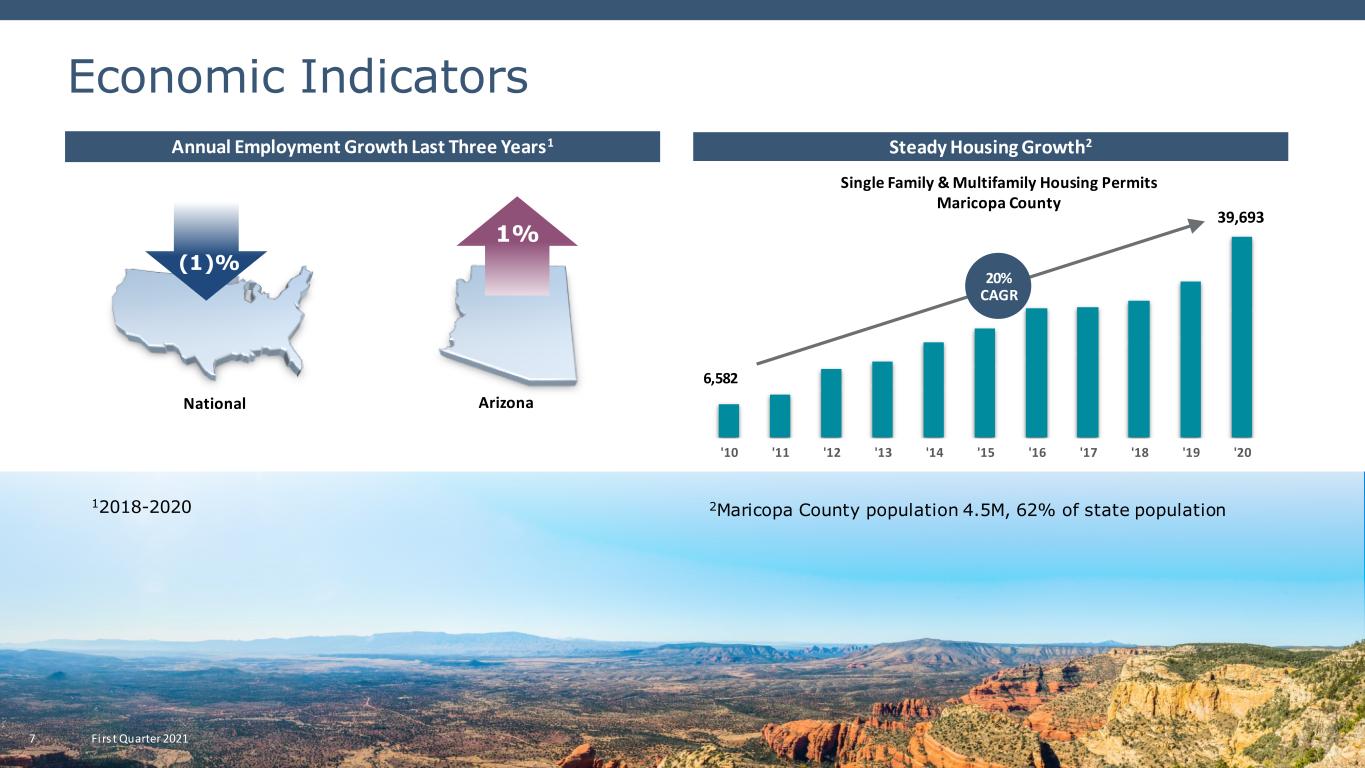
7 Economic Indicators Annual Employment Growth Last Three Years1 Steady Housing Growth2 '10 '11 '12 '13 '14 '15 '16 '17 '18 '19 '20 Single Family & Multifamily Housing Permits Maricopa County 20% CAGR 6,582 39,693 National Arizona (1)% 1% Firs t Quarter 2021 2Maricopa County population 4.5M, 62% of state population 12018-2020


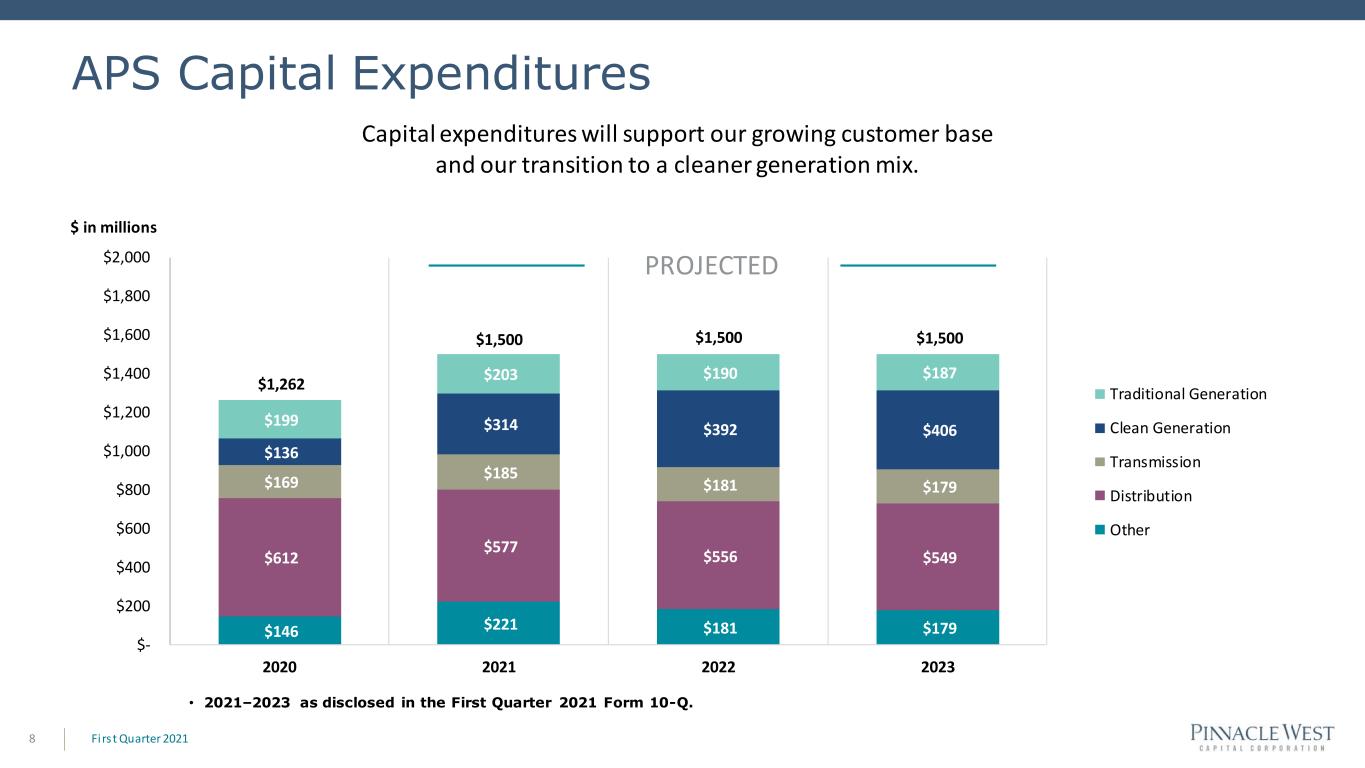
APS Capital Expenditures Firs t Quarter 20218 Capital expenditures will support our growing customer base and our transition to a cleaner generation mix. $146 $221 $181 $179 $612 $577 $556 $549 $169 $185 $181 $179 $136 $314 $392 $406 $199 $203 $190 $187 $1,262 $1,500 $1,500 $1,500 $- $200 $400 $600 $800 $1,000 $1,200 $1,400 $1,600 $1,800 $2,000 2020 2021 2022 2023 Traditional Generation Clean Generation Transmission Distribution Other • 2021–2023 as disclosed in the First Quarter 2021 Form 10-Q. $ in millions PROJECTED


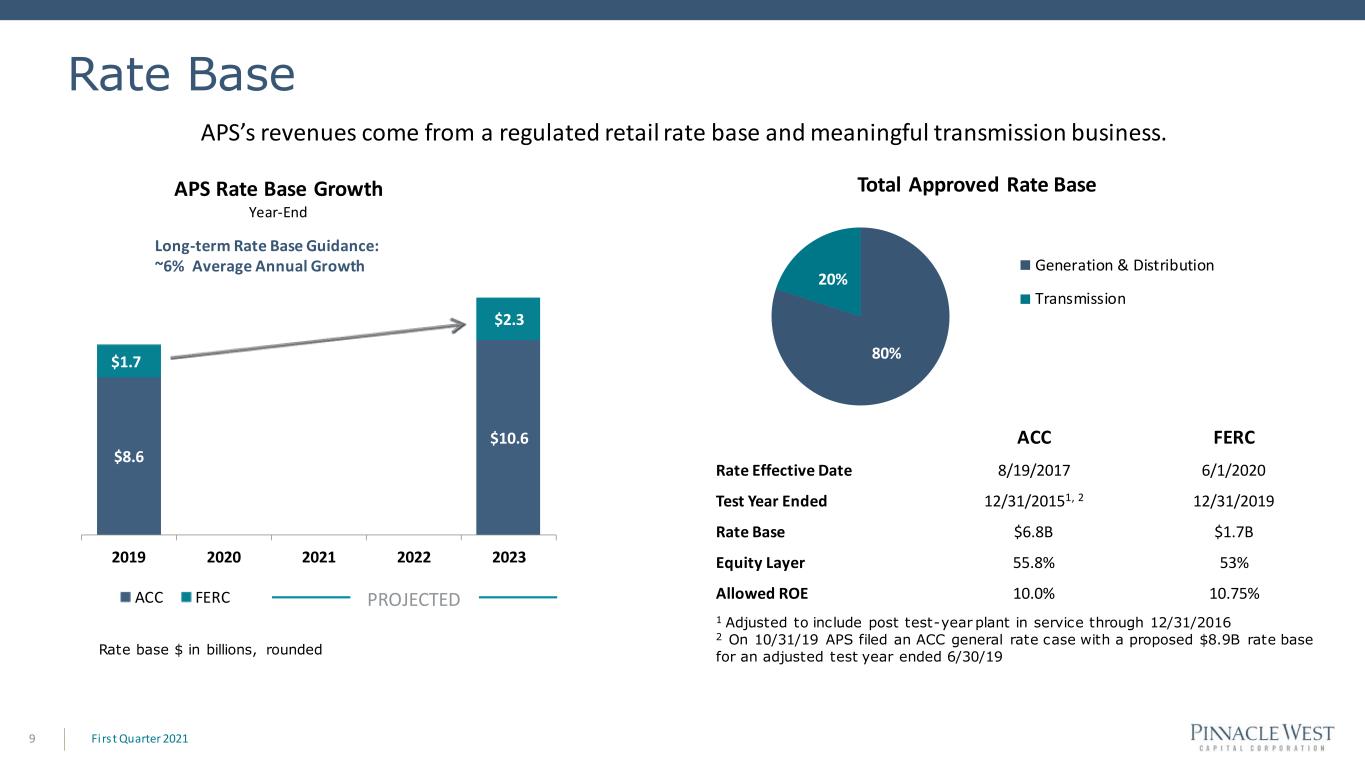
Rate Base Firs t Quarter 20219 $8.6 $10.6 $1.7 $2.3 2019 2020 2021 2022 2023 APS Rate Base Growth Year-End ACC FERC Total Approved Rate Base ACC FERC Rate Effective Date 8/19/2017 6/1/2020 Test Year Ended 12/31/20151, 2 12/31/2019 Rate Base $6.8B $1.7B Equity Layer 55.8% 53% Allowed ROE 10.0% 10.75% 1 Adjusted to include post test-year plant in service through 12/31/2016 2 On 10/31/19 APS filed an ACC general rate case with a proposed $8.9B rate base for an adjusted test year ended 6/30/19 80% 20% Generation & Distribution Transmission Rate base $ in billions, rounded APS’s revenues come from a regulated retail rate base and meaningful transmission business. Long-term Rate Base Guidance: ~6% Average Annual Growth PROJECTED


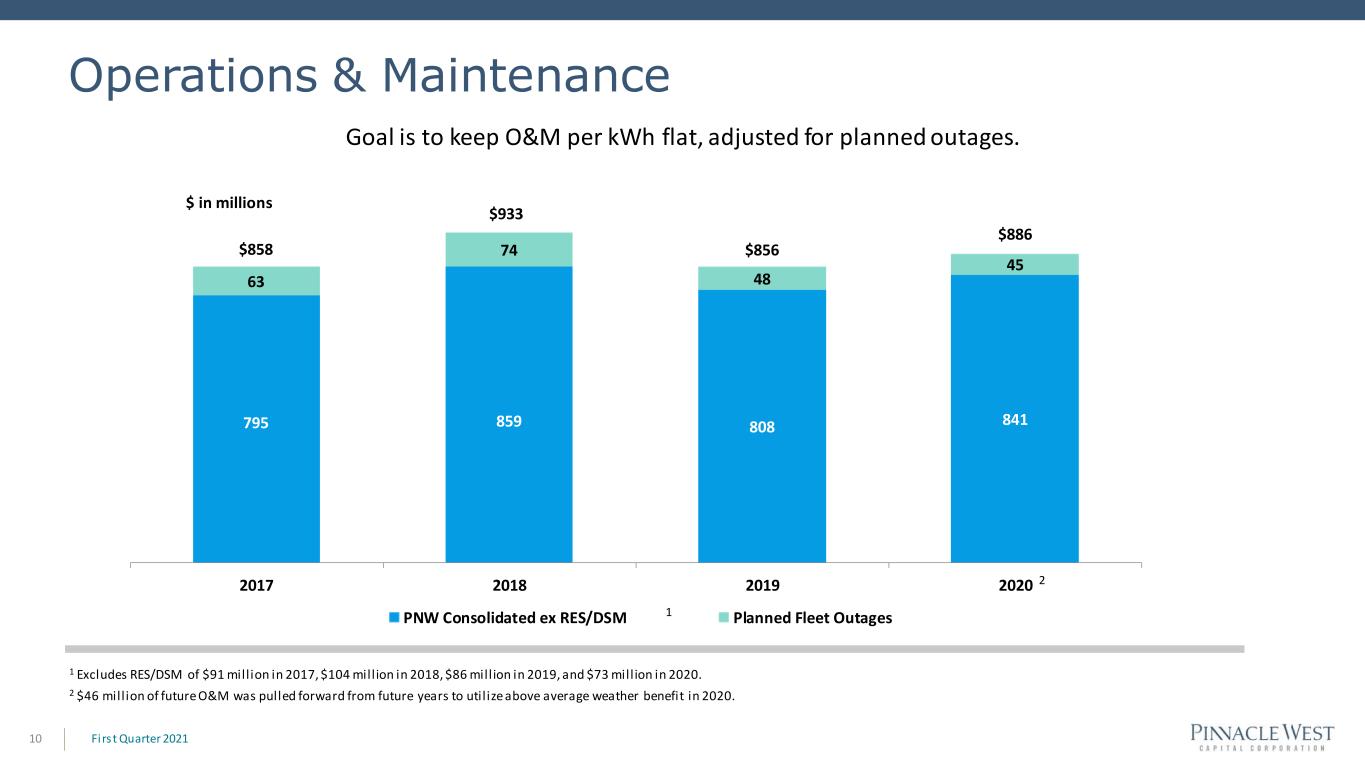
Operations & Maintenance Firs t Quarter 202110 795 859 808 841 63 74 48 45 $858 $933 $856 $886 2017 2018 2019 2020 PNW Consolidated ex RES/DSM Planned Fleet Outages 2 1 Excludes RES/DSM of $91 mill ion in 2017, $104 mill ion in 2018, $86 mill ion in 2019, and $73 mill ion in 2020. 2 $46 mill ion of future O&M was pulled forward from future years to util ize above average weather benefit in 2020. $ in millions Goal is to keep O&M per kWh flat, adjusted for planned outages. 1


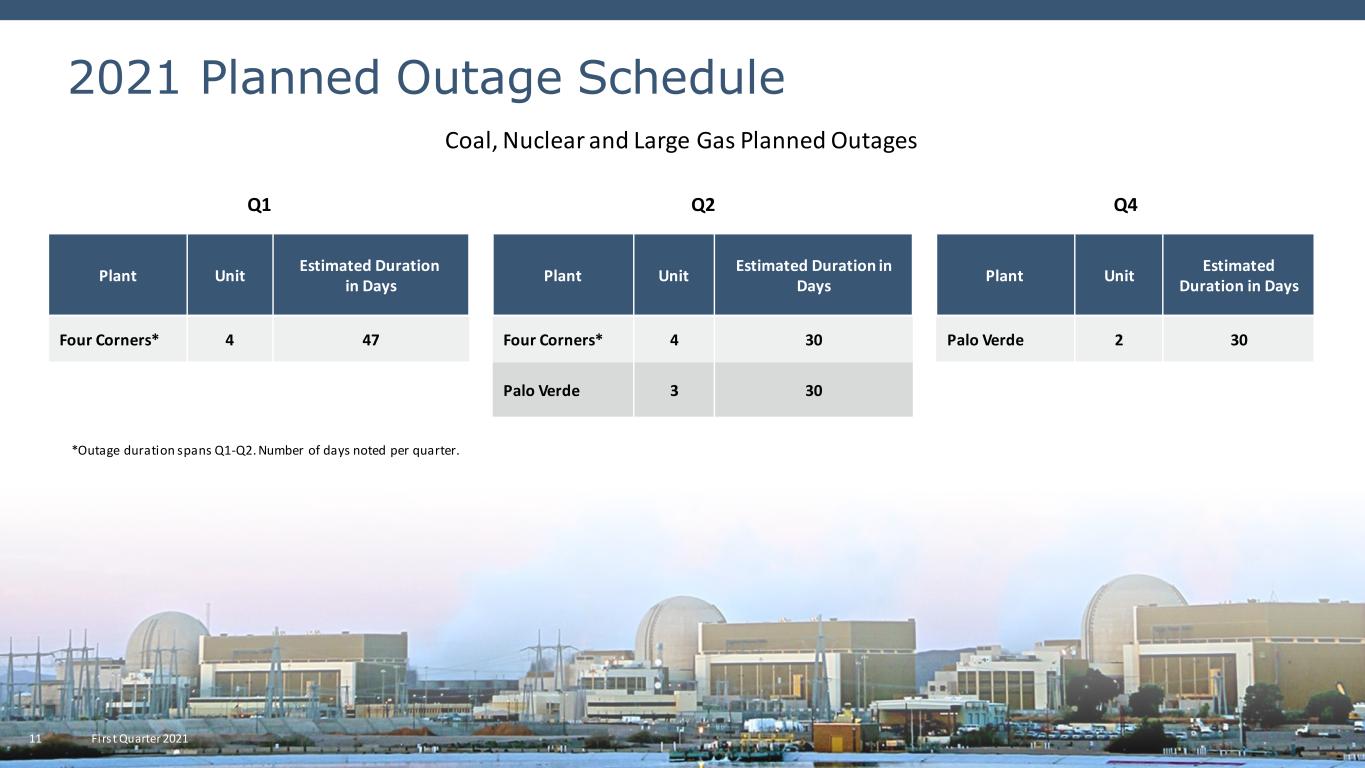
2021 Planned Outage Schedule Firs t Quarter 202111 Coal, Nuclear and Large Gas Planned Outages Q1 Q2 Q4 Plant Unit Estimated Duration in Days Plant Unit Estimated Duration in Days Plant Unit Estimated Duration in Days Four Corners* 4 47 Four Corners* 4 30 Palo Verde 2 30 Palo Verde 3 30 *Outage duration spans Q1-Q2. Number of days noted per quarter.


APPENDIX 12


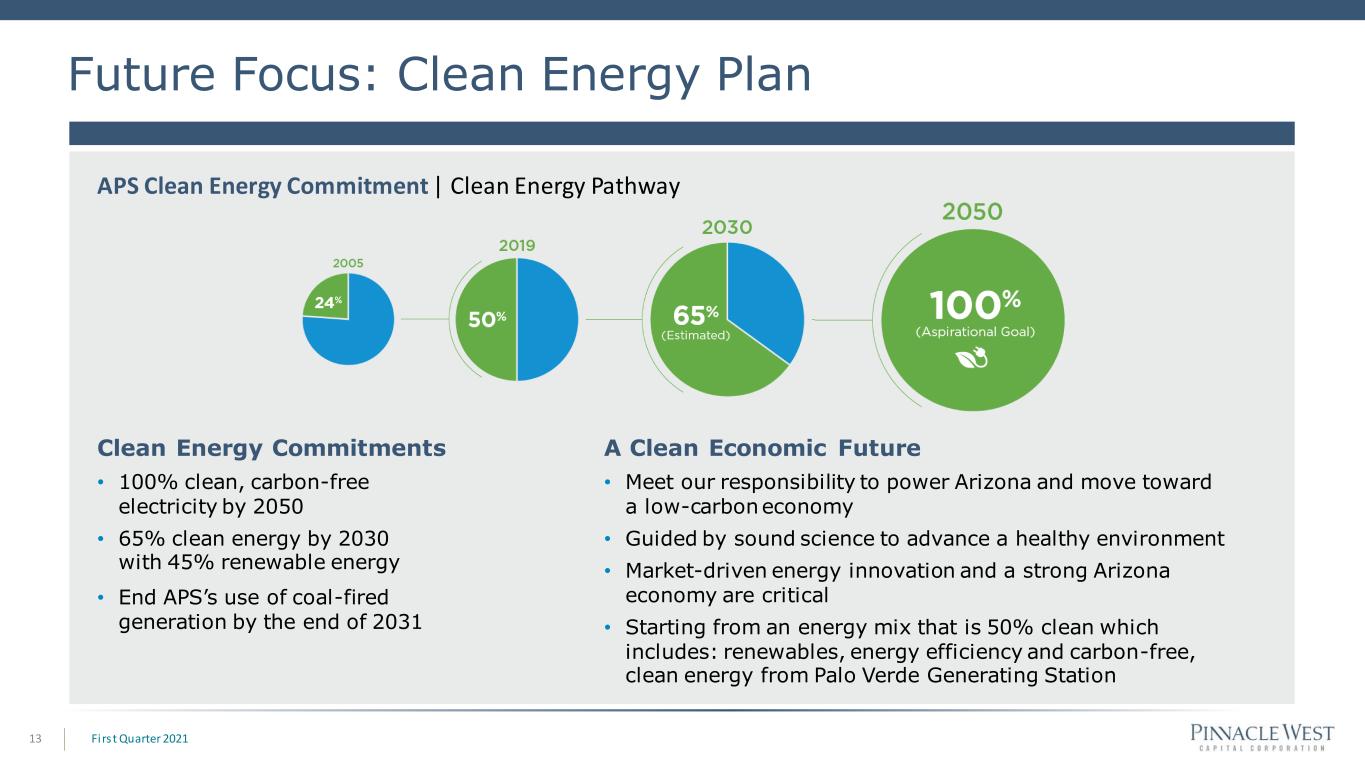
Future Focus: Clean Energy Plan Firs t Quarter 202113 Clean Energy Commitments • 100% clean, carbon-free electricity by 2050 • 65% clean energy by 2030 with 45% renewable energy • End APS’s use of coal-fired generation by the end of 2031 A Clean Economic Future • Meet our responsibility to power Arizona and move toward a low-carbon economy • Guided by sound science to advance a healthy environment • Market-driven energy innovation and a strong Arizona economy are critical • Starting from an energy mix that is 50% clean which includes: renewables, energy efficiency and carbon-free, clean energy from Palo Verde Generating Station APS Clean Energy Commitment | Clean Energy Pathway


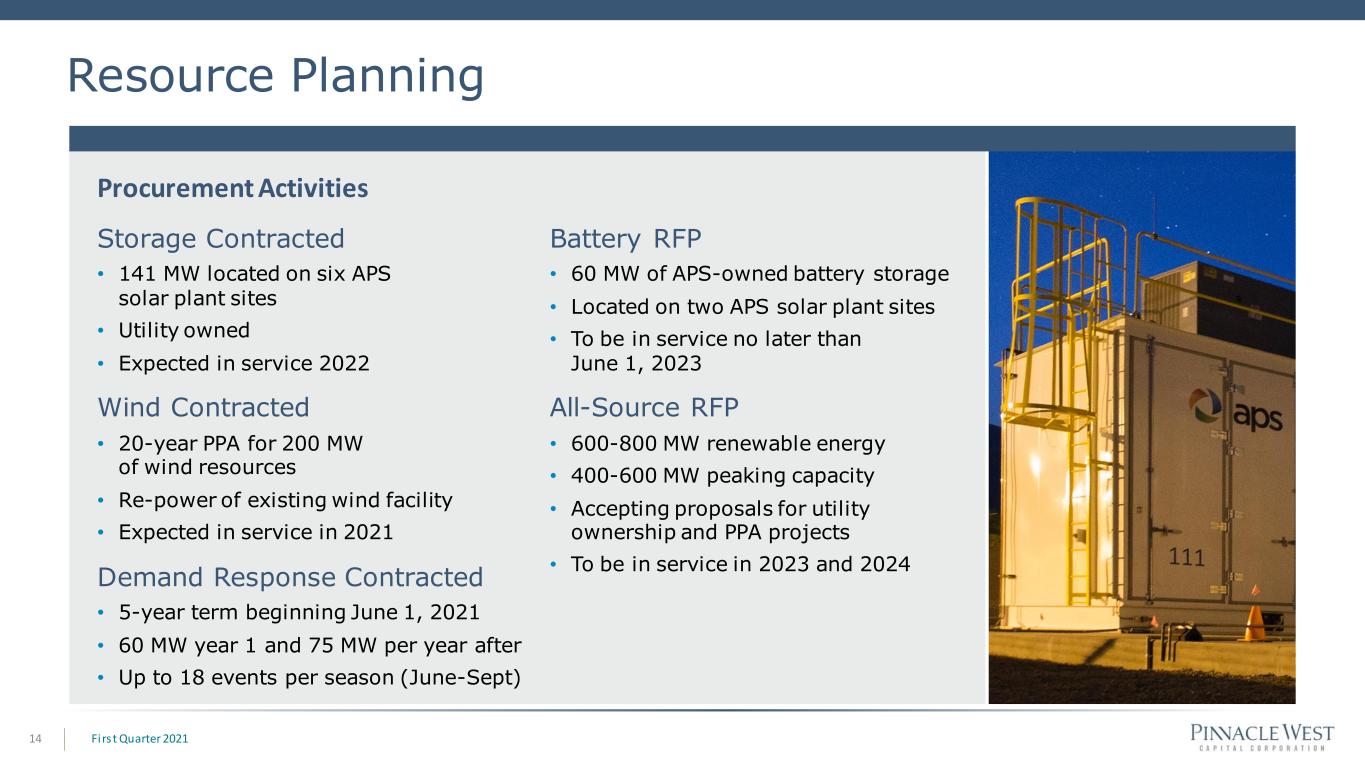
Resource Planning Firs t Quarter 202114 Storage Contracted • 141 MW located on six APS solar plant sites • Utility owned • Expected in service 2022 Wind Contracted • 20-year PPA for 200 MW of wind resources • Re-power of existing wind facility • Expected in service in 2021 Demand Response Contracted • 5-year term beginning June 1, 2021 • 60 MW year 1 and 75 MW per year after • Up to 18 events per season (June-Sept) Battery RFP • 60 MW of APS-owned battery storage • Located on two APS solar plant sites • To be in service no later than June 1, 2023 All-Source RFP • 600-800 MW renewable energy • 400-600 MW peaking capacity • Accepting proposals for utility ownership and PPA projects • To be in service in 2023 and 2024 Procurement Activities


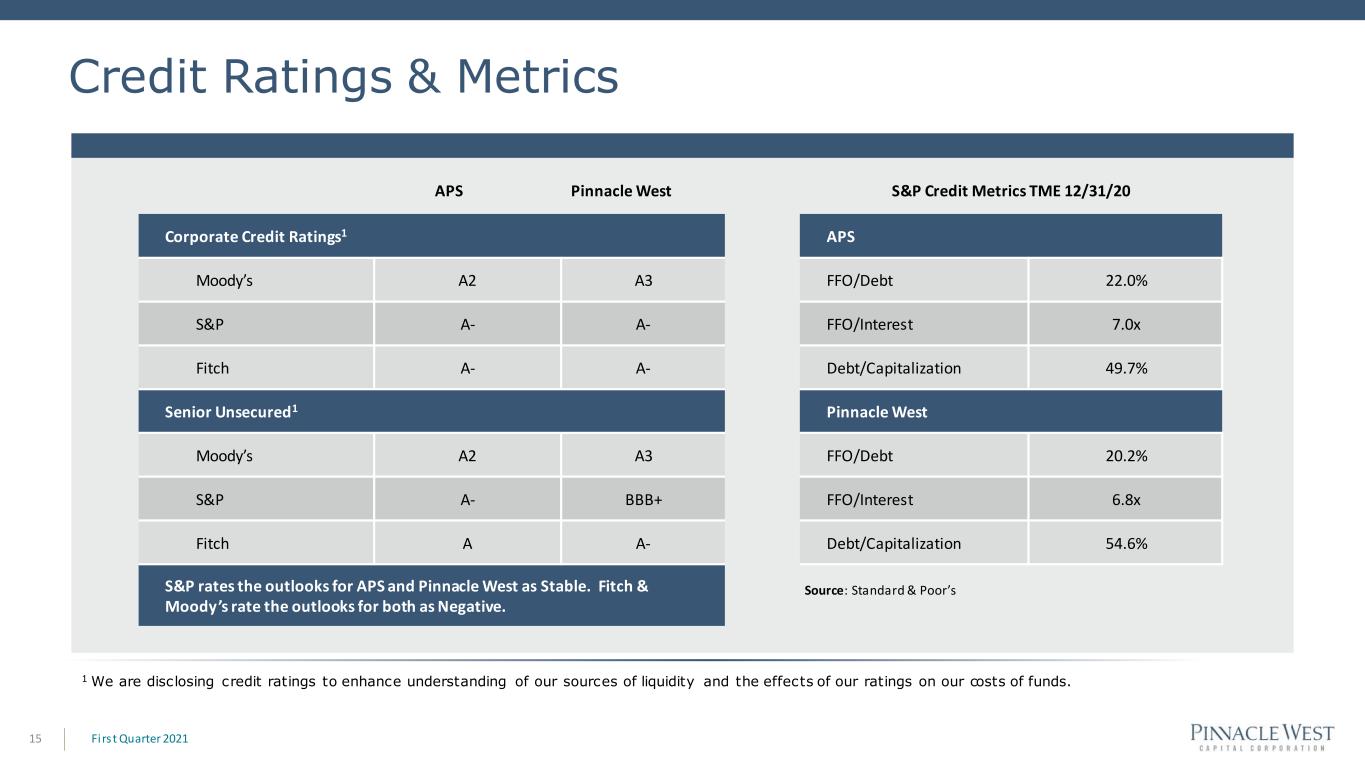
Credit Ratings & Metrics Firs t Quarter 202115 Source: Standard & Poor’s APS Pinnacle West Corporate Credit Ratings1 Moody’s A2 A3 S&P A- A- Fitch A- A- Senior Unsecured1 Moody’s A2 A3 S&P A- BBB+ Fitch A A- S&P rates the outlooks for APS and Pinnacle West as Stable. Fitch & Moody’s rate the outlooks for both as Negative. 1 We are disclosing credit ratings to enhance understanding of our sources of liquidity and the effects of our ratings on our costs of funds. S&P Credit Metrics TME 12/31/20 APS FFO/Debt 22.0% FFO/Interest 7.0x Debt/Capitalization 49.7% Pinnacle West FFO/Debt 20.2% FFO/Interest 6.8x Debt/Capitalization 54.6%


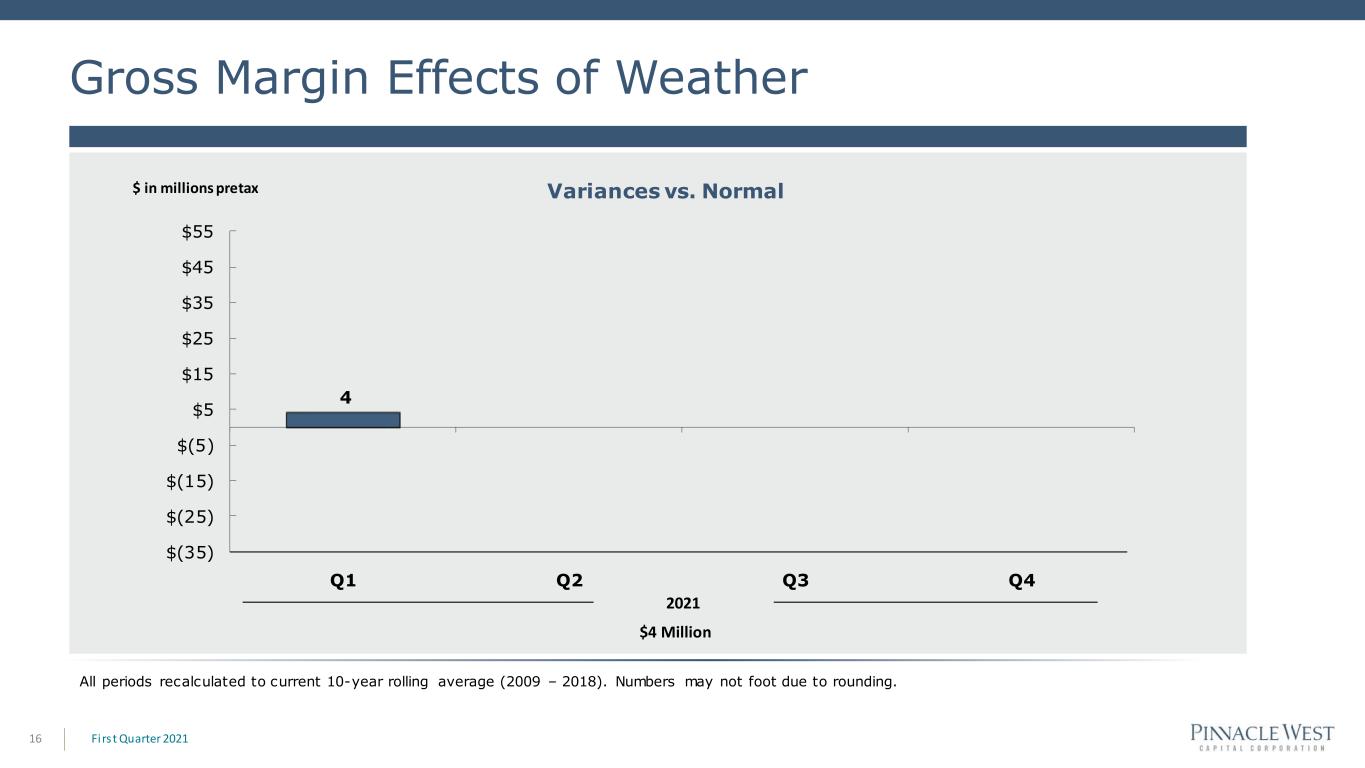
4 $(35) $(25) $(15) $(5) $5 $15 $25 $35 $45 $55 Q1 Q2 Q3 Q4 Gross Margin Effects of Weather Firs t Quarter 202116 Variances vs. Normal$ in millions pretax 2021 $4 Million All periods recalculated to current 10-year rolling average (2009 – 2018). Numbers may not foot due to rounding.


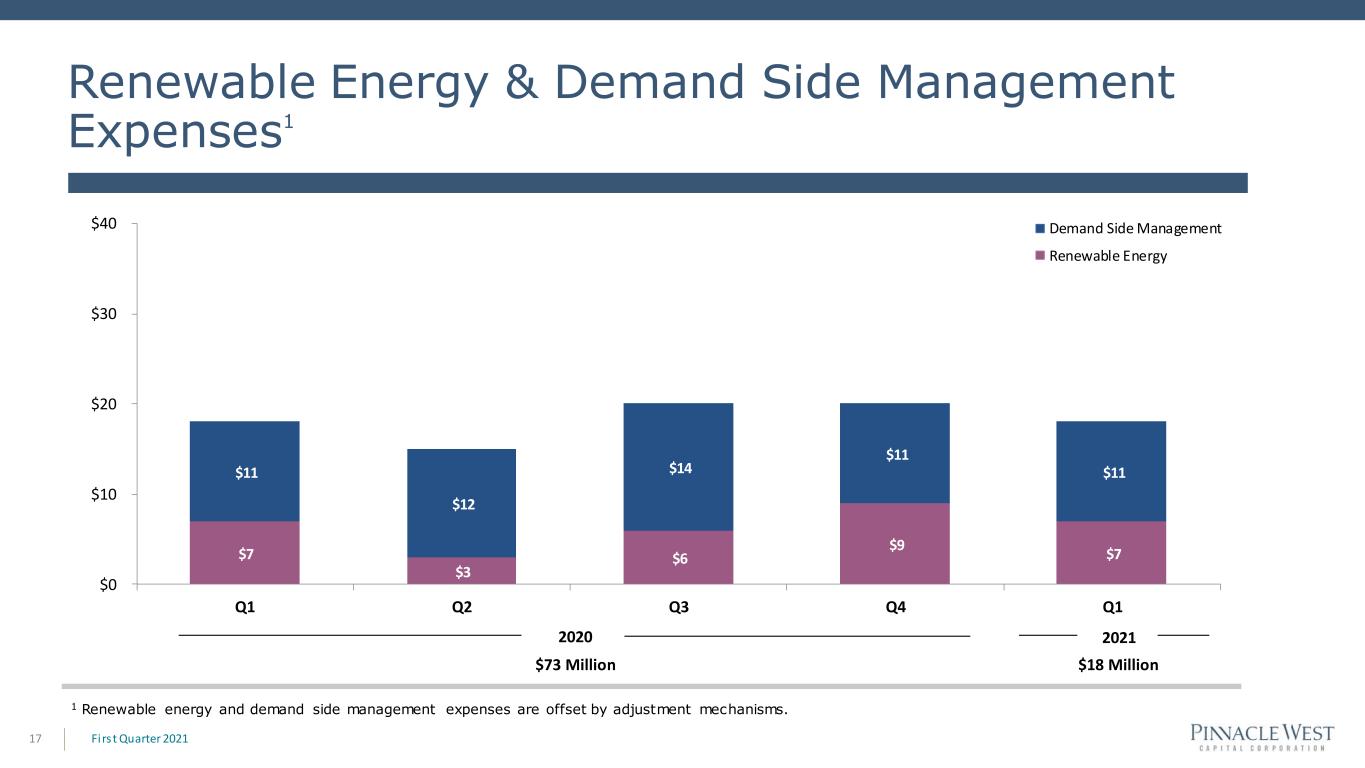
Renewable Energy & Demand Side Management Expenses1 Firs t Quarter 202117 $7 $3 $6 $9 $7 $11 $12 $14 $11 $11 $0 $10 $20 $30 $40 Q1 Q2 Q3 Q4 Q1 Demand Side Management Renewable Energy 2020 $73 Million 1 Renewable energy and demand side management expenses are offset by adjustment mechanisms. 2021 $18 Million


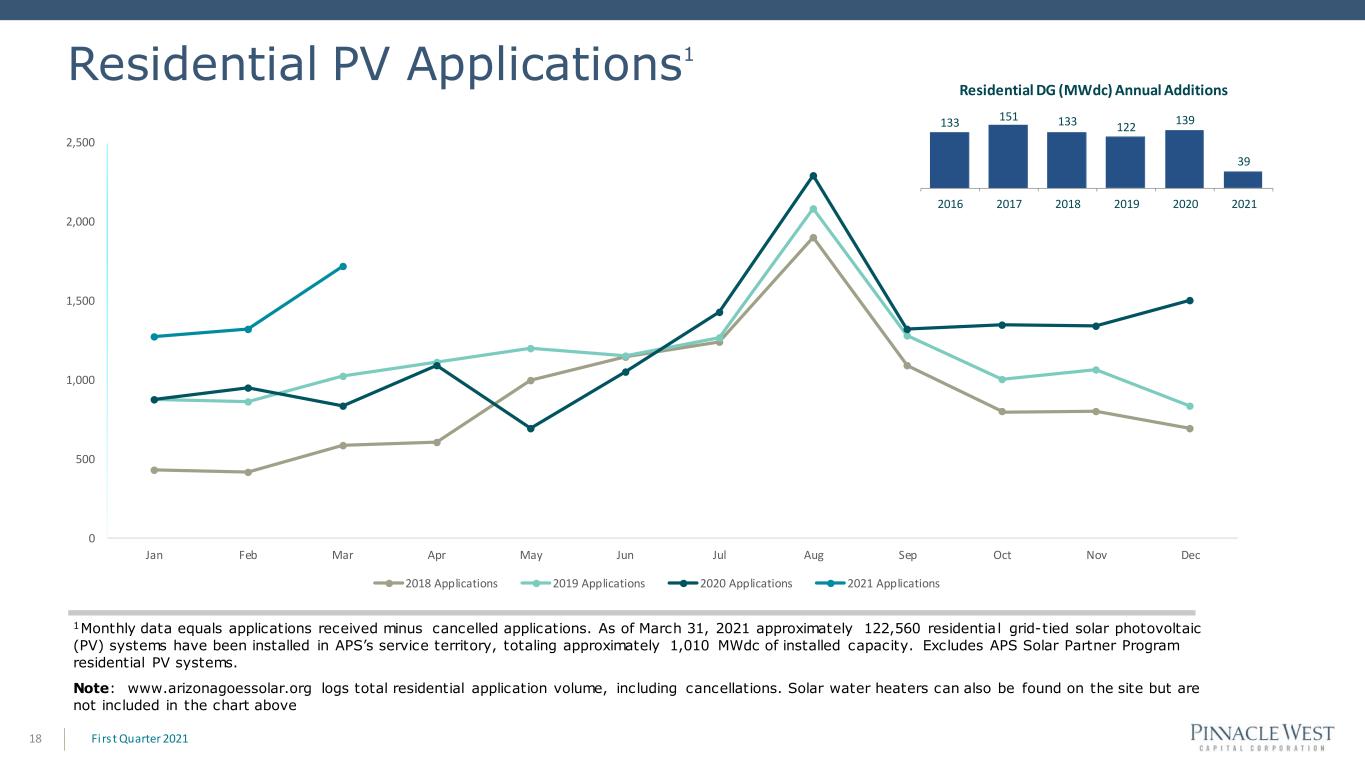
Residential PV Applications1 Firs t Quarter 202118 1Monthly data equals applications received minus cancelled applications. As of March 31, 2021 approximately 122,560 residentia l grid-tied solar photovoltaic (PV) systems have been installed in APS’s service territory, totaling approximately 1,010 MWdc of installed capacity. Excludes APS Solar Partner Program residential PV systems. Note: www.arizonagoessolar.org logs total residential application volume, including cancellations. Solar water heaters can also be found on the site but are not included in the chart above Residential DG (MWdc) Annual Additions 0 500 1,000 1,500 2,000 2,500 Jan Feb Mar Apr May Jun Jul Aug Sep Oct Nov Dec 2018 Applications 2019 Applications 2020 Applications 2021 Applications 133 151 133 122 139 39 2016 2017 2018 2019 2020 2021


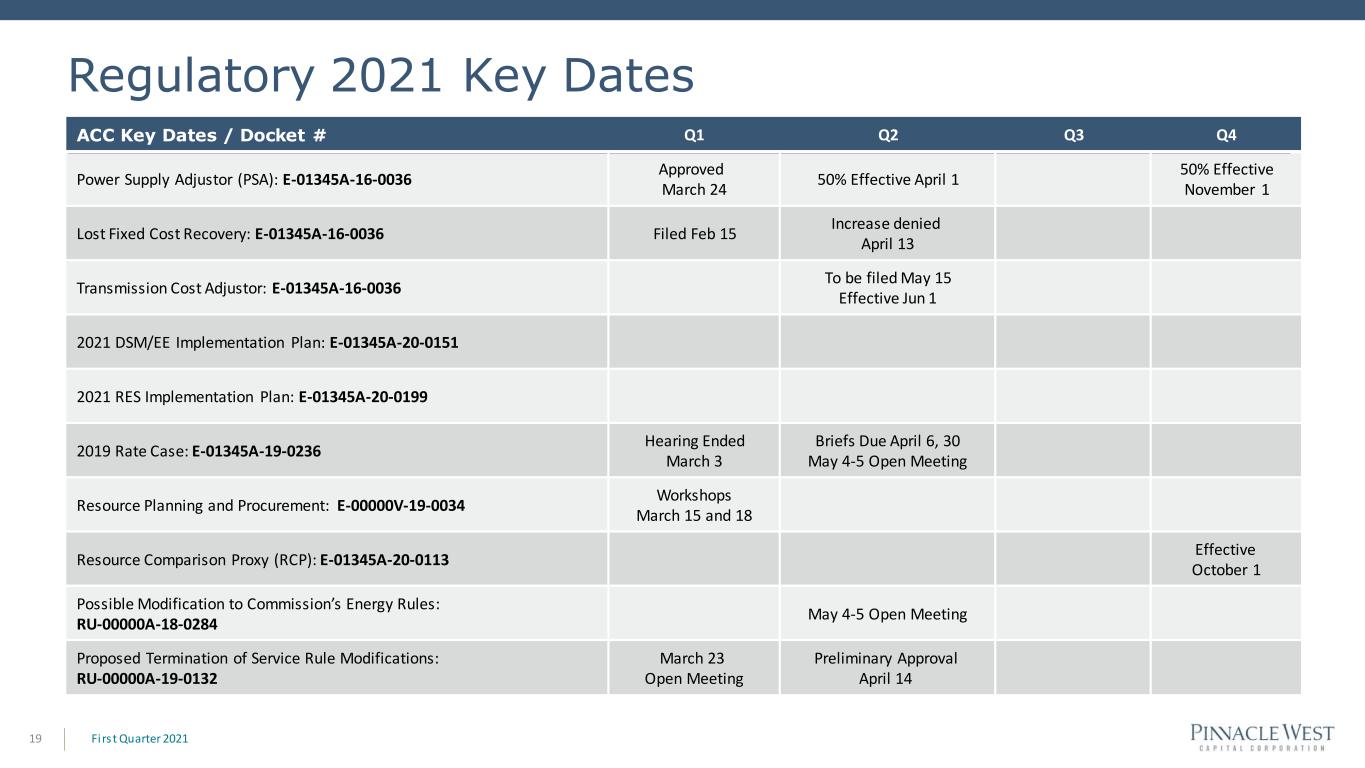
Regulatory 2021 Key Dates Firs t Quarter 202119 ACC Key Dates / Docket # Q1 Q2 Q3 Q4 Power Supply Adjustor (PSA): E-01345A-16-0036 Approved March 24 50% Effective April 1 50% Effective November 1 Lost Fixed Cost Recovery: E-01345A-16-0036 Filed Feb 15 Increase denied April 13 Transmission Cost Adjustor: E-01345A-16-0036 To be filed May 15 Effective Jun 1 2021 DSM/EE Implementation Plan: E-01345A-20-0151 2021 RES Implementation Plan: E-01345A-20-0199 2019 Rate Case: E-01345A-19-0236 Hearing Ended March 3 Briefs Due April 6, 30 May 4-5 Open Meeting Resource Planning and Procurement: E-00000V-19-0034 Workshops March 15 and 18 Resource Comparison Proxy (RCP): E-01345A-20-0113 Effective October 1 Possible Modification to Commission’s Energy Rules: RU-00000A-18-0284 May 4-5 Open Meeting Proposed Termination of Service Rule Modifications: RU-00000A-19-0132 March 23 Open Meeting Preliminary Approval April 14


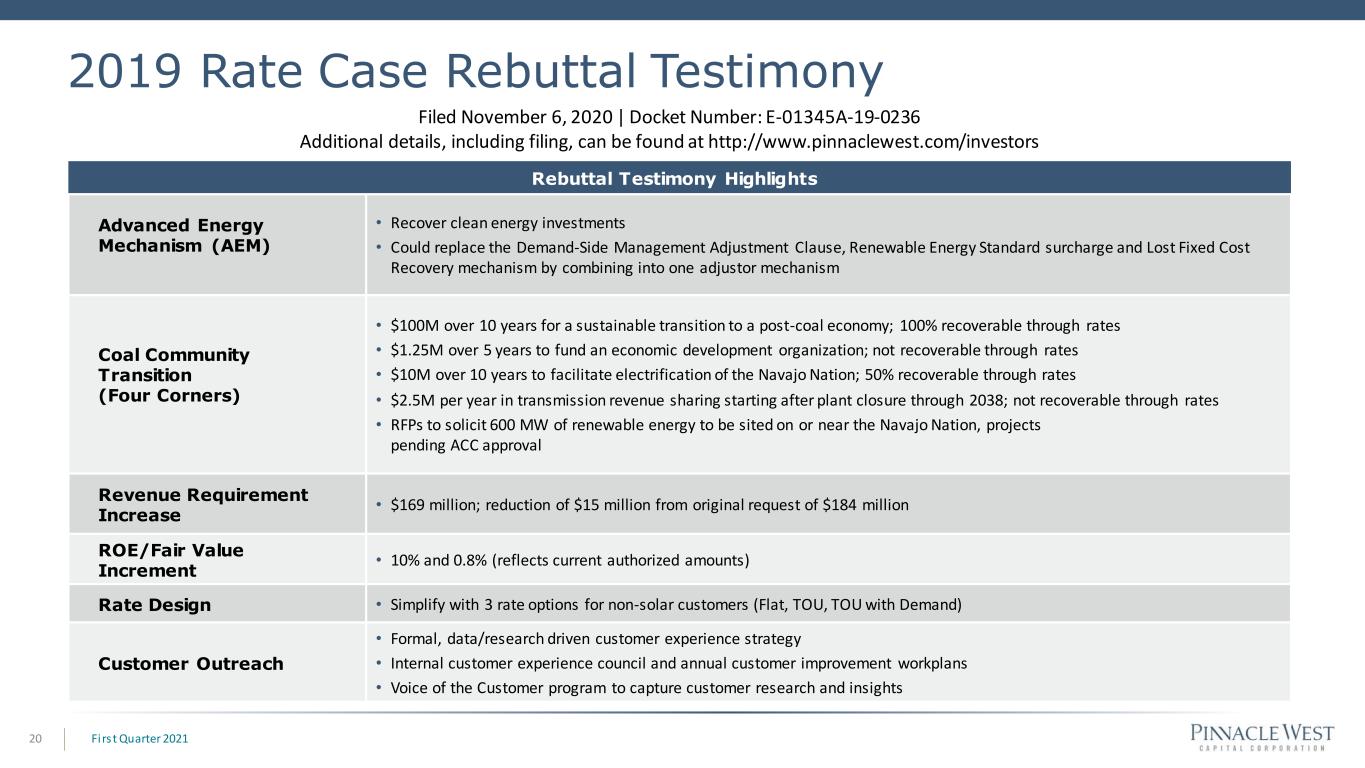
Rebuttal Testimony Highlights Advanced Energy Mechanism (AEM) • Recover clean energy investments • Could replace the Demand-Side Management Adjustment Clause, Renewable Energy Standard surcharge and Lost Fixed Cost Recovery mechanism by combining into one adjustor mechanism Coal Community Transition (Four Corners) • $100M over 10 years for a sustainable transition to a post-coal economy; 100% recoverable through rates • $1.25M over 5 years to fund an economic development organization; not recoverable through rates • $10M over 10 years to facilitate electrification of the Navajo Nation; 50% recoverable through rates • $2.5M per year in transmission revenue sharing starting after plant closure through 2038; not recoverable through rates • RFPs to solicit 600 MW of renewable energy to be sited on or near the Navajo Nation, projects pending ACC approval Revenue Requirement Increase • $169 million; reduction of $15 million from original request of $184 million ROE/Fair Value Increment • 10% and 0.8% (reflects current authorized amounts) Rate Design • Simplify with 3 rate options for non-solar customers (Flat, TOU, TOU with Demand) Customer Outreach • Formal, data/research driven customer experience strategy • Internal customer experience council and annual customer improvement workplans • Voice of the Customer program to capture customer research and insights 2019 Rate Case Rebuttal Testimony Firs t Quarter 202120 Filed November 6, 2020 | Docket Number: E-01345A-19-0236 Additional details, including filing, can be found at http://www.pinnaclewest.com/investors


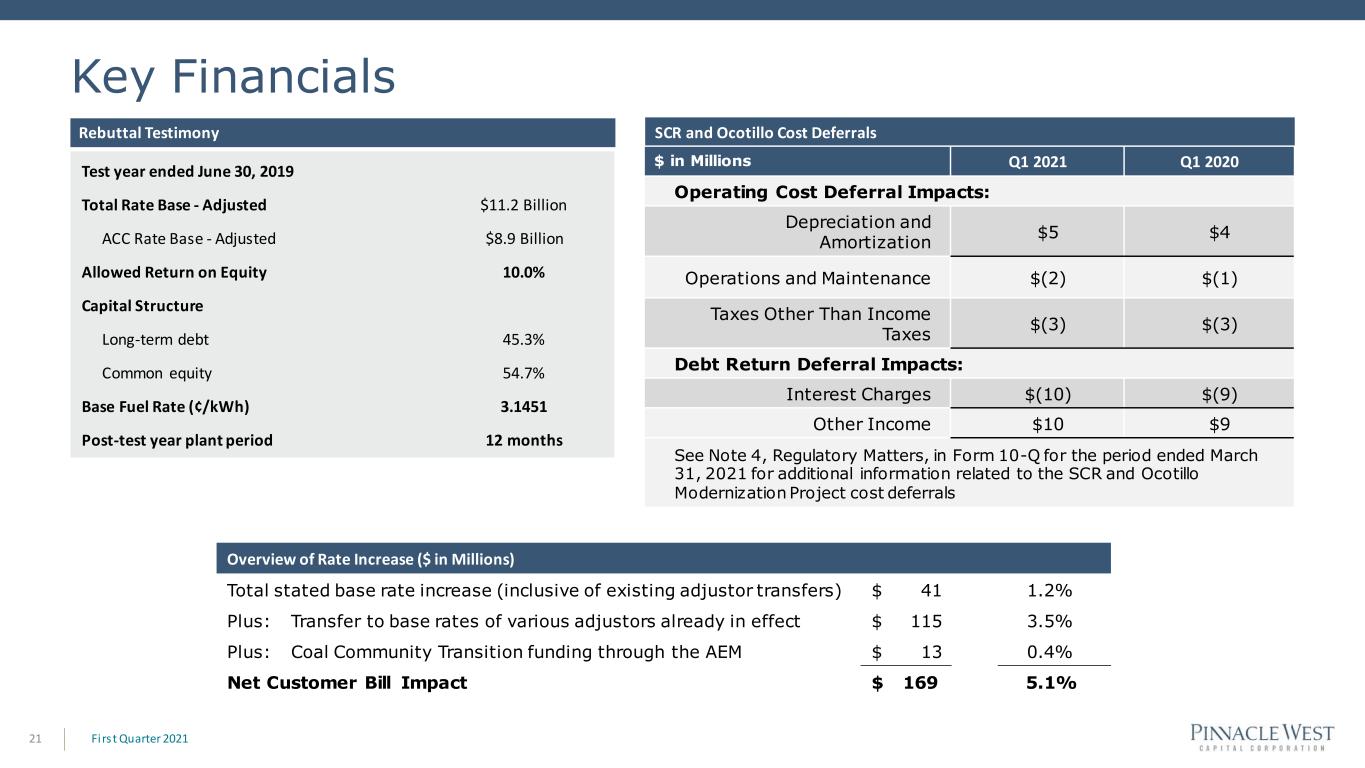
Key Financials Firs t Quarter 202121 Test year ended June 30, 2019 Total Rate Base - Adjusted $11.2 Billion ACC Rate Base - Adjusted $8.9 Billion Allowed Return on Equity 10.0% Capital Structure Long-term debt 45.3% Common equity 54.7% Base Fuel Rate (¢/kWh) 3.1451 Post-test year plant period 12 months Overview of Rate Increase ($ in Millions)​ Total stated base rate increase (inclusive of existing adjustor transfers) $ 41 1.2% Plus: Transfer to base rates of various adjustors already in effect $ 115 3.5% Plus: Coal Community Transition funding through the AEM $ 13 0.4% Net Customer Bill Impact $ 169 5.1% Rebuttal Testimony SCR and Ocotillo Cost Deferrals $ in Millions Q1 2021 Q1 2020​ Operating Cost Deferral Impacts: Depreciation and Amortization $5 $4 Operations and Maintenance $(2) $(1) Taxes Other Than Income Taxes $(3) $(3) Debt Return Deferral Impacts: Interest Charges $(10) $(9) Other Income $10 $9 See Note 4, Regulatory Matters, in Form 10-Q for the period ended March 31, 2021 for additional information related to the SCR and Ocotillo Modernization Project cost deferrals


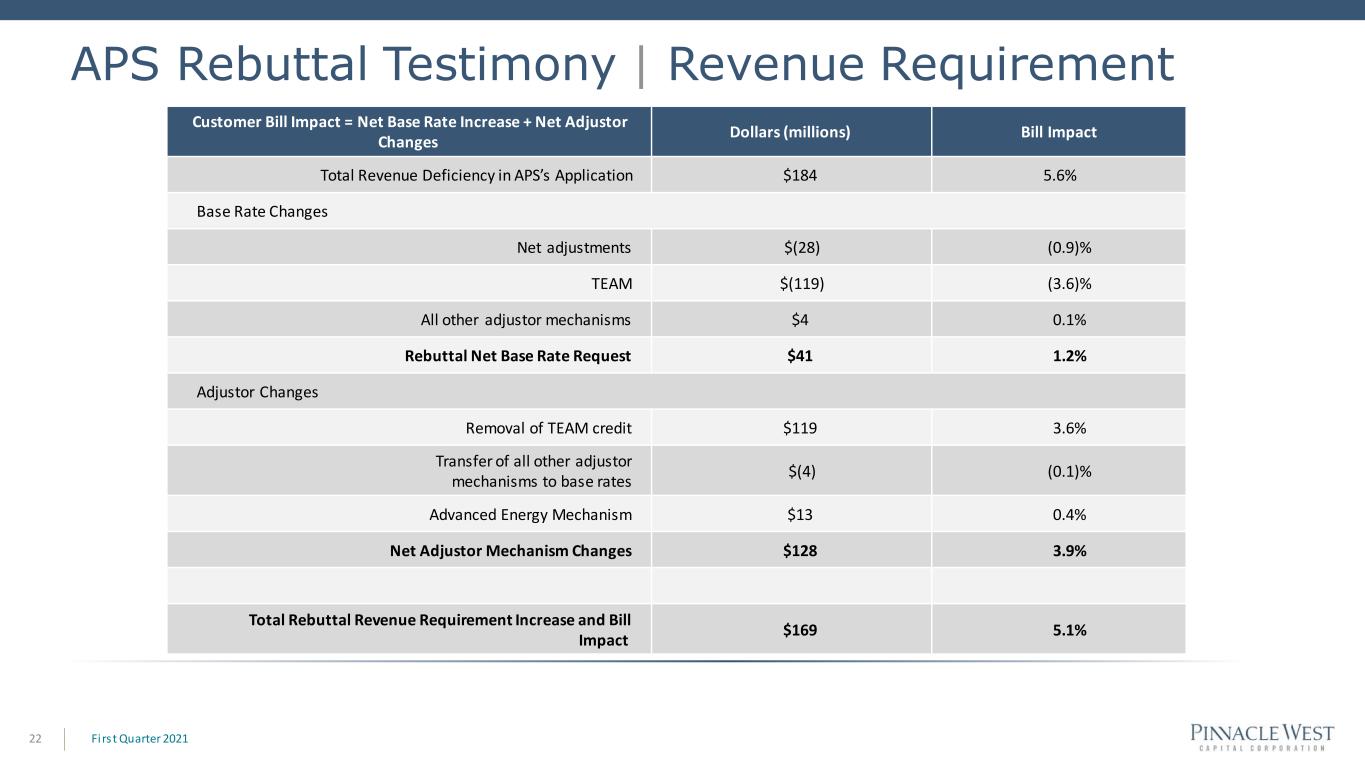
Customer Bill Impact = Net Base Rate Increase + Net Adjustor Changes Dollars (millions) Bill Impact​ Total Revenue Deficiency in APS’s Application​ $184 5.6%​ Base Rate Changes​ Net adjustments​ $(28)​ (0.9)%​ TEAM​ $(119)​ (3.6)%​ All other adjustor mechanisms​ $4 0.1%​ Rebuttal Net Base Rate Request $41 1.2% Adjustor Changes​ Removal of TEAM credit​ $119 3.6%​ Transfer of all other adjustor mechanisms to base rates​ $(4)​ (0.1)%​ Advanced Energy Mechanism​ $13 0.4%​ Net Adjustor Mechanism Changes $128 3.9% Total Rebuttal Revenue Requirement Increase and Bill Impact $169 5.1% APS Rebuttal Testimony | Revenue Requirement Firs t Quarter 202122


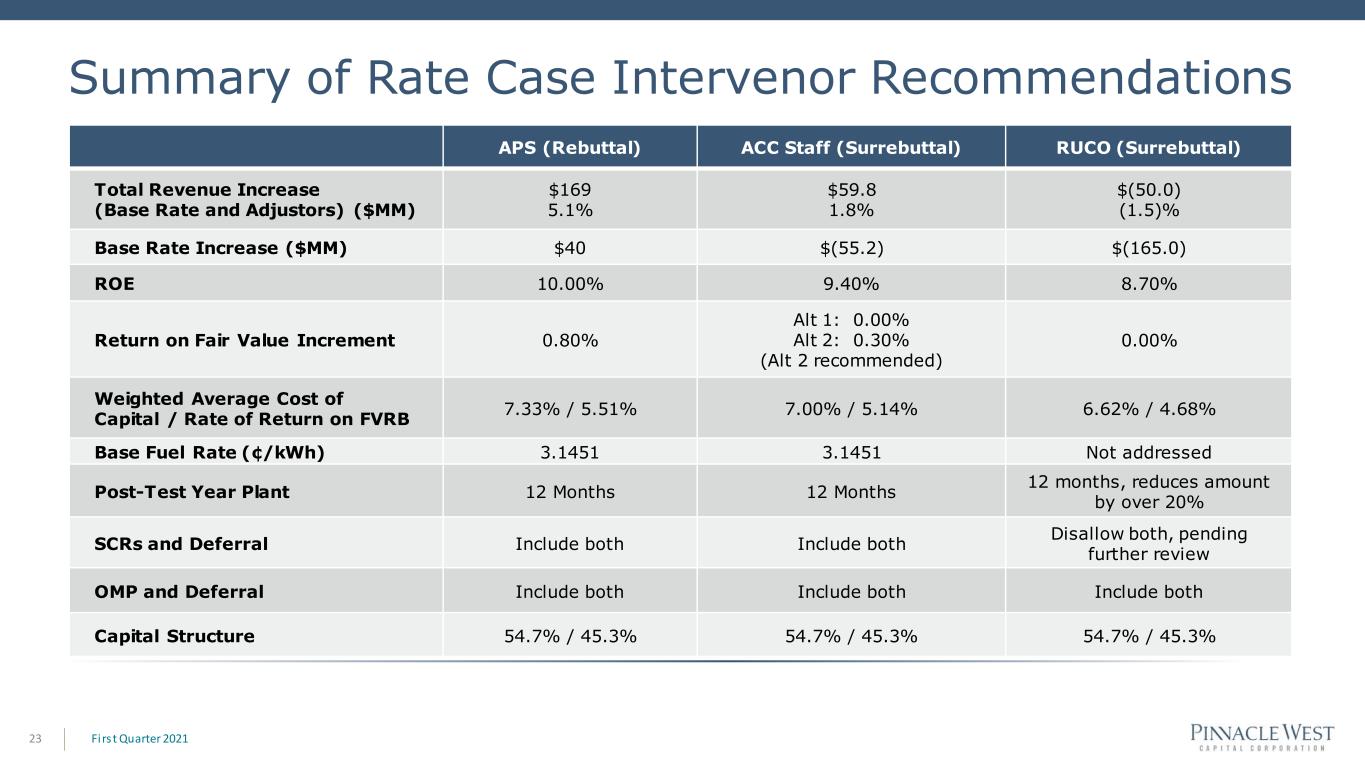
APS (Rebuttal) ACC Staff (Surrebuttal) RUCO (Surrebuttal) Total Revenue Increase (Base Rate and Adjustors) ($MM) $169 5.1% $59.8 1.8% $(50.0) (1.5)% Base Rate Increase ($MM) $40 $(55.2) $(165.0) ROE 10.00% 9.40% 8.70% Return on Fair Value Increment 0.80% Alt 1: 0.00% Alt 2: 0.30% (Alt 2 recommended) 0.00% Weighted Average Cost of Capital / Rate of Return on FVRB 7.33% / 5.51% 7.00% / 5.14% 6.62% / 4.68% Base Fuel Rate (¢/kWh) 3.1451 3.1451 Not addressed Post-Test Year Plant 12 Months 12 Months 12 months, reduces amount by over 20% SCRs and Deferral Include both Include both Disallow both, pending further review OMP and Deferral Include both Include both Include both Capital Structure 54.7% / 45.3% 54.7% / 45.3% 54.7% / 45.3% Summary of Rate Case Intervenor Recommendations Firs t Quarter 202123


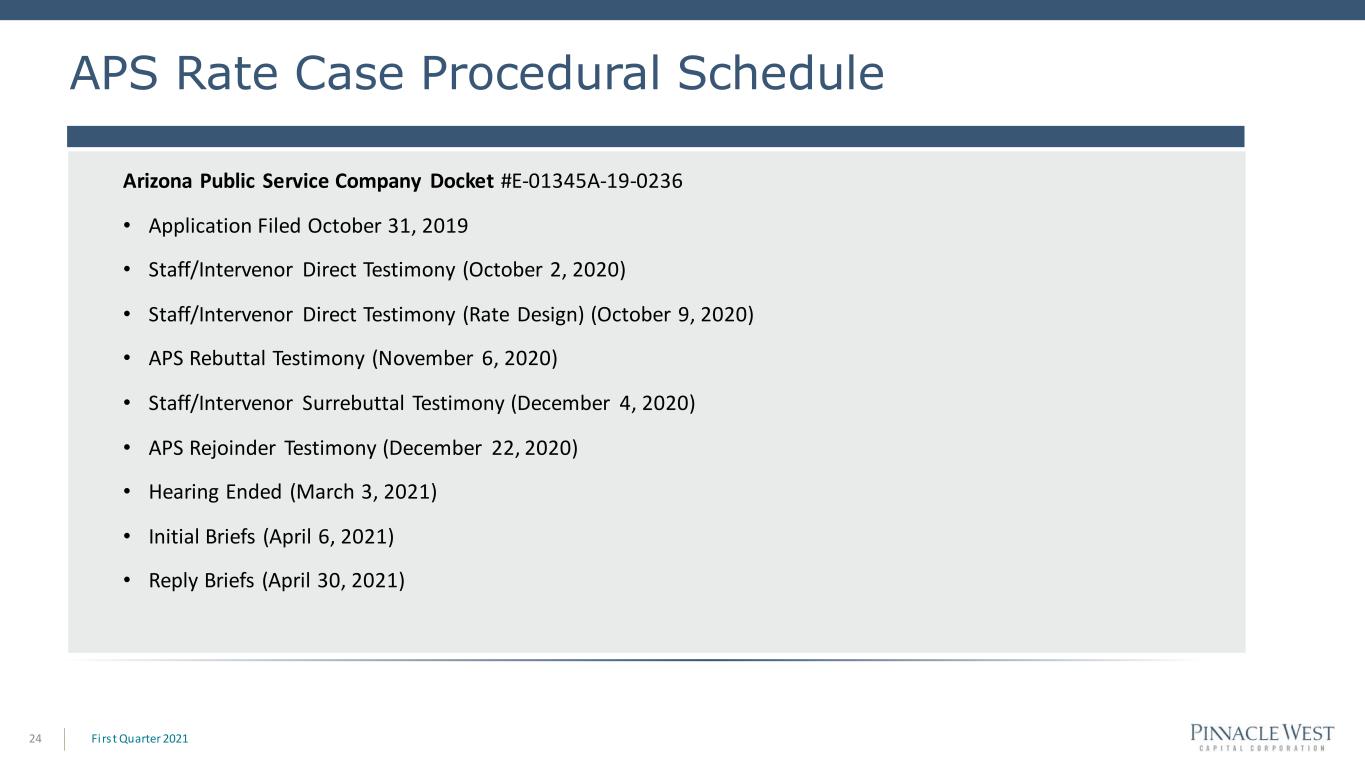
APS Rate Case Procedural Schedule Firs t Quarter 202124 Arizona Public Service Company Docket #E-01345A-19-0236 • Application Filed October 31, 2019 • Staff/Intervenor Direct Testimony (October 2, 2020) • Staff/Intervenor Direct Testimony (Rate Design) (October 9, 2020) • APS Rebuttal Testimony (November 6, 2020) • Staff/Intervenor Surrebuttal Testimony (December 4, 2020) • APS Rejoinder Testimony (December 22, 2020) • Hearing Ended (March 3, 2021) • Initial Briefs (April 6, 2021) • Reply Briefs (April 30, 2021)


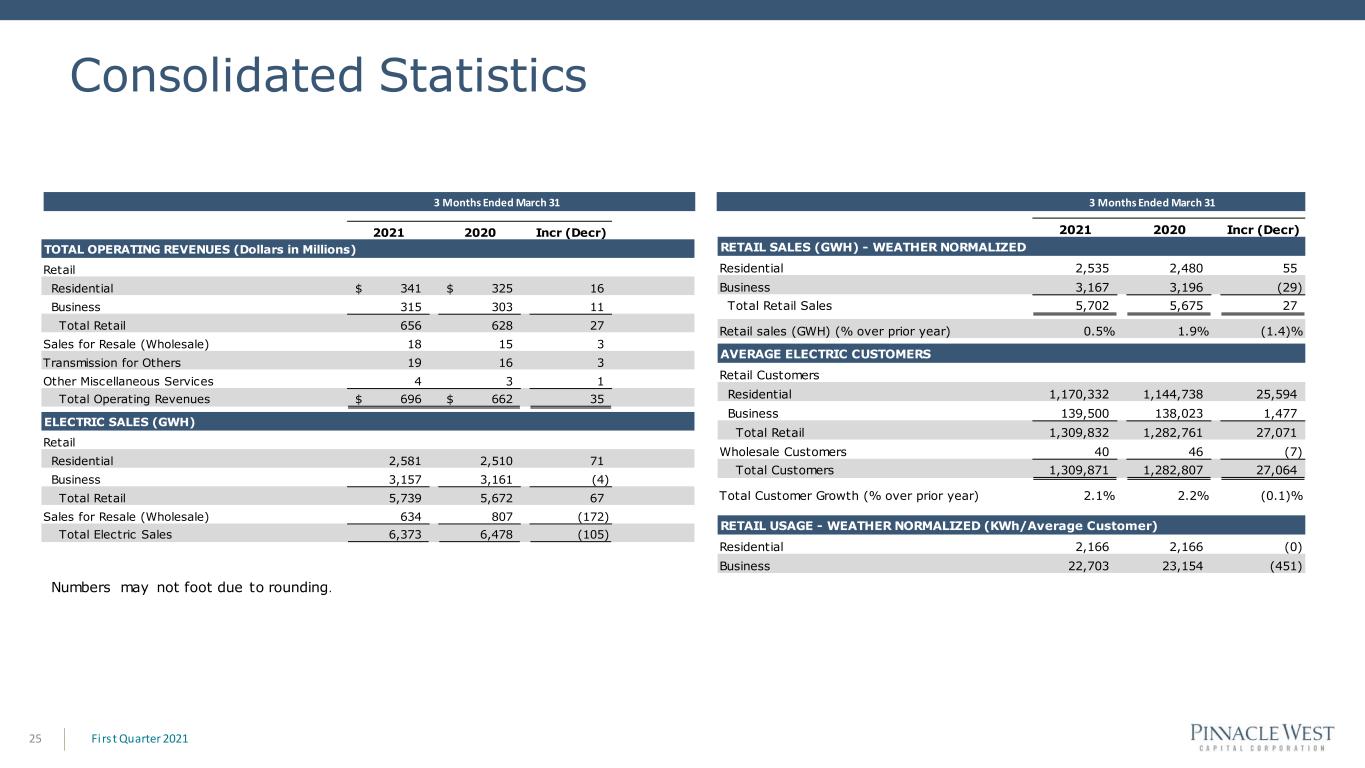
Consolidated Statistics Firs t Quarter 202125 3 Months Ended March 31 Numbers may not foot due to rounding. 2021 2020 Incr (Decr) TOTAL OPERATING REVENUES (Dollars in Millions) Retail Residential 341$ 325$ 16 Business 315 303 11 Total Retail 656 628 27 Sales for Resale (Wholesale) 18 15 3 Transmission for Others 19 16 3 Other Miscellaneous Services 4 3 1 Total Operating Revenues 696$ 662$ 35 ELECTRIC SALES (GWH) Retail Residential 2,581 2,510 71 Business 3,157 3,161 (4) Total Retail 5,739 5,672 67 Sales for Resale (Wholesale) 634 807 (172) Total Electric Sales 6,373 6,478 (105) 3 Months Ended March 31 2021 2020 Incr (Decr) RETAIL SALES (GWH) - WEATHER NORMALIZED Residential 2,535 2,480 55 Business 3,167 3,196 (29) Total Retail Sales 5,702 5,675 27 Retail sales (GWH) (% over prior year) 0.5% 1.9% (1.4)% AVERAGE ELECTRIC CUSTOMERS Retail Customers Residential 1,170,332 1,144,738 25,594 Business 139,500 138,023 1,477 Total Retail 1,309,832 1,282,761 27,071 Wholesale Customers 40 46 (7) Total Customers 1,309,871 1,282,807 27,064 Total Customer Growth (% over prior year) 2.1% 2.2% (0.1)% RETAIL USAGE - WEATHER NORMALIZED (KWh/Average Customer) Residential 2,166 2,166 (0) Business 22,703 23,154 (451)


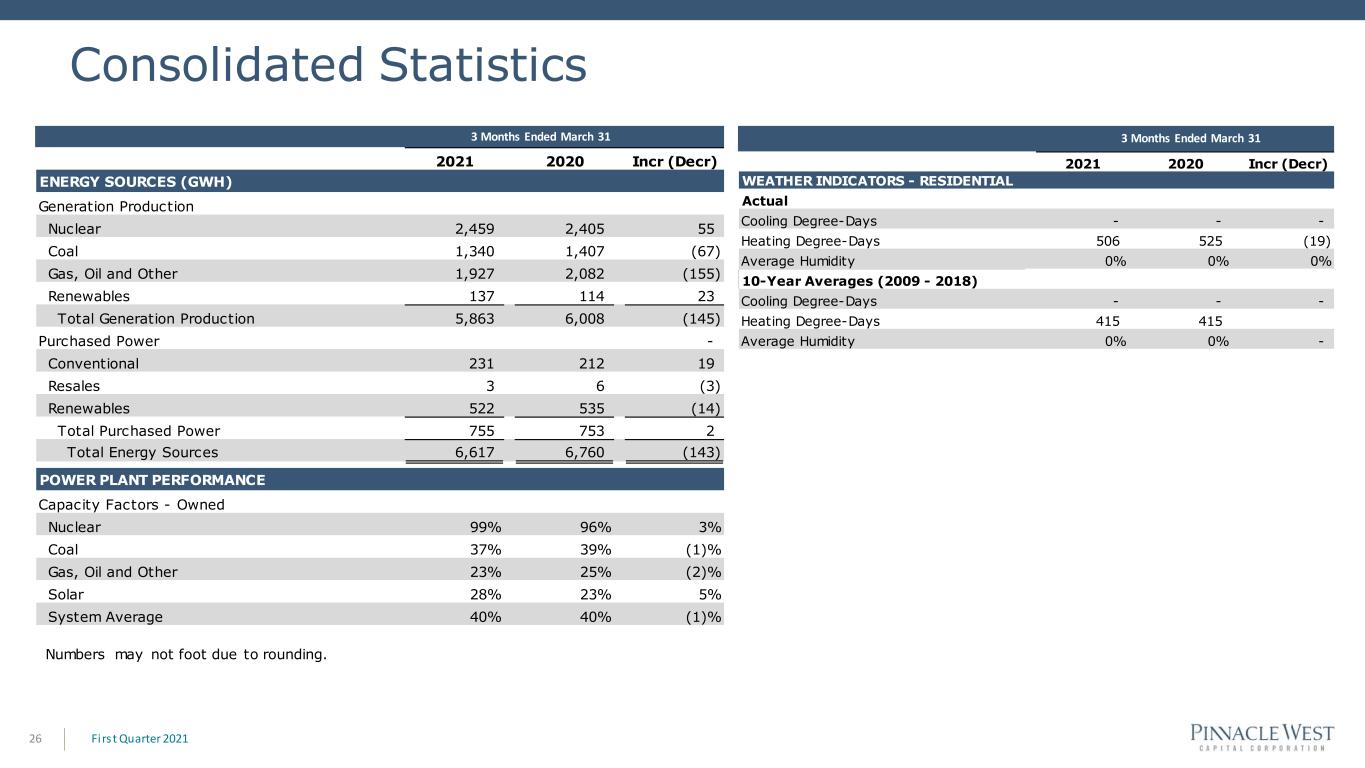
Consolidated Statistics Firs t Quarter 202126 3 Months Ended March 31 Numbers may not foot due to rounding. 2021 2020 Incr (Decr) ENERGY SOURCES (GWH) Generation Production Nuclear 2,459 2,405 55 Coal 1,340 1,407 (67) Gas, Oil and Other 1,927 2,082 (155) Renewables 137 114 23 Total Generation Production 5,863 6,008 (145) Purchased Power - Conventional 231 212 19 Resales 3 6 (3) Renewables 522 535 (14) Total Purchased Power 755 753 2 Total Energy Sources 6,617 6,760 (143) POWER PLANT PERFORMANCE Capacity Factors - Owned Nuclear 99% 96% 3% Coal 37% 39% (1)% Gas, Oil and Other 23% 25% (2)% Solar 28% 23% 5% System Average 40% 40% (1)% 2021 2020 Incr (Decr) WEATHER INDICATORS - RESIDENTIAL Actual Cooling Degree-Days - - - Heating Degree-Days 506 525 (19) Average Humidity 0% 0% 0% 10-Year Averages (2009 - 2018) Cooling Degree-Days - - - Heating Degree-Days 415 415 Average Humidity 0% 0% - 3 Months Ended March 31