pnw-20220223
0000764622falseAZ00000072868-KFebruary 23, 2022falseAZfalsefalsefalsefalsefalse00007646222022-02-232022-02-230000764622pnw:ArizonaPublicServiceCompanyMember2022-02-232022-02-23


UNITED STATES
SECURITIES AND EXCHANGE COMMISSION
WASHINGTON, DC 20549 
 

FORM 8-K 
 

CURRENT REPORT
Pursuant to Section 13 or 15(d) of the
Securities Exchange Act of 1934

Date of report (Date of earliest event reported):
February 23, 2022


Commission File
Number
 Exact Name of Each Registrant as specified in its
charter; State of Incorporation; Address; and
Telephone Number
IRS Employer
Identification No.
1-8962 PINNACLE WEST CAPITAL CORPORATION86-0512431
(an Arizona corporation)
400 North Fifth Street, P.O. Box 53999
PhoenixArizona85072-3999
(602) 250-1000
1-4473 ARIZONA PUBLIC SERVICE COMPANY86-0011170
(an Arizona corporation)
400 North Fifth Street, P.O. Box 53999
PhoenixArizona85072-3999
(602)250-1000

Check the appropriate box below if the Form 8-K filing is intended to simultaneously satisfy the filing obligation of the registrant under any of the following provisions:


Written communications pursuant to Rule 425 under the Securities Act (17 CFR 230.425)
Soliciting material pursuant to Rule 14a-12 under the Exchange Act (17 CFR 240.14a-12)
Pre-commencement communications pursuant to Rule 14d-2(b) under the Exchange Act (17 CFR 240.14d-2(b))
Pre-commencement communications pursuant to Rule 13e-4(c) under the Exchange Act (17 CFR 240.13e-4(c))

Securities registered pursuant to Section 12(b) of the Act:
Title of each class
Trading Symbol(s)
Name of each exchange on which registered
Common Stock
PNW
The New York Stock Exchange

Indicate by check mark whether the registrant is an emerging growth company as defined in Rule 405 of the Securities Act of 1933 (17 CFR §230.405) or Rule 12b-2 of the Securities Exchange Act of 1934 (17 CFR §240.12b-2).
Emerging growth company

If an emerging growth company, indicate by check mark if the registrant has elected not to use the extended transition period for complying with any new or revised financial accounting standards provided pursuant to Section 13(a) of the Exchange Act. ¨

This combined Form 8-K is separately filed or furnished by Pinnacle West Capital Corporation and Arizona Public Service Company. Each registrant is filing or furnishing on its own behalf all of the information contained in this Form 8-K that relates to such registrant and, where required, its subsidiaries. Except as stated in the preceding sentence, neither registrant is filing or furnishing any information that does not relate to such registrant, and therefore makes no representation as to any such information.


Item 2.02. Results of Operations and Financial Condition.

    The following information is furnished pursuant to Item 2.02.

    On February 25, 2022, Pinnacle West Capital Corporation (the “Company” or “Pinnacle West”) issued a press release regarding its financial results for the fiscal quarter and full year ended December 31, 2021 and its earnings outlook for 2022. A copy of the press release is attached hereto as Exhibit 99.1.

Item 5.02 Departure of Directors or Certain Officers; Election of Directors; Appointment of Certain Officers; Compensatory Arrangements of Certain Officers.

On February 23, 2022, the Board of Directors of the Company expanded the number of Directors on the Pinnacle West Board of Directors by one and elected Mr. Gonzalo de la Melena, Jr. as a Director. Mr. de la Melena’s initial term will extend until the Pinnacle West 2022 Annual Meeting of Shareholders on May 18, 2022 (the “2022 Annual Meeting of Shareholders”). The Board of Directors of Arizona Public Service Company (“APS”), the principal subsidiary of Pinnacle West, also elected Mr. de la Melena to the APS Board of Directors. Mr. de la Melena has been appointed to the Audit Committee and the Nuclear and Operating Committee of Pinnacle West. Mr. de la Melena will participate in the compensation arrangements for non-employee directors described on page 58 of the Pinnacle West Proxy Statement for its Annual Meeting of Shareholders held on May 19, 2021, except the annual retainer and equity grant will be prorated to reflect his service from the date of his election until the 2022 Annual Meeting of Shareholders. A copy of a press release regarding the election of Mr. Gonzalo de la Melena, Jr. is attached hereto as Exhibit 99.2.

Item 7.01. Regulation FD Disclosure.

    The following information is furnished pursuant to Item 7.01.

    The Company is providing a copy of the slide presentation made in connection with its earnings conference call on February 25, 2022. This information contains Company operating results for the fiscal quarter and fiscal year ended December 31, 2021, earnings outlook for 2022 and a quarterly and full year consolidated statistical summary. The slide presentation is attached hereto as Exhibit 99.3 and is concurrently being posted to the Company’s website at www.pinnaclewest.com.

Item 9.01.    Financial Statements and Exhibits.
    (d)    Exhibits

Exhibit No.Registrant(s)Description
99.1Pinnacle West
APS
99.2Pinnacle West
APS
99.3Pinnacle West
APS


SIGNATURES

    Pursuant to the requirements of the Securities Exchange Act of 1934, each registrant has duly caused this report to be signed on its behalf by the undersigned hereunto duly authorized.


PINNACLE WEST CAPITAL CORPORATION
(Registrant)
Dated: February 25, 2022By: /s/ Theodore N. Geisler            
Theodore N. Geisler
Senior Vice President and
Chief Financial Officer
ARIZONA PUBLIC SERVICE COMPANY
(Registrant)
Dated: February 25, 2022By: /s/ Theodore N. Geisler            
Theodore N. Geisler
Senior Vice President and
Chief Financial Officer


a1qearningsfinal05011a14a.jpg
FOR IMMEDIATE RELEASEFebruary 25, 2022
Media Contact:
Alan Bunnell (602) 250-3376
Analyst Contacts:
Amanda Ho (602) 250-3334
Website:pinnaclewest.com

PINNACLE WEST REPORTS 2021 FULL-YEAR AND FOURTH-QUARTER RESULTS

Financial results reflect higher customer usage and robust customer growth of 2.2%

2022 to serve as a “financial reset year” following recent rate case decision currently under appeal

APS employees stay focused on operations and customer service improvements

Company continues progress on Clean Energy Commitment

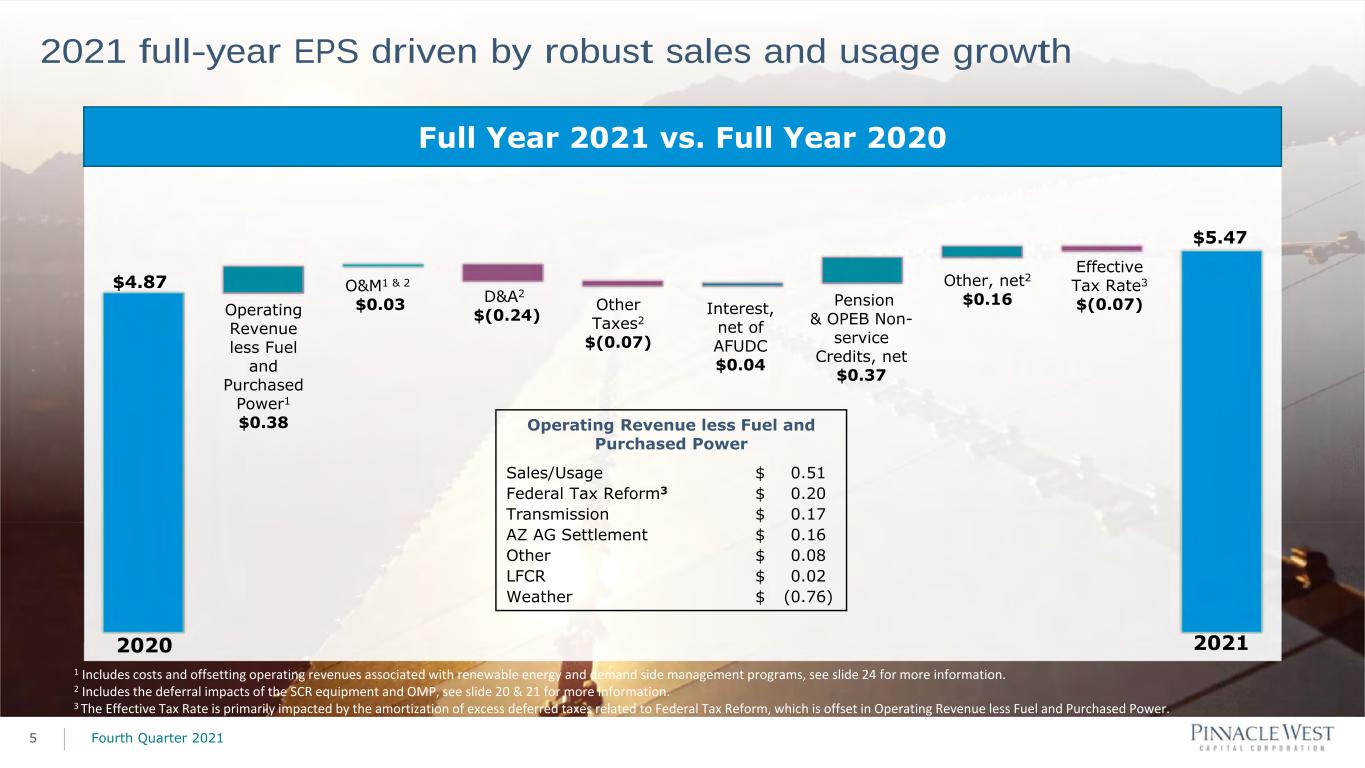
PHOENIX – Pinnacle West Capital Corp. (NYSE: PNW) today reported consolidated net income attributable to common shareholders of $618.7 million, or $5.47 per diluted share, for full-year 2021. This result compares with net income of $550.6 million, or $4.87 per diluted share, in 2020.

The 2021 results were positively impacted by an increase in revenue driven by higher customer usage and growth, higher transmission revenues, and the absence of a one-time charge related to a 2020 settlement. Other factors affecting the full-year results included higher pension and other postretirement non-service credits, and lower other expenses, partially offset by the effects of weather and higher depreciation and amortization expense.

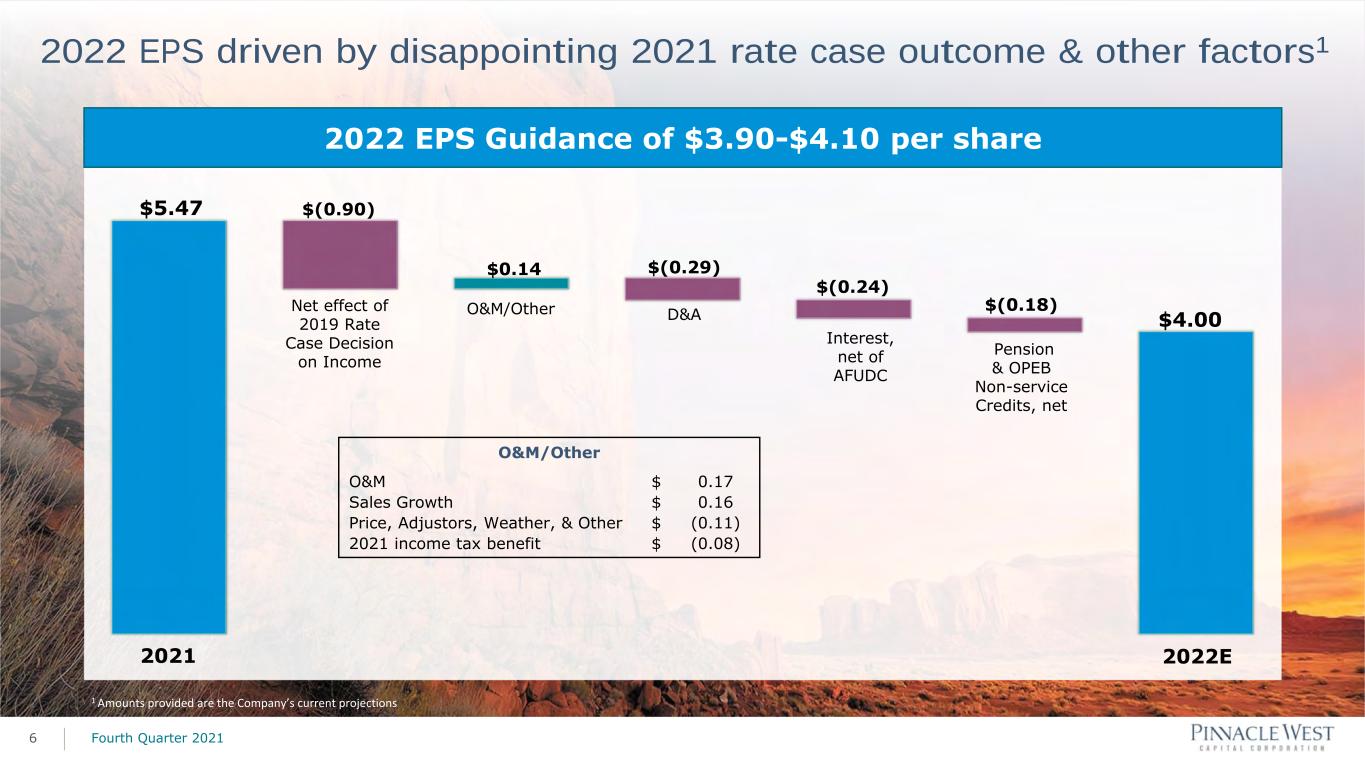
“Though operational and financial rigor were key to our strong performance in 2021, we anticipate near-term headwinds due to the unfavorable outcome in our recent rate case,” said Pinnacle West Chairman, President and CEO Jeff Guldner. “As a result of that decision, 2022 will be a financial reset year with projections significantly lower than what we achieved in 2021.

“However, looking beyond this challenge, we believe in our ability to provide long-term value to both customers and shareholders by activating a well-thought-out strategy, working with regulators and stakeholders for a more constructive regulatory environment, deepening our renewed focus on customer satisfaction, and continuing our proven cost management efforts – all against the backdrop of Arizona’s incredible economic expansion.”

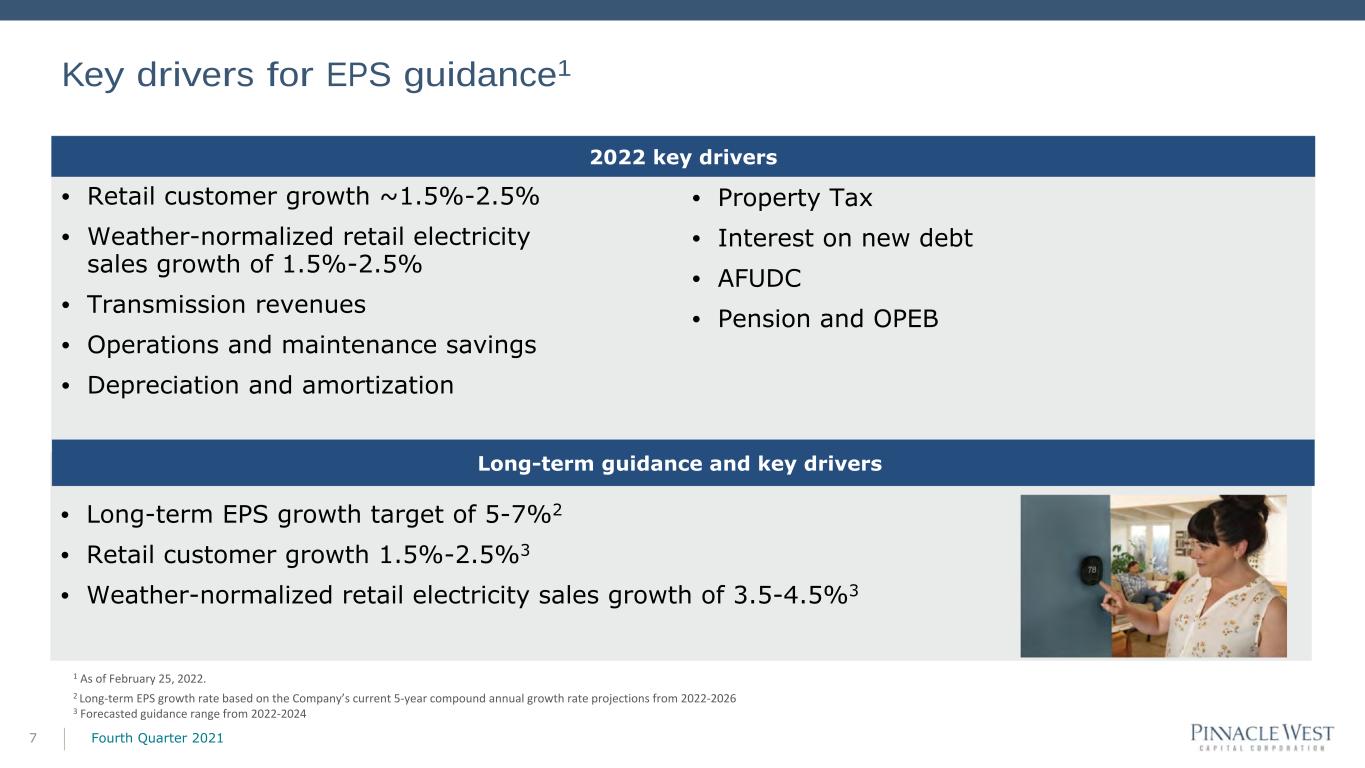
The company’s principal subsidiary, Arizona Public Service Co. (APS), benefited from robust customer growth of 2.2% in 2021, as people and businesses continued to move to Arizona, making the company’s service territory among the fastest growing in the nation. As a result, APS experienced weather normalized, year-over-year overall retail electricity sales growth of 4.2%. The company further anticipates steady customer growth in the range of 1.5 to 2.5 percent through 2024, with energy sales trending up at an even quicker pace.


Higher Customer Usage, Growth Contributed to Fourth-Quarter Results
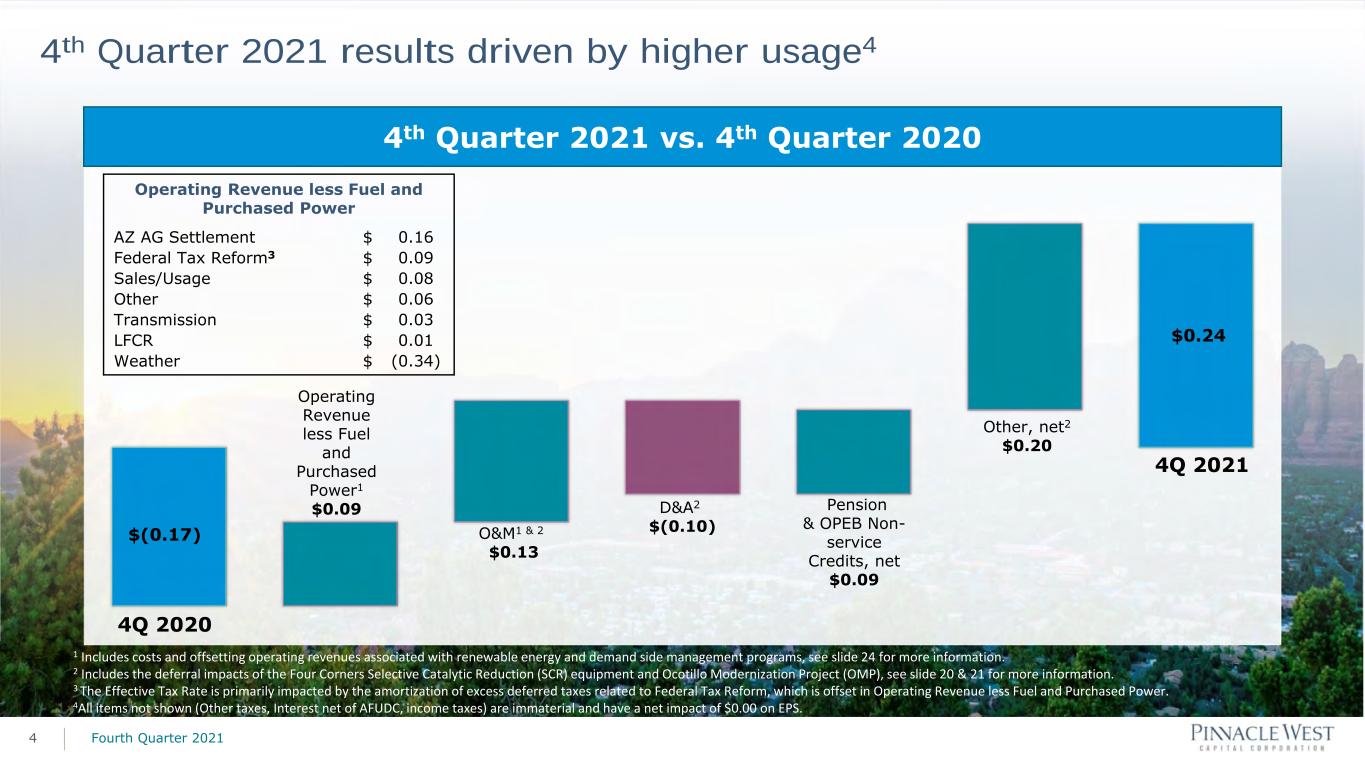
For the quarter ended Dec. 31, 2021, Pinnacle West reported consolidated net earnings attributable to common shareholders of $27.6 million, or $0.24 per diluted share. This result compares with a net loss of $19.4 million, or a loss of $0.17 per share, for the same period in 2020.

Main drivers for the quarter-over-quarter improvement were the previously mentioned settlement and shareholders’ portion of the coal community transition, both of which were booked in the fourth quarter of 2020. Mild weather was a factor in the 2021 fourth quarter, but was largely offset by an increase in revenue driven by higher customer usage and growth.

Staying Focused on Serving Customers
Recognizing that creating customer value is inextricably linked to increasing shareholder value, APS employees remain focused on putting customers first and achieving an industry-leading best-in-class customer experience. Actions taken as part of this multi-year objective include incrementally improving the company’s J.D. Power (JDP) customer satisfaction ratings to the first-quartile of its peer set comprised of large investor-owned utilities.

The company demonstrated progress on that front in 2021, Guldner said. “Thanks to the hard work of our employees, our fourth-quarter JDP overall residential customer satisfaction score earned APS a third-quartile ranking, with year-over-year improvements in several key areas important to customers, including power quality and reliability, billing and payment, and customer call center performance.”

In 2021, APS call center associates answered about 76% of more than one million calls in 30 seconds or less. In addition to service and billing questions, advisors helped customers with crisis bill assistance, payment arrangements and other energy support programs.

Additionally, customers embraced APS’s digital platforms, where improvement efforts were a significant focus throughout 2021. Customers used the APS website and mobile app to complete 26 million-plus transactions and engagements in 2021 – a massive 53% increase over the prior year. This increase was reflected in customers’ ratings of the APS app, which has earned more than “4 stars” on both the Apple App Store and Google Play.

APS also was named a 2021 Business Customer Champion by international market research firm Escalent, which recognized the company as one of the top performing electric utilities in the nation for brand trust, product experience, service satisfaction and customer effort score for business customers.

Advancing Arizona’s Clean Energy Future
Following the second-year anniversary of its Clean Energy Commitment, the company continues to advance its goal of providing customers with 100% clean, carbon-free electricity by 2050 – while taking the necessary steps to maintain reliability and affordable prices for customers.

Since its initial announcement in early 2020, APS has procured nearly 1,400 megawatts of additional clean energy and storage – all of which will be in service for APS customers no later than 2024.

“We’ve made solid progress on our Clean Energy Commitment, but much work remains,” said Guldner.
“These substantial capital investments not only are vital to our transition away from coal and into a clean energy future, but they are also essential resources designed to help us keep pace with Arizona’s tremendous growth at the same time that electricity capacity markets are tightening across the entire West.”

The company’s clean energy goals and progress have been lauded by respected, independent third parties:
For the third year in a row, global disclosure organization CDP recognized Pinnacle West for its action and leadership on climate change and water security, making it one of only two North American electric utility companies to achieve leadership scores in both categories;
Finance research firm MSCI upgraded Pinnacle West’s Environmental, Social and Governance rating from “A” to “AA” as of April 2021; and


Energy Intelligence named the company to its annual ranking of the world’s Top 100 Green Utilities for the third year in a row.

Financial Outlook
Following the unfavorable decision in APS’s recent rate case, which is currently being appealed, the company expects its 2022 full-year ongoing consolidated earnings will be within a range of $3.90 to $4.10 per diluted share on a weather-normalized basis. Key factors and assumptions underlying the 2022 outlook can be found in the year-end/fourth-quarter 2021 earnings presentation slides at pinnaclewest.com/investors.

Conference Call and Webcast
Pinnacle West management will host a live webcast and conference call to discuss financial results and recent developments at 11 a.m. ET (9 a.m. Arizona time) today, February 25. The webcast can be accessed at pinnaclewest.com/presentations and will be available for replay on the website for 30 days. To access the live conference call by telephone, (888) 506-0062 or (973) 528-0011 for international callers and enter participant access code 908426. A replay of the call also will be available until 11:59 p.m. ET, Friday, March 4, by calling (877) 481-4010 in the U.S. and Canada or (919) 882-2331 internationally and entering replay passcode 44200.

General Information
Pinnacle West Capital Corp., an energy holding company based in Phoenix, has consolidated assets of approximately $22 billion, about 6,300 megawatts of generating capacity and nearly 5,900 employees in Arizona and New Mexico. Through its principal subsidiary, Arizona Public Service, the company provides retail electricity service to more than 1.3 million Arizona homes and businesses. For more information about Pinnacle West, visit the company’s website at pinnaclewest.com.

Earnings per share amounts in this news release are based on average diluted common shares outstanding. For more information on Pinnacle West’s operating statistics and earnings, please visit pinnaclewest.com/investors.

FORWARD-LOOKING STATEMENTS
This press release contains forward-looking statements based on current expectations. These forward-looking statements are often identified by words such as "estimate," "predict," "may," "believe," "plan," "expect," "require," "intend," "assume," "project," "anticipate," "goal," "seek," "strategy," "likely," "should," "will," "could," and similar words. Because actual results may differ materially from expectations, we caution readers not to place undue reliance on these statements. Several factors could cause future results to differ materially from historical results, or from outcomes currently expected or sought by Pinnacle West or APS. These factors include, but are not limited to:

the potential effects of the continued COVID-19 pandemic, including, but not limited to, demand for energy, economic growth, our employees and contractors, vaccine mandates, supply chain, expenses, capital markets, capital projects, operations and maintenance activities, uncollectable accounts, liquidity, cash flows or other unpredictable events;
our ability to manage capital expenditures and operations and maintenance costs while maintaining reliability and customer service levels;
variations in demand for electricity, including those due to weather, seasonality (including large increases in ambient temperatures), the general economy or social conditions, customers and sales growth (or decline), the effects of energy conservation measures and distributed generation, and technological advancements;
the potential effects of climate change on our electric system, including as a result of weather extremes such as prolonged drought and high temperature variations in the area where APS conducts its business;
power plant and transmission system performance and outages;
competition in retail and wholesale power markets;
regulatory and judicial decisions, developments and proceedings;


new legislation, ballot initiatives and regulation or interpretations of existing legislation or regulations, including those relating to environmental requirements, regulatory and energy policy, nuclear plant operations and potential deregulation of retail electric markets;
fuel and water supply availability;
our ability to achieve timely and adequate rate recovery of our costs through our rates and adjustor recovery mechanisms, including returns on and of debt and equity capital investment;
our ability to meet renewable energy and energy efficiency mandates and recover related costs;
the ability of APS to achieve its clean energy goals (including a goal by 2050 of 100% clean, carbon-free electricity) and, if these goals are achieved, the impact of such achievement on APS, its customers, and its business, financial condition and results of operations;
risks inherent in the operation of nuclear facilities, including spent fuel disposal uncertainty;
current and future economic conditions in Arizona, including in real estate markets;
the direct or indirect effect on our facilities or business from cybersecurity threats or intrusions, data security breaches, terrorist attack, physical attack, severe storms, or other catastrophic events, such as fires, explosions, pandemic health events, or similar occurrences;
the development of new technologies which may affect electric sales or delivery;
the cost of debt and equity capital and the ability to access capital markets when required;
environmental, economic and other concerns surrounding coal-fired generation, including regulation of greenhouse gas emissions;
volatile fuel and purchased power costs;
the investment performance of the assets of our nuclear decommissioning trust, pension, and other postretirement benefit plans and the resulting impact on future funding requirements;
the liquidity of wholesale power markets and the use of derivative contracts in our business;
potential shortfalls in insurance coverage;
new accounting requirements or new interpretations of existing requirements;
generation, transmission and distribution facility and system conditions and operating costs;
the ability to meet the anticipated future need for additional generation and associated transmission facilities in our region;
the willingness or ability of our counterparties, power plant participants and power plant landowners to meet contractual or other obligations or extend the rights for continued power plant operations; and
restrictions on dividends or other provisions in our credit agreements and Arizona Corporation Commission orders.

These and other factors are discussed in Risk Factors described in Part 1, Item 1A of the Pinnacle West/APS Annual Report on Form 10-K for the fiscal year ended December 31, 2021, which readers should review carefully before placing any reliance on our financial statements or disclosures. Neither Pinnacle West nor APS assumes any obligation to update these statements, even if our internal estimates change, except as required by law.


# # #


PINNACLE WEST CAPITAL CORPORATION
CONSOLIDATED STATEMENTS OF INCOME
(unaudited)
(dollars and shares in thousands, except per share amounts)
THREE MONTHS ENDEDTWELVE MONTHS ENDED
DECEMBER 31,DECEMBER 31,
2021202020212020
Operating Revenues$ 798,857$ 740,961$ 3,803,835$ 3,586,982
Operating Expenses
Fuel and purchased power257,037213,3451,152,551993,419
Operations and maintenance261,936281,229954,067958,910
Depreciation and amortization170,782155,121650,875614,378
Taxes other than income taxes58,05356,321234,639224,835
Other expenses1,0324,0976,3937,288
Total748,840710,1132,998,5252,798,830
Operating Income50,01730,848805,310788,152
Other Income (Deductions)
Allowance for equity funds used during construction11,1889,12441,73733,776
Pension and other postretirement non-service credits - net28,44014,170112,54156,341
Other income8,49214,05145,10056,703
Other expense(10,288)(43,586)(25,396)(57,776)
Total37,832(6,241)173,98289,044
Interest Expense
Interest charges65,53264,080254,314247,501
Allowance for borrowed funds used during construction(5,586)(5,042)(21,052)(18,530)
Total59,94659,038233,262228,971
Income Before Income Taxes27,903(34,431)746,030648,225
Income Taxes(3,987)(19,913)110,08678,173
Net Income31,890(14,518)635,944570,052
Less: Net income attributable to noncontrolling interests4,3064,87317,22419,493
Net Income Attributable To Common Shareholders$ 27,584$ (19,391)$ 618,720$ 550,559
Weighted-Average Common Shares Outstanding - Basic113,005112,747112,910112,666
Weighted-Average Common Shares Outstanding - Diluted113,232113,031113,192112,942
Earnings Per Weighted-Average Common Share Outstanding
Net income attributable to common shareholders - basic$ 0.24$ (0.17)$ 5.48$ 4.89
Net income attributable to common shareholders - diluted$ 0.24$ (0.17)$ 5.47$ 4.87


image_0a.jpg
FOR IMMEDIATE RELEASEFebruary 25, 2022
Media Contact:
Analyst Contact:
Alan Bunnell (602) 250-3376
Amanda Ho (602) 250-3334
Website:
pinnaclewest.com


PINNACLE WEST ADDS FORMER HEAD OF ARIZONA HISPANIC CHAMBER OF COMMERCE
TO ITS BOARD OF DIRECTORS

PHOENIX – Pinnacle West Capital Corp. (NYSE: PNW) announced today that Gonzalo A. de la Melena Jr., Founder and Chief Executive Officer of Phoenix-based Emerging Airport Ventures, has been elected to the company’s board of directors effective immediately.

For nearly a decade, de la Melena served Arizona communities as President and CEO of the Arizona Hispanic Chamber of Commerce where he helped Latino-owned businesses find access to capital and resources to help them grow and prosper. He also was Operator of the Minority Business Development Agency (MBDA), the region’s leading advocate representing more than 200,000-plus minority business enterprises. In that capacity, he worked directly with national and regional economic development organizations and elected officials on supplier development, diversity, equity and inclusion.

“Gonzalo is an impressive executive with a strong combination of corporate, civic and entrepreneurial experience,” said Pinnacle West Chairman, President and Chief Executive Officer Jeff Guldner. “His relationships with Arizona business and Hispanic communities are important qualities that are valued by me and our entire board. Additionally, Gonzalo’s diversity and expertise will make our company stronger and better represent the communities we serve, while helping Arizona grow in responsible ways.”

de la Melena has more than 20 years of management experience in consumer package goods, retail and restaurants. He began his career in “back of the house” restaurant operations before joining consumer products companies Coca-Cola and The Dial Corporation, where he conducted business in more than 30 countries before reaching 30 years of age.

He currently serves on the National Board of Directors for Airport Minority Advisory Council (AMAC), Gainey Business Bancorp (in organization), Education Forward Arizona and is a member of Greater Phoenix Leadership (GPL). He earned a Master of Business Administration from Thunderbird School of Global Management and received an undergraduate degree in business from Arizona State University.

Pinnacle West Capital Corp., an energy holding company based in Phoenix, has consolidated assets of approximately $22 billion, about 6,300 megawatts of generating capacity, and nearly 5,900 employees in Arizona and New Mexico. Through its principal subsidiary, Arizona Public Service, the company provides retail electricity service to more than 1.3 million Arizona homes and businesses. For more information about Pinnacle West, visit the company’s website at pinnaclewest.com.

-30-

POWERING GROWTH DELIVERING VALUE Fourth Quarter & Full Year 2021 Results February 25, 2022 1


Forward Looking Statements 2 This presentation contains forward-looking statements based on current expectations, including statements regarding our earnings guidance and financial outlook and goals. These forward-looking statements are often identified by words such as “estimate,” “predict,” “may,” “believe,” “plan,” “expect,” “require,” “intend,” “assume,” “project,” "anticipate," "goal," "seek," "strategy," "likely," "should," "will," "could," and similar words. Because actual results may differ materially from expectations, we caution you not to place undue reliance on these statements. A number of factors could cause future results to differ materially from historical results, or from outcomes currently expected or sought by Pinnacle West or APS. These factors include, but are not limited to: the potential effects of the continued COVID-19 pandemic, including, but not limited to, demand for energy, economic growth, our employees and contractors, vaccine mandates, supply chain, expenses, capital markets, capital projects, operations and maintenance activities, uncollectable accounts, liquidity, cash flows, or other unpredictable events; our ability to manage capital expenditures and operations and maintenance costs while maintaining reliability and customer service levels; variations in demand for electricity, including those due to weather, seasonality (including large increases in ambient temperatures), the general economy or social conditions, customer and sales growth (or decline), the effects of energy conservation measures and distributed generation, and technological advancements; the potential effects of climate change on our electric system, including as a result of weather extremes such as prolonged drought and high temperature variations in the area where APS conducts its business; power plant and transmission system performance and outages; competition in retail and wholesale power markets; regulatory and judicial decisions, developments and proceedings; new legislation, ballot initiatives and regulation or interpretations of existing legislation or regulations, including those relating to environmental requirements, regulatory and energy policy, nuclear plant operations and potential deregulation of retail electric markets; fuel and water supply availability; our ability to achieve timely and adequate rate recovery of our costs through our rates and adjustor recovery mechanisms, including returns on and of debt and equity capital investments; our ability to meet renewable energy and energy efficiency mandates and recover related costs; the ability of APS to achieve its clean energy goals (including a goal by 2050 of 100% clean, carbon-free electricity) and, if these goals are achieved, the impact of such achievement on APS, its customers, and its business, financial condition and results of operations; risks inherent in the operation of nuclear facilities, including spent fuel disposal uncertainty; current and future economic conditions in Arizona, including in real estate markets; the direct or indirect effect on our facilities or business from cybersecurity threats or intrusions, data security breaches, terrorist attack, physical attack, severe storms, or other catastrophic events, such as fires, explosions, pandemic health events, or similar occurrences; the development of new technologies which may affect electric sales or delivery; the cost of debt and equity capital and the ability to access capital markets when required; environmental, economic and other concerns surrounding coal-fired generation, including regulation of greenhouse gas emissions; volatile fuel and purchased power costs; the investment performance of the assets of our nuclear decommissioning trust, pension, and other postretirement benefit plans and the resulting impact on future funding requirements; the liquidity of wholesale power markets and the use of derivative contracts in our business; potential shortfalls in insurance coverage; new accounting requirements or new interpretations of existing requirements; generation, transmission and distribution facility and system conditions and operating costs; the ability to meet the anticipated future need for additional generation and associated transmission facilities in our region; the willingness or ability of our counterparties, power plant participants and power plant land-owners to meet contractual or other obligations or extend the rights for continued power plant operations; and restrictions on dividends or other provisions in our credit agreements and ACC orders. These and other factors are discussed in Risk Factors described in Part I, Item 1A of the Pinnacle West/APS Annual Report on Form 10-K for the fiscal year ended December 31, 2021, which you should review carefully before placing any reliance on our financial statements, disclosures or earnings outlook. Neither Pinnacle West nor APS assumes any obligation to update these statements, even if our internal estimates change, except as required by law. In this presentation, references to net income and earnings per share (EPS) refer to amounts attributable to common shareholders. Fourth Quarter 2021


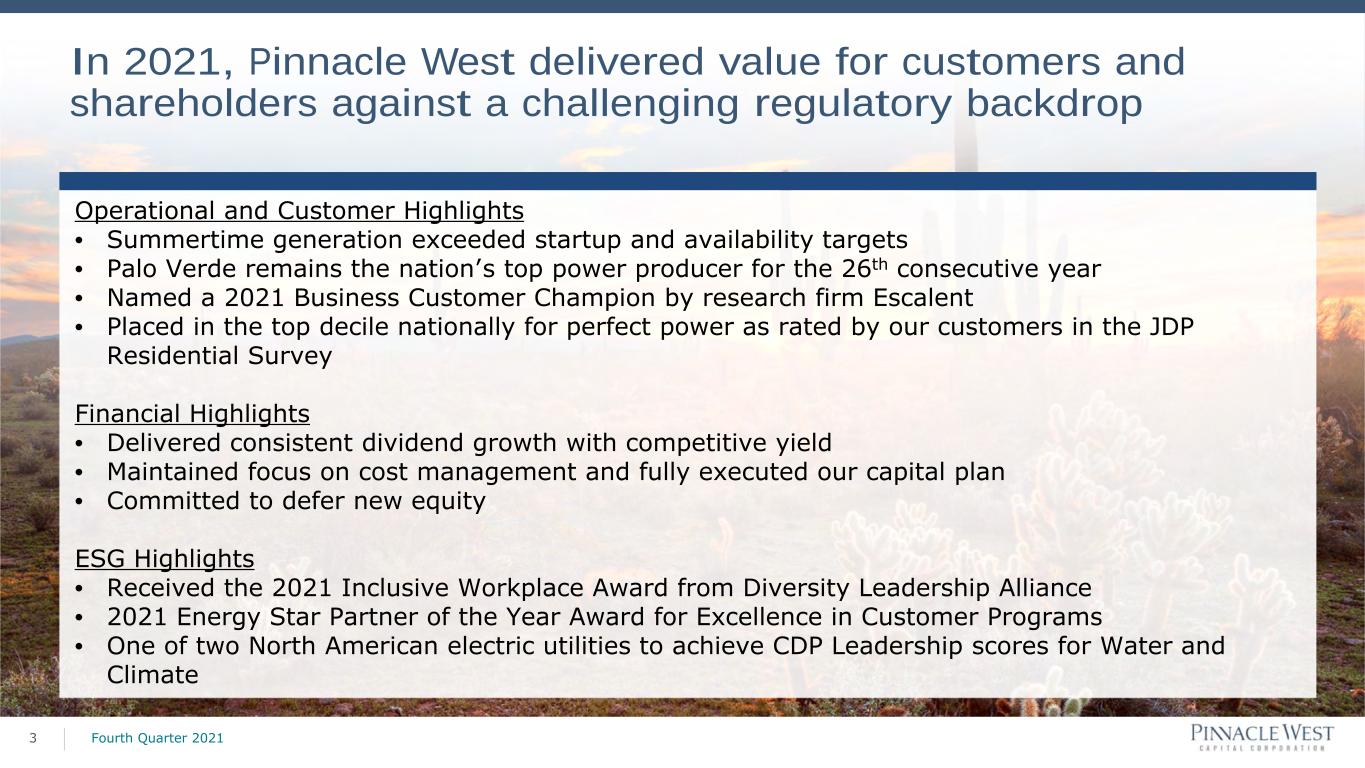
In 2021, Pinnacle West delivered value for customers and shareholders against a challenging regulatory backdrop 3 Fourth Quarter 2021 Operational and Customer Highlights • Summertime generation exceeded startup and availability targets • Palo Verde remains the nation’s top power producer for the 26th consecutive year • Named a 2021 Business Customer Champion by research firm Escalent • Placed in the top decile nationally for perfect power as rated by our customers in the JDP Residential Survey Financial Highlights • Delivered consistent dividend growth with competitive yield • Maintained focus on cost management and fully executed our capital plan • Committed to defer new equity ESG Highlights • Received the 2021 Inclusive Workplace Award from Diversity Leadership Alliance • 2021 Energy Star Partner of the Year Award for Excellence in Customer Programs • One of two North American electric utilities to achieve CDP Leadership scores for Water and Climate


4th Quarter 2021 results driven by higher usage4 4 4th Quarter 2021 vs. 4th Quarter 2020 4Q 2020 4Q 2021 $(0.17) $0.24 Operating Revenue less Fuel and Purchased Power1 $0.09 O&M1 & 2 $0.13 D&A2 $(0.10) Operating Revenue less Fuel and Purchased Power AZ AG Settlement Federal Tax Reform3 Sales/Usage Other Transmission LFCR Weather $ $ $ $ $ $ $ 0.16 0.09 0.08 0.06 0.03 0.01 (0.34) Pension & OPEB Non- service Credits, net $0.09 Other, net2 $0.20 1 Includes costs and offsetting operating revenues associated with renewable energy and demand side management programs, see slide 24 for more information. 2 Includes the deferral impacts of the Four Corners Selective Catalytic Reduction (SCR) equipment and Ocotillo Modernization Project (OMP), see slide 20 & 21 for more information. 3 The Effective Tax Rate is primarily impacted by the amortization of excess deferred taxes related to Federal Tax Reform, which is offset in Operating Revenue less Fuel and Purchased Power. 4All items not shown (Other taxes, Interest net of AFUDC, income taxes) are immaterial and have a net impact of $0.00 on EPS. Fourth Quarter 2021


2021 full-year EPS driven by robust sales and usage growth 5 Full Year 2021 vs. Full Year 2020 2020 2021 $4.87 $5.47 Operating Revenue less Fuel and Purchased Power1 $0.38 O&M1 & 2 $0.03 D&A2 $(0.24) Other Taxes2 $(0.07) Interest, net of AFUDC $0.04 Pension & OPEB Non- service Credits, net $0.37 Other, net2 $0.16 Effective Tax Rate3 $(0.07) Operating Revenue less Fuel and Purchased Power Sales/Usage Federal Tax Reform3 Transmission AZ AG Settlement Other LFCR Weather $ $ $ $ $ $ $ 0.51 0.20 0.17 0.16 0.08 0.02 (0.76) 1 Includes costs and offsetting operating revenues associated with renewable energy and demand side management programs, see slide 24 for more information. 2 Includes the deferral impacts of the SCR equipment and OMP, see slide 20 & 21 for more information. 3 The Effective Tax Rate is primarily impacted by the amortization of excess deferred taxes related to Federal Tax Reform, which is offset in Operating Revenue less Fuel and Purchased Power. Fourth Quarter 2021


2022 EPS driven by disappointing 2021 rate case outcome & other factors1 6 1 Amounts provided are the Company’s current projections. 2022 EPS Guidance of $3.90-$4.10 per share 2021 2022E $5.47 $4.00 Net effect of 2019 Rate Case Decision on Income $(0.90) $0.14 O&M/Other $(0.29) D&A Interest, net of AFUDC $(0.24) $(0.18) Pension & OPEB Non-service Credits, net O&M/Other O&M Sales Growth Price, Adjustors, Weather, & Other 2021 income tax benefit $ $ $ $ 0.17 0.16 (0.11) (0.08) Fourth Quarter 2021


Key drivers for EPS guidance1 1 • Retail customer growth ~1.5%-2.5% • Weather-normalized retail electricity sales growth of 1.5%-2.5% • Transmission revenues • Operations and maintenance savings • Depreciation and amortization Fourth Quarter 20217 2022 key drivers • Long-term EPS growth target of 5-7%2 • Retail customer growth 1.5%-2.5%3 • Weather-normalized retail electricity sales growth of 3.5-4.5%3 1 As of February 25, 2022. Long-term guidance and key drivers • Property Tax • Interest on new debt • AFUDC • Pension and OPEB 2 Long-term EPS growth rate based on the Company’s current 5-year compound annual growth rate projections from 2022-2026 3 Forecasted guidance range from 2022-2024


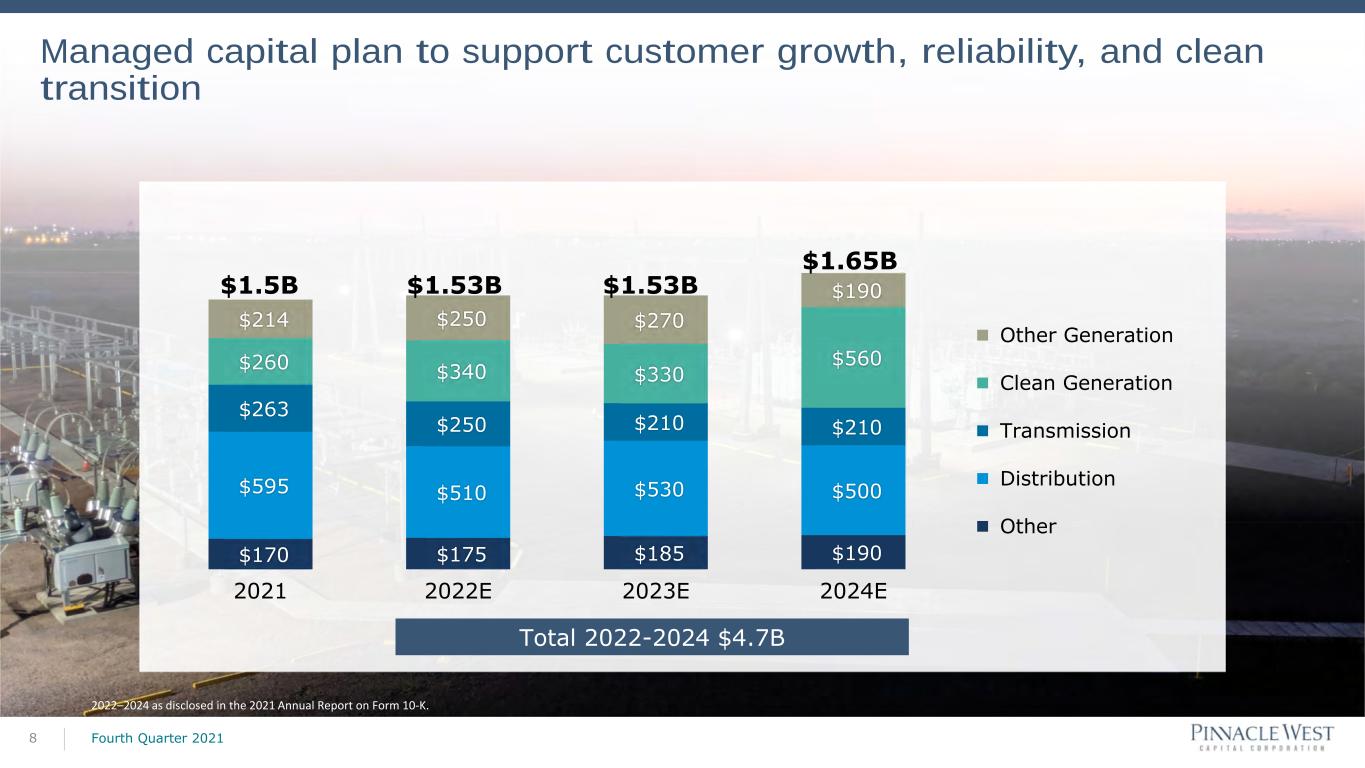
$170 $175 $185 $190 $595 $510 $530 $500 $263 $250 $210 $210 $260 $340 $330 $560 $214 $250 $270 $190 2021 2022E 2023E 2024E Other Generation Clean Generation Transmission Distribution Other Total 2022-2024 $4.7B $1.5B $1.53B $1.53B $1.65B 8 Managed capital plan to support customer growth, reliability, and clean transition 2022–2024 as disclosed in the 2021 Annual Report on Form 10-K. Fourth Quarter 2021


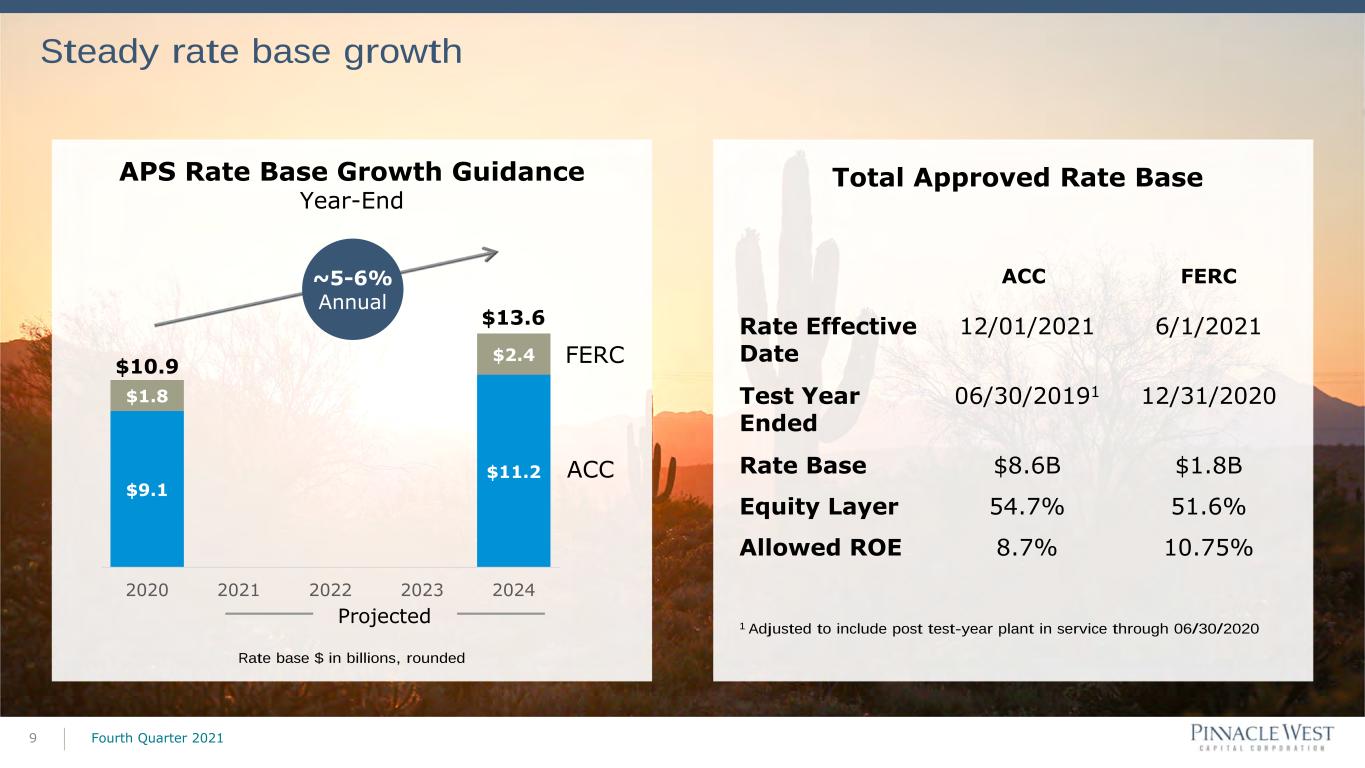
Total Approved Rate BaseAPS Rate Base Growth Guidance Year-End Steady rate base growth Fourth Quarter 20219 ACC FERC Rate Effective Date 12/01/2021 6/1/2021 Test Year Ended 06/30/20191 12/31/2020 Rate Base $8.6B $1.8B Equity Layer 54.7% 51.6% Allowed ROE 8.7% 10.75% 1 Adjusted to include post test-year plant in service through 06/30/2020 Rate base $ in billions, rounded $9.1 $11.2 $1.8 $2.4 2020 2021 2022 2023 2024 Projected ~5-6% Annual FERC ACC $10.9 $13.6


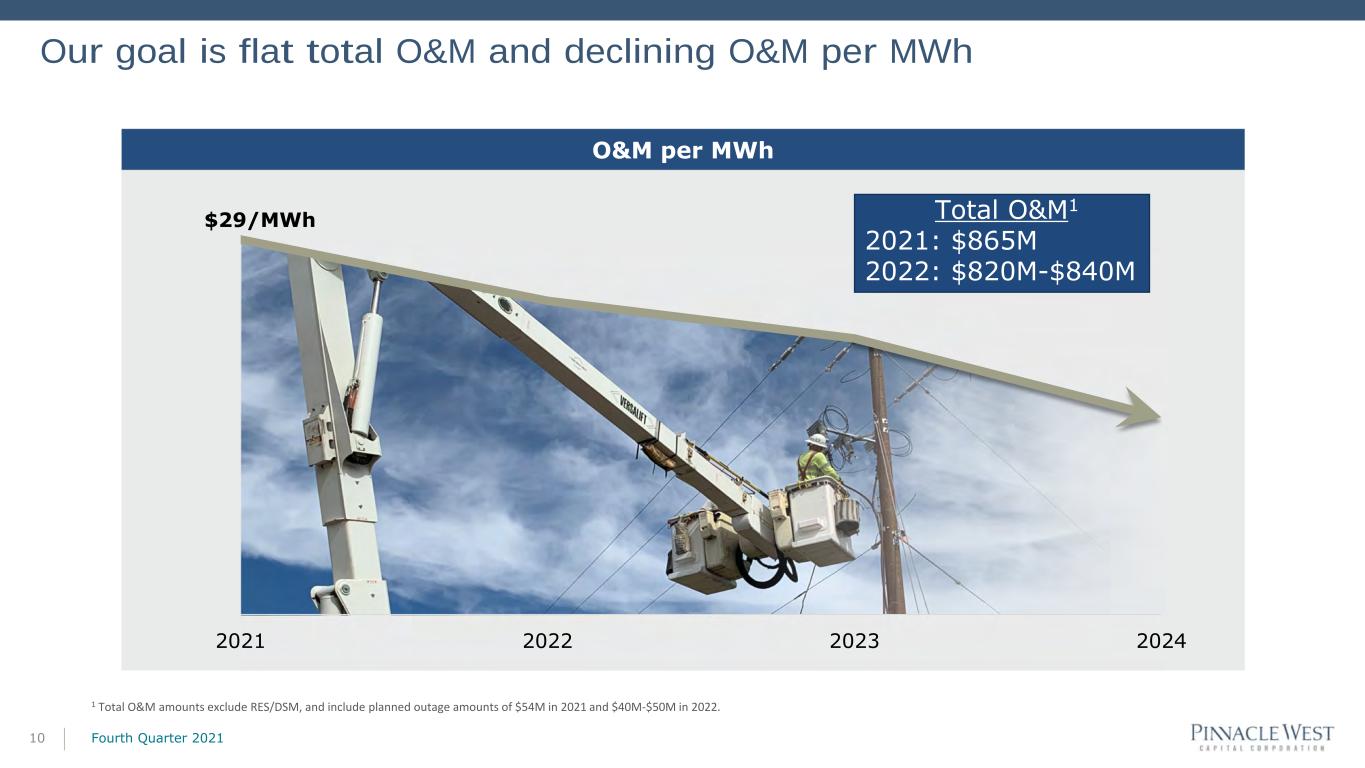
Our goal is flat total O&M and declining O&M per MWh 10 2021 2022 2023 2024 $29/MWh O&M per MWh Total O&M1 2021: $865M 2022: $820M-$840M 1 Total O&M amounts exclude RES/DSM, and include planned outage amounts of $54M in 2021 and $40M-$50M in 2022. Fourth Quarter 2021


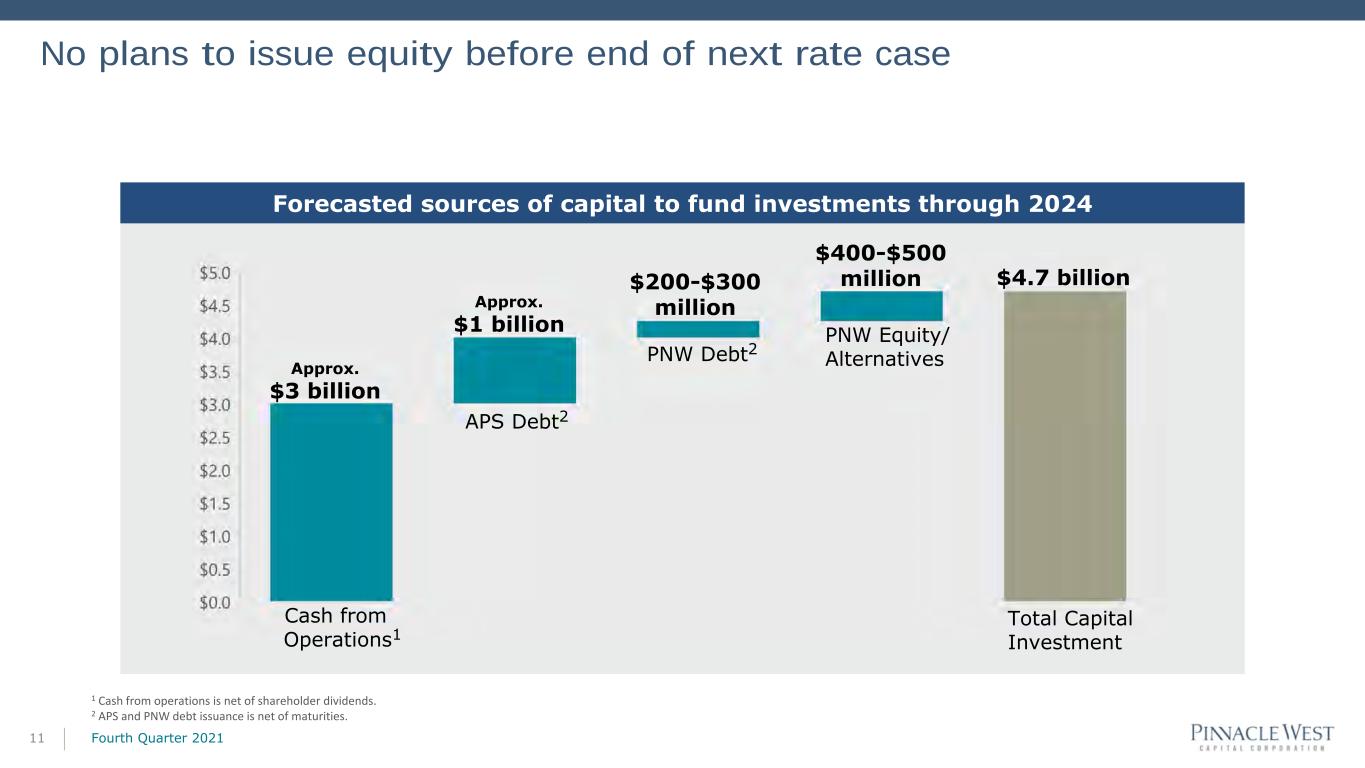
Forecasted sources of capital to fund investments through 2024 No plans to issue equity before end of next rate case 11 Approx. $3 billion Approx. $1 billion $4.7 billion APS Debt2 PNW Debt2 Cash from Operations1 $200-$300 million $400-$500 million 1 Cash from operations is net of shareholder dividends. 2 APS and PNW debt issuance is net of maturities. Fourth Quarter 2021 Total Capital Investment PNW Equity/ Alternatives


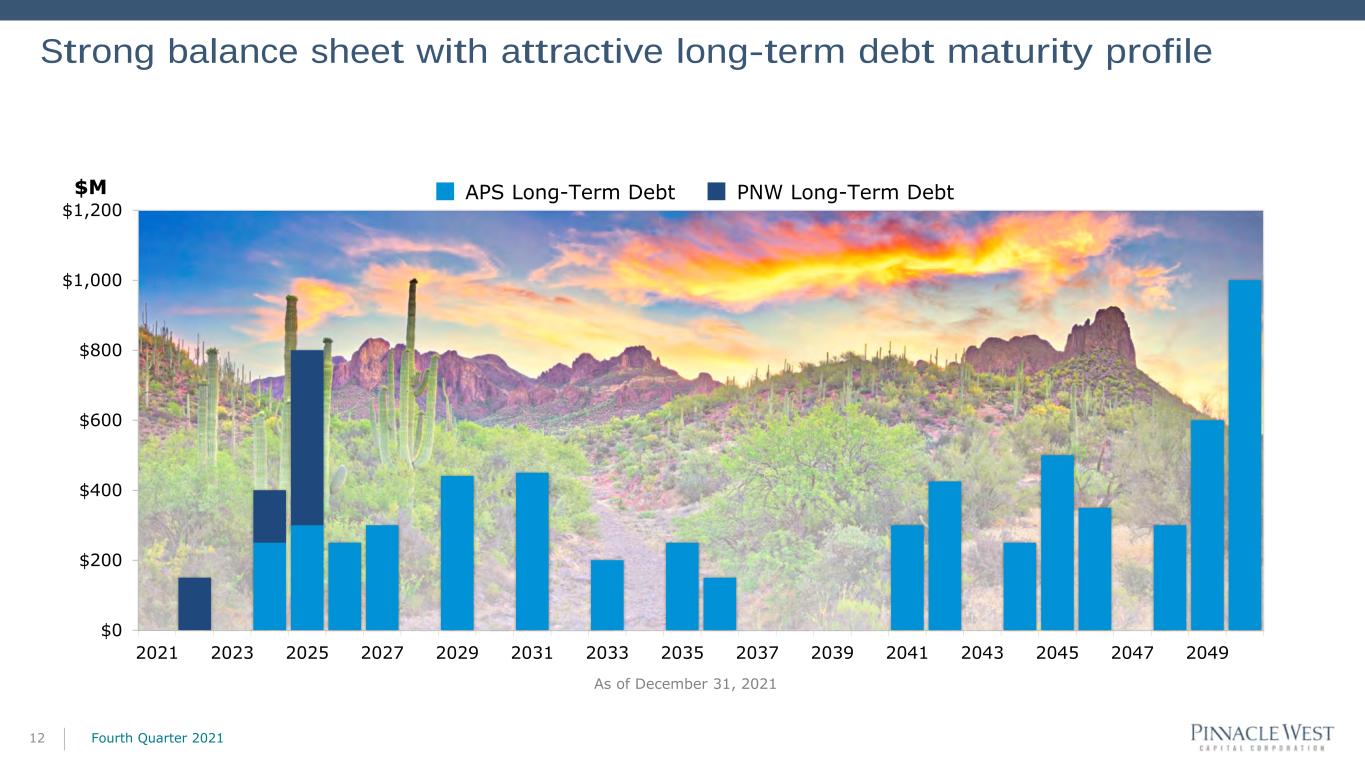
Strong balance sheet with attractive long-term debt maturity profile 12 $M PNW Long-Term DebtAPS Long-Term Debt $0 $200 $400 $600 $800 $1,000 $1,200 2021 2023 2025 2027 2029 2031 2033 2035 2037 2039 2041 2043 2045 2047 2049 As of December 31, 2021 Fourth Quarter 2021


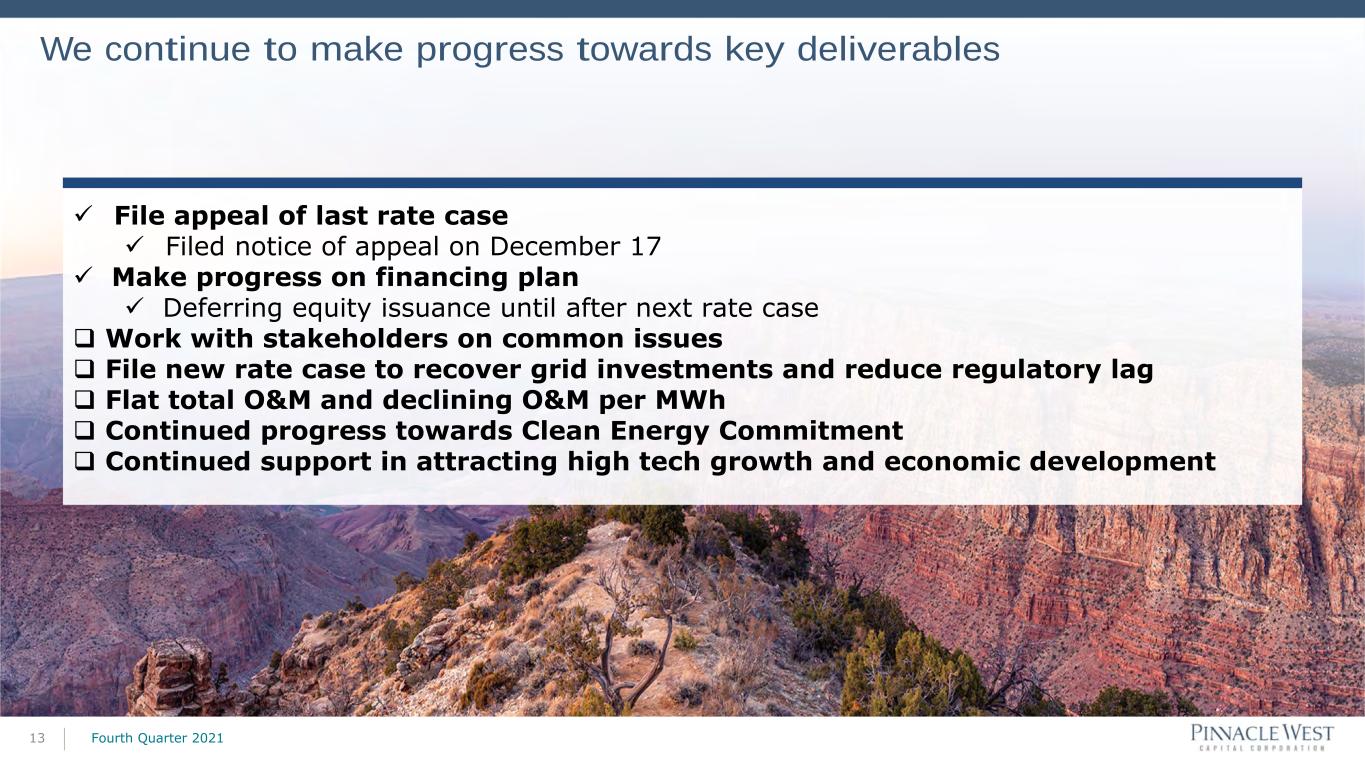
We continue to make progress towards key deliverables Fourth Quarter 202113  File appeal of last rate case  Filed notice of appeal on December 17  Make progress on financing plan  Deferring equity issuance until after next rate case  Work with stakeholders on common issues  File new rate case to recover grid investments and reduce regulatory lag  Flat total O&M and declining O&M per MWh  Continued progress towards Clean Energy Commitment  Continued support in attracting high tech growth and economic development


APPENDIX


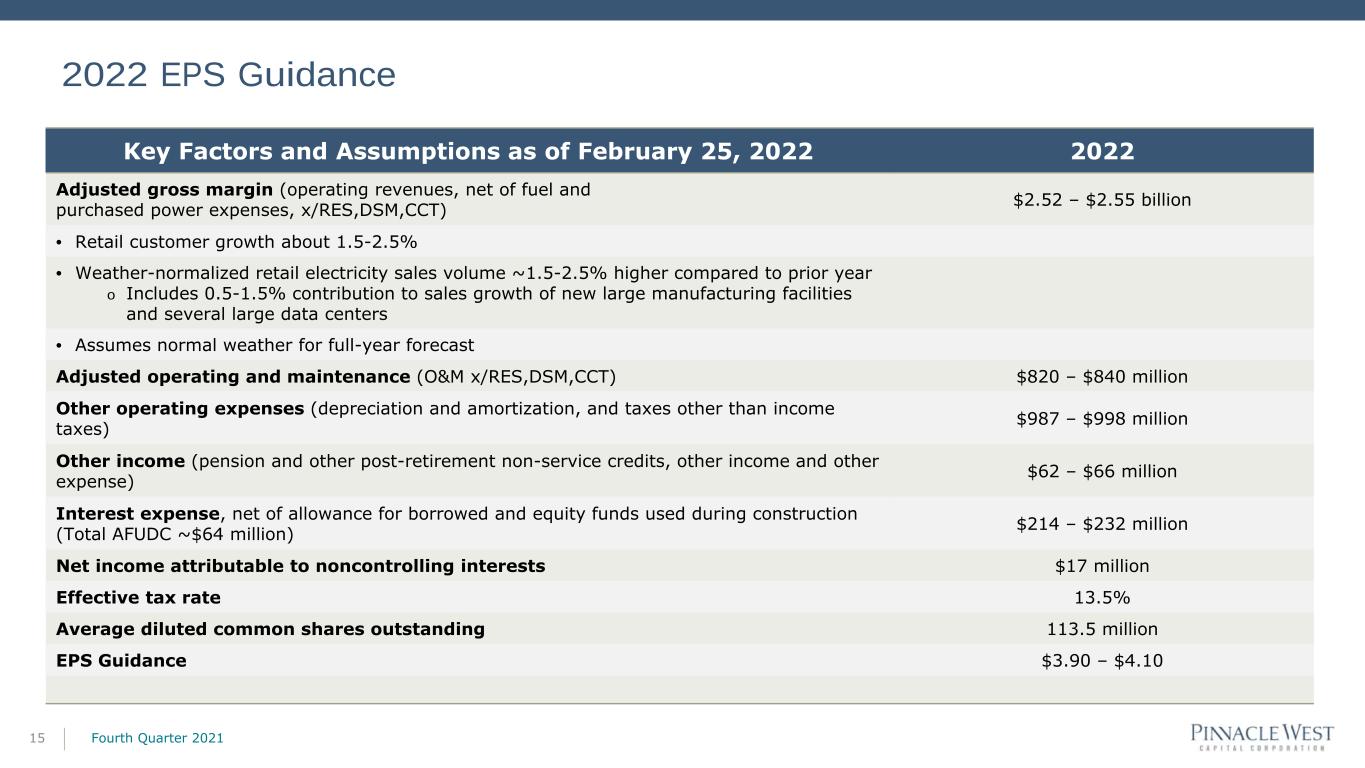
2022 EPS Guidance Fourth Quarter 202115 Key Factors and Assumptions as of February 25, 2022 2022 Adjusted gross margin (operating revenues, net of fuel and purchased power expenses, x/RES,DSM,CCT) $2.52 – $2.55 billion • Retail customer growth about 1.5-2.5% • Weather-normalized retail electricity sales volume ~1.5-2.5% higher compared to prior year o Includes 0.5-1.5% contribution to sales growth of new large manufacturing facilities and several large data centers • Assumes normal weather for full-year forecast Adjusted operating and maintenance (O&M x/RES,DSM,CCT) $820 – $840 million Other operating expenses (depreciation and amortization, and taxes other than income taxes) $987 – $998 million Other income (pension and other post-retirement non-service credits, other income and other expense) $62 – $66 million Interest expense, net of allowance for borrowed and equity funds used during construction (Total AFUDC ~$64 million) $214 – $232 million Net income attributable to noncontrolling interests $17 million Effective tax rate 13.5% Average diluted common shares outstanding 113.5 million EPS Guidance $3.90 – $4.10


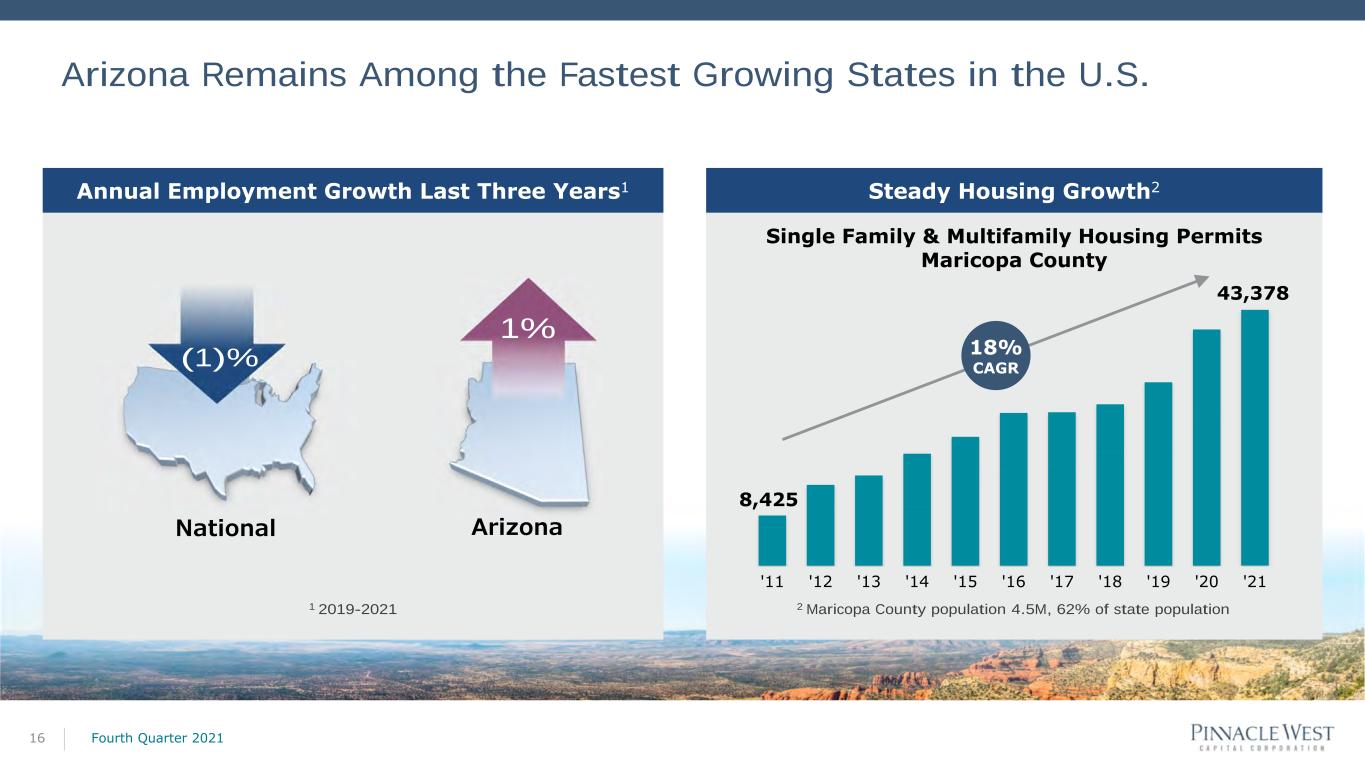
Arizona Remains Among the Fastest Growing States in the U.S. 16 Annual Employment Growth Last Three Years1 Steady Housing Growth2 '11 '12 '13 '14 '15 '16 '17 '18 '19 '20 '21 Single Family & Multifamily Housing Permits Maricopa County 8,425 43,378 2 Maricopa County population 4.5M, 62% of state population1 2019-2021 National Arizona (1)% 1% 18% CAGR Fourth Quarter 2021


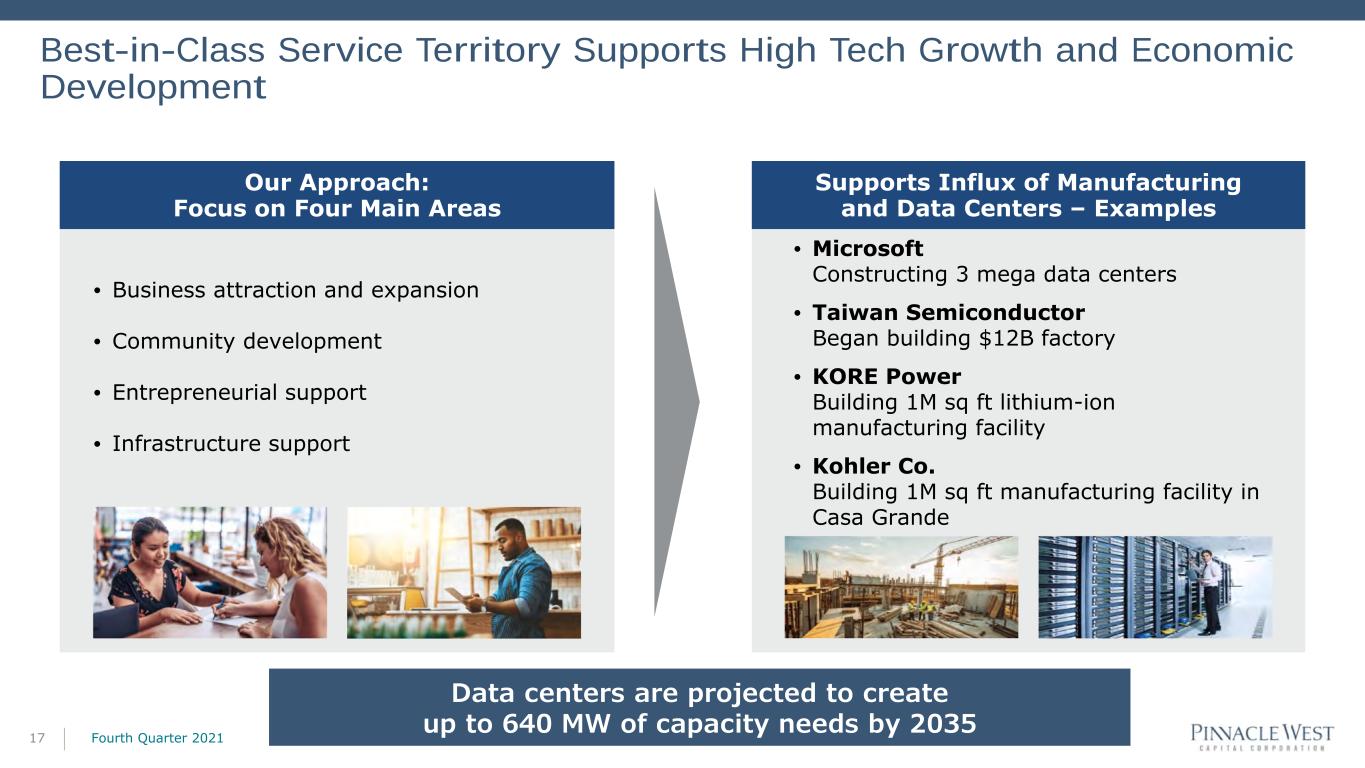
Best-in-Class Service Territory Supports High Tech Growth and Economic Development 17 Our Approach: Focus on Four Main Areas Supports Influx of Manufacturing and Data Centers – Examples • Business attraction and expansion • Community development • Entrepreneurial support • Infrastructure support • Microsoft Constructing 3 mega data centers • Taiwan Semiconductor Began building $12B factory • KORE Power Building 1M sq ft lithium-ion manufacturing facility • Kohler Co. Building 1M sq ft manufacturing facility in Casa Grande Data centers are projected to create up to 640 MW of capacity needs by 2035 Fourth Quarter 2021


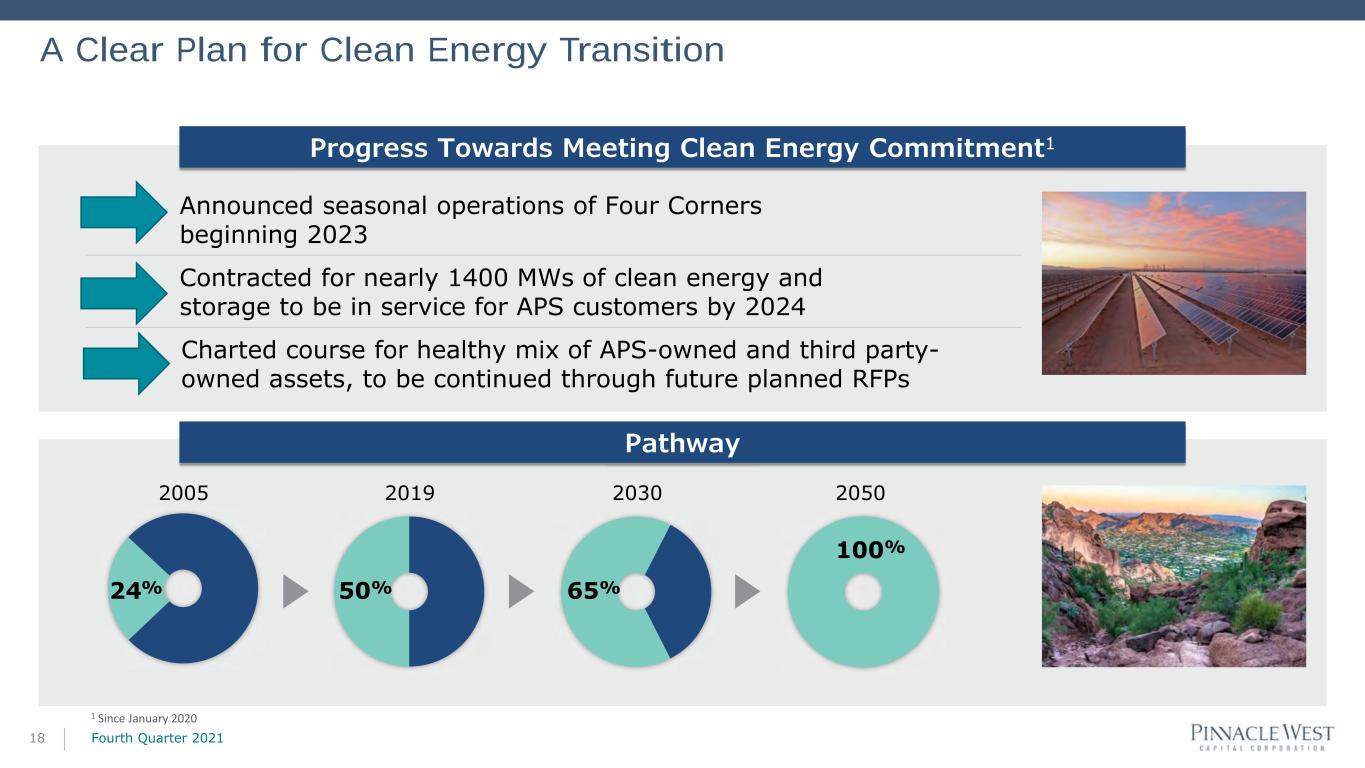
A Clear Plan for Clean Energy Transition 18 Progress Towards Meeting Clean Energy Commitment1 Pathway 2005 2019 2030 2050 Announced seasonal operations of Four Corners beginning 2023 Contracted for nearly 1400 MWs of clean energy and storage to be in service for APS customers by 2024 Charted course for healthy mix of APS-owned and third party- owned assets, to be continued through future planned RFPs 24% 50% 65% 100% 1 Since January 2020 Fourth Quarter 2021


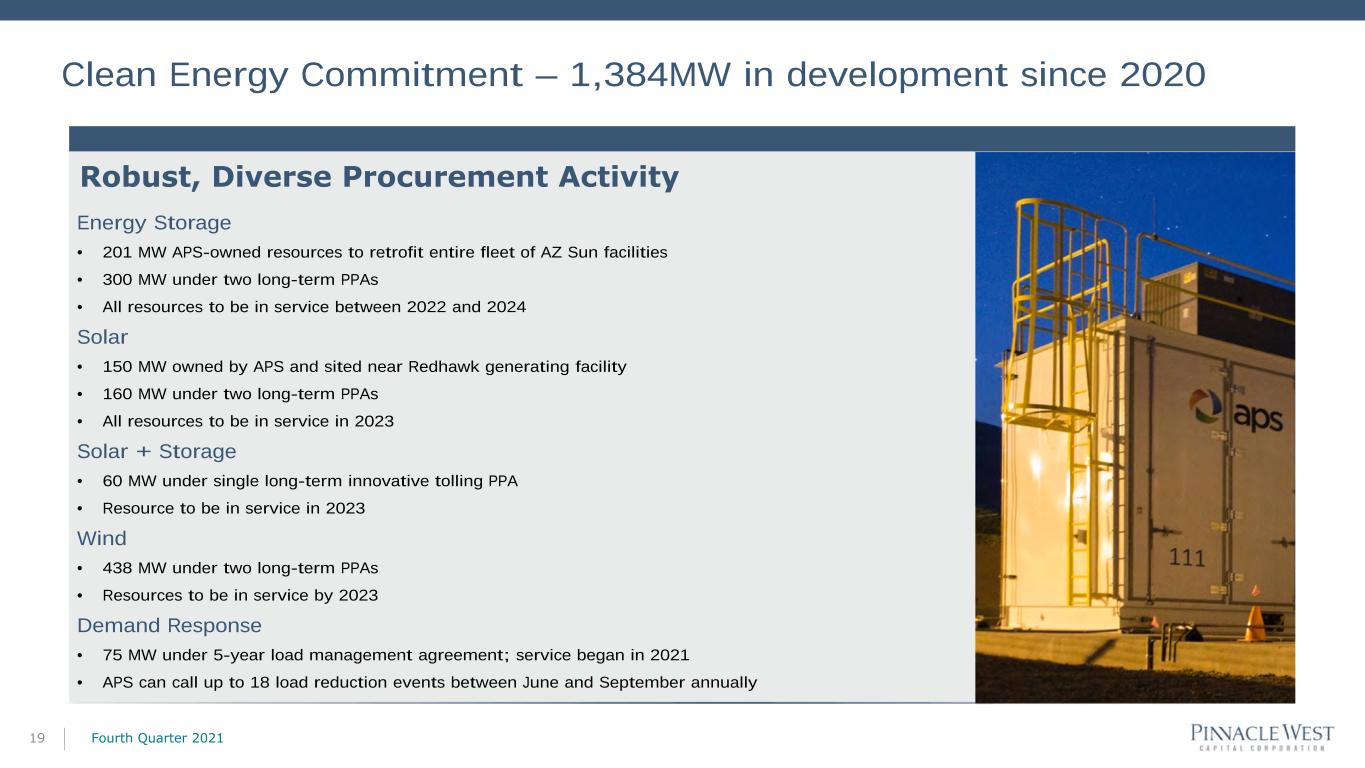
Clean Energy Commitment – 1,384MW in development since 2020 Fourth Quarter 202119 Robust, Diverse Procurement Activity Energy Storage • 201 MW APS-owned resources to retrofit entire fleet of AZ Sun facilities • 300 MW under two long-term PPAs • All resources to be in service between 2022 and 2024 Solar • 150 MW owned by APS and sited near Redhawk generating facility • 160 MW under two long-term PPAs • All resources to be in service in 2023 Solar + Storage • 60 MW under single long-term innovative tolling PPA • Resource to be in service in 2023 Wind • 438 MW under two long-term PPAs • Resources to be in service by 2023 Demand Response • 75 MW under 5-year load management agreement; service began in 2021 • APS can call up to 18 load reduction events between June and September annually


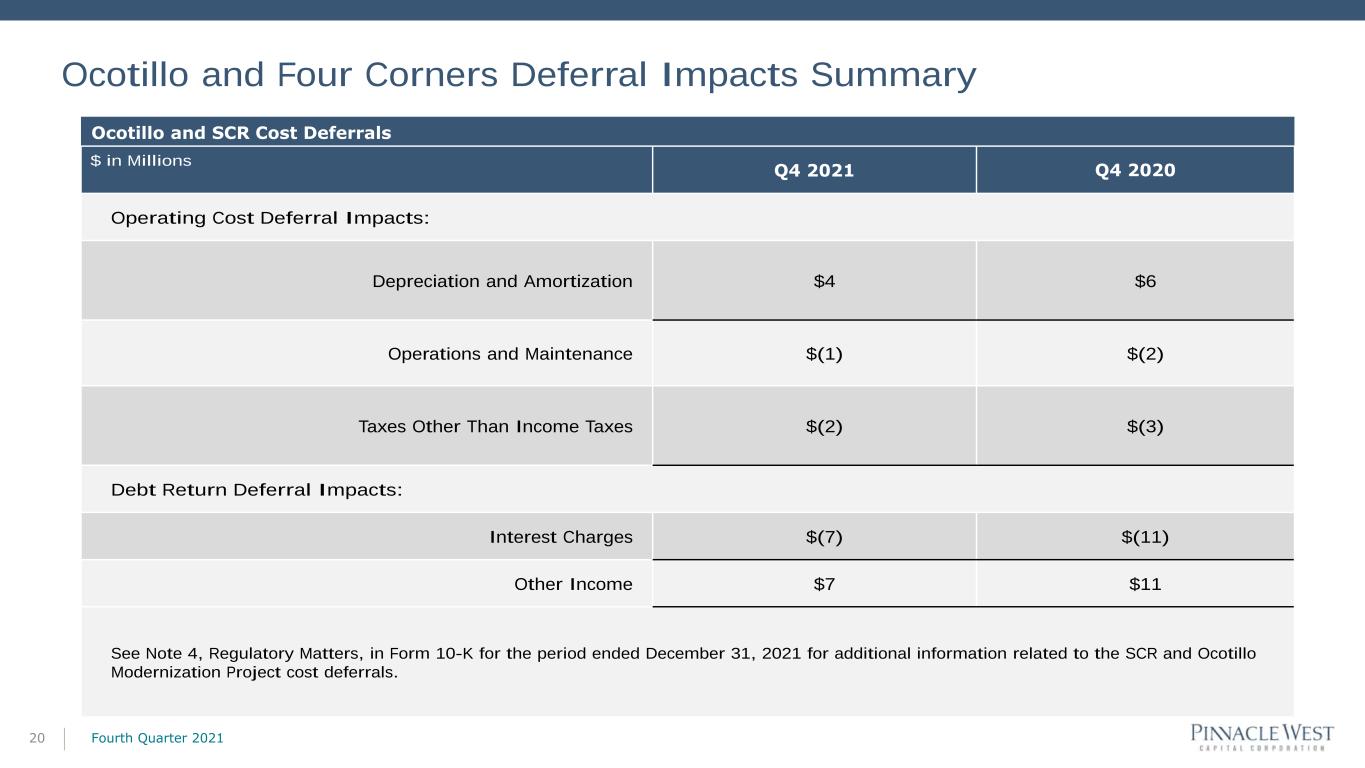
Ocotillo and Four Corners Deferral Impacts Summary Fourth Quarter 202120 Ocotillo and SCR Cost Deferrals $ in Millions Q4 2021 Q4 2020 Operating Cost Deferral Impacts: Depreciation and Amortization $4 $6 Operations and Maintenance $(1) $(2) Taxes Other Than Income Taxes $(2) $(3) Debt Return Deferral Impacts: Interest Charges $(7) $(11) Other Income $7 $11 See Note 4, Regulatory Matters, in Form 10-K for the period ended December 31, 2021 for additional information related to the SCR and Ocotillo Modernization Project cost deferrals.


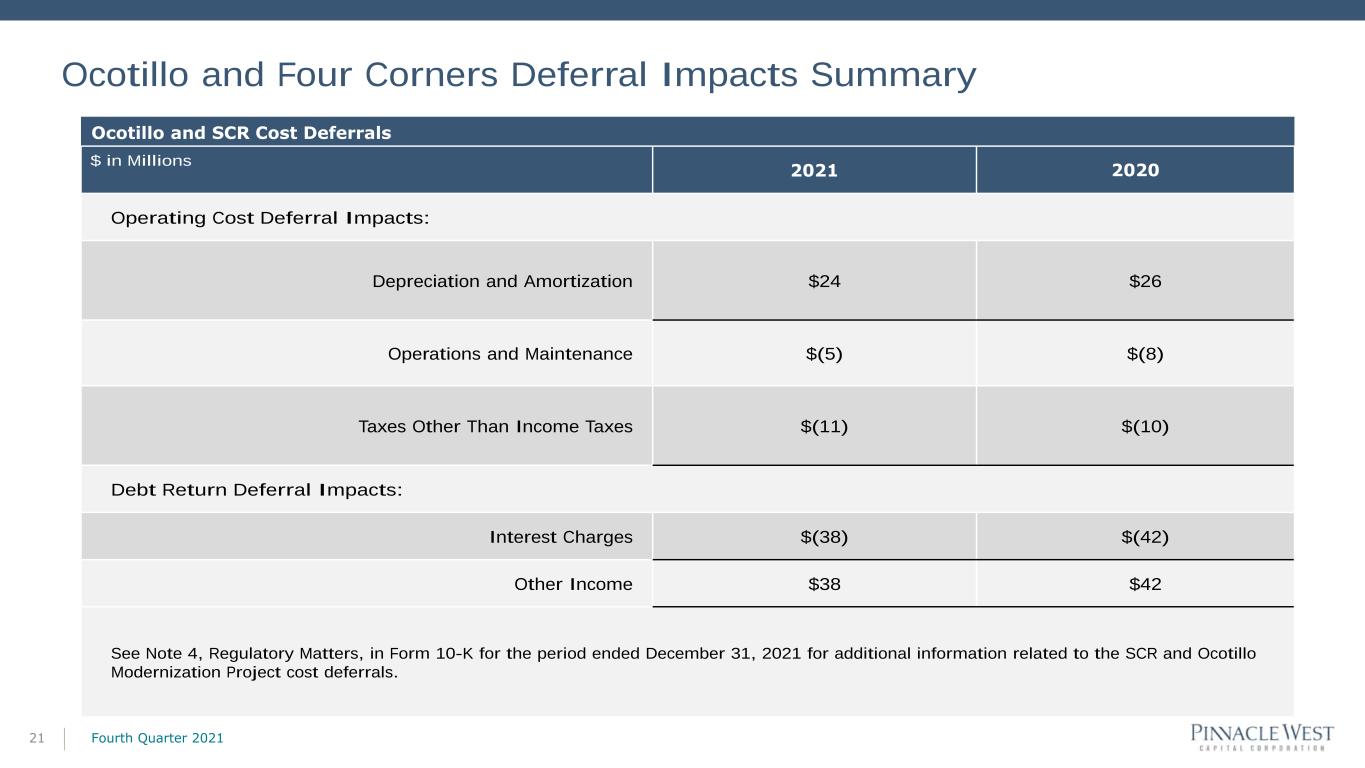
Ocotillo and Four Corners Deferral Impacts Summary Fourth Quarter 202121 Ocotillo and SCR Cost Deferrals $ in Millions 2021 2020 Operating Cost Deferral Impacts: Depreciation and Amortization $24 $26 Operations and Maintenance $(5) $(8) Taxes Other Than Income Taxes $(11) $(10) Debt Return Deferral Impacts: Interest Charges $(38) $(42) Other Income $38 $42 See Note 4, Regulatory Matters, in Form 10-K for the period ended December 31, 2021 for additional information related to the SCR and Ocotillo Modernization Project cost deferrals.


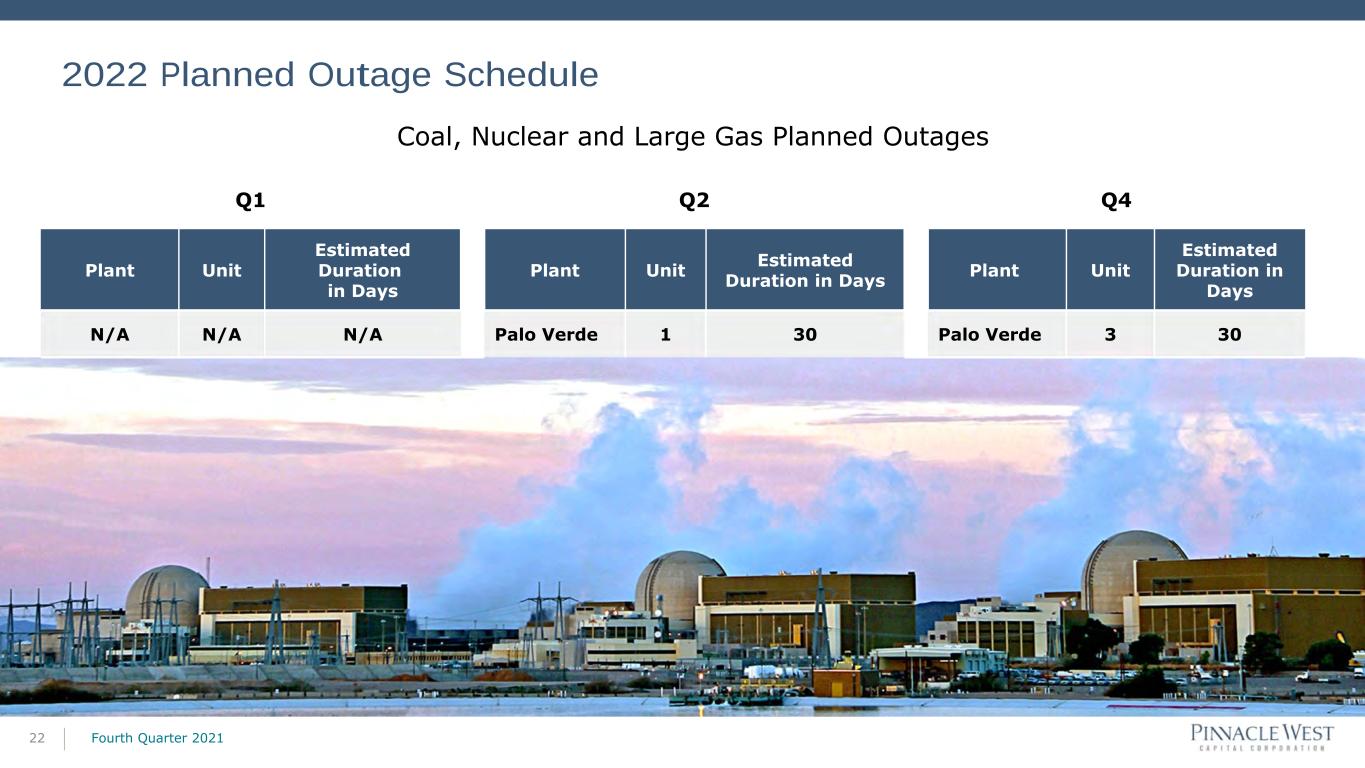
2022 Planned Outage Schedule Fourth Quarter 202122 Coal, Nuclear and Large Gas Planned Outages Q1 Q2 Q4 Plant Unit Estimated Duration in Days Plant Unit Estimated Duration in Days Plant Unit Estimated Duration in Days N/A N/A N/A Palo Verde 1 30 Palo Verde 3 30


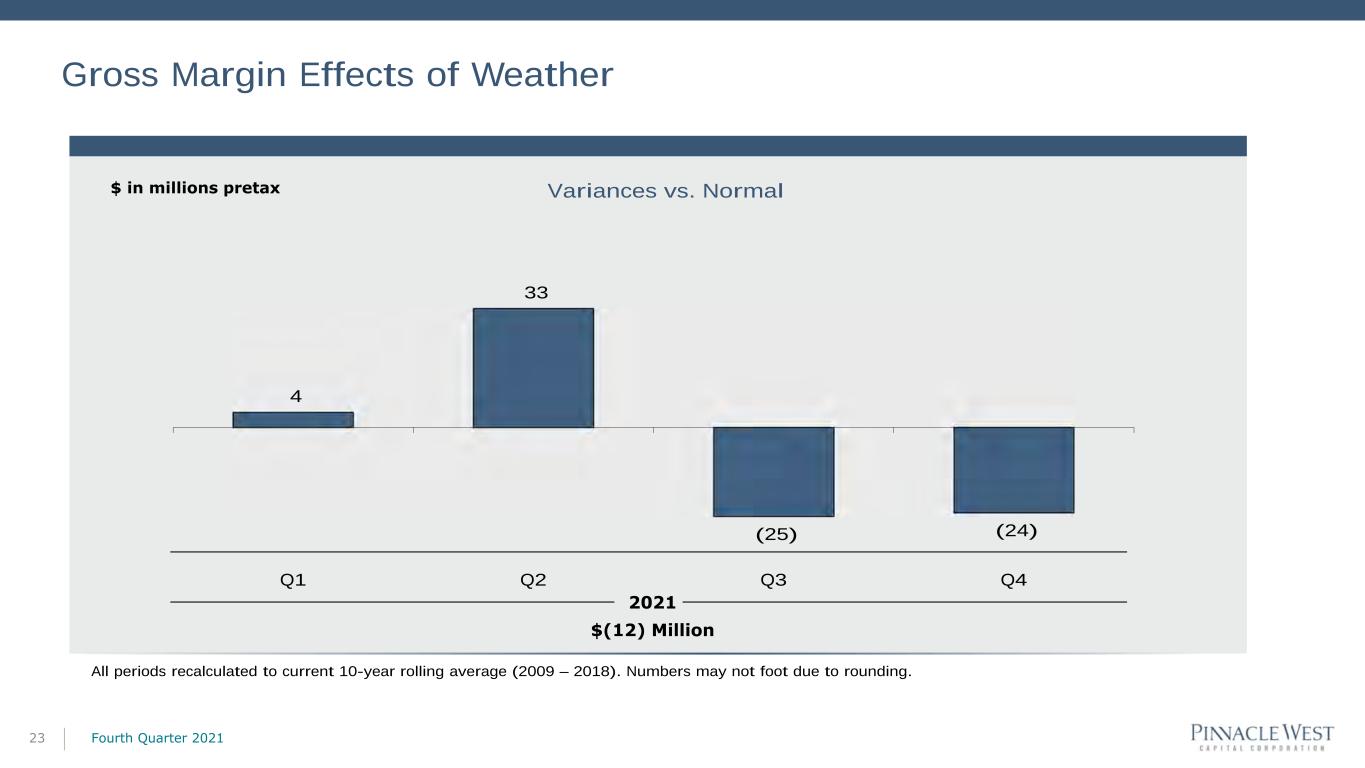
4 33 (25) (24) Q1 Q2 Q3 Q4 Gross Margin Effects of Weather Fourth Quarter 202123 Variances vs. Normal$ in millions pretax 2021 $(12) Million All periods recalculated to current 10-year rolling average (2009 – 2018). Numbers may not foot due to rounding.


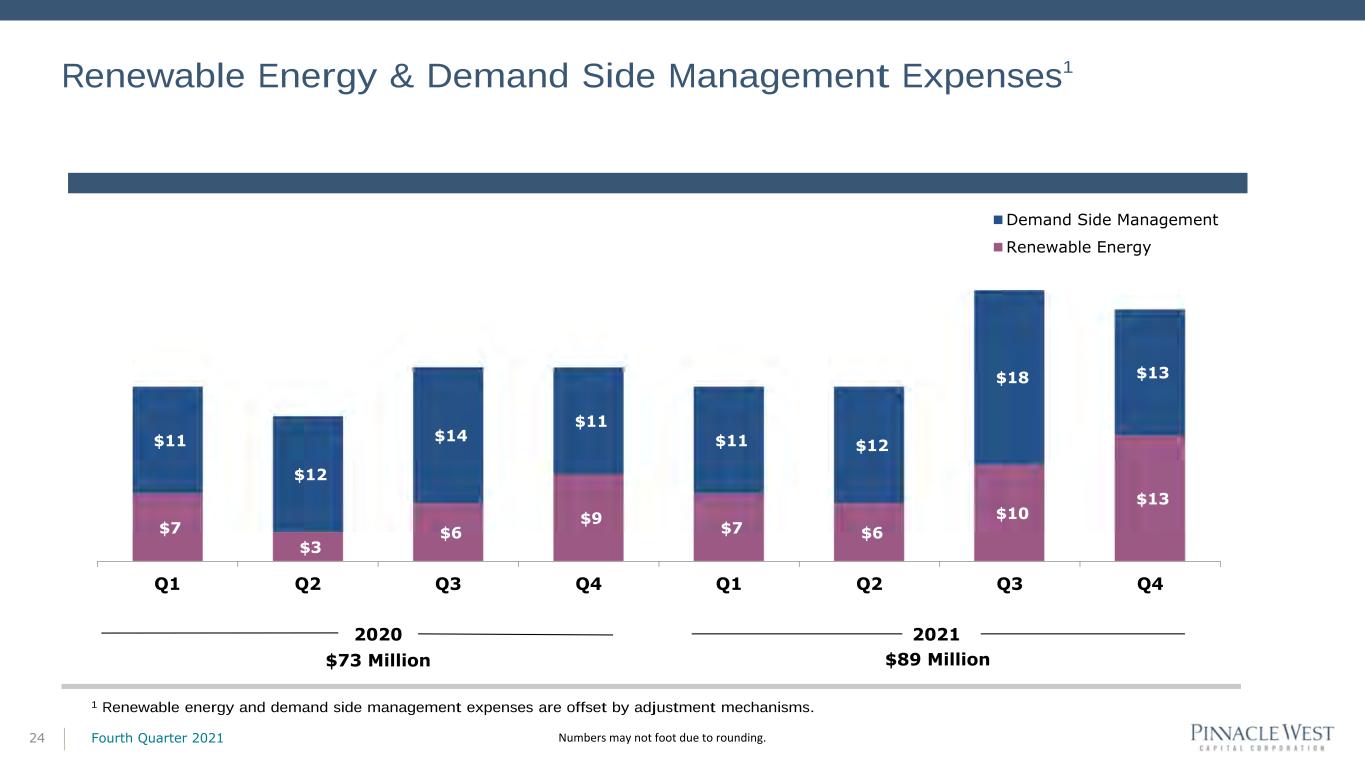
Renewable Energy & Demand Side Management Expenses1 Fourth Quarter 202124 $7 $3 $6 $9 $7 $6 $10 $13 $11 $12 $14 $11 $11 $12 $18 $13 Q1 Q2 Q3 Q4 Q1 Q2 Q3 Q4 Demand Side Management Renewable Energy 2020 $73 Million 1 Renewable energy and demand side management expenses are offset by adjustment mechanisms. 2021 $89 Million Numbers may not foot due to rounding.


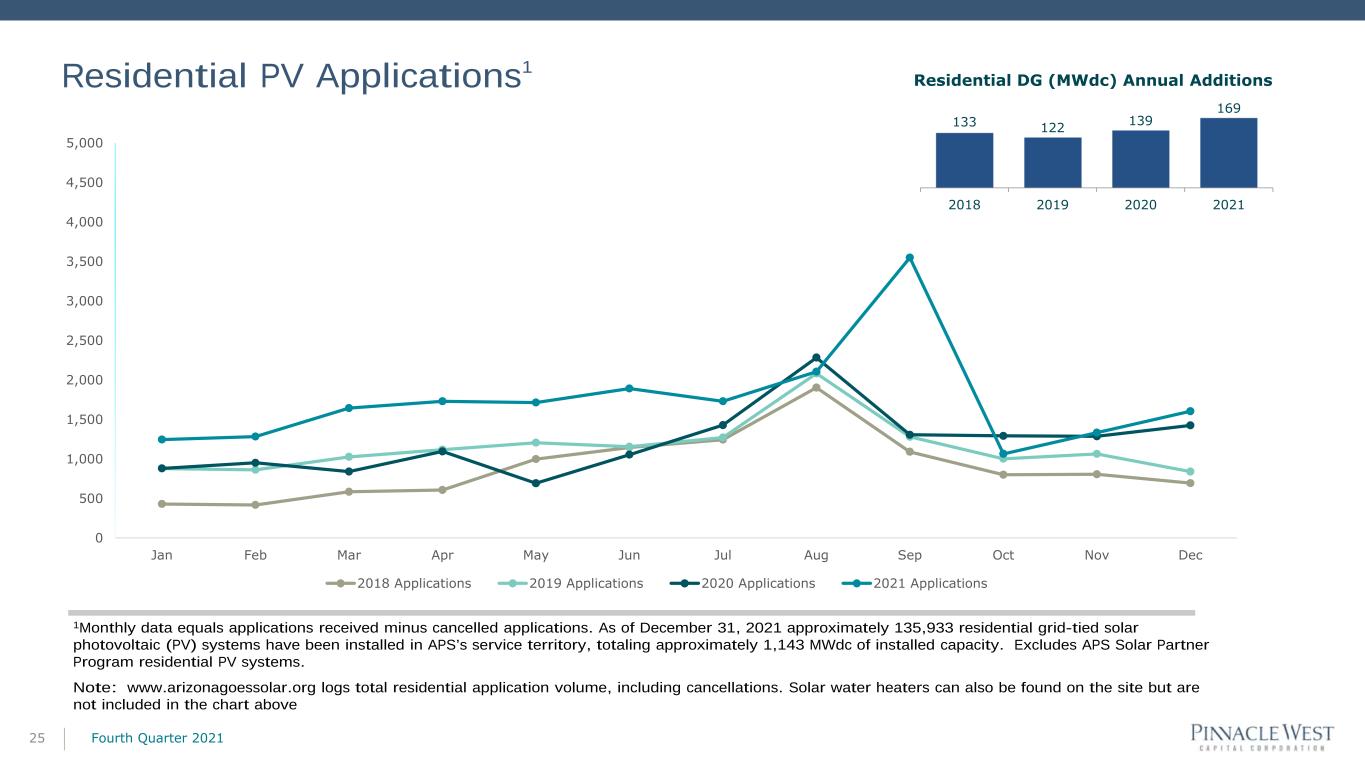
Residential PV Applications1 Fourth Quarter 202125 1Monthly data equals applications received minus cancelled applications. As of December 31, 2021 approximately 135,933 residential grid-tied solar photovoltaic (PV) systems have been installed in APS’s service territory, totaling approximately 1,143 MWdc of installed capacity. Excludes APS Solar Partner Program residential PV systems. Note: www.arizonagoessolar.org logs total residential application volume, including cancellations. Solar water heaters can also be found on the site but are not included in the chart above Residential DG (MWdc) Annual Additions 0 500 1,000 1,500 2,000 2,500 3,000 3,500 4,000 4,500 5,000 Jan Feb Mar Apr May Jun Jul Aug Sep Oct Nov Dec 2018 Applications 2019 Applications 2020 Applications 2021 Applications 133 122 139 169 2018 2019 2020 2021


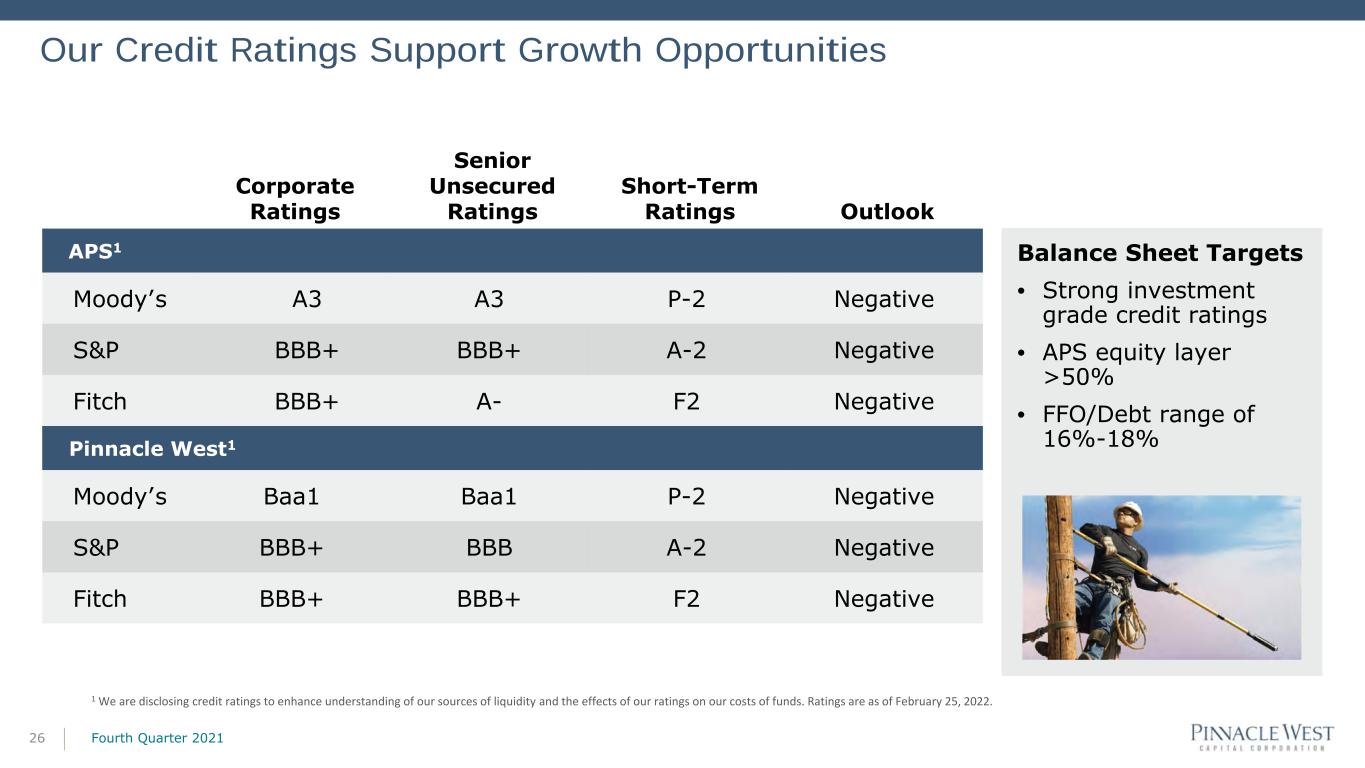
Our Credit Ratings Support Growth Opportunities 26 Corporate Ratings Senior Unsecured Ratings Short-Term Ratings Outlook APS1 Moody’s A3 A3 P-2 Negative S&P BBB+ BBB+ A-2 Negative Fitch BBB+ A- F2 Negative Pinnacle West1 Moody’s Baa1 Baa1 P-2 Negative S&P BBB+ BBB A-2 Negative Fitch BBB+ BBB+ F2 Negative Balance Sheet Targets • Strong investment grade credit ratings • APS equity layer >50% • FFO/Debt range of 16%-18% 1 We are disclosing credit ratings to enhance understanding of our sources of liquidity and the effects of our ratings on our costs of funds. Ratings are as of February 25, 2022. Fourth Quarter 2021


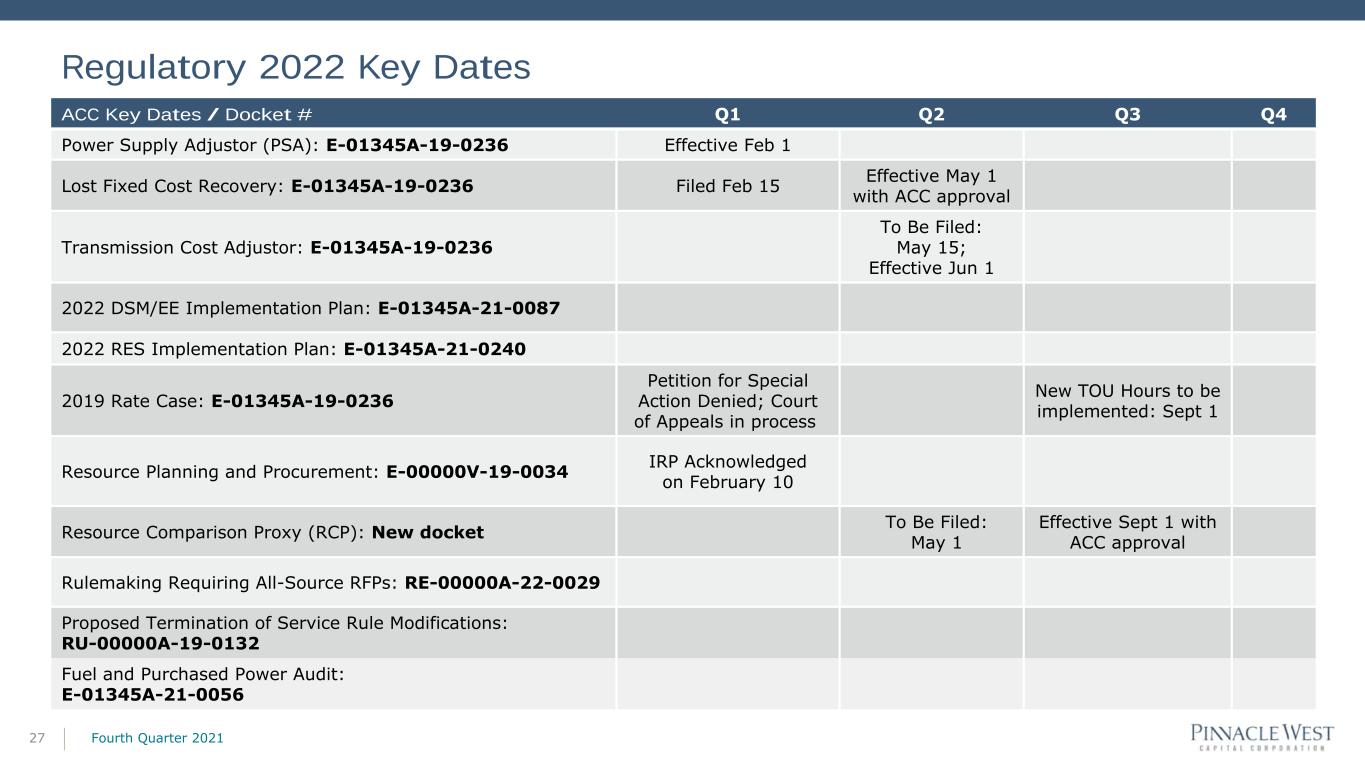
Regulatory 2022 Key Dates Fourth Quarter 202127 ACC Key Dates / Docket # Q1 Q2 Q3 Q4 Power Supply Adjustor (PSA): E-01345A-19-0236 Effective Feb 1 Lost Fixed Cost Recovery: E-01345A-19-0236 Filed Feb 15 Effective May 1 with ACC approval Transmission Cost Adjustor: E-01345A-19-0236 To Be Filed: May 15; Effective Jun 1 2022 DSM/EE Implementation Plan: E-01345A-21-0087 2022 RES Implementation Plan: E-01345A-21-0240 2019 Rate Case: E-01345A-19-0236 Petition for Special Action Denied; Court of Appeals in process New TOU Hours to be implemented: Sept 1 Resource Planning and Procurement: E-00000V-19-0034 IRP Acknowledged on February 10 Resource Comparison Proxy (RCP): New docket To Be Filed: May 1 Effective Sept 1 with ACC approval Rulemaking Requiring All-Source RFPs: RE-00000A-22-0029 Proposed Termination of Service Rule Modifications: RU-00000A-19-0132 Fuel and Purchased Power Audit: E-01345A-21-0056


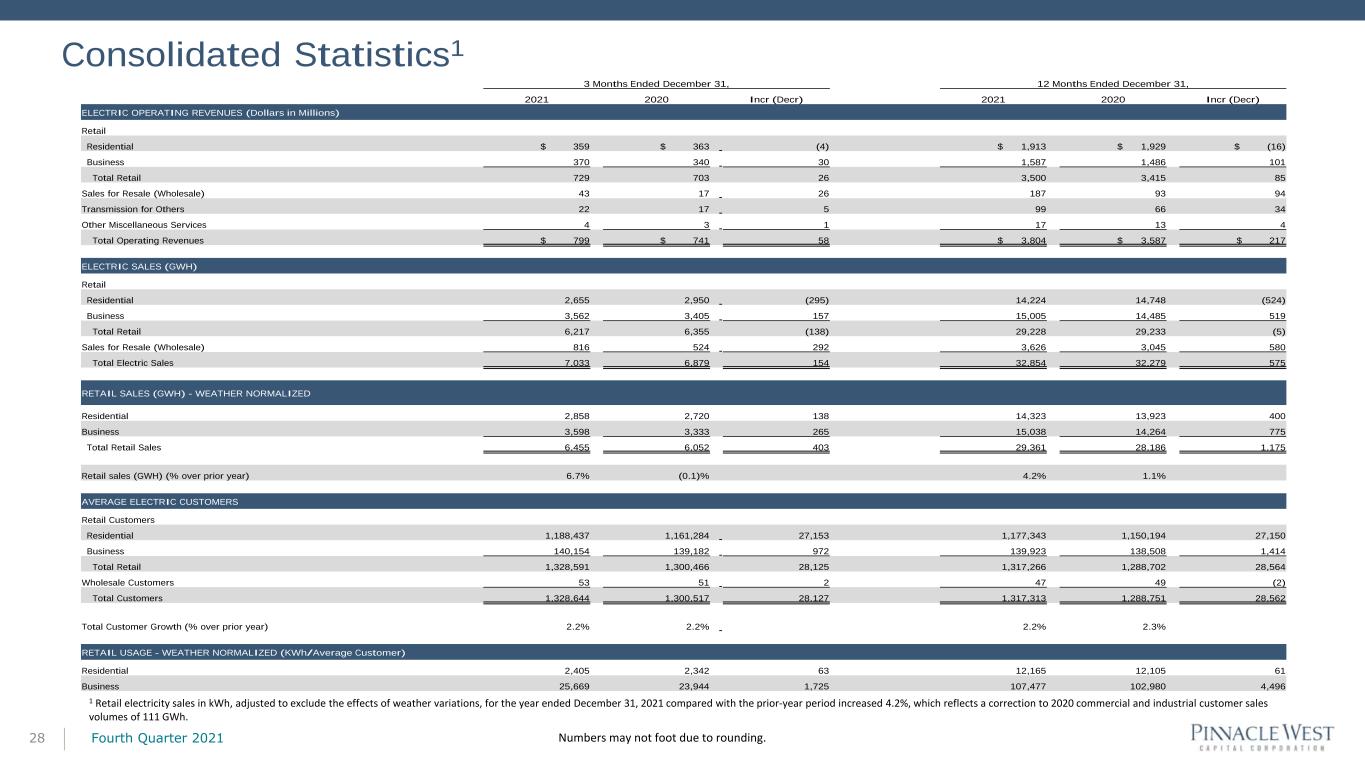
Consolidated Statistics1 Fourth Quarter 202128 3 Months Ended June 30 Numbers may not foot due to rounding. 3 Months Ended June 30 1 Retail electricity sales in kWh, adjusted to exclude the effects of weather variations, for the year ended December 31, 2021 compared with the prior-year period increased 4.2%, which reflects a correction to 2020 commercial and industrial customer sales volumes of 111 GWh. 3 Months Ended December 31, 12 Months Ended December 31, 2021 2020 Incr (Decr) 2021 2020 Incr (Decr) ELECTRIC OPERATING REVENUES (Dollars in Millions) Retail Residential $ 359 $ 363 (4) $ 1,913 $ 1,929 $ (16) Business 370 340 30 1,587 1,486 101 Total Retail 729 703 26 3,500 3,415 85 Sales for Resale (Wholesale) 43 17 26 187 93 94 Transmission for Others 22 17 5 99 66 34 Other Miscellaneous Services 4 3 1 17 13 4 Total Operating Revenues $ 799 $ 741 58 $ 3,804 $ 3,587 $ 217 ELECTRIC SALES (GWH) Retail Residential 2,655 2,950 (295) 14,224 14,748 (524) Business 3,562 3,405 157 15,005 14,485 519 Total Retail 6,217 6,355 (138) 29,228 29,233 (5) Sales for Resale (Wholesale) 816 524 292 3,626 3,045 580 Total Electric Sales 7,033 6,879 154 32,854 32,279 575 RETAIL SALES (GWH) - WEATHER NORMALIZED Residential 2,858 2,720 138 14,323 13,923 400 Business 3,598 3,333 265 15,038 14,264 775 Total Retail Sales 6,455 6,052 403 29,361 28,186 1,175 Retail sales (GWH) (% over prior year) 6.7% (0.1)% 4.2% 1.1% AVERAGE ELECTRIC CUSTOMERS Retail Customers Residential 1,188,437 1,161,284 27,153 1,177,343 1,150,194 27,150 Business 140,154 139,182 972 139,923 138,508 1,414 Total Retail 1,328,591 1,300,466 28,125 1,317,266 1,288,702 28,564 Wholesale Customers 53 51 2 47 49 (2) Total Customers 1,328,644 1,300,517 28,127 1,317,313 1,288,751 28,562 Total Customer Growth (% over prior year) 2.2% 2.2% 2.2% 2.3% RETAIL USAGE - WEATHER NORMALIZED (KWh/Average Customer) Residential 2,405 2,342 63 12,165 12,105 61 Business 25,669 23,944 1,725 107,477 102,980 4,496


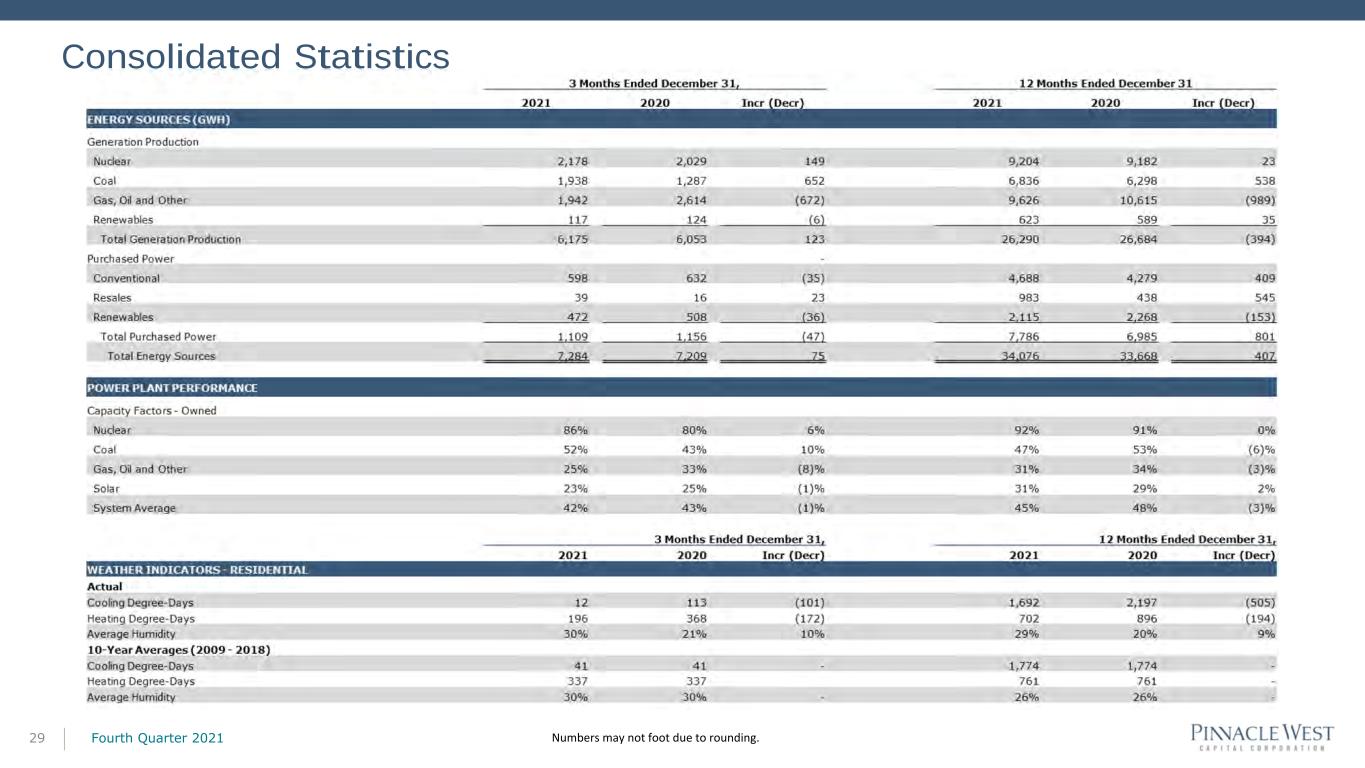
Consolidated Statistics Fourth Quarter 202129 Numbers may not foot due to rounding. 3 Months Ended June 30