
POWERING GROWTH DELIVERING VALUE Fourth Quarter and Full-Year 2019 Results February 21, 2020 Fourth Quarter 2019 | 0
FORWARD LOOKING STATEMENTS AND NON-GAAP FINANCIAL MEASURES This presentation contains forward-looking statements based on current expectations, including statements regarding our earnings guidance and financial outlook and goals. These forward-looking statements are often identified by words such as “estimate,” “predict,” “may,” “believe,” “plan,” “expect,” “require,” “intend,” “assume,” “project” and similar words. Because actual results may differ materially from expectations, we caution you not to place undue reliance on these statements. A number of factors could cause future results to differ materially from historical results, or from outcomes currently expected or sought by Pinnacle West or APS. These factors include, but are not limited to: our ability to manage capital expenditures and operations and maintenance costs while maintaining high reliability and customer service levels; variations in demand for electricity, including those due to weather seasonality, the general economy, customer and sales growth (or decline), the effects of energy conservation measures and distributed generation, and technological advancements; power plant and transmission system performance and outages; competition in retail and wholesale power markets; regulatory and judicial decisions, developments and proceedings; new legislation, ballot initiatives and regulation, including those relating to environmental requirements, regulatory policy, nuclear plant operations and potential deregulation of retail electric markets; fuel and water supply availability; our ability to achieve timely and adequate rate recovery of our costs, including returns on and of debt and equity capital investments; our ability to meet renewable energy and energy efficiency mandates and recover related costs; risks inherent in the operation of nuclear facilities, including spent fuel disposal uncertainty; current and future economic conditions in Arizona, including in real estate markets; the direct or indirect effect on our facilities or business from cybersecurity threats or intrusions, data security breaches, terrorist attack, physical attack, severe storms, droughts, or other catastrophic events, such as fires, explosions, pandemic health events or similar occurrences; the development of new technologies which may affect electric sales or delivery; the cost of debt and equity capital and the ability to access capital markets when required; environmental, economic and other concerns surrounding coal-fired generation, including regulation of greenhouse gas emissions; volatile fuel and purchased power costs; the investment performance of the assets of our nuclear decommissioning trust, pension, and other postretirement benefit plans and the resulting impact on future funding requirements; the liquidity of wholesale power markets and the use of derivative contracts in our business; potential shortfalls in insurance coverage; new accounting requirements or new interpretations of existing requirements; generation, transmission and distribution facility and system conditions and operating costs; the ability to meet the anticipated future need for additional generation and associated transmission facilities in our region; the willingness or ability of our counterparties, power plant participants and power plant land owners to meet contractual or other obligations or continue or discontinue power plant operations consistent with our corporate interests; and restrictions on dividends or other provisions in our credit agreements and ACC orders. These and other factors are discussed in Risk Factors described in Part I, Item 1A of the Pinnacle West/APS Annual Report on Form 10-K for the fiscal year ended December 31, 2019, which you should review carefully before placing any reliance on our financial statements, disclosures or earnings outlook. Neither Pinnacle West nor APS assumes any obligation to update these statements, even if our internal estimates change, except as required by law. In this presentation, references to net income and earnings per share (EPS) refer to amounts attributable to common shareholders. We present “gross margin” per diluted share of common stock. Gross margin refers to operating revenues less fuel and purchased power expenses. Gross margin is a “non-GAAP financial measure,” as defined in accordance with SEC rules. The appendix contains a reconciliation of this non-GAAP financial measure to the referenced revenue and expense line items on our Consolidated Statements of Income, which are the most directly comparable financial measures calculated and presented in accordance with generally accepted accounting principles in the United States of America (GAAP). We view gross margin as an important performance measure of the core profitability of our operations, and is used by our management in analyzing the operations of our business. We believe that investors benefit from having access to the same financial measures that management uses. We present “adjusted gross margin” and “adjusted operations and maintenance” that have been adjusted to exclude costs and offsetting operating revenues associated with renewable energy and demand side management programs. We also present “adjusted D&A,” “adjusted other taxes,” “adjusted interest, net of AFUDC,” and “adjusted other, net” that has been adjusted for the deferral impacts of the Four Corner’s Selective Catalytic Reduction (SCR) equipment and the Ocotillo Modernization Project. We also present “adjusted income taxes" that shows the impact of tax reform. Adjusted gross margin, adjusted operations and maintenance, adjusted D&A, adjusted other taxes, adjusted interest, net of AFUDC, adjusted other, net, and adjusted income taxes are “non-GAAP financial measures,” as defined in accordance with SEC rules. The appendix contains a reconciliation to show the exclusion of costs and offsetting operating revenues associated with renewable energy and demand side management programs, the deferral impacts of the Four Corners SCR equipment and the Ocotillo Modernization Project, and the impact of tax reform. We believe the information provided in the reconciliation provides investors with useful indicators of our results that are comparable among periods because they exclude the effects of unusual items that may occur on an irregular basis, such as the installation of the SCR equipment, the Ocotillo Modernization Project and tax reform impacts, and exclude the effects of programs that overstate our gross margin. Fourth Quarter 2019 | 1
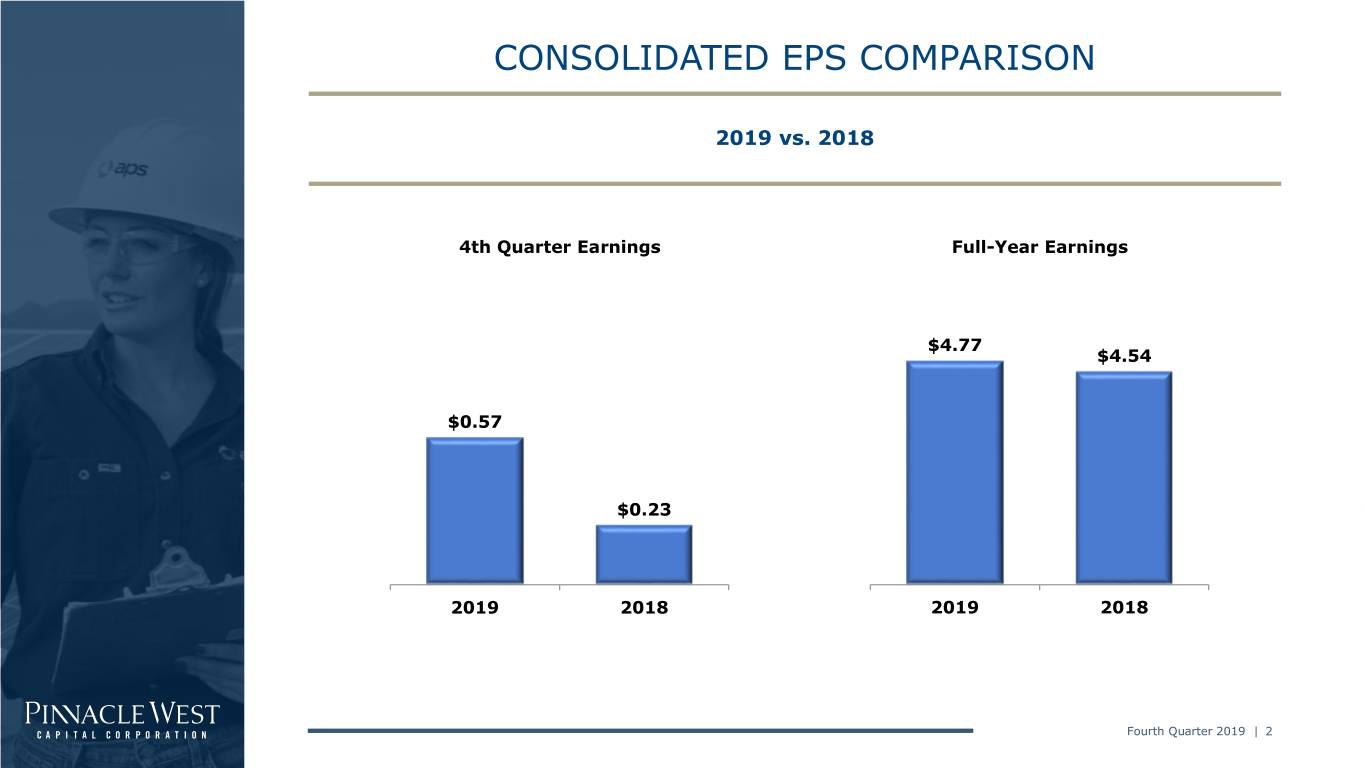
CONSOLIDATED EPS COMPARISON 2019 vs. 2018 4th Quarter Earnings Full-Year Earnings $4.77 $4.54 $0.57 $0.23 2019 2018 2019 2018 Fourth Quarter 2019 | 2
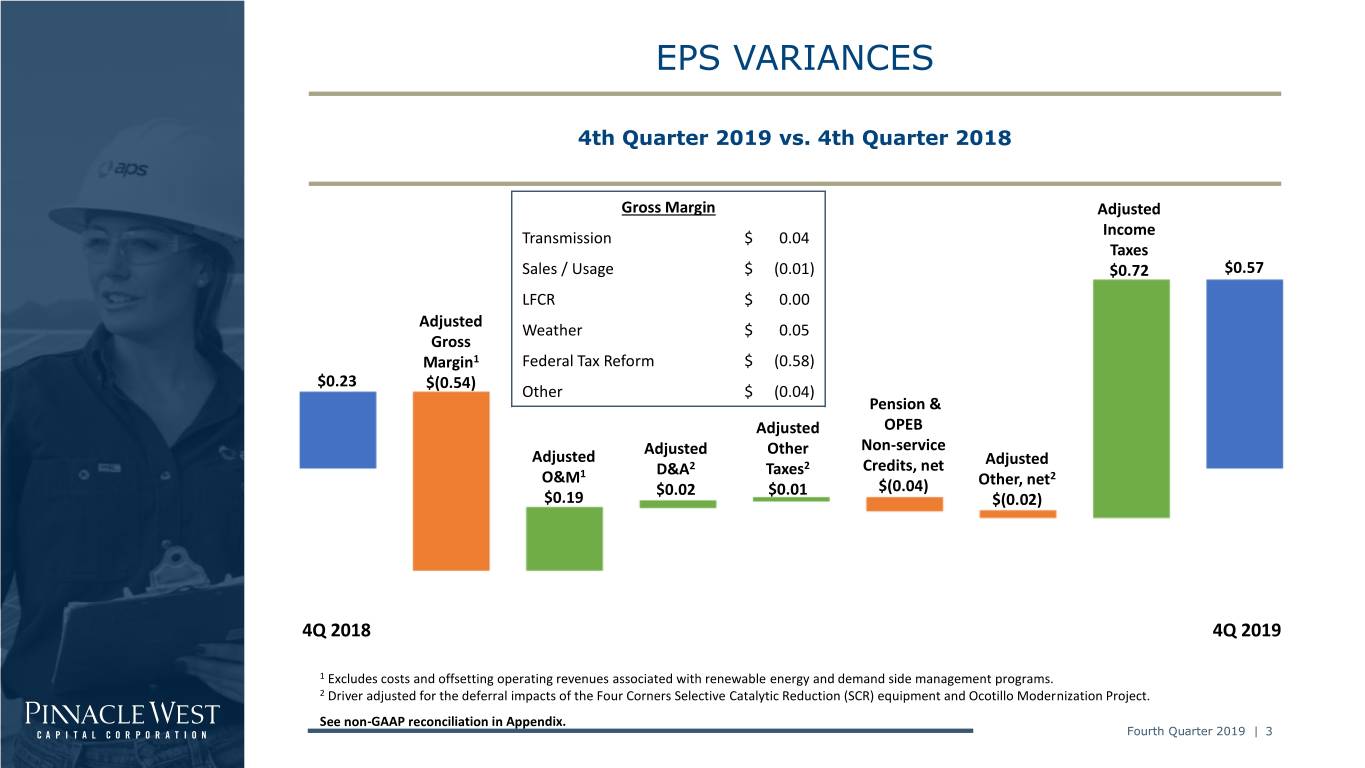
EPS VARIANCES 4th Quarter 2019 vs. 4th Quarter 2018 Gross Margin Adjusted Transmission $ 0.04 Income Taxes Sales / Usage $ (0.01) $0.72 $0.57 LFCR $ 0.00 Adjusted Weather $ 0.05 Gross Margin1 Federal Tax Reform $ (0.58) $0.23 $(0.54) Other $ (0.04) Pension & Adjusted OPEB Adjusted Other Non-service Adjusted Adjusted D&A2 Taxes2 Credits, net O&M1 Other, net2 $0.02 $0.01 $(0.04) $0.19 $(0.02) 4Q 2018 4Q 2019 1 Excludes costs and offsetting operating revenues associated with renewable energy and demand side management programs. 2 Driver adjusted for the deferral impacts of the Four Corners Selective Catalytic Reduction (SCR) equipment and Ocotillo Modernization Project. See non-GAAP reconciliation in Appendix. Fourth Quarter 2019 | 3
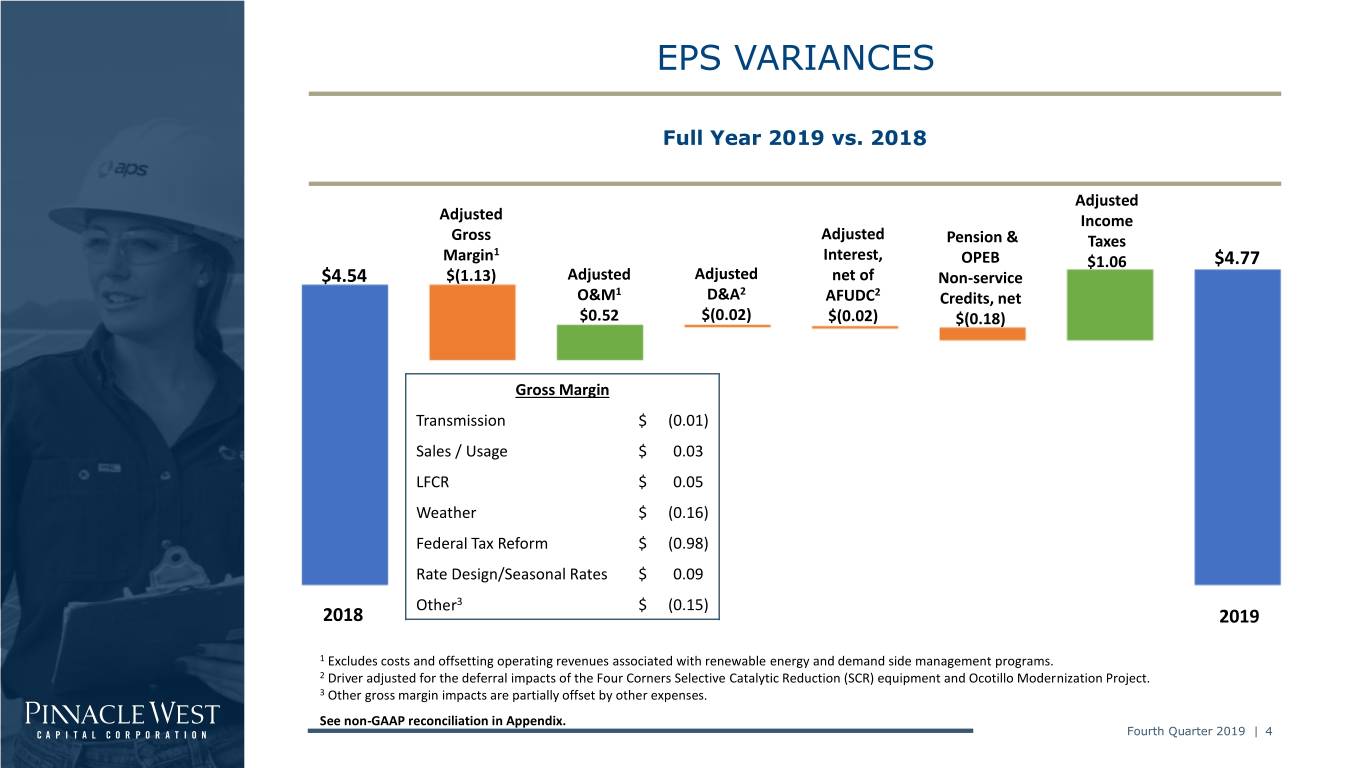
EPS VARIANCES Full Year 2019 vs. 2018 Adjusted Adjusted Income Gross Adjusted Pension & Taxes 1 Margin Interest, OPEB $1.06 $4.77 $4.54 $(1.13) Adjusted Adjusted net of Non-service O&M1 D&A2 AFUDC2 Credits, net $0.52 $(0.02) $(0.02) $(0.18) Gross Margin Transmission $ (0.01) Sales / Usage $ 0.03 LFCR $ 0.05 Weather $ (0.16) Federal Tax Reform $ (0.98) Rate Design/Seasonal Rates $ 0.09 Other3 $ (0.15) 2018 2019 1 Excludes costs and offsetting operating revenues associated with renewable energy and demand side management programs. 2 Driver adjusted for the deferral impacts of the Four Corners Selective Catalytic Reduction (SCR) equipment and Ocotillo Modernization Project. 3 Other gross margin impacts are partially offset by other expenses. See non-GAAP reconciliation in Appendix. Fourth Quarter 2019 | 4
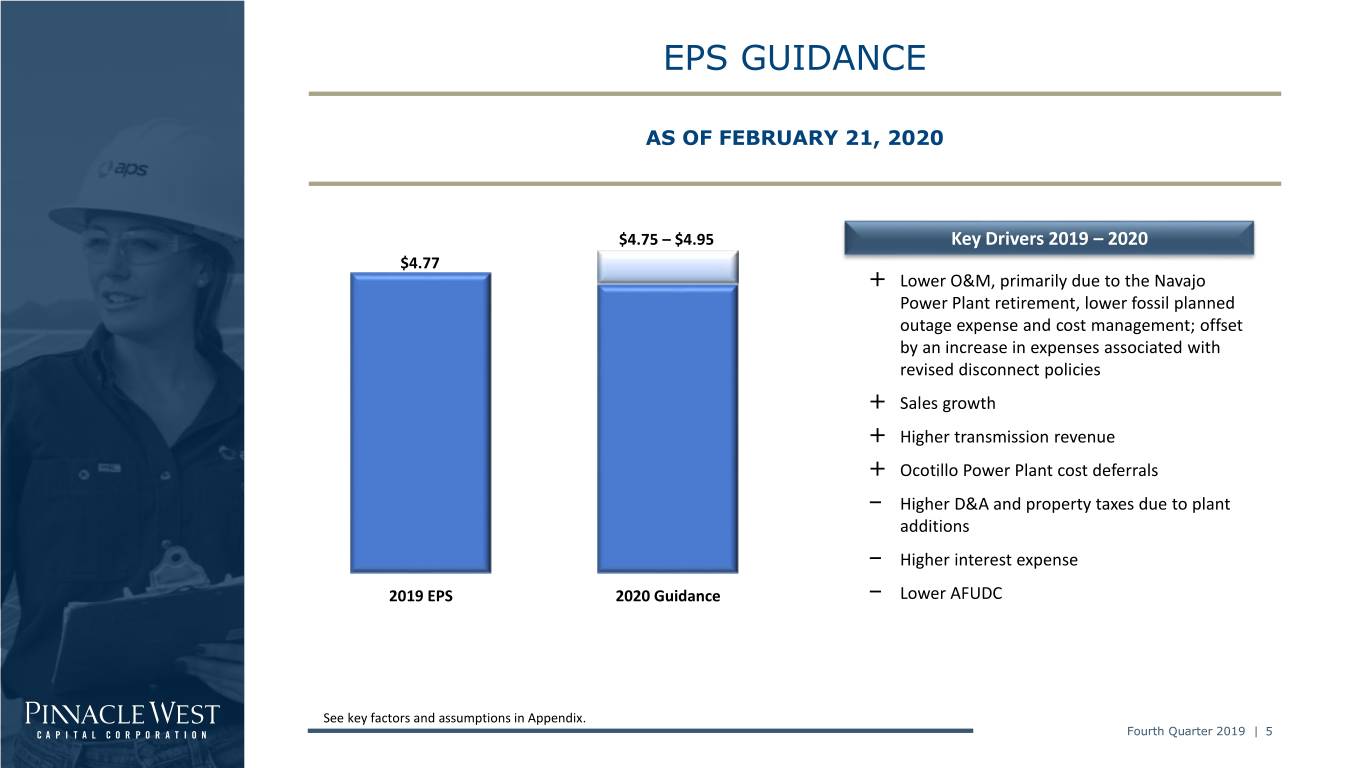
EPS GUIDANCE AS OF FEBRUARY 21, 2020 $4.75 – $4.95 Key Drivers 2019 – 2020 $4.77 + Lower O&M, primarily due to the Navajo Power Plant retirement, lower fossil planned outage expense and cost management; offset by an increase in expenses associated with revised disconnect policies + Sales growth + Higher transmission revenue + Ocotillo Power Plant cost deferrals – Higher D&A and property taxes due to plant additions – Higher interest expense 2019 EPS 2020 Guidance – Lower AFUDC See key factors and assumptions in Appendix. Fourth Quarter 2019 | 5
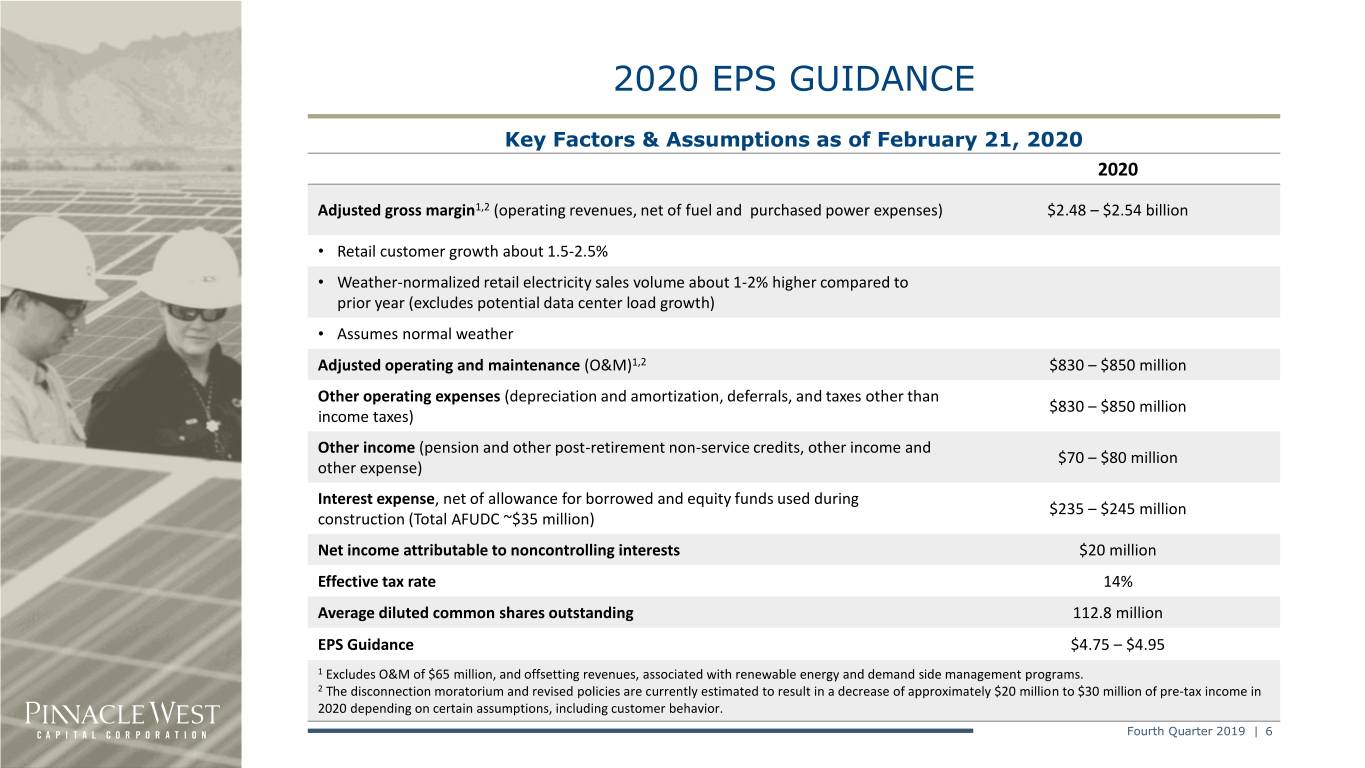
2020 EPS GUIDANCE Key Factors & Assumptions as of February 21, 2020 2020 Adjusted gross margin1,2 (operating revenues, net of fuel and purchased power expenses) $2.48 – $2.54 billion • Retail customer growth about 1.5-2.5% • Weather-normalized retail electricity sales volume about 1-2% higher compared to prior year (excludes potential data center load growth) • Assumes normal weather Adjusted operating and maintenance (O&M)1,2 $830 – $850 million Other operating expenses (depreciation and amortization, deferrals, and taxes other than $830 – $850 million income taxes) Other income (pension and other post-retirement non-service credits, other income and $70 – $80 million other expense) Interest expense, net of allowance for borrowed and equity funds used during $235 – $245 million construction (Total AFUDC ~$35 million) Net income attributable to noncontrolling interests $20 million Effective tax rate 14% Average diluted common shares outstanding 112.8 million EPS Guidance $4.75 – $4.95 1 Excludes O&M of $65 million, and offsetting revenues, associated with renewable energy and demand side management programs. 2 The disconnection moratorium and revised policies are currently estimated to result in a decrease of approximately $20 million to $30 million of pre-tax income in 2020 depending on certain assumptions, including customer behavior. Fourth Quarter 2019 | 6
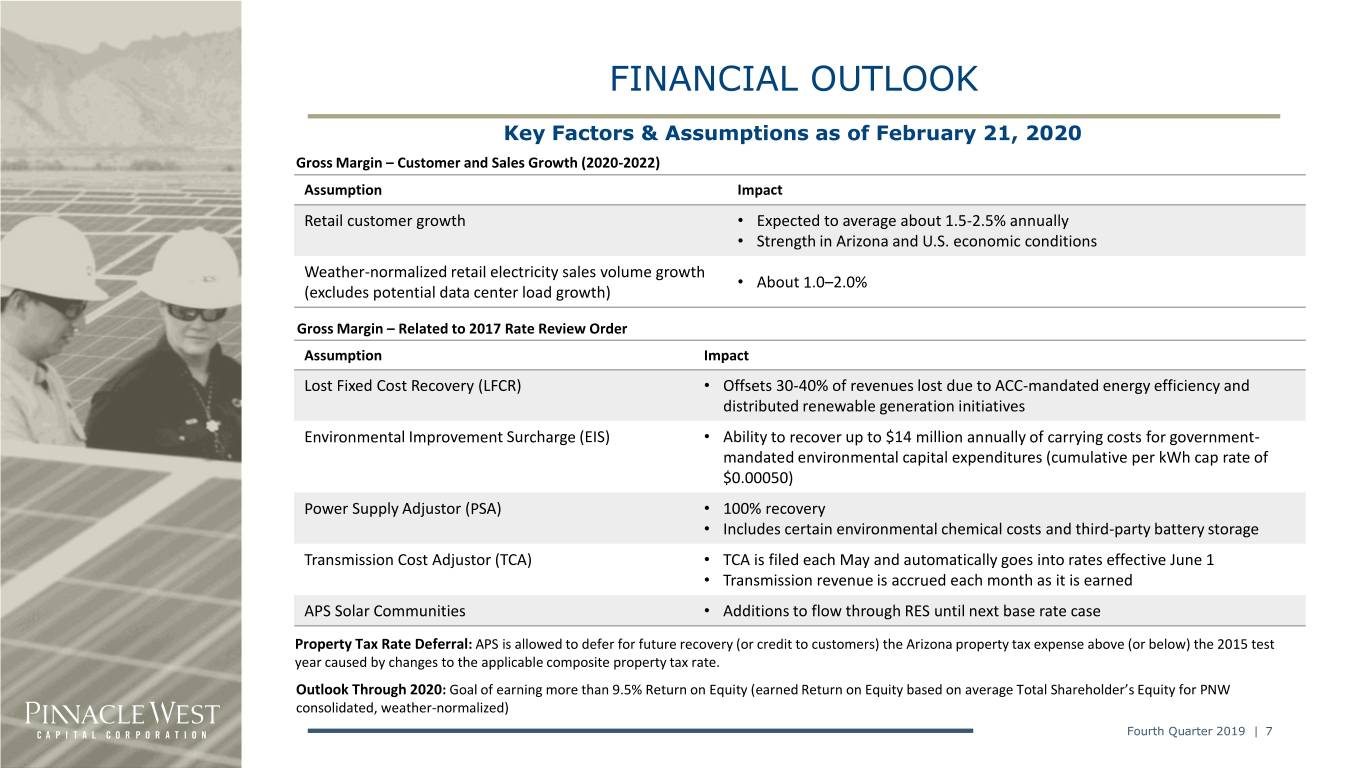
FINANCIAL OUTLOOK Key Factors & Assumptions as of February 21, 2020 Gross Margin – Customer and Sales Growth (2020-2022) Assumption Impact Retail customer growth • Expected to average about 1.5-2.5% annually • Strength in Arizona and U.S. economic conditions Weather-normalized retail electricity sales volume growth • About 1.0–2.0% (excludes potential data center load growth) Gross Margin – Related to 2017 Rate Review Order Assumption Impact Lost Fixed Cost Recovery (LFCR) • Offsets 30-40% of revenues lost due to ACC-mandated energy efficiency and distributed renewable generation initiatives Environmental Improvement Surcharge (EIS) • Ability to recover up to $14 million annually of carrying costs for government- mandated environmental capital expenditures (cumulative per kWh cap rate of $0.00050) Power Supply Adjustor (PSA) • 100% recovery • Includes certain environmental chemical costs and third-party battery storage Transmission Cost Adjustor (TCA) • TCA is filed each May and automatically goes into rates effective June 1 • Transmission revenue is accrued each month as it is earned APS Solar Communities • Additions to flow through RES until next base rate case Property Tax Rate Deferral: APS is allowed to defer for future recovery (or credit to customers) the Arizona property tax expense above (or below) the 2015 test year caused by changes to the applicable composite property tax rate. Outlook Through 2020: Goal of earning more than 9.5% Return on Equity (earned Return on Equity based on average Total Shareholder’s Equity for PNW consolidated, weather-normalized) Fourth Quarter 2019 | 7
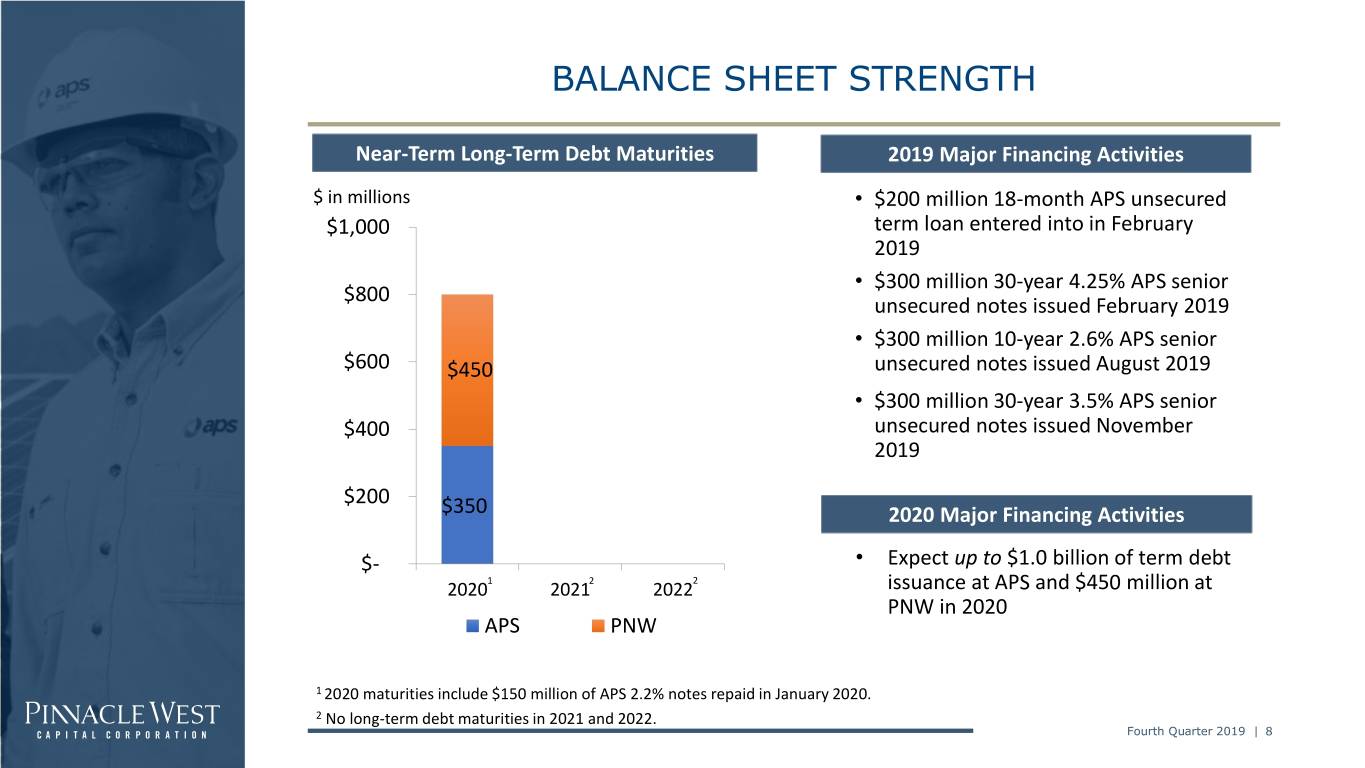
BALANCE SHEET STRENGTH Near-Term Long-Term Debt Maturities 2019 Major Financing Activities $ in millions • $200 million 18-month APS unsecured $1,000 term loan entered into in February 2019 • $300 million 30-year 4.25% APS senior $800 unsecured notes issued February 2019 • $300 million 10-year 2.6% APS senior $600 $450 unsecured notes issued August 2019 • $300 million 30-year 3.5% APS senior $400 unsecured notes issued November 2019 $200 $350 2020 Major Financing Activities $- • Expect up to $1.0 billion of term debt 20201 20212 20222 issuance at APS and $450 million at PNW in 2020 APS PNW 1 2020 maturities include $150 million of APS 2.2% notes repaid in January 2020. 2 No long-term debt maturities in 2021 and 2022. Fourth Quarter 2019 | 8
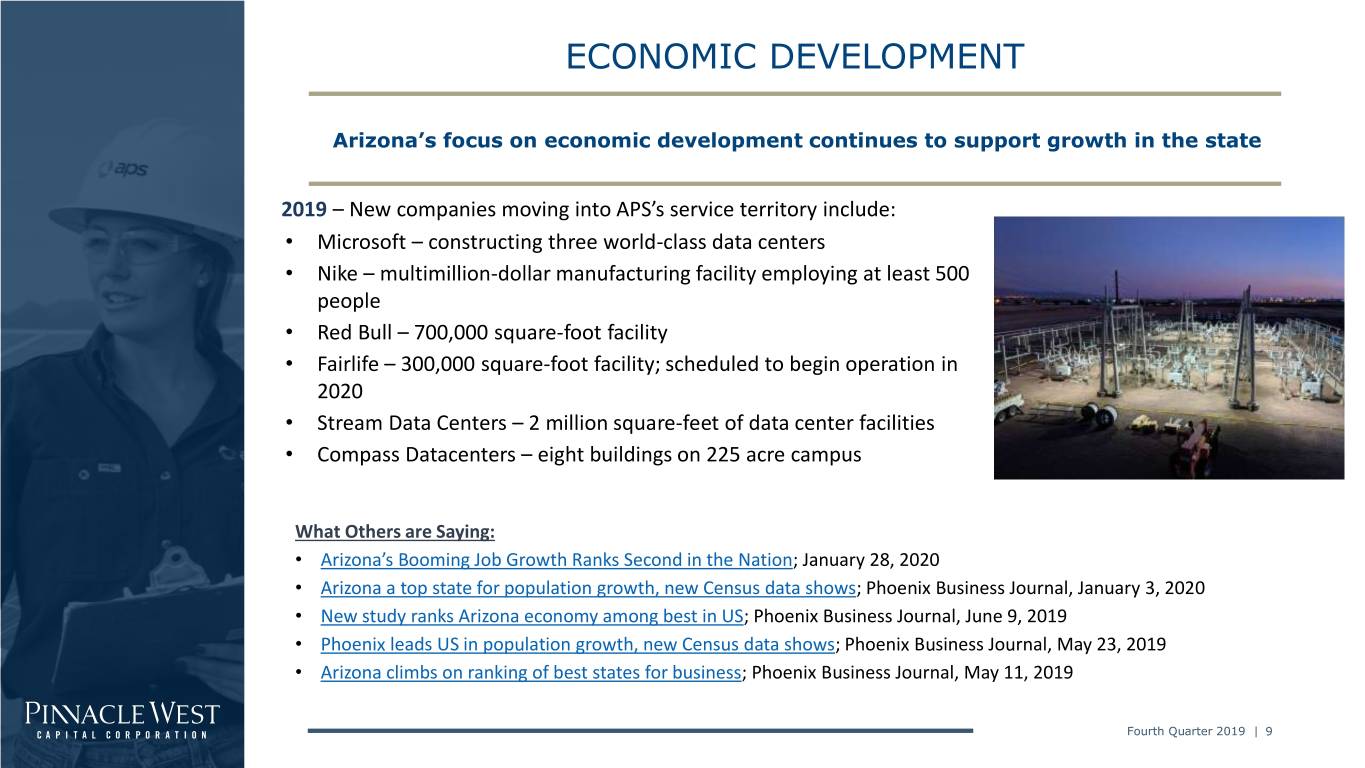
ECONOMIC DEVELOPMENT Arizona’s focus on economic development continues to support growth in the state 2019 – New companies moving into APS’s service territory include: • Microsoft – constructing three world-class data centers • Nike – multimillion-dollar manufacturing facility employing at least 500 people • Red Bull – 700,000 square-foot facility • Fairlife – 300,000 square-foot facility; scheduled to begin operation in 2020 • Stream Data Centers – 2 million square-feet of data center facilities • Compass Datacenters – eight buildings on 225 acre campus What Others are Saying: • Arizona’s Booming Job Growth Ranks Second in the Nation; January 28, 2020 • Arizona a top state for population growth, new Census data shows; Phoenix Business Journal, January 3, 2020 • New study ranks Arizona economy among best in US; Phoenix Business Journal, June 9, 2019 • Phoenix leads US in population growth, new Census data shows; Phoenix Business Journal, May 23, 2019 • Arizona climbs on ranking of best states for business; Phoenix Business Journal, May 11, 2019 Fourth Quarter 2019 | 9
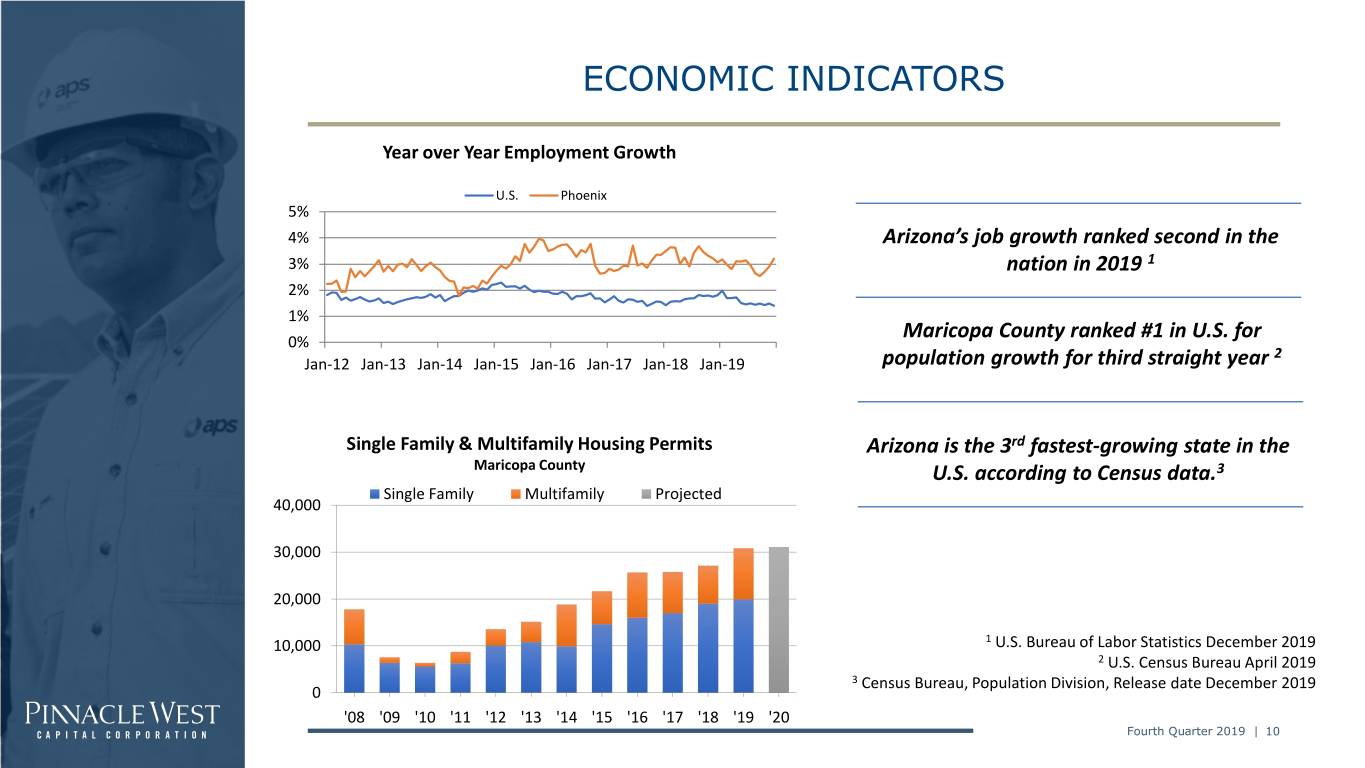
ECONOMIC INDICATORS Year over Year Employment Growth U.S. Phoenix 5% 4% Arizona’s job growth ranked second in the 3% nation in 2019 1 2% 1% Maricopa County ranked #1 in U.S. for 0% 2 Jan-12 Jan-13 Jan-14 Jan-15 Jan-16 Jan-17 Jan-18 Jan-19 population growth for third straight year Single Family & Multifamily Housing Permits Arizona is the 3rd fastest-growing state in the Maricopa County U.S. according to Census data.3 Single Family Multifamily Projected 40,000 30,000 20,000 10,000 1 U.S. Bureau of Labor Statistics December 2019 2 U.S. Census Bureau April 2019 3 Census Bureau, Population Division, Release date December 2019 0 '08 '09 '10 '11 '12 '13 '14 '15 '16 '17 '18 '19 '20 Fourth Quarter 2019 | 10
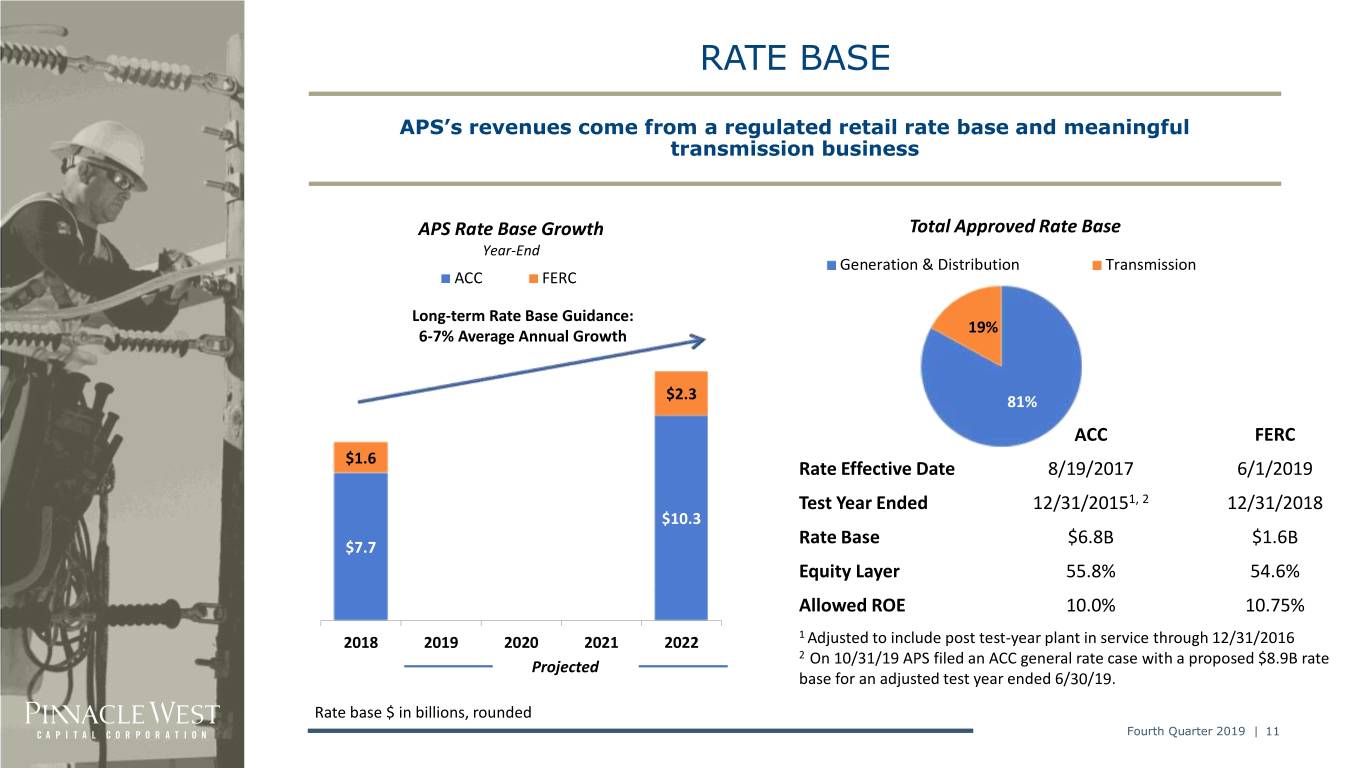
RATE BASE APS’s revenues come from a regulated retail rate base and meaningful transmission business APS Rate Base Growth Total Approved Rate Base Year-End Generation & Distribution Transmission ACC FERC Long-term Rate Base Guidance: 19% 6-7% Average Annual Growth $2.3 81% ACC FERC $1.6 Rate Effective Date 8/19/2017 6/1/2019 Test Year Ended 12/31/20151, 2 12/31/2018 $10.3 Rate Base $6.8B $1.6B $7.7 Equity Layer 55.8% 54.6% Allowed ROE 10.0% 10.75% 2018 2019 2020 2021 2022 1 Adjusted to include post test-year plant in service through 12/31/2016 2 On 10/31/19 APS filed an ACC general rate case with a proposed $8.9B rate Projected base for an adjusted test year ended 6/30/19. Rate base $ in billions, rounded Fourth Quarter 2019 | 11
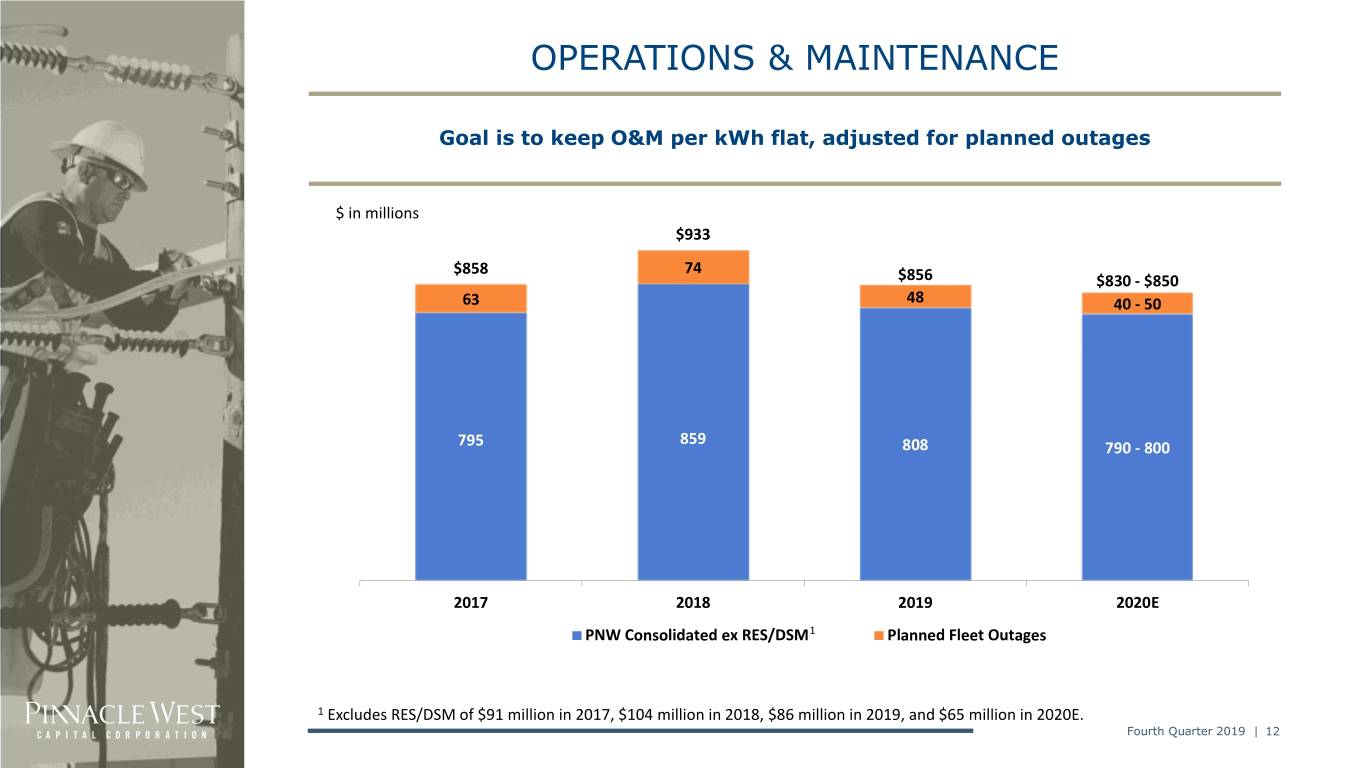
OPERATIONS & MAINTENANCE Goal is to keep O&M per kWh flat, adjusted for planned outages $ in millions $933 $858 74 $856 $830 - $850 63 48 40 - 50 859 795 808 790 - 800 2017 2018 2019 2020E PNW Consolidated ex RES/DSM1 Planned Fleet Outages 1 Excludes RES/DSM of $91 million in 2017, $104 million in 2018, $86 million in 2019, and $65 million in 2020E. Fourth Quarter 2019 | 12
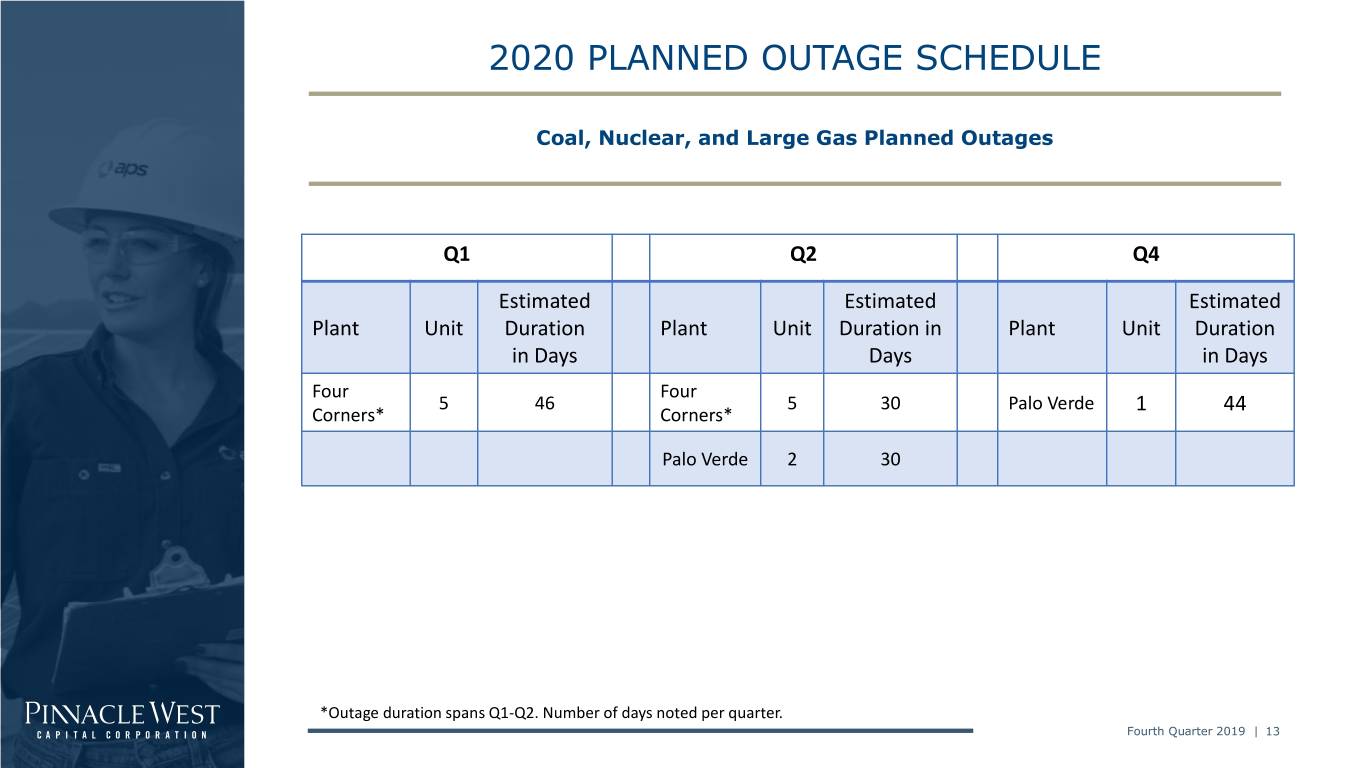
2020 PLANNED OUTAGE SCHEDULE Coal, Nuclear, and Large Gas Planned Outages Q1 Q2 Q4 Estimated Estimated Estimated Plant Unit Duration Plant Unit Duration in Plant Unit Duration in Days Days in Days Four Four 5 46 5 30 Palo Verde 1 44 Corners* Corners* Palo Verde 2 30 *Outage duration spans Q1-Q2. Number of days noted per quarter. Fourth Quarter 2019 | 13
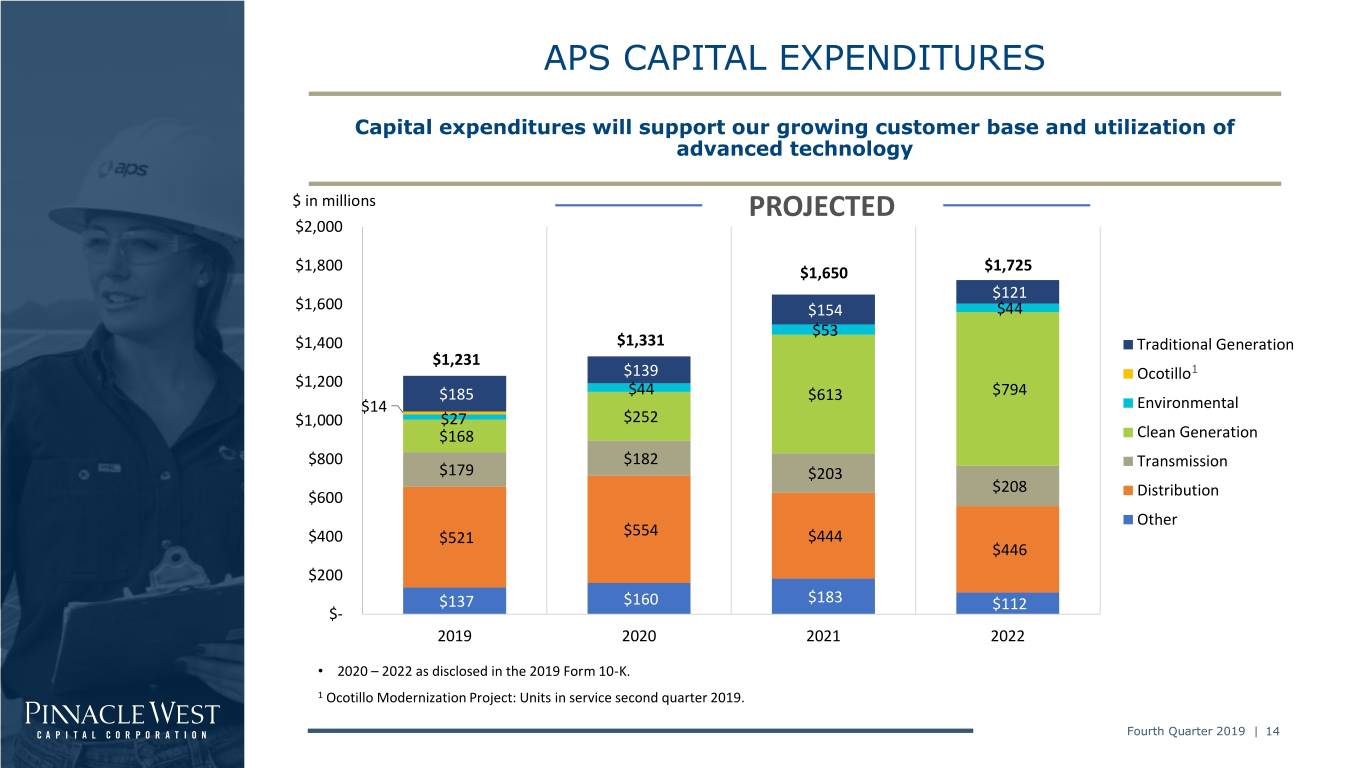
APS CAPITAL EXPENDITURES Capital expenditures will support our growing customer base and utilization of advanced technology $ in millions PROJECTED $2,000 $1,800 $1,650 $1,725 $121 $1,600 $154 $44 $53 $1,400 $1,331 Traditional Generation $1,231 $139 1 $1,200 Ocotillo $185 $44 $613 $794 $14 Environmental $1,000 $27 $252 $168 Clean Generation $800 $182 Transmission $179 $203 $208 $600 Distribution Other $400 $521 $554 $444 $446 $200 $137 $160 $183 $112 $- 2019 2020 2021 2022 • 2020 – 2022 as disclosed in the 2019 Form 10-K. 1 Ocotillo Modernization Project: Units in service second quarter 2019. Fourth Quarter 2019 | 14
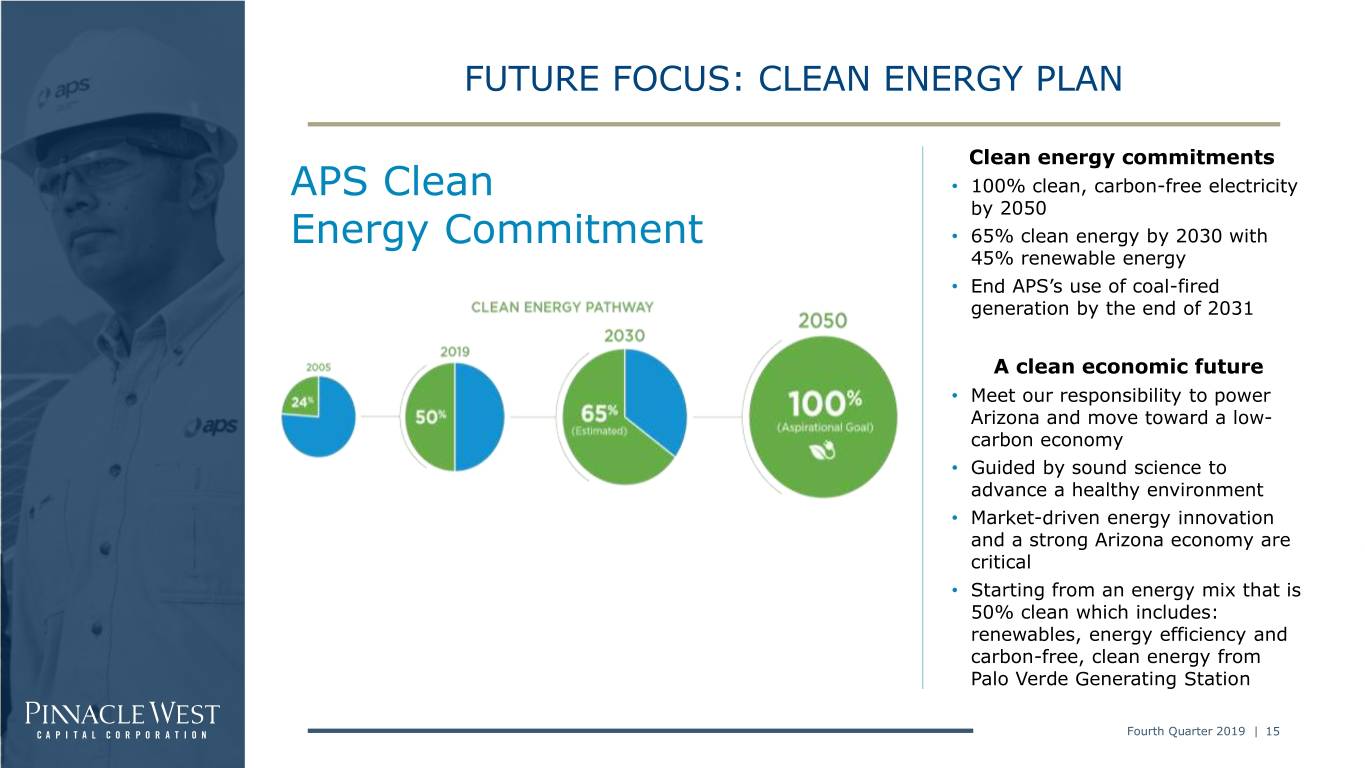
FUTURE FOCUS: CLEAN ENERGY PLAN Clean energy commitments APS Clean • 100% clean, carbon-free electricity by 2050 Energy Commitment • 65% clean energy by 2030 with 45% renewable energy • End APS’s use of coal-fired generation by the end of 2031 A clean economic future • Meet our responsibility to power Arizona and move toward a low- carbon economy • Guided by sound science to advance a healthy environment • Market-driven energy innovation and a strong Arizona economy are critical • Starting from an energy mix that is 50% clean which includes: renewables, energy efficiency and carbon-free, clean energy from Palo Verde Generating Station Fourth Quarter 2019 | 15
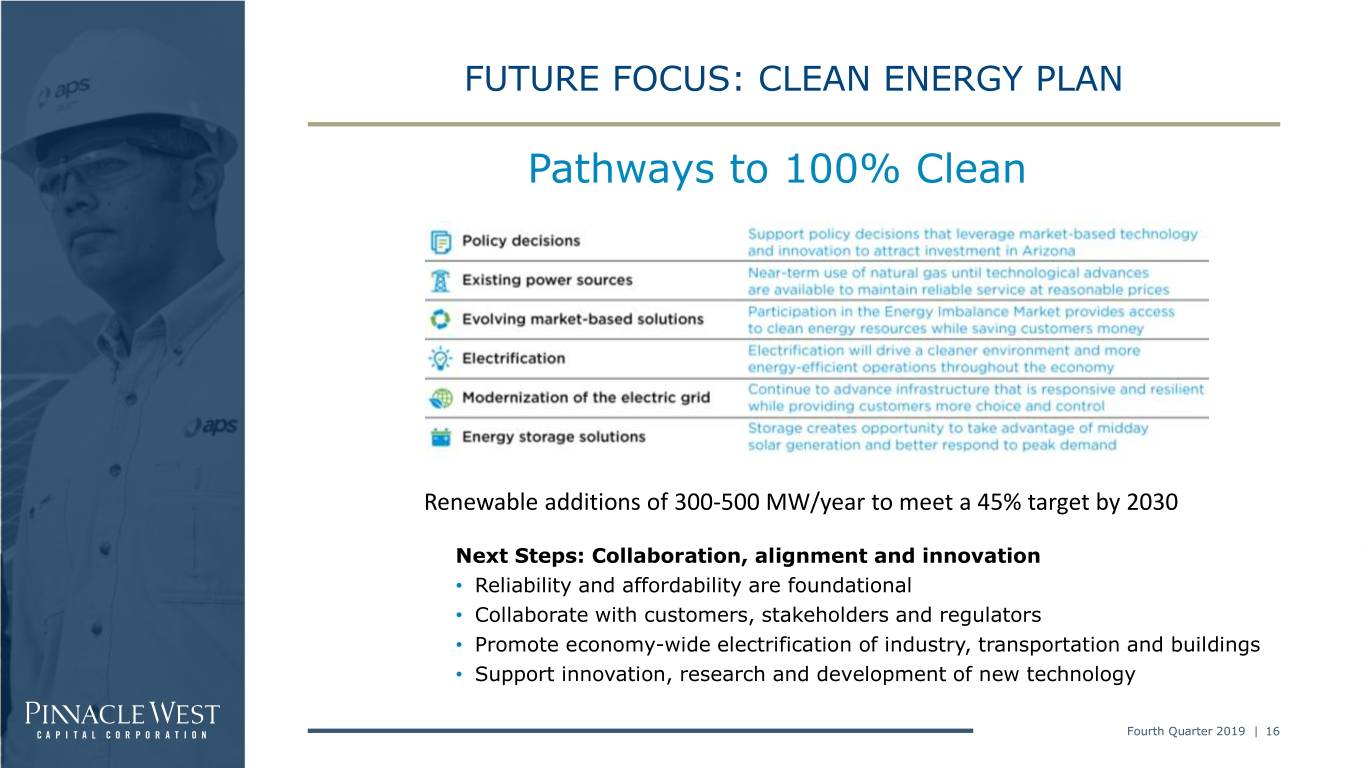
FUTURE FOCUS: CLEAN ENERGY PLAN Pathways to 100% Clean Renewable additions of 300-500 MW/year to meet a 45% target by 2030 Next Steps: Collaboration, alignment and innovation • Reliability and affordability are foundational • Collaborate with customers, stakeholders and regulators • Promote economy-wide electrification of industry, transportation and buildings • Support innovation, research and development of new technology Fourth Quarter 2019 | 16
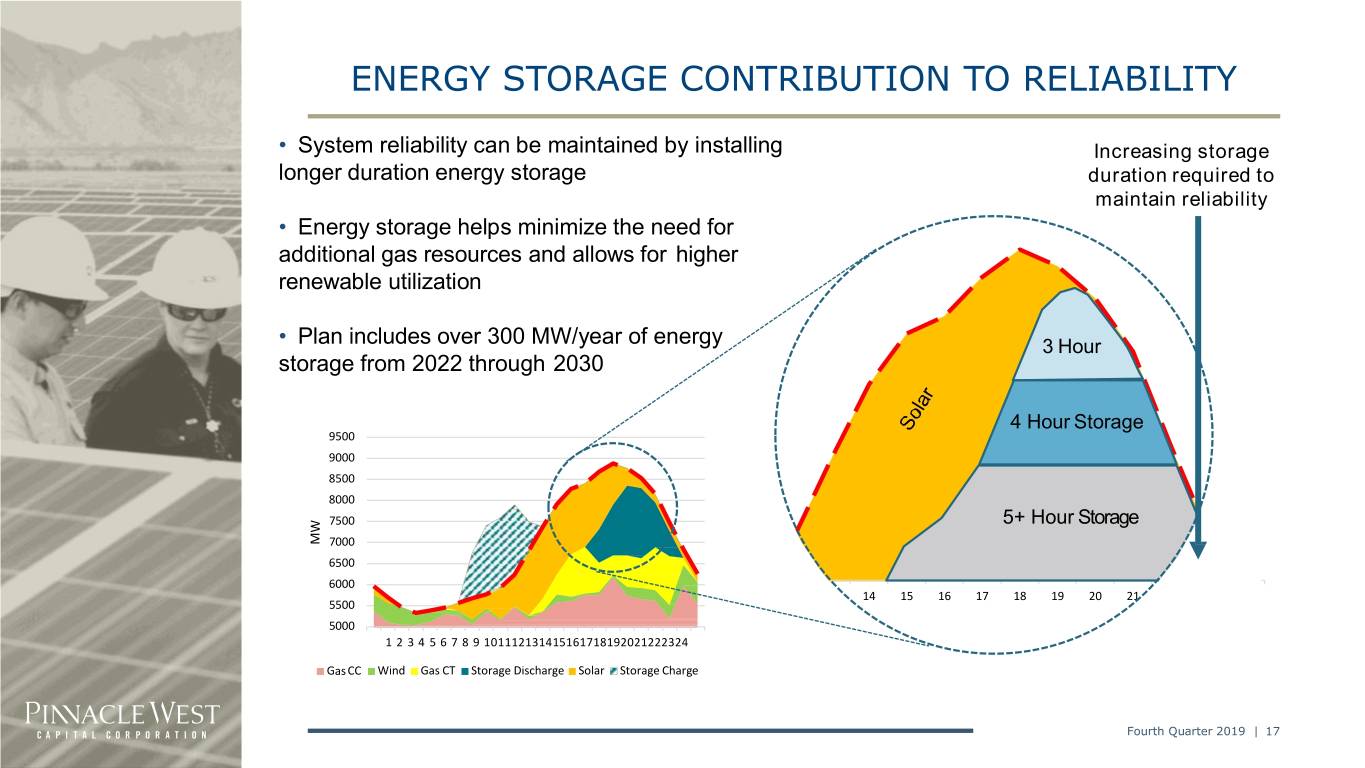
ENERGY STORAGE CONTRIBUTION TO RELIABILITY • System reliability can be maintained by installing Increasing storage longer duration energy storage duration required to maintain reliability • Energy storage helps minimize the need for additional gas resources and allows for higher renewable utilization • Plan includes over 300 MW/year of energy 3 Hour storage from 2022 through 2030 4 Hour Storage 9500 9000 8500 8000 7500 5+ Hour Storage MW 7000 6500 6000 12 13 14 15 16 17 18 19 20 21 22 23 24 5500 5000 1 2 3 4 5 6 7 8 9 101112131415161718192021222324 GasCC Wind Gas CT Storage Discharge Solar Storage Charge Fourth Quarter 2019 | 17
APPENDIX Fourth Quarter 2019 | 18
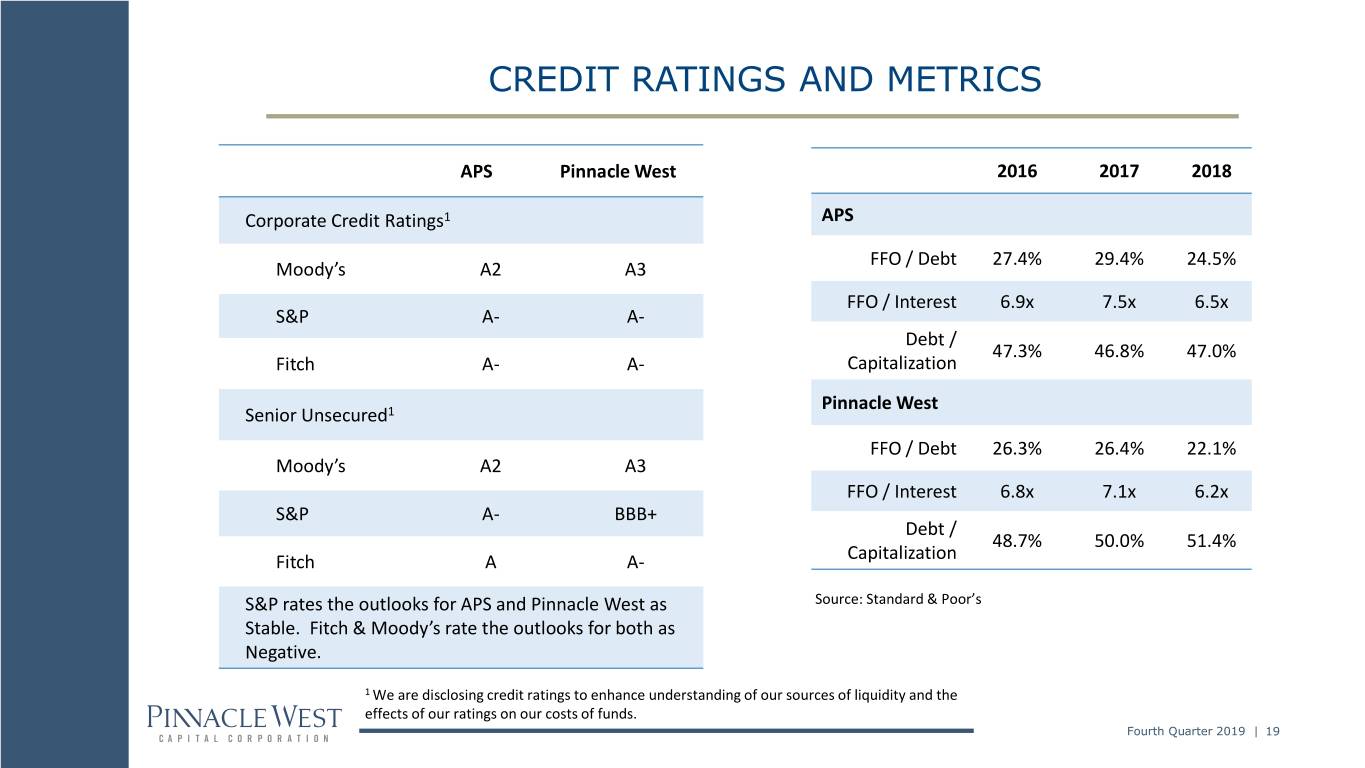
CREDIT RATINGS AND METRICS APS Pinnacle West 2016 2017 2018 Corporate Credit Ratings1 APS FFO / Debt 27.4% 29.4% 24.5% Moody’s A2 A3 FFO / Interest 6.9x 7.5x 6.5x S&P A- A- Debt / 47.3% 46.8% 47.0% Fitch A- A- Capitalization Pinnacle West Senior Unsecured1 FFO / Debt 26.3% 26.4% 22.1% Moody’s A2 A3 FFO / Interest 6.8x 7.1x 6.2x S&P A- BBB+ Debt / 48.7% 50.0% 51.4% Fitch A A- Capitalization S&P rates the outlooks for APS and Pinnacle West as Source: Standard & Poor’s Stable. Fitch & Moody’s rate the outlooks for both as Negative. 1 We are disclosing credit ratings to enhance understanding of our sources of liquidity and the effects of our ratings on our costs of funds. Fourth Quarter 2019 | 19
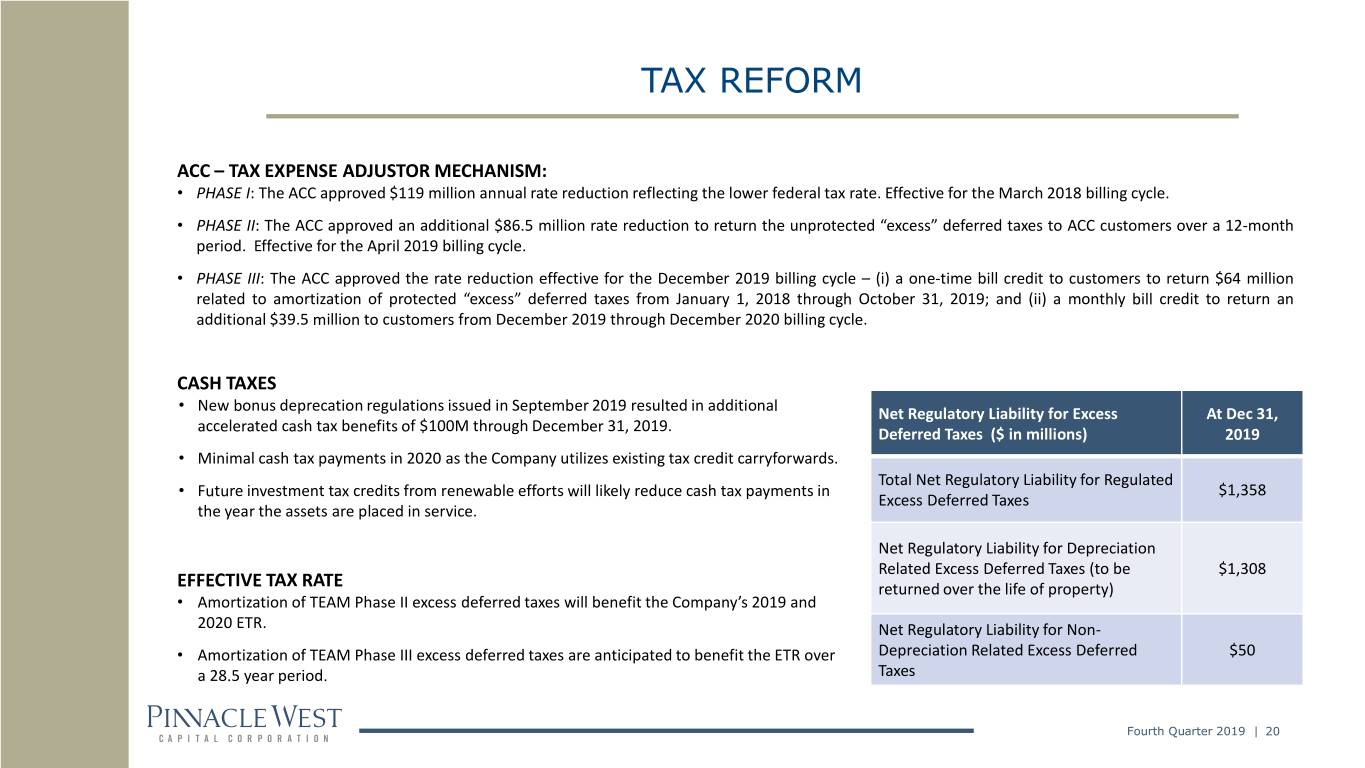
TAX REFORM ACC – TAX EXPENSE ADJUSTOR MECHANISM: • PHASE I: The ACC approved $119 million annual rate reduction reflecting the lower federal tax rate. Effective for the March 2018 billing cycle. • PHASE II: The ACC approved an additional $86.5 million rate reduction to return the unprotected “excess” deferred taxes to ACC customers over a 12-month period. Effective for the April 2019 billing cycle. • PHASE III: The ACC approved the rate reduction effective for the December 2019 billing cycle – (i) a one-time bill credit to customers to return $64 million related to amortization of protected “excess” deferred taxes from January 1, 2018 through October 31, 2019; and (ii) a monthly bill credit to return an additional $39.5 million to customers from December 2019 through December 2020 billing cycle. CASH TAXES • New bonus deprecation regulations issued in September 2019 resulted in additional Net Regulatory Liability for Excess At Dec 31, accelerated cash tax benefits of $100M through December 31, 2019. Deferred Taxes ($ in millions) 2019 • Minimal cash tax payments in 2020 as the Company utilizes existing tax credit carryforwards. Total Net Regulatory Liability for Regulated • Future investment tax credits from renewable efforts will likely reduce cash tax payments in $1,358 Excess Deferred Taxes the year the assets are placed in service. Net Regulatory Liability for Depreciation Related Excess Deferred Taxes (to be $1,308 EFFECTIVE TAX RATE returned over the life of property) • Amortization of TEAM Phase II excess deferred taxes will benefit the Company’s 2019 and 2020 ETR. Net Regulatory Liability for Non- • Amortization of TEAM Phase III excess deferred taxes are anticipated to benefit the ETR over Depreciation Related Excess Deferred $50 a 28.5 year period. Taxes Fourth Quarter 2019 | 20
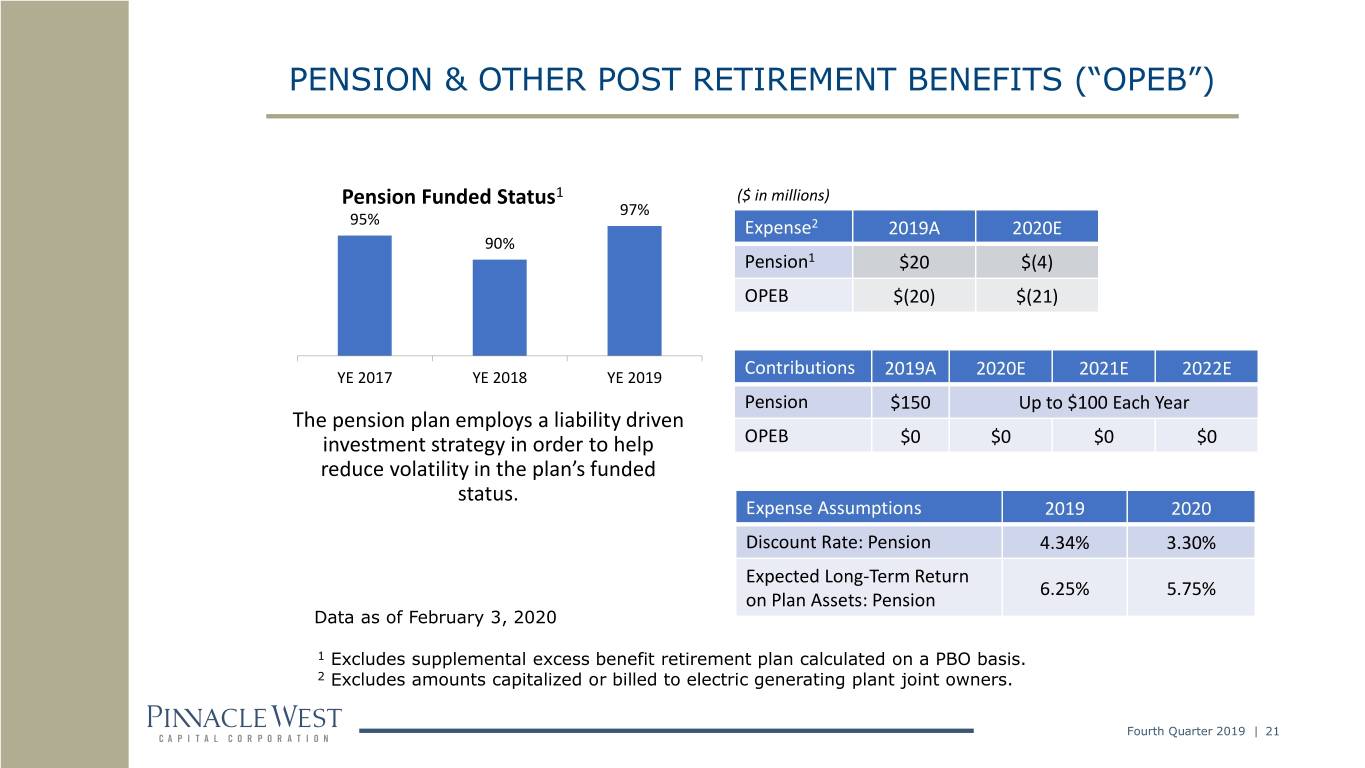
PENSION & OTHER POST RETIREMENT BENEFITS (“OPEB”) Pension Funded Status1 ($ in millions) 97% 95% Expense2 2019A 2020E 90% Pension1 $20 $(4) OPEB $(20) $(21) YE 2017 YE 2018 YE 2019 Contributions 2019A 2020E 2021E 2022E Pension $150 Up to $100 Each Year The pension plan employs a liability driven investment strategy in order to help OPEB $0 $0 $0 $0 reduce volatility in the plan’s funded status. Expense Assumptions 2019 2020 Discount Rate: Pension 4.34% 3.30% Expected Long-Term Return 6.25% 5.75% on Plan Assets: Pension Data as of February 3, 2020 1 Excludes supplemental excess benefit retirement plan calculated on a PBO basis. 2 Excludes amounts capitalized or billed to electric generating plant joint owners. Fourth Quarter 2019 | 21
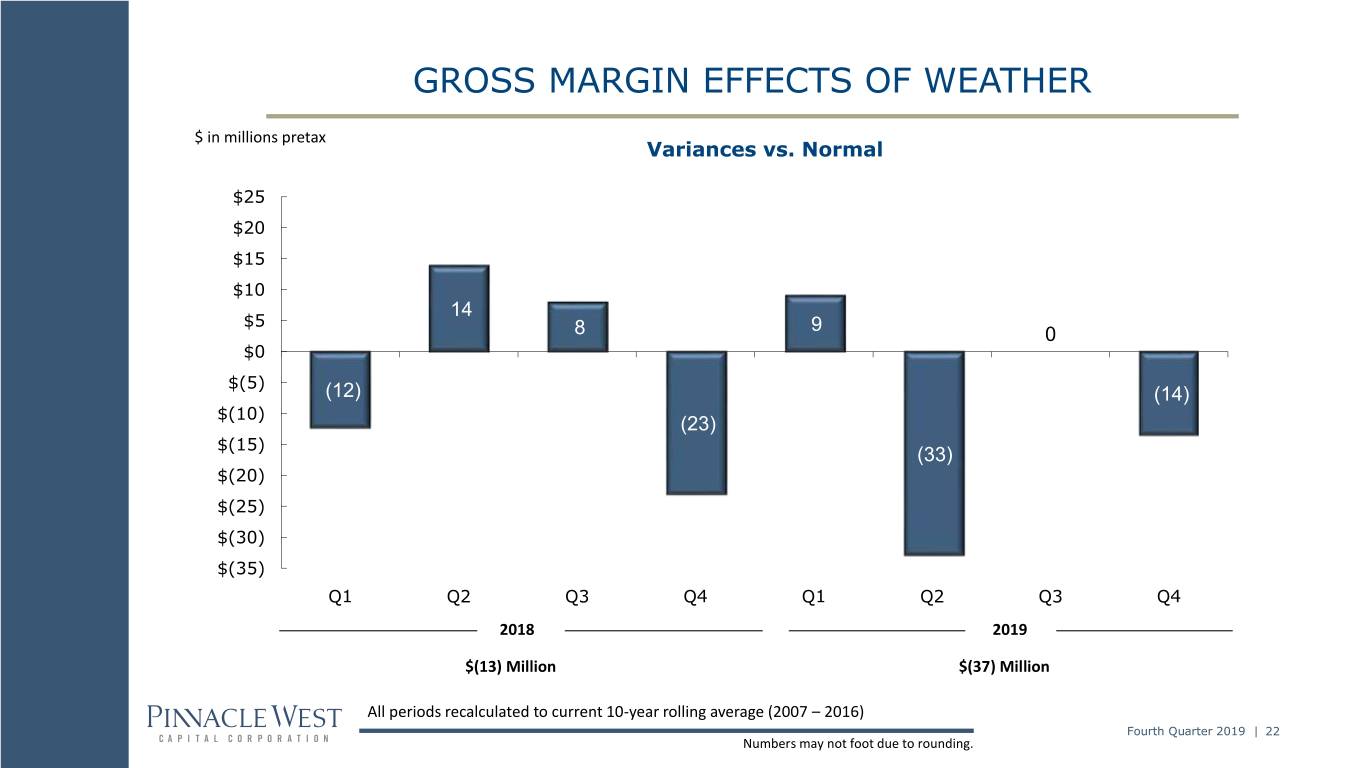
GROSS MARGIN EFFECTS OF WEATHER $ in millions pretax Variances vs. Normal $25 $20 $15 $10 14 $5 9 8 0 $0 $(5) (12) (14) $(10) (23) $(15) (33) $(20) $(25) $(30) $(35) Q1 Q2 Q3 Q4 Q1 Q2 Q3 Q4 2018 2019 $(13) Million $(37) Million All periods recalculated to current 10-year rolling average (2007 – 2016) Fourth Quarter 2019 | 22 Numbers may not foot due to rounding.
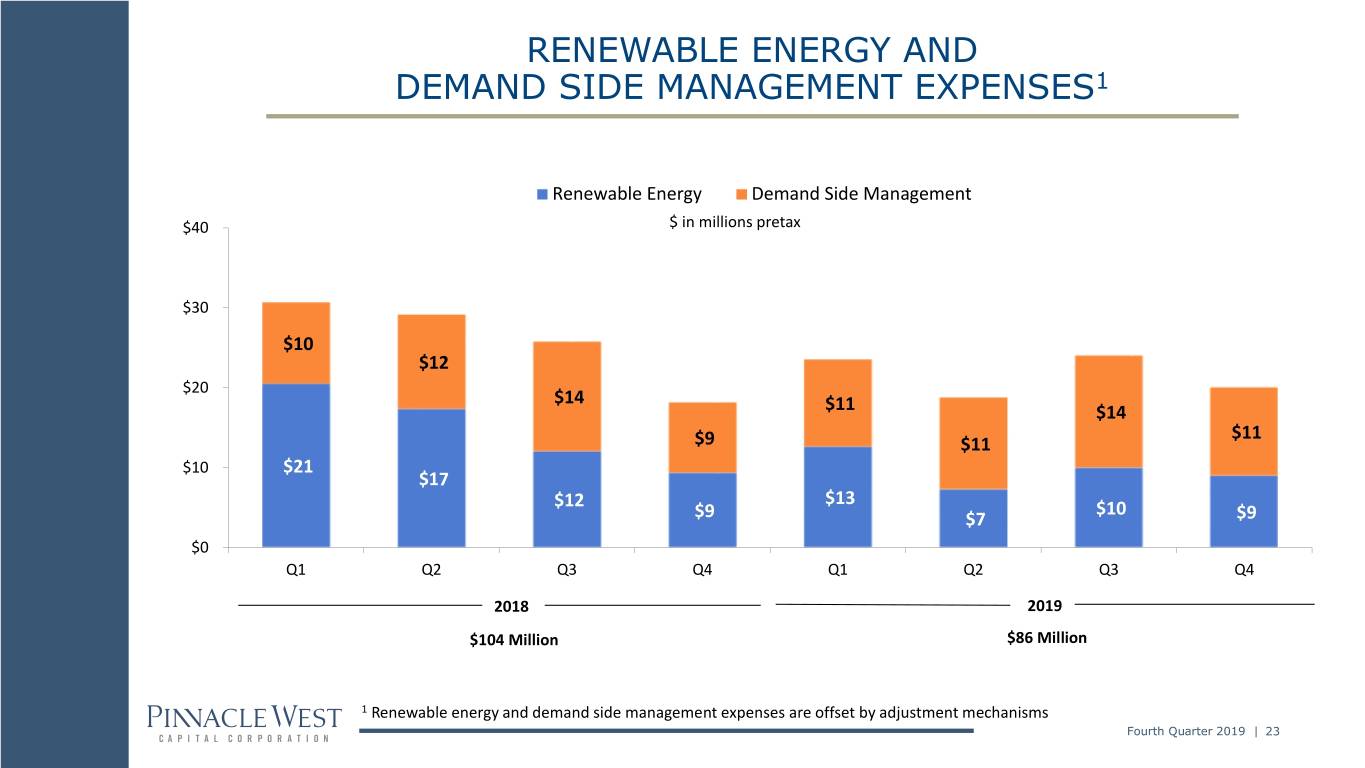
RENEWABLE ENERGY AND DEMAND SIDE MANAGEMENT EXPENSES1 Renewable Energy Demand Side Management $40 $ in millions pretax $30 $10 $12 $20 $14 $11 $14 $11 $9 $11 $10 $21 $17 $13 $12 $10 $9 $7 $9 $0 Q1 Q2 Q3 Q4 Q1 Q2 Q3 Q4 2018 2019 $104 Million $86 Million 1 Renewable energy and demand side management expenses are offset by adjustment mechanisms Fourth Quarter 2019 | 23
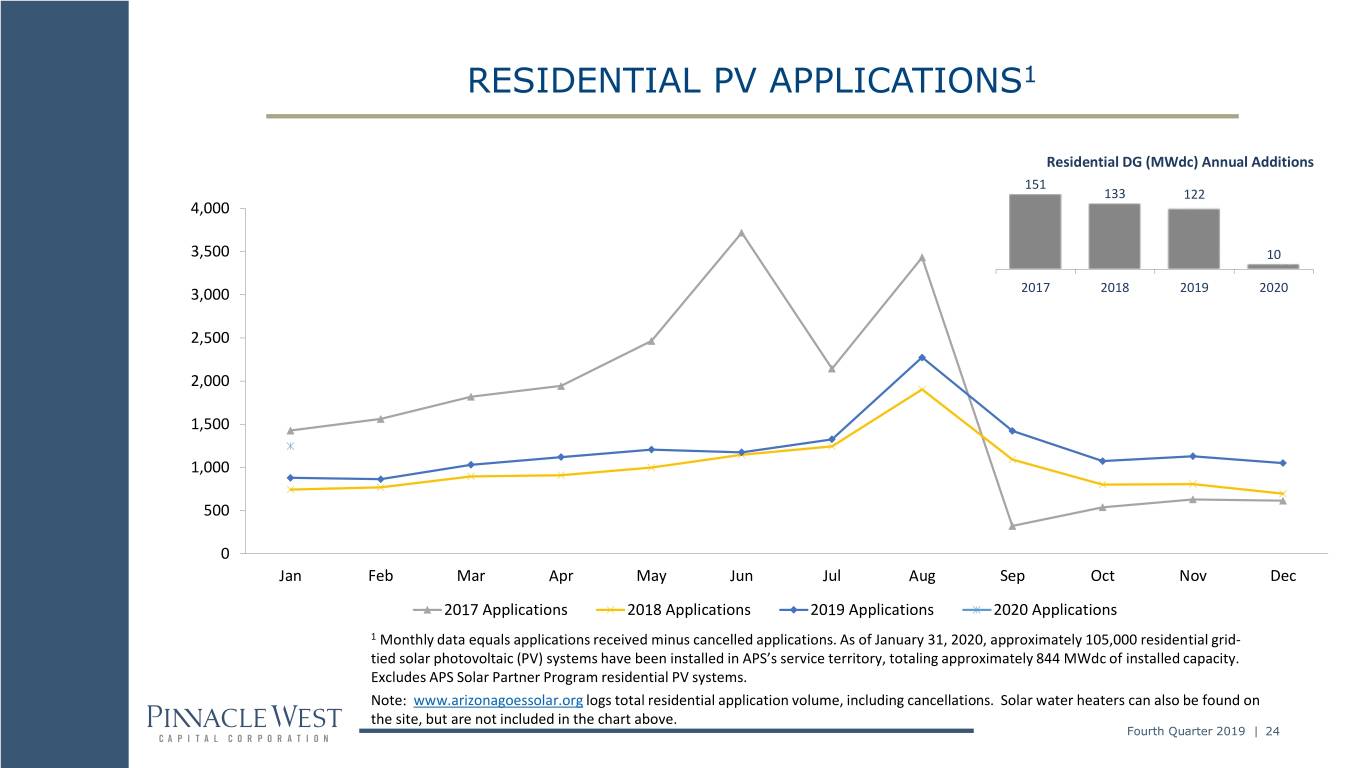
RESIDENTIAL PV APPLICATIONS1 Residential DG (MWdc) Annual Additions 151 133 122 4,000 3,500 10 3,000 2017 2018 2019 2020 2,500 2,000 1,500 1,000 500 0 Jan Feb Mar Apr May Jun Jul Aug Sep Oct Nov Dec 2017 Applications 2018 Applications 2019 Applications 2020 Applications 1 Monthly data equals applications received minus cancelled applications. As of January 31, 2020, approximately 105,000 residential grid- tied solar photovoltaic (PV) systems have been installed in APS’s service territory, totaling approximately 844 MWdc of installed capacity. Excludes APS Solar Partner Program residential PV systems. Note: www.arizonagoessolar.org logs total residential application volume, including cancellations. Solar water heaters can also be found on the site, but are not included in the chart above. Fourth Quarter 2019 | 24
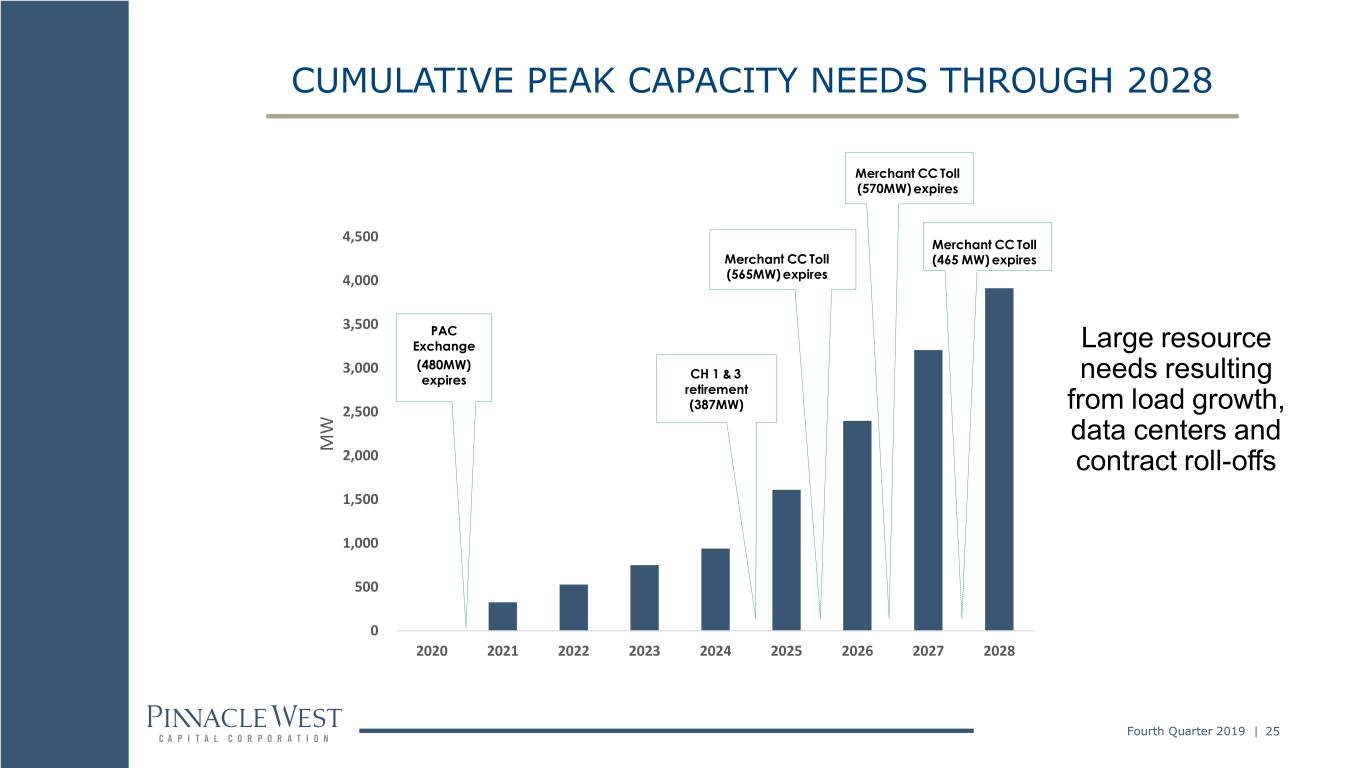
CUMULATIVE PEAK CAPACITY NEEDS THROUGH 2028 Merchant CC Toll (570MW) expires 4,500 Merchant CC Toll Merchant CC Toll (465 MW) expires 4,000 (565MW) expires 3,500 PAC Exchange Large resource 3,000 (480MW) expires CH 1 & 3 needs resulting retirement 2,500 (387MW) from load growth, data centers and MW 2,000 contract roll-offs 1,500 1,000 500 0 2020 2021 2022 2023 2024 2025 2026 2027 2028 Fourth Quarter 2019 | 25
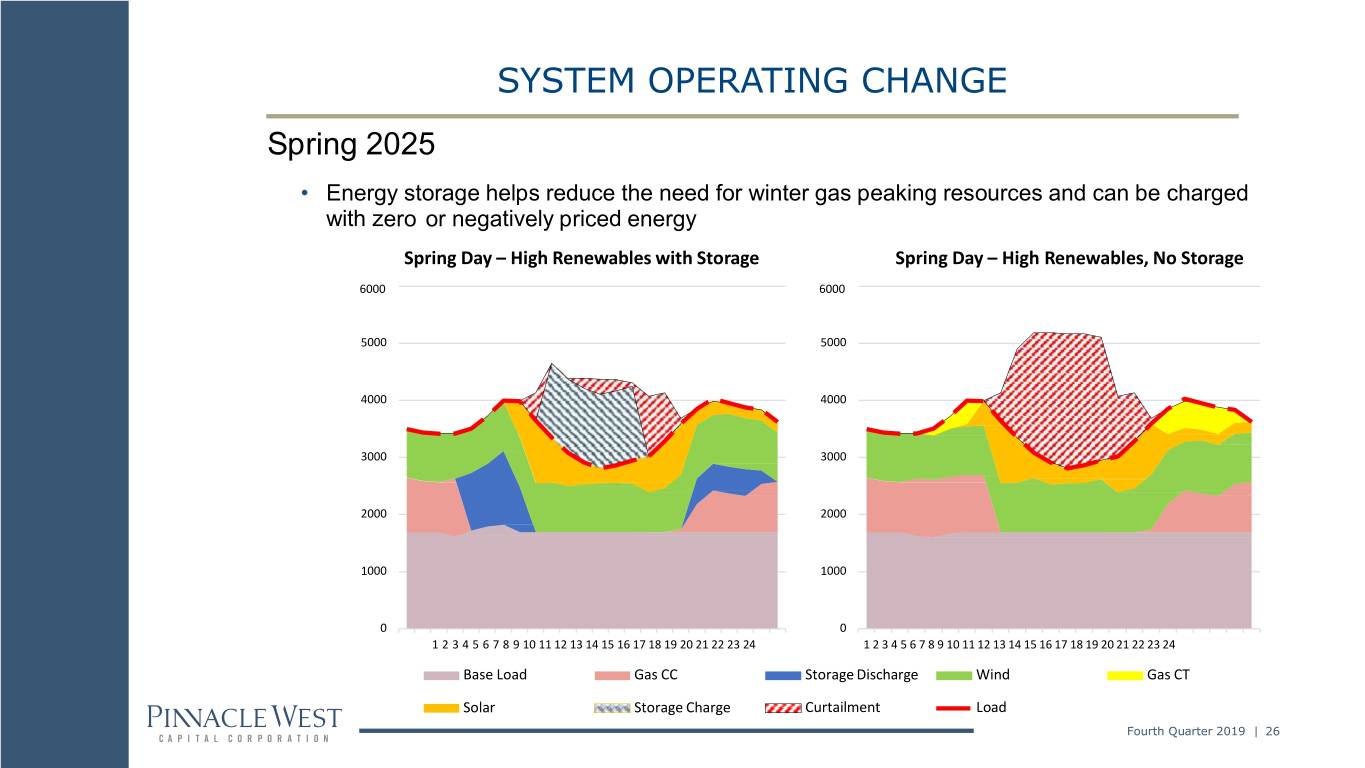
SYSTEM OPERATING CHANGE Spring 2025 • Energy storage helps reduce the need for winter gas peaking resources and can be charged with zero or negatively priced energy Spring Day – High Renewables with Storage Spring Day – High Renewables, No Storage 6000 6000 5000 5000 4000 4000 3000 3000 2000 2000 1000 1000 0 0 1 2 3 4 5 6 7 8 9 10 11 12 13 14 15 16 17 18 19 20 21 22 23 24 1 2 3 4 5 6 7 8 9 10 11 12 13 14 15 16 17 18 19 20 21 22 23 24 Base Load Gas CC Storage Discharge Wind Gas CT Solar Storage Charge Curtailment Load Fourth Quarter 2019 | 26
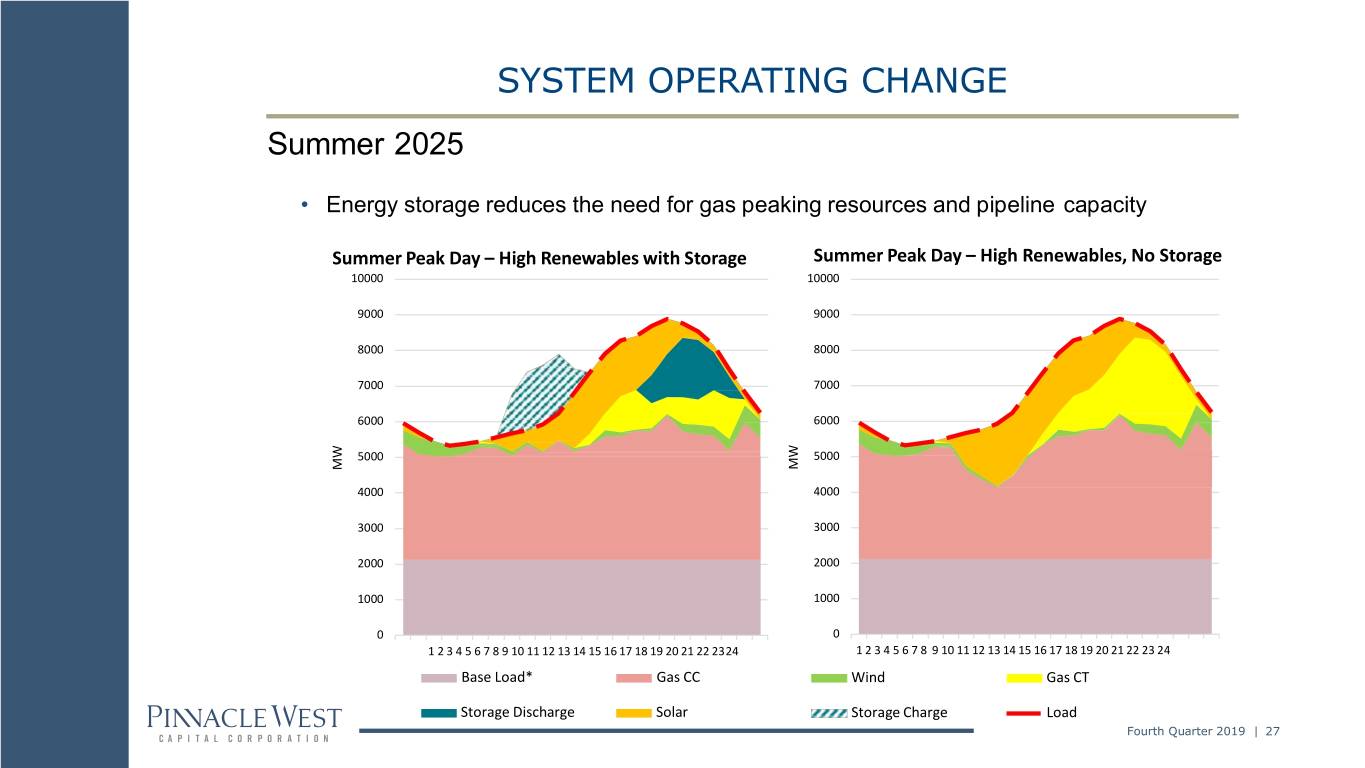
SYSTEM OPERATING CHANGE Summer 2025 • Energy storage reduces the need for gas peaking resources and pipeline capacity Summer Peak Day – High Renewables with Storage Summer Peak Day – High Renewables, No Storage 10000 10000 9000 9000 8000 8000 7000 7000 6000 6000 5000 5000 MW MW 4000 4000 3000 3000 2000 2000 1000 1000 0 0 1 2 3 4 5 6 7 8 9 10 11 12 13 14 15 16 17 18 19 20 21 22 2324 1 2 3 4 5 6 7 8 9 10 11 12 13 14 15 16 17 18 19 20 21 22 23 24 Base Load* Gas CC Wind Gas CT Storage Discharge Solar Storage Charge Load Fourth Quarter 2019 | 27
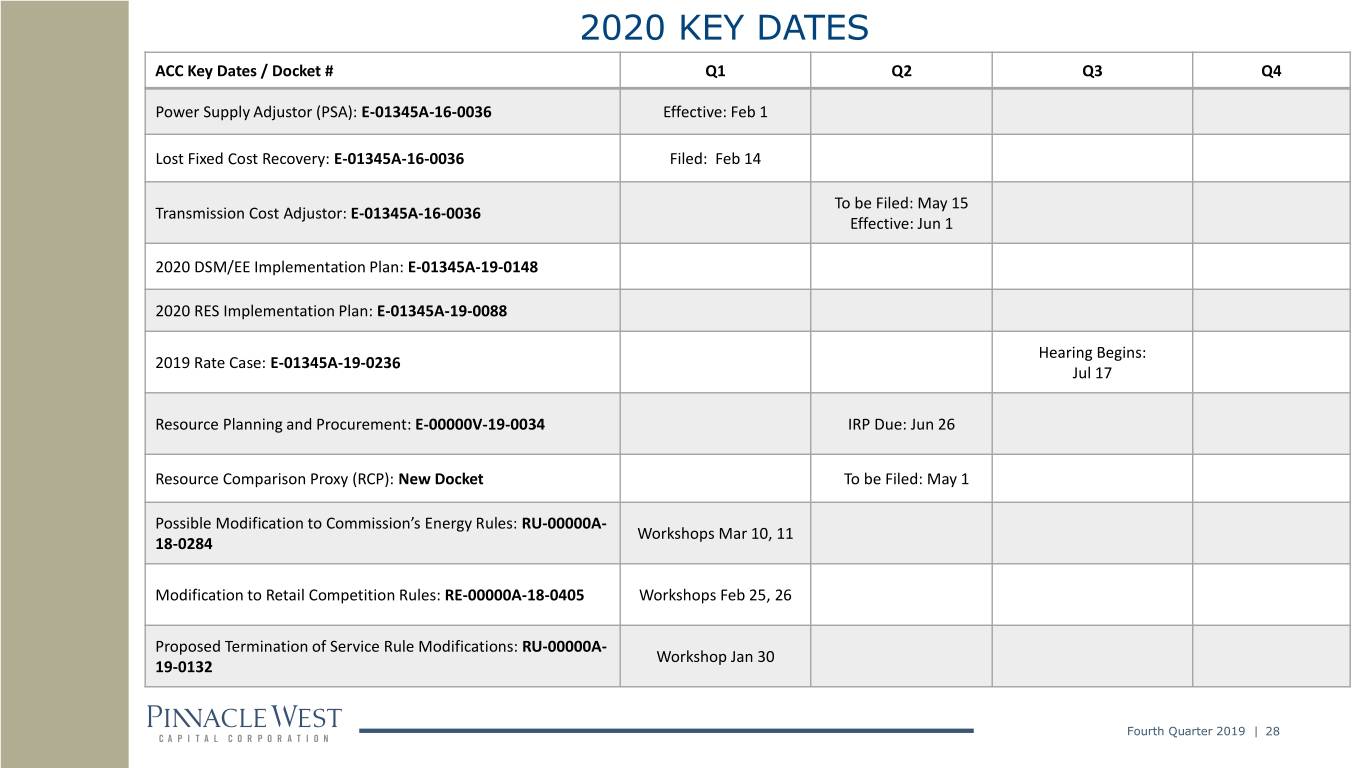
2020 KEY DATES ACC Key Dates / Docket # Q1 Q2 Q3 Q4 Power Supply Adjustor (PSA): E-01345A-16-0036 Effective: Feb 1 Lost Fixed Cost Recovery: E-01345A-16-0036 Filed: Feb 14 To be Filed: May 15 Transmission Cost Adjustor: E-01345A-16-0036 Effective: Jun 1 2020 DSM/EE Implementation Plan: E-01345A-19-0148 2020 RES Implementation Plan: E-01345A-19-0088 Hearing Begins: 2019 Rate Case: E-01345A-19-0236 Jul 17 Resource Planning and Procurement: E-00000V-19-0034 IRP Due: Jun 26 Resource Comparison Proxy (RCP): New Docket To be Filed: May 1 Possible Modification to Commission’s Energy Rules: RU-00000A- Workshops Mar 10, 11 18-0284 Modification to Retail Competition Rules: RE-00000A-18-0405 Workshops Feb 25, 26 Proposed Termination of Service Rule Modifications: RU-00000A- Workshop Jan 30 19-0132 Fourth Quarter 2019 | 28
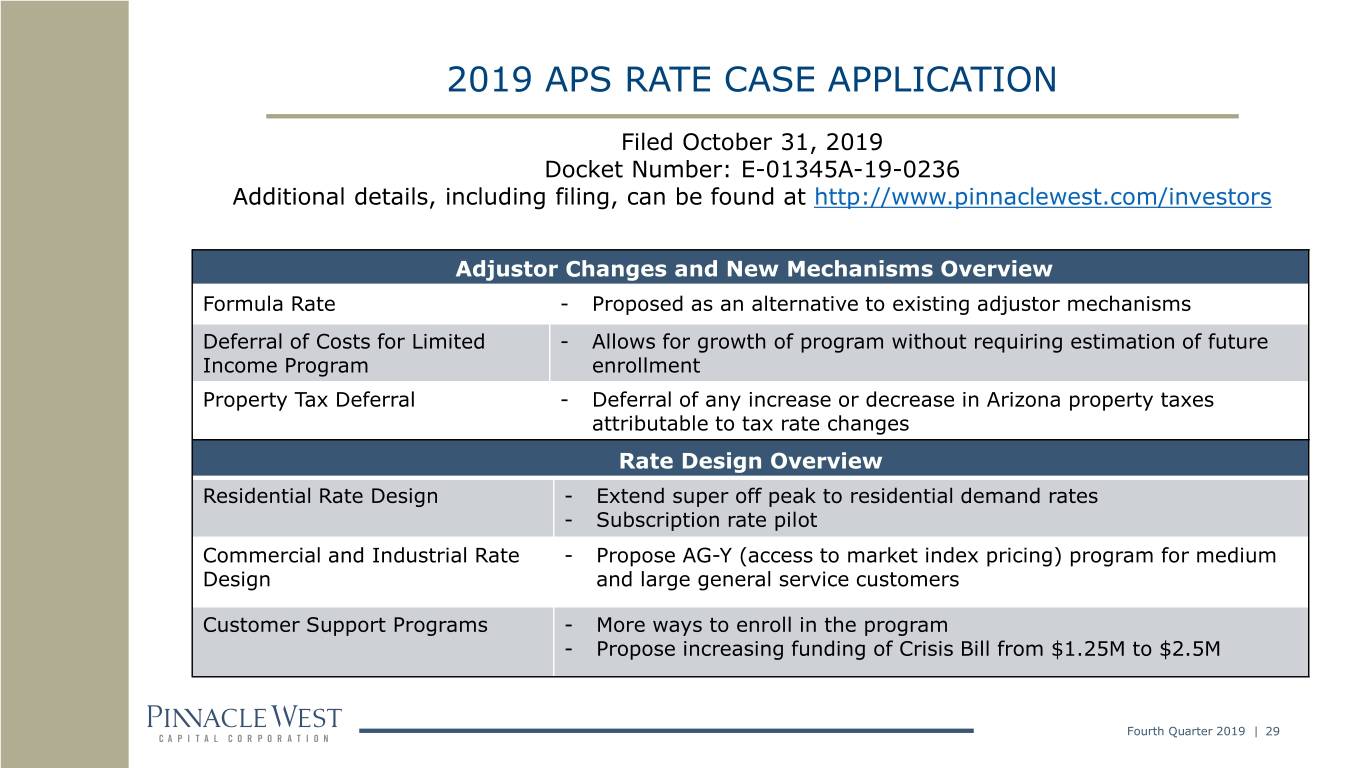
2019 APS RATE CASE APPLICATION Filed October 31, 2019 Docket Number: E-01345A-19-0236 Additional details, including filing, can be found at http://www.pinnaclewest.com/investors Adjustor Changes and New Mechanisms Overview Formula Rate - Proposed as an alternative to existing adjustor mechanisms Deferral of Costs for Limited - Allows for growth of program without requiring estimation of future Income Program enrollment Property Tax Deferral - Deferral of any increase or decrease in Arizona property taxes attributable to tax rate changes Rate Design Overview Residential Rate Design - Extend super off peak to residential demand rates - Subscription rate pilot Commercial and Industrial Rate - Propose AG-Y (access to market index pricing) program for medium Design and large general service customers Customer Support Programs - More ways to enroll in the program - Propose increasing funding of Crisis Bill from $1.25M to $2.5M Fourth Quarter 2019 | 29
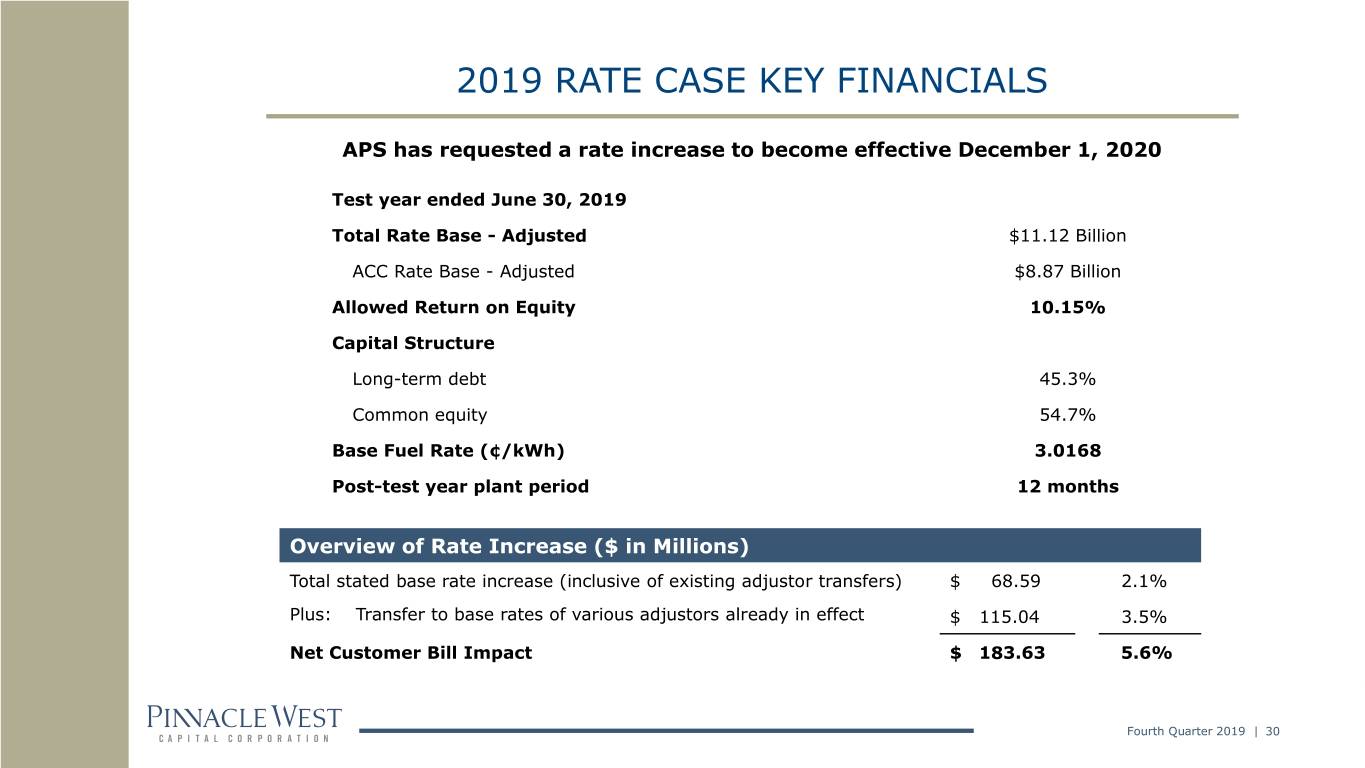
2019 RATE CASE KEY FINANCIALS APS has requested a rate increase to become effective December 1, 2020 Test year ended June 30, 2019 Total Rate Base - Adjusted $11.12 Billion ACC Rate Base - Adjusted $8.87 Billion Allowed Return on Equity 10.15% Capital Structure Long-term debt 45.3% Common equity 54.7% Base Fuel Rate (¢/kWh) 3.0168 Post-test year plant period 12 months Overview of Rate Increase ($ in Millions) Total stated base rate increase (inclusive of existing adjustor transfers) $ 68.59 2.1% Plus: Transfer to base rates of various adjustors already in effect $ 115.04 3.5% Net Customer Bill Impact $ 183.63 5.6% Fourth Quarter 2019 | 30
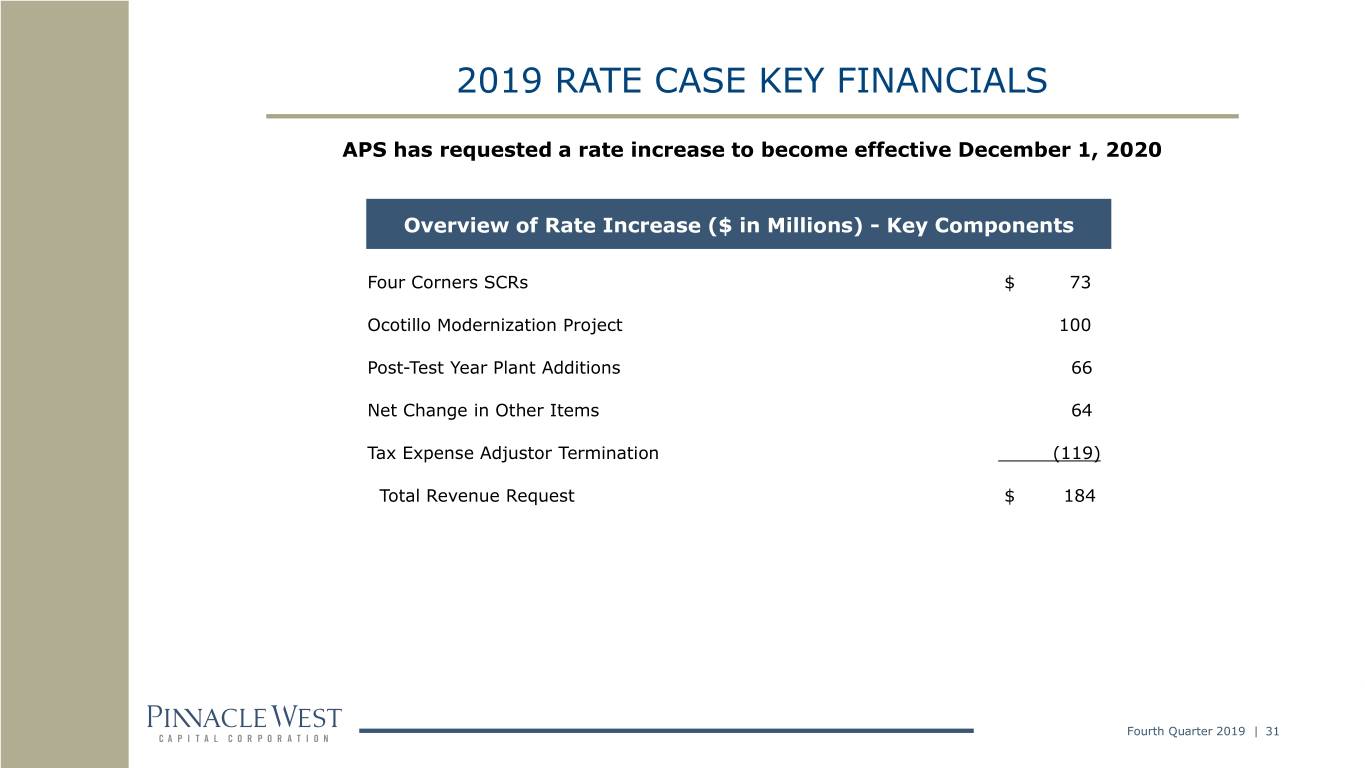
2019 RATE CASE KEY FINANCIALS APS has requested a rate increase to become effective December 1, 2020 Overview of Rate Increase ($ in Millions) - Key Components Four Corners SCRs $ 73 Ocotillo Modernization Project 100 Post-Test Year Plant Additions 66 Net Change in Other Items 64 Tax Expense Adjustor Termination (119) Total Revenue Request $ 184 Fourth Quarter 2019 | 31
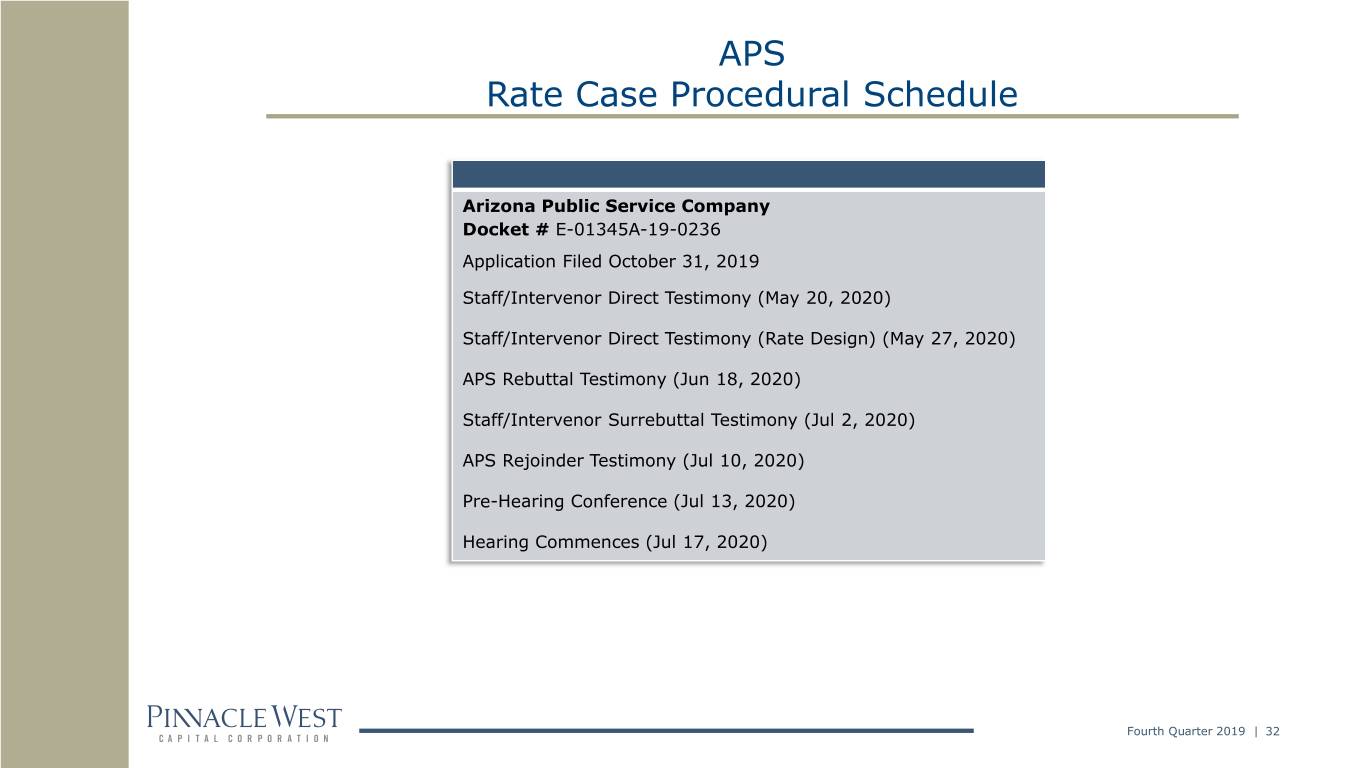
APS Rate Case Procedural Schedule Arizona Public Service Company Docket # E-01345A-19-0236 Application Filed October 31, 2019 Staff/Intervenor Direct Testimony (May 20, 2020) Staff/Intervenor Direct Testimony (Rate Design) (May 27, 2020) APS Rebuttal Testimony (Jun 18, 2020) Staff/Intervenor Surrebuttal Testimony (Jul 2, 2020) APS Rejoinder Testimony (Jul 10, 2020) Pre-Hearing Conference (Jul 13, 2020) Hearing Commences (Jul 17, 2020) Fourth Quarter 2019 | 32
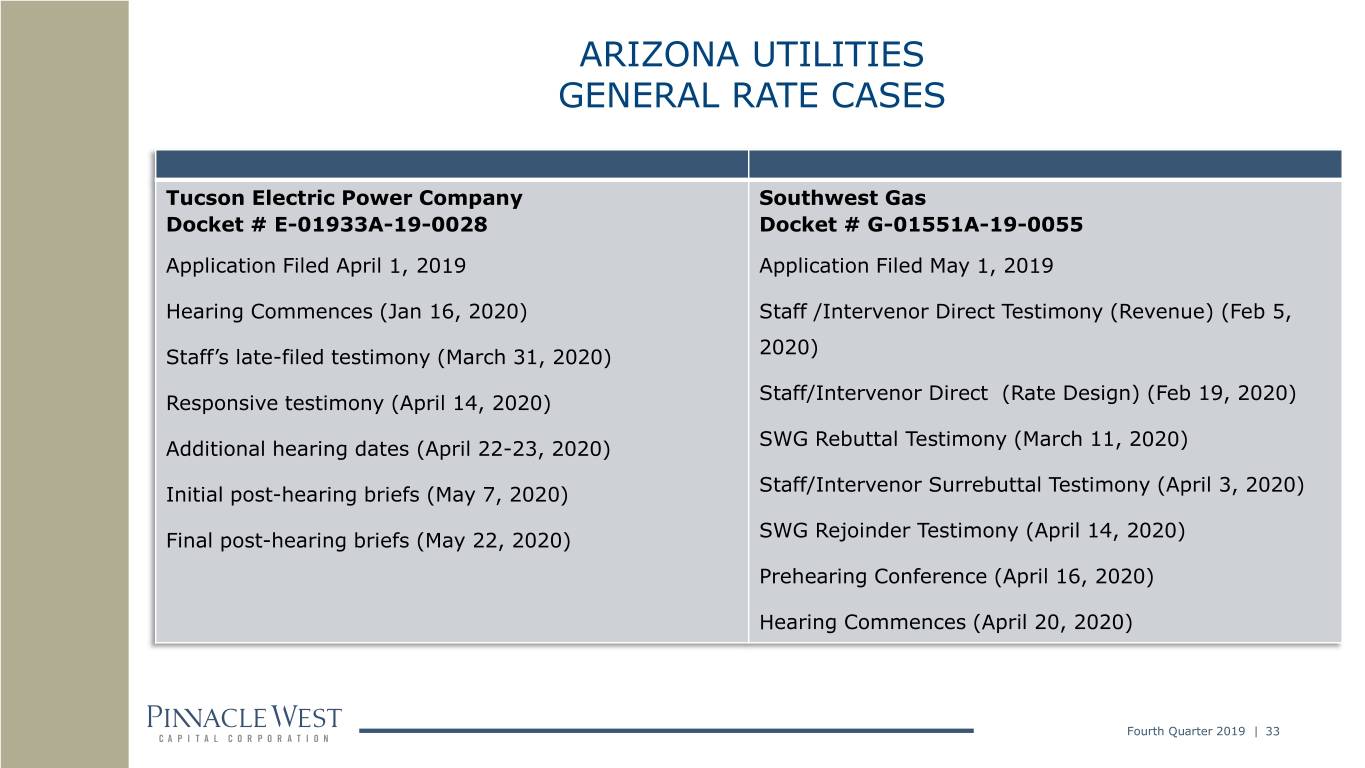
ARIZONA UTILITIES GENERAL RATE CASES Tucson Electric Power Company Southwest Gas Docket # E-01933A-19-0028 Docket # G-01551A-19-0055 Application Filed April 1, 2019 Application Filed May 1, 2019 Hearing Commences (Jan 16, 2020) Staff /Intervenor Direct Testimony (Revenue) (Feb 5, Staff’s late-filed testimony (March 31, 2020) 2020) Staff/Intervenor Direct (Rate Design) (Feb 19, 2020) Responsive testimony (April 14, 2020) Additional hearing dates (April 22-23, 2020) SWG Rebuttal Testimony (March 11, 2020) Initial post-hearing briefs (May 7, 2020) Staff/Intervenor Surrebuttal Testimony (April 3, 2020) SWG Rejoinder Testimony (April 14, 2020) Final post-hearing briefs (May 22, 2020) Prehearing Conference (April 16, 2020) Hearing Commences (April 20, 2020) Fourth Quarter 2019 | 33
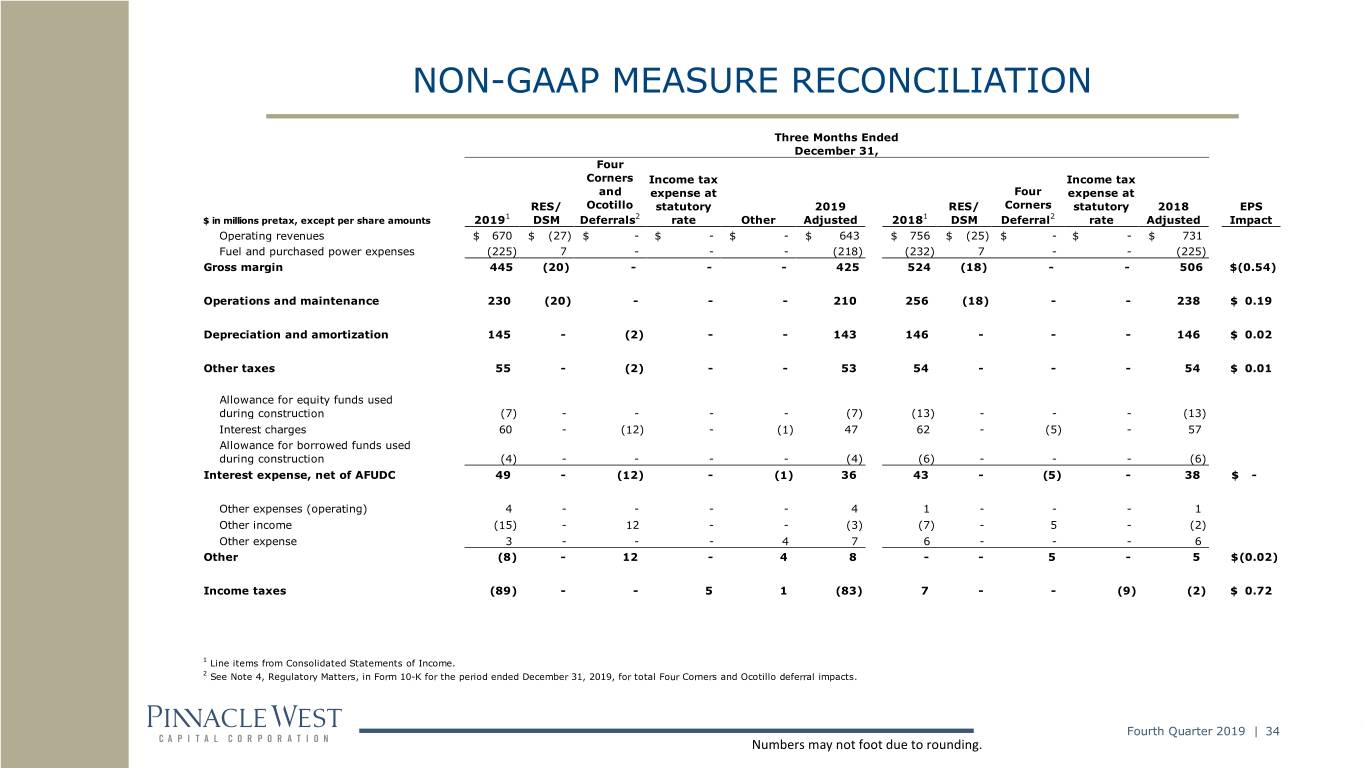
NON-GAAP MEASURE RECONCILIATION Three Months Ended December 31, Four Corners Income tax Income tax and expense at Four expense at RES/ Ocotillo statutory 2019 RES/ Corners statutory 2018 EPS 1 2 1 2 $ in millions pretax, except per share amounts 2019 DSM Deferrals rate Other Adjusted 2018 DSM Deferral rate Adjusted Impact Operating revenues $ 670 $ (27) $ - $ - $ - $ 643 $ 756 $ (25) $ - $ - $ 731 Fuel and purchased power expenses (225) 7 - - - (218) (232) 7 - - (225) Gross margin 445 (20) - - - 425 524 (18) - - 506 $(0.54) Operations and maintenance 230 (20) - - - 210 256 (18) - - 238 $ 0.19 Depreciation and amortization 145 - (2) - - 143 146 - - - 146 $ 0.02 Other taxes 55 - (2) - - 53 54 - - - 54 $ 0.01 Allowance for equity funds used during construction (7) - - - - (7) (13) - - - (13) Interest charges 60 - (12) - (1) 47 62 - (5) - 57 Allowance for borrowed funds used during construction (4) - - - - (4) (6) - - - (6) Interest expense, net of AFUDC 49 - (12) - (1) 36 43 - (5) - 38 $ - Other expenses (operating) 4 - - - - 4 1 - - - 1 Other income (15) - 12 - - (3) (7) - 5 - (2) Other expense 3 - - - 4 7 6 - - - 6 Other (8) - 12 - 4 8 - - 5 - 5 $ (0.02) Income taxes (89) - - 5 1 (83) 7 - - (9) (2) $ 0.72 1 Line items from Consolidated Statements of Income. 2 See Note 4, Regulatory Matters, in Form 10-K for the period ended December 31, 2019, for total Four Corners and Ocotillo deferral impacts. Fourth Quarter 2019 | 34 Numbers may not foot due to rounding.
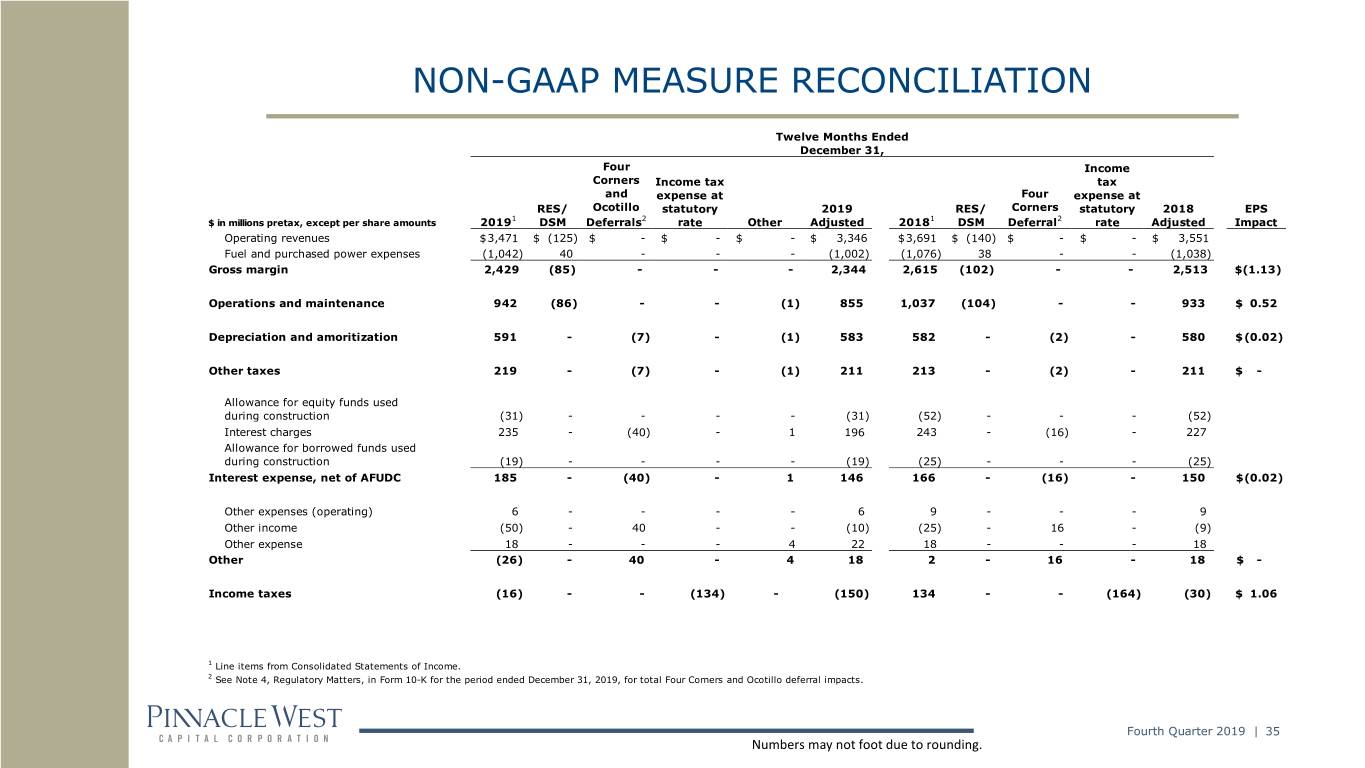
NON-GAAP MEASURE RECONCILIATION Twelve Months Ended December 31, Four Income Corners Income tax tax and expense at Four expense at RES/ Ocotillo statutory 2019 RES/ Corners statutory 2018 EPS 1 2 1 2 $ in millions pretax, except per share amounts 2019 DSM Deferrals rate Other Adjusted 2018 DSM Deferral rate Adjusted Impact Operating revenues $ 3,471 $ (125) $ - $ - $ - $ 3,346 $ 3,691 $ (140) $ - $ - $ 3,551 Fuel and purchased power expenses (1,042) 40 - - - (1,002) (1,076) 38 - - (1,038) Gross margin 2,429 (85) - - - 2,344 2,615 (102) - - 2,513 $(1.13) Operations and maintenance 942 (86) - - (1) 855 1,037 (104) - - 933 $ 0.52 Depreciation and amoritization 591 - (7) - (1) 583 582 - (2) - 580 $ (0.02) Other taxes 219 - (7) - (1) 211 213 - (2) - 211 $ - Allowance for equity funds used during construction (31) - - - - (31) (52) - - - (52) Interest charges 235 - (40) - 1 196 243 - (16) - 227 Allowance for borrowed funds used during construction (19) - - - - (19) (25) - - - (25) Interest expense, net of AFUDC 185 - (40) - 1 146 166 - (16) - 150 $ (0.02) Other expenses (operating) 6 - - - - 6 9 - - - 9 Other income (50) - 40 - - (10) (25) - 16 - (9) Other expense 18 - - - 4 22 18 - - - 18 Other (26) - 40 - 4 18 2 - 16 - 18 $ - Income taxes (16) - - (134) - (150) 134 - - (164) (30) $ 1.06 1 Line items from Consolidated Statements of Income. 2 See Note 4, Regulatory Matters, in Form 10-K for the period ended December 31, 2019, for total Four Corners and Ocotillo deferral impacts. Fourth Quarter 2019 | 35 Numbers may not foot due to rounding.
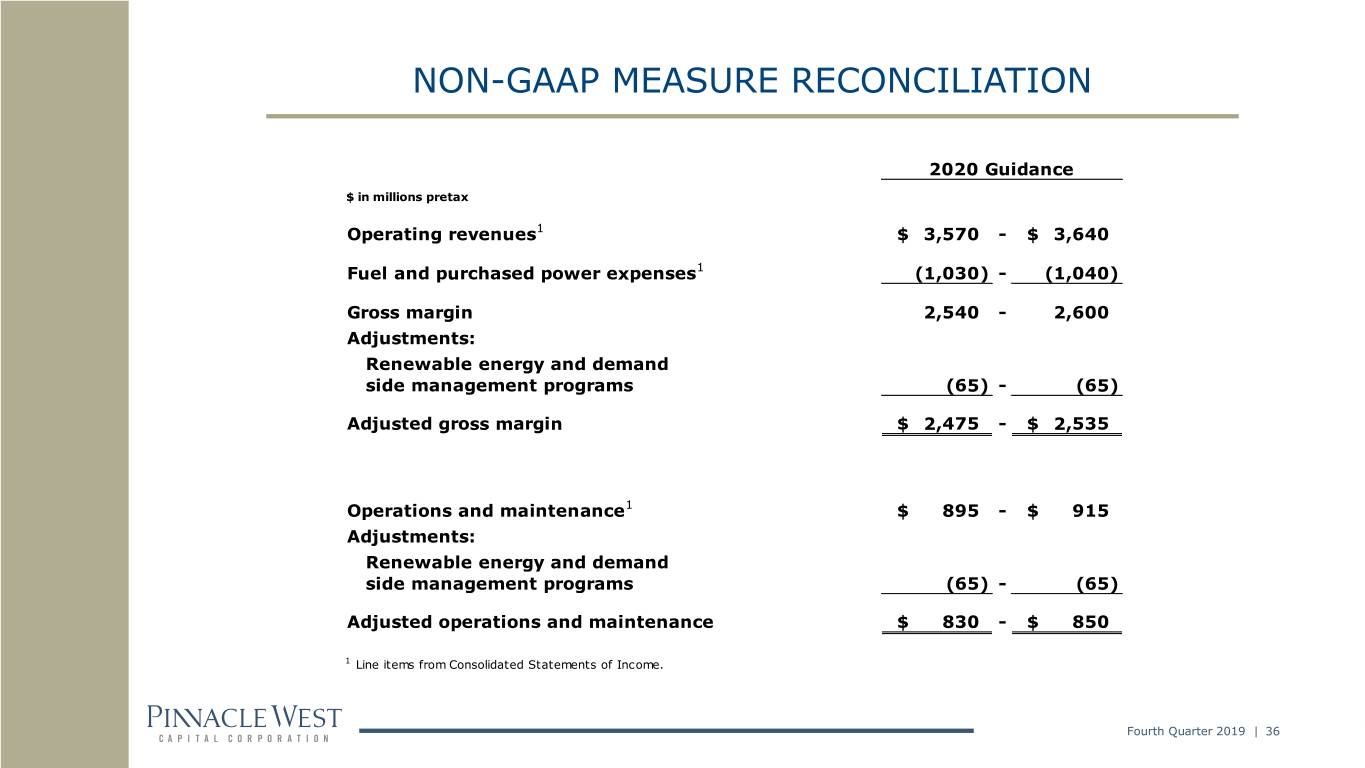
NON-GAAP MEASURE RECONCILIATION 2020 Guidance $ in millions pretax Operating revenues1 $ 3,570 - $ 3,640 Fuel and purchased power expenses1 (1,030) - (1,040) Gross margin 2,540 - 2,600 Adjustments: Renewable energy and demand side management programs (65) - (65) Adjusted gross margin $ 2,475 - $ 2,535 Operations and maintenance1 $ 895 - $ 915 Adjustments: Renewable energy and demand side management programs (65) - (65) Adjusted operations and maintenance $ 830 - $ 850 1 Line items from Consolidated Statements of Income. Fourth Quarter 2019 | 36
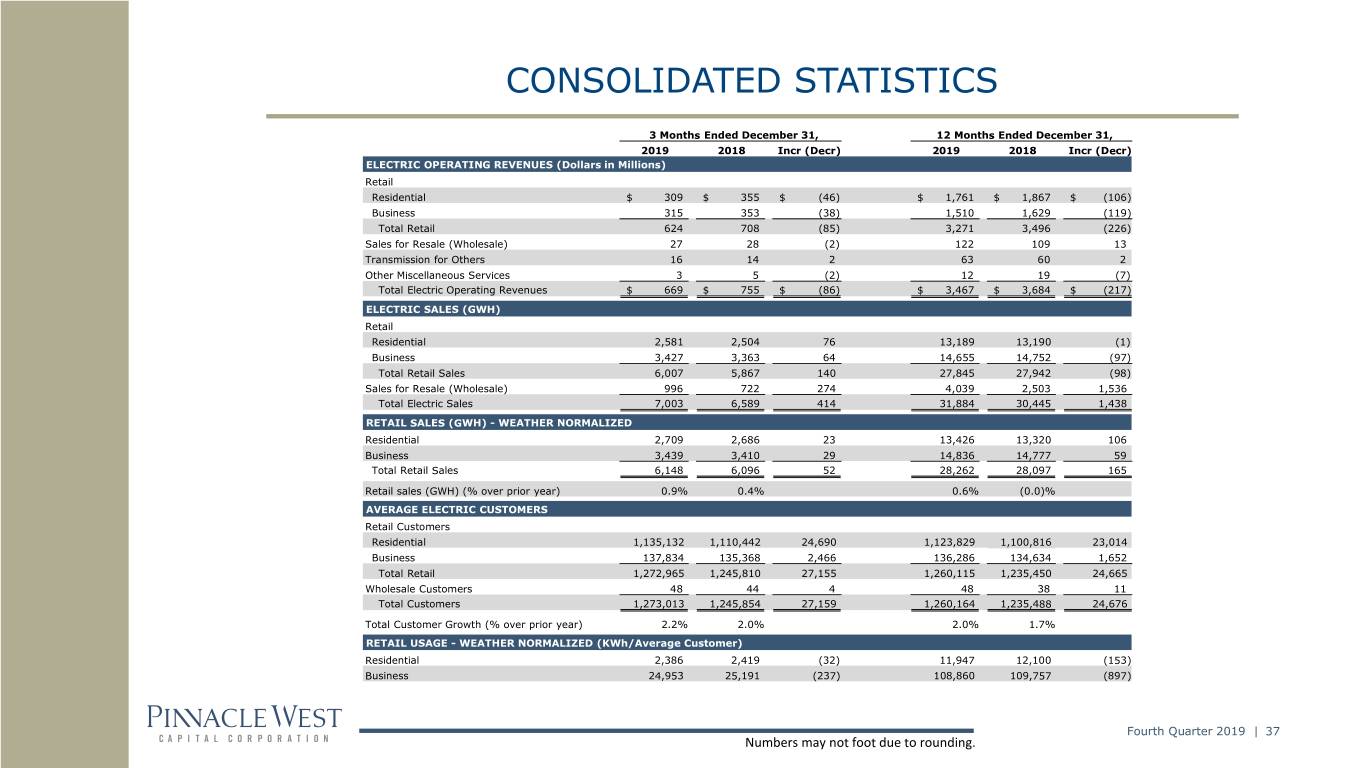
CONSOLIDATED STATISTICS 3 Months Ended December 31, 12 Months Ended December 31, 2019 2018 Incr (Decr) 2019 2018 Incr (Decr) ELECTRIC OPERATING REVENUES (Dollars in Millions) Retail Residential $ 309 $ 355 $ (46) $ 1,761 $ 1,867 $ (106) Business 315 353 (38) 1,510 1,629 (119) Total Retail 624 708 (85) 3,271 3,496 (226) Sales for Resale (Wholesale) 27 28 (2) 122 109 13 Transmission for Others 16 14 2 63 60 2 Other Miscellaneous Services 3 5 (2) 12 19 (7) Total Electric Operating Revenues $ 669 $ 755 $ (86) $ 3,467 $ 3,684 $ (217) ELECTRIC SALES (GWH) Retail Residential 2,581 2,504 76 13,189 13,190 (1) Business 3,427 3,363 64 14,655 14,752 (97) Total Retail Sales 6,007 5,867 140 27,845 27,942 (98) Sales for Resale (Wholesale) 996 722 274 4,039 2,503 1,536 Total Electric Sales 7,003 6,589 414 31,884 30,445 1,438 RETAIL SALES (GWH) - WEATHER NORMALIZED Residential 2,709 2,686 23 13,426 13,320 106 Business 3,439 3,410 29 14,836 14,777 59 Total Retail Sales 6,148 6,096 52 28,262 28,097 165 Retail sales (GWH) (% over prior year) 0.9% 0.4% 0.6% (0.0)% AVERAGE ELECTRIC CUSTOMERS Retail Customers Residential 1,135,132 1,110,442 24,690 1,123,829 1,100,816 23,014 Business 137,834 135,368 2,466 136,286 134,634 1,652 Total Retail 1,272,965 1,245,810 27,155 1,260,115 1,235,450 24,665 Wholesale Customers 48 44 4 48 38 11 Total Customers 1,273,013 1,245,854 27,159 1,260,164 1,235,488 24,676 Total Customer Growth (% over prior year) 2.2% 2.0% 2.0% 1.7% RETAIL USAGE - WEATHER NORMALIZED (KWh/Average Customer) Residential 2,386 2,419 (32) 11,947 12,100 (153) Business 24,953 25,191 (237) 108,860 109,757 (897) Fourth Quarter 2019 | 37 Numbers may not foot due to rounding.
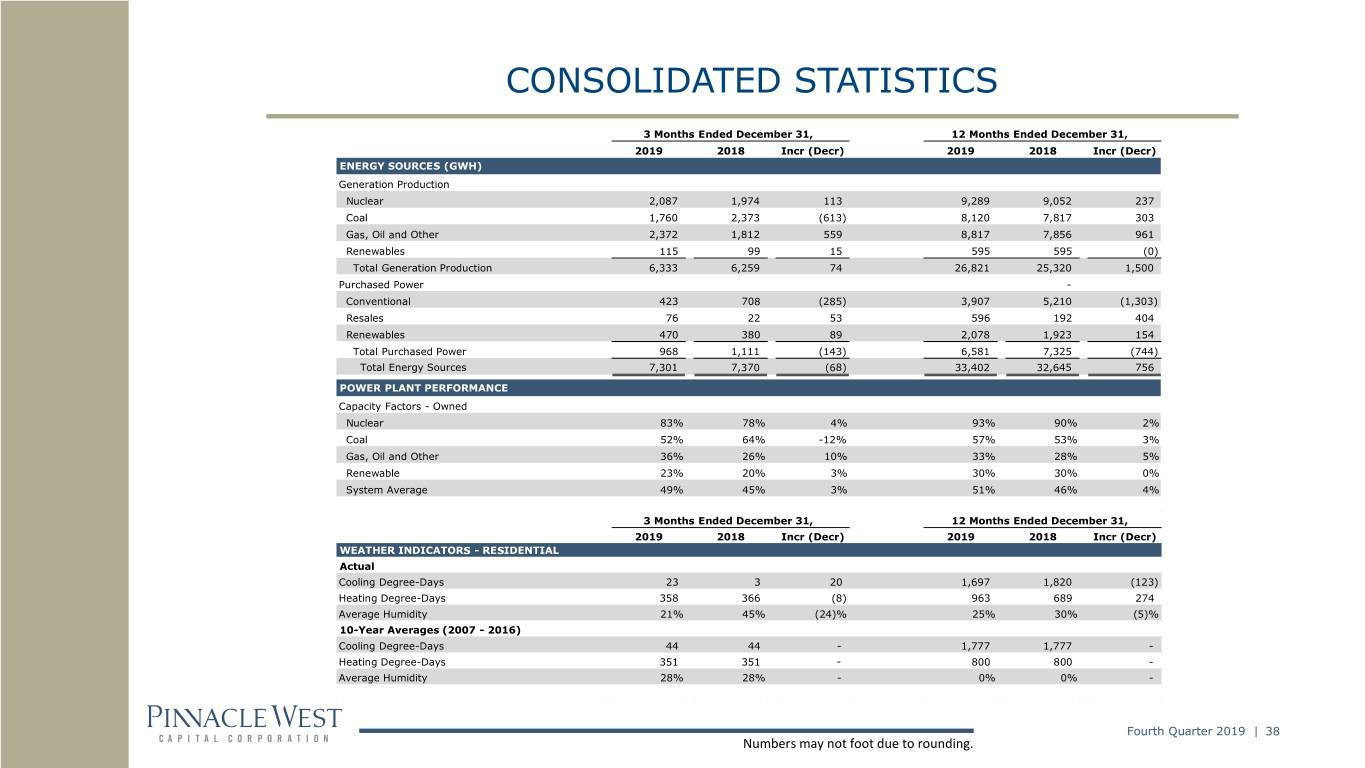
CONSOLIDATED STATISTICS 3 Months Ended December 31, 12 Months Ended December 31, 2019 2018 Incr (Decr) 2019 2018 Incr (Decr) ENERGY SOURCES (GWH) Generation Production Nuclear 2,087 1,974 113 9,289 9,052 237 Coal 1,760 2,373 (613) 8,120 7,817 303 Gas, Oil and Other 2,372 1,812 559 8,817 7,856 961 Renewables 115 99 15 595 595 (0) Total Generation Production 6,333 6,259 74 26,821 25,320 1,500 Purchased Power - Conventional 423 708 (285) 3,907 5,210 (1,303) Resales 76 22 53 596 192 404 Renewables 470 380 89 2,078 1,923 154 Total Purchased Power 968 1,111 (143) 6,581 7,325 (744) Total Energy Sources 7,301 7,370 (68) 33,402 32,645 756 POWER PLANT PERFORMANCE Capacity Factors - Owned Nuclear 83% 78% 4% 93% 90% 2% Coal 52% 64% -12% 57% 53% 3% Gas, Oil and Other 36% 26% 10% 33% 28% 5% Renewable 23% 20% 3% 30% 30% 0% System Average 49% 45% 3% 51% 46% 4% 3 Months Ended December 31, 12 Months Ended December 31, 2019 2018 Incr (Decr) 2019 2018 Incr (Decr) WEATHER INDICATORS - RESIDENTIAL Actual Cooling Degree-Days 23 3 20 1,697 1,820 (123) Heating Degree-Days 358 366 (8) 963 689 274 Average Humidity 21% 45% (24)% 25% 30% (5)% 10-Year Averages (2007 - 2016) Cooling Degree-Days 44 44 - 1,777 1,777 - Heating Degree-Days 351 351 - 800 800 - Average Humidity 28% 28% - 0% 0% - Fourth Quarter 2019 | 38 Numbers may not foot due to rounding.
