pnw-20201030
0000764622falseAZ00000072868-KOctober 30, 2020falseAZfalsefalsefalsefalsefalse00007646222020-10-302020-10-300000764622pnw:ArizonaPublicServiceCompanyMember2020-10-302020-10-30

UNITED STATES
SECURITIES AND EXCHANGE COMMISSION
WASHINGTON, DC 20549 
 
FORM 8-K 
 
CURRENT REPORT
Pursuant to Section 13 or 15(d) of the
Securities Exchange Act of 1934
Date of report (Date of earliest event reported):
October 30, 2020
Commission File
Number
 Exact Name of Each Registrant as specified in its
charter; State of Incorporation; Address; and
Telephone Number
IRS Employer
Identification No.
1-8962 PINNACLE WEST CAPITAL CORPORATION86-0512431
(an Arizona corporation)
400 North Fifth Street, P.O. Box 53999
PhoenixArizona85072-3999
(602) 250-1000
1-4473 ARIZONA PUBLIC SERVICE COMPANY86-0011170
(an Arizona corporation)
400 North Fifth Street, P.O. Box 53999
PhoenixArizona85072-3999
(602)250-1000

Check the appropriate box below if the Form 8-K filing is intended to simultaneously satisfy the filing obligation of the registrant under any of the following provisions:
Written communications pursuant to Rule 425 under the Securities Act (17 CFR 230.425)
Soliciting material pursuant to Rule 14a-12 under the Exchange Act (17 CFR 240.14a-12)
Pre-commencement communications pursuant to Rule 14d-2(b) under the Exchange Act (17 CFR 240.14d-2(b))
Pre-commencement communications pursuant to Rule 13e-4(c) under the Exchange Act (17 CFR 240.13e-4(c))

Securities registered pursuant to Section 12(b) of the Act:
Title of each class
Trading Symbol(s)
Name of each exchange on which registered
Common Stock
PNW
The New York Stock Exchange

Indicate by check mark whether the registrant is an emerging growth company as defined in Rule 405 of the Securities Act of 1933 (17 CFR §230.405) or Rule 12b-2 of the Securities Exchange Act of 1934 (17 CFR §240.12b-2).
Emerging growth company

If an emerging growth company, indicate by check mark if the registrant has elected not to use the extended transition period for complying with any new or revised financial accounting standards provided pursuant to Section 13(a) of the Exchange Act. ¨

This combined Form 8-K is separately filed or furnished by Pinnacle West Capital Corporation and Arizona Public Service Company. Each registrant is filing or furnishing on its own behalf all of the information contained in this Form 8-K that relates to such registrant and, where required, its subsidiaries. Except as stated in the preceding sentence, neither registrant is filing or furnishing any information that does not relate to such registrant, and therefore makes no representation as to any such information.


Item 2.02. Results of Operations and Financial Condition.

    The following information is furnished pursuant to Item 2.02.

    On October 30, 2020, Pinnacle West Capital Corporation (“Pinnacle West”) issued a press release regarding its financial results for the fiscal quarter ended September 30, 2020 and its earnings outlook for 2020. A copy of the press release is attached hereto as Exhibit 99.1.

Item 7.01. Regulation FD Disclosure.

    The following information is furnished pursuant to Item 7.01.

    Pinnacle West is providing a copy of the slide presentation made in connection with the quarterly earnings conference call on October 30, 2020. This information contains Pinnacle West operating results for the fiscal quarter ended September 30, 2020, earnings outlook for 2020 and a quarterly consolidated statistical summary. The slide presentation is attached hereto as Exhibit 99.2 and is concurrently being posted to Pinnacle West’s website at www.pinnaclewest.com.

Item 9.01.    Financial Statements and Exhibits.

    (d)    Exhibits
Exhibit No.Registrant(s)Description
99.1Pinnacle West
Arizona Public Service Company
99.2Pinnacle West
Arizona Public Service Company


SIGNATURES

    Pursuant to the requirements of the Securities Exchange Act of 1934, each registrant has duly caused this report to be signed on its behalf by the undersigned hereunto duly authorized.

PINNACLE WEST CAPITAL CORPORATION
(Registrant)
Dated: October 30, 2020By: /s/ Theodore N. Geisler    
Theodore N. Geisler
Senior Vice President and
Chief Financial Officer
ARIZONA PUBLIC SERVICE COMPANY
(Registrant)
Dated: October 30, 2020By: /s/ Theodore N. Geisler    
Theodore N. Geisler
Senior Vice President and
Chief Financial Officer


a2q2020earningsfinal0_imaga.jpg
FOR IMMEDIATE RELEASEOctober 30, 2020
Media Contact:
Analyst Contact:
Alan Bunnell (602) 250-3376
Stefanie Layton (602) 250-4541
Website:pinnaclewest.com

PINNACLE WEST REPORTS 2020 THIRD-QUARTER EARNINGS

Record summer heat drives quarter-over-quarter earnings improvement
Strong customer growth of 2.3% underscores Arizona’s expanding economy
Operating performance, reliability remain strong

PHOENIX – Pinnacle West Capital Corp. (NYSE: PNW) today reported consolidated net income attributable to common shareholders for the 2020 third quarter of $346.4 million, or $3.07 per diluted share. This result compares with net income of $312.3 million, or $2.77 per share, for the same period a year ago.

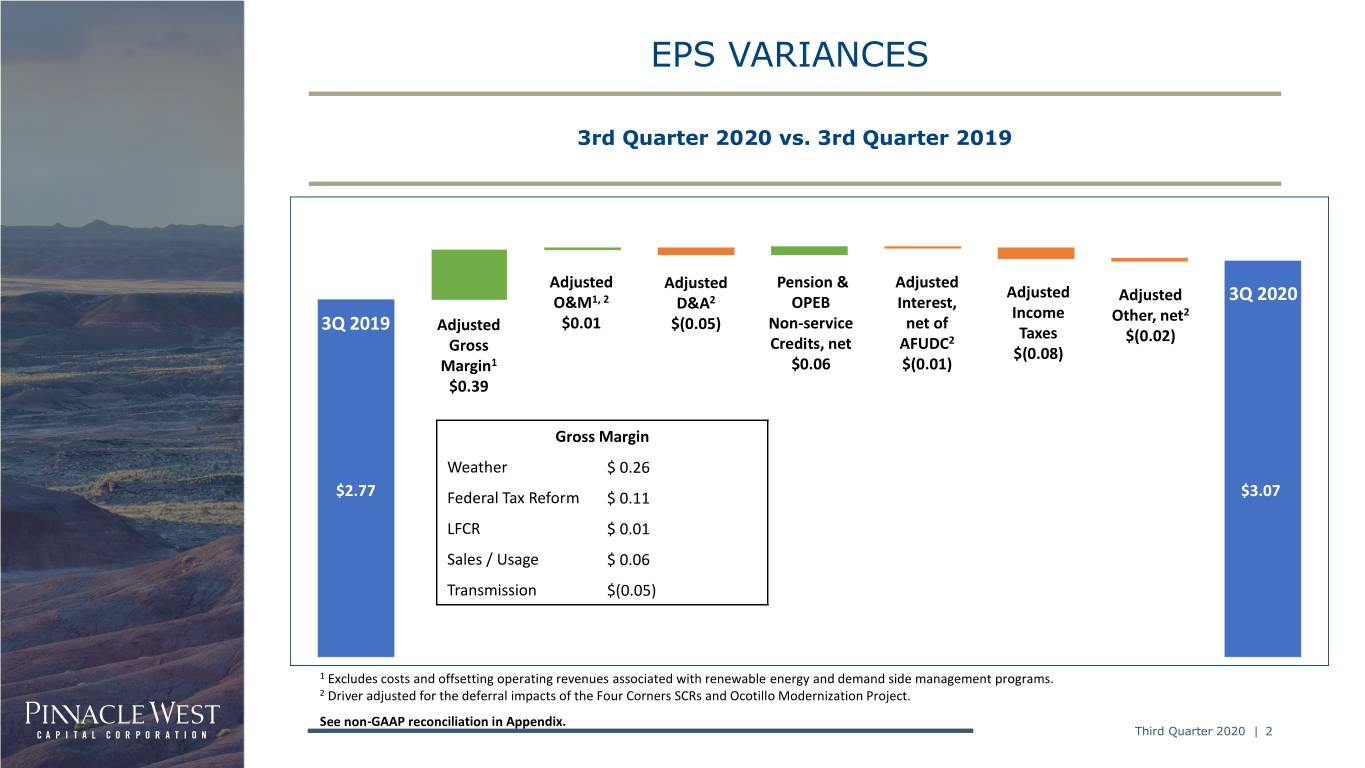
For a second consecutive quarter, hotter-than-normal weather was the primary driver in the quarter-over-quarter improvement, increasing revenues, net of fuel and purchased power costs, by $29.3 million (after-tax), or $0.26 per share, compared to 2019’s third-quarter. Strong customer growth of 2.3% also contributed to the company’s revenues and bottom line.

“The third quarter picked up right where the second quarter left off – with a historic run of record heat that contributed to the hottest July and August on record. In fact, this summer proved to be the hottest ever,” said Pinnacle West Chairman, President and Chief Executive Officer Jeff Guldner. “As a result, our customers used more energy to cool their homes and businesses than under normal weather conditions. The resulting increase in retail sales, taken together with our growing customer base, led to stronger financial results.”

Summer 2020: The Hottest on Record
According to the National Weather Service, the average high temperature in the third quarter was 108.2 degrees – an increase of 2.7% over 2019’s quarter and 3.9% over 10-year historical averages.
image1a.jpg


The number of residential cooling degree-days (a utility’s measure of the effects of weather) increased 15.9% over the same period in 2019 and was 24.7% higher than historical 10-year averages. Moreover, residential cooling degree-days for both July and August were the highest of any year since data tracking began in 1974. Similarly, September had the third-highest cooling degree-days of any year during this time span, with only 2001 and 2018 recording higher numbers.

In addition to being the hottest summer on record, 2020 daily temperatures set records across both the second and third quarters including:
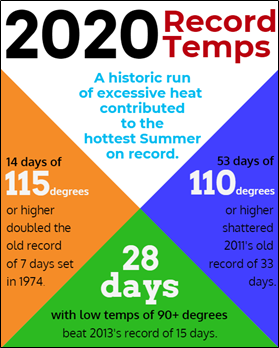
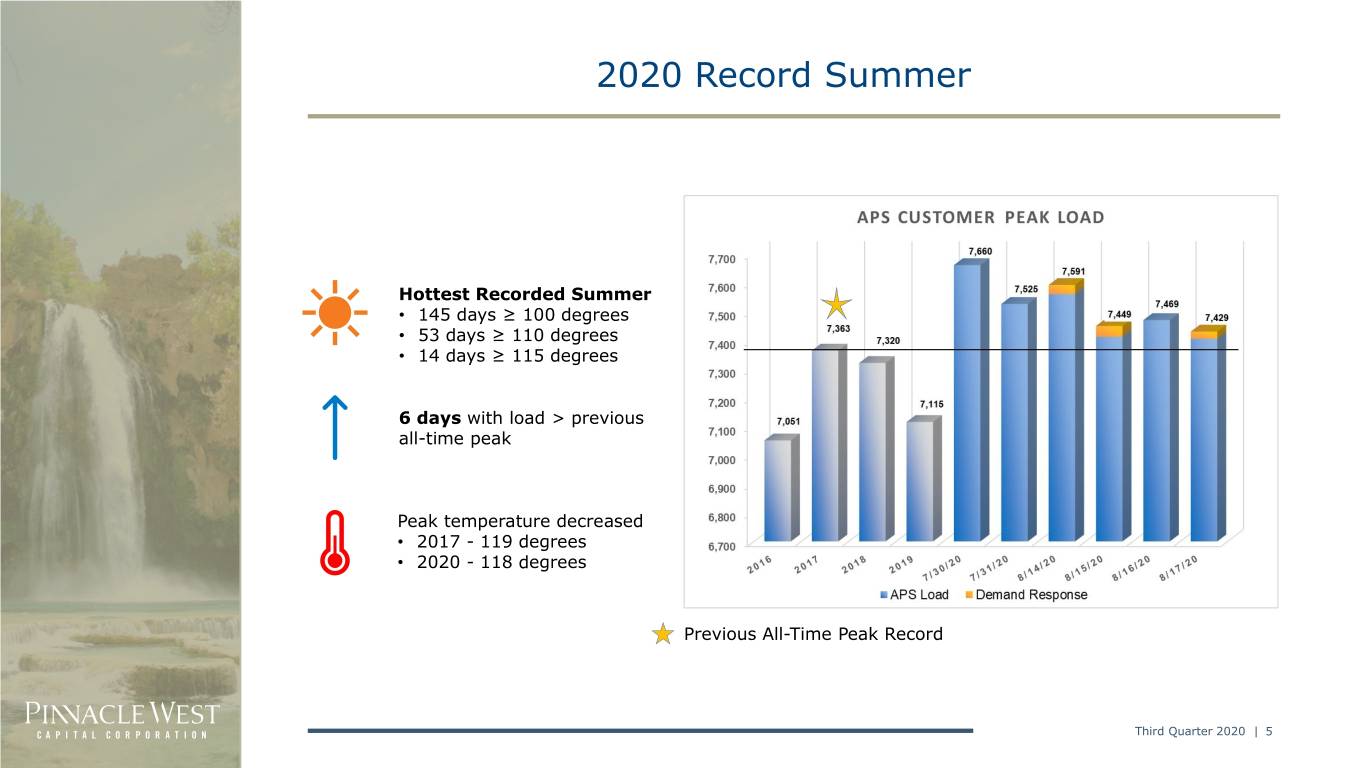
14 days at or above 115 degrees, doubling the old record of 7 days set in 1974;
53 days at or above 110 degrees, which crushed 2011’s prior record of 33 days;
28 days of overnight low temperatures of 90 degrees or higher. This beat the prior record of 15 days set in 2013.

As previously reported, customers set an all-time record peak demand of 7,660 megawatts on July 30, eclipsing the previous record set in 2017 by nearly 300 megawatts. Customer peak load on six other days this summer also surpassed 2017’s previous record peak.

Operating Performance and Reliability Remain Strong
The Company’s third-quarter operating performance and reliability remained strong despite the extreme heat and regional demand for energy that, in some cases, exceeded supply. APS, however, was well prepared.

“Our employees continued to do what they do best: maintain reliable electric service for our 1.3 million customers,” Guldner said. “Our field crews consistently performed under extreme conditions, and our essential mix of baseload power plants operated exceptionally well. That execution was especially critical when this summer’s record heat strained regional energy markets, causing other utilities and system operators across the west to declare energy emergencies.”

Looking to the future, Guldner said that solid long-term planning, operational efficiencies and responsible energy policy will be increasingly critical as additional people and businesses choose to make Arizona their home. With one of the fastest growing markets in the country, the company remains focused on building a strong, sustainable energy future for Arizona that includes executing on several key initiatives. Top priorities include enhancements to customers’ direct customer care experience; execution of its clean energy commitment; and resolution of the company’s rate case filed in 2019 at the direction of the Arizona Corporation Commission.

Customer Support Broadened to Include Energy Efficiency
The challenges of 2020, from summer heat to COVID-19, led APS to further increase direct assistance to customers struggling to pay their bills.

In addition to already having pledged $8 million in pandemic relief – among the largest commitments of any utility in the country – the company extended its voluntary moratorium on service disconnections for non-payment through year-end 2020. This decision came on the heels of APS applying an automatic $100 bill credit to nearly 13,500 of its most vulnerable customers with delinquent balances -- without them needing to take any action. As of October 21, the company’s Customer Support Fund has provided APS customers with $4.3 million in bill relief.

With support of the Arizona Corporation Commission, APS also recently expanded energy efficiency programs to help customers lower their energy bills and ease the burden of unexpected costs. These programs include smart energy and weatherization improvement rebates, as well as emergency HVAC assistance.


A full list of the company’s actions in response to the pandemic is available on the Pinnacle West website, and APS customers are encouraged to visit aps.com/COVID19 for up-to-date details on available resources and support.

Financial Outlook
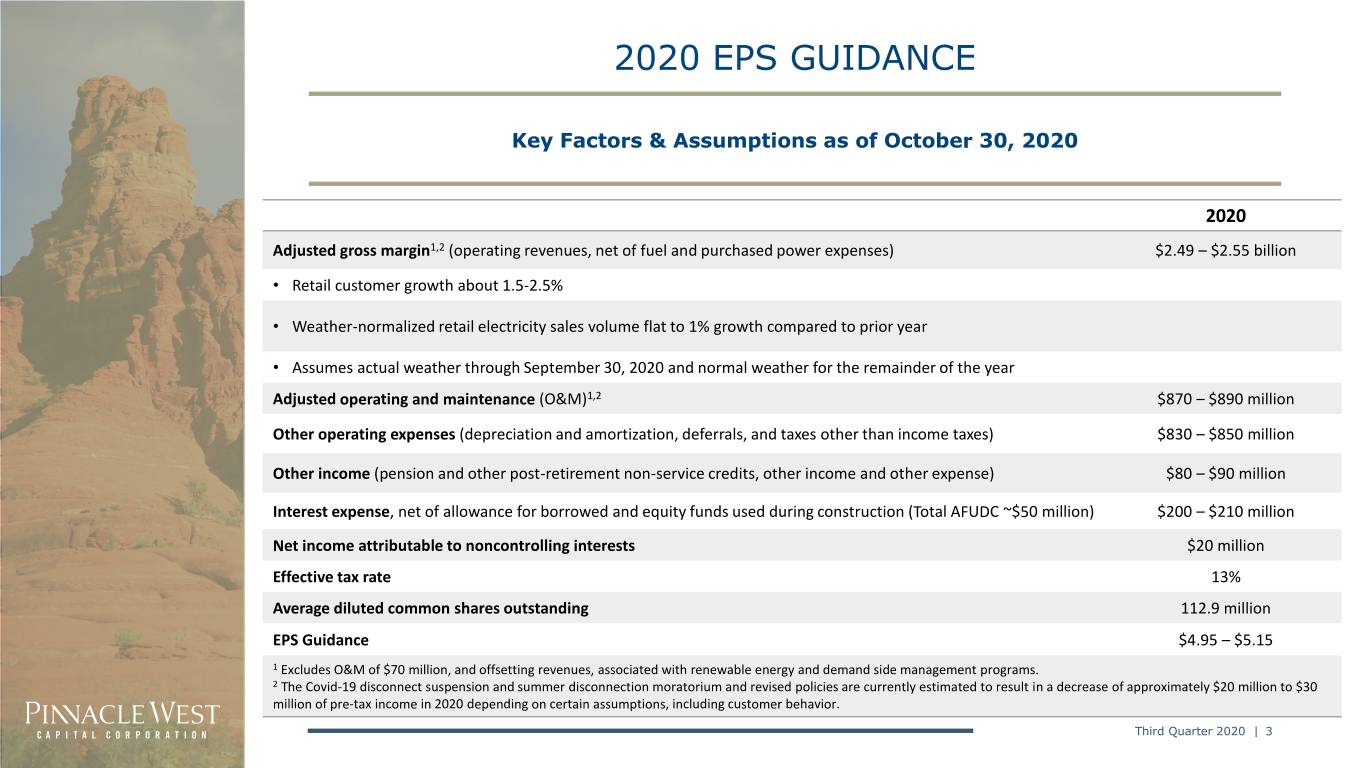
Given the impacts from significantly above-average weather year to date, the company increased its 2020 consolidated earnings guidance to $4.95 to $5.15 per diluted share from a previously disclosed range of $4.75 to $4.95 per share.

Key factors and assumptions underlying the 2020 outlook can be found in the third-quarter 2020 earnings presentation slides at pinnaclewest.com/investors.

Conference Call and Webcast
Pinnacle West invites interested parties to listen to the live webcast of management’s conference call to discuss 2020 third-quarter results, as well as recent developments, at noon ET (9 a.m. Arizona time) today, October 30. The webcast can be accessed at pinnaclewest.com/presentations and will be available for replay on the website for 30 days. To access the live conference call by telephone, dial (877) 407-8035 or (201) 689-8035 for international callers. A replay of the call also will be available at pinnaclewest.com/presentations or by telephone until 11:59 p.m. ET, Friday, Nov. 6, 2020, by calling (877) 481-4010 in the U.S. and Canada or (919) 882-2331 internationally and entering passcode 37822.

General Information
Pinnacle West Capital Corp., an energy holding company based in Phoenix, has consolidated assets of approximately $20 billion, about 6,300 megawatts of generating capacity, and 6,200 employees in Arizona and New Mexico. Through its principal subsidiary, Arizona Public Service, the company provides retail electricity service to nearly 1.3 million Arizona homes and businesses. For more information about Pinnacle West, visit the company’s website at pinnaclewest.com.

Earnings per share amounts in this news release are based on average diluted common shares outstanding. For more information on Pinnacle West’s operating statistics and earnings, please visit pinnaclewest.com/investors.

FORWARD-LOOKING STATEMENTS

This press release contains forward-looking statements based on our current expectations, including statements regarding our earnings guidance and financial outlook and goals. These forward-looking statements are often identified by words such as “estimate,” “predict,” “may,” “believe,” “plan,” “expect,” “require,” “intend,” “assume,” “project,” "anticipate," "goal," "seek," "strategy," "likely," "should," "will," "could," and similar words. Because actual results may differ materially from expectations, we caution readers not to place undue reliance on these statements. A number of factors could cause future results to differ materially from historical results, or from outcomes currently expected or sought by Pinnacle West or APS. These factors include, but are not limited to:

the potential effects of the continued COVID-19 pandemic, including, but not limited to, demand for energy, economic growth, our employees and contractors, supply chain, expenses, capital markets, capital projects, operations and maintenance activities, uncollectable accounts, liquidity, cash flows, or other unpredictable events;
our ability to manage capital expenditures and operations and maintenance costs while maintaining high reliability and customer service levels;
variations in demand for electricity, including those due to weather, seasonality, the general economy or social conditions, customer and sales growth (or decline), the effects of energy conservation measures and distributed generation, and technological advancements;
power plant and transmission system performance and outages;


competition in retail and wholesale power markets;
regulatory and judicial decisions, developments and proceedings;
new legislation, ballot initiatives and regulation, including those relating to environmental requirements, regulatory policy, nuclear plant operations and potential deregulation of retail electric markets;
fuel and water supply availability;
our ability to achieve timely and adequate rate recovery of our costs, including returns on and of debt and equity capital investment;
our ability to meet renewable energy and energy efficiency mandates and recover related costs;
risks inherent in the operation of nuclear facilities, including spent fuel disposal uncertainty;
current and future economic conditions in Arizona, including in real estate markets;
the direct or indirect effect on our facilities or business from cybersecurity threats or intrusions, data security breaches, terrorist attack, physical attack, severe storms, droughts, or other catastrophic events, such as fires, explosions, pandemic health events, or similar occurrences;
the development of new technologies which may affect electric sales or delivery;
the cost of debt and equity capital and the ability to access capital markets when required;
environmental, economic and other concerns surrounding coal-fired generation, including regulation of greenhouse gas emissions;
volatile fuel and purchased power costs;
the investment performance of the assets of our nuclear decommissioning trust, pension, and other post-retirement benefit plans and the resulting impact on future funding requirements;
the liquidity of wholesale power markets and the use of derivative contracts in our business;
potential shortfalls in insurance coverage;
new accounting requirements or new interpretations of existing requirements;
generation, transmission and distribution facility and system conditions and operating costs;
the ability to meet the anticipated future need for additional generation and associated transmission facilities in our region;
the willingness or ability of our counterparties, power plant participants and power plant land owners to meet contractual or other obligations or continue or discontinue power plant operations consistent with our corporate interests; and
restrictions on dividends or other provisions in our credit agreements and Arizona Corporation Commission orders.

These and other factors are discussed in Risk Factors described in Part 1, Item 1A of the Pinnacle West/APS Annual Report on Form 10-K for the fiscal year ended Dec. 31, 2019; in Part II, Item 1A in of the Pinnacle West/APS Quarterly Reports on Form 10-Q for the quarters ended March 31, 2020, June 30, 2020 and Sept. 30, 2020, which readers should review carefully before placing any reliance on our financial statements or disclosures. Neither Pinnacle West nor APS assumes any obligation to update these statements, even if our internal estimates change, except as required by law.

# # #


PINNACLE WEST CAPITAL CORPORATION
CONSOLIDATED STATEMENTS OF INCOME
(unaudited)
(dollars and shares in thousands, except per share amounts)
 THREE MONTHS ENDED  NINE MONTHS ENDED
 SEPTEMBER 30,  SEPTEMBER 30,
2020201920202019
Operating Revenues$1,254,501 $1,190,787 $2,846,021 $2,800,818 
Operating Expenses
Fuel and purchased power353,171 344,862 780,074 817,672 
Operations and maintenance236,971 238,582 677,681 711,759 
Depreciation and amortization152,696 149,450 459,257 445,531 
Taxes other than income taxes54,978 53,809 168,514 163,989 
Other expenses1,677 794 3,191 1,904 
    Total799,493 787,497 2,088,717 2,140,855 
Operating Income455,008 403,290 757,304 659,963 
Other Income (Deductions)
Allowance for equity funds used during construction 8,144 5,917 24,652 24,677 
Pension and other postretirement non-service credits - net14,118 5,752 42,171 17,240 
Other income13,881 15,191 42,888 35,245 
Other expense(5,838)(5,740)(14,426)(14,448)
   Total30,305 21,120 95,285 62,714 
Interest Expense
Interest charges61,497 57,481 183,421 175,599 
Allowance for borrowed funds used during construction (4,663)(3,486)(13,488)(14,645)
   Total56,834 53,995 169,933 160,954 
Income Before Income Taxes428,479 370,415 682,656 561,723 
Income Taxes77,234 53,266 98,086 72,764 
Net Income 351,245 317,149 584,570 488,959 
Less: Net income attributable to noncontrolling interests4,873 4,873 14,620 14,620 
Net Income Attributable To Common Shareholders346,372 312,276 569,950 474,339 
Weighted-Average Common Shares Outstanding - Basic112,679 112,463 112,639 112,408 
Weighted-Average Common Shares Outstanding - Diluted112,987 112,746 112,912 112,739 
Earnings Per Weighted-Average Common Share Outstanding
Net income attributable to common shareholders - basic3.072.785.064.22
Net income attributable to common shareholders - diluted3.072.775.054.21


POWERING GROWTH DELIVERING VALUE Third Quarter 2020 Results October 30, 2020 Third Quarter 2020 | 0


FORWARD LOOKING STATEMENTS AND NON-GAAP FINANCIAL MEASURES This presentation contains forward-looking statements based on current expectations, including statements regarding our earnings guidance and financial outlook and goals. These forward-looking statements are often identified by words such as “estimate,” “predict,” “may,” “believe,” “plan,” “expect,” “require,” “intend,” “assume,” “project,” "anticipate," "goal," "seek," "strategy," "likely," "should," "will," "could," and similar words. Because actual results may differ materially from expectations, we caution you not to place undue reliance on these statements. A number of factors could cause future results to differ materially from historical results, or from outcomes currently expected or sought by Pinnacle West or APS. These factors include, but are not limited to: the potential effects of the continued COVID-19 pandemic, including, but not limited to, demand for energy, economic growth, our employees and contractors, supply chain, expenses, capital markets, capital projects, operations and maintenance activities, uncollectable accounts, liquidity, cash flows, or other unpredictable events; our ability to manage capital expenditures and operations and maintenance costs while maintaining high reliability and customer service levels; variations in demand for electricity, including those due to weather seasonality, the general economy or social conditions, customer and sales growth (or decline), the effects of energy conservation measures and distributed generation, and technological advancements; power plant and transmission system performance and outages; competition in retail and wholesale power markets; regulatory and judicial decisions, developments and proceedings; new legislation, ballot initiatives and regulation, including those relating to environmental requirements, regulatory policy, nuclear plant operations and potential deregulation of retail electric markets; fuel and water supply availability; our ability to achieve timely and adequate rate recovery of our costs, including returns on and of debt and equity capital investments; our ability to meet renewable energy and energy efficiency mandates and recover related costs; risks inherent in the operation of nuclear facilities, including spent fuel disposal uncertainty; current and future economic conditions in Arizona, including in real estate markets; the direct or indirect effect on our facilities or business from cybersecurity threats or intrusions, data security breaches, terrorist attack, physical attack, severe storms, droughts, or other catastrophic events, such as fires, explosions, pandemic health events, or similar occurrences; the development of new technologies which may affect electric sales or delivery; the cost of debt and equity capital and the ability to access capital markets when required; environmental, economic and other concerns surrounding coal-fired generation, including regulation of greenhouse gas emissions; volatile fuel and purchased power costs; the investment performance of the assets of our nuclear decommissioning trust, pension, and other postretirement benefit plans and the resulting impact on future funding requirements; the liquidity of wholesale power markets and the use of derivative contracts in our business; potential shortfalls in insurance coverage; new accounting requirements or new interpretations of existing requirements; generation, transmission and distribution facility and system conditions and operating costs; the ability to meet the anticipated future need for additional generation and associated transmission facilities in our region; the willingness or ability of our counterparties, power plant participants and power plant land owners to meet contractual or other obligations or continue or discontinue power plant operations consistent with our corporate interests; and restrictions on dividends or other provisions in our credit agreements and ACC orders. These and other factors are discussed in Risk Factors described in Part I, Item 1A of the Pinnacle West/APS Annual Report on Form 10-K for the fiscal year ended December 31, 2019, in Part II, Item 1A in of the Pinnacle West/APS Quarterly Reports on Form 10-Q for the quarters ended March 31, 2020, June 30, 2020 and September 30, 2020, which you should review carefully before placing any reliance on our financial statements, disclosures or earnings outlook. Neither Pinnacle West nor APS assumes any obligation to update these statements, even if our internal estimates change, except as required by law. In this presentation, references to net income and earnings per share (EPS) refer to amounts attributable to common shareholders. We present “gross margin” per diluted share of common stock. Gross margin refers to operating revenues less fuel and purchased power expenses. Gross margin is a “non-GAAP financial measure,” as defined in accordance with SEC rules. The appendix contains a reconciliation of this non-GAAP financial measure to the referenced revenue and expense line items on our Consolidated Statements of Income, which are the most directly comparable financial measures calculated and presented in accordance with generally accepted accounting principles in the United States of America (GAAP). We view gross margin as an important performance measure of the core profitability of our operations and is used by our management in analyzing the operations of our business. We believe that investors benefit from having access to the same financial measures that management uses. We present “adjusted gross margin” and “adjusted operations and maintenance” that have been adjusted to exclude costs and offsetting operating revenues associated with renewable energy and demand side management programs. We also present “adjusted operations and maintenance,” “adjusted D&A,” “adjusted interest, net of AFUDC,” and “adjusted other, net” that have been adjusted for the deferral impacts of the Four Corner's Selective Catalytic Reduction (SCR) equipment and Ocotillo Modernization Project. We also present “adjusted income taxes" that shows the impact of tax reform. Adjusted gross margin, adjusted operations and maintenance, adjusted D&A, adjusted interest, net of AFUDC, adjusted other, net, and adjusted income taxes are “non-GAAP financial measures,” as defined in accordance with SEC rules. The appendix contains a reconciliation to show the exclusion of costs and offsetting operating revenues associated with renewable energy and demand side management programs, the deferral impacts of the Four Corner’s SCR equipment and the Ocotillo Modernization Project, and the impact of tax reform. We believe the information provided in the reconciliation provides investors with useful indicators of our results that are comparable among periods because they exclude the effects of unusual items that may occur on an irregular basis, such as the installation of the SCR equipment, the Ocotillo Modernization Project and tax reform impacts, and exclude the effects of programs that overstate our gross margin. Third Quarter 2020 | 1


EPS VARIANCES 3rd Quarter 2020 vs. 3rd Quarter 2019 Adjusted Adjusted Pension & Adjusted Adjusted O&M1, 2 D&A2 OPEB Interest, Adjusted 3Q 2020 Income 2 $0.01 $(0.05) Non-service net of Other, net 3Q 2019 Adjusted Taxes Credits, net AFUDC2 $(0.02) Gross $(0.08) Margin1 $0.06 $(0.01) $0.39 Gross Margin $1.28 Weather $ 0.26 $1.71 $2.77 Federal Tax Reform $ 0.11 $3.07 LFCR $ 0.01 Sales / Usage $ 0.06 Transmission $(0.05) 1 Excludes costs and offsetting operating revenues associated with renewable energy and demand side management programs. 2 Driver adjusted for the deferral impacts of the Four Corners SCRs and Ocotillo Modernization Project. See non-GAAP reconciliation in Appendix. Third Quarter 2020 | 2


2020 EPS GUIDANCE Key Factors & Assumptions as of October 30, 2020 2020 Adjusted gross margin1,2 (operating revenues, net of fuel and purchased power expenses) $2.49 – $2.55 billion • Retail customer growth about 1.5-2.5% • Weather-normalized retail electricity sales volume flat to 1% growth compared to prior year • Assumes actual weather through September 30, 2020 and normal weather for the remainder of the year Adjusted operating and maintenance (O&M)1,2 $870 – $890 million Other operating expenses (depreciation and amortization, deferrals, and taxes other than income taxes) $830 – $850 million Other income (pension and other post-retirement non-service credits, other income and other expense) $80 – $90 million Interest expense, net of allowance for borrowed and equity funds used during construction (Total AFUDC ~$50 million) $200 – $210 million Net income attributable to noncontrolling interests $20 million Effective tax rate 13% Average diluted common shares outstanding 112.9 million EPS Guidance $4.95 – $5.15 1 Excludes O&M of $70 million, and offsetting revenues, associated with renewable energy and demand side management programs. 2 The Covid-19 disconnect suspension and summer disconnection moratorium and revised policies are currently estimated to result in a decrease of approximately $20 million to $30 million of pre-tax income in 2020 depending on certain assumptions, including customer behavior. Third Quarter 2020 | 3


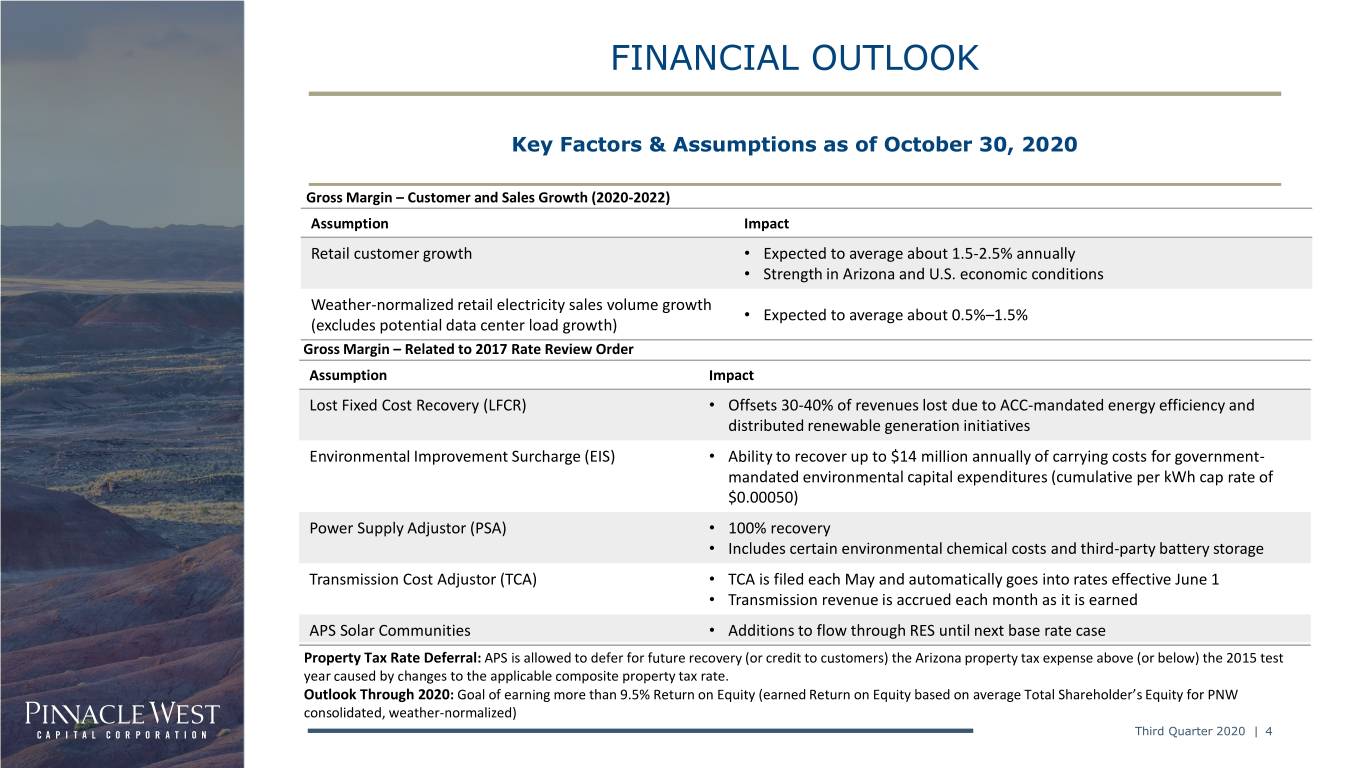
FINANCIAL OUTLOOK Key Factors & Assumptions as of October 30, 2020 Gross Margin – Customer and Sales Growth (2020-2022) Assumption Impact Retail customer growth • Expected to average about 1.5-2.5% annually • Strength in Arizona and U.S. economic conditions Weather-normalized retail electricity sales volume growth • Expected to average about 0.5%–1.5% (excludes potential data center load growth) Gross Margin – Related to 2017 Rate Review Order Assumption Impact Lost Fixed Cost Recovery (LFCR) • Offsets 30-40% of revenues lost due to ACC-mandated energy efficiency and distributed renewable generation initiatives Environmental Improvement Surcharge (EIS) • Ability to recover up to $14 million annually of carrying costs for government- mandated environmental capital expenditures (cumulative per kWh cap rate of $0.00050) Power Supply Adjustor (PSA) • 100% recovery • Includes certain environmental chemical costs and third-party battery storage Transmission Cost Adjustor (TCA) • TCA is filed each May and automatically goes into rates effective June 1 • Transmission revenue is accrued each month as it is earned APS Solar Communities • Additions to flow through RES until next base rate case Property Tax Rate Deferral: APS is allowed to defer for future recovery (or credit to customers) the Arizona property tax expense above (or below) the 2015 test year caused by changes to the applicable composite property tax rate. Outlook Through 2020: Goal of earning more than 9.5% Return on Equity (earned Return on Equity based on average Total Shareholder’s Equity for PNW consolidated, weather-normalized) Third Quarter 2020 | 4


2020 Record Summer Hottest Recorded Summer • 145 days ≥ 100 degrees • 53 days ≥ 110 degrees • 14 days ≥ 115 degrees 6 days with load > previous all-time peak Peak temperature decreased • 2017 - 119 degrees • 2020 - 118 degrees Previous All-Time Peak Record Third Quarter 2020 | 5


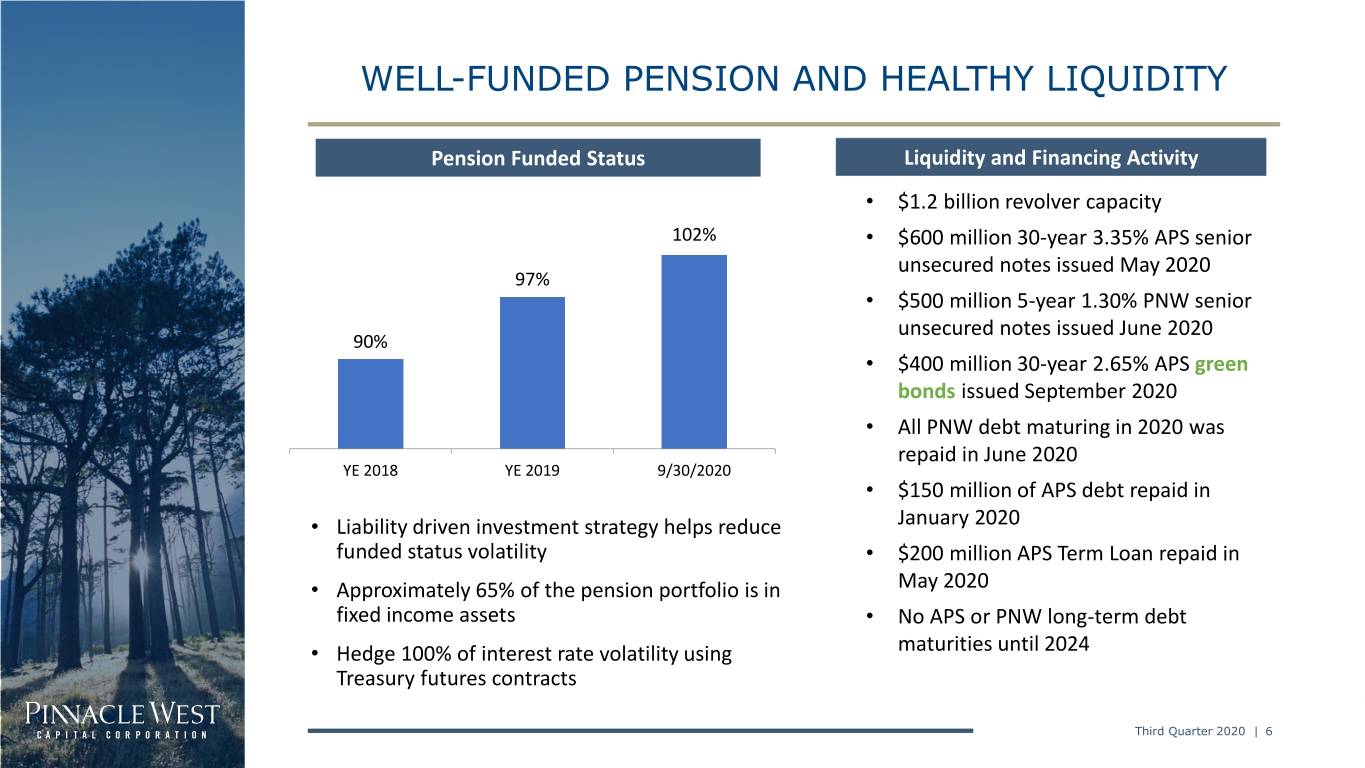
WELL-FUNDED PENSION AND HEALTHY LIQUIDITY Pension Funded Status Liquidity and Financing Activity • $1.2 billion revolver capacity 102% • $600 million 30-year 3.35% APS senior unsecured notes issued May 2020 97% • $500 million 5-year 1.30% PNW senior unsecured notes issued June 2020 90% • $400 million 30-year 2.65% APS green bonds issued September 2020 • All PNW debt maturing in 2020 was repaid in June 2020 YE 2018 YE 2019 9/30/2020 • $150 million of APS debt repaid in • Liability driven investment strategy helps reduce January 2020 funded status volatility • $200 million APS Term Loan repaid in • Approximately 65% of the pension portfolio is in May 2020 fixed income assets • No APS or PNW long-term debt • Hedge 100% of interest rate volatility using maturities until 2024 Treasury futures contracts Third Quarter 2020 | 6


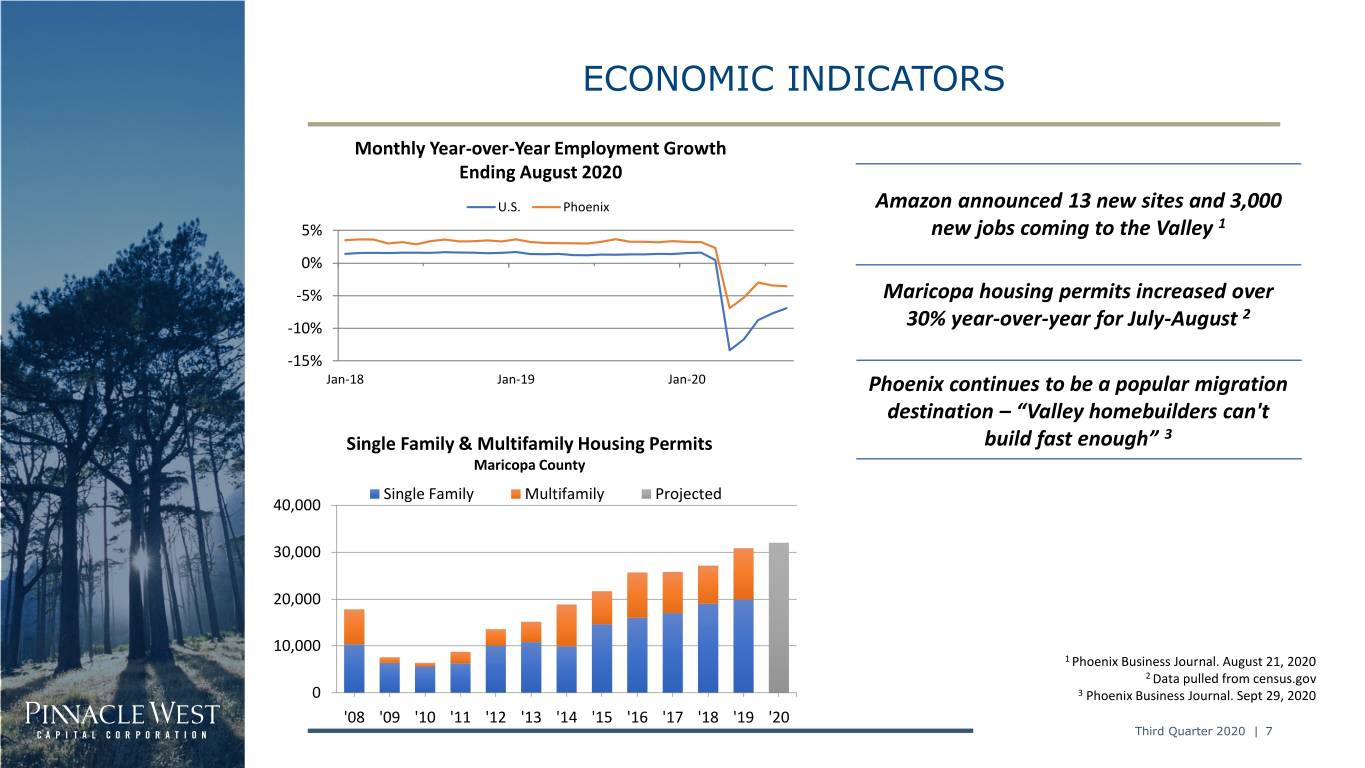
ECONOMIC INDICATORS Monthly Year-over-Year Employment Growth Ending August 2020 U.S. Phoenix Amazon announced 13 new sites and 3,000 5% new jobs coming to the Valley 1 0% -5% Maricopa housing permits increased over 2 -10% 30% year-over-year for July-August -15% Jan-18 Jan-19 Jan-20 Phoenix continues to be a popular migration destination – “Valley homebuilders can't Single Family & Multifamily Housing Permits build fast enough” 3 Maricopa County Single Family Multifamily Projected 40,000 30,000 20,000 10,000 1 Phoenix Business Journal. August 21, 2020 2 Data pulled from census.gov 0 3 Phoenix Business Journal. Sept 29, 2020 '08 '09 '10 '11 '12 '13 '14 '15 '16 '17 '18 '19 '20 Third Quarter 2020 | 7


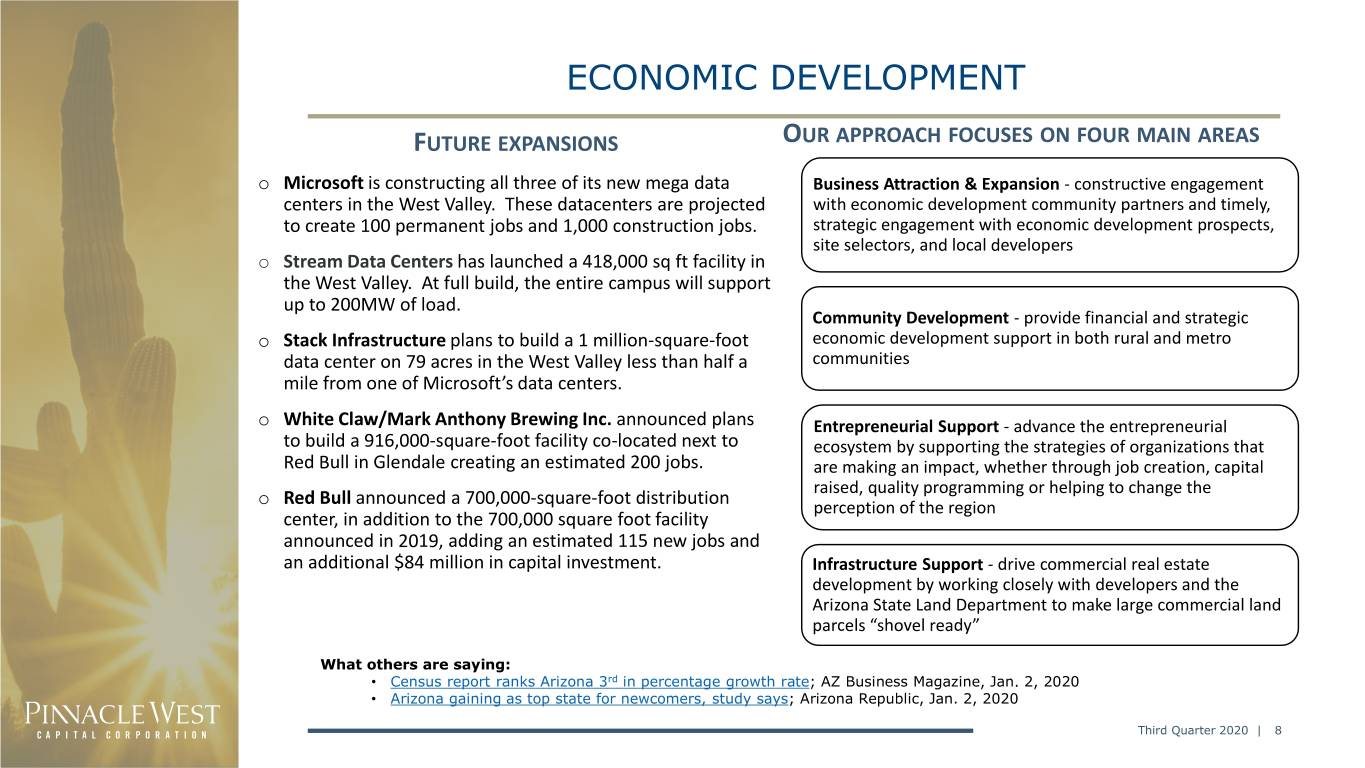
ECONOMIC DEVELOPMENT FUTURE EXPANSIONS OUR APPROACH FOCUSES ON FOUR MAIN AREAS o Microsoft is constructing all three of its new mega data Business Attraction & Expansion - constructive engagement centers in the West Valley. These datacenters are projected with economic development community partners and timely, to create 100 permanent jobs and 1,000 construction jobs. strategic engagement with economic development prospects, site selectors, and local developers o Stream Data Centers has launched a 418,000 sq ft facility in the West Valley. At full build, the entire campus will support up to 200MW of load. Community Development - provide financial and strategic o Stack Infrastructure plans to build a 1 million-square-foot economic development support in both rural and metro data center on 79 acres in the West Valley less than half a communities mile from one of Microsoft’s data centers. o White Claw/Mark Anthony Brewing Inc. announced plans Entrepreneurial Support - advance the entrepreneurial to build a 916,000-square-foot facility co-located next to ecosystem by supporting the strategies of organizations that Red Bull in Glendale creating an estimated 200 jobs. are making an impact, whether through job creation, capital o raised, quality programming or helping to change the Red Bull announced a 700,000-square-foot distribution perception of the region center, in addition to the 700,000 square foot facility announced in 2019, adding an estimated 115 new jobs and an additional $84 million in capital investment. Infrastructure Support - drive commercial real estate development by working closely with developers and the Arizona State Land Department to make large commercial land parcels “shovel ready” What others are saying: • Census report ranks Arizona 3rd in percentage growth rate; AZ Business Magazine, Jan. 2, 2020 • Arizona gaining as top state for newcomers, study says; Arizona Republic, Jan. 2, 2020 Third Quarter 2020 | 8


RATE BASE APS’s revenues come from a regulated retail rate base and meaningful transmission business APS Rate Base Growth Total Approved Rate Base Year-End Generation & Distribution Transmission ACC FERC Long-term Rate Base Guidance: 6-7% Average Annual Growth 20% $2.3 80% $1.7 ACC FERC $1.6 Rate Effective Date 8/19/2017 6/1/2020 Test Year Ended 12/31/20151, 2 12/31/2019 $10.7 $8.6 Rate Base $6.8B $1.7B $7.7 Equity Layer 55.8% 53% Allowed ROE 10.0% 10.75% 2018 2019 2020 2021 2022 1 Adjusted to include post test-year plant in service through 12/31/2016 2 On 10/31/19 APS filed an ACC general rate case with a proposed $8.9B rate Projected base for an adjusted test year ended 6/30/19 Rate base $ in billions, rounded Third Quarter 2020 | 9


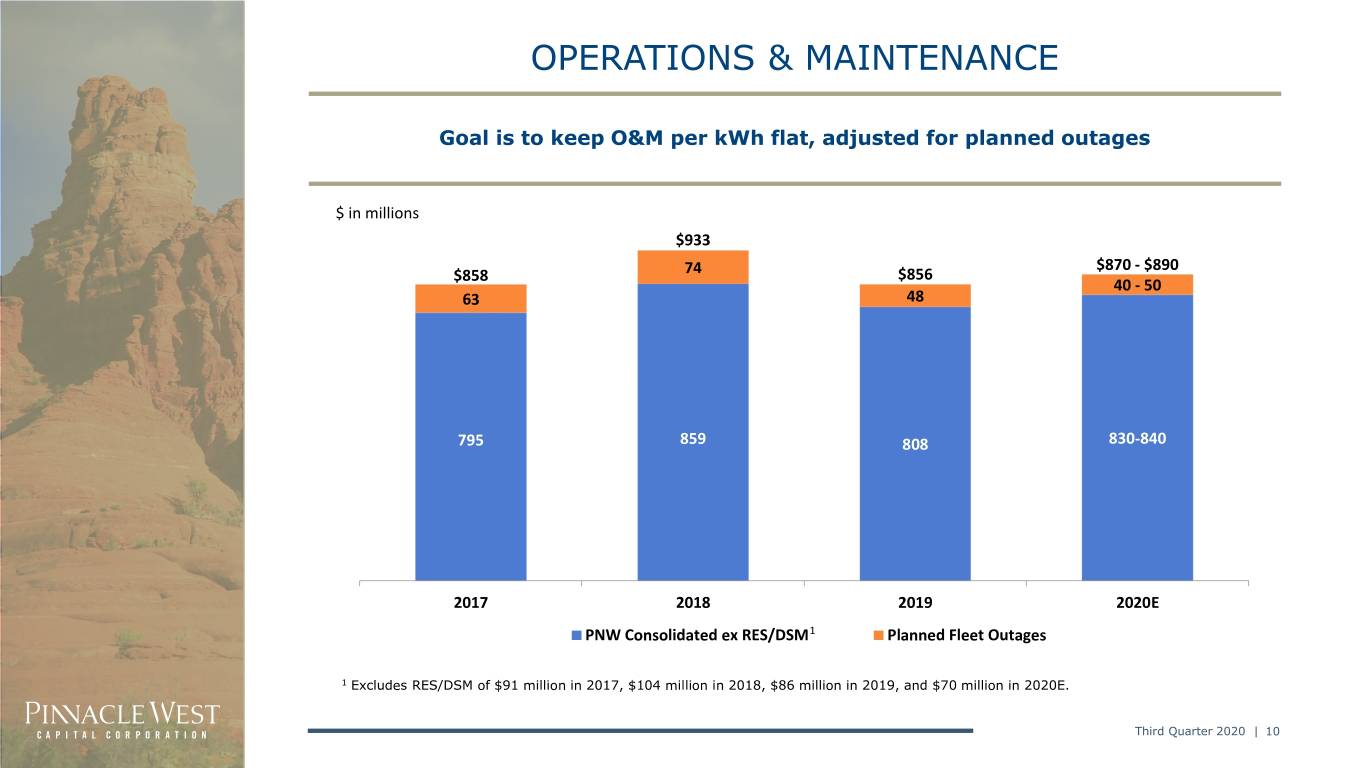
OPERATIONS & MAINTENANCE Goal is to keep O&M per kWh flat, adjusted for planned outages $ in millions $933 $870 - $890 $858 74 $856 40 - 50 63 48 795 859 808 830-840 2017 2018 2019 2020E PNW Consolidated ex RES/DSM1 Planned Fleet Outages 1 Excludes RES/DSM of $91 million in 2017, $104 million in 2018, $86 million in 2019, and $70 million in 2020E. Third Quarter 2020 | 10


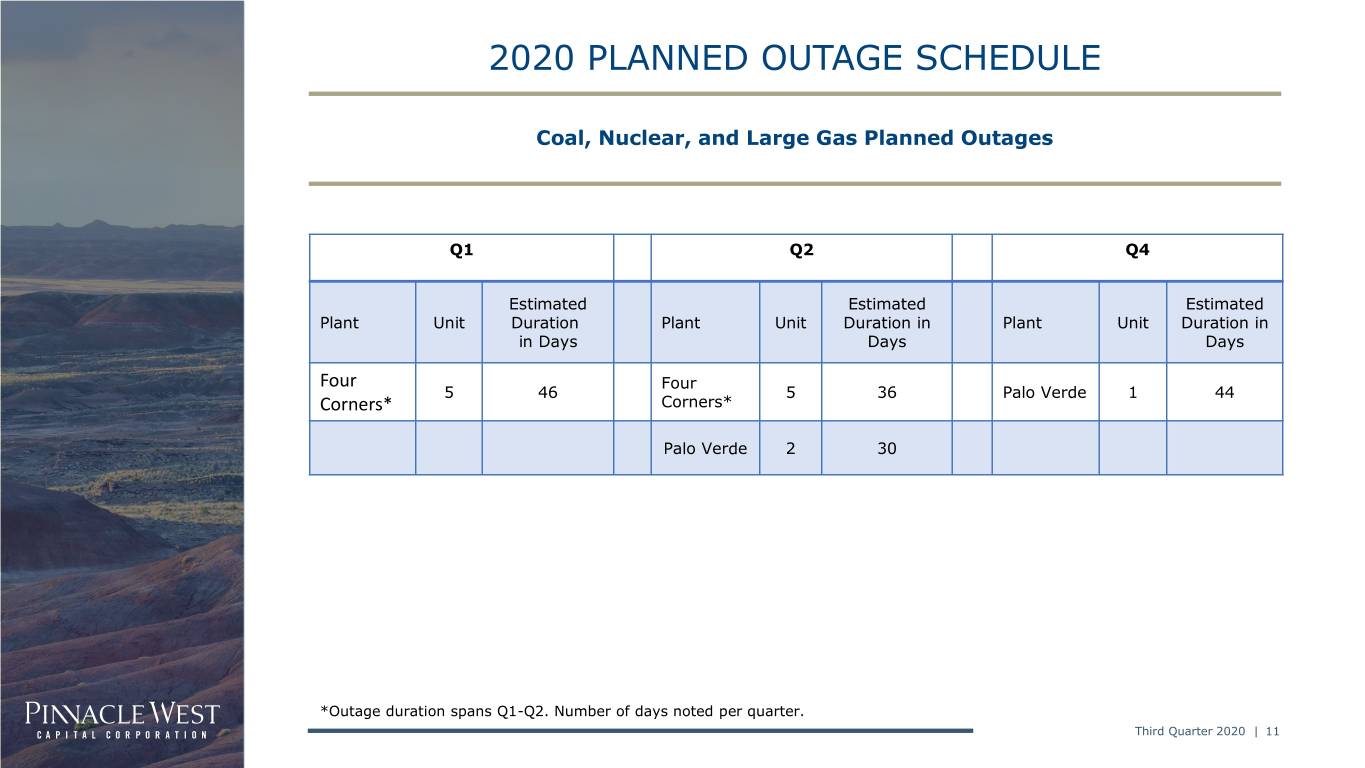
2020 PLANNED OUTAGE SCHEDULE Coal, Nuclear, and Large Gas Planned Outages Q1 Q2 Q4 Estimated Estimated Estimated Plant Unit Duration Plant Unit Duration in Plant Unit Duration in in Days Days Days Four Four 5 46 5 36 Palo Verde 1 44 Corners* Corners* Palo Verde 2 30 *Outage duration spans Q1-Q2. Number of days noted per quarter. Third Quarter 2020 | 11


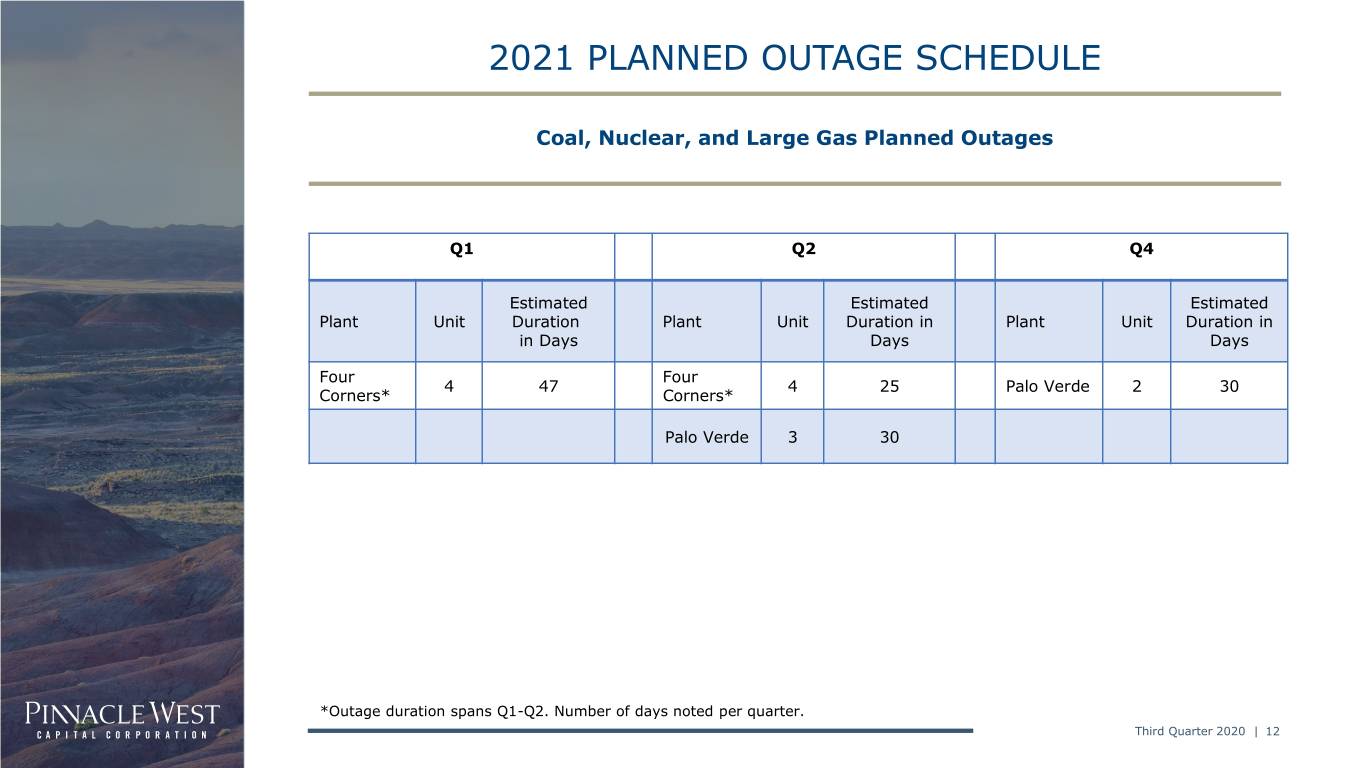
2021 PLANNED OUTAGE SCHEDULE Coal, Nuclear, and Large Gas Planned Outages Q1 Q2 Q4 Estimated Estimated Estimated Plant Unit Duration Plant Unit Duration in Plant Unit Duration in in Days Days Days Four Four 4 47 4 25 Palo Verde 2 30 Corners* Corners* Palo Verde 3 30 *Outage duration spans Q1-Q2. Number of days noted per quarter. Third Quarter 2020 | 12


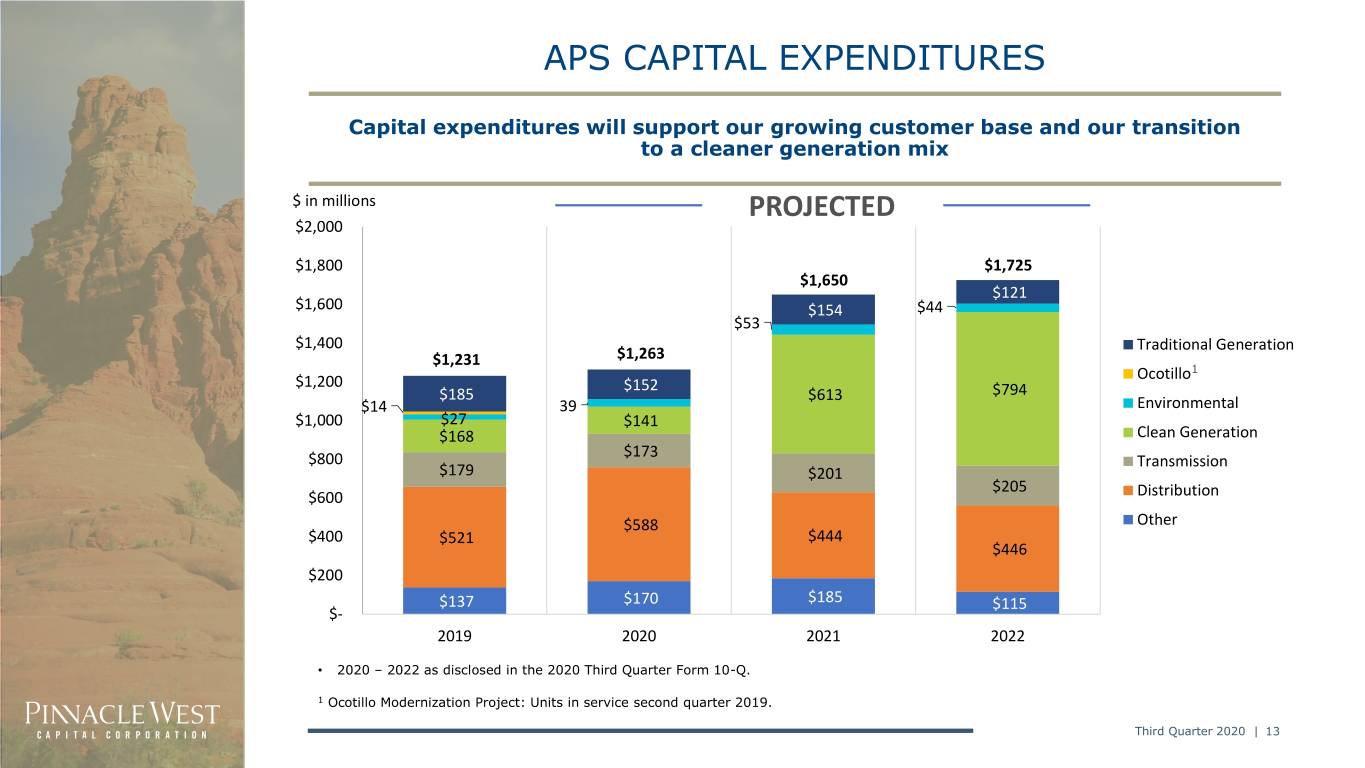
APS CAPITAL EXPENDITURES Capital expenditures will support our growing customer base and our transition to a cleaner generation mix $ in millions PROJECTED $2,000 $1,800 $1,725 $1,650 $121 $1,600 $154 $44 $53 $1,400 Traditional Generation $1,231 $1,263 Ocotillo1 $1,200 $152 $185 $613 $794 $14 39 Environmental $1,000 $27 $141 $168 Clean Generation $173 $800 Transmission $179 $201 $205 $600 Distribution $588 Other $400 $521 $444 $446 $200 $137 $170 $185 $115 $- 2019 2020 2021 2022 • 2020 – 2022 as disclosed in the 2020 Third Quarter Form 10-Q. 1 Ocotillo Modernization Project: Units in service second quarter 2019. Third Quarter 2020 | 13


APPENDIX Third Quarter 2020 | 14


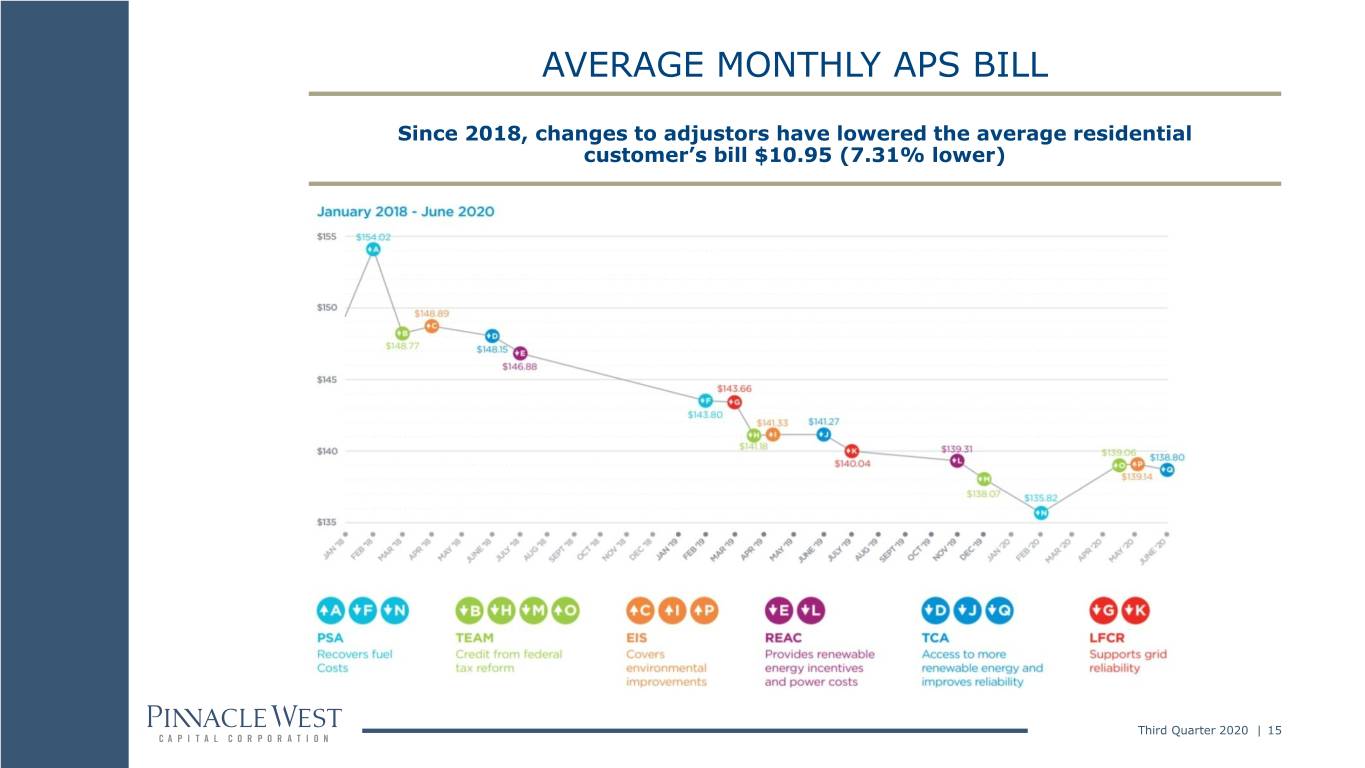
AVERAGE MONTHLY APS BILL Since 2018, changes to adjustors have lowered the average residential customer’s bill $10.95 (7.31% lower) Third Quarter 2020 | 15


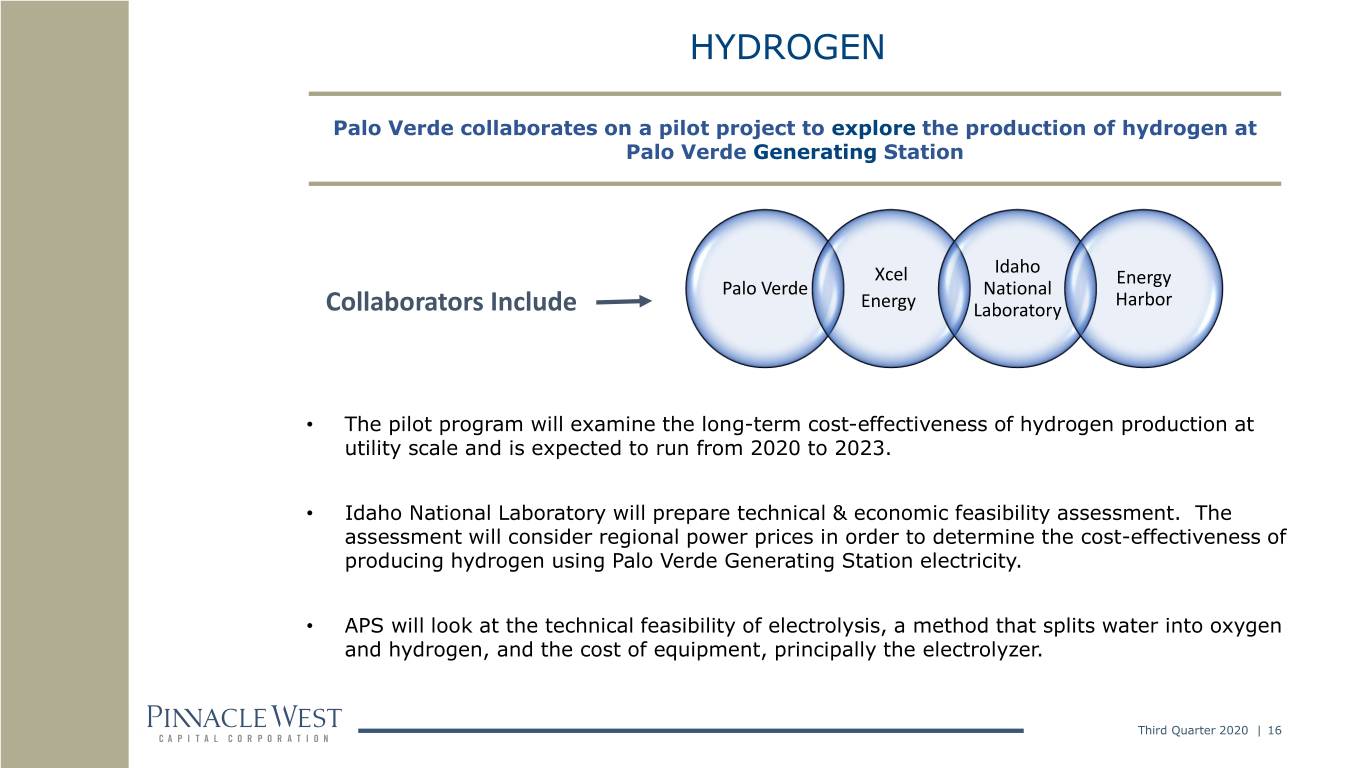
HYDROGEN Palo Verde collaborates on a pilot project to explore the production of hydrogen at Palo Verde Generating Station Idaho Xcel Energy Palo Verde National Harbor Collaborators Include Energy Laboratory • The pilot program will examine the long-term cost-effectiveness of hydrogen production at utility scale and is expected to run from 2020 to 2023. • Idaho National Laboratory will prepare technical & economic feasibility assessment. The assessment will consider regional power prices in order to determine the cost-effectiveness of producing hydrogen using Palo Verde Generating Station electricity. • APS will look at the technical feasibility of electrolysis, a method that splits water into oxygen and hydrogen, and the cost of equipment, principally the electrolyzer. Third Quarter 2020 | 16


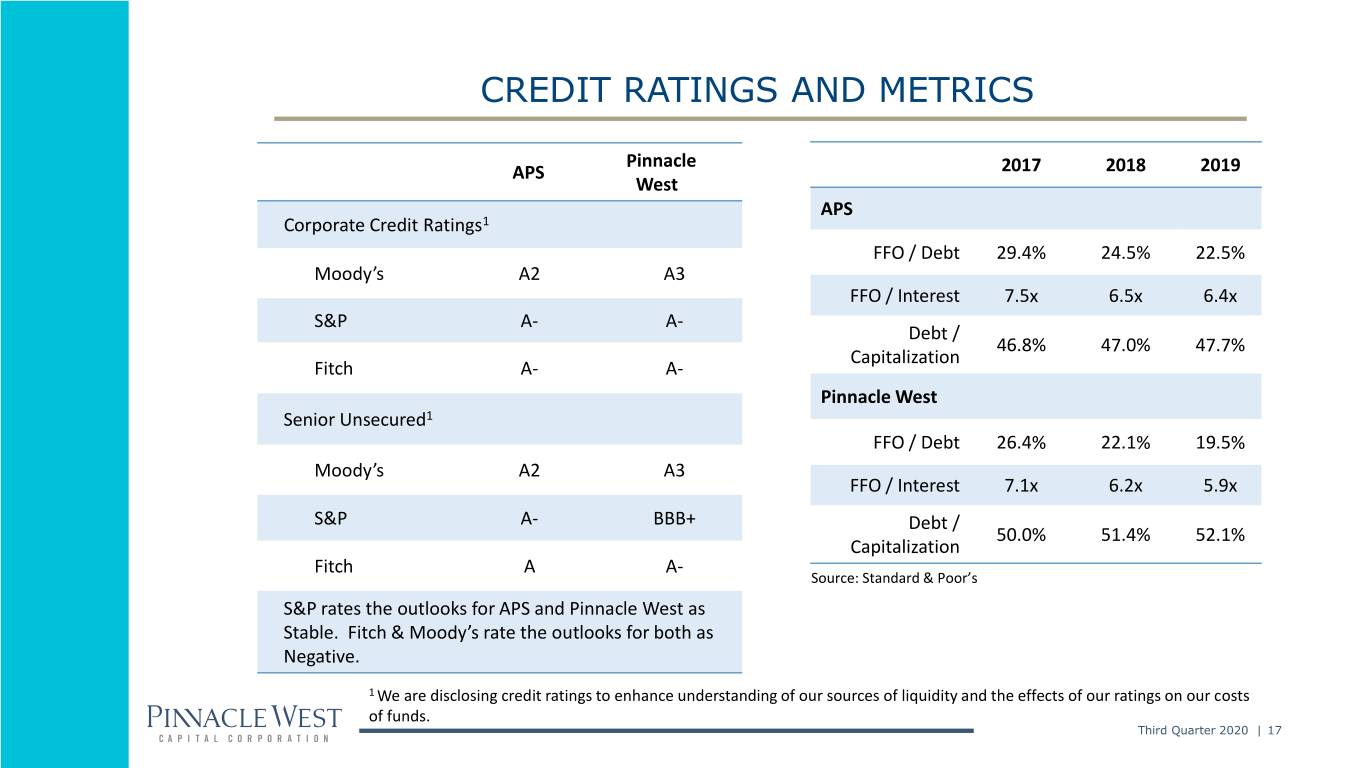
CREDIT RATINGS AND METRICS Pinnacle APS 2017 2018 2019 West APS Corporate Credit Ratings1 FFO / Debt 29.4% 24.5% 22.5% Moody’s A2 A3 FFO / Interest 7.5x 6.5x 6.4x S&P A- A- Debt / 46.8% 47.0% 47.7% Capitalization Fitch A- A- Pinnacle West Senior Unsecured1 FFO / Debt 26.4% 22.1% 19.5% Moody’s A2 A3 FFO / Interest 7.1x 6.2x 5.9x S&P A- BBB+ Debt / 50.0% 51.4% 52.1% Capitalization Fitch A A- Source: Standard & Poor’s S&P rates the outlooks for APS and Pinnacle West as Stable. Fitch & Moody’s rate the outlooks for both as Negative. 1 We are disclosing credit ratings to enhance understanding of our sources of liquidity and the effects of our ratings on our costs of funds. Third Quarter 2020 | 17


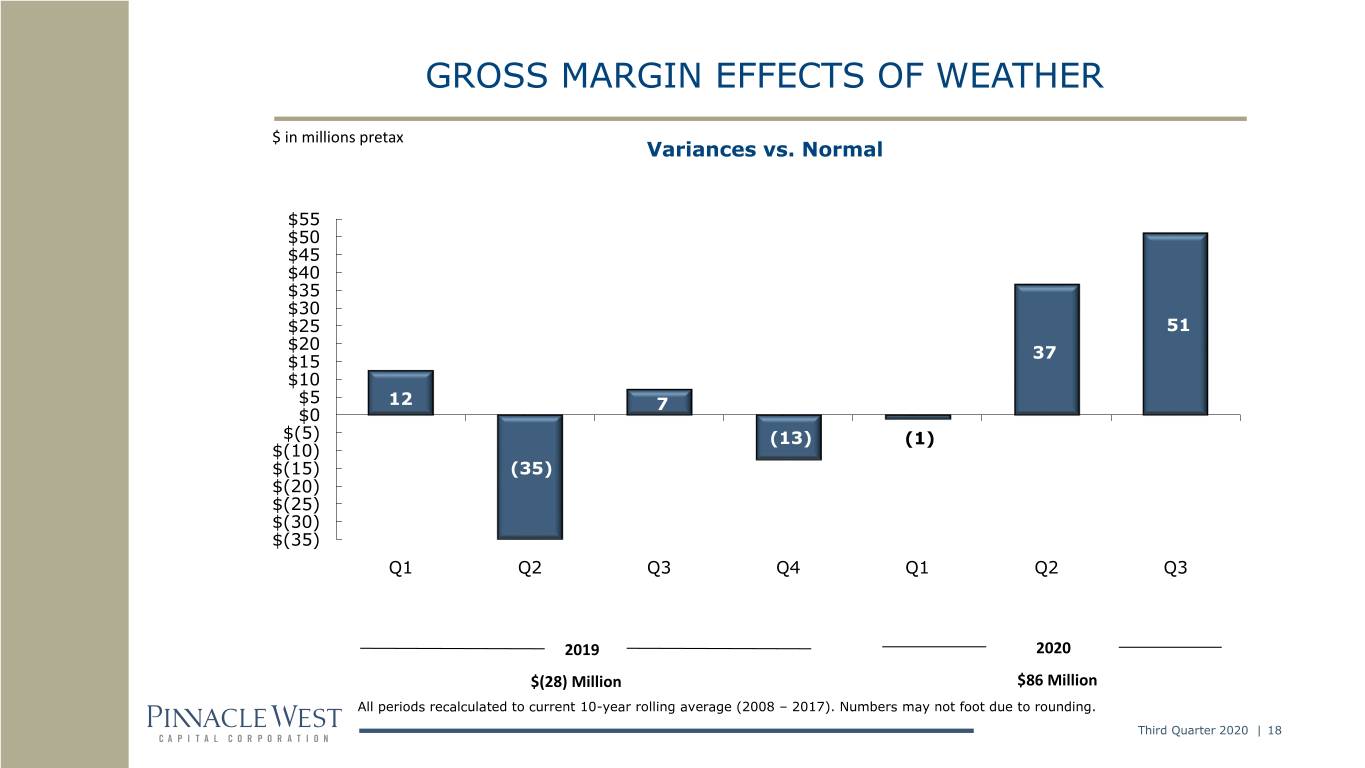
GROSS MARGIN EFFECTS OF WEATHER $ in millions pretax Variances vs. Normal $55 $50 $45 $40 $35 $30 $25 51 $20 37 $15 $10 $5 12 7 $0 $(5) (13) (1) $(10) $(15) (35) $(20) $(25) $(30) $(35) Q1 Q2 Q3 Q4 Q1 Q2 Q3 2019 2020 $(28) Million $86 Million All periods recalculated to current 10-year rolling average (2008 – 2017). Numbers may not foot due to rounding. Third Quarter 2020 | 18


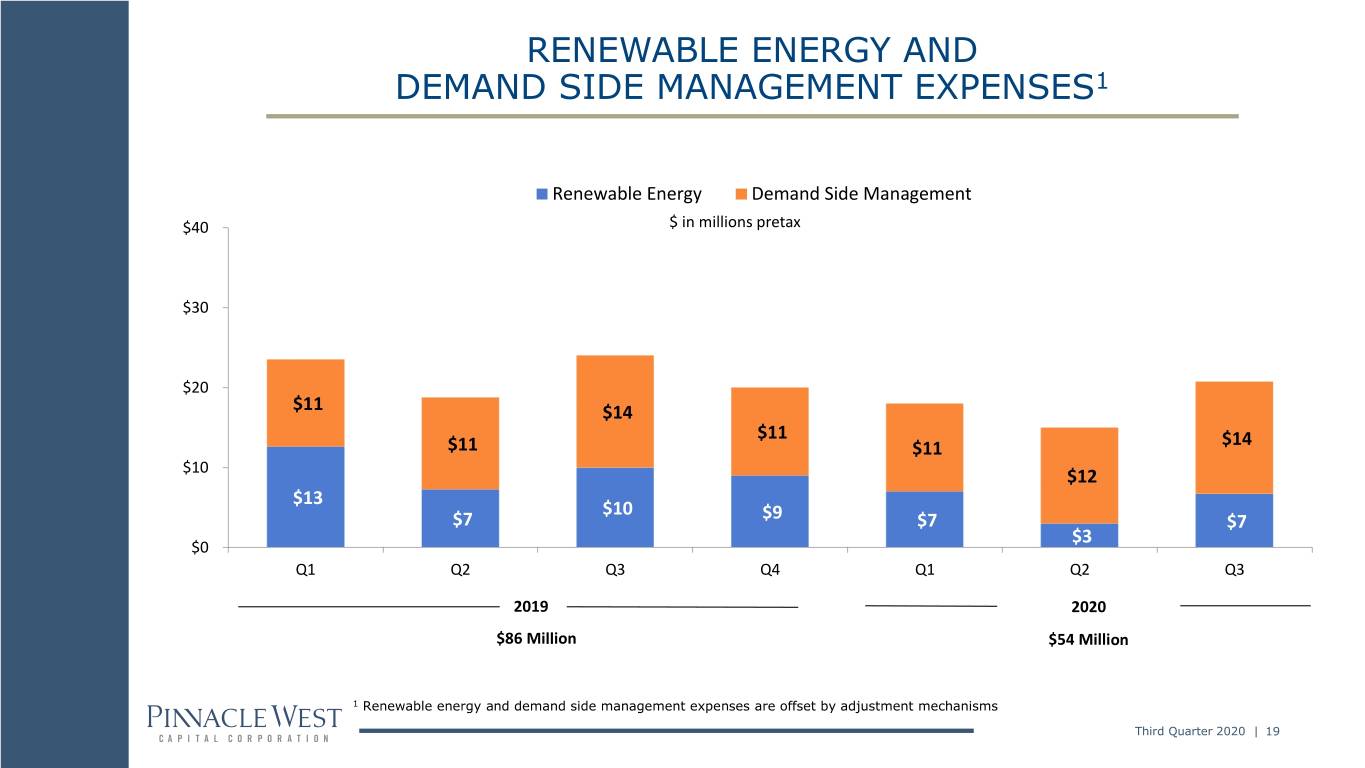
RENEWABLE ENERGY AND DEMAND SIDE MANAGEMENT EXPENSES1 Renewable Energy Demand Side Management $40 $ in millions pretax $30 $20 $11 $14 $11 $11 $11 $14 $10 $12 $13 $10 $7 $9 $7 $7 $3 $0 Q1 Q2 Q3 Q4 Q1 Q2 Q3 2019 2020 $86 Million $54 Million 1 Renewable energy and demand side management expenses are offset by adjustment mechanisms Third Quarter 2020 | 19


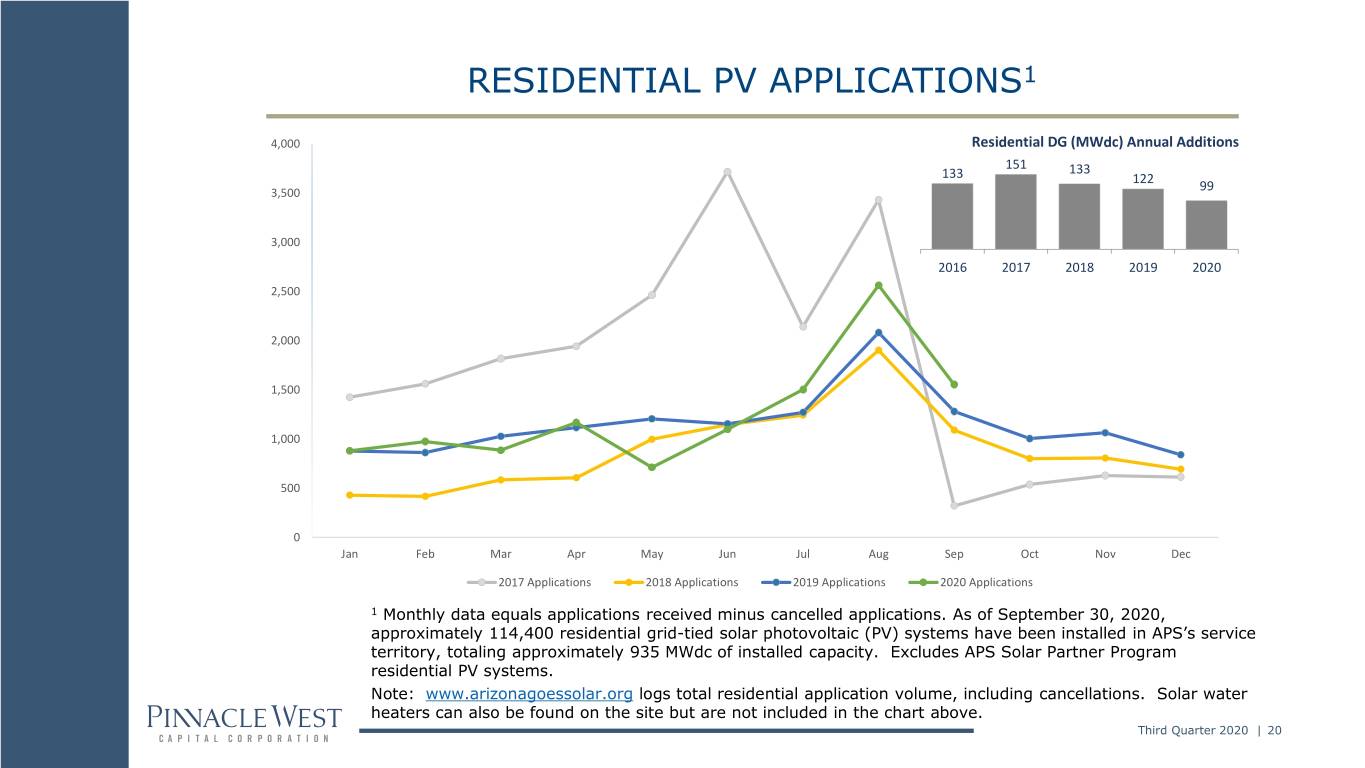
RESIDENTIAL PV APPLICATIONS1 4,000 Residential DG (MWdc) Annual Additions 151 133 133 122 3,500 99 3,000 2016 2017 2018 2019 2020 2,500 2,000 1,500 1,000 500 0 Jan Feb Mar Apr May Jun Jul Aug Sep Oct Nov Dec 2017 Applications 2018 Applications 2019 Applications 2020 Applications 1 Monthly data equals applications received minus cancelled applications. As of September 30, 2020, approximately 114,400 residential grid-tied solar photovoltaic (PV) systems have been installed in APS’s service territory, totaling approximately 935 MWdc of installed capacity. Excludes APS Solar Partner Program residential PV systems. Note: www.arizonagoessolar.org logs total residential application volume, including cancellations. Solar water heaters can also be found on the site but are not included in the chart above. Third Quarter 2020 | 20


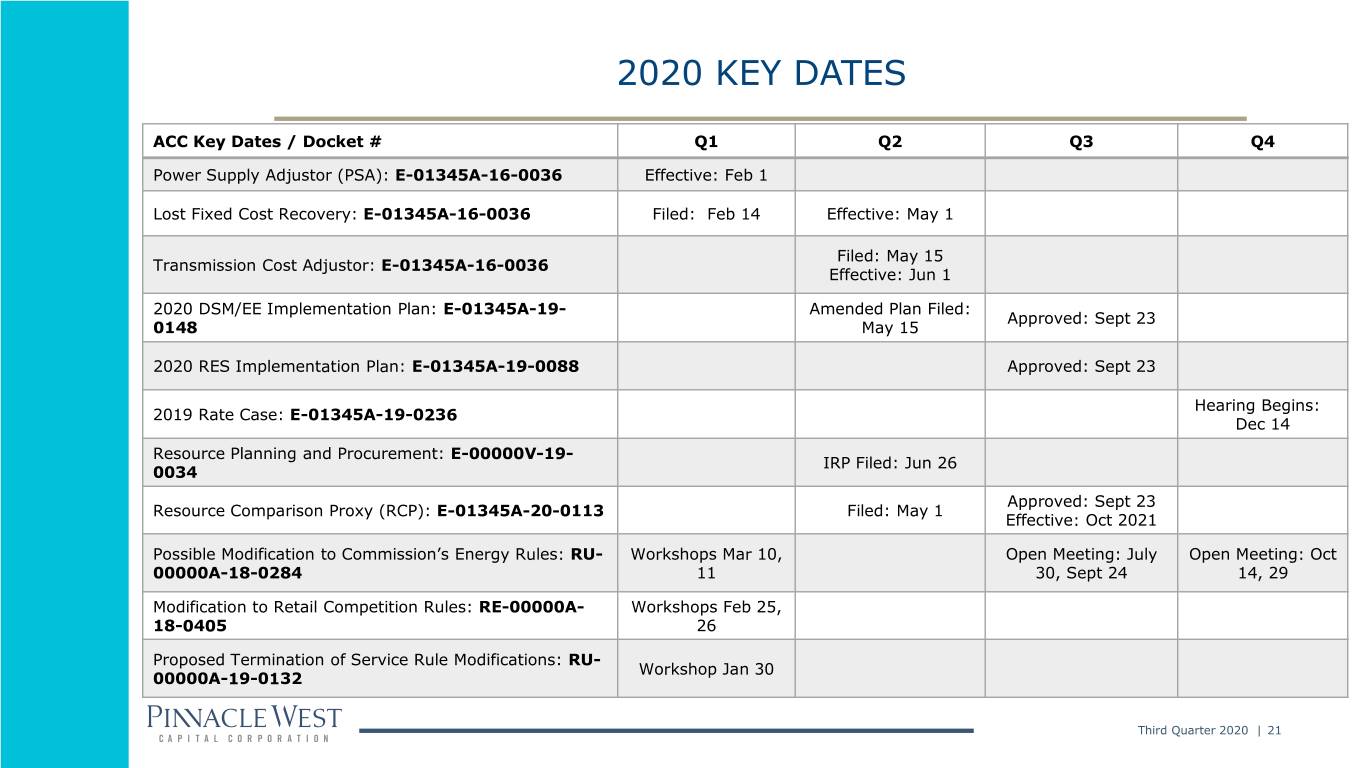
2020 KEY DATES ACC Key Dates / Docket # Q1 Q2 Q3 Q4 Power Supply Adjustor (PSA): E-01345A-16-0036 Effective: Feb 1 Lost Fixed Cost Recovery: E-01345A-16-0036 Filed: Feb 14 Effective: May 1 Filed: May 15 Transmission Cost Adjustor: E-01345A-16-0036 Effective: Jun 1 2020 DSM/EE Implementation Plan: E-01345A-19- Amended Plan Filed: Approved: Sept 23 0148 May 15 2020 RES Implementation Plan: E-01345A-19-0088 Approved: Sept 23 Hearing Begins: 2019 Rate Case: E-01345A-19-0236 Dec 14 Resource Planning and Procurement: E-00000V-19- IRP Filed: Jun 26 0034 Approved: Sept 23 Resource Comparison Proxy (RCP): E-01345A-20-0113 Filed: May 1 Effective: Oct 2021 Possible Modification to Commission’s Energy Rules: RU- Workshops Mar 10, Open Meeting: July Open Meeting: Oct 00000A-18-0284 11 30, Sept 24 14, 29 Modification to Retail Competition Rules: RE-00000A- Workshops Feb 25, 18-0405 26 Proposed Termination of Service Rule Modifications: RU- Workshop Jan 30 00000A-19-0132 Third Quarter 2020 | 21


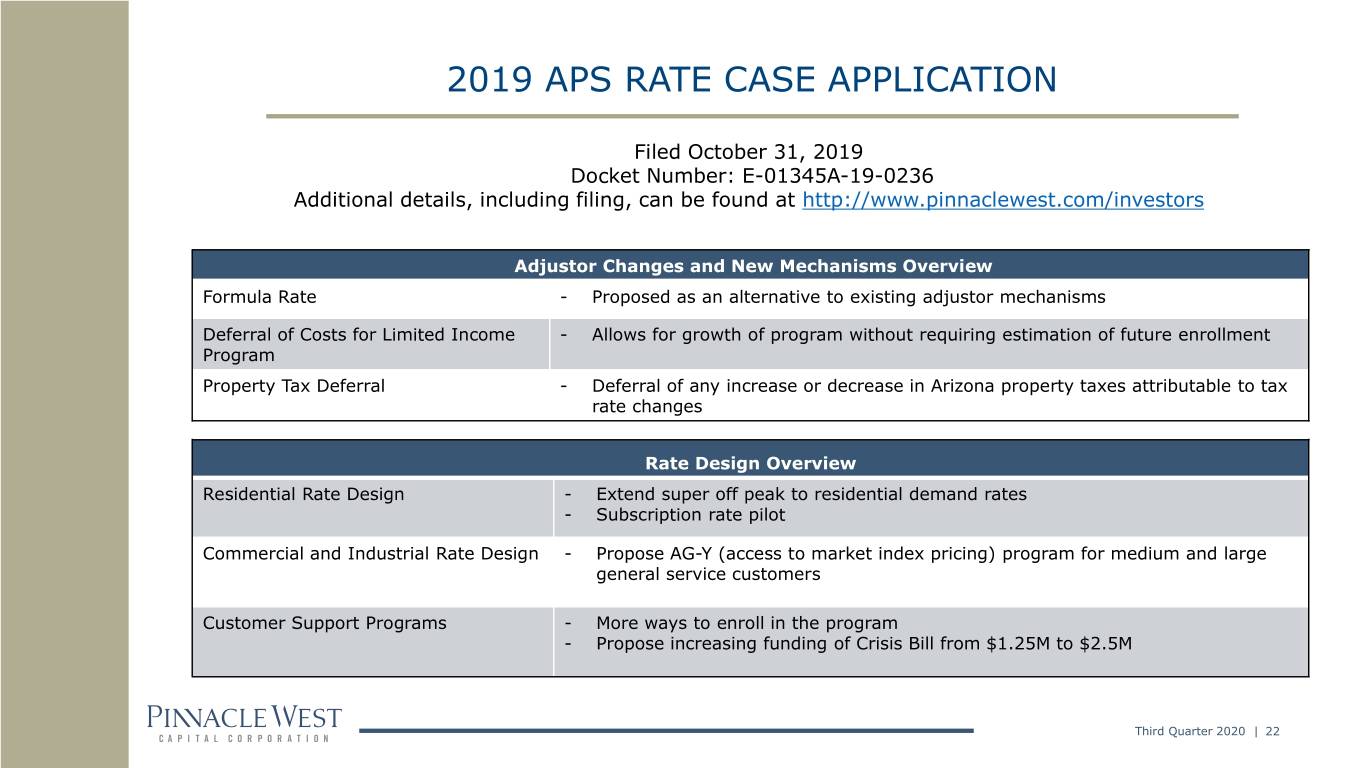
2019 APS RATE CASE APPLICATION Filed October 31, 2019 Docket Number: E-01345A-19-0236 Additional details, including filing, can be found at http://www.pinnaclewest.com/investors Adjustor Changes and New Mechanisms Overview Formula Rate - Proposed as an alternative to existing adjustor mechanisms Deferral of Costs for Limited Income - Allows for growth of program without requiring estimation of future enrollment Program Property Tax Deferral - Deferral of any increase or decrease in Arizona property taxes attributable to tax rate changes Rate Design Overview Residential Rate Design - Extend super off peak to residential demand rates - Subscription rate pilot Commercial and Industrial Rate Design - Propose AG-Y (access to market index pricing) program for medium and large general service customers Customer Support Programs - More ways to enroll in the program - Propose increasing funding of Crisis Bill from $1.25M to $2.5M Third Quarter 2020 | 22


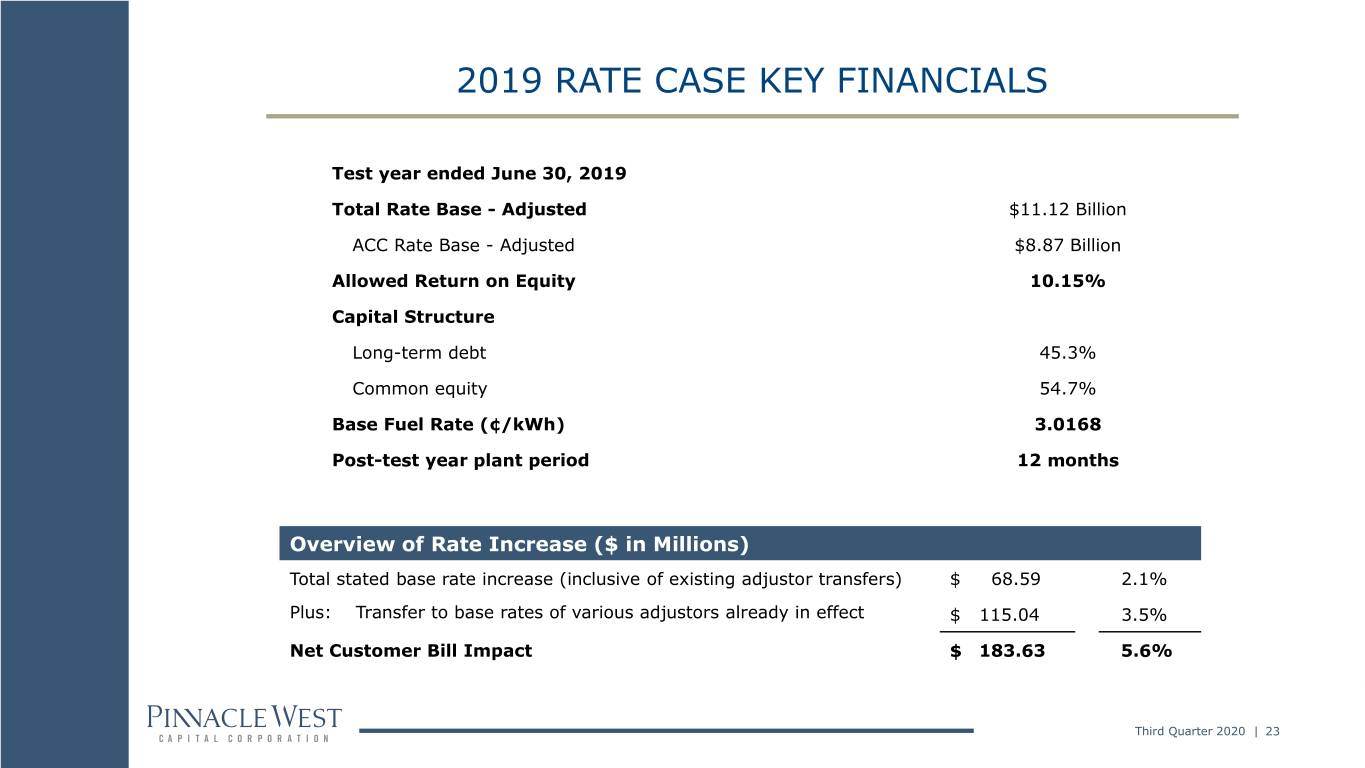
2019 RATE CASE KEY FINANCIALS Test year ended June 30, 2019 Total Rate Base - Adjusted $11.12 Billion ACC Rate Base - Adjusted $8.87 Billion Allowed Return on Equity 10.15% Capital Structure Long-term debt 45.3% Common equity 54.7% Base Fuel Rate (¢/kWh) 3.0168 Post-test year plant period 12 months Overview of Rate Increase ($ in Millions) Total stated base rate increase (inclusive of existing adjustor transfers) $ 68.59 2.1% Plus: Transfer to base rates of various adjustors already in effect $ 115.04 3.5% Net Customer Bill Impact $ 183.63 5.6% Third Quarter 2020 | 23


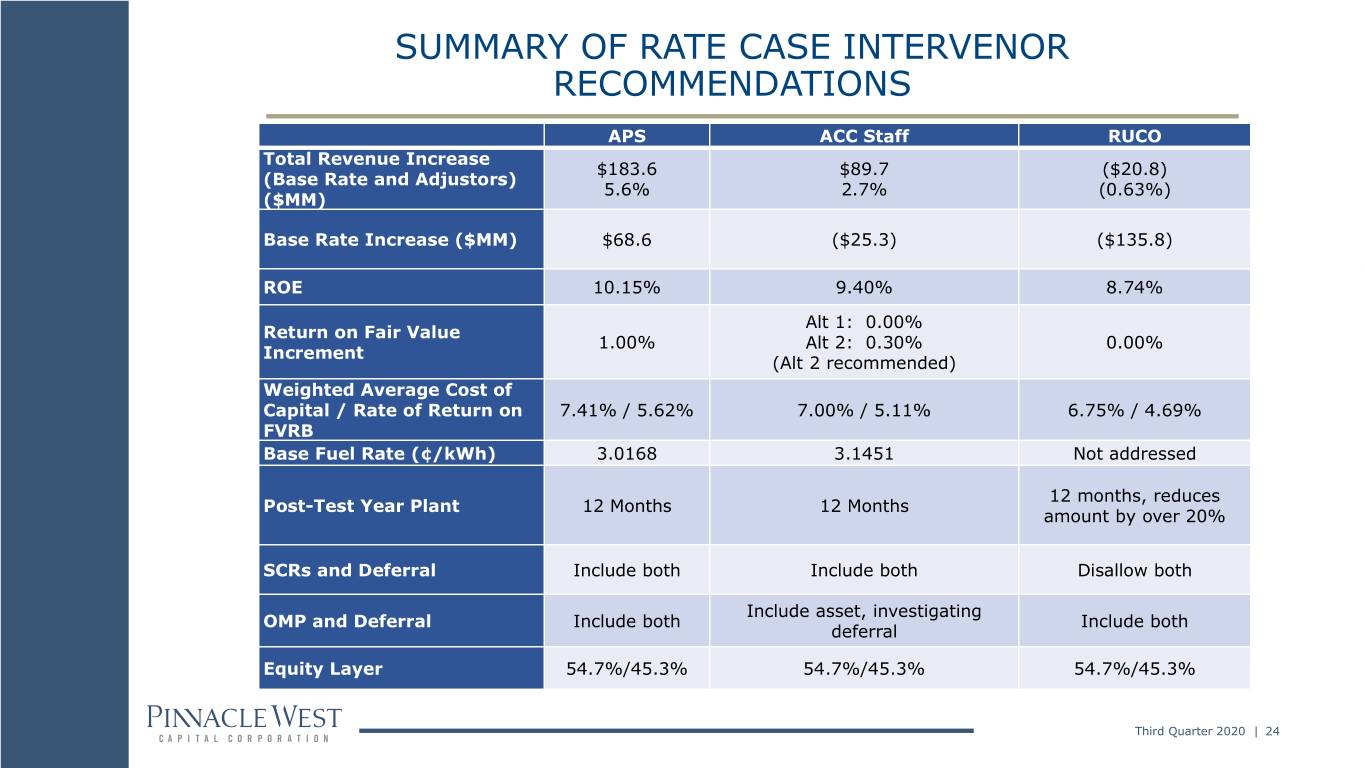
SUMMARY OF RATE CASE INTERVENOR RECOMMENDATIONS APS ACC Staff RUCO Total Revenue Increase $183.6 $89.7 ($20.8) (Base Rate and Adjustors) 5.6% 2.7% (0.63%) ($MM) Base Rate Increase ($MM) $68.6 ($25.3) ($135.8) ROE 10.15% 9.40% 8.74% Alt 1: 0.00% Return on Fair Value 1.00% Alt 2: 0.30% 0.00% Increment (Alt 2 recommended) Weighted Average Cost of Capital / Rate of Return on 7.41% / 5.62% 7.00% / 5.11% 6.75% / 4.69% FVRB Base Fuel Rate (¢/kWh) 3.0168 3.1451 Not addressed 12 months, reduces Post-Test Year Plant 12 Months 12 Months amount by over 20% SCRs and Deferral Include both Include both Disallow both Include asset, investigating OMP and Deferral Include both Include both deferral Equity Layer 54.7%/45.3% 54.7%/45.3% 54.7%/45.3% Third Quarter 2020 | 24


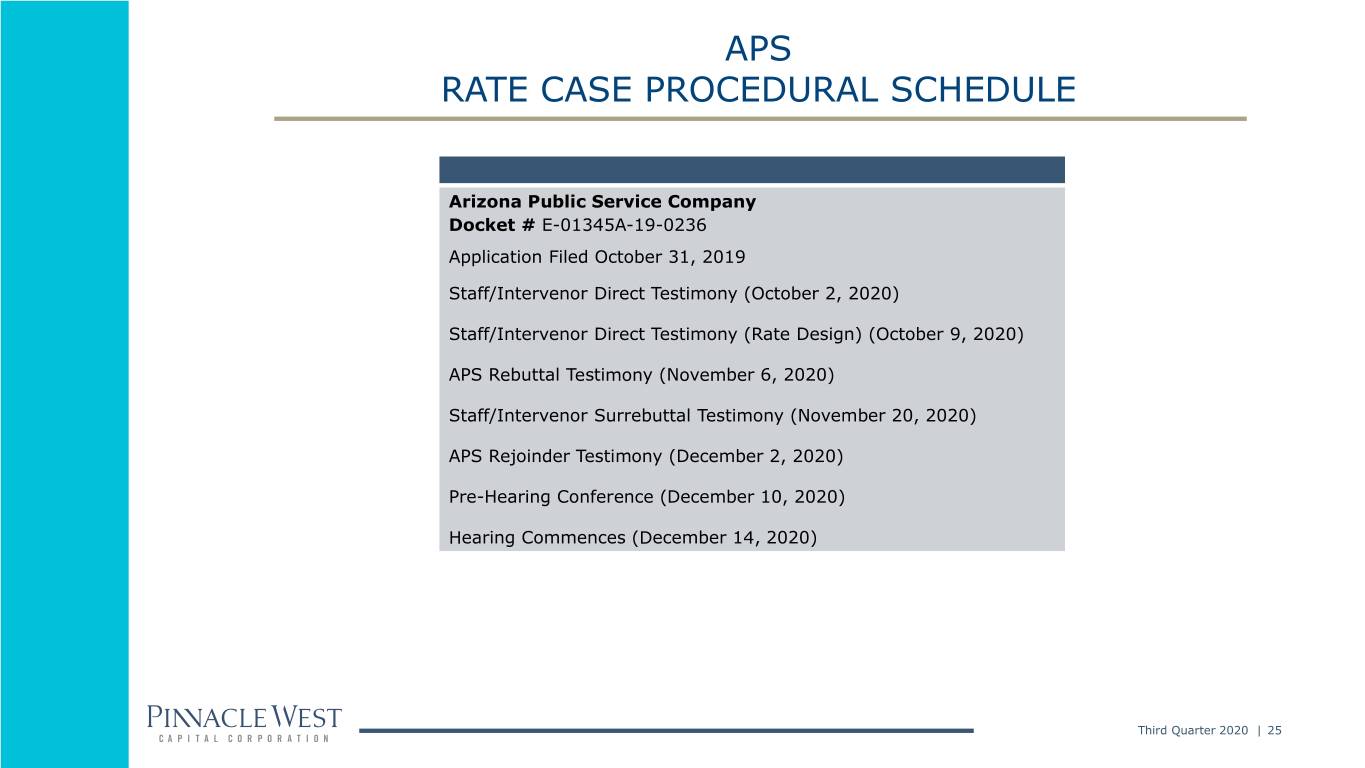
APS RATE CASE PROCEDURAL SCHEDULE Arizona Public Service Company Docket # E-01345A-19-0236 Application Filed October 31, 2019 Staff/Intervenor Direct Testimony (October 2, 2020) Staff/Intervenor Direct Testimony (Rate Design) (October 9, 2020) APS Rebuttal Testimony (November 6, 2020) Staff/Intervenor Surrebuttal Testimony (November 20, 2020) APS Rejoinder Testimony (December 2, 2020) Pre-Hearing Conference (December 10, 2020) Hearing Commences (December 14, 2020) Third Quarter 2020 | 25


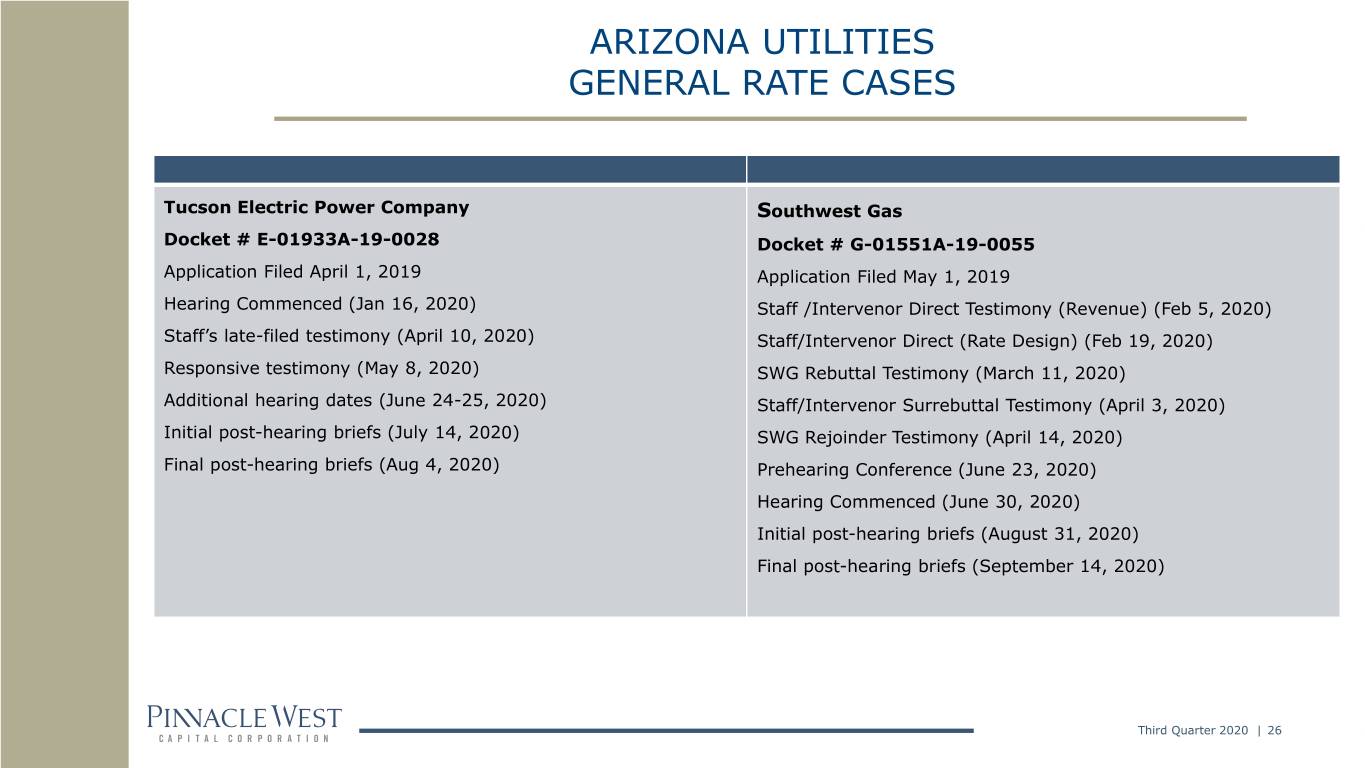
ARIZONA UTILITIES GENERAL RATE CASES Tucson Electric Power Company Southwest Gas Docket # E-01933A-19-0028 Docket # G-01551A-19-0055 Application Filed April 1, 2019 Application Filed May 1, 2019 Hearing Commenced (Jan 16, 2020) Staff /Intervenor Direct Testimony (Revenue) (Feb 5, 2020) Staff’s late-filed testimony (April 10, 2020) Staff/Intervenor Direct (Rate Design) (Feb 19, 2020) Responsive testimony (May 8, 2020) SWG Rebuttal Testimony (March 11, 2020) Additional hearing dates (June 24-25, 2020) Staff/Intervenor Surrebuttal Testimony (April 3, 2020) Initial post-hearing briefs (July 14, 2020) SWG Rejoinder Testimony (April 14, 2020) Final post-hearing briefs (Aug 4, 2020) Prehearing Conference (June 23, 2020) Hearing Commenced (June 30, 2020) Initial post-hearing briefs (August 31, 2020) Final post-hearing briefs (September 14, 2020) Third Quarter 2020 | 26


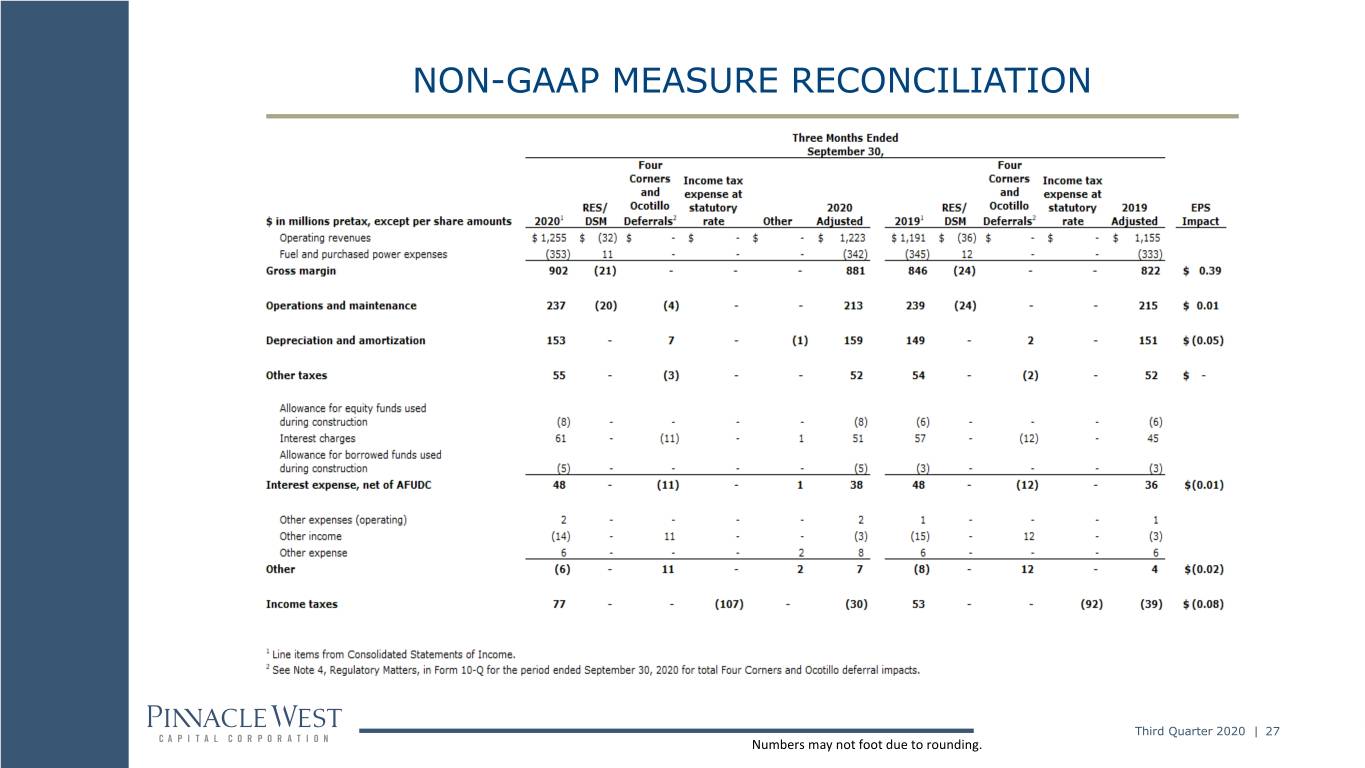
NON-GAAP MEASURE RECONCILIATION Third Quarter 2020 | 27 Numbers may not foot due to rounding.


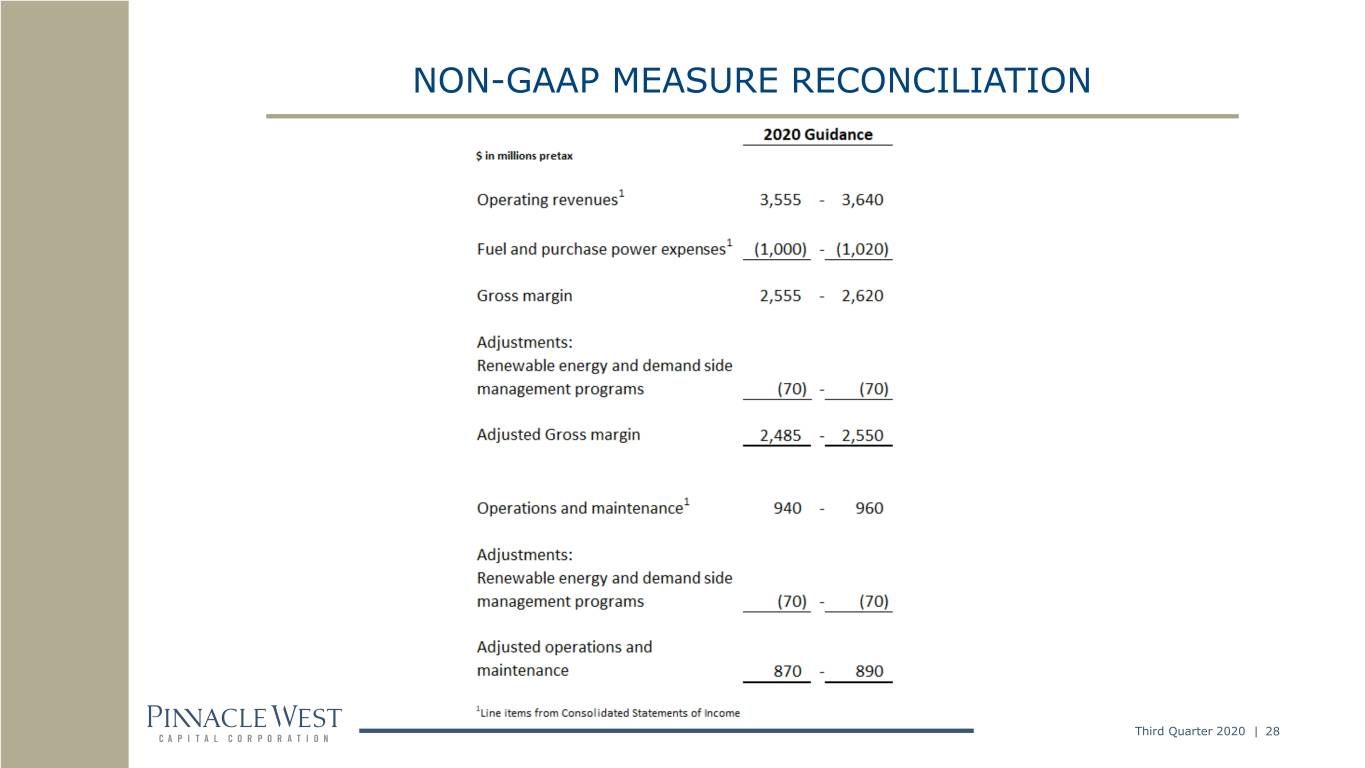
NON-GAAP MEASURE RECONCILIATION Third Quarter 2020 | 28


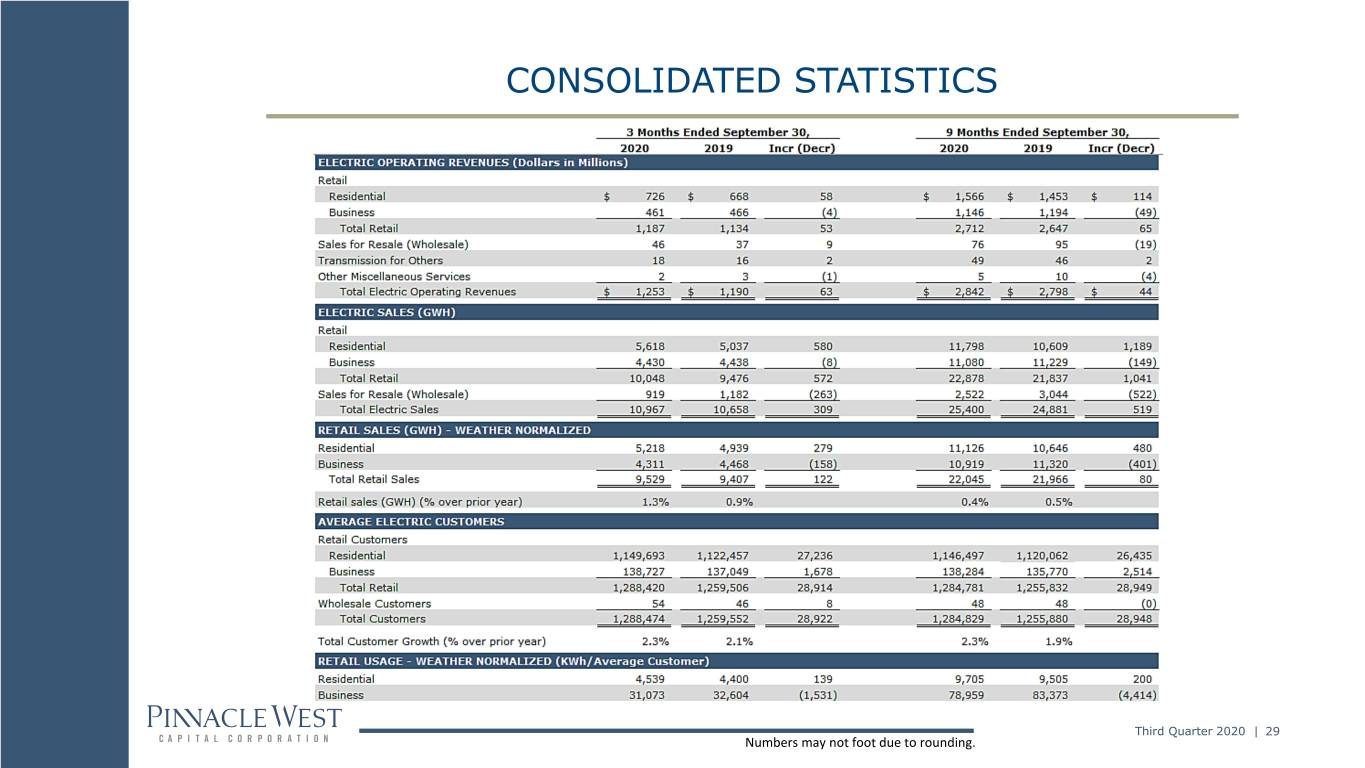
CONSOLIDATED STATISTICS Third Quarter 2020 | 29 Numbers may not foot due to rounding.


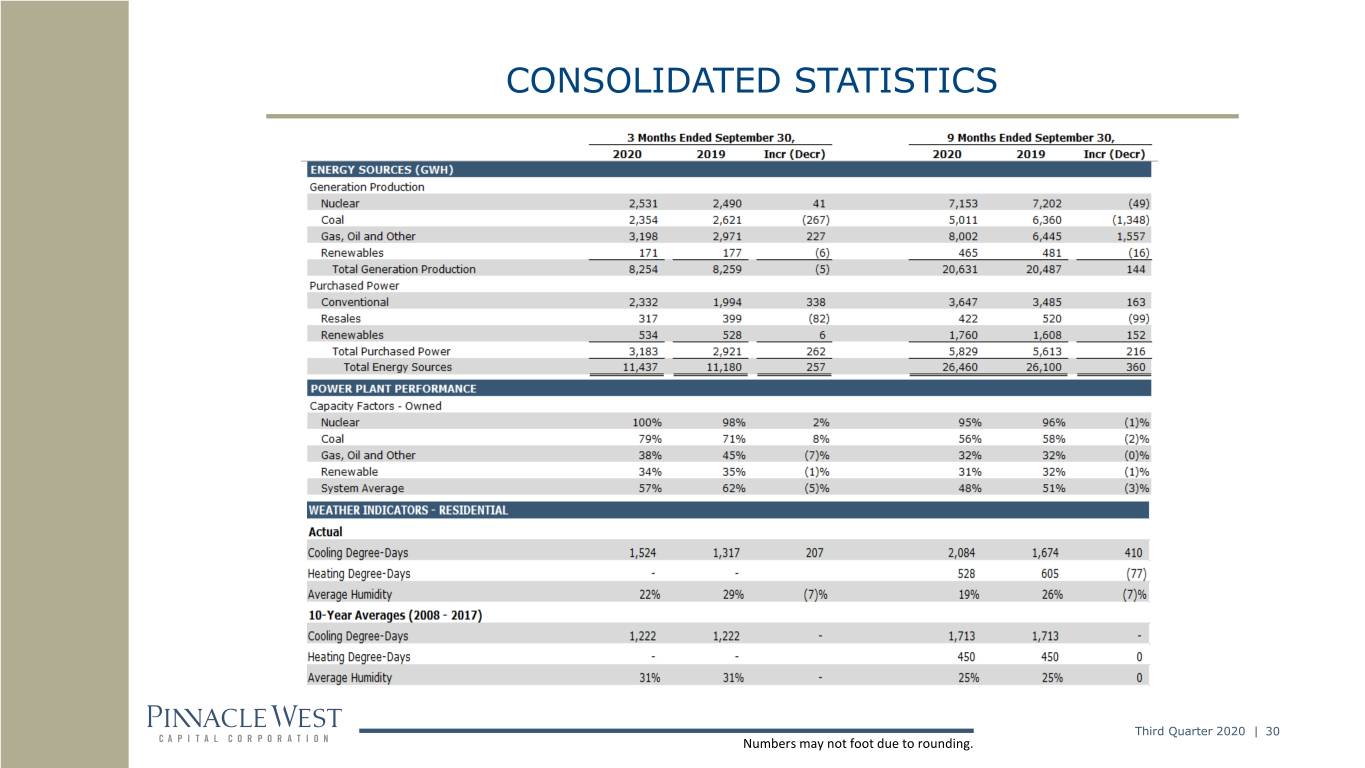
CONSOLIDATED STATISTICS - Third Quarter 2020 | 30 Numbers may not foot due to rounding.