Document
falsefalse2020-08-068-K00007646220000007286 falseAZAZfalsefalsefalsefalse 0000764622 2020-08-06 2020-08-06 0000764622 pnw:ArizonaPublicServiceCompanyMember 2020-08-06 2020-08-06


UNITED STATES
SECURITIES AND EXCHANGE COMMISSION
WASHINGTON, DC 20549 
 

FORM 8-K 
 

CURRENT REPORT
Pursuant to Section 13 or 15(d) of the
Securities Exchange Act of 1934

 
Date of report (Date of earliest event reported):
August 6, 2020


Commission File
Number
 
Exact Name of Each Registrant as specified in its
charter; State of Incorporation; Address; and
Telephone Number
 
IRS Employer
Identification No.
1-8962
 
PINNACLE WEST CAPITAL CORPORATION
 
86-0512431
 
 
(an Arizona corporation)


400 North Fifth Street, P.O. Box 53999


Phoenix
Arizona
85072-3999


(602)
250-1000


1-4473
 
ARIZONA PUBLIC SERVICE COMPANY
 
86-0011170
 
 
(an Arizona corporation)


400 North Fifth Street, P.O. Box 53999


Phoenix
Arizona
85072-3999


(602)
250-1000


Check the appropriate box below if the Form 8-K filing is intended to simultaneously satisfy the filing obligation of the registrant under any of the following provisions:

Written communications pursuant to Rule 425 under the Securities Act (17 CFR 230.425)
 
 
Soliciting material pursuant to Rule 14a-12 under the Exchange Act (17 CFR 240.14a-12)
 
 
Pre-commencement communications pursuant to Rule 14d-2(b) under the Exchange Act (17 CFR 240.14d-2(b))
 
 
Pre-commencement communications pursuant to Rule 13e-4(c) under the Exchange Act (17 CFR 240.13e-4(c))


Securities registered pursuant to Section 12(b) of the Act:
Title of each class
Trading Symbol(s)
Name of each exchange on which registered
Common Stock
PNW
The New York Stock Exchange

Indicate by check mark whether the registrant is an emerging growth company as defined in Rule 405 of the Securities Act of 1933 (17 CFR §230.405) or Rule 12b-2 of the Securities Exchange Act of 1934 (17 CFR §240.12b-2).
Emerging growth company

If an emerging growth company, indicate by check mark if the registrant has elected not to use the extended transition period for complying with any new or revised financial accounting standards provided pursuant to Section 13(a) of the Exchange Act. ¨

This combined Form 8-K is separately filed or furnished by Pinnacle West Capital Corporation and Arizona Public Service Company. Each registrant is filing or furnishing on its own behalf all of the information contained in this Form 8-K that relates to such registrant and, where required, its subsidiaries. Except as stated in the preceding sentence, neither registrant is filing or furnishing any information that does not relate to such registrant, and therefore makes no representation as to any such information.


Item 2.02. Results of Operations and Financial Condition.

The following information is furnished pursuant to Item 2.02.

On August 6, 2020, Pinnacle West Capital Corporation (“Pinnacle West”) issued a press release regarding its financial results for the fiscal quarter ended June 30, 2020 and its earnings outlook for 2020. A copy of the press release is attached hereto as Exhibit 99.1.

Item 7.01. Regulation FD Disclosure.

The following information is furnished pursuant to Item 7.01.

Pinnacle West is providing a copy of the slide presentation made in connection with the quarterly earnings conference call on August 6, 2020. This information contains Pinnacle West operating results for the fiscal quarter ended June 30, 2020, earnings outlook for 2020 and a quarterly consolidated statistical summary. The slide presentation is attached hereto as Exhibit 99.2 and is concurrently being posted to Pinnacle West’s website at www.pinnaclewest.com.
 
Item 9.01.    Financial Statements and Exhibits.

(d)    Exhibits
Exhibit No.
Registrant(s)
Description


99.1
Pinnacle West
Arizona Public Service Company


99.2
Pinnacle West
Arizona Public Service Company


SIGNATURES

Pursuant to the requirements of the Securities Exchange Act of 1934, each registrant has duly caused this report to be signed on its behalf by the undersigned hereunto duly authorized.


PINNACLE WEST CAPITAL CORPORATION
 
 
(Registrant)


Dated: August 6, 2020
 
By: /s/ Theodore N. Geisler    
 
 
Theodore N. Geisler
 
 
Senior Vice President and
 
 
Chief Financial Officer


ARIZONA PUBLIC SERVICE COMPANY
 
 
(Registrant)


Dated: August 6, 2020
 
By: /s/ Theodore N. Geisler    
 
 
Theodore N. Geisler
 
 
Senior Vice President and
 
 
Chief Financial Officer


a2q2020earningsfinal0_image1.jpg
FOR IMMEDIATE RELEASE
August 6, 2020
Media Contact:
Analyst Contact:
Alan Bunnell (602) 250-3376
Stefanie Layton (602) 250-4541
 
Website:
pinnaclewest.com
 

PINNACLE WEST REPORTS 2020 SECOND-QUARTER RESULTS

Return of triple-digit temperatures, record heat drives higher quarter-over-quarter earnings
COVID-19 impact on sales partially offset by Lean efforts and continued cost management
Customer Support Fund expanded to provide more relief to customers impacted by pandemic

PHOENIX – Pinnacle West Capital Corp. (NYSE: PNW) today reported consolidated net income attributable to common shareholders of $193.6 million, or $1.71 per diluted share of common stock, for the quarter ended June 30, 2020. This result compares with earnings of $144.1 million, or $1.28 per share, in the same 2019 period.

Hotter-than-normal weather was the primary driver in the quarter-over-quarter improvement, increasing revenues, net of fuel and purchased power costs, by $48 million (after-tax), or $0.43 per share. Lower operations and maintenance expenses also contributed to the company’s bottom line, partially offsetting impacts of the COVID-19 pandemic.

“Like many electric utilities, weather is a major factor in our business. The dramatic contrast between Arizona’s temperatures in second-quarter 2020 compared to the same time last year is reflected in the results we are reporting today,”
said Pinnacle West Chairman, President and Chief Executive Officer Jeff Guldner. “Excluding the substantial impact of weather on our results, sales were down year-over-year primarily due to declines in retail energy sales and business closures amid the pandemic. During this challenging time for Arizona, our employees continue to innovate and lower costs, and we are making more support and pandemic relief available to our customers and communities.”
a2q2020earningsfinal0_image2.gif

Temperatures Set New Records

Some of the quarter’s daily high temperatures in APS service territory beat or matched previous records not seen in more than a century. According to the National Weather Service, the period’s


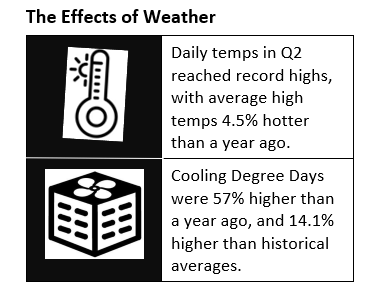
average high temperature was 97.4 degrees – an increase of 4.5% over 2019’s quarter and 2.2% over 10-year historical averages. By comparison, second-quarter 2019 included the mildest month of May Arizona had experienced in 40 years, which was reflected in customers’ lower energy use and a significant decrease in operating revenues.

The number of residential cooling degree-days (a utility’s measure of the effects of weather) increased 57% versus the year-ago period and were 14.1% higher than historical 10-year averages. In fact, May 2020 had more cooling degree-days than in any May since 2009, while only three years since 1974 have produced more cooling degree-days during the month.

COVID-19, however, continued to have a negative impact on retail sales and revenues. With some businesses still closed or operating at partial capacity, retail energy sales (excluding the impacts of weather) were down 1.3%, or $0.10 per share, compared to last year’s second quarter. For the period March 13 to July 28, overall weather-normalized sales were down about 1% year over year.

Operationally, Guldner said APS employees continue to execute well, ensuring reliable customer service amidst extreme summer temperatures and increased customer demand. On July 30, customers set an all-time record peak demand of 7,659 megawatts, eclipsing the previous record of 7,363 MW set in June 2017.

Employees Reduce Costs to Customers’ Benefit
In addition to the effects of weather, 2020 second-quarter results positively reflect customer growth of 2.4% and lower O&M expenses. Using Lean principles introduced in 2019, the company continues to focus on employee-led projects and activities to create and capture cost savings.

For example, the Procurement Operations team delivered significant savings by negotiating lower prices with vendors, maximizing the competitive bidding process, and driving efficiency gains within existing vendor contracts. These efforts, along with negotiating early pay discounts with suppliers, have contributed about $5 million in customer affordability savings through the second quarter. Altogether, employees have been challenged to increase efficiency and decrease costs by $20 million this year alone.

New Report Describes Pathways to a Clean, Sustainable Energy Future
Looking to the future, Guldner added that the company is focused on achieving a constructive regulatory outcome in its current rate case, as well as realizing its previously announced Clean Energy Commitment goal of 100% carbon-free electricity by 2050 – while also maintaining affordable prices for a customer base that is among the fastest-growing in the nation.

A report posted to the company’s website in June provides more details on pathways to achieving this future, including the 2030 target of achieving a 65% clean energy resource mix and a commitment to end use of coal-fired generation by 2031.

“Our clean energy objectives are both ambitious and achievable,” Guldner said. “With a combination of the right technologies, collaborative partnerships and a supportive policy environment, we can and will deliver a carbon-free energy future while maintaining affordability for our customers.”

More COVID-19 Support Offered to Customers through Difficult Times
As previously announced, APS acted early to support customers and communities impacted by COVID-19, pledging $8 million in pandemic relief – one of the largest commitments of any utility in the country. This support includes a robust Customer Support Fund to provide direct assistance to APS customers struggling to pay their bills.


In the second quarter, this fund was increased to help more residential customers with $100 bill credits, and to offer qualifying small businesses with up to $1,000 in bill credits. As of July 29, the Customer Support Fund has provided more than $1.8 million of bill relief to APS customers. 

A full list of the company’s actions in response to the pandemic is available on the Pinnacle West website, and APS customers are encouraged to visit aps.com/COVID19 for up-to-date details on available resources and support.

Financial Outlook
While the company cannot predict the duration and longer-term impacts of the ongoing COVID-19 pandemic, as of today Pinnacle West continues to believe its 2020 consolidated earnings guidance of $4.75 to $4.95 per diluted share is still achievable.

Key factors and assumptions underlying the 2020 outlook can be found in the second-quarter 2020 earnings presentation slides at pinnaclewest.com/investors.

Conference Call and Webcast
Pinnacle West invites interested parties to listen to the live webcast of management’s conference call to discuss 2020 second-quarter results, as well as recent developments, at noon ET (9 a.m. Arizona time) today, Aug. 6. The webcast can be accessed at pinnaclewest.com/presentations and will be available for replay on the website for 30 days. To access the live conference call by telephone, dial (877) 407-8035 or (201) 689-8035 for international callers. A replay of the call also will be available at pinnaclewest.com/presentations or by telephone until 11:59 p.m. ET, Thursday, Aug. 13, 2020, by calling (877) 481-4010 in the U.S. and Canada or (919) 882-2331 internationally and entering passcode 35575.

General Information
Pinnacle West Capital Corp., an energy holding company based in Phoenix, has consolidated assets of approximately $19 billion, about 6,300 megawatts of generating capacity, and 6,200 employees in Arizona and New Mexico. Through its principal subsidiary, Arizona Public Service, the company provides retail electricity service to nearly 1.3 million Arizona homes and businesses. For more information about Pinnacle West, visit the company’s website at pinnaclewest.com.

Earnings per share amounts in this news release are based on average diluted common shares outstanding. For more information on Pinnacle West’s operating statistics and earnings, please visit pinnaclewest.com/investors.

FORWARD-LOOKING STATEMENTS

This press release contains forward-looking statements based on our current expectations, including statements regarding our earnings guidance and financial outlook and goals. These forward-looking statements are often identified by words such as “estimate,” “predict,” “may,” “believe,” “plan,” “expect,” “require,” “intend,” “assume,” “project,” "anticipate," "goal," "seek," "strategy," "likely," "should," "will," "could," and similar words. Because actual results may differ materially from expectations, we caution readers not to place undue reliance on these statements. A number of factors could cause future results to differ materially from historical results, or from outcomes currently expected or sought by Pinnacle West or APS. These factors include, but are not limited to:
the potential effects of the continued COVID-19 pandemic, including, but not limited to, demand for energy, economic growth, our employees and contractors, supply chain, expenses, capital markets, capital projects, operations and maintenance activities, uncollectable accounts, liquidity, cash flows, or other unpredictable events;


our ability to manage capital expenditures and operations and maintenance costs while maintaining high reliability and customer service levels;
variations in demand for electricity, including those due to weather, seasonality, the general economy or social conditions, customer and sales growth (or decline), the effects of energy conservation measures and distributed generation, and technological advancements;
power plant and transmission system performance and outages;
competition in retail and wholesale power markets;
regulatory and judicial decisions, developments and proceedings;
new legislation, ballot initiatives and regulation, including those relating to environmental requirements, regulatory policy, nuclear plant operations and potential deregulation of retail electric markets;
fuel and water supply availability;
our ability to achieve timely and adequate rate recovery of our costs, including returns on and of debt and equity capital investment;
our ability to meet renewable energy and energy efficiency mandates and recover related costs;
risks inherent in the operation of nuclear facilities, including spent fuel disposal uncertainty;
current and future economic conditions in Arizona, including in real estate markets;
the direct or indirect effect on our facilities or business from cybersecurity threats or intrusions, data security breaches, terrorist attack, physical attack, severe storms, droughts, or other catastrophic events, such as fires, explosions, pandemic health events, or similar occurrences;
the development of new technologies which may affect electric sales or delivery;
the cost of debt and equity capital and the ability to access capital markets when required;
environmental, economic and other concerns surrounding coal-fired generation, including regulation of greenhouse gas emissions;
volatile fuel and purchased power costs;
the investment performance of the assets of our nuclear decommissioning trust, pension, and other post-retirement benefit plans and the resulting impact on future funding requirements;
the liquidity of wholesale power markets and the use of derivative contracts in our business;
potential shortfalls in insurance coverage;
new accounting requirements or new interpretations of existing requirements;
generation, transmission and distribution facility and system conditions and operating costs;
the ability to meet the anticipated future need for additional generation and associated transmission facilities in our region;
the willingness or ability of our counterparties, power plant participants and power plant land owners to meet contractual or other obligations or continue or discontinue power plant operations consistent with our corporate interests; and
restrictions on dividends or other provisions in our credit agreements and Arizona Corporation Commission orders.


These and other factors are discussed in Risk Factors described in Part 1, Item 1A of the Pinnacle West/APS Annual Report on Form 10-K for the fiscal year ended Dec. 31, 2019; in Part II, Item 1A in of the Pinnacle West/APS Quarterly Report on Form 10-Q for the quarter ended March 31, 2020; and in Part II, Item 1A in the Pinnacle West/APS Quarterly Report on Form 10-Q for the quarter ended June 30, 2020, which readers should review carefully before placing any reliance on our financial statements or disclosures. Neither Pinnacle West nor APS assumes any obligation to update these statements, even if our internal estimates change, except as required by law.

# # #


PINNACLE WEST CAPITAL CORPORATION
CONSOLIDATED STATEMENTS OF INCOME
(unaudited)
(dollars and shares in thousands, except per share amounts)
 
 
 THREE MONTHS ENDED
 
 SIX MONTHS ENDED
 
 
 JUNE 30,
 
 JUNE 30,
 
 
 2020
 
 2019
 
 2020
 
 2019


Operating Revenues
 $ 929,590
 
 $ 869,501

 
 $ 1,591,520
 
 $ 1,610,031


Operating Expenses


Fuel and purchased power
       238,382
 
       242,222

 
       426,903
 
       472,810
 
Operations and maintenance
       219,392
 
       227,543

 
       440,710
 
       473,177
 
Depreciation and amortization
       152,482
 
       147,374

 
       306,561
 
       296,081
 
Taxes other than income taxes
         56,768
 
         55,090

 
       113,536
 
       110,180
 
Other expenses
              692
 
              683

 
           1,514
 
           1,110
 
    Total
       667,716
 
       672,912

 
    1,289,224
 
    1,353,358


Operating Income
       261,874
 
       196,589

 
       302,296
 
       256,673


Other Income (Deductions)


Allowance for equity funds used during construction
           8,811
 
           7,572

 
         16,508
 
         18,760
 
Pension and other postretirement non-service credits - net
         14,142
 
           6,374

 
         28,053
 
         11,488
 
Other income
         16,670
 
         12,885

 
         29,239
 
         20,054
 
Other expense
          (4,036)
 
(4,350
)
 
          (8,820)
 
          (8,708)
 
   Total
         35,587
 
         22,481

 
         64,980
 
         41,594


Interest Expense


Interest charges
         62,690
 
         57,465

 
       121,924
 
       118,118
 
Allowance for borrowed funds used during construction
          (4,749)
 
          (4,494)

 
          (8,825)
 
        (11,159)
 
   Total
         57,941
 
         52,971

 
       113,099
 
       106,959


Income Before Income Taxes
       239,520
 
       166,099

 
       254,177
 
       191,308


Income Taxes
         41,061
 
         17,080

 
         20,852
 
         19,498


Net Income
       198,459
 
       149,019

 
       233,325
 
       171,810


Less: Net income attributable to noncontrolling interests
           4,874
 
           4,874

 
           9,747
 
           9,747


Net Income Attributable To Common Shareholders
 $ 193,585
 
 $ 144,145

 
 $ 223,578
 
 $ 162,063


Weighted-Average Common Shares Outstanding - Basic
       112,638
 
       112,337

 
       112,616
 
       112,381


Weighted-Average Common Shares Outstanding - Diluted
       112,879
 
       112,651

 
       112,871
 
       112,734


Earnings Per Weighted-Average Common Share Outstanding


Net income attributable to common shareholders - basic
 $ 1.72
 
 $ 1.28

 
 $ 1.99
 
 $ 1.44
 
Net income attributable to common shareholders - diluted
 $ 1.71
 
 $ 1.28

 
 $ 1.98
 
 $ 1.44


POWERING GROWTH DELIVERING VALUE Second Quarter 2020 Results August 6, 2020 Second Quarter 2020 | 0


FORWARD LOOKING STATEMENTS AND NON-GAAP FINANCIAL MEASURES This presentation contains forward-looking statements based on current expectations, including statements regarding our earnings guidance and financial outlook and goals. These forward-looking statements are often identified by words such as “estimate,” “predict,” “may,” “believe,” “plan,” “expect,” “require,” “intend,” “assume,” “project,” "anticipate," "goal," "seek," "strategy," "likely," "should," "will," "could," and similar words. Because actual results may differ materially from expectations, we caution you not to place undue reliance on these statements. A number of factors could cause future results to differ materially from historical results, or from outcomes currently expected or sought by Pinnacle West or APS. These factors include, but are not limited to: the potential effects of the continued COVID-19 pandemic, including, but not limited to, demand for energy, economic growth, our employees and contractors, supply chain, expenses, capital markets, capital projects, operations and maintenance activities, uncollectable accounts, liquidity, cash flows, or other unpredictable events; our ability to manage capital expenditures and operations and maintenance costs while maintaining high reliability and customer service levels; variations in demand for electricity, including those due to weather seasonality, the general economy or social conditions, customer and sales growth (or decline), the effects of energy conservation measures and distributed generation, and technological advancements; power plant and transmission system performance and outages; competition in retail and wholesale power markets; regulatory and judicial decisions, developments and proceedings; new legislation, ballot initiatives and regulation, including those relating to environmental requirements, regulatory policy, nuclear plant operations and potential deregulation of retail electric markets; fuel and water supply availability; our ability to achieve timely and adequate rate recovery of our costs, including returns on and of debt and equity capital investments; our ability to meet renewable energy and energy efficiency mandates and recover related costs; risks inherent in the operation of nuclear facilities, including spent fuel disposal uncertainty; current and future economic conditions in Arizona, including in real estate markets; the direct or indirect effect on our facilities or business from cybersecurity threats or intrusions, data security breaches, terrorist attack, physical attack, severe storms, droughts, or other catastrophic events, such as fires, explosions, pandemic health events, or similar occurrences; the development of new technologies which may affect electric sales or delivery; the cost of debt and equity capital and the ability to access capital markets when required; environmental, economic and other concerns surrounding coal-fired generation, including regulation of greenhouse gas emissions; volatile fuel and purchased power costs; the investment performance of the assets of our nuclear decommissioning trust, pension, and other postretirement benefit plans and the resulting impact on future funding requirements; the liquidity of wholesale power markets and the use of derivative contracts in our business; potential shortfalls in insurance coverage; new accounting requirements or new interpretations of existing requirements; generation, transmission and distribution facility and system conditions and operating costs; the ability to meet the anticipated future need for additional generation and associated transmission facilities in our region; the willingness or ability of our counterparties, power plant participants and power plant land owners to meet contractual or other obligations or continue or discontinue power plant operations consistent with our corporate interests; and restrictions on dividends or other provisions in our credit agreements and ACC orders. These and other factors are discussed in Risk Factors described in Part I, Item 1A of the Pinnacle West/APS Annual Report on Form 10-K for the fiscal year ended December 31, 2019, in Part II, Item 1A in of the Pinnacle West/APS Quarterly Report on Form 10-Q for the quarter ended March 31, 2020, and in Part II, Item 1A in the Pinnacle West/APS Quarterly Report on Form 10-Q for the quarter ended June 30, 2020, which you should review carefully before placing any reliance on our financial statements, disclosures or earnings outlook. Neither Pinnacle West nor APS assumes any obligation to update these statements, even if our internal estimates change, except as required by law. In this presentation, references to net income and earnings per share (EPS) refer to amounts attributable to common shareholders. We present “gross margin” per diluted share of common stock. Gross margin refers to operating revenues less fuel and purchased power expenses. Gross margin is a “non-GAAP financial measure,” as defined in accordance with SEC rules. The appendix contains a reconciliation of this non-GAAP financial measure to the referenced revenue and expense line items on our Consolidated Statements of Income, which are the most directly comparable financial measures calculated and presented in accordance with generally accepted accounting principles in the United States of America (GAAP). We view gross margin as an important performance measure of the core profitability of our operations and is used by our management in analyzing the operations of our business. We believe that investors benefit from having access to the same financial measures that management uses. We present “adjusted gross margin” and “adjusted operations and maintenance” that have been adjusted to exclude costs and offsetting operating revenues associated with renewable energy and demand side management programs. We also present “adjusted D&A,” “adjusted interest, net of AFUDC,” adjusted other taxes,” and “adjusted other, net” that have been adjusted for the deferral impacts of the Ocotillo Modernization Project. We also present “adjusted income taxes" that shows the impact of tax reform. Adjusted gross margin, adjusted operations and maintenance, adjusted D&A, adjusted interest, net of AFUDC, adjusted other, net, adjusted income taxes and adjusted other taxes are “non-GAAP financial measures,” as defined in accordance with SEC rules. The appendix contains a reconciliation to show the exclusion of costs and offsetting operating revenues associated with renewable energy and demand side management programs, the deferral impacts of the Ocotillo Modernization Project, and the impact of tax reform. We believe the information provided in the reconciliation provides investors with useful indicators of our results that are comparable among periods because they exclude the effects of unusual items that may occur on an irregular basis, such as the Ocotillo Modernization Project and tax reform impacts, and exclude the effects of programs that overstate our gross margin. Second Quarter 2020 | 1


EPS VARIANCES 2nd Quarter 2020 vs. 2nd Quarter 2019 Adjusted Adjusted Pension & Adjusted Adjusted Adjusted Adjusted O&M1 D&A2 OPEB Interest, Income Other Other, net2 $0.03 $(0.03) Non-service net of Taxes Taxes2 $0.01 Credits, net 2 Adjusted AFUDC $(0.05) $(0.01) $0.05 Gross $(0.02) Margin1 $0.45 Gross Margin Weather $ 0.43 $1.28 $1.71 Federal Tax Reform $ 0.09 LFCR $ 0.02 Other $ 0.02 Sales / Usage $(0.10) 2Q 2019 Transmission $(0.01) 2Q 2020 1 Excludes costs and offsetting operating revenues associated with renewable energy and demand side management programs. 2 Driver adjusted for the deferral impacts of the Ocotillo Modernization Project. See non-GAAP reconciliation in Appendix. Second Quarter 2020 | 2


2020 EPS GUIDANCE Key Factors & Assumptions as of August 6, 2020 2020 Adjusted gross margin1,2 (operating revenues, net of fuel and purchased power expenses) $2.41 – $2.47 billion • Retail customer growth about 1.5-2.5% • Weather-normalized retail electricity sales volume flat to negative 1% compared to prior year (excludes potential data center load growth) • Assumes normal weather Adjusted operating and maintenance (O&M)1,2 $820 – $840 million Other operating expenses (depreciation and amortization, deferrals, and taxes other than income taxes) $830 – $850 million Other income (pension and other post-retirement non-service credits, other income and other expense) $80 – $90 million Interest expense, net of allowance for borrowed and equity funds used during construction (Total AFUDC ~$45 million) $200 – $210 million Net income attributable to noncontrolling interests $20 million Effective tax rate 13% Average diluted common shares outstanding 112.8 million EPS Guidance $4.75 – $4.95 1 Excludes O&M of $70 million, and offsetting revenues, associated with renewable energy and demand side management programs. 2 The Covid-19 disconnect suspension and summer disconnection moratorium and revised policies are currently estimated to result in a decrease of approximately $20 million to $30 million of pre-tax income in 2020 depending on certain assumptions, including customer behavior. Second Quarter 2020 | 3


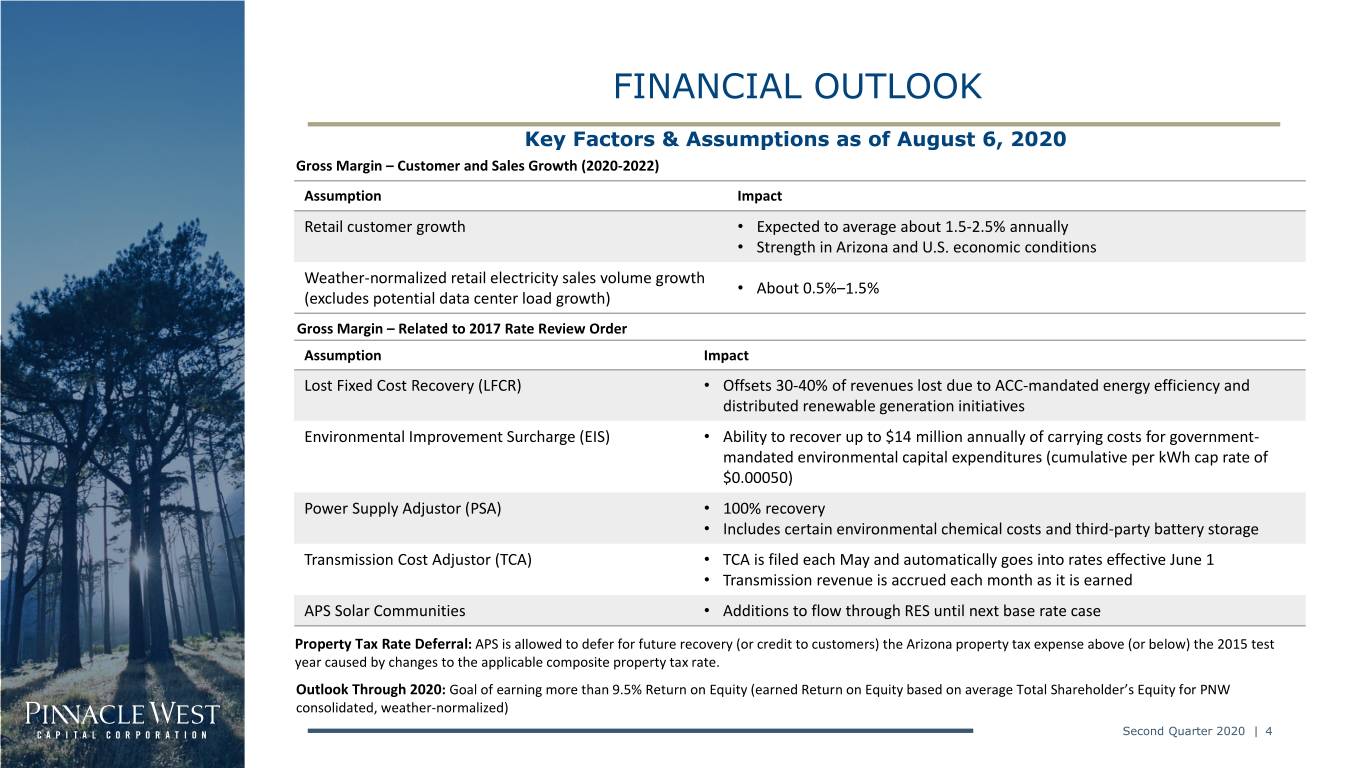
FINANCIAL OUTLOOK Key Factors & Assumptions as of August 6, 2020 Gross Margin – Customer and Sales Growth (2020-2022) Assumption Impact Retail customer growth • Expected to average about 1.5-2.5% annually • Strength in Arizona and U.S. economic conditions Weather-normalized retail electricity sales volume growth • About 0.5%–1.5% (excludes potential data center load growth) Gross Margin – Related to 2017 Rate Review Order Assumption Impact Lost Fixed Cost Recovery (LFCR) • Offsets 30-40% of revenues lost due to ACC-mandated energy efficiency and distributed renewable generation initiatives Environmental Improvement Surcharge (EIS) • Ability to recover up to $14 million annually of carrying costs for government- mandated environmental capital expenditures (cumulative per kWh cap rate of $0.00050) Power Supply Adjustor (PSA) • 100% recovery • Includes certain environmental chemical costs and third-party battery storage Transmission Cost Adjustor (TCA) • TCA is filed each May and automatically goes into rates effective June 1 • Transmission revenue is accrued each month as it is earned APS Solar Communities • Additions to flow through RES until next base rate case Property Tax Rate Deferral: APS is allowed to defer for future recovery (or credit to customers) the Arizona property tax expense above (or below) the 2015 test year caused by changes to the applicable composite property tax rate. Outlook Through 2020: Goal of earning more than 9.5% Return on Equity (earned Return on Equity based on average Total Shareholder’s Equity for PNW consolidated, weather-normalized) Second Quarter 2020 | 4


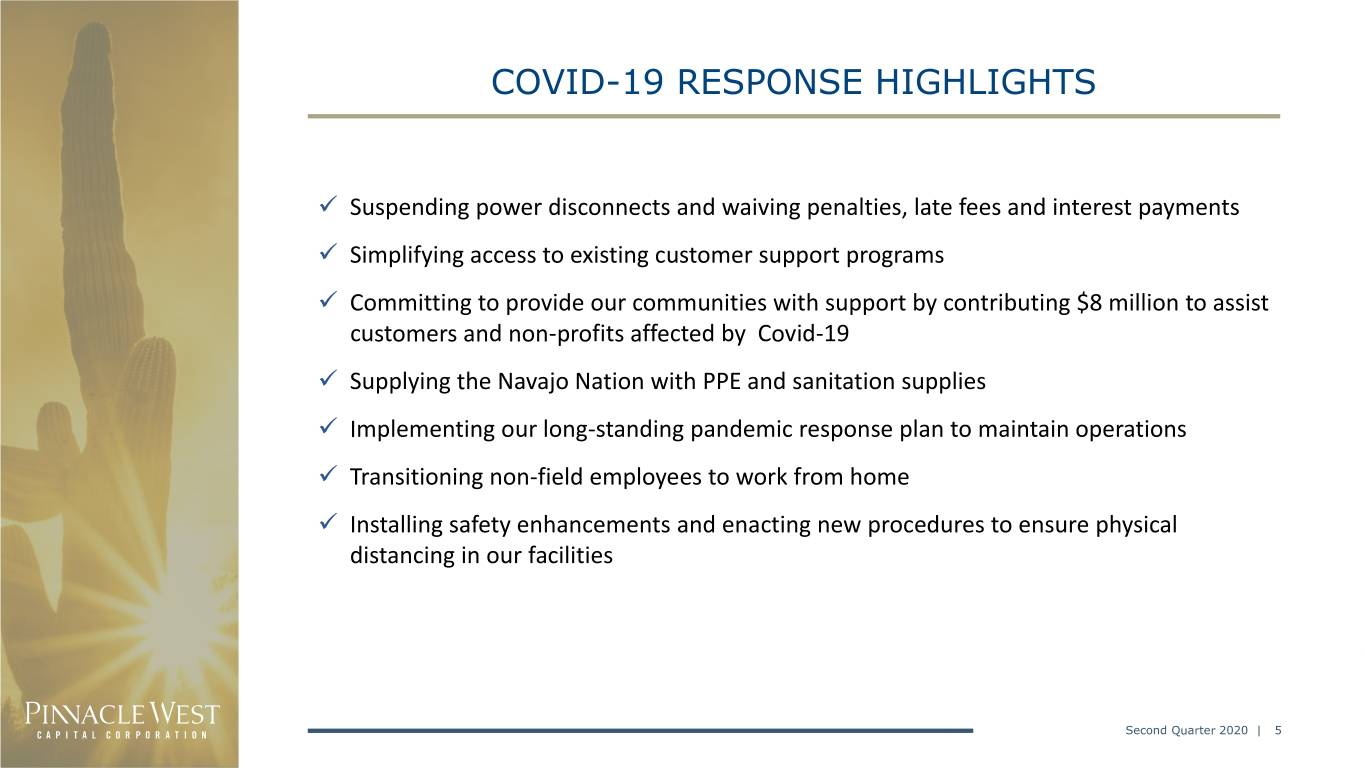
COVID-19 RESPONSE HIGHLIGHTS ✓ Suspending power disconnects and waiving penalties, late fees and interest payments ✓ Simplifying access to existing customer support programs ✓ Committing to provide our communities with support by contributing $8 million to assist customers and non-profits affected by Covid-19 ✓ Supplying the Navajo Nation with PPE and sanitation supplies ✓ Implementing our long-standing pandemic response plan to maintain operations ✓ Transitioning non-field employees to work from home ✓ Installing safety enhancements and enacting new procedures to ensure physical distancing in our facilities Second Quarter 2020 | 5


ENERGY USAGE AND SALES COVID impacts on sales have diminished since businesses began to reopen in mid-May. From March 13th through July 28th the cumulative year over year reduction in weather-normalized usage was (1)% YoY Approximate Pre-COVID Main COVID Impacts Recovery Sales Growth1 January 1 – March 12 March 13 – May 12 May 13 – July 28 All Classes 1% (7)% 0% Residential 2% 6% 4% C&I (1)% (13)% (4)% 1 Weather normalized. Second Quarter 2020 | 6


PRELIMINARY WEATHER-NORMALIZED ENERGY TREND Daily Energy Normalized Actual: 2020 vs 2019 March 1 - July 28, 2020 Week of May 11th businesses began reopening and stay-at-home guidelines expired March 1 March 15 March 29 April 12 April 26 May 10 May 24 June 7 June 21 July 5 July 19 Normalized Actual 2020 Normalized Actual 2019 Second Quarter 2020 | 7


ARIZONA COVID-19 RESPONSE TIMELINE • May 4th – Retail establishments permitted to reopen • May 8th – Hair salons permitted to reopen • May 11th – Dine-in restaurants permitted to reopen • May 13th – Pools, gyms and spas permitted to reopen • May 15th – Stay Home, Stay Healthy, Stay Connected guideline expired • May 16th – Professional sports may resume without fans • May 28th – Governor announced schools will reopen in the fall; summer school, summer camp and youth activities may begin • June 29th – Bars, nightclubs, gyms, movie theaters and waterparks closed through August 10th and the first day of in-person school delayed until August 17th • July 9th – Indoor dining limited to less than 50% occupancy Second Quarter 2020 | 8


WELL FUNDED PENSION AND HEALTHY LIQUIDITY Pension Funded Status Liquidity and Financing Activity 97% 97% • $1.2 billion revolver capacity • $600 million 30-year 3.35% APS senior 90% unsecured notes issued May 2020 • $500 million 5-year 1.30% PNW senior unsecured notes issued June 2020 • Expect up to $400 million of additional term debt issuance at APS in 2020 • All PNW debt maturing in 2020 was repaid in June 2020 YE 2018 YE 2019 6/30/2020 • $150 million of APS debt repaid in • Liability driven investment strategy helps reduce January 2020 funded status volatility • $200 million APS Term Loan repaid in • Approximately 65% of the pension portfolio is in May 2020 fixed income assets • No APS or PNW long-term debt • Hedge 100% of interest rate volatility using maturities until 2024 Treasury futures contracts Second Quarter 2020 | 9


ECONOMIC INDICATORS Monthly Year-over-Year Employment Growth Ending May 2020 Taylor Morrison reports June 2020 as best U.S. Phoenix 1 5% month in Scottsdale homebuilder’s history 0% -5% Custom home lot sales going strong in metro 2 -10% Phoenix despite COVID-19 -15% Jan-18 Jan-19 Jan-20 Valley high-end homes listings make rapid comeback after tepid spring 3 Single Family & Multifamily Housing Permits Maricopa County Single Family Multifamily Projected 40,000 30,000 20,000 1 10,000 www.bizjournals.com/phoenix July 9, 2020 2 www.bizjournals.com/phoenix July 11, 2020 3 www.bizjournals.com/phoenix July 10, 2020 0 '08 '09 '10 '11 '12 '13 '14 '15 '16 '17 '18 '19 '20 Second Quarter 2020 | 10


ECONOMIC DEVELOPMENT FUTURE EXPANSIONS OUR APPROACH FOCUSES ON FOUR MAIN AREAS o Stack Infrastructure plans to build a 1 million-square-foot Business Attraction & Expansion - constructive engagement data center on 79 acres in the West Valley less than half a with economic development community partners and timely, mile from one of Microsoft’s data centers. strategic engagement with economic development prospects, o White Claw/Mark Anthony Brewing Inc. announced plans site selectors, and local developers to build a 916,000-square-foot facility co-located next to Red Bull in Glendale creating an estimated 200 jobs. o Red Bull announced a 700,000-square-foot distribution Community Development - provide financial and strategic center, in addition to the 700,000 square foot facility economic development support in both rural and metro announced in 2019, adding an estimated 115 new jobs and communities an additional $84 million in capital investment. o Nacero Inc. made public plans to build a $3.3 billion natural gas to gasoline manufacturing facility in Casa Grande. The Entrepreneurial Support - advance the entrepreneurial project is expected to encompass a total of 1,038 acres. ecosystem by supporting the strategies of organizations that are making an impact, whether through job creation, capital o Ball Corporation announced plans to build a second location raised, quality programming or helping to change the within the Phoenix metropolitan area next to the Red Bull perception of the region and White Claw manufacturing facilities in Glendale. Ball plans to invest $300 million and create 190 jobs. This is in addition to their current 500,000-square-foot facility located Infrastructure Support - drive commercial real estate in Goodyear. development by working closely with developers and the Arizona State Land Department to make large commercial land parcels “shovel ready” What others are saying: • Census report ranks Arizona 3rd in percentage growth rate; AZ Business Magazine, Jan. 2, 2020 • Arizona gaining as top state for newcomers, study says; Arizona Republic, Jan. 2, 2020 • Electric-car maker breaks ground in Casa Grande as competition grows; Capitol Media Services (AZ Capitol Times), Dec. 3, 2019 Second Quarter 2020 | 11


RATE BASE APS’s revenues come from a regulated retail rate base and meaningful transmission business APS Rate Base Growth Total Approved Rate Base Year-End Generation & Distribution Transmission ACC FERC Long-term Rate Base Guidance: 19% 6-7% Average Annual Growth $2.3 81% ACC FERC $1.6 Rate Effective Date 8/19/2017 6/1/2020 Test Year Ended 12/31/20151, 2 12/31/2019 $10.7 Rate Base $6.8B $1.7B $7.7 Equity Layer 55.8% 53% Allowed ROE 10.0% 10.75% 1 2018 2019 2020 2021 2022 Adjusted to include post test-year plant in service through 12/31/2016 2 On 10/31/19 APS filed an ACC general rate case with a proposed $8.9B rate base for an Projected adjusted test year ended 6/30/19 Rate base $ in billions, rounded Second Quarter 2020 | 12


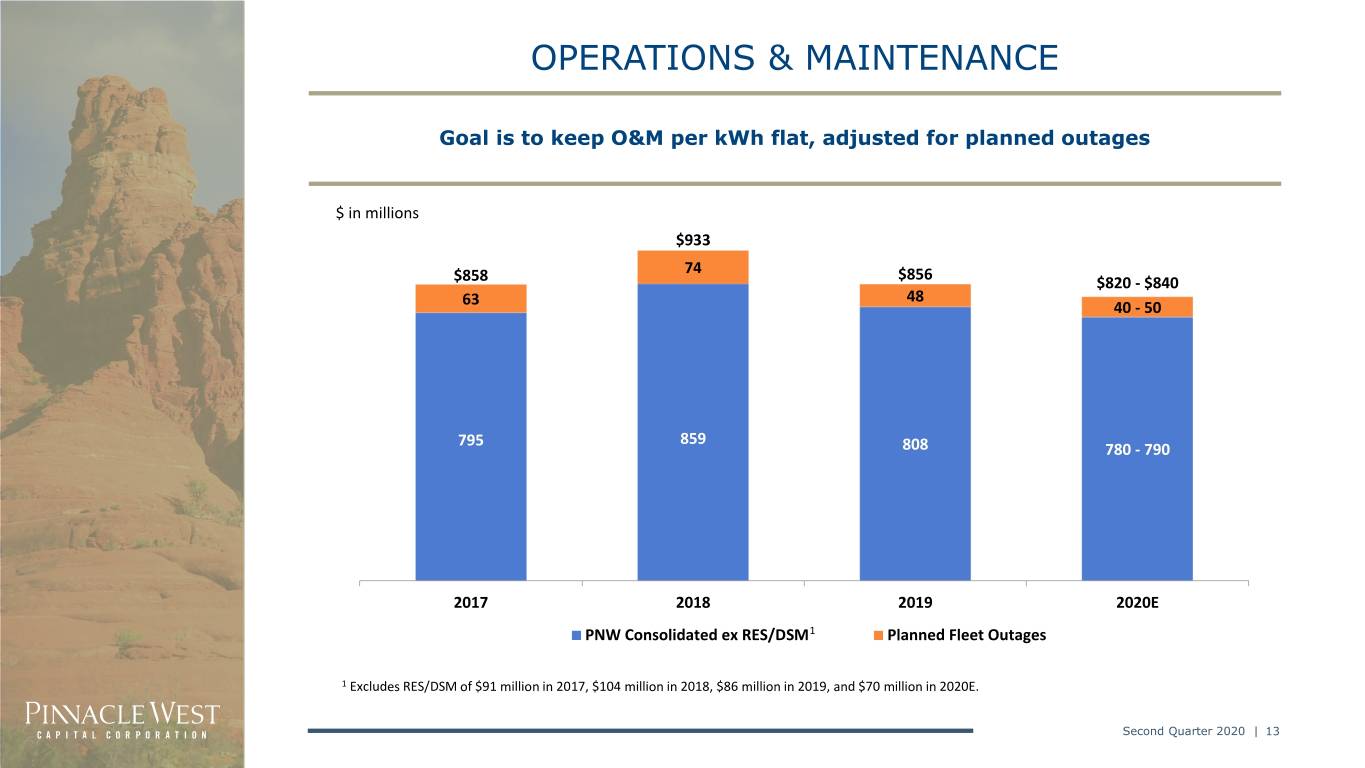
OPERATIONS & MAINTENANCE Goal is to keep O&M per kWh flat, adjusted for planned outages $ in millions $933 74 $856 $858 $820 - $840 48 63 40 - 50 795 859 808 780 - 790 2017 2018 2019 2020E PNW Consolidated ex RES/DSM1 Planned Fleet Outages 1 Excludes RES/DSM of $91 million in 2017, $104 million in 2018, $86 million in 2019, and $70 million in 2020E. Second Quarter 2020 | 13


2020 PLANNED OUTAGE SCHEDULE Coal, Nuclear, and Large Gas Planned Outages Q1 Q2 Q4 Estimated Estimated Estimated Plant Unit Duration Plant Unit Duration in Plant Unit Duration in Days Days in Days Four Four 5 46 5 36 Palo Verde 1 44 Corners* Corners* Palo Verde 2 30 *Outage duration spans Q1-Q2. Number of days noted per quarter. Second Quarter 2020 | 14


APS CAPITAL EXPENDITURES Capital expenditures will support our growing customer base and utilization of advanced technology $ in millions PROJECTED $2,000 $1,800 $1,725 $1,650 $121 $1,600 $154 $44 $53 $1,400 $1,331 Traditional Generation $1,231 $141 1 $1,200 Ocotillo $185 $45 $613 $794 $14 Environmental $1,000 $27 $250 $168 Clean Generation $800 $181 Transmission $179 $201 $205 $600 Distribution Other $400 $521 $556 $444 $446 $200 $137 $158 $185 $115 $- 2019 2020 2021 2022 • 2020 – 2022 as disclosed in the 2020 Second Quarter Form 10-Q. 1 Ocotillo Modernization Project: Units in service second quarter 2019. Second Quarter 2020 | 15


INTEGRATED RESOURCE PLAN A plan to power our customers’ future needs with clean energy 2020-2024 Additions Megawatts • Approximately 2,500 megawatts of renewable energy, demand response, energy efficiency and Demand Side Management 575 energy storage needed between 2020 and 2024. Demand Response 193 • We expect the renewable energy additions will Distributed Energy 408 include wind and solar generation, with the exact mix determined through all-source RFP Renewable Energy 962 procurement processes. Energy Storage 750 Merchant PPA/ Hydrogen- 0 • Approximately 1,400 megawatts of coal are scheduled to be retired, and another 1,600 ready CTs megawatts of gas purchase agreements are Microgrid 6 scheduled to expire over the next decade. Total 2,894 • Resource retirements, contract roll-offs and peak demand growth result in capacity needs of IRP forecast does not include the uncertain approximately 6,000 megawatts by 2035. impacts of COVID-19 Second Quarter 2020 | 16


APPENDIX Second Quarter 2020 | 17


CREDIT RATINGS AND METRICS APS Pinnacle West 2017 2018 2019 Corporate Credit Ratings1 APS FFO / Debt 29.4% 24.5% 22.5% Moody’s A2 A3 FFO / Interest 7.5x 6.5x 6.4x S&P A- A- Debt / 46.8% 47.0% 47.7% Fitch A- A- Capitalization Pinnacle West Senior Unsecured1 FFO / Debt 26.4% 22.1% 19.5% Moody’s A2 A3 FFO / Interest 7.1x 6.2x 5.9x S&P A- BBB+ Debt / 50.0% 51.4% 52.1% Fitch A A- Capitalization S&P rates the outlooks for APS and Pinnacle West as Source: Standard & Poor’s Stable. Fitch & Moody’s rate the outlooks for both as Negative. 1 We are disclosing credit ratings to enhance understanding of our sources of liquidity and the effects of our ratings on our costs of funds. Second Quarter 2020 | 18


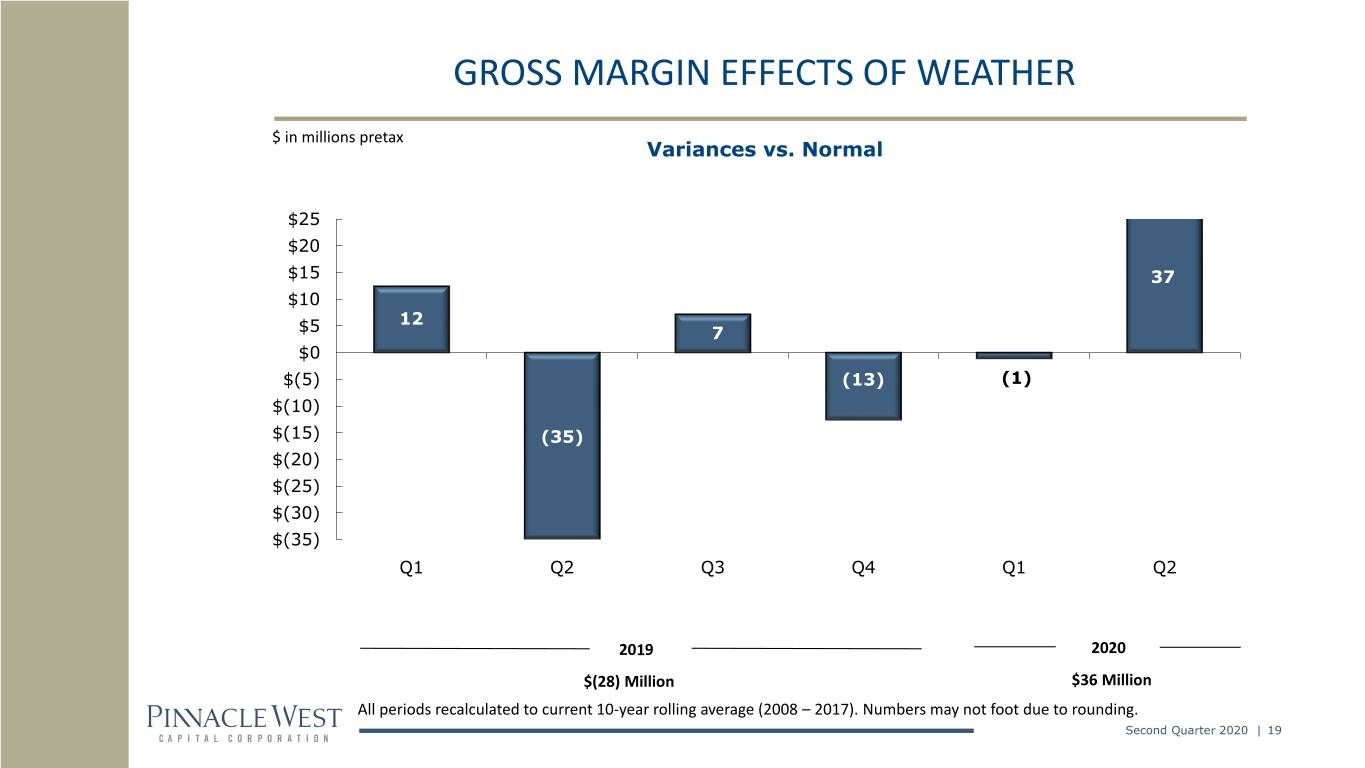
GROSS MARGIN EFFECTS OF WEATHER $ in millions pretax Variances vs. Normal $25 $20 $15 37 $10 12 $5 7 $0 $(5) (13) (1) $(10) $(15) (35) $(20) $(25) $(30) $(35) Q1 Q2 Q3 Q4 Q1 Q2 2019 2020 $(28) Million $36 Million All periods recalculated to current 10-year rolling average (2008 – 2017). Numbers may not foot due to rounding. Second Quarter 2020 | 19


RENEWABLE ENERGY AND DEMAND SIDE MANAGEMENT EXPENSES1 Renewable Energy Demand Side Management $40 $ in millions pretax $30 $20 $11 $14 $11 $11 $11 $10 $12 $13 $10 $7 $9 $7 $3 $0 Q1 Q2 Q3 Q4 Q1 Q2 2019 2020 $86 Million $33 Million 1 Renewable energy and demand side management expenses are offset by adjustment mechanisms Second Quarter 2020 | 20


RESIDENTIAL PV APPLICATIONS1 4,000 Residential DG (MWdc) Annual Additions 151 133 133 122 3,500 64 3,000 2016 2017 2018 2019 2020 2,500 2,000 1,500 1,000 500 0 Jan Feb Mar Apr May Jun Jul Aug Sep Oct Nov Dec 2017 Applications 2018 Applications 2019 Applications 2020 Applications 1 Monthly data equals applications received minus cancelled applications. As of June 30, 2020, approximately 110,792 residential grid-tied solar photovoltaic (PV) systems have been installed in APS’s service territory, totaling approximately 900 MWdc of installed capacity. Excludes APS Solar Partner Program residential PV systems. Note: www.arizonagoessolar.org logs total residential application volume, including cancellations. Solar water heaters can also be found on the site but are not included in the chart above. Second Quarter 2020 | 21


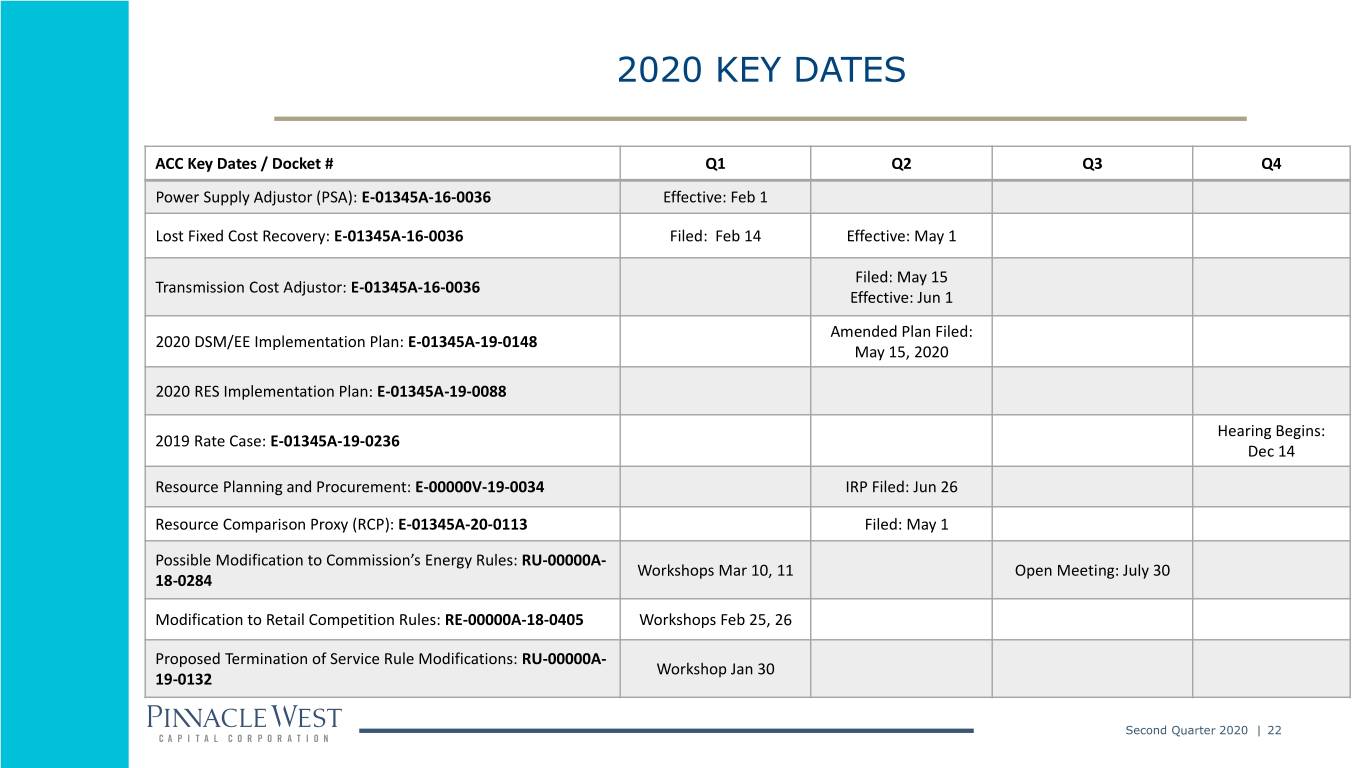
2020 KEY DATES ACC Key Dates / Docket # Q1 Q2 Q3 Q4 Power Supply Adjustor (PSA): E-01345A-16-0036 Effective: Feb 1 Lost Fixed Cost Recovery: E-01345A-16-0036 Filed: Feb 14 Effective: May 1 Filed: May 15 Transmission Cost Adjustor: E-01345A-16-0036 Effective: Jun 1 Amended Plan Filed: 2020 DSM/EE Implementation Plan: E-01345A-19-0148 May 15, 2020 2020 RES Implementation Plan: E-01345A-19-0088 Hearing Begins: 2019 Rate Case: E-01345A-19-0236 Dec 14 Resource Planning and Procurement: E-00000V-19-0034 IRP Filed: Jun 26 Resource Comparison Proxy (RCP): E-01345A-20-0113 Filed: May 1 Possible Modification to Commission’s Energy Rules: RU-00000A- Workshops Mar 10, 11 Open Meeting: July 30 18-0284 Modification to Retail Competition Rules: RE-00000A-18-0405 Workshops Feb 25, 26 Proposed Termination of Service Rule Modifications: RU-00000A- Workshop Jan 30 19-0132 Second Quarter 2020 | 22


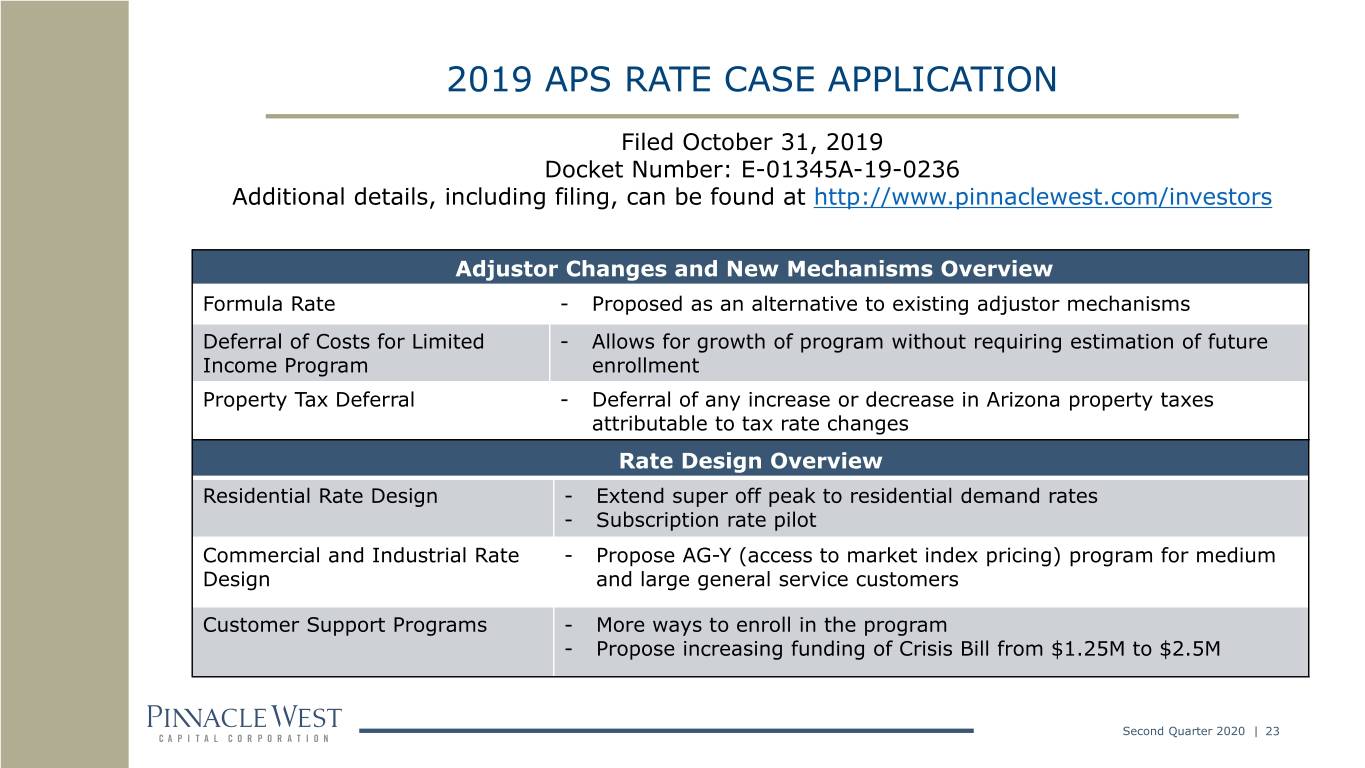
2019 APS RATE CASE APPLICATION Filed October 31, 2019 Docket Number: E-01345A-19-0236 Additional details, including filing, can be found at http://www.pinnaclewest.com/investors Adjustor Changes and New Mechanisms Overview Formula Rate - Proposed as an alternative to existing adjustor mechanisms Deferral of Costs for Limited - Allows for growth of program without requiring estimation of future Income Program enrollment Property Tax Deferral - Deferral of any increase or decrease in Arizona property taxes attributable to tax rate changes Rate Design Overview Residential Rate Design - Extend super off peak to residential demand rates - Subscription rate pilot Commercial and Industrial Rate - Propose AG-Y (access to market index pricing) program for medium Design and large general service customers Customer Support Programs - More ways to enroll in the program - Propose increasing funding of Crisis Bill from $1.25M to $2.5M Second Quarter 2020 | 23


2019 RATE CASE KEY FINANCIALS Test year ended June 30, 2019 Total Rate Base - Adjusted $11.12 Billion ACC Rate Base - Adjusted $8.87 Billion Allowed Return on Equity 10.15% Capital Structure Long-term debt 45.3% Common equity 54.7% Base Fuel Rate (¢/kWh) 3.0168 Post-test year plant period 12 months Overview of Rate Increase ($ in Millions) Total stated base rate increase (inclusive of existing adjustor transfers) $ 68.59 2.1% Plus: Transfer to base rates of various adjustors already in effect $ 115.04 3.5% Net Customer Bill Impact $ 183.63 5.6% Second Quarter 2020 | 24


2019 RATE CASE KEY FINANCIALS Overview of Rate Increase ($ in Millions) - Key Components Four Corners SCRs $ 73 Ocotillo Modernization Project 100 Post-Test Year Plant Additions 66 Net Change in Other Items 64 Tax Expense Adjustor Termination (119) Total Revenue Request $ 184 Second Quarter 2020 | 25


APS RATE CASE PROCEDURAL SCHEDULE Arizona Public Service Company Docket # E-01345A-19-0236 Application Filed October 31, 2019 Staff/Intervenor Direct Testimony (October 2, 2020) Staff/Intervenor Direct Testimony (Rate Design) (October 9, 2020) APS Rebuttal Testimony (November 6, 2020) Staff/Intervenor Surrebuttal Testimony (November 20, 2020) APS Rejoinder Testimony (December 2, 2020) Pre-Hearing Conference (December 10, 2020) Hearing Commences (December 14, 2020) Second Quarter 2020 | 26


ARIZONA UTILITIES GENERAL RATE CASES Tucson Electric Power Company Southwest Gas Docket # E-01933A-19-0028 Docket # G-01551A-19-0055 Application Filed April 1, 2019 Application Filed May 1, 2019 Hearing Commenced (Jan 16, 2020) Staff /Intervenor Direct Testimony (Revenue) (Feb 5, Staff’s late-filed testimony (April 10, 2020) 2020) Staff/Intervenor Direct (Rate Design) (Feb 19, 2020) Responsive testimony (May 8, 2020) SWG Rebuttal Testimony (March 11, 2020) Additional hearing dates (June 24-25, 2020) Initial post-hearing briefs (July 14, 2020) Staff/Intervenor Surrebuttal Testimony (April 3, 2020) SWG Rejoinder Testimony (April 14, 2020) Final post-hearing briefs (Aug 4, 2020) Prehearing Conference (June 23, 2020) Hearing Commenced (June 30, 2020) Second Quarter 2020 | 27


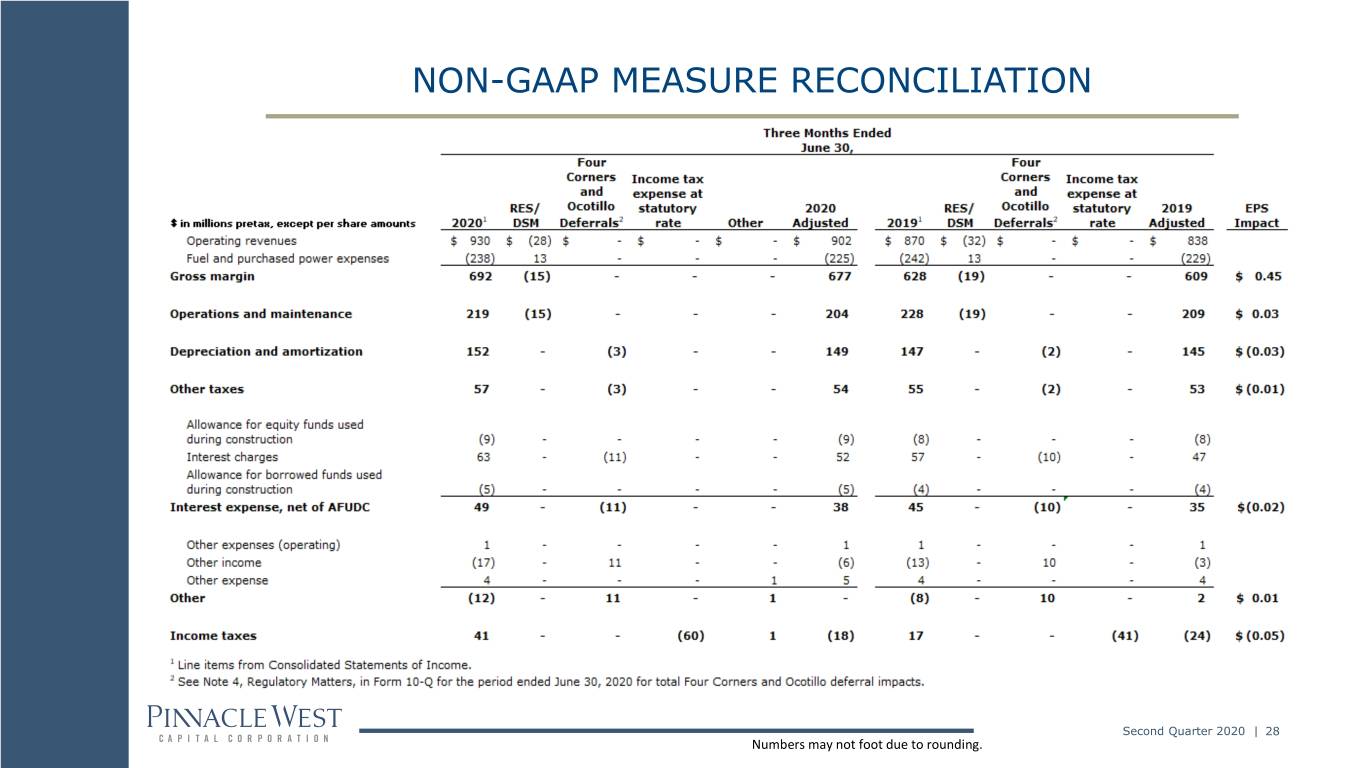
NON-GAAP MEASURE RECONCILIATION Second Quarter 2020 | 28 Numbers may not foot due to rounding.


NON-GAAP MEASURE RECONCILIATION 2020 Guidance $ in millions pretax Operating revenues1 $ 3,455 - $ 3,525 Fuel and purchased power expenses1 (975) - (985) Gross margin 2,480 - 2,540 Adjustments: Renewable energy and demand side management programs (70) - (70) Adjusted gross margin $ 2,410 - $ 2,470 Operations and maintenance1 $ 890 - $ 910 Adjustments: Renewable energy and demand side management programs 70 - 70 Adjusted operations and maintenance $ 820 - $ 840 1 Line items from Consolidated Statements of Income. Second Quarter 2020 | 29


CONSOLIDATED STATISTICS 3 Months Ended June 30, 6 Months Ended June 30, 2020 2019 Incr (Decr) 2020 2019 Incr (Decr) ELECTRIC OPERATING REVENUES (Dollars in Millions) Retail Residential $ 515 $ 433 83 $ 840 $ 784 $ 56 Business 381 396 (15) 684 729 (44) Total Retail 896 828 68 1,525 1,513 12 Sales for Resale (Wholesale) 16 22 (6) 31 58 (28) Transmission for Others 15 15 (0) 31 30 0 Other Miscellaneous Services 2 3 (1) 3 7 (3) Total Electric Operating Revenues $ 929 $ 868 60 $ 1,589 $ 1,608 $ (19) ELECTRIC SALES (GWH) Retail Residential 3,670 2,994 676 6,180 5,571 609 Business 3,489 3,593 (104) 6,650 6,790 (140) Total Retail 7,159 6,587 572 12,830 12,362 469 Sales for Resale (Wholesale) 796 1,015 (219) 1,602 1,861 (259) Total Electric Sales 7,954 7,602 353 14,432 14,223 210 RETAIL SALES (GWH) - WEATHER NORMALIZED Residential 3,420 3,239 181 5,908 5,707 201 Business 3,405 3,673 (269) 6,608 6,851 (243) Total Retail Sales 6,825 6,912 (88) 12,516 12,558 (42) Retail sales (GWH) (% over prior year) (1.3)% (0.4)% (0.3)% 0.2% AVERAGE ELECTRIC CUSTOMERS Retail Customers Residential 1,145,060 1,117,422 27,638 1,144,899 1,118,865 26,034 Business 138,101 135,318 2,783 138,062 135,131 2,932 Total Retail 1,283,161 1,252,740 30,421 1,282,961 1,253,995 28,966 Wholesale Customers 44 46 (3) 45 50 (5) Total Customers 1,283,205 1,252,786 30,419 1,283,006 1,254,045 28,961 Total Customer Growth (% over prior year) 2.4% 1.8% 2.3% 1.8% RETAIL USAGE - WEATHER NORMALIZED (KWh/Average Customer) Residential 2,987 2,899 88 5,160 5,101 60 Business 24,653 27,145 (2,492) 47,863 50,701 (2,838) Second Quarter 2020 | 30 Numbers may not foot due to rounding.


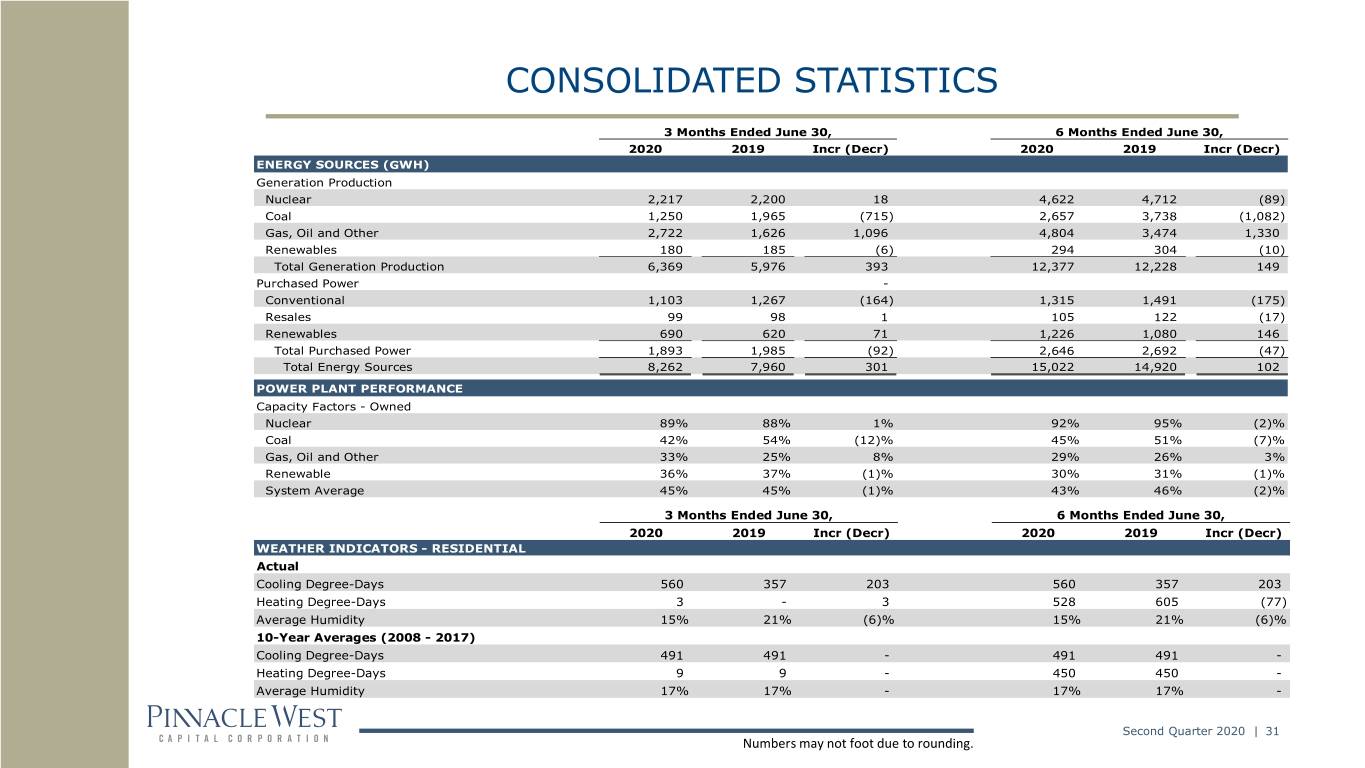
CONSOLIDATED STATISTICS 3 Months Ended June 30, 6 Months Ended June 30, 2020 2019 Incr (Decr) 2020 2019 Incr (Decr) ENERGY SOURCES (GWH) Generation Production Nuclear 2,217 2,200 18 4,622 4,712 (89) Coal 1,250 1,965 (715) 2,657 3,738 (1,082) Gas, Oil and Other 2,722 1,626 1,096 4,804 3,474 1,330 Renewables 180 185 (6) 294 304 (10) Total Generation Production 6,369 5,976 393 12,377 12,228 149 Purchased Power - Conventional 1,103 1,267 (164) 1,315 1,491 (175) Resales 99 98 1 105 122 (17) Renewables 690 620 71 1,226 1,080 146 Total Purchased Power 1,893 1,985 (92) 2,646 2,692 (47) Total Energy Sources 8,262 7,960 301 15,022 14,920 102 POWER PLANT PERFORMANCE Capacity Factors - Owned Nuclear 89% 88% 1% 92% 95% (2)% Coal 42% 54% (12)% 45% 51% (7)% Gas, Oil and Other 33% 25% 8% 29% 26% 3% Renewable 36% 37% (1)% 30% 31% (1)% System Average 45% 45% (1)% 43% 46% (2)% 3 Months Ended June 30, 6 Months Ended June 30, 2020 2019 Incr (Decr) 2020 2019 Incr (Decr) WEATHER INDICATORS - RESIDENTIAL Actual Cooling Degree-Days 560 357 203 560 357 203 Heating Degree-Days 3 - 3 528 605 (77) Average Humidity 15% 21% (6)% 15% 21% (6)% 10-Year Averages (2008 - 2017) Cooling Degree-Days 491 491 - 491 491 - - Heating Degree-Days 9 9 - 450 450 - Average Humidity 17% 17% - 17% 17% - Second Quarter 2020 | 31 Numbers may not foot due to rounding.