Page 1 of 20

IAC REPORTS Q1 2025
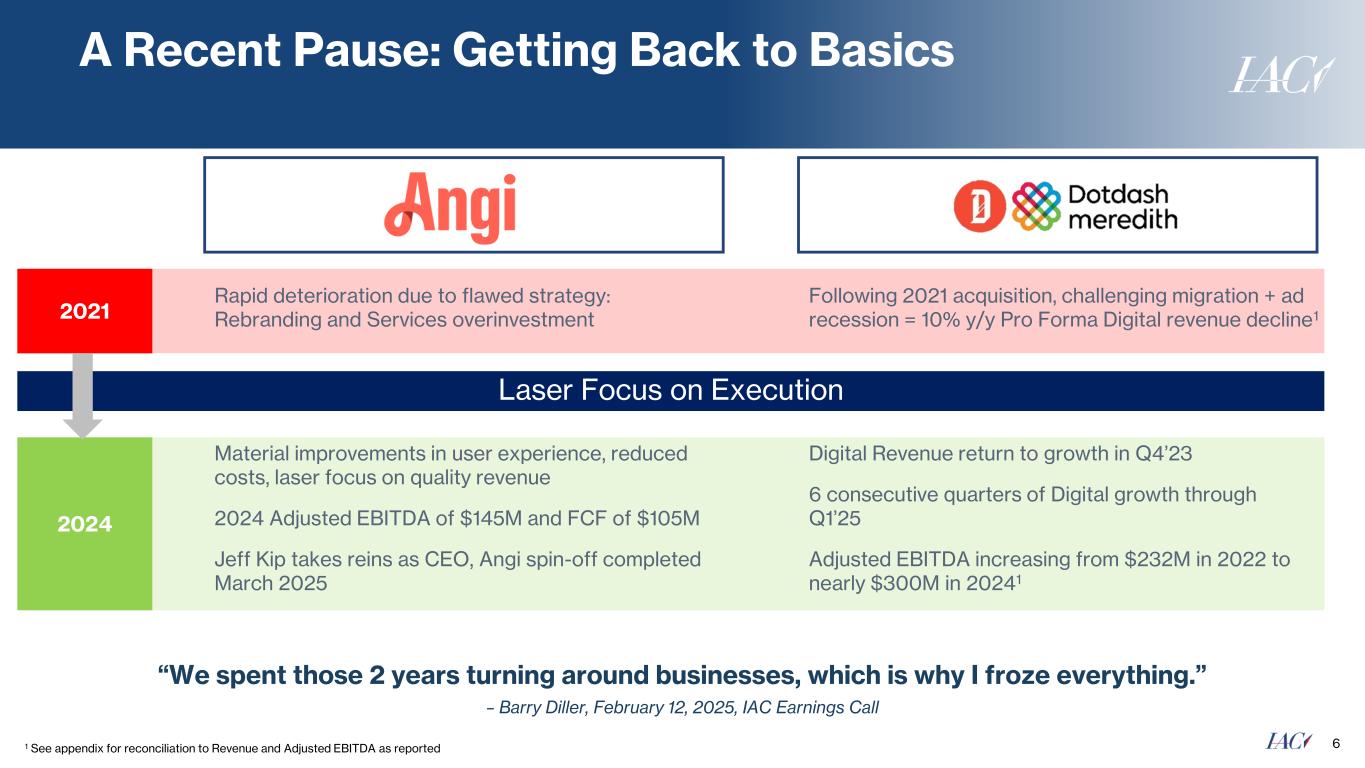
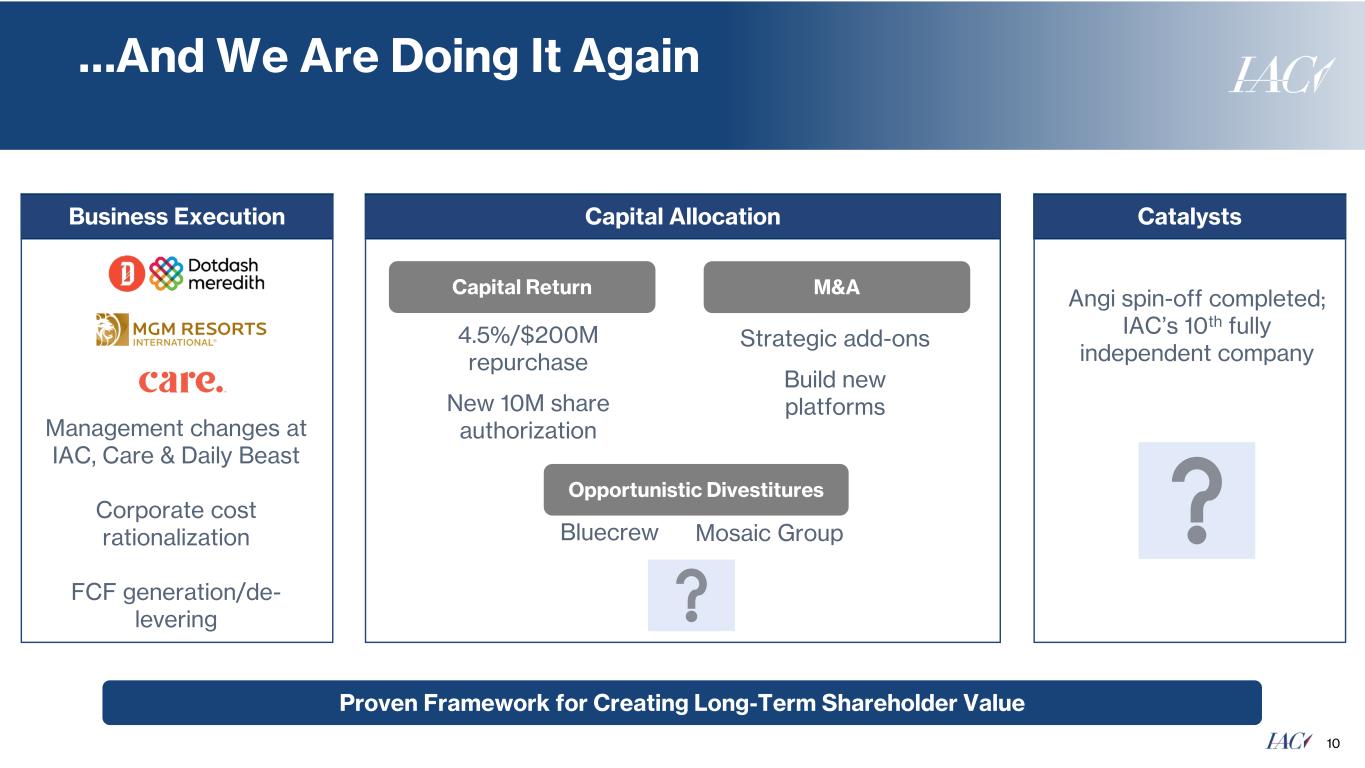
Completed the spin-off of Angi
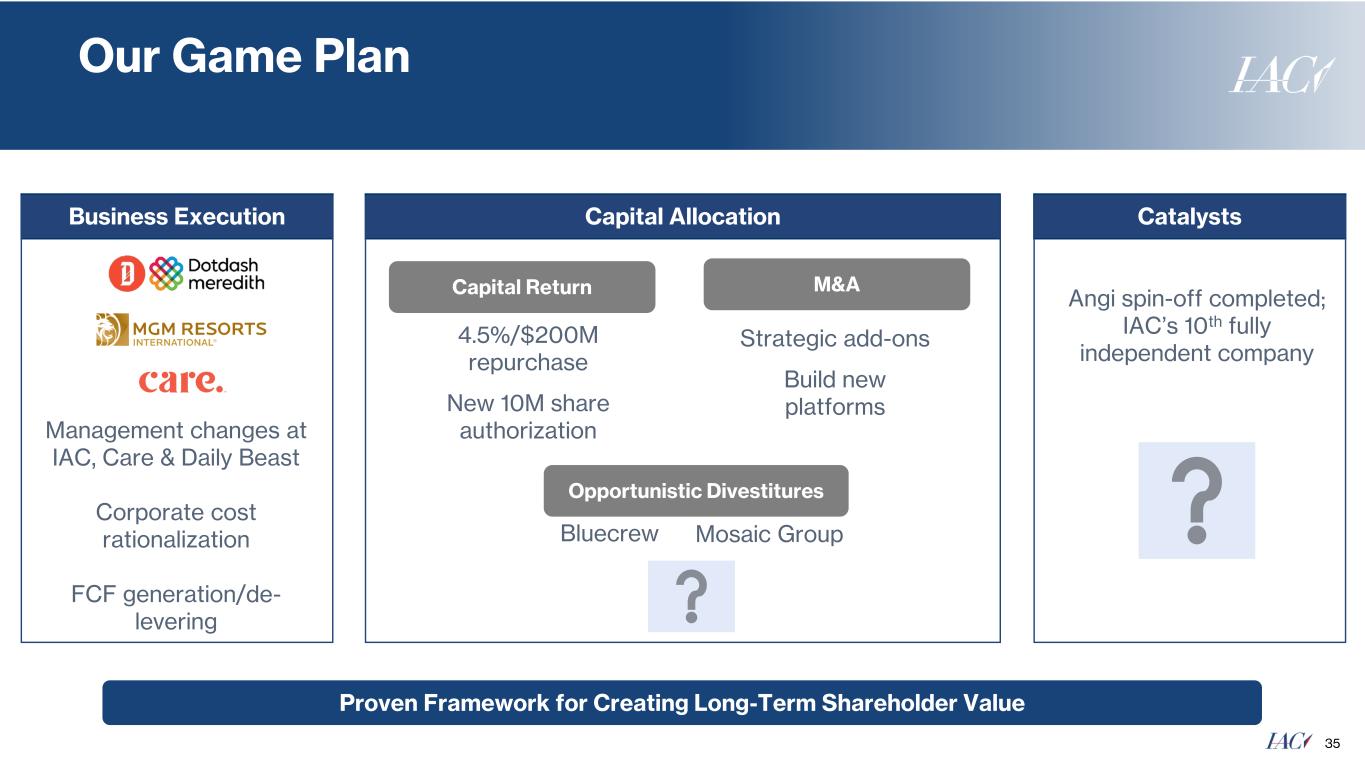
Repurchased 4.5 million shares since Q4 2024 earnings for an aggregate of $200 million
Board of Directors approved a new 10 million share repurchase authorization
Full year 2025 guidance reiterated for all businesses
NEW YORK— May 5, 2025—IAC (NASDAQ: IAC) released its first quarter results today and separately posted an investor deck on the Investor Relations section of its website at ir.iac.com.
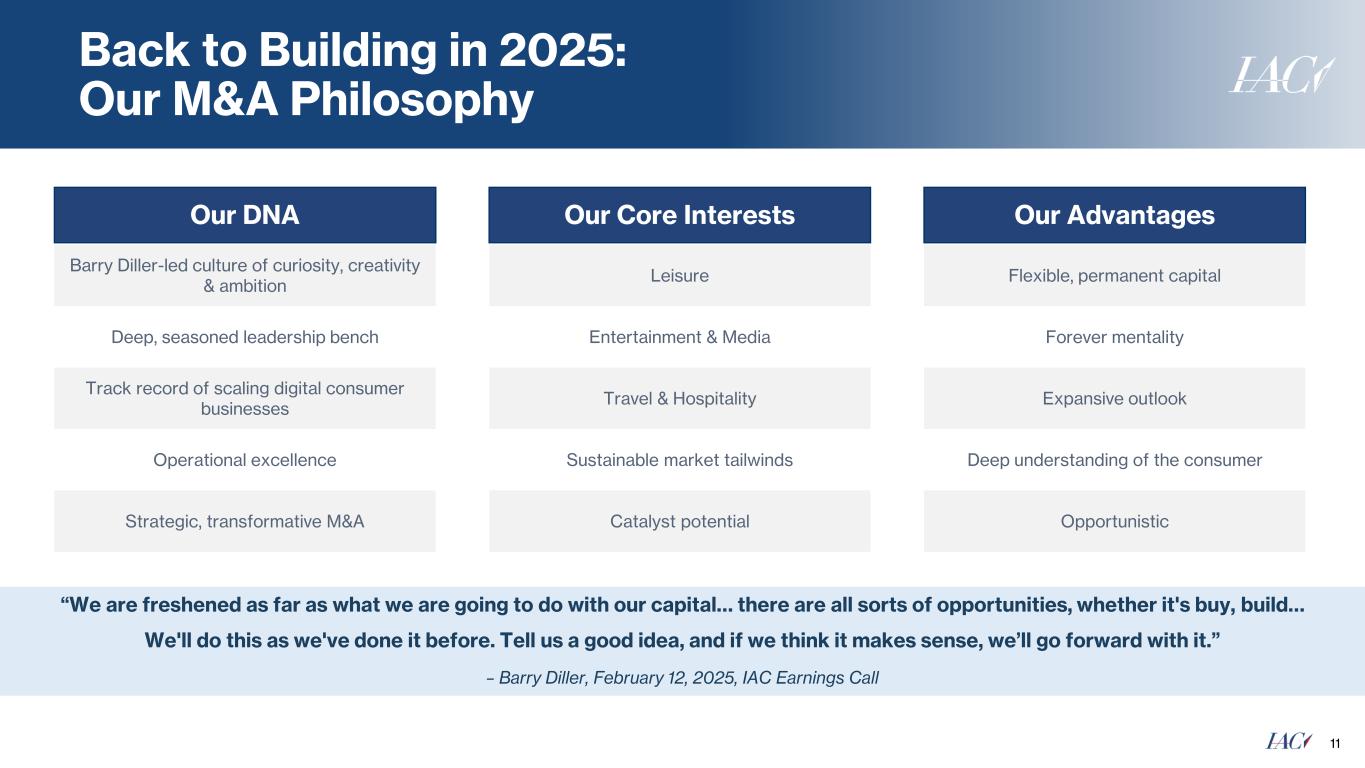
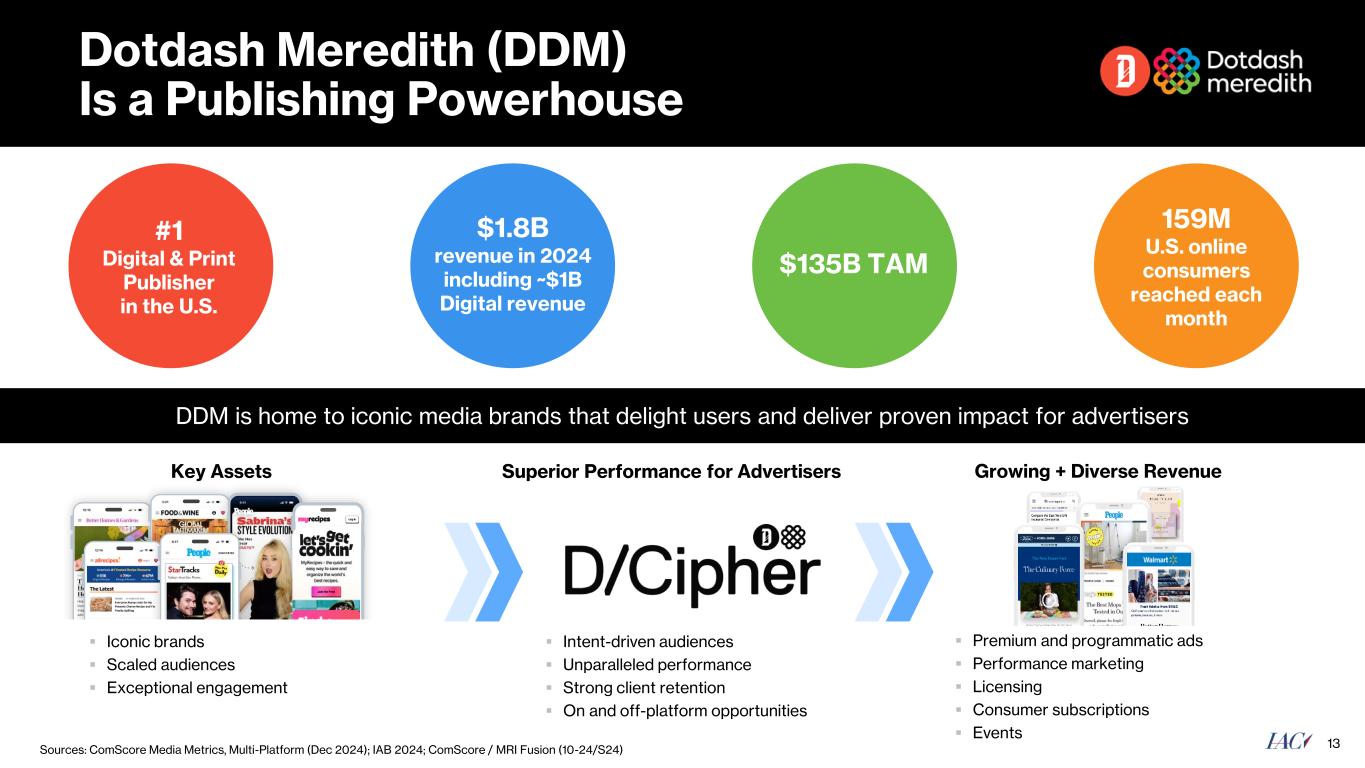
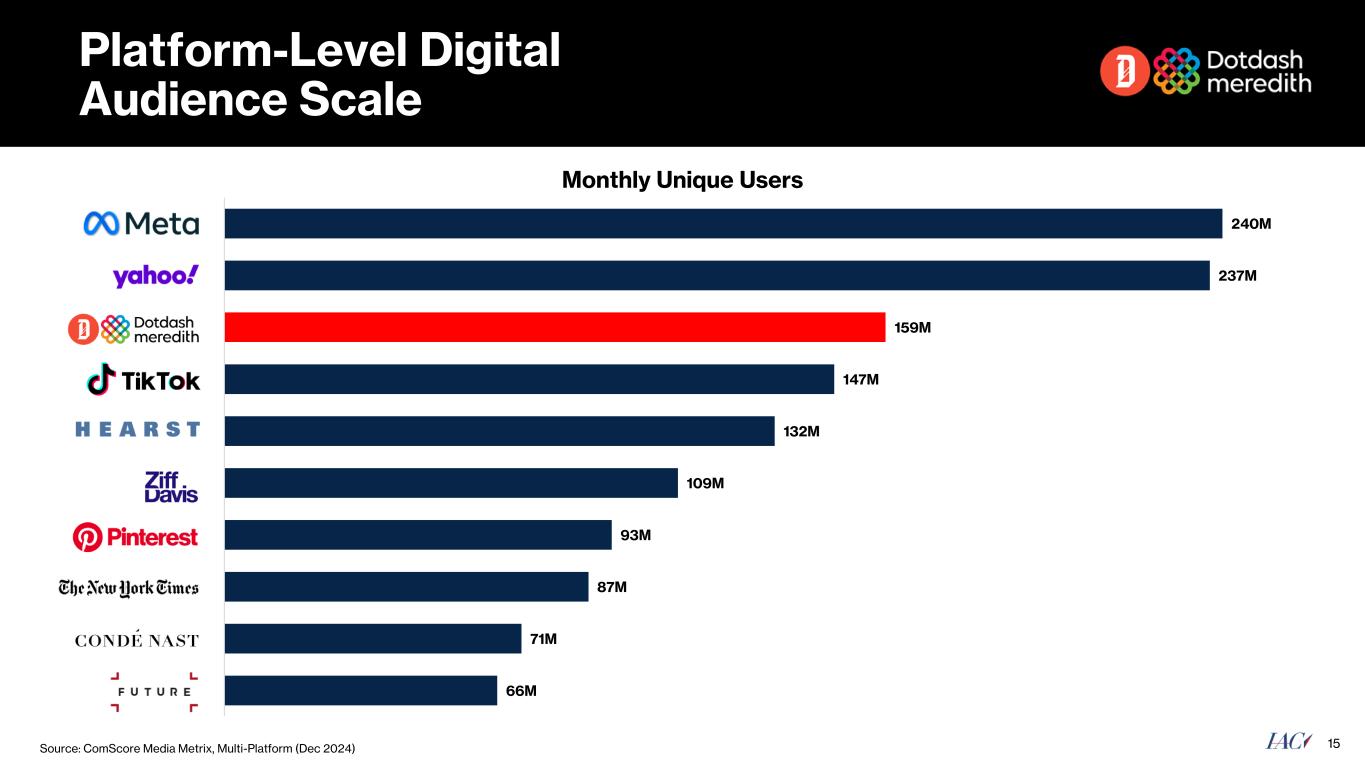
“It was a strong quarter and we are back to what we do best: allocating capital and seizing opportunities for value creation,” said Barry Diller, Chairman and Senior Executive of IAC. “We completed the spin-off of Angi, repurchased 5% of the company, and are optimistic about the possibilities for deploying capital, both within our businesses and finding fertile new ground. DDM, our largest business and the largest publisher in the country, continues to grow digital revenue and profit, even amidst the uncertain landscape. DDM’s sheer scale, loyal audiences, beloved brands like PEOPLE and advertising performance continue to differentiate it from the industry and underscore its growth potential.”
| IAC SUMMARY RESULTS | ||||||||||||||||||||
| ($ in millions except per share amounts) | ||||||||||||||||||||
| Q1 2025 | Q1 2024 | Growth | ||||||||||||||||||
| Revenue | $ | 570.5 | $ | 624.3 | -9 | % | ||||||||||||||
| Operating income (loss) | 35.8 | (63.4) | NM | |||||||||||||||||
| Unrealized (loss) gain on investment in MGM Resorts International | (324.3) | 163.8 | NM | |||||||||||||||||
| Net (loss) earnings | (216.8) | 45.0 | NM | |||||||||||||||||
| Diluted (loss) earnings per share | (2.64) | 0.51 | NM | |||||||||||||||||
| Adjusted EBITDA | 50.9 | 5.5 | 818 | % | ||||||||||||||||
See reconciliations of GAAP to non-GAAP measures beginning on page 16. | ||||||||||||||||||||
Q1 2025 SUMMARY
•IAC completed the spin-off of IAC’s full ownership stake in Angi Inc. on March 31, 2025. Angi Inc. results are reflected as discontinued operations in Q1 2025 and all historical periods.
•Between February 12, 2025 and May 2, 2025, the Company repurchased 4.5 million common shares for an aggregate of $200 million.
◦On March 16, 2025, the Board of Directors approved a new stock repurchase authorization of 10 million shares. As of May 2, 2025, IAC had 9.2 million shares remaining in its share repurchase authorization.
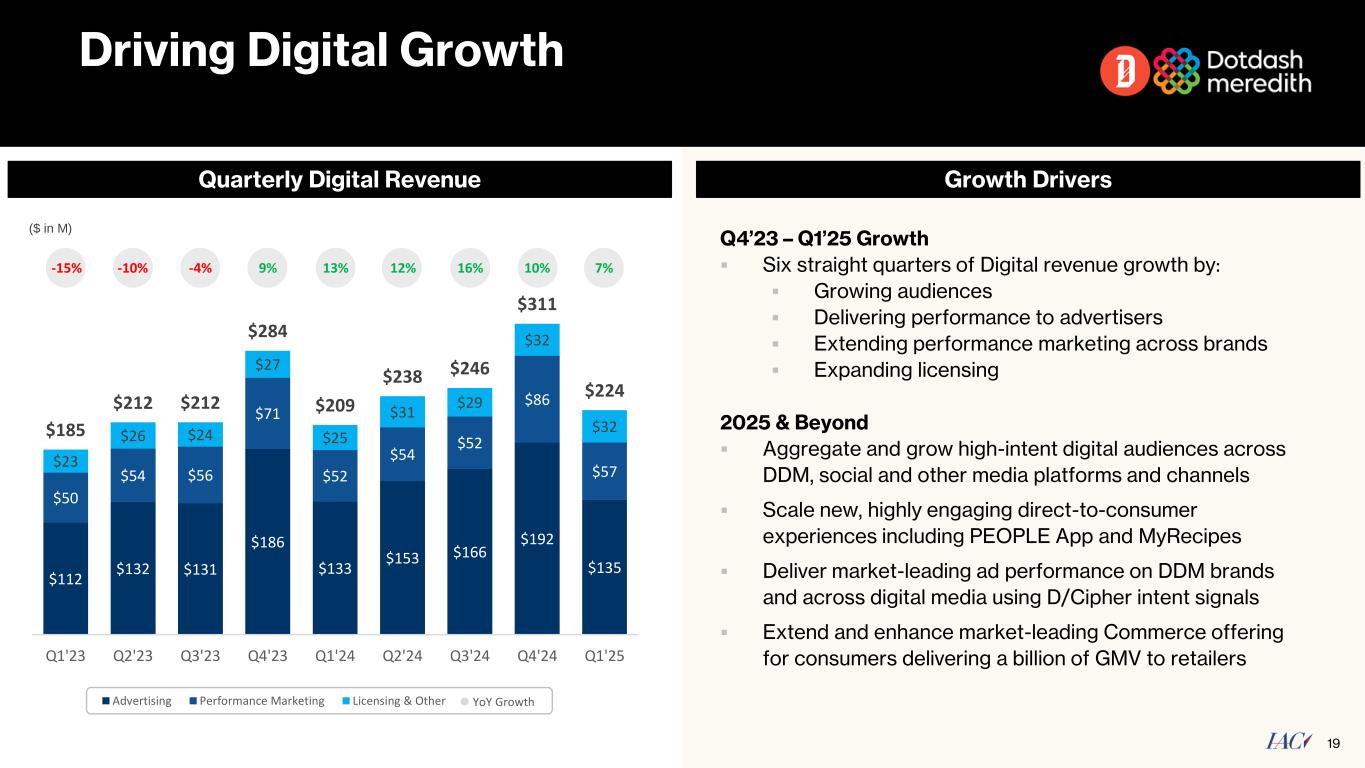
•Dotdash Meredith (“DDM”) Digital revenue increased 7% to $224 million, while Print revenue decreased 7% to $174 million.
◦Total operating income of $43 million increased $64 million driven primarily by a 166% increase in Adjusted EBITDA to $80 million driven by:
▪A $36 million non-cash gain related to the termination of a lease that would otherwise have expired in 2032, which required a total payment of $43 million; the termination reduces future fixed lease payments by $102 million.
▪Digital Adjusted EBITDA increased 15% to $42 million.
▪Print Adjusted EBITDA increased $11 million.
Page 2 of 20
◦Product updates:
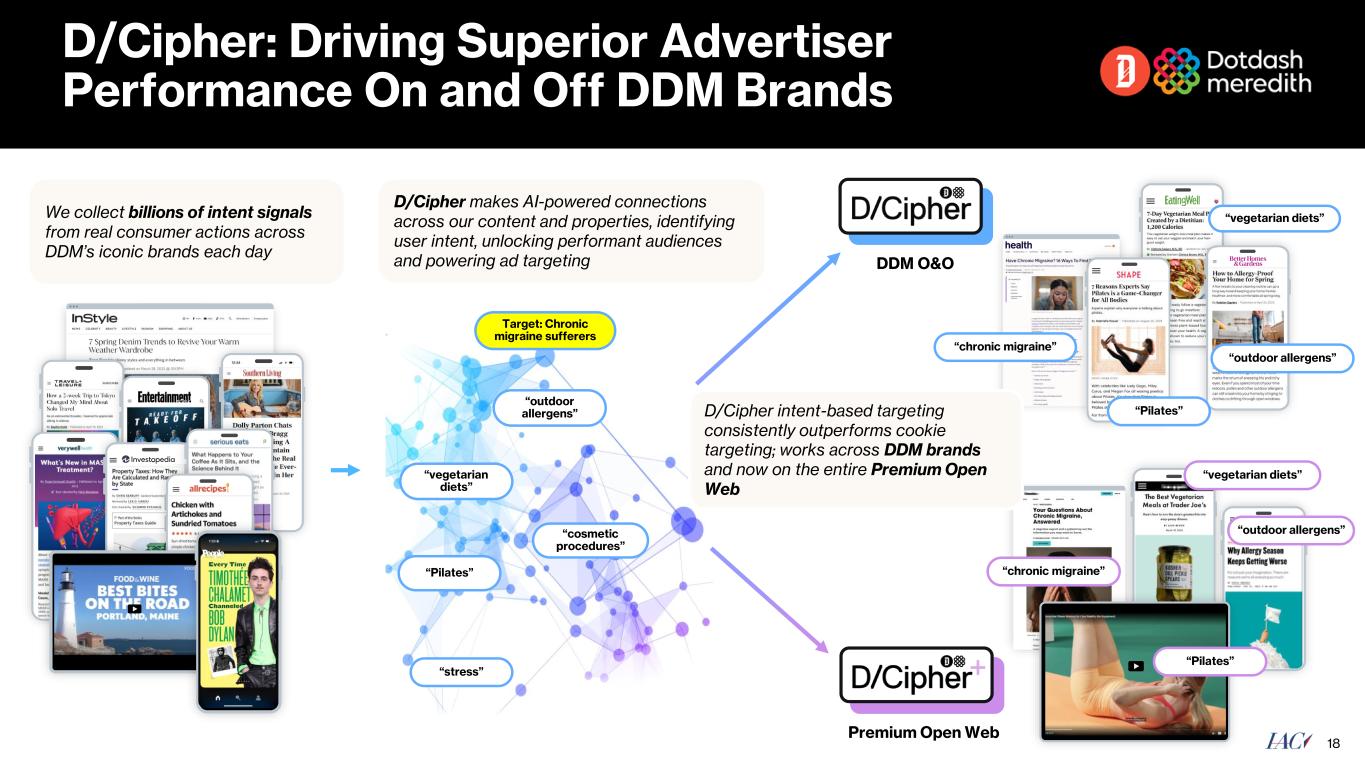
▪On March 17, 2025, DDM announced the appointment of Jim Lawson (former AdTheorent Inc. CEO) as President of D/Cipher to accelerate its expansion as a new standard of ad targeting across the premium open web.
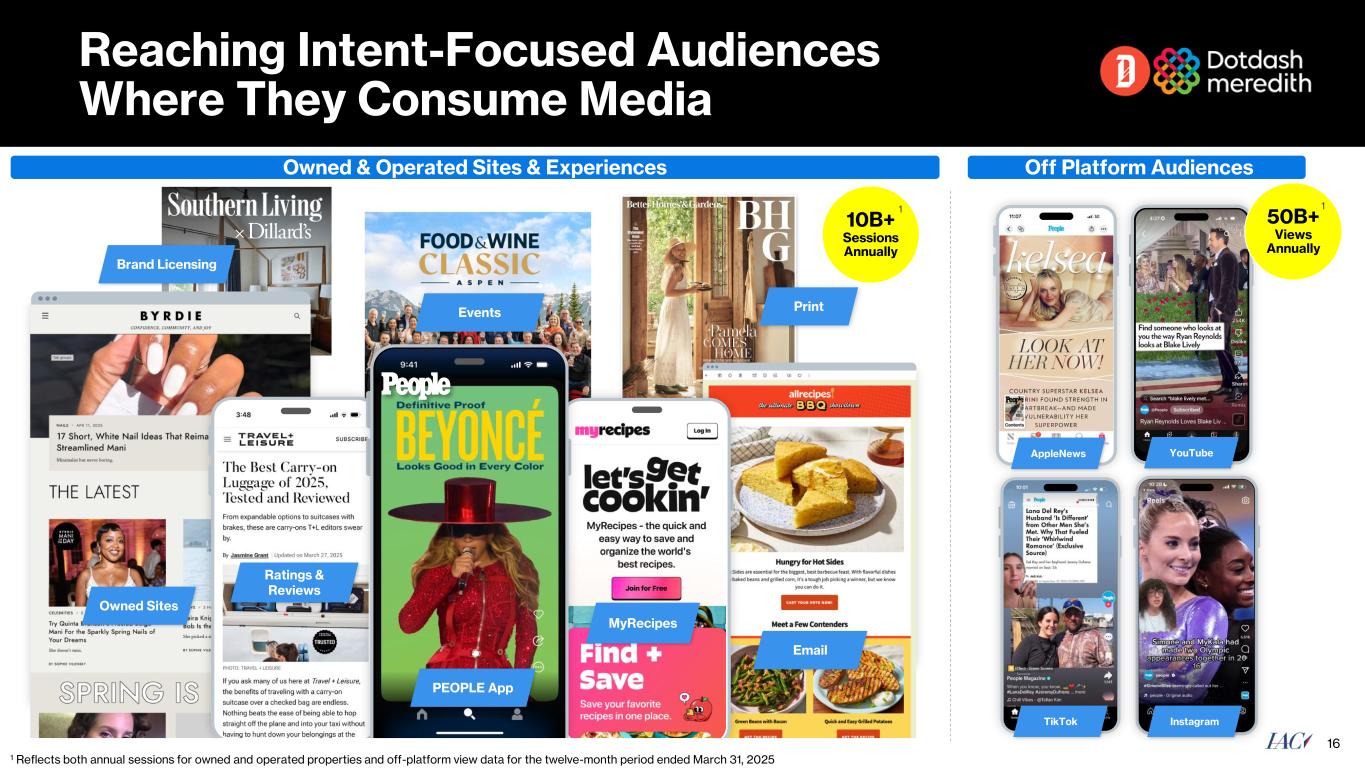
▪On April 10, 2025, DDM unveiled its new PEOPLE App, a scrollable, swipeable and shareable experience with rich image-driven storytelling and exclusive access to video and PEOPLE’s top-rated journalism.
▪MyRecipes, DDM’s new multi-brand recipe locker that helps consumers easily tag and save food content across leading brands like Food & Wine and allrecipes, went live in Q4 2024 and continues to ramp.
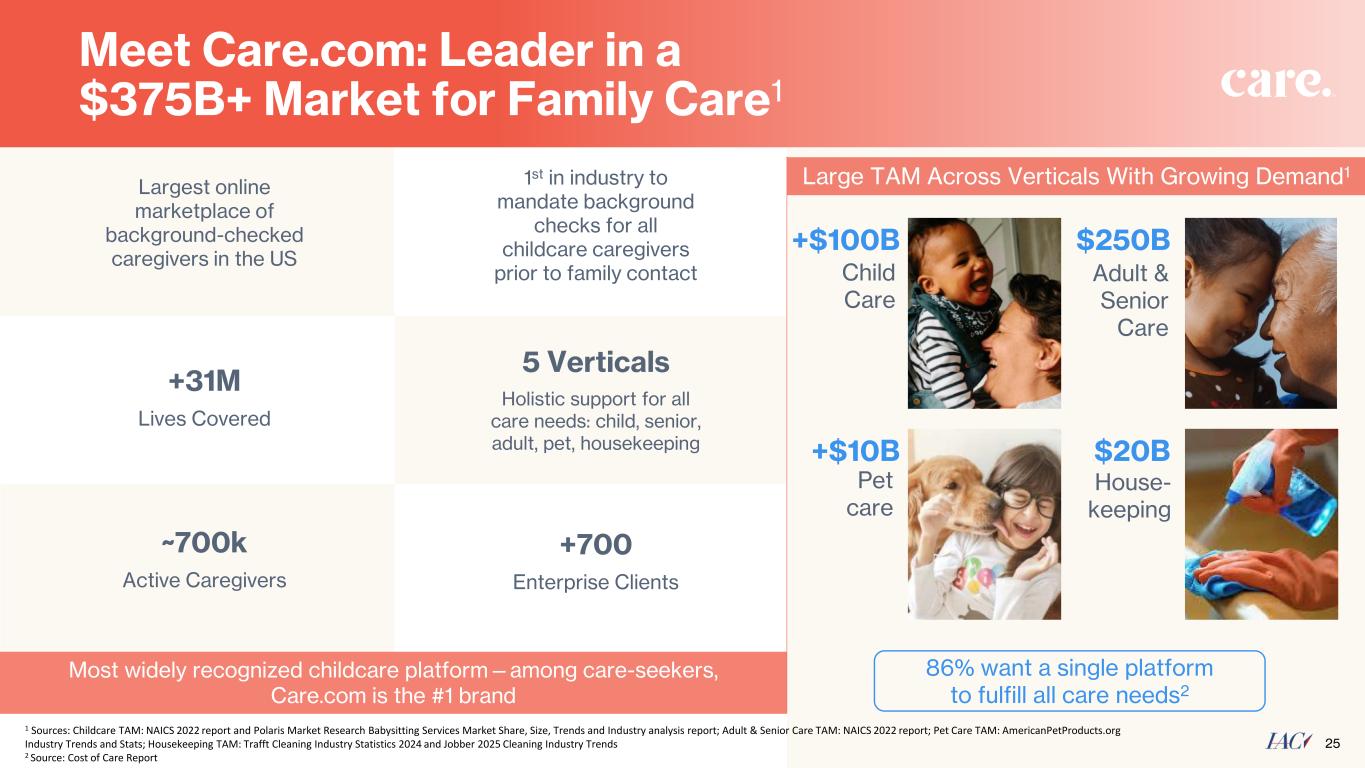
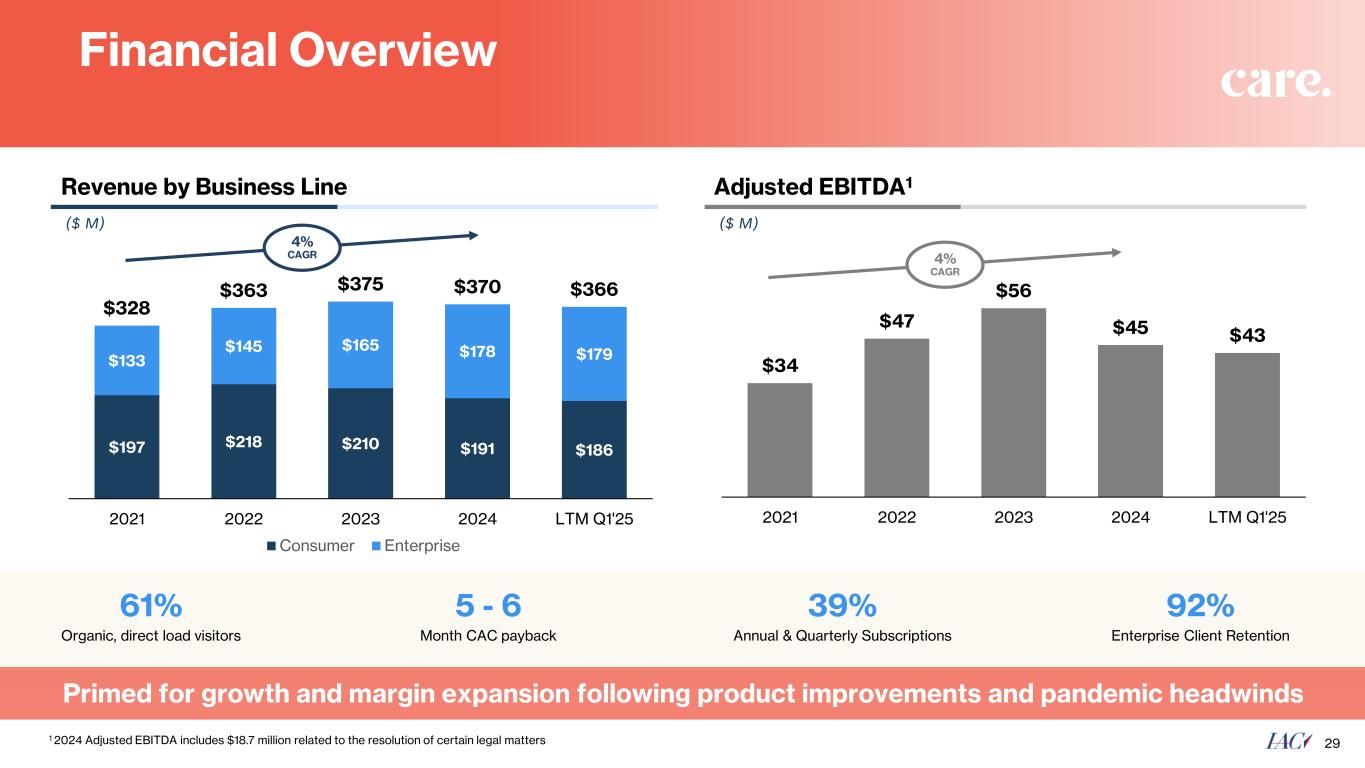
•Care.com revenue was $89 million, operating income was $12 million and Adjusted EBITDA was $14 million.
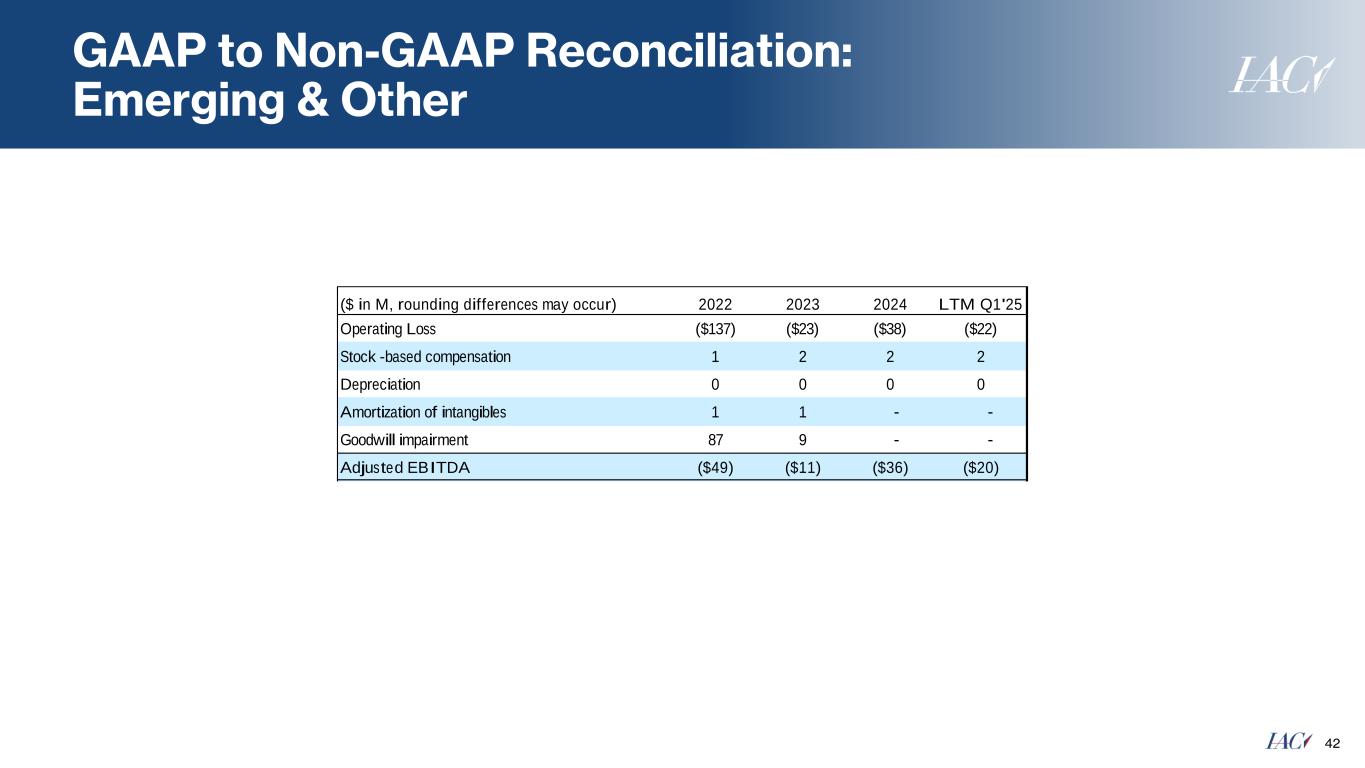
•Emerging & Other revenue decreased 46% year-over-year to $18 million with both operating loss and Adjusted EBITDA loss improving $16 million to $5 million.
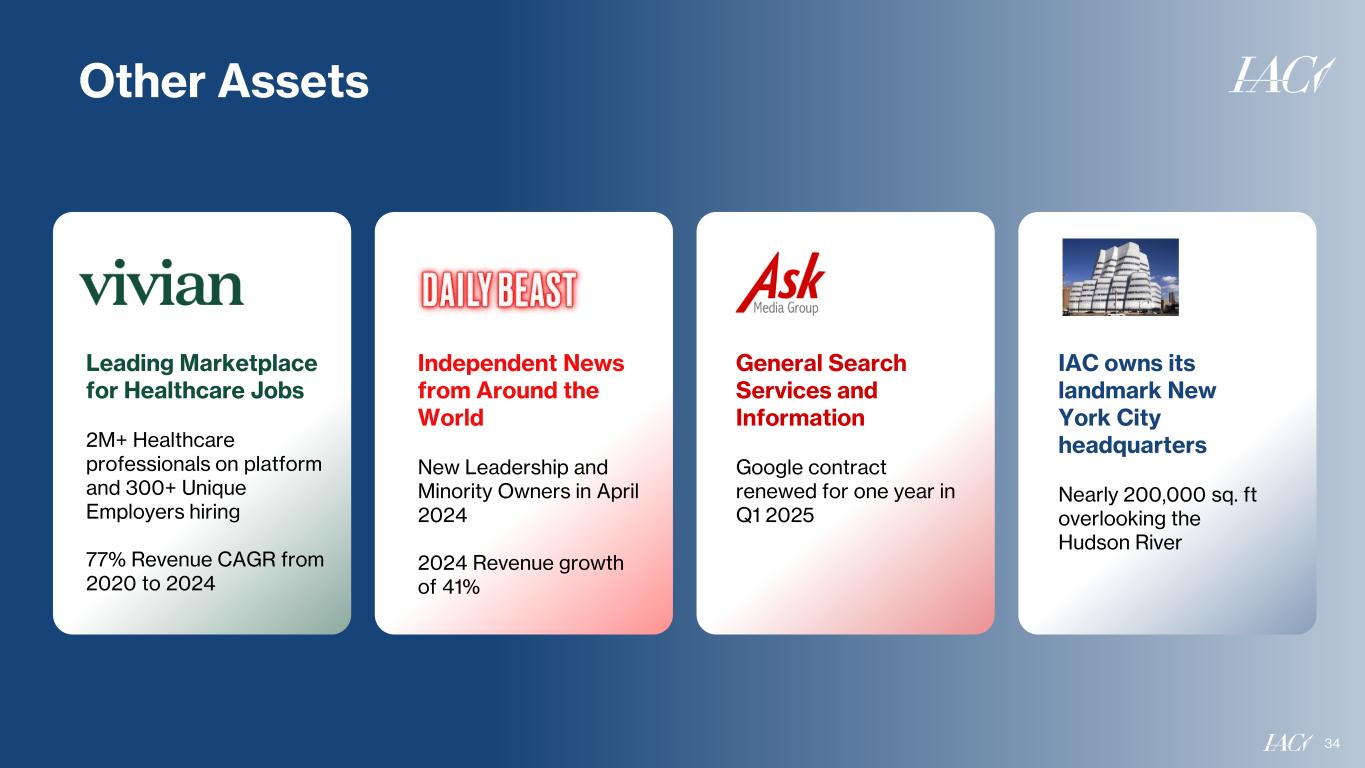
◦Excluding Mosaic Group revenue of $18 million in Q1 2024 (the assets of which were sold on February 15, 2024), revenue would have increased 14% year-over year in Q1 2025 driven by 72% growth from The Daily Beast.
◦Q1 2024 operating loss and Adjusted EBITDA loss included $16 million in severance and transaction-related costs at Mosaic Group related to the sale of the assets of the business.
•See the FY 2025 outlook detail and Q2 2025 outlook commentary on page 15.
Page 3 of 20
DISCUSSION OF FINANCIAL AND OPERATING RESULTS
| ($ in millions, rounding differences may occur) | Q1 2025 | Q1 2024 | Growth | ||||||||||||||
| Revenue | |||||||||||||||||
| DDM | $ | 393.1 | $ | 390.5 | 1 | % | |||||||||||
| Care.com | 88.9 | 92.5 | -4 | % | |||||||||||||
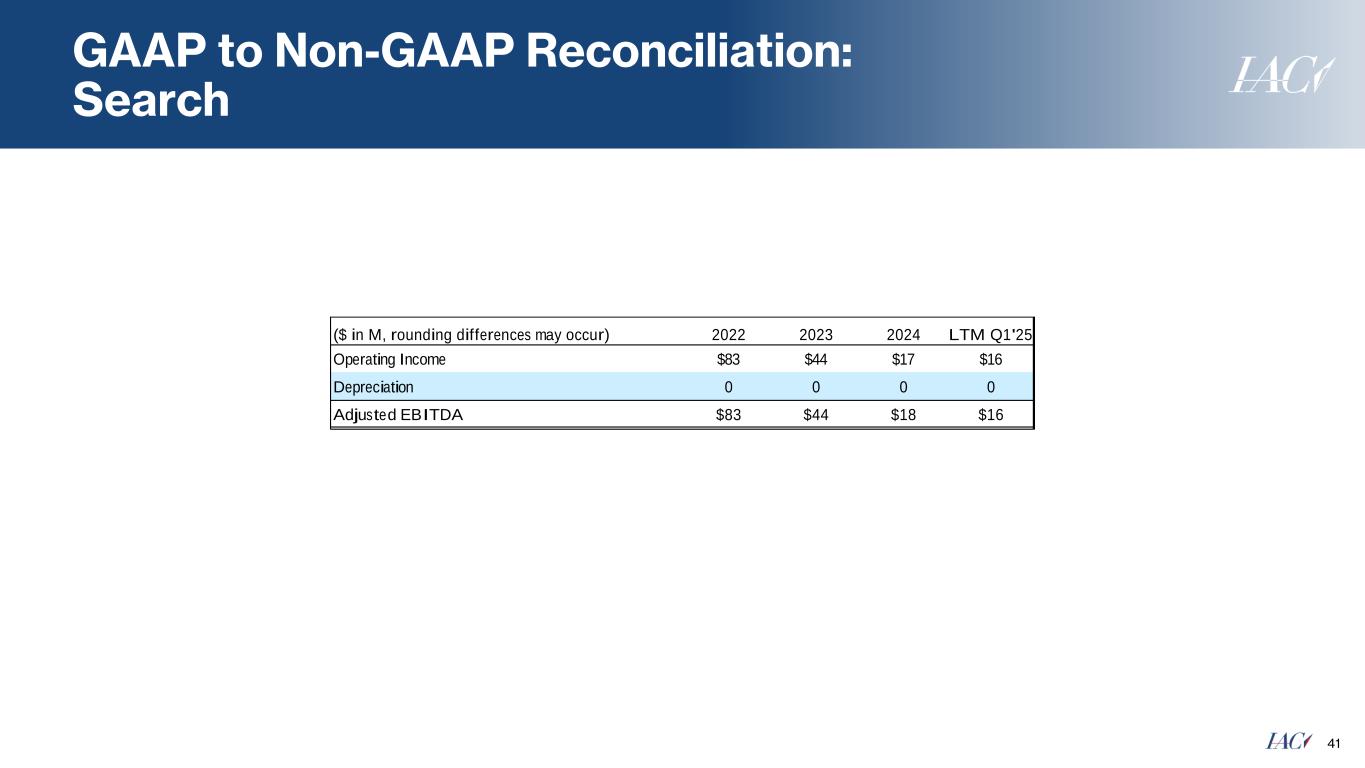
| Search | 70.3 | 108.5 | -35 | % | |||||||||||||
| Emerging & Other | 18.3 | 34.0 | -46 | % | |||||||||||||
| Intersegment eliminations | (0.1) | (1.3) | 96 | % | |||||||||||||
| Total Revenue | $ | 570.5 | $ | 624.3 | -9 | % | |||||||||||
| Operating income (loss) | |||||||||||||||||
| DDM | $ | 43.2 | $ | (20.8) | NM | ||||||||||||
| Care.com | 11.7 | 11.6 | 0 | % | |||||||||||||
| Search | 3.0 | 4.4 | -31 | % | |||||||||||||
| Emerging & Other | (4.9) | (21.1) | 77 | % | |||||||||||||
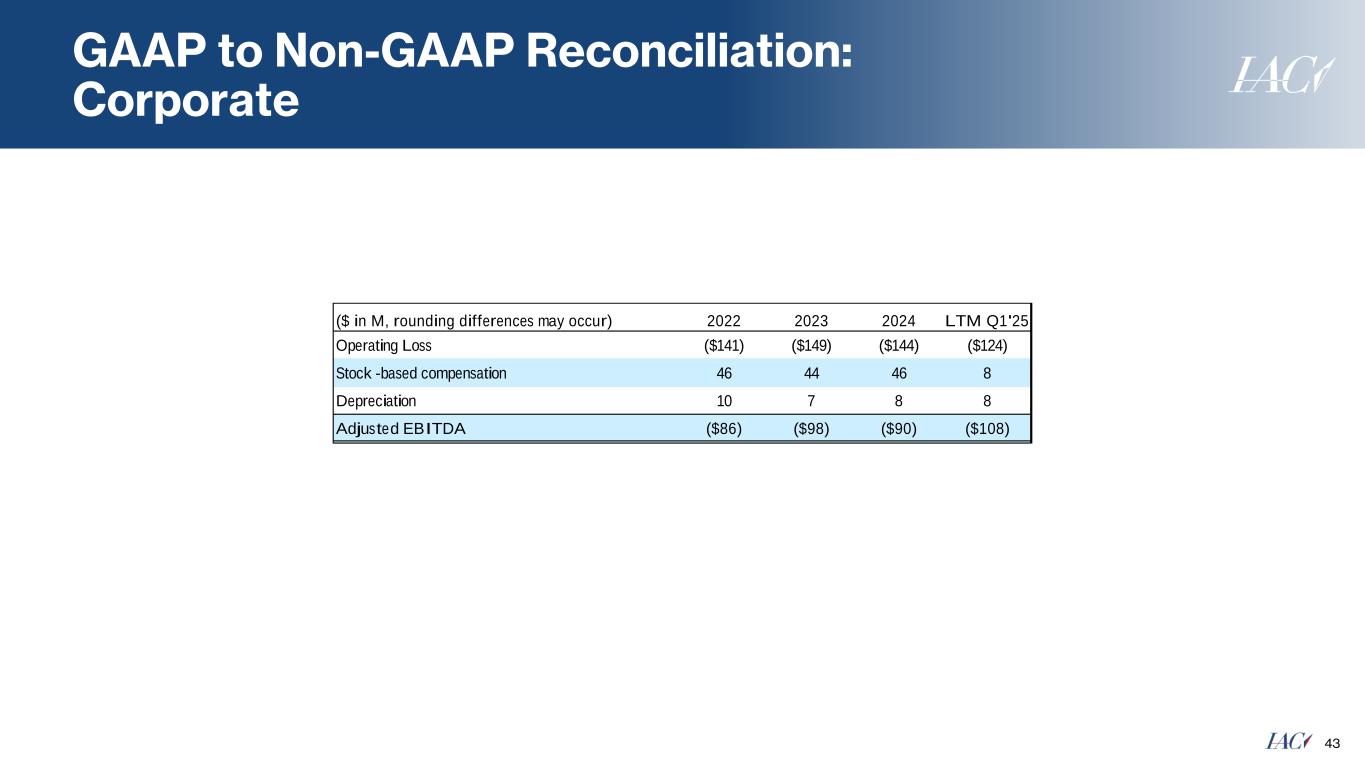
| Corporate | (17.2) | (37.5) | 54 | % | |||||||||||||
| Total Operating income (loss) | $ | 35.8 | $ | (63.4) | NM | ||||||||||||
| Adjusted EBITDA | |||||||||||||||||
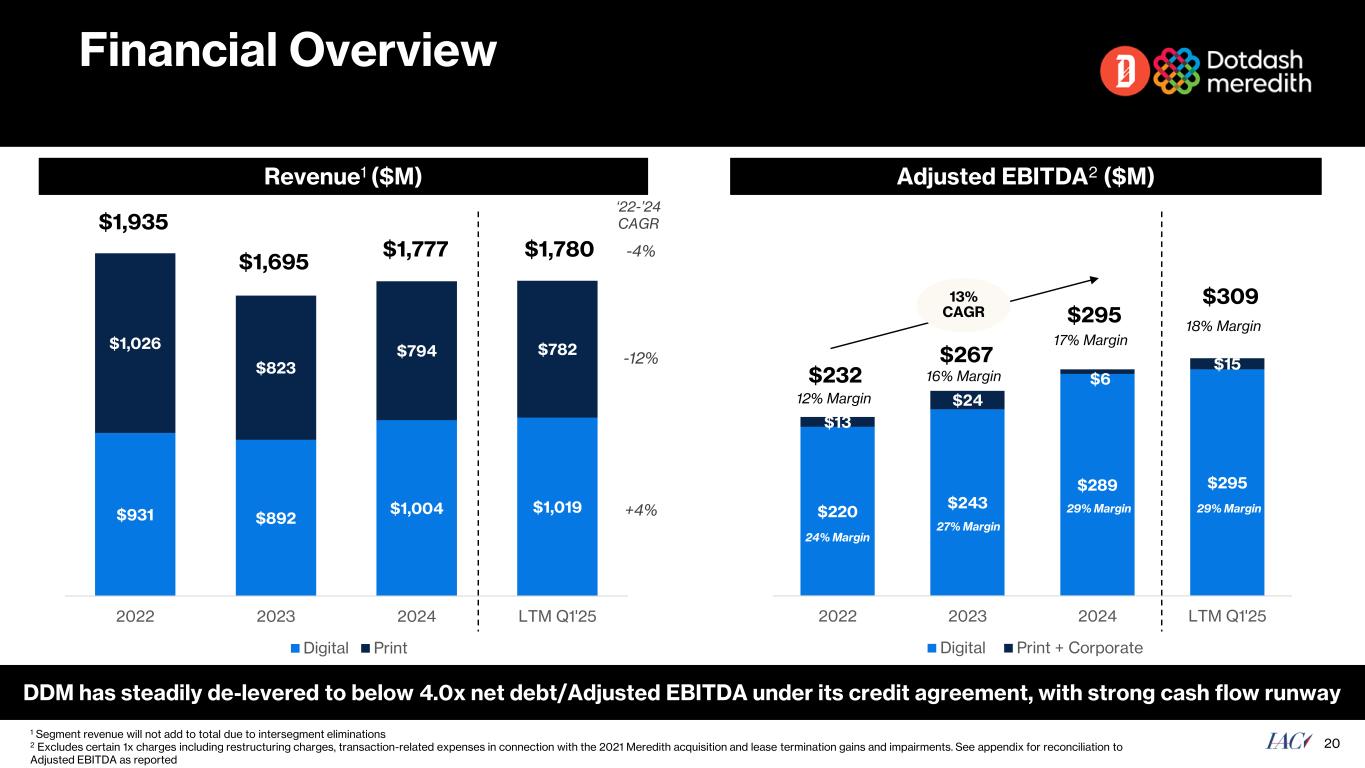
| DDM | $ | 80.3 | $ | 30.2 | 166 | % | |||||||||||
| Care.com | 14.5 | 16.4 | -12 | % | |||||||||||||
| Search | 3.0 | 4.4 | -31 | % | |||||||||||||
| Emerging & Other | (4.5) | (20.6) | 78 | % | |||||||||||||
| Corporate | (42.4) | (24.9) | -71 | % | |||||||||||||
| Total Adjusted EBITDA | $ | 50.9 | $ | 5.5 | 818 | % | |||||||||||
Page 4 of 20
DDM
Revenue
| ($ in millions, rounding differences may occur) | Q1 2025 | Q1 2024 | Growth | ||||||||||||||
| Revenue | |||||||||||||||||
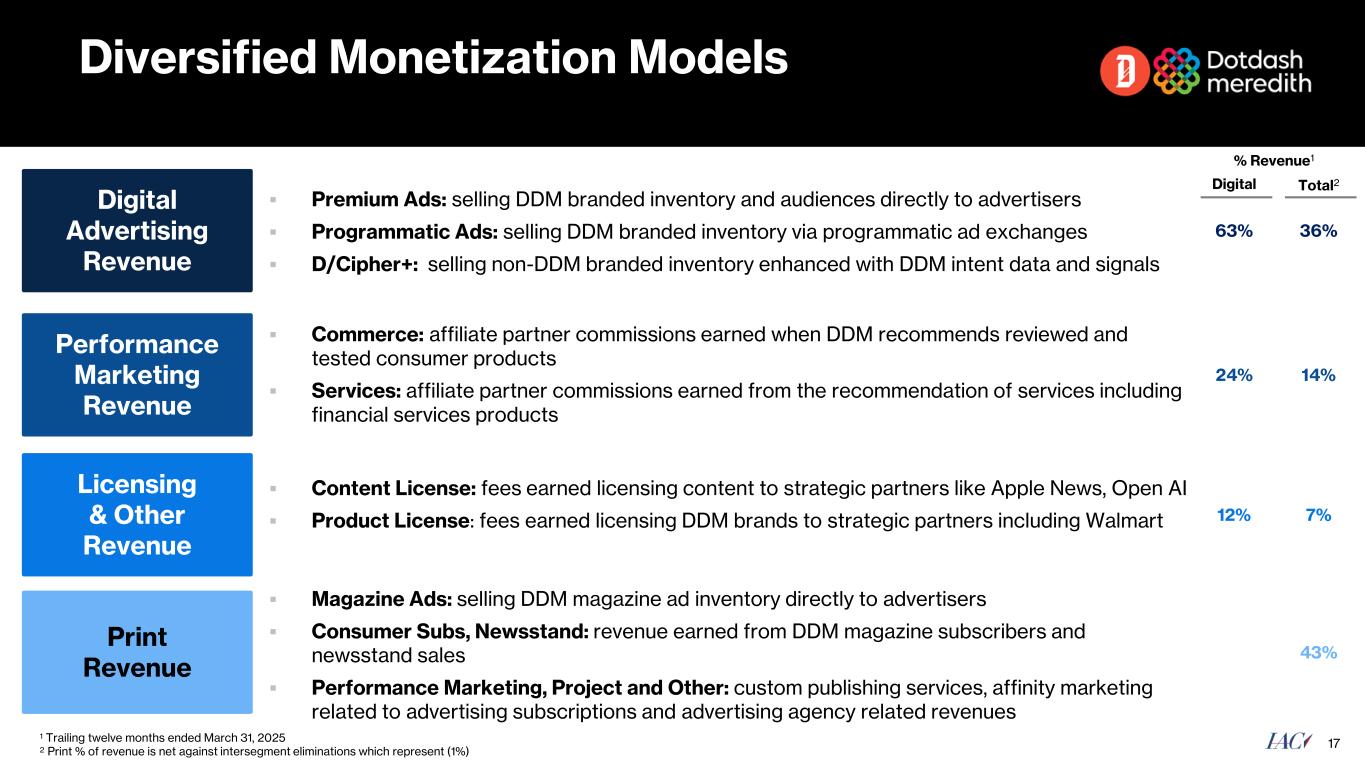
| Digital | $ | 224.2 | $ | 209.3 | 7 | % | |||||||||||
| 173.8 | 185.9 | -7 | % | ||||||||||||||
| Intersegment eliminations | (4.9) | (4.7) | -5 | % | |||||||||||||
| Total | $ | 393.1 | $ | 390.5 | 1 | % | |||||||||||
•Revenue of $393.1 million increased 1% year-over-year reflecting:
◦7% Digital revenue growth driven by:
▪Advertising revenue increased 1%, reflecting:
•Higher premium advertising revenue due primarily to the Technology, Retail and Beauty & Style categories
•Lower programmatic advertising revenue due to lower impression volumes driven by 3% declines in Core Sessions and the higher premium advertising penetration, partially offset by higher rates
▪Performance marketing revenue increased 11% year-over-year driven by 26% affiliate commerce growth, partially offset by revenue declines from services, concentrated primarily in the Finance category
▪Licensing and other revenue increased 30% due primarily to the addition of OpenAI (partnership began in May 2024) and improved performance from content syndication partners and Apple News+
◦7% Print revenue declines driven by the ongoing portfolio optimization and the continued migration of audience and advertising spend from print to digital
Page 5 of 20
Operating Income (Loss) and Adjusted EBITDA
| ($ in millions, rounding differences may occur) | Q1 2025 | Q1 2024 | Growth | ||||||||||||||
| Operating income (loss) | |||||||||||||||||
| Digital | $ | 18.7 | $ | (0.2) | NM | ||||||||||||
| 7.9 | (5.1) | NM | |||||||||||||||
| Other | 16.6 | (15.5) | NM | ||||||||||||||
| Total | $ | 43.2 | $ | (20.8) | NM | ||||||||||||
| Adjusted EBITDA | |||||||||||||||||
| Digital | $ | 42.4 | $ | 37.0 | 15 | % | |||||||||||
| 13.5 | 2.9 | 357 | % | ||||||||||||||
| Other | 24.5 | (9.7) | NM | ||||||||||||||
| Total | $ | 80.3 | $ | 30.2 | 166 | % | |||||||||||
•Operating income of $43.2 million increased $64.0 million reflecting:
◦Digital operating income of $18.7 million compared to a loss of $0.2 million in Q1 2024 reflecting:
▪$11.4 million lower amortization of intangibles due to certain definite lived intangible assets that fully amortized in the prior year
▪Adjusted EBITDA growth of 15% to $42.4 million due to higher revenue, partially offset by higher cost of sales and higher online marketing spend
◦Print operating income of $7.9 million compared to a loss of $5.1 million in Q1 2024 reflecting:
▪Adjusted EBITDA increased $10.5 million to $13.5 million due to lower operating expenses resulting from continued cost rationalization, partially offset by revenue declines
▪$1.4 million lower amortization of intangibles and $1.1 million lower depreciation
◦Other operating income of $16.6 million compared to a loss of $15.5 million in Q1 2024 reflecting:
▪Adjusted EBITDA of $24.5 million compared to a loss of $9.7 million in Q1 2024 due primarily to a $36.2 million non-cash gain related to a lease termination
▪$3.5 million higher depreciation due primarily to accelerated expense related to the lease termination
Page 6 of 20
Care.com
•Revenue decreased 4% to $88.9 million reflecting:
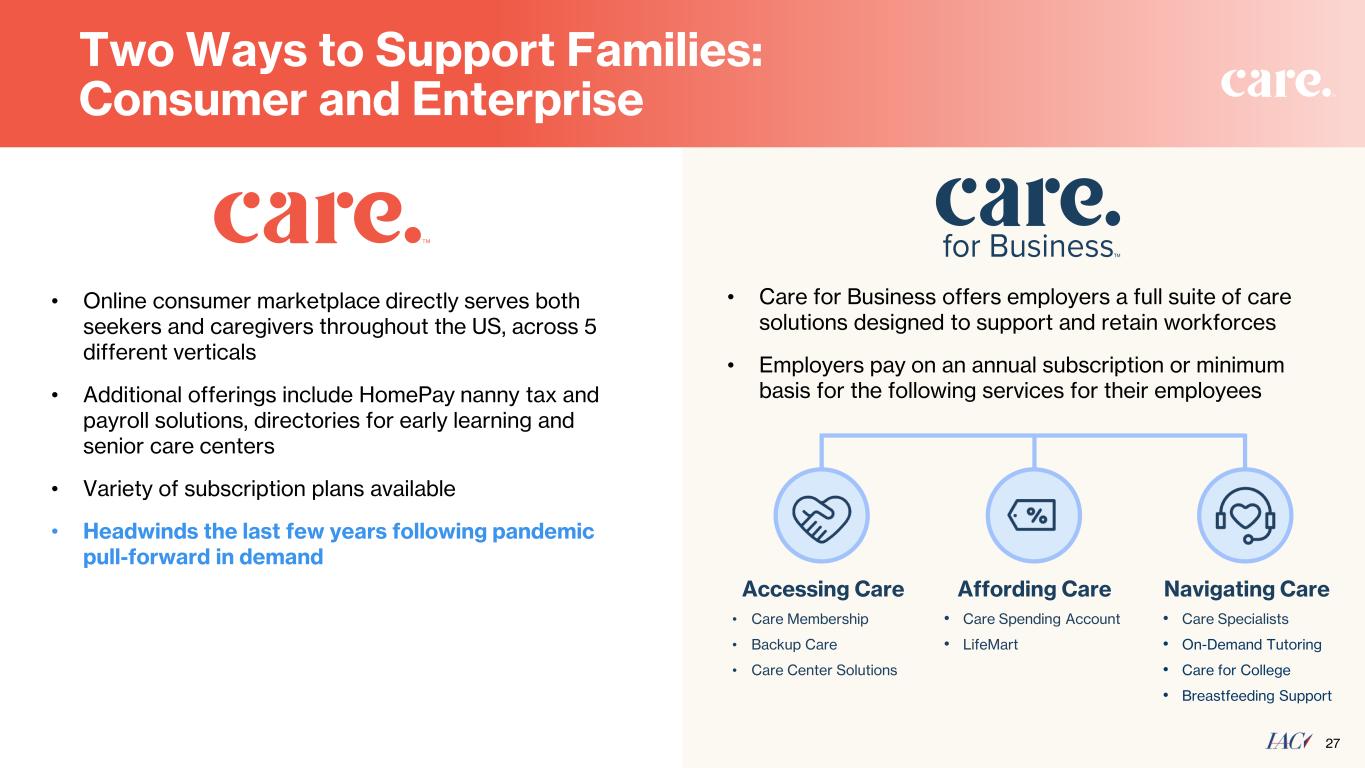
◦9% decrease in Consumer revenue driven by lower subscriptions on the Care.com platform
◦3% increase in Enterprise revenue primarily driven by an increase in back-up care utilization
•Operating income of $11.7 million was flat compared to Q1 2024 reflecting:
◦ Adjusted EBITDA declined 12% to $14.5 million due primarily to the lower revenue and higher compensation costs, partially offset by lower selling and marketing expense
◦$1.1 million lower depreciation
Search
•Revenue decreased 35% to $70.3 million reflecting:
◦36% decrease at Ask Media Group due to a reduction in traffic acquisition costs driving fewer visitors to ad-supported search and content websites
◦32% decrease at Desktop (legacy desktop search software business)
•Operating income of $3.0 million reflecting Adjusted EBITDA decreasing 31% to $3.0 million due primarily to lower revenue, partially offset by lower traffic acquisition costs and lower compensation costs
Emerging & Other
•Revenue decreased 46% to $18.3 million reflecting:
◦The sale of Mosaic Group on February 15, 2024 ($17.9 million included in Q1 2024)
◦72% growth from The Daily Beast
◦7% decrease at Vivian Health
•Operating loss decreased $16.2 million to $4.9 million driven by the decrease in Adjusted EBITDA loss of $16.1 million to $4.5 million reflecting:
◦Mosaic Group losses of $14.0 million in Q1 2024 including $16.5 million in severance and transaction-related costs related to the sale of the assets of the business
◦Profits at The Daily Beast and Vivian Health as compared to losses in Q1 2024
◦Higher legal fees
Page 7 of 20
Corporate
Operating loss decreased $20.3 million to $17.2 million reflecting:
•The net reversal of $34.9 million in stock-based compensation expense related primarily to the forfeiture of the former IAC CEO’s restricted stock award on January 13, 2025, pursuant to his employment transition agreement (the “ETA”)
•$17.5 million higher Adjusted EBITDA losses driven primarily by $14.5 million in separation benefits pursuant to the ETA, $4.8 million of transaction-related costs related to the spin-off of Angi Inc. and $1.8 million in severance related to other headcount reductions
Investment in MGM
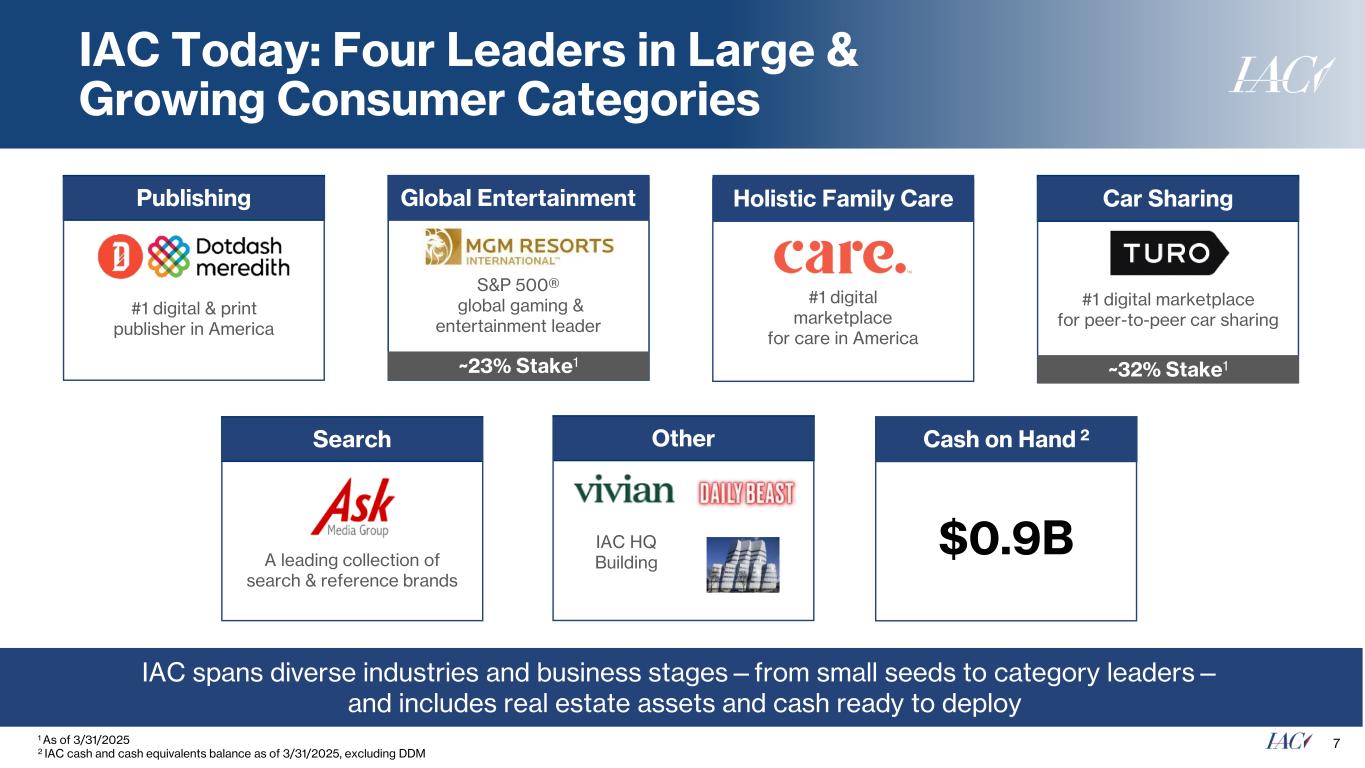
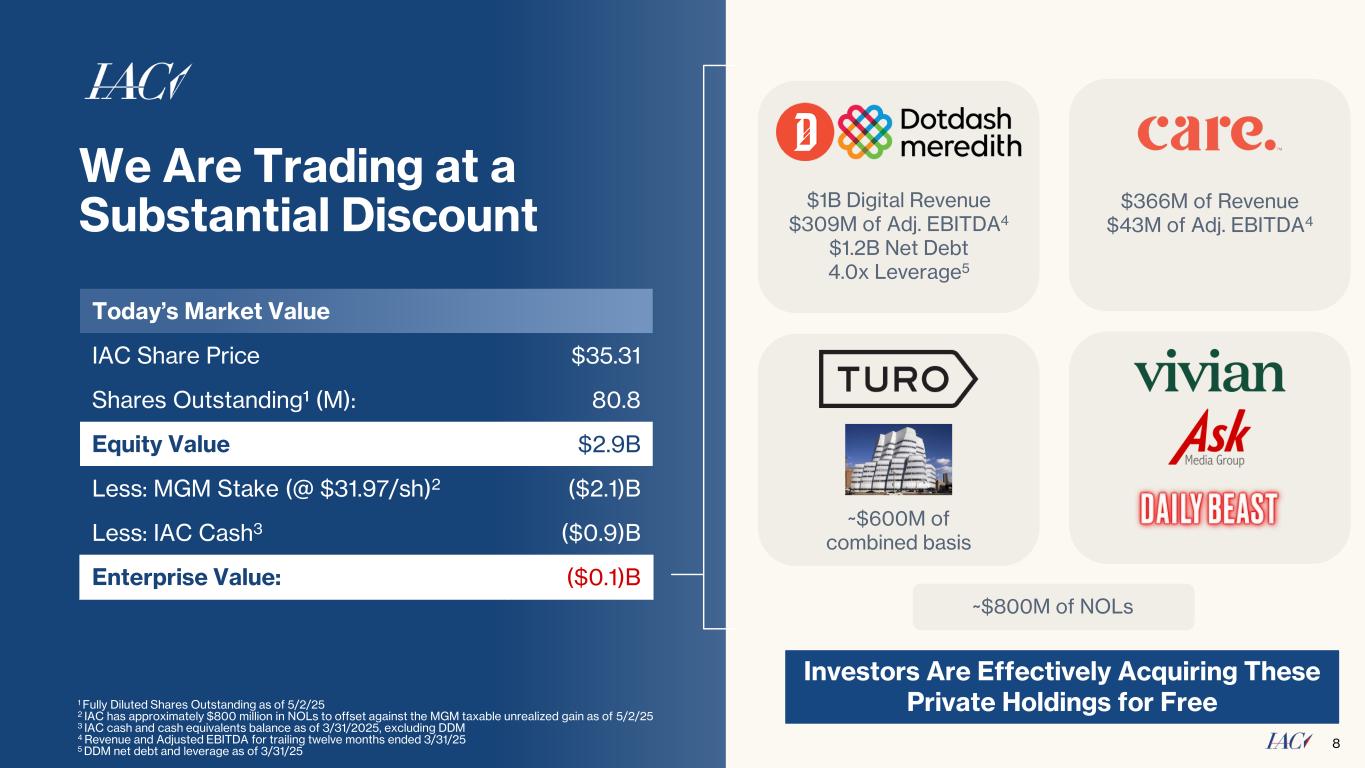
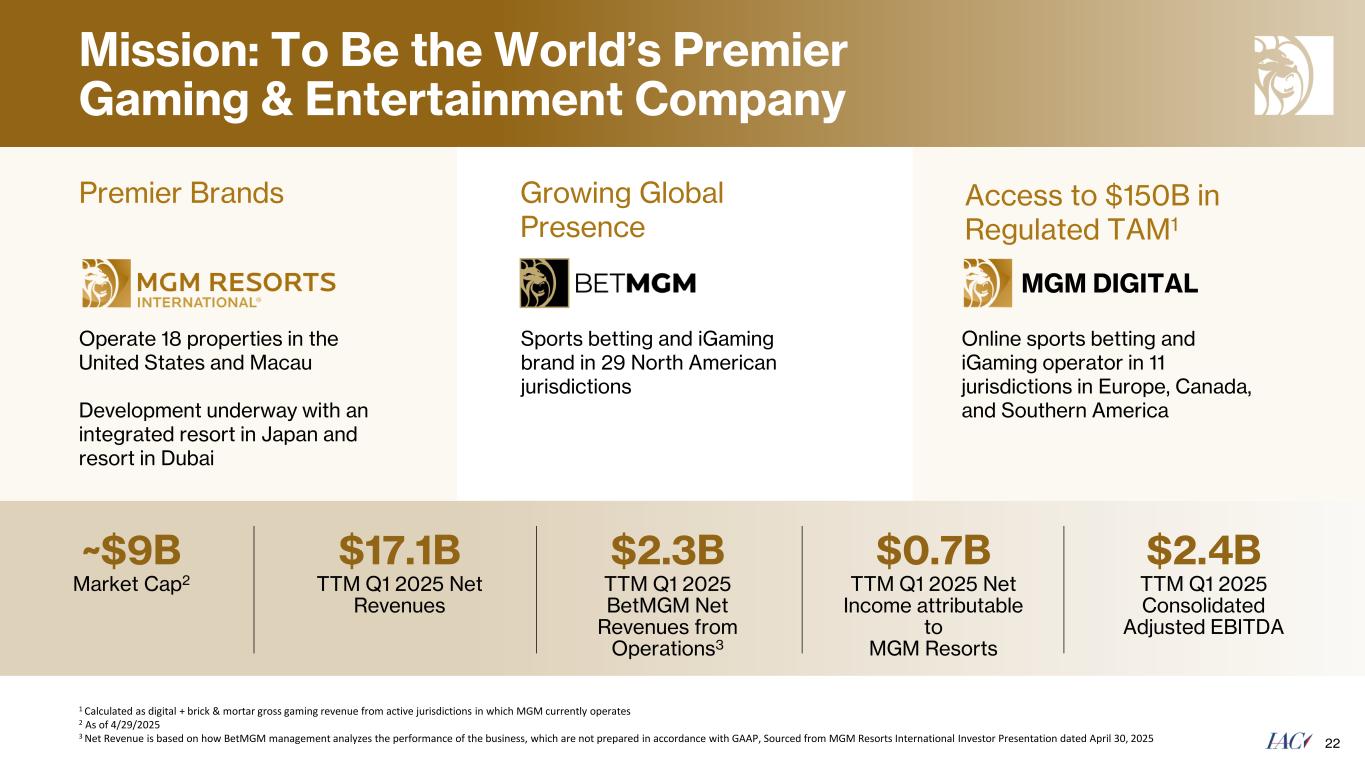
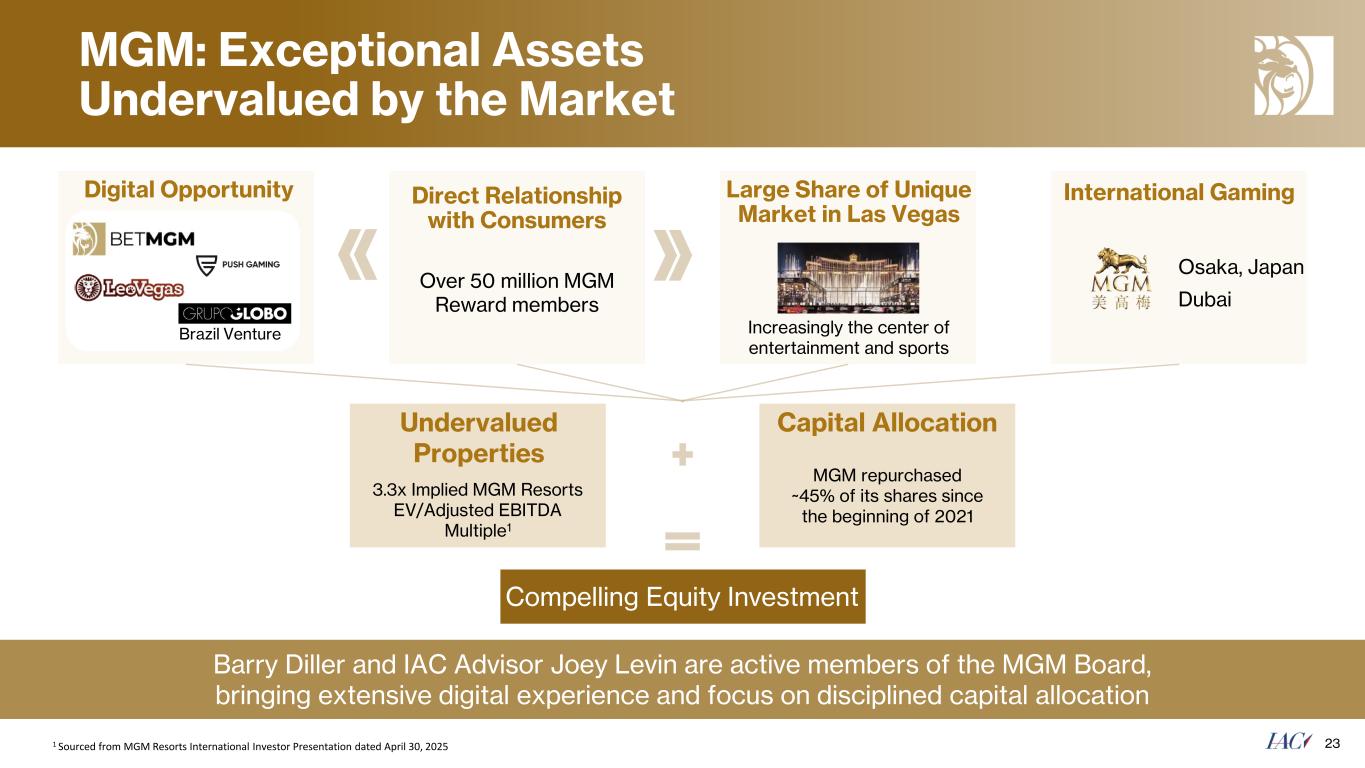
IAC holds 64.7 million shares of MGM Resorts International (“MGM”), which were purchased for $1.3 billion, and were worth $2.1 billion as of May 2, 2025. Net earnings (loss) and diluted earnings (loss) per share reflect changes in MGM’s share price as unrealized gains and losses and, as a result, can be very volatile, which reduces their ability to be effective measures to assess operating performance.
Income Taxes
The Company recorded an income tax benefit of $79.2 million in Q1 2025 for an effective tax rate of 26%, which was higher than the statutory rate due primarily to state taxes and the nontaxable stock-based compensation expense reversal (discussed above). In Q1 2024, the Company recorded an income tax provision of $46.5 million for an effective tax rate of 48%, which was higher than the statutory rate due primarily to the nondeductible portion of the goodwill in the sale of assets of Mosaic Group and nondeductible expenses, partially offset by the realization of a capital loss and research credits.
Page 8 of 20
Free Cash Flow
For the three months ended March 31, 2025, net cash provided by operating activities attributable to continuing operations was $0.1 million, a $40.2 million decrease year-over-year. Free Cash Flow decreased $41.9 million to negative $4.6 million due primarily to unfavorable working capital (including a $21.6 million payment at DDM related to the termination of a lease) and higher capital expenditures, partially offset by higher Adjusted EBITDA.
| Three Months Ended March 31, | |||||||||||
| ($ in millions, rounding differences may occur) | 2025 | 2024 | |||||||||
| Net cash provided by operating activities attributable to continuing operations | $ | 0.1 | $ | 40.2 | |||||||
| Capital expenditures | (4.7) | (2.9) | |||||||||
| Free cash flow | $ | (4.6) | $ | 37.3 | |||||||
CONFERENCE CALL
IAC will host a conference call to answer questions regarding its first quarter results on Tuesday, May 6, 2025, at 8:30 a.m. Eastern Time. This conference call will include the disclosure of certain information, including forward-looking information, which may be material to an investor’s understanding of IAC’s business. The conference call will be accessible to the public at ir.iac.com. The investor presentation and a recording of the webcast will also be made available at the same location.
Page 9 of 20
LIQUIDITY AND CAPITAL RESOURCES
As of March 31, 2025:
•IAC had 80.1 million shares of common stock and Class B common stock outstanding.
•The Company had $1.2 billion in cash and cash equivalents of which IAC held $917 million and DDM held $243 million.
•The Company had $1.5 billion in long-term debt, which was held at DDM.
•IAC owned 64.7 million shares of MGM.
Between February 12, 2025 and May 2, 2025, the Company repurchased 4.5 million common shares for an aggregate of $200.0 million.
On March 16, 2025, the Company’s Board of Directors approved a new stock repurchase authorization of 10 million shares (the “2025 Share Authorization”). As of May 2, 2025, IAC had 9.2 million shares remaining in the 2025 Share Authorization.
Pursuant to the 2025 Share Authorization, share repurchases can be made over an indefinite period of time in the open market and in privately negotiated transactions, depending on those factors management deems relevant at any particular time, including, without limitation, market conditions, price and future outlook.
As of March 31, 2025, DDM’s net consolidated leverage ratio defined in its credit agreement remained below 4.0x, providing IAC with increased financial flexibility.
DDM has a $150 million revolving credit facility, which had no borrowings outstanding as of March 31, 2025 and currently has no borrowings outstanding.
Page 10 of 20
OPERATING METRICS
($ in millions; rounding differences may occur)
| Q1 2025 | Q1 2024 | Growth | |||||||||||||||
| DDM | |||||||||||||||||
| Revenue | |||||||||||||||||
| Advertising revenue | $ | 134.6 | $ | 132.9 | 1 | % | |||||||||||
| Performance marketing revenue | 57.3 | 51.5 | 11 | % | |||||||||||||
| Licensing and other revenue | 32.4 | 24.9 | 30 | % | |||||||||||||
| Total Digital Revenue | $ | 224.2 | $ | 209.3 | 7 | % | |||||||||||
| Print Revenue | 173.8 | 185.9 | -7 | % | |||||||||||||
| Intersegment eliminations | (4.9) | (4.7) | 5 | % | |||||||||||||
| Total Revenue | $ | 393.1 | $ | 390.5 | 1 | % | |||||||||||
| Digital metrics | |||||||||||||||||
| Total Sessions (in millions) | 2,484 | 2,750 | -10 | % | |||||||||||||
| Core Sessions (in millions) | 2,211 | 2,273 | -3 | % | |||||||||||||
| Care.com | |||||||||||||||||
| Revenue | |||||||||||||||||
| Consumer | $ | 47.5 | $ | 52.3 | -9 | % | |||||||||||
| Enterprise | 41.3 | 40.2 | 3 | % | |||||||||||||
| Total Revenue | $ | 88.9 | $ | 92.5 | -4 | % | |||||||||||
| Search | |||||||||||||||||
| Revenue | |||||||||||||||||
| Ask Media Group | $ | 57.7 | $ | 90.0 | -36 | % | |||||||||||
| Desktop | 12.6 | 18.5 | -32 | % | |||||||||||||
| Total Revenue | $ | 70.3 | $ | 108.5 | -35 | % | |||||||||||
See metric definitions on page 19
Page 11 of 20
DILUTIVE SECURITIES
IAC has various dilutive securities. The table below details these securities as well as potential dilution at various stock prices (shares in millions; rounding differences may occur).
| Shares | Avg Exercise Price | As of 05/02/25 | Dilution at: | ||||||||||||||||||||||||||
| Share Price | $ | 35.31 | $ | 40.00 | $ | 45.00 | $ | 50.00 | $ | 55.00 | |||||||||||||||||||
Absolute Shares as of 05/02/25 | 79.8 | 79.8 | 79.8 | 79.8 | 79.8 | 79.8 | |||||||||||||||||||||||
| RSUs and non-publicly traded subsidiary denominated equity awards | 2.8 | 0.8 | 0.7 | 0.7 | 0.7 | 0.7 | |||||||||||||||||||||||
| Options | 1.2 | $ | 10.40 | 0.2 | 0.2 | 0.3 | 0.3 | 0.3 | |||||||||||||||||||||
| Total Dilution | 1.0 | 1.0 | 1.0 | 1.0 | 1.0 | ||||||||||||||||||||||||
| % Dilution | 1.2 | % | 1.2 | % | 1.2 | % | 1.2 | % | 1.3 | % | |||||||||||||||||||
| Total Diluted Shares Outstanding | 80.8 | 80.8 | 80.8 | 80.8 | 80.9 | ||||||||||||||||||||||||
The dilutive securities presentation is calculated using the methods and assumptions described below, which are different from those used for GAAP dilution, which is calculated based on the treasury stock method.
The Company currently settles all equity awards on a net basis; therefore, the dilutive effect is presented as the net number of shares expected to be issued upon vesting or exercise, and in the case of options, assuming no proceeds are received by the Company. Any required withholding taxes are paid in cash by the Company on behalf of the employees. In addition, the estimated income tax benefit from the tax deduction received upon the vesting or exercise of these awards is assumed to be used to repurchase IAC shares. Assuming all awards were exercised or vested on May 2, 2025, withholding taxes payable by the Company on behalf of the employees upon net settlement would have been $64.0 million (of which approximately 60% would be payable for awards currently vested and those vesting on or before March 31, 2026), assuming a stock price of $35.31 and a 50% withholding rate. The table above assumes no change in the fair value estimate of the non-publicly traded subsidiary denominated equity awards from the values used at March 31, 2025. The number of shares ultimately needed to settle these awards and the cash withholding tax obligation may vary significantly as a result of the determination of the fair value of the relevant subsidiary. In addition, the number of shares required to settle these awards will be impacted by movement in the stock price of IAC.
Page 12 of 20
GAAP FINANCIAL STATEMENTS
IAC CONSOLIDATED STATEMENT OF OPERATIONS
($ in thousands except per share data)
| Three Months Ended March 31, | |||||||||||
| 2025 | 2024 | ||||||||||
| Revenue | $ | 570,489 | $ | 624,290 | |||||||
| Operating costs and expenses: | |||||||||||
| Cost of revenue (exclusive of depreciation shown separately below) | 205,283 | 259,467 | |||||||||
| Selling and marketing expense | 180,914 | 188,077 | |||||||||
| General and administrative expense | 62,824 | 127,472 | |||||||||
| Product development expense | 50,213 | 63,243 | |||||||||
| Depreciation | 11,946 | 12,724 | |||||||||
| Amortization of intangibles | 23,533 | 36,728 | |||||||||
| Total operating costs and expenses | 534,713 | 687,711 | |||||||||
| Operating income (loss) | 35,776 | (63,421) | |||||||||
| Interest expense | (28,314) | (34,680) | |||||||||
| Unrealized (loss) gain on investment in MGM Resorts International | (324,265) | 163,751 | |||||||||
| Other income, net | 7,688 | 30,321 | |||||||||
| (Loss) earnings from continuing operations before income taxes | (309,115) | 95,971 | |||||||||
| Income tax benefit (provision) | 79,234 | (46,527) | |||||||||
| Net (loss) earnings from continuing operations | (229,881) | 49,444 | |||||||||
| Earnings (loss) from discontinued operations, net of tax | 15,313 | (4,472) | |||||||||
| Net (loss) earnings | (214,568) | 44,972 | |||||||||
| Net (earnings) loss attributable to noncontrolling interests | (2,237) | 59 | |||||||||
| Net (loss) earnings attributable to IAC shareholders | $ | (216,805) | $ | 45,031 | |||||||
| Per share information from continuing operations: | |||||||||||
| Basic (loss) earnings per share | $ | (2.80) | $ | 0.58 | |||||||
| Diluted (loss) earnings per share | $ | (2.80) | $ | 0.56 | |||||||
| Per share information attributable to IAC Common Stock and Class B common stock shareholders: | |||||||||||
| Basic (loss) earnings per share | $ | (2.64) | $ | 0.52 | |||||||
| Diluted (loss) earnings per share | $ | (2.64) | $ | 0.51 | |||||||
| Stock-based compensation expense by function: | |||||||||||
| Cost of revenue | $ | 339 | $ | 493 | |||||||
| Selling and marketing expense | 771 | 409 | |||||||||
| General and administrative expense | (22,053) | 17,761 | |||||||||
| Product development expense | 543 | 847 | |||||||||
| Total stock-based compensation expense | $ | (20,400) | $ | 19,510 | |||||||
Page 13 of 20
IAC CONSOLIDATED BALANCE SHEET
($ in thousands)
| March 31, 2025 | December 31, 2024 | ||||||||||
| ASSETS | |||||||||||
| Cash and cash equivalents | $ | 1,159,225 | $ | 1,381,736 | |||||||
| Accounts receivable, net | 391,804 | 483,020 | |||||||||
| Other current assets | 142,723 | 125,208 | |||||||||
| Current assets of discontinued operations | — | 495,072 | |||||||||
| Total current assets | 1,693,752 | 2,485,036 | |||||||||
| Buildings, land, equipment, leasehold improvements and capitalized software, net | 307,883 | 313,197 | |||||||||
| Goodwill | 1,993,302 | 1,993,302 | |||||||||
| Intangible assets, net of accumulated amortization | 530,940 | 554,473 | |||||||||
| Investment in MGM Resorts International | 1,918,407 | 2,242,672 | |||||||||
| Long-term investments | 420,489 | 438,534 | |||||||||
| Other non-current assets | 322,352 | 324,901 | |||||||||
| Non-current assets of discontinued operations | — | 1,336,529 | |||||||||
| TOTAL ASSETS | $ | 7,187,125 | $ | 9,688,644 | |||||||
| LIABILITIES AND SHAREHOLDERS' EQUITY | |||||||||||
| LIABILITIES: | |||||||||||
| Current portion of long-term debt | $ | 42,331 | $ | 35,000 | |||||||
| Accounts payable, trade | 47,002 | 53,672 | |||||||||
| Deferred revenue | 78,567 | 56,560 | |||||||||
| Accrued expenses and other current liabilities | 459,496 | 509,299 | |||||||||
| Current liabilities of discontinued operations | — | 231,661 | |||||||||
| Total current liabilities | 627,396 | 886,192 | |||||||||
| Long-term debt, net | 1,419,544 | 1,435,007 | |||||||||
| Deferred income taxes | 73,085 | 153,850 | |||||||||
| Other long-term liabilities | 304,368 | 372,950 | |||||||||
| Non-current liabilities of discontinued operations | — | 536,257 | |||||||||
| Redeemable noncontrolling interests | 25,294 | 25,415 | |||||||||
| Commitments and contingencies | |||||||||||
| SHAREHOLDERS' EQUITY: | |||||||||||
| Common stock, $0.0001 par value | 8 | 8 | |||||||||
| Class B common stock, $0.0001 par value | 1 | 1 | |||||||||
| Additional paid-in-capital | 5,913,590 | 6,380,700 | |||||||||
| Accumulated deficit | (755,779) | (538,974) | |||||||||
| Accumulated other comprehensive loss | (10,993) | (11,396) | |||||||||
| Treasury stock | (433,268) | (252,441) | |||||||||
| Total IAC shareholders' equity | 4,713,559 | 5,577,898 | |||||||||
| Noncontrolling interests | 23,879 | 701,075 | |||||||||
| Total shareholders' equity | 4,737,438 | 6,278,973 | |||||||||
| TOTAL LIABILITIES AND SHAREHOLDERS' EQUITY | $ | 7,187,125 | $ | 9,688,644 | |||||||
Page 14 of 20
IAC CONSOLIDATED STATEMENT OF CASH FLOWS
($ in thousands)
| Three Months Ended March 31, | |||||||||||
| 2025 | 2024 | ||||||||||
| Cash flows from operating activities attributable to continuing operations: | |||||||||||
| Net (loss) earnings | $ | (214,568) | $ | 44,972 | |||||||
| Less: Net earnings (loss) from discontinued operations | 15,313 | (4,472) | |||||||||
| Net (loss) earnings from continuing operations | (229,881) | 49,444 | |||||||||
| Adjustments to reconcile net (loss) earnings to net cash provided by operating activities attributable to continuing operations: | |||||||||||
| Unrealized loss (gain) on investment in MGM Resorts International | 324,265 | (163,751) | |||||||||
| Amortization of intangibles | 23,533 | 36,728 | |||||||||
| Depreciation | 11,946 | 12,724 | |||||||||
| Non-cash lease expense (including right-of-use asset impairments) | 9,004 | 10,356 | |||||||||
| Net loss (gain) on sales of investments and businesses (including unrealized losses on investments) | 7,538 | (25,941) | |||||||||
| Deferred income taxes | (80,616) | 39,843 | |||||||||
| Net gain on lease terminations | (36,038) | — | |||||||||
| Stock-based compensation expense | (20,400) | 19,510 | |||||||||
| Unrealized decrease in the estimated fair value of a warrant | — | 10,231 | |||||||||
| Other adjustments, net | 1,469 | (162) | |||||||||
| Changes in assets and liabilities, net of effects of dispositions: | |||||||||||
| Accounts receivable | 79,026 | 81,845 | |||||||||
| Other assets | (32,424) | 31,173 | |||||||||
| Operating lease liabilities | (34,324) | (13,165) | |||||||||
| Accounts payable and other liabilities | (48,153) | (72,131) | |||||||||
| Income taxes payable and receivable | 2,510 | 5,848 | |||||||||
| Deferred revenue | 22,608 | 17,677 | |||||||||
| Net cash provided by operating activities attributable to continuing operations | 63 | 40,229 | |||||||||
| Cash flows from investing activities attributable to continuing operations: | |||||||||||
| Capital expenditures | (4,656) | (2,914) | |||||||||
| Distribution of Angi Inc.'s cash in the spin-off | (386,563) | — | |||||||||
| Net proceeds from the sales of investments and businesses | 10,096 | 159,678 | |||||||||
| Net proceeds from sales of fixed assets | 134 | 12,654 | |||||||||
| Proceeds from the sale of a portion of the retirement investment fund | 5,248 | — | |||||||||
| Proceeds from maturities of marketable debt securities | — | 137,500 | |||||||||
| Purchases of marketable debt securities | — | (123,104) | |||||||||
| Other, net | — | 1,199 | |||||||||
| Net cash (used in) provided by investing activities attributable to continuing operations | (375,741) | 185,013 | |||||||||
| Cash flows from financing activities attributable to continuing operations: | |||||||||||
| Principal payments on DDM Term Loans | (8,750) | (7,500) | |||||||||
| Withholding taxes paid on behalf of employees on net settled stock-based awards | (45,201) | (8,248) | |||||||||
| Purchases of treasury stock | (179,394) | — | |||||||||
| Other, net | (655) | (152) | |||||||||
| Net cash used in financing activities attributable to continuing operations | (234,000) | (15,900) | |||||||||
| Total cash (used in) provided by continuing operations | (609,678) | 209,342 | |||||||||
| Net cash (used in) provided by operating activities attributable to discontinued operations | (2,758) | 23,825 | |||||||||
| Net cash used in investing activities attributable to discontinued operations | (12,499) | (12,792) | |||||||||
| Net cash used in financing activities attributable to discontinued operations | (14,343) | (10,074) | |||||||||
| Total cash (used in) provided by discontinued operations | (29,600) | 959 | |||||||||
| Effect of exchange rate changes on cash and cash equivalents and restricted cash | 362 | (741) | |||||||||
| Net (decrease) increase in cash and cash equivalents and restricted cash | (638,916) | 209,560 | |||||||||
| Cash and cash equivalents and restricted cash at beginning of period | 1,807,255 | 1,306,241 | |||||||||
| Cash and cash equivalents and restricted cash at end of period | $ | 1,168,339 | $ | 1,515,801 | |||||||
Page 15 of 20
FULL YEAR 2025 OUTLOOK
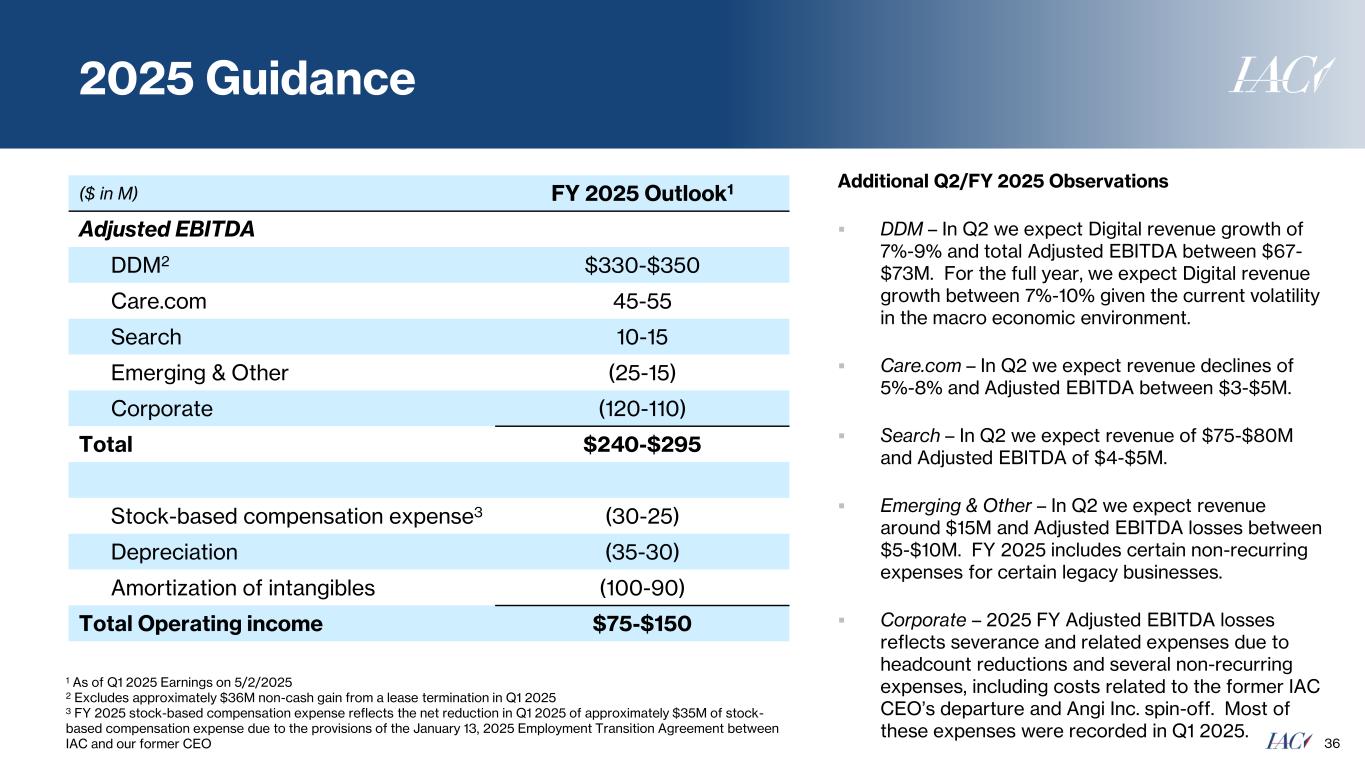
Please find below our full year 2025 outlook. As stewards of shareholder capital, we continually evaluate investment opportunities and are prepared to diverge from our stated outlook when we identify compelling prospects that we believe will create long-term value, even if they may impact short-term results. We also acknowledge that, at times, our expectations about the future may not materialize as anticipated. With that caution in mind, here’s our current outlook:
| ($ in millions) | FY 2025 Outlook | ||||
| Adjusted EBITDA | |||||
DDM (a) | $330-$350 | ||||
| Care.com | 45-55 | ||||
| Search | 10-15 | ||||
| Emerging & Other | (25-15) | ||||
| Corporate | (120-110) | ||||
| Total | $240-$295 | ||||
Stock-based compensation expense (b) | (30-25) | ||||
| Depreciation | (35-30) | ||||
| Amortization of intangibles | (100-90) | ||||
| Total Operating income | $75-$150 | ||||
(a) Excludes approximately $36 million non-cash gain from a lease termination in Q1 2025.
(b) FY 2025 stock-based compensation expense reflects the net reduction in Q1 2025 of approximately $35 million of stock-based compensation expense due to the provisions of the January 13, 2025 ETA between IAC and its former CEO.
Additional Q2/FY 2025 Observations
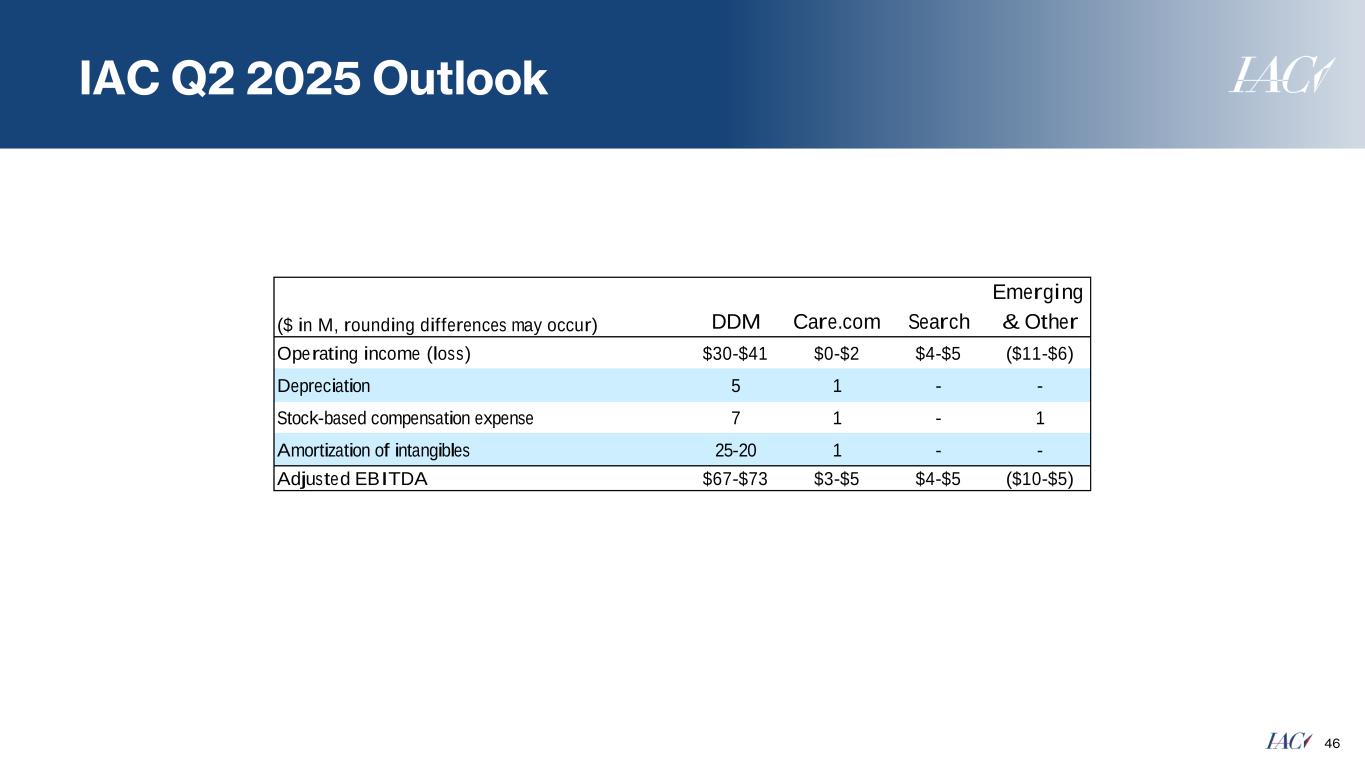
•DDM – In Q2 we expect Digital revenue growth of 7%-9% and total Adjusted EBITDA between $67-$73 million. For the full year, we expect Digital revenue growth between 7%-10% given the current volatility in the macro economic environment.
•Care.com – In Q2 we expect revenue declines of 5%-8% and Adjusted EBITDA between $3-$5 million.
•Search – In Q2 we expect revenue of $75-$80 million and Adjusted EBITDA of $4-$5 million.
•Emerging & Other – In Q2 we expect revenue around $15 million and Adjusted EBITDA losses between $5-$10 million. FY 2025 includes certain non-recurring expenses for certain legacy businesses.
•Corporate – 2025 FY Adjusted EBITDA losses reflects severance and related expenses due to headcount reductions and several non-recurring expenses including costs related to the former IAC CEO’s departure and Angi Inc. spin-off. Most of these expenses were recorded in Q1 2025.
Page 16 of 20
RECONCILIATIONS OF GAAP TO NON-GAAP MEASURES
($ in millions; rounding differences may occur)
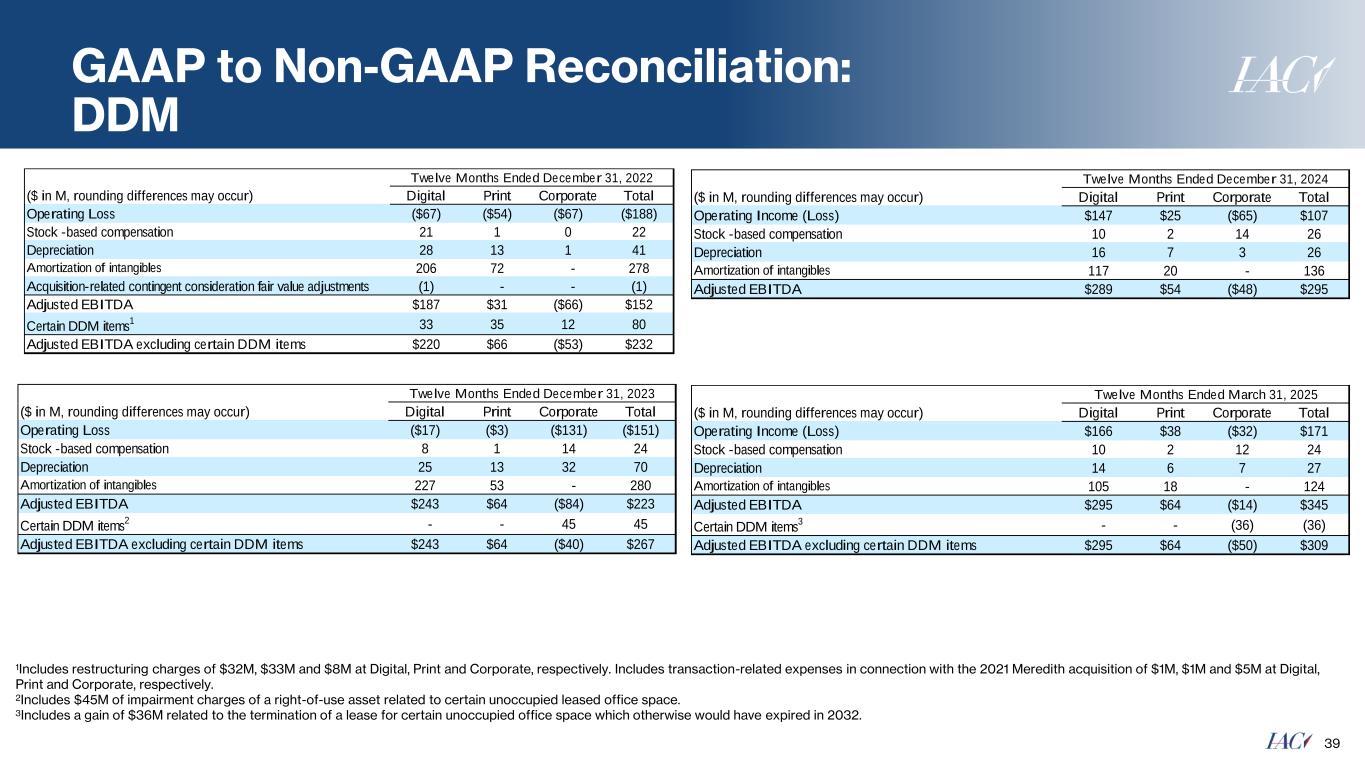
IAC RECONCILIATION OF OPERATING INCOME (LOSS) TO ADJUSTED EBITDA
| For the three months ended March 31, 2025 | |||||||||||||||||||||||||||||
| Operating Income (Loss) | Stock-based Compensation Expense | Depreciation | Amortization of Intangibles | Adjusted EBITDA | |||||||||||||||||||||||||
| DDM | |||||||||||||||||||||||||||||
| Digital | $ | 18.7 | $ | 1.9 | $ | 3.1 | $ | 18.7 | $ | 42.4 | |||||||||||||||||||
| 7.9 | 0.5 | 1.4 | 3.7 | 13.5 | |||||||||||||||||||||||||
| Other | 16.6 | 3.2 | 4.7 | — | 24.5 | ||||||||||||||||||||||||
| Total DDM | 43.2 | 5.5 | 9.2 | 22.4 | 80.3 | ||||||||||||||||||||||||
| Care.com | 11.7 | 1.0 | 0.7 | 1.1 | 14.5 | ||||||||||||||||||||||||
| Search | 3.0 | — | — | — | 3.0 | ||||||||||||||||||||||||
| Emerging & Other | (4.9) | 0.3 | — | — | (4.5) | ||||||||||||||||||||||||
| Corporate | (17.2) | (27.2) | 2.0 | — | (42.4) | ||||||||||||||||||||||||
| Total | $ | 35.8 | $ | (20.4) | $ | 11.9 | $ | 23.5 | $ | 50.9 | |||||||||||||||||||
| For the three months ended March 31, 2024 | |||||||||||||||||||||||||||||
| Operating (Loss) Income | Stock-based Compensation Expense | Depreciation | Amortization of Intangibles | Adjusted EBITDA | |||||||||||||||||||||||||
| DDM | |||||||||||||||||||||||||||||
| Digital | $ | (0.2) | $ | 2.2 | $ | 4.9 | $ | 30.1 | $ | 37.0 | |||||||||||||||||||
| (5.1) | 0.4 | 2.5 | 5.1 | 2.9 | |||||||||||||||||||||||||
| Other | (15.5) | 4.7 | 1.2 | — | (9.7) | ||||||||||||||||||||||||
| Total DDM | (20.8) | 7.3 | 8.6 | 35.2 | 30.2 | ||||||||||||||||||||||||
| Care.com | 11.6 | 1.4 | 1.8 | 1.6 | 16.4 | ||||||||||||||||||||||||
| Search | 4.4 | — | — | — | 4.4 | ||||||||||||||||||||||||
| Emerging & Other | (21.1) | 0.4 | — | — | (20.6) | ||||||||||||||||||||||||
| Corporate | (37.5) | 10.3 | 2.3 | — | (24.9) | ||||||||||||||||||||||||
| Total | $ | (63.4) | $ | 19.5 | $ | 12.7 | $ | 36.7 | $ | 5.5 | |||||||||||||||||||
Page 17 of 20
Q2 2025 OPERATING INCOME (LOSS) TO ADJUSTED EBITDA RECONCILIATION
| Q2 2025 Outlook | ||||||||||||||
| ($ in millions) | DDM | Care.com | Search | Emerging & Other | ||||||||||
| Operating income (loss) | $30-$41 | $0-$2 | $4-$5 | ($11-$6) | ||||||||||
| Depreciation | 5 | 1 | — | — | ||||||||||
| Stock-based compensation expense | 7 | 1 | — | 1 | ||||||||||
| Amortization of intangibles | 25-20 | 1 | — | — | ||||||||||
| Adjusted EBITDA | $67-$73 | $3-$5 | $4-$5 | ($10-$5) | ||||||||||
Page 18 of 20
PRINCIPLES OF FINANCIAL REPORTING
IAC reports Adjusted EBITDA and Free Cash Flow, which are supplemental measures to U.S. generally accepted accounting principles (“GAAP”). Adjusted EBITDA is our primary segment measure of profitability; it and Free Cash Flow are among the metrics by which we evaluate the performance of our businesses, and our internal budgets are based and may also impact management compensation. We believe that investors should have access to, and we are obligated to provide, the same set of tools that we use in analyzing our results. These non-GAAP measures should be considered in addition to results prepared in accordance with GAAP but should not be considered a substitute for or superior to GAAP results. IAC endeavors to compensate for the limitations of the non-GAAP measures presented by providing the comparable GAAP measures with equal or greater prominence and descriptions of the reconciling items, including quantifying such items, to derive the non-GAAP measures. We encourage investors to examine the reconciling adjustments between the GAAP and non-GAAP measures, which are included in this release. Interim results are not necessarily indicative of the results that may be expected for a full year.
Definitions of Non-GAAP Measures
Adjusted EBITDA (Adjusted Earnings Before Interest, Taxes, Depreciation and Amortization) is defined as operating income excluding: (1) stock-based compensation expense; (2) depreciation; and (3) acquisition-related items consisting of (i) amortization of intangible assets and impairments of goodwill and intangible assets, if applicable, and (ii) gains and losses recognized on changes in the fair value of contingent consideration arrangements, if applicable. We believe this measure is useful for analysts and investors as this measure allows a more meaningful comparison between our performance and that of our competitors. Adjusted EBITDA has certain limitations because it excludes the impact of these expenses.
Free Cash Flow is defined as net cash provided by operating activities attributable to continuing operations, less capital expenditures. We believe Free Cash Flow is useful to analysts and investors because it represents the cash that our operating businesses generate, before taking into account non-operational cash movements. Free Cash Flow has certain limitations in that it does not represent the total increase or decrease in the cash balance for the period, nor does it represent the residual cash flow for discretionary expenditures. For example, it does not take into account stock repurchases. Therefore, we think it is important to evaluate Free Cash Flow along with our consolidated statement of cash flows.
Non-Cash Expenses That Are Excluded from Adjusted EBITDA
Stock-based compensation expense consists of expense associated with awards that were granted under various IAC stock and annual incentive plans that are denominated in IAC common shares and expense related to awards denominated in the equity of certain subsidiaries of the Company. These expenses are not paid in cash, and we view the economic costs of stock-based awards to be the dilution to our share base; the related shares are included in our fully diluted shares outstanding for GAAP earnings per share using the treasury stock method. The Company currently settles all stock-based awards on a net basis; IAC remits the required tax-withholding on behalf of employees for net-settled awards from its current funds.
Please see page 11 for a summary of our dilutive securities, including stock-based awards as of May 2, 2025, and a description of the calculation methodology.
Depreciation is a non-cash expense relating to our buildings, equipment, leasehold improvements and capitalized software and is computed using the straight-line method to allocate the cost of depreciable assets to operations over their estimated useful lives, or, in the case of leasehold improvements, the lease term, if shorter.
Amortization of intangible assets and impairments of goodwill and intangible assets are non-cash expenses related primarily to acquisitions. At the time of an acquisition, the identifiable definite-lived intangible assets of the acquired company, such as advertiser relationships, licensee relationships, trade names, content, technology, customer lists and user base, and professional relationships, are valued and amortized over their estimated lives. Value is also assigned to acquired indefinite-lived intangible assets, which comprise trade names and trademarks, and goodwill that are not subject to amortization. An impairment is recorded when the carrying value of an intangible asset or goodwill exceeds its fair value. We believe that intangible assets represent costs incurred by the acquired company to build value prior to acquisition and the related amortization and impairments of intangible assets or goodwill, if applicable, are not ongoing costs of doing business.
Gains and losses recognized on changes in the fair value of contingent consideration arrangements are accounting adjustments to report liabilities for the portion of the purchase price of acquisitions, if applicable, that is contingent upon the financial performance and/or operating targets of the acquired company at fair value that are recognized in “General and administrative expense” in the statement of operations. These adjustments can be highly variable and are excluded from our assessment of performance because they are considered non-operational in nature and, therefore, are not indicative of current or future performance or the ongoing cost of doing business.
Page 19 of 20
Metric Definitions
DDM
Digital Revenue – Includes Advertising revenue, Performance Marketing revenue and Licensing and Other revenue.
(a) Advertising revenue – primarily includes revenue generated from digital advertisements and intent-based advertising targeting capabilities sold directly to advertisers or through advertising agencies and programmatic advertising networks.
(b) Performance Marketing revenue – includes commissions generated through affiliate commerce, performance marketing services and affinity marketing channels. Affiliate commerce commission revenue is generated when DDM’s branded content refers consumers to commerce partner websites resulting in a purchase or transaction. Performance marketing services commission revenue is generated on a cost-per-click or cost-per-action basis. Affinity marketing programs are arrangements where DDM acts as an agent for both DDM and third-party publishers to market and place magazine subscriptions online for which commission revenue is earned when a subscriber name has been provided to the publisher.
(c) Licensing and Other revenue – primarily includes revenue generated through brand and content licensing and similar agreements. Brand licensing generates royalties from long-term trademark licensing agreements with retailers, manufacturers, publishers and service providers. Content licensing royalties are earned from our relationship with Apple News+ as well as other content use and distribution relationships, including utilization in large-language models and other artificial intelligence-related activities.
Print Revenue – Primarily includes subscription, advertising, newsstand, project and other and performance marketing revenue.
Total Sessions – Represents unique visits to all sites that are part of DDM’s network.
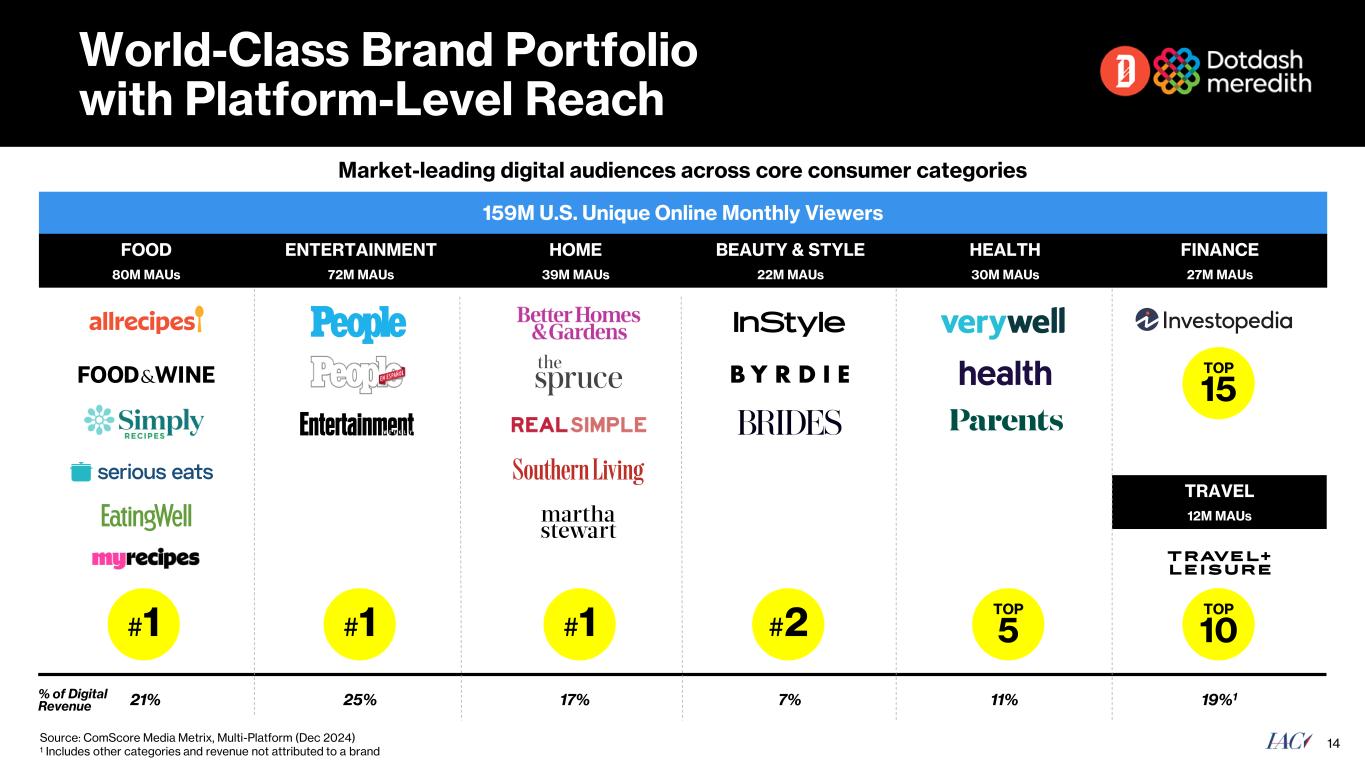
Core Sessions – Represents a subset of Total Sessions that comprises unique visits to DDM’s most significant (in terms of investment) owned and operated sites as follows:
| People | InStyle | Simply Recipes | ||||||
| allrecipes | FOOD & WINE | Serious Eats | ||||||
| Investopedia | Martha Stewart | EatingWell | ||||||
| Better Homes & Gardens | BYRDIE | Parents | ||||||
| Verywell Health | REAL SIMPLE | Verywell Mind | ||||||
| The Spruce | Southern Living | Health | ||||||
| TRAVEL + LEISURE | ||||||||
Care.com
Consumer Revenue - Consists of revenue primarily generated through subscription fees from families and caregivers, both domestically and internationally, for its suite of products and services. Consumer revenue also includes revenue generated through Care.com’s comprehensive household payroll and tax support services (HomePay) as well as through contracts with businesses that advertise through its platform.
Enterprise Revenue - Consists of revenue primarily generated through annual contracts with businesses (employers or re-sellers) who provide access to Care.com’s suite of products and services as an employee benefit.
Search
Ask Media Group Revenue - Consists of revenue generated from advertising principally through the display of paid listings in response to search queries, as well as from display advertisements appearing alongside content on its various websites, and, to a lesser extent, affiliate commerce commission revenue.
Desktop Revenue - Consists of revenue generated by applications distributed through both business-to-business partnerships and direct-to-consumer marketing.
Page 20 of 20
OTHER INFORMATION
Safe Harbor Statement Under the Private Securities Litigation Reform Act of 1995
This press release and the IAC conference call, which will be held at 8:30 a.m. Eastern Time on Wednesday, May 6, 2025, may contain "forward-looking statements" within the meaning of the Private Securities Litigation Reform Act of 1995. The use of words such as "anticipates," "estimates," "expects," "plans" and "believes," among others, generally identify forward-looking statements. These forward-looking statements include, among others, statements relating to: the future financial performance of IAC and its businesses, business prospects and strategy, the anticipated benefits of the completed Angi Inc. spin-off, the reorganization of IAC’s leadership, anticipated trends and prospects in the industries in which IAC’s businesses operate and other similar matters. Actual results could differ materially from those contained in these forward-looking statements for a variety of reasons, including, among others: (i) our ability to market our products and services in a successful and cost-effective manner, (ii) the display prominence of links to websites offering our products and services in search results, (iii) changes in our relationship with (or policies implemented by) Google, (iv) our ability to compete with generative artificial intelligence technology and the related disruption to marketing technologies, (v) the failure or delay of the markets and industries in which our businesses operate to migrate online and the continued growth and acceptance of online products and services as effective alternatives to traditional products and services, (vi) our continued ability to develop and monetize versions of our products and services for mobile and other digital devices, (vii) unstable market and economic conditions (particularly those that adversely impact advertising spending levels and consumer confidence and spending behavior), either generally and/or in any of the markets in which our businesses operate, as well as geopolitical conflicts, (viii) the ability of our Digital business to successfully expand the digital reach of our portfolio of publishing brands, (ix) our continued ability to market, distribute and monetize our products and services through search engines, digital app stores, advertising networks and social media platforms, (x) risks related to our Print business (declining revenue, increased paper and postage costs, reliance on a single supplier to print our magazines and potential increases in pension plan obligations), (xi) our ability to establish and maintain relationships with quality and trustworthy caregivers, (xii) our ability to access, collect, use and protect the personal data of our users and subscribers, (xiii) our ability to engage directly with users, subscribers, consumers, professionals and caregivers on a timely basis, (xiv) the ability of our Chairman and Senior Executive and certain members of his family to exercise significant influence over the composition of our board of directors, matters subject to stockholder approval and our operations, (xv) risks related to our liquidity and indebtedness (the impact of our indebtedness on our ability to operate our business, our ability to generate sufficient cash to service our indebtedness and interest rate risk), (xvi) our inability to freely access the cash of DDM and its subsidiaries, (xvii) dilution with respect to investments in IAC, (xviii) our ability to compete, (xix) our ability to build, maintain and/or enhance our various brands, (xx) our ability to protect our systems, technology and infrastructure from cyberattacks (including cyberattacks experienced by third parties with whom we do business), (xxi) the occurrence of data security breaches and/or fraud, (xxii) increased liabilities and costs related to the processing, storage, use and disclosure of personal and confidential user information, (xxiii) the integrity, quality, efficiency and scalability of our systems, technology and infrastructure (and those of third parties with whom we do business), (xxiv) changes in key personnel and risks related to leadership transitions and (xxv) changes to our capital deployment strategy. Certain of these and other risks and uncertainties are described in IAC’s filings with the Securities and Exchange Commission (the “SEC”), including the most recent Annual Report on Form 10-K filed with the SEC on February 28, 2025, and subsequent reports that IAC files with the SEC. Other unknown or unpredictable factors that could also adversely affect IAC's business, financial condition and results of operations may arise from time to time. It is not possible for our management to predict all risks, nor can we assess the impact of all factors on our business or the extent to which any factor, or combination of factors, may cause actual results to differ materially from those expressed in any forward-looking statements we may make. Except as required by law, we undertake no obligation to update any forward-looking statements to reflect events or circumstances after the date of such statements. You should, therefore, not rely on these forward-looking statements as representing our views as of any date subsequent to the date of this press release.
About IAC
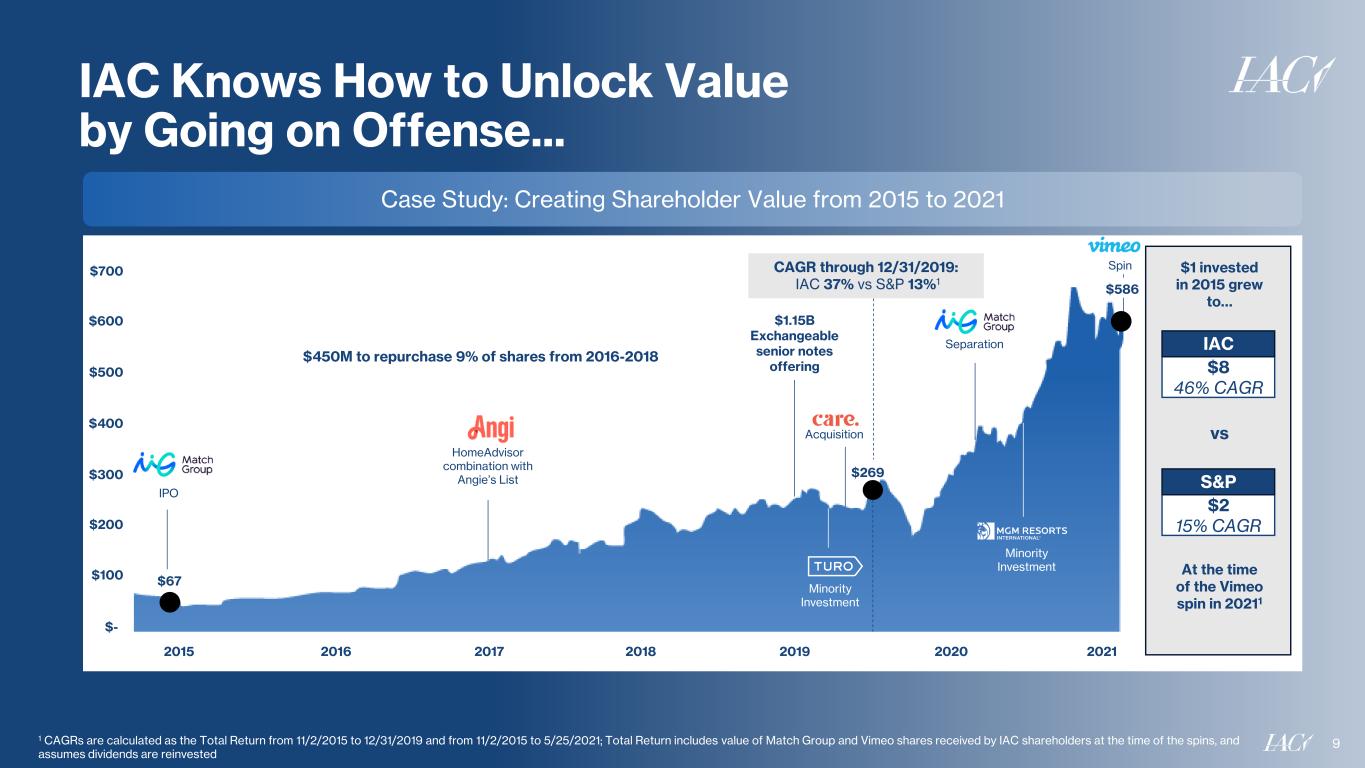
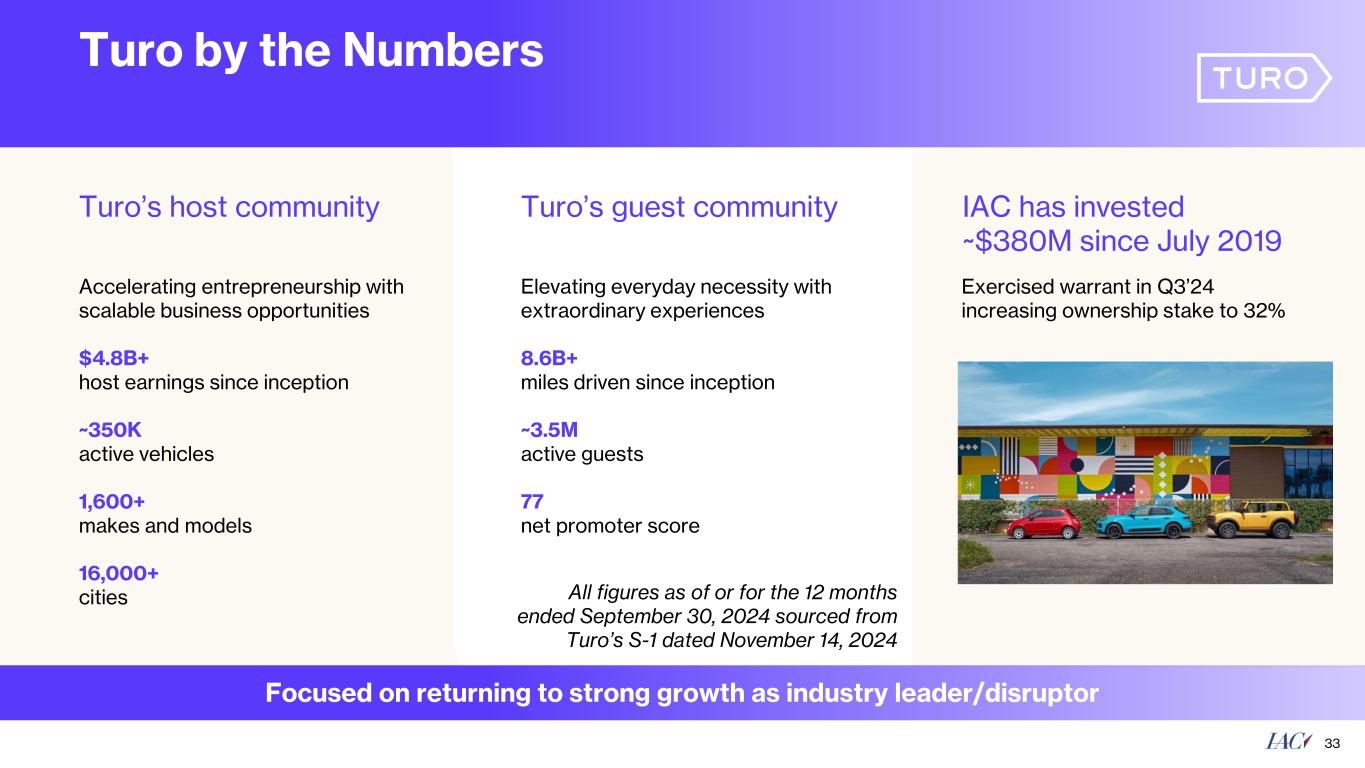
IAC (NASDAQ: IAC) builds companies. We are guided by curiosity, a questioning of the status quo, and a desire to invent or acquire new products and brands. From the single seed that started as IAC over two decades ago have emerged 10 independent, public-traded companies and generations of exceptional leaders. We will always evolve, but our basic principles of financially-disciplined opportunism will never change. IAC is today comprised of category-leading businesses Dotdash Meredith (DDM) and Care.com among others and holds strategic equity positions in MGM Resorts International and Turo Inc. IAC is headquartered in New York City.
Contact Us
IAC Investor Relations
Mark Schneider
(212) 314-7400
IAC Corporate Communications
Valerie Combs
(212) 314-7251
IAC
555 West 18th Street, New York, NY 10011 (212) 314-7300 http://iac.com