0001784535false00017845352021-05-172021-05-17

UNITED STATES

SECURITIES AND EXCHANGE COMMISSION

Washington, D.C. 20549

FORM 8-K

CURRENT REPORT

Pursuant to Section 13 or 15(d)

of the Securities Exchange Act of 1934

Date of Report (Date Earliest Event Reported):

May 17, 2021

PORCH GROUP, INC.

(Exact name of registrant as specified in its charter)

Delaware


001-39142


83-2587663

(State or Other Jurisdiction
of Incorporation)


(Commission File Number)


(IRS Employer
Identification No.)

2200 1st Avenue South, Suite 300

Seattle, Washington

98134

(Address of Principal Executive Offices)

(Zip Code)

(855) 767-2400

(Registrant’s telephone number, including area code)

Not Applicable

(Former Name or Former Address, if Changed Since Last Report)

Check the appropriate box below if the Form 8-K filing is intended to simultaneously satisfy the filing obligation of the registrant under any of the following provisions:

Written communications pursuant to Rule 425 under the Securities Act (17 CFR 230.425)

Soliciting material pursuant to Rule 14a-12 under the Exchange Act (17 CFR 240.14a-12)

Pre-commencement communications pursuant to Rule 14d-2(b) under the Exchange Act (17 CFR 240.14d-2(b))

Pre-commencement communications pursuant to Rule 13e-4(c) under the Exchange Act (17 CFR 240.13e- 4(c))

Securities registered pursuant to Section 12(b) of the Act:

Title of each class


Trading
Symbol(s)


Name of each exchange on
which registered

Common stock, par value $0.0001


PRCH


The Nasdaq Stock Market LLC

Indicate by check mark whether the registrant is an emerging growth company as defined in Rule 405 of the Securities Act of 1933 (§230.405 of this chapter) or Rule 12b-2 of the Securities Exchange Act of 1934 (§240.12b-2 of this chapter).

Emerging growth company   

If an emerging growth company, indicate by check mark if the registrant has elected not to use the extended transition period for complying with any new or revised financial accounting standards provided pursuant to Section 13(a) of the Exchange Act. 

Item 2.02. Results of Operation and Financial Condition.

On May 17, 2021, Porch Group, Inc. (the “Company”) issued an earnings release announcing financial results for the quarter ended March 31, 2021. The full text of the press release issued in connection with the announcement is attached as Exhibit 99.1 to this Current Report on Form 8-K and is incorporated herein by reference.

Item 7.01. Regulation FD Disclosure.

On May 17, 2021, the Company will host an earnings call at 5:00 p.m. Eastern time to discuss its financial results for the first quarter ended March 31, 2021. The investor presentation to be used for the call is attached as Exhibit 99.2 to this Current Report on Form 8-K and is incorporated herein by reference. Live and archived webcasts of the presentation will be available on the Company’s website at https://ir.porchgroup.com.

The information in this Current Report on Form 8-K and the exhibits attached hereto shall not be deemed “filed” for purposes of Section 18 of the Securities Exchange Act of 1934, as amended (the “Exchange Act”), or otherwise subject to the liabilities of that section, nor shall it be deemed incorporated by reference in any filing under the Securities Act of 1933, as amended, or the Exchange Act, except as expressly set forth by specific reference in such a filing.

Item 9.01 Financial Statements and Exhibits

(d) Exhibits.

Exhibit No.


Description

99.1


Press Release, dated May 17, 2021

99.2

Investor Presentation, dated May 17, 2021

104

Cover Page Interactive Data File (embedded within the Inline XBRL document)

SIGNATURES

Pursuant to the requirements of the Securities Exchange Act of 1934, the registrant has duly caused this report to be signed on its behalf by the undersigned hereunto duly authorized.


PORCH GROUP, INC.


By:

/s/ Martin L. Heimbigner


Name:

Martin L. Heimbigner


Title:

Chief Financial Officer

Date: May 17, 2021

Exhibit 99.1

Graphic

Porch Group Reports First Quarter 2021 Financial Results

Company Exceeds Q1 Guidance and Increases Full Year 2021 Revenue Guidance to $178 Million, Representing Approximately 147% Year-over-Year Growth

SEATTLE, WA, May 17, 2021 – Porch Group, Inc. (“Porch” or “the Company”) (NASDAQ: PRCH), a leading vertical software company reinventing the home services industry, today reported financial results for the first quarter ended March 31, 2021.

First Quarter 2021 Financial Results

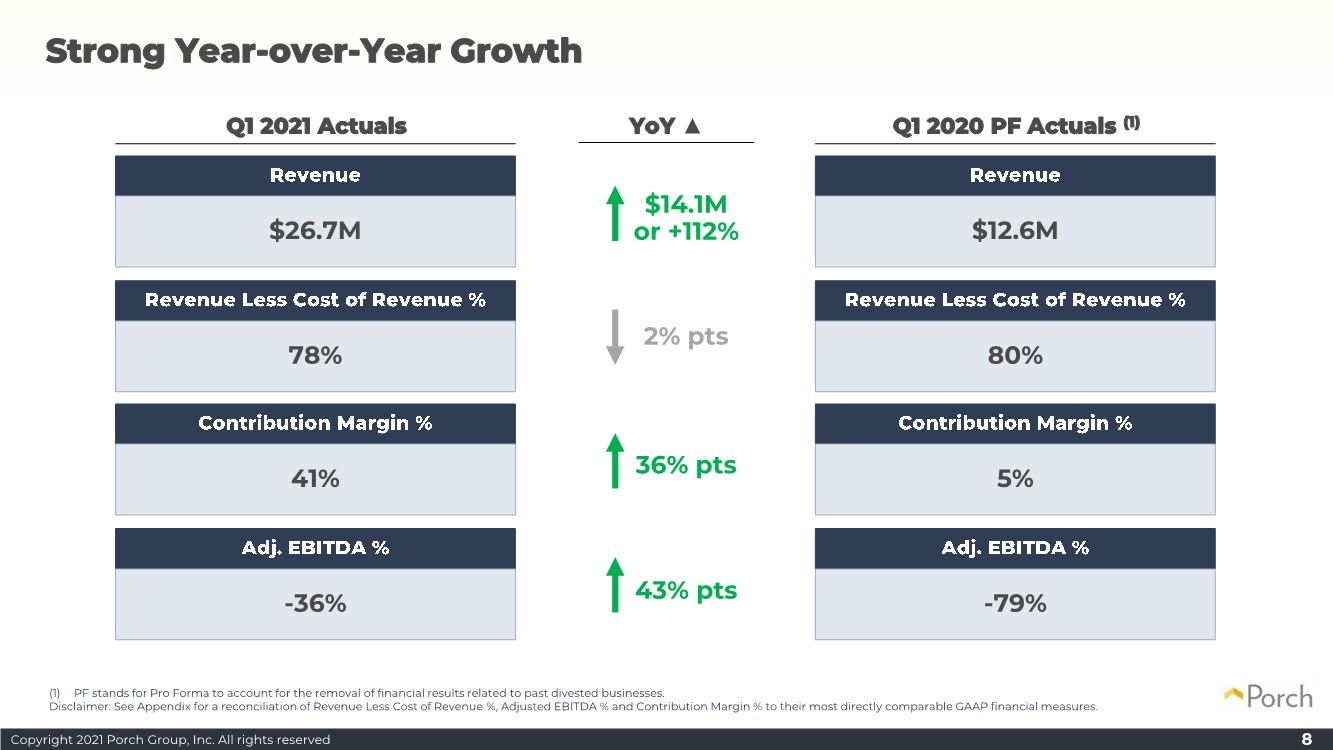
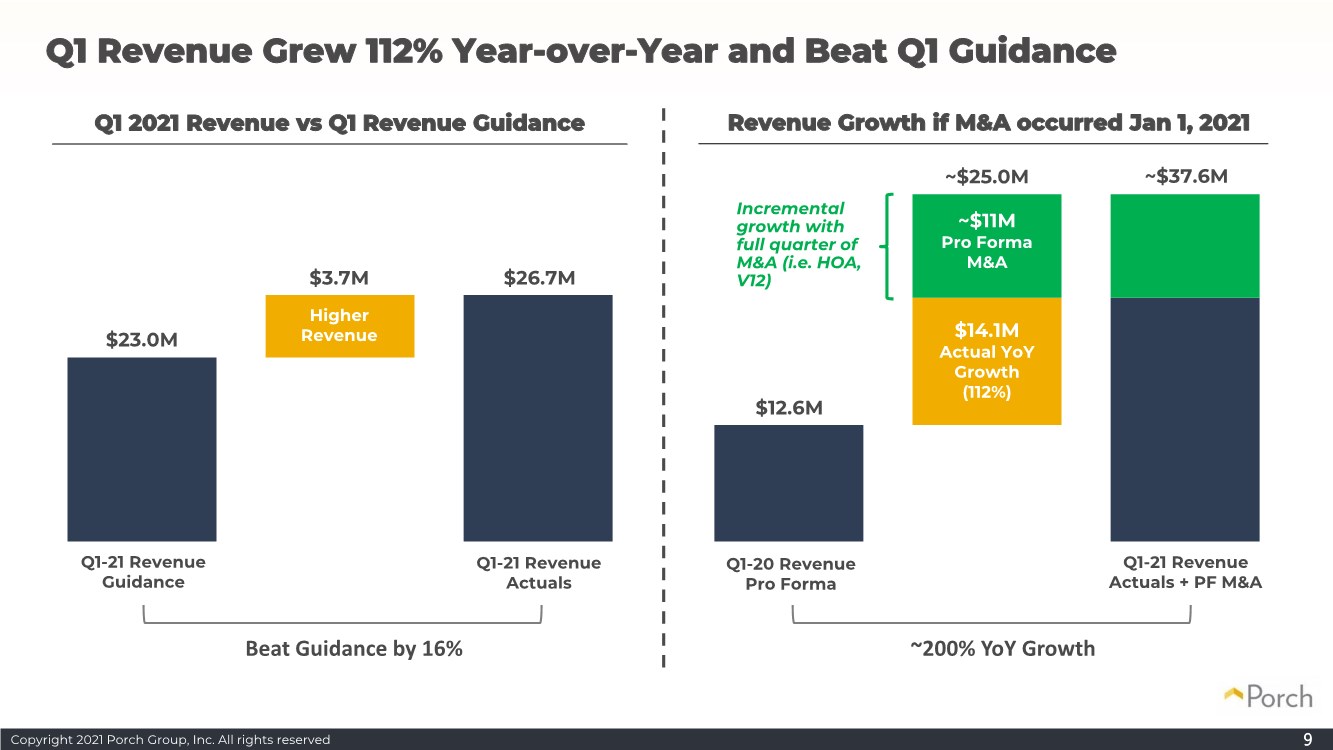
Total revenue for the first quarter of 2021 was $26.7 million, an increase of 77% from $15.1 million in the first quarter of 2020. When adjusting for past divestitures by the Company, year-over-year growth was 112%, up from $12.6 million in the first quarter of 2020 pro forma. The increase in total revenue was driven by selling software to more companies, by significantly increasing both the B2B SaaS fees and transaction revenue generated per company, and acquisitions.

Comparing to the first quarter of 2020 adjusting for past divestitures, cost of revenue as a percentage of total revenue for the first quarter 2021 was 78% compared to 80% in the same year-ago period and contribution margin was 41%, up from 5% in the same year-ago period.

GAAP net loss for the first quarter of 2021 total $65.1 million, driven primarily by remeasurement of the earnout liability and private warrant liability related to Porch’s SPAC merger, as well as non-cash stock-based compensation. Adjusted EBITDA loss, a non-GAAP metric, for the first quarter of 2021 totaled $9.6 million (or -36% of total revenue), an improvement from Adjusted EBITDA loss of $10.8 million (or -71% of total revenue) in the first quarter of 2020.

As of March 31, 2021, cash, cash equivalents, and restricted cash totaled $233.4 million.

First Quarter 2021 Key Performance Indicators (KPIs)

Software and services to companies:

·

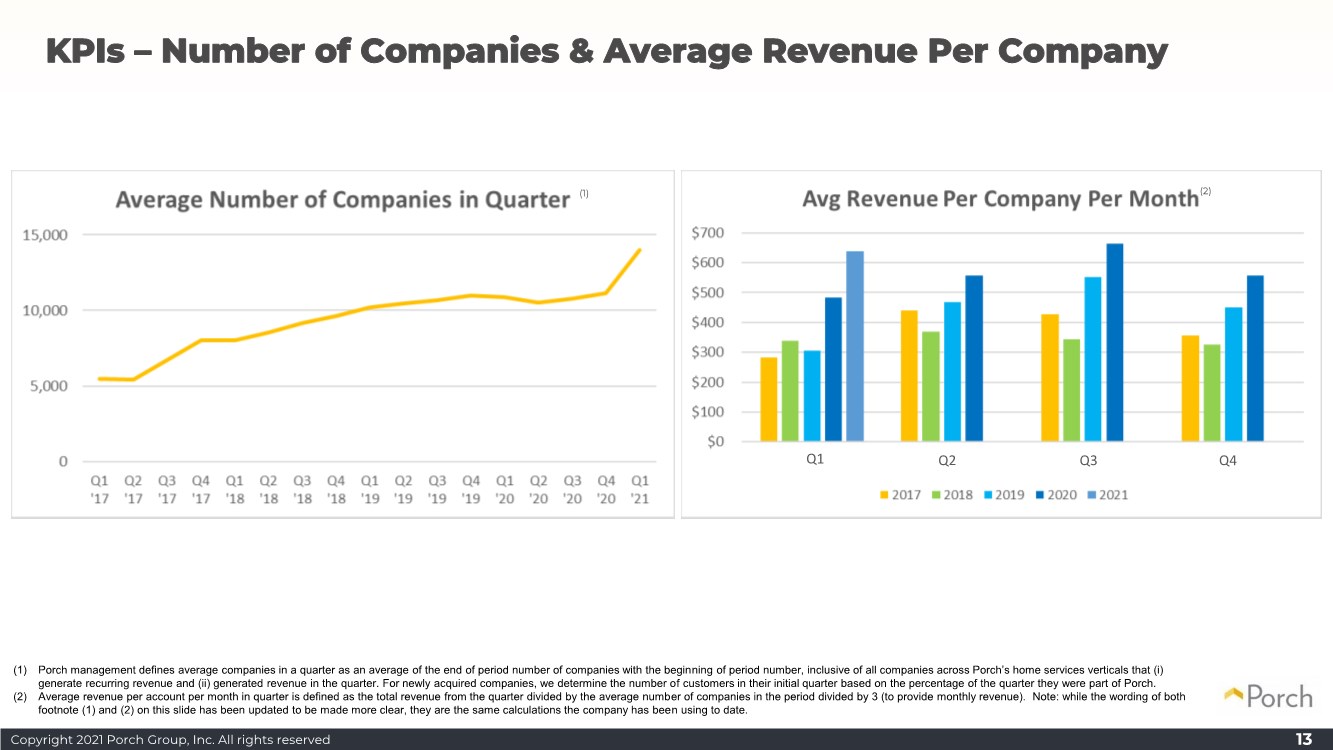
Average number of companies increased to 13,995 from 11,157 in Q4 2020

·

Average revenue per company per month increased approximately 32% to $637 from $484 in Q1 2020

Monetized services for consumers:

·

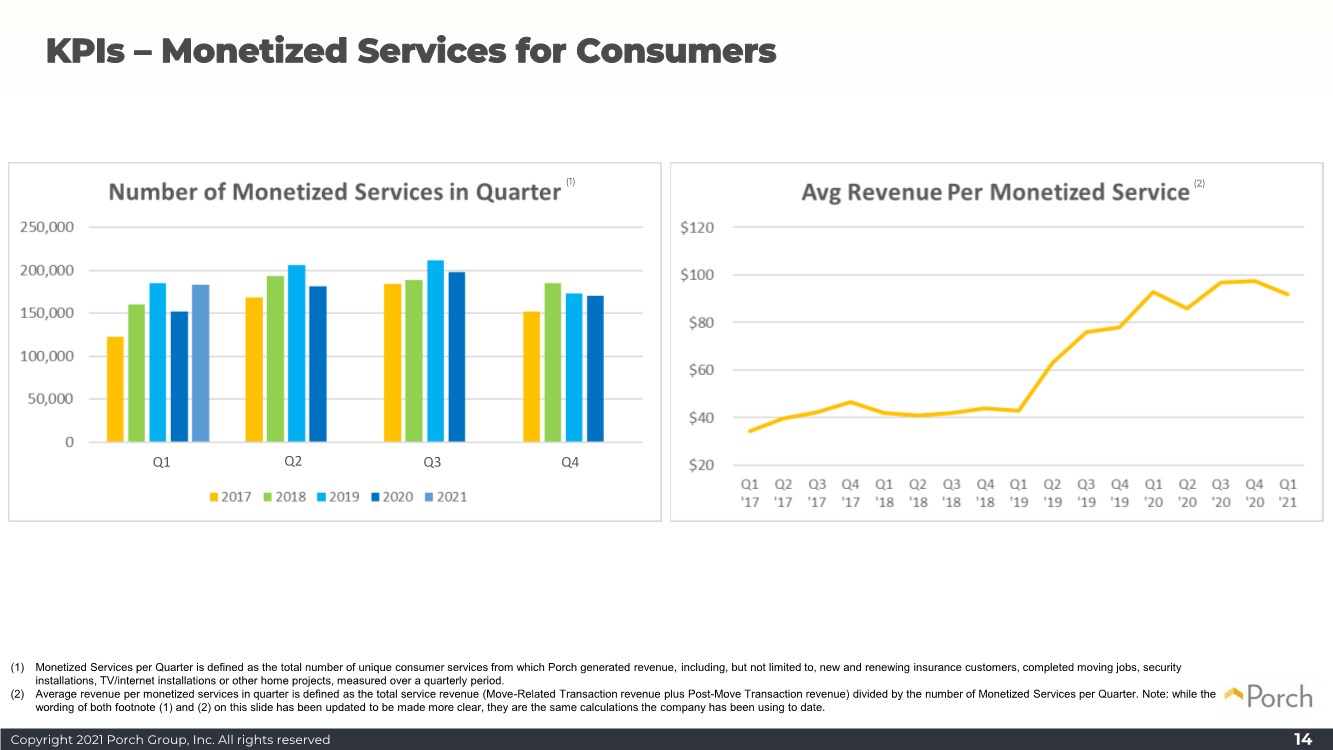
Number of monetized services was 182,779 in Q1 2021, up approximately 20% as compared to Q1 2020

·

Average revenue per monetized service was $92 approximately flat from Q1 2020

M&A highlights from the first quarter include Porch acquiring V12 on January 12, 2021 as well as other small software companies to expand the vertical markets we serve, and signing definitive agreements to acquire Homeowners of America (which was closed on April 6, 2021).


Graphic

Management Commentary

“In the first quarter, our strong results demonstrated our ability to execute on our strategy to drive growth and expand our business through organic growth and acquisitions,” said Matt Ehrlichman, founder, chairman and CEO. “For the quarter, our total revenue increased by 112% compared to Q1 2020 pro forma net of past divestitures, giving us even greater confidence in the trajectory of our business and growth outlook for 2021. We are performing well against the key strategic areas of our business, with insurance at the core of our synergistic platform. Our InsurTech division provides us with fundamental advantages and positions us in a unique spot with our durable and transformational capabilities, and we are focused on capitalizing on our market opportunity and driving sustained returns. I’m exceptionally proud of our team’s hard work and commitment to building a truly great and enduring company that benefits all of our valued stakeholders.”

Full Year 2021 Financial Outlook

Porch provides guidance based on current market conditions and expectations.

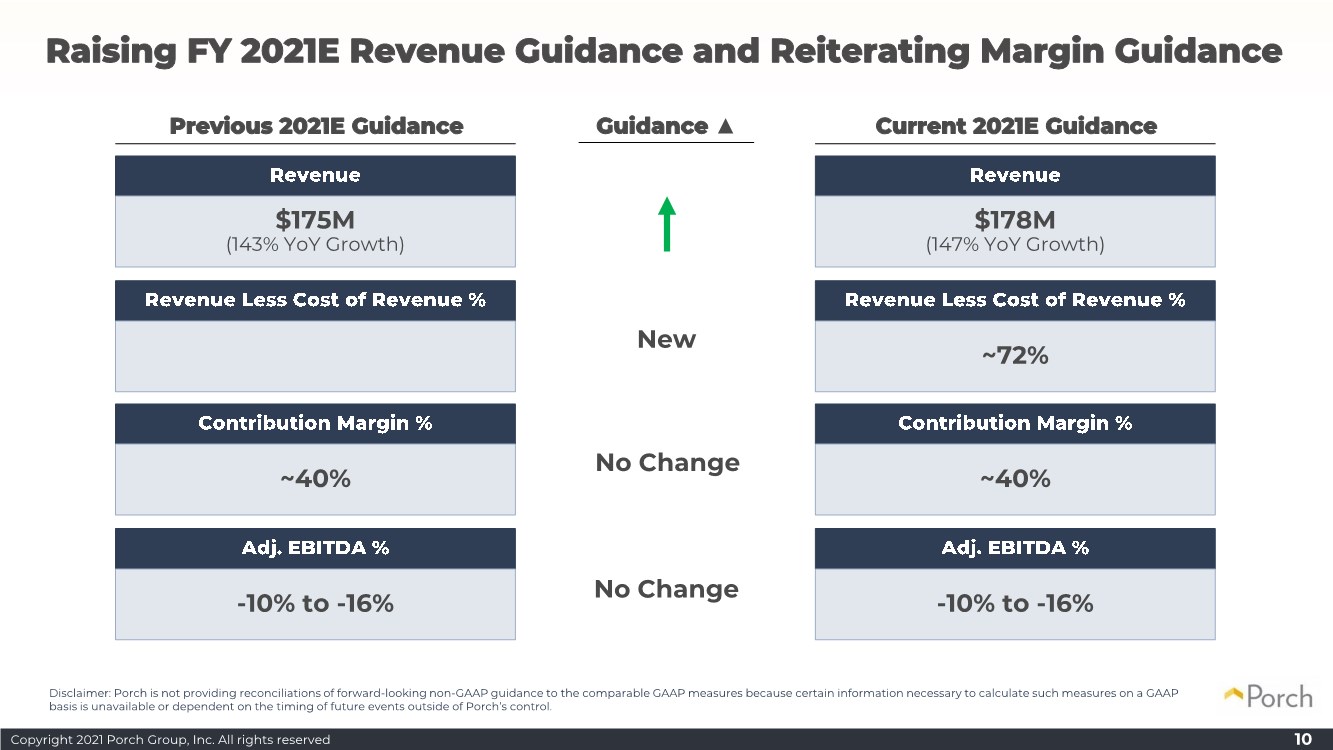
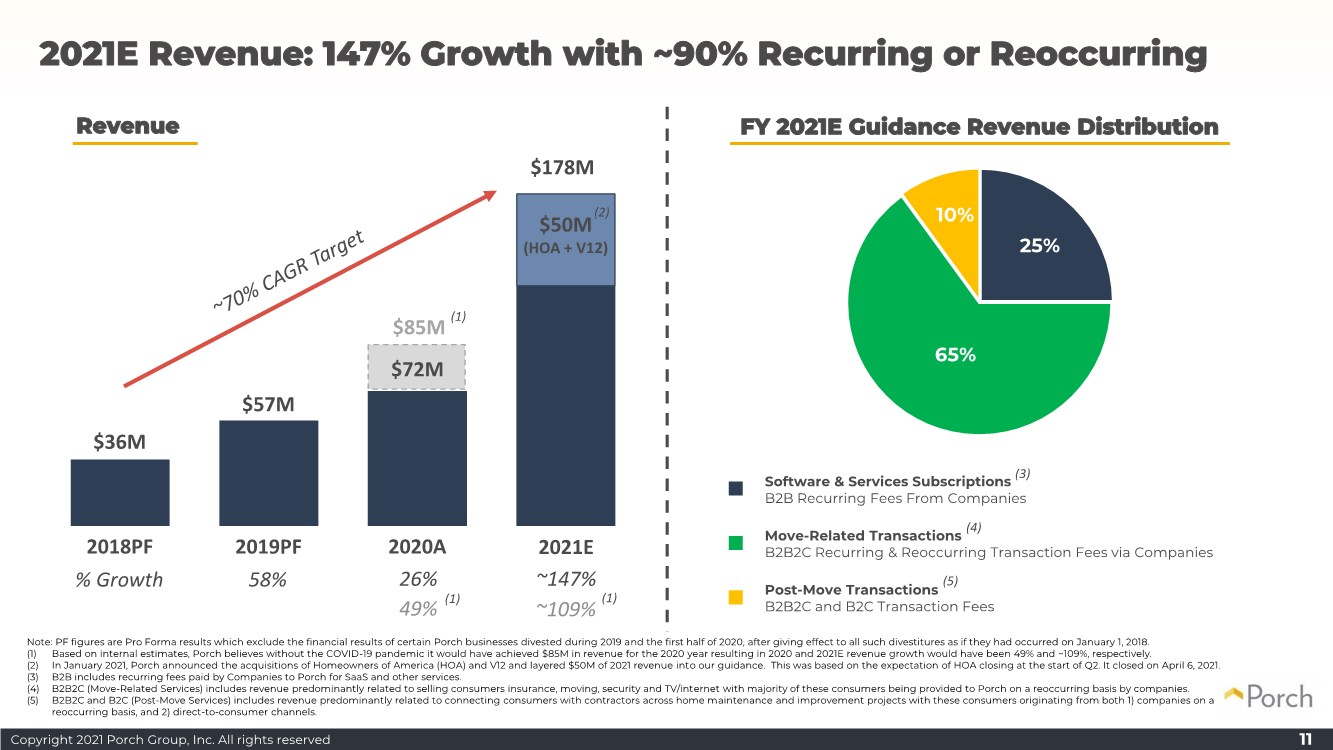
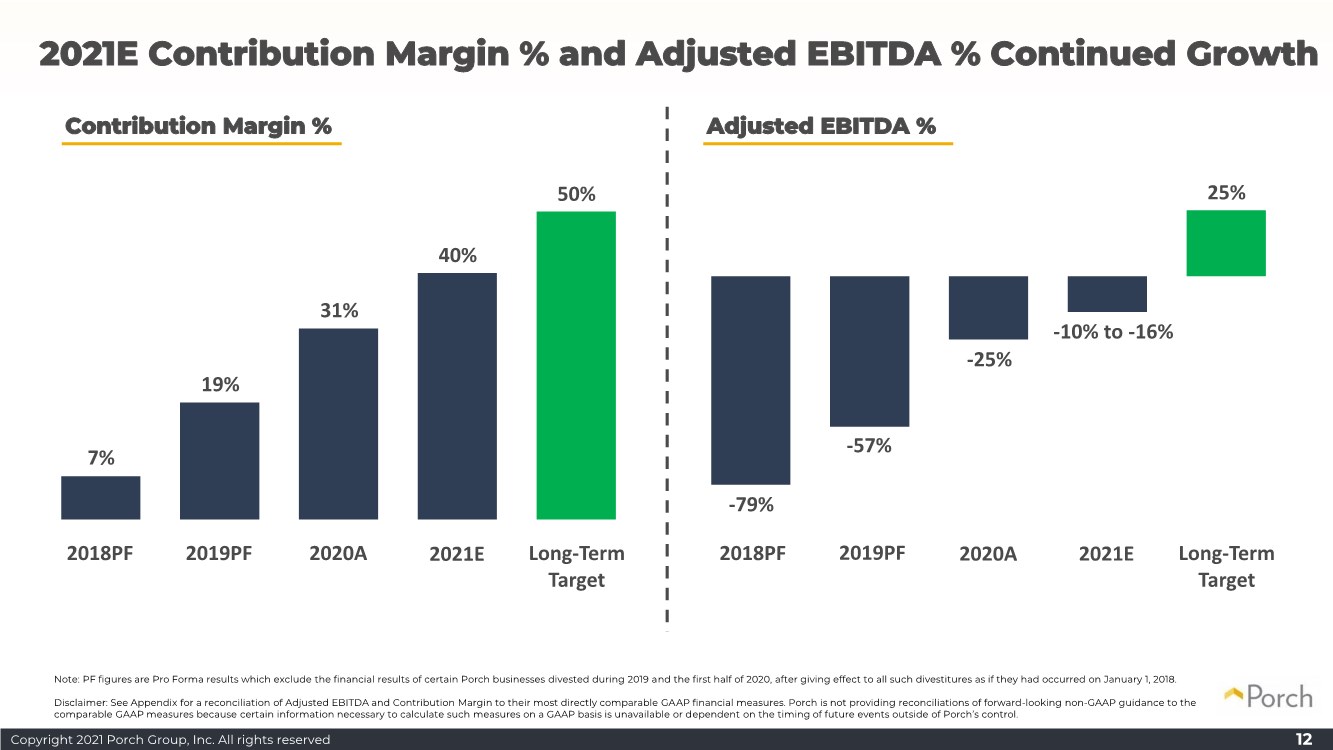
For the full year of 2021, Porch increased its revenue outlook from $175 million to $178 million, representing approximately 147% year-over-year revenue growth. Porch continues to expect approximately 25% of 2021 total revenue to be from B2B SaaS fees, approximately 65% of revenue from B2B2C move-related services which includes recurring insurance revenue, and approximately 10% of revenues from post-move services. Porch reiterated its 2021 guidance for contribution margin, defined as total revenue less all variable expense, of 40%, an improvement from 31% and 19% in 2020 and 2019 respectively, pro forma adjusted for past divestitures. The Company introduced guidance for revenue less cost of revenue of approximately 72% for 2021. Porch continues to expect Adjusted EBITDA margin of -10% to -16% for the full year of 2021, which is an improvement from -26% in 2020 and -57% in 2019 pro forma adjusted for past divestitures.

Porch is not providing reconciliations of expected Adjusted EBITDA margin or contribution margin for future periods to the most directly comparable measures prepared in accordance with GAAP because Porch is unable to provide these reconciliations without unreasonable effort because certain information necessary to calculate such measures on a GAAP basis is unavailable or dependent on the timing of future events outside of Porch’s control.

Conference Call

Porch management will host a conference call today (May 17, 2021) at 5:00 p.m. Eastern time (2:00 p.m. Pacific time). The presentation will be accompanied by a slide presentation available on the Investor Relations section of the Company’s website. A question-and-answer session will follow management’s prepared remarks.

All are invited to listen to the event by registering for the webinar here.

To access the webinar by telephone, please see below:

Or One tap mobile:

U.S.: +14086380968,,88683232630#,,,,*810400# US or +16699006833,,88683232630#,,,,*810400#


Graphic

Or join by phone:

Dial (for higher quality, dial a number based on your current location):

US: +1 408 638 0968 or +1 669 900 6833 or +1 253 215 8782 or +1 346 248 7799 or +1 646 876 9923 or +1 301 715 8592 or +1 312 626 6799

Webinar ID: 886 8323 2630

Passcode: 810400

International numbers available here.

If you have any difficulty connecting with the conference call or webcast, please contact Porch’s investor relations team at (949) 574-3860 or [email protected].

A replay of the webinar will also be available in the Investors section of Porch’s corporate website.

About Porch Group

Seattle-based Porch Group, the vertical software platform for the home, provides software and services to more than 11,150 home services companies such as home inspectors, moving companies, real estate agencies, utility companies, and warranty companies. Through these relationships and its multiple brands, Porch provides a moving concierge service to homebuyers, helping them save time and make better decisions on critical services, including insurance, moving, security, TV/internet, home repair and improvement, and more. To learn more about Porch, visit porchgroup.com or porch.com.

Forward-Looking Statements

Certain statements in this release may be considered “forward-looking statements” within the meaning of the “safe harbor” provisions of the United States Private Securities Litigation Reform Act of 1995. Forward-looking statements generally relate to future events or Porch’s future financial or operating performance. For example, projections of future revenue, contribution margin, Adjusted EBITDA and other metrics, business strategy and plans, and anticipated impacts from pending or completed acquisitions, are forward-looking statements. In some cases, you can identify forward-looking statements by terminology such as “may,” “should,” “expect,” “intend,” “will,” “estimate,” “anticipate,” “believe,” “predict,” “potential” or “continue,” or the negatives of these terms or variations of them or similar terminology. Such forward-looking statements are subject to risks, uncertainties, and other factors which could cause actual results to differ materially from those expressed or implied by such forward looking statements.

These forward-looking statements are based upon estimates and assumptions that, while considered reasonable by Porch and its management, are inherently uncertain. Factors that may cause actual results to differ materially from current expectations include, but are not limited to: (1) the ability to recognize the anticipated benefits of Porch’s December 2020 business combination (the “Merger”) with PropTech Acquisition Corporation (“PropTech”), which may be affected by, among other things, competition and the ability of the combined company to grow and manage growth profitably, maintain key commercial relationships and retain its management and key employees; (2) expansion plans and opportunities, including future and pending acquisitions or additional business combinations; (3) costs related to the Merger and being a public company; (4) litigation, complaints, and/or adverse publicity; (5) the impact of changes in consumer spending patterns, consumer preferences, local, regional and national economic conditions, crime, weather, demographic trends and employee availability; (6) privacy and data protection


Graphic

laws, privacy or data breaches, or the loss of data; (7) the impact of the COVID-19 pandemic and its effect on the business and financial conditions of Porch; and (8) other risks and uncertainties described in Porch’s most recent annual report on Form 10-K and quarterly report on Form 10-Q, filed with the Securities and Exchange Commission (the “SEC”), which are available on the SEC’s website at www.sec.gov.

Nothing in this release should be regarded as a representation by any person that the forward-looking statements set forth herein will be achieved or that any of the contemplated results of such forward-looking statements will be achieved. You should not place undue reliance on forward-looking statements, which speak only as of the date of this release. Porch does not undertake any duty to update these forward-looking statements, whether as a result of changed circumstances, new information, future events or otherwise, except as may be required by law.

Non-GAAP Financial Measures

Some of the financial information and data contained in this press release, such as Adjusted EBITDA, Adjusted EBITDA margin and contribution margin, has not been prepared in accordance with United States generally accepted accounting principles (“GAAP”). Porch defines Adjusted EBITDA as net income (loss) plus interest expense, net, income tax expense (benefit), other expense, net, and depreciation and amortization, certain non-cash long-lived asset impairment charges, stock-based compensation expense and acquisition-related impacts, including compensation to the sellers that requires future service, amortization of intangible assets, gains (losses) recognized on changes in the value of contingent consideration arrangements, if any, gain or loss on divestures and certain transaction costs. Adjusted EBITDA margin is defined as Adjusted EBITDA as a percentage of total revenue. Contribution margin is defined as revenue less all variable expenses, including cost of revenue, market, and sales. See the reconciliation table below for more details regarding these non-GAAP measurements, including the reconciliation of historical non-GAAP figures to the nearest comparable GAAP measure.

Porch uses these non-GAAP measures to compare Porch’s performance to that of prior periods for budgeting and planning purposes. Porch believes that the use of these non-GAAP financial measures provides an additional tool for investors to use in evaluating projected operating results and trends in and in comparing Porch’s financial measures with other similar companies, many of which present similar non-GAAP financial measures to investors. Porch's method of determining these non-GAAP measures may be different from other companies' methods and, therefore, may not be comparable to those used by other companies and Porch does not recommend the sole use of these non-GAAP measures to assess its financial performance. Porch management does not consider these non-GAAP measures in isolation or as an alternative to financial measures determined in accordance with GAAP.


Graphic

You should review the following reconciliation of non-GAAP measures to the nearest comparable GAAP measures, and not rely on any single financial measure to evaluate Porch’s business:

March 31,

March 31,


2021


2020

Net loss

$

(65,101)

$

(18,367)

Interest expense

1,223

3,086

Income tax(benefit) expense

(350)

21

Depreciation and amortization

2,463

1,789

Other expense, net

(83)

1,874

Non-cash long-lived asset impairment charge


68


167

Non-cash stock-based compensation

16,723

369

Non-cash bonus expense

290

Revaluation of contingent consideration

(355)

(80)

Revaluation of earnout liability

18,770

Revaluation of private warrant liability

15,910

Acquisition and related (income) expense


840


371

Adjusted EBITDA (loss)

$

(9,602)

$

(10,770)

Adjusted EBITDA (loss) as a percentage of revenue

(36)

%  

(71)

%

Investor Relations Contact:

Cody Slach, Matt Glover

Gateway Group, Inc.

(949) 574-3860

[email protected]

Porch Press contact:

Jordan Schmidt

Gateway Group, Inc.

(949) 386-6332

[email protected]


Graphic

Porch Group, Inc.

Condensed Consolidated Statements of Operations

(In thousands, except share and per share data)

Three Months Ended

March 31,


2021


2020

Revenue

$

26,742

$

15,074

Operating expenses:

Cost of revenue

5,930

4,099

Selling and marketing

14,638

12,853

Product and technology

11,789

7,352

General and administrative

24,016

4,156

Total operating expenses


56,373


28,460

Operating loss


(29,631)


(13,386)

Other income (expense):


Interest expense

(1,223)

(3,086)

Change in fair value of earnout liability

(18,770)

Change in fair value of private warrant liability

(15,910)

Other income (expense), net

83

(1,874)

Total other income (expense)

(35,820)

(4,960)

Loss before income taxes

(65,451)

(18,346)

Income tax (benefit) expense

(350)

21

Net loss

$

(65,101)

$

(18,367)

Net loss attributable per share to common stockholders:

Basic

$

(0.76)

$

(0.53)

Diluted

$

(0.76)

$

(0.53)

Weighted-average shares used in computing net loss attributable per share to common stockholders:


Basic

85,331,575

34,965,300

Diluted

85,331,575

34,965,300


Graphic

Porch Group, Inc.

Condensed Consolidated Balance Sheets

(In thousands)

December 31, 2020


March 31, 2021


(Restated)

Assets

Current assets

Cash and cash equivalents

$

222,948

$

196,046

Accounts receivable, net

9,629

4,268

Prepaid expenses and other current assets


7,869


4,080

Restricted cash

10,435

11,407

Total current assets

250,881

215,801

Property, equipment, and software, net

5,328

4,593

Goodwill


50,120


28,289

Intangible assets, net

22,715

15,961

Long-term insurance commissions receivable

4,748

3,365

Other assets


444


378

Total assets

$

334,236

$

268,387

Liabilities and Stockholders' Equity

Current liabilities

Accounts payable

$

6,384

$

9,203

Accrued expenses and other current liabilities

15,268

9,905

Deferred revenue

4,346

5,208

Refundable customer deposit


2,026


2,664

Current portion of long-term debt

7,480

4,746

Total current liabilities


35,504


31,726

Long-term debt

42,624

43,237

Refundable customer deposit, non-current

396

529

Earnout liability, at fair value

43,193

50,238

Private warrant liability, at fair value

47,444

31,534

Other liabilities (includes $2,869 and $3,549 at fair value, respectively)

3,068

3,798

Total liabilities

172,229

161,062

Commitments and contingencies

Stockholders' equity

Common stock, $0.0001 par value: Authorized shares – 400,000,000 and 400,000,000 Issued and outstanding shares – 91,455,732 and 81,669,151

8

8

Additional paid-in capital


544,606


424,823

Accumulated deficit


(382,607)


(317,506)

Total stockholders' equity

162,007

107,325

Total liabilities and stockholders' equity

$

334,236

$

268,387


Graphic

Porch Group, Inc.

Consolidated Statements of Cash Flows

(In thousands)

Three Months Ended

March 31, 


2021


2020

Cash flows from operating activities:


Net loss

$

(65,101)

$

(18,367)

Adjustments to reconcile net loss to net cash used in operating activities


Depreciation and amortization


2,463


1,789

Loss on sale and impairment of long-lived assets

68

167

Loss (gain) on extinguishment of debt


247

Loss on remeasurement of debt


454

Loss on remeasurement of warrants


15,910


1,079

Loss (gain) on remeasurement of contingent consideration


(355)


(80)

Loss on remeasurement of earnout liability

18,770

Stock-based compensation


16,835


672

Interest expense (non-cash)


311


1,089

Other


(225)


167

Change in operating assets and liabilities, net of acquisitions and divestitures


Accounts receivable


(846)


559

Prepaid expenses and other current assets


441


281

Long-term insurance commissions receivable

(1,383)

(174)

Accounts payable


(8,090)


1,414

Accrued expenses and other current liabilities


2,625


1,651

Deferred revenue


(1,362)


136

Refundable customer deposits


(837)


(880)

Contingent consideration - business combination

(1,663)

Other


(496)


158

Net cash used in operating activities


(22,935)


(9,638)

Cash flows from investing activities:


Purchases of property and equipment


(34)


(84)

Capitalized internal use software development costs


(798)


(890)

Acquisitions, net of cash acquired


(22,882)


Net cash used in investing activities


(23,714)


(974)

Cash flows from financing activities:


Proceeds from debt issuance, net of fees


1,940

Repayments of principal and related fees


(150)


(401)

Proceeds from issuance of redeemable convertible preferred stock, net of fees


4,714

Proceeds from exercises of warrants


89,771


Proceeds from exercises of stock options

355

1

Income tax withholdings paid upon vesting of restricted stock units

(16,997)

Settlement of contingent consideration related to a business combination


(400)


Net cash provided by financing activities


72,579


6,254

Change in cash, cash equivalents, and restricted cash

$

25,930

$

(4,358)

Cash, cash equivalents, and restricted cash, beginning of period

$

207,453

$

7,179

Cash, cash equivalents, and restricted cash end of period

$

233,383

$

2,821


Exhibit 99.2

GRAPHIC

Copyright 2021 Porch Group, Inc. All rights reserved 1 Q1 2021 Earnings Presentation May 17, 2021 Group Love your home. For moving and improving and everything in between.

GRAPHIC

Copyright 2021 Porch Group, Inc. All rights reserved 2 DISCLAIMERS 2 Forward-Looking Statements Certain statements in this presentation may be considered “forward-looking statements” within the meaning of the “safe harbor” provisions of the United States Private Securities Litigation Reform Act of 1995. Forward-looking statements generally relate to future events or Porch Group, Inc.’s (“Porch”) future financial or operating performance. For example, projections of future revenue, contribution margin, Adjusted EBITDA and other metrics, business strategy and plans, and anticipated impacts from pending or completed acquisitions, are forward-looking statements. In some cases, you can identify forward-looking statements by terminology such as “may,” “should,” “expect,” “intend,” “will,” “estimate,” “anticipate,” “believe,” “predict,” “potential” or “continue,” or the negatives of these terms or variations of them or similar terminology. Such forward-looking statements are subject to risks, uncertainties, and other factors which could cause actual results to differ materially from those expressed or implied by such forward looking statements. These forward-looking statements are based upon estimates and assumptions that, while considered reasonable by Porch and its management, are inherently uncertain. Factors that may cause actual results to differ materially from current expectations include, but are not limited to:(1) the ability to recognize the anticipated benefits of Porch’s December 2020 business combination (the “Merger”) with PropTech Acquisition Corporation (“PropTech”), which may be affected by, among other things, competition and the ability of the combined company to grow and manage growth profitably, maintain key commercial relationships and retain its management and key employees;(2) expansion plans and opportunities, including future and pending acquisitions or additional business combinations;(3) costs related to the Merger and being a public company;(4) litigation, complaints, and/or adverse publicity;(5) the impact of changes in consumer spending patterns, consumer preferences, local, regional and national economic conditions, crime, weather, demographic trends and employee availability;(6) privacy and data protection laws, privacy or data breaches, or the loss of data;(7) the impact of the COVID-19 pandemic and its effect on the business and financial conditions of Porch; and (8) other risks and uncertainties described in Porch’s most recent Form 10-K and quarterly report on Form 10-Q, filed with the Securities and Exchange Commission (“SEC”), which are available on the SEC’s website at www.sec.gov. Nothing in this presentation should be regarded as a representation by any person that the forward-looking statements set forth herein will be achieved or that any of the contemplated results of such forward-looking statements will be achieved. You should not place undue reliance on forward-looking statements, which speak only as of the date of this presentation. Porch does not undertake any duty to update these forward-looking statements, whether as a result of changed circumstances, new information, future events or otherwise, except as may be required by law. 2020 Financial Information; Non-GAAP Financial Measures Some of the financial information and data contained in this presentation, such as Adjusted EBITDA, Adjusted EBITDA Margin, Contribution Margin, and Gross Written Premium have not been prepared in accordance with United States generally accepted accounting principles (“GAAP”). Porch defines Adjusted EBITDA as net income (loss) plus interest expense, net, income tax expense (benefit), other expense, net, and depreciation and amortization, certain non-cash long-lived asset impairment charges, stock- based compensation expense and acquisition-related impacts, including compensation to the sellers that requires future service, amortization of intangible assets, gains (losses) recognized on changes in the value of contingent consideration arrangements, if any, gain or loss on divestures and certain transaction costs. Adjusted EBITDA Margin is defined as Adjusted EBITDA as a percentage of total revenue. Contribution Margin is defined as revenue less all variable expenses, including cost of revenue, marketing and sales. Gross Written Premium represents the total dollars of insurance premium sales based on date of contract execution. The effects of these excluded items may be significant. Porch is not providing reconciliations of expected Adjusted EBITDA, Adjusted EBITDA Margin, Contribution Margin, or Gross Written Premium for future periods to the most directly comparable measures prepared in accordance with GAAP because Porch is unable to provide these reconciliations without unreasonable effort because certain information necessary to calculate such measures on a GAAP basis is unavailable or dependent on the timing of future events outside of our control. Porch uses these non-GAAP measures to compare Porch’s performance to that of prior periods for budgeting and planning purposes. Porch believes these non-GAAP measures of financial results provide useful information to management and investors regarding certain financial and business trends relating to Porch’s results of operations. Porch believes that the use of these non-GAAP financial measures provides an additional tool for investors to use in evaluating projected operating results and trends in and in comparing Porch’s financial measures with other similar companies, many of which present similar non-GAAP financial measures to investors. Porch's method of determining these non-GAAP measures may be different from other companies' methods and, therefore, may not be comparable to those used by other companies and Porch does not recommend the sole use of these non-GAAP measures to assess its financial performance. Porch management does not consider these non-GAAP measures in isolation or as an alternative to financial measures determined in accordance with GAAP. The principal limitation of these non-GAAP financial measures is that they exclude significant expenses and income that are required by GAAP to be recorded in Porch’s financial statements. In addition, they are subject to inherent limitations as they reflect the exercise of judgments by management about which expense and income are excluded or included in determining these non-GAAP financial measures. In order to compensate for these limitations, management presents non-GAAP financial measures in connection with GAAP results.

GRAPHIC

Copyright 2021 Porch Group, Inc. All rights reserved Presenters Matt Ehrlichman CEO & Founder, Porch Group Marty Heimbigner CFO, Porch Group Matthew Neagle COO, Porch Group 3 Nicole Pelley VP Product, Porch Group

GRAPHIC

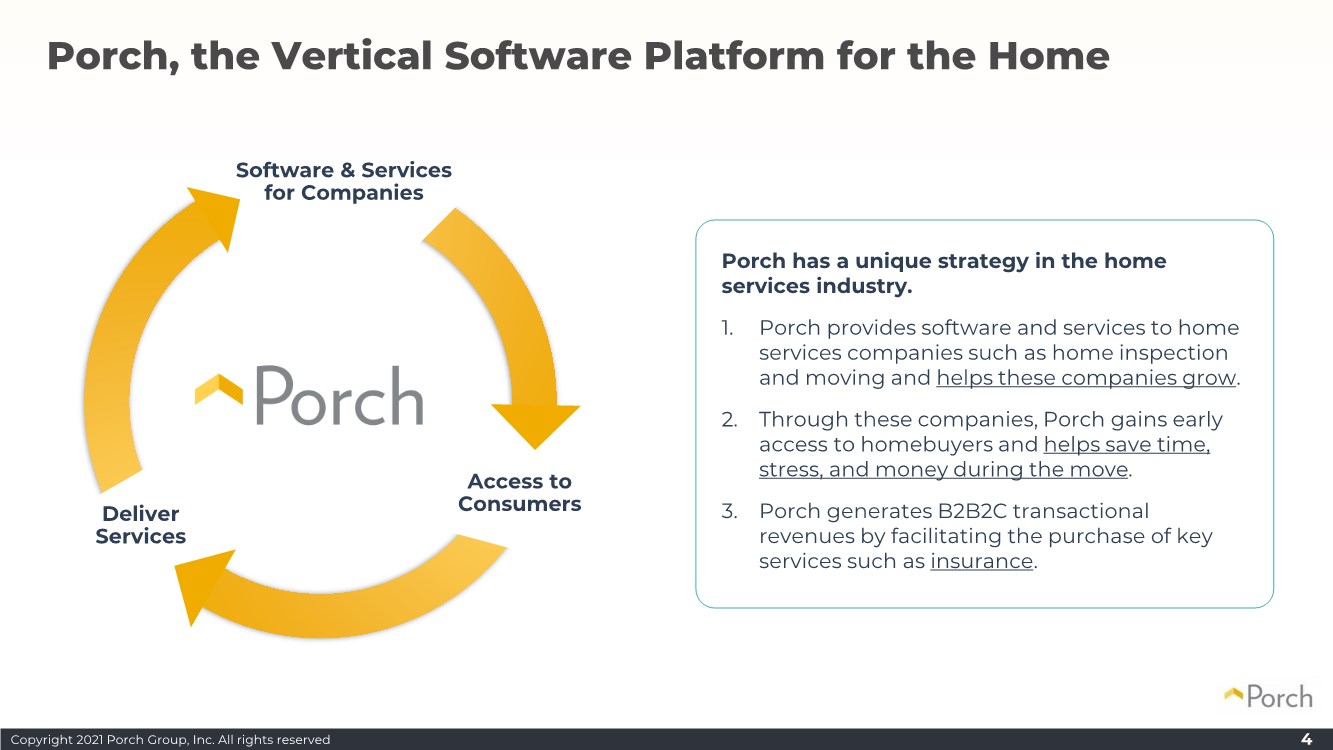
Copyright 2021 Porch Group, Inc. All rights reserved Software & Services for Companies Access to Consumers Deliver Services Porch has a unique strategy in the home services industry. 1. Porch provides software and services to home services companies such as home inspection and moving and helps these companies grow. 2. Through these companies, Porch gains early access to homebuyers and helps save time, stress, and money during the move. 3. Porch generates B2B2C transactional revenues by facilitating the purchase of key services such as insurance. Porch, the Vertical Software Platform for the Home 4

GRAPHIC

Copyright 2021 Porch Group, Inc. All rights reserved 5

GRAPHIC

Copyright 2021 Porch Group, Inc. All rights reserved 6 Key Focus Areas for 2021 1. Increase number of companies using our vertical software 2. Increase access to consumers from software companies 3. Increase B2B2C transaction revenue per consumer 4. Continue to scale our InsurTech business 5. Help brands and advertisers improve their mover marketing 6. Pursue strategic and accretive M&A opportunities 6

GRAPHIC

Copyright 2021 Porch Group, Inc. All rights reserved 7 Q1 2021 Results & 2021E Guidance Group

GRAPHIC

Copyright 2021 Porch Group, Inc. All rights reserved 8 Strong Year-over-Year Growth (1) PF stands for Pro Forma to account for the removal of financial results related to past divested businesses. Disclaimer: See Appendix for a reconciliation of Revenue Less Cost of Revenue %, Adjusted EBITDA % and Contribution Margin % to their most directly comparable GAAP financial measures. $26.7M 78% 41% -36% Q1 2021 Actuals $12.6M 80% 5% -79% Q1 2020 PF Actuals (1) YoY ▲ $14.1M or +112% 2% pts 36% pts 43% pts

GRAPHIC

Copyright 2021 Porch Group, Inc. All rights reserved 9 Q1 Revenue Grew 112% Year-over-Year and Beat Q1 Guidance Q1 2021 Revenue vs Q1 Revenue Guidance Revenue Growth if M&A occurred Jan 1, 2021 $23.0M Beat Guidance by 16% $3.7M $26.7M Q1-21 Revenue Guidance Higher Revenue Q1-21 Revenue Actuals $12.6M ~$25.0M ~$37.6M ~200% YoY Growth Incremental growth with full quarter of M&A (i.e. HOA, V12) $14.1M Actual YoY Growth (112%) ~$11M Pro Forma M&A Q1-21 Revenue Actuals + PF M&A Q1-20 Revenue Pro Forma

GRAPHIC

Copyright 2021 Porch Group, Inc. All rights reserved 10 Raising FY 2021E Revenue Guidance and Reiterating Margin Guidance $175M (143% YoY Growth) ~40% -10% to -16% Previous 2021E Guidance $178M (147% YoY Growth) ~72% ~40% -10% to -16% Current 2021E Guidance Guidance ▲ New No Change No Change Disclaimer: Porch is not providing reconciliations of forward-looking non-GAAP guidance to the comparable GAAP measures because certain information necessary to calculate such measures on a GAAP basis is unavailable or dependent on the timing of future events outside of Porch’s control.

GRAPHIC

Copyright 2021 Porch Group, Inc. All rights reserved 25% 65% 10% Note: PF figures are Pro Forma results which exclude the financial results of certain Porch businesses divested during 2019 and the first half of 2020, after giving effect to all such divestitures as if they had occurred on January 1, 2018. (1) Based on internal estimates, Porch believes without the COVID-19 pandemic it would have achieved $85M in revenue for the 2020 year resulting in 2020 and 2021E revenue growth would have been 49% and ~109%, respectively. (2) In January 2021, Porch announced the acquisitions of Homeowners of America (HOA) and V12 and layered $50M of 2021 revenue into our guidance. This was based on the expectation of HOA closing at the start of Q2. It closed on April 6, 2021. (3) B2B includes recurring fees paid by Companies to Porch for SaaS and other services. (4) B2B2C (Move-Related Services) includes revenue predominantly related to selling consumers insurance, moving, security and TV/internet with majority of these consumers being provided to Porch on a reoccurring basis by companies. (5) B2B2C and B2C (Post-Move Services) includes revenue predominantly related to connecting consumers with contractors across home maintenance and improvement projects with these consumers originating from both 1) companies on a reoccurring basis, and 2) direct-to-consumer channels. 11 2021E Revenue: 147% Growth with ~90% Recurring or Reoccurring Revenue 2018PF 2019PF 2020A 2021E $36M $57M $178M % Growth 58% 26% ~147% 49% ~109% (1) (1) Software & Services Subscriptions B2B Recurring Fees From Companies Move-Related Transactions B2B2C Recurring & Reoccurring Transaction Fees via Companies Post-Move Transactions B2B2C and B2C Transaction Fees (3) (4) (5) $72M $85M (1) FY 2021E Guidance Revenue Distribution $50M (HOA + V12) (2)

GRAPHIC

Copyright 2021 Porch Group, Inc. All rights reserved Note: PF figures are Pro Forma results which exclude the financial results of certain Porch businesses divested during 2019 and the first half of 2020, after giving effect to all such divestitures as if they had occurred on January 1, 2018. Disclaimer: See Appendix for a reconciliation of Adjusted EBITDA and Contribution Margin to their most directly comparable GAAP financial measures. Porch is not providing reconciliations of forward-looking non-GAAP guidance to the comparable GAAP measures because certain information necessary to calculate such measures on a GAAP basis is unavailable or dependent on the timing of future events outside of Porch’s control. 12 2021E Contribution Margin % and Adjusted EBITDA % Continued Growth Contribution Margin % 2018PF 2019PF 2020A 2021E 7% 19% 40% 31% Long-Term Target 50% Adjusted EBITDA % 2018PF 2019PF 2020A 2021E -79% -57% -25% -10% to -16% 25% Long-Term Target

GRAPHIC

Copyright 2021 Porch Group, Inc. All rights reserved 13 KPIs – Number of Companies & Average Revenue Per Company (1) Porch management defines average companies in a quarter as an average of the end of period number of companies with the beginning of period number, inclusive of all companies across Porch’s home services verticals that (i) generate recurring revenue and (ii) generated revenue in the quarter. For newly acquired companies, we determine the number of customers in their initial quarter based on the percentage of the quarter they were part of Porch. (2) Average revenue per account per month in quarter is defined as the total revenue from the quarter divided by the average number of companies in the period divided by 3 (to provide monthly revenue). Note: while the wording of both footnote (1) and (2) on this slide has been updated to be made more clear, they are the same calculations the company has been using to date. Q1 Q2 Q3 Q4 (1) (2)

GRAPHIC

Copyright 2021 Porch Group, Inc. All rights reserved 14 KPIs – Monetized Services for Consumers (1) Monetized Services per Quarter is defined as the total number of unique consumer services from which Porch generated revenue, including, but not limited to, new and renewing insurance customers, completed moving jobs, security installations, TV/internet installations or other home projects, measured over a quarterly period. (2) Average revenue per monetized services in quarter is defined as the total service revenue (Move-Related Transaction revenue plus Post-Move Transaction revenue) divided by the number of Monetized Services per Quarter. Note: while the wording of both footnote (1) and (2) on this slide has been updated to be made more clear, they are the same calculations the company has been using to date. Q1 Q2 Q3 Q4 (1) (2)

GRAPHIC

Copyright 2021 Porch Group, Inc. All rights reserved 15 Deep Dives Group

GRAPHIC

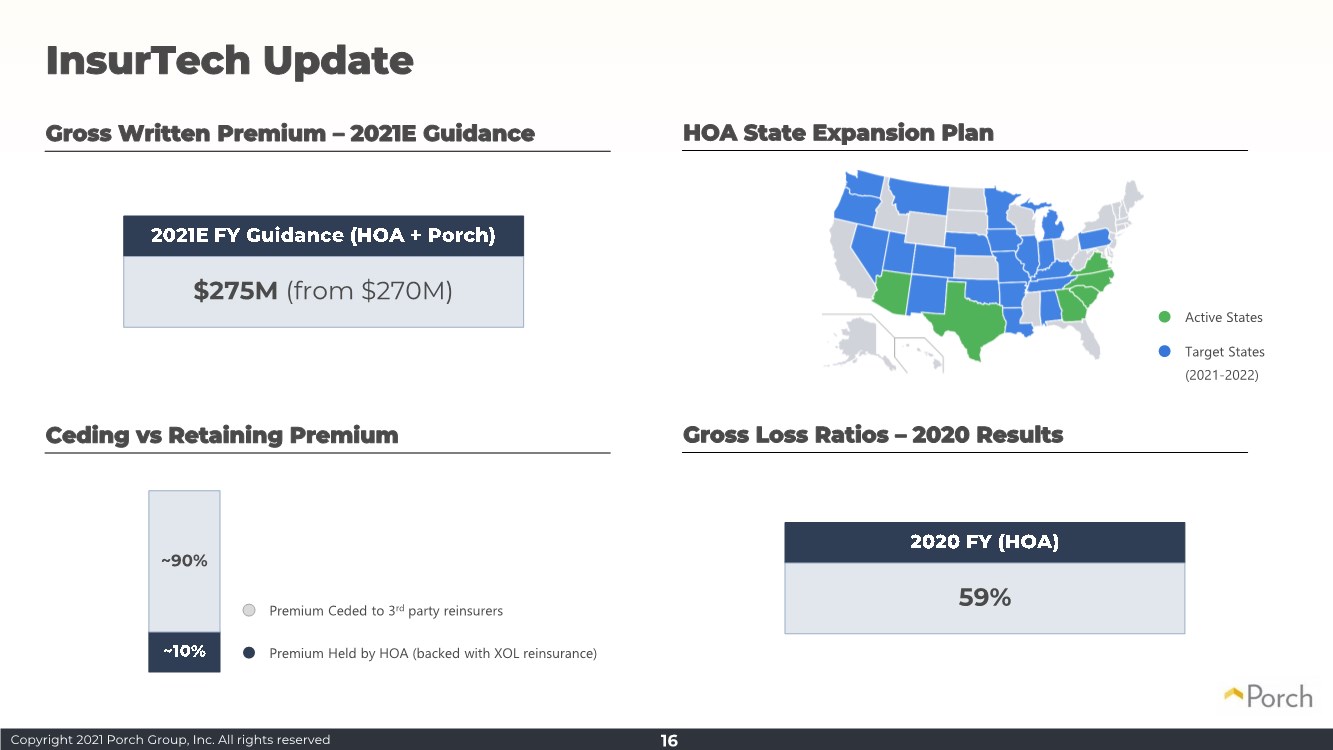
Copyright 2021 Porch Group, Inc. All rights reserved InsurTech Update Gross Written Premium – 2021E Guidance HOA State Expansion Plan Gross Loss Ratios – 2020 Results Active States Target States (2021-2022) $275M (from $270M) 59% 16 Ceding vs Retaining Premium ~90% Premium Ceded to 3rd party reinsurers Premium Held by HOA (backed with XOL reinsurance)

GRAPHIC

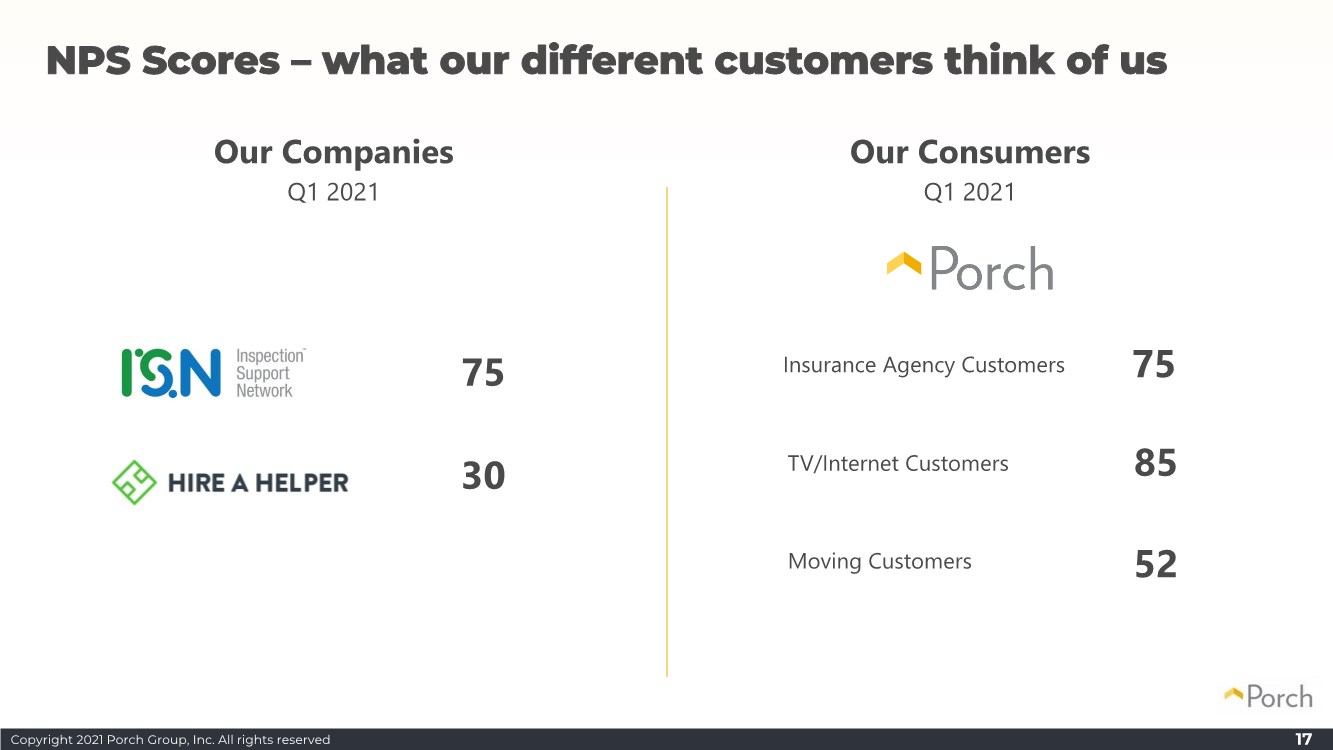
Copyright 2021 Porch Group, Inc. All rights reserved NPS Scores – what our different customers think of us 17 Our Companies Q1 2021 Our Consumers Q1 2021 75 30 85 TV/Internet Customers Moving Customers 52 Insurance Agency Customers 75

GRAPHIC

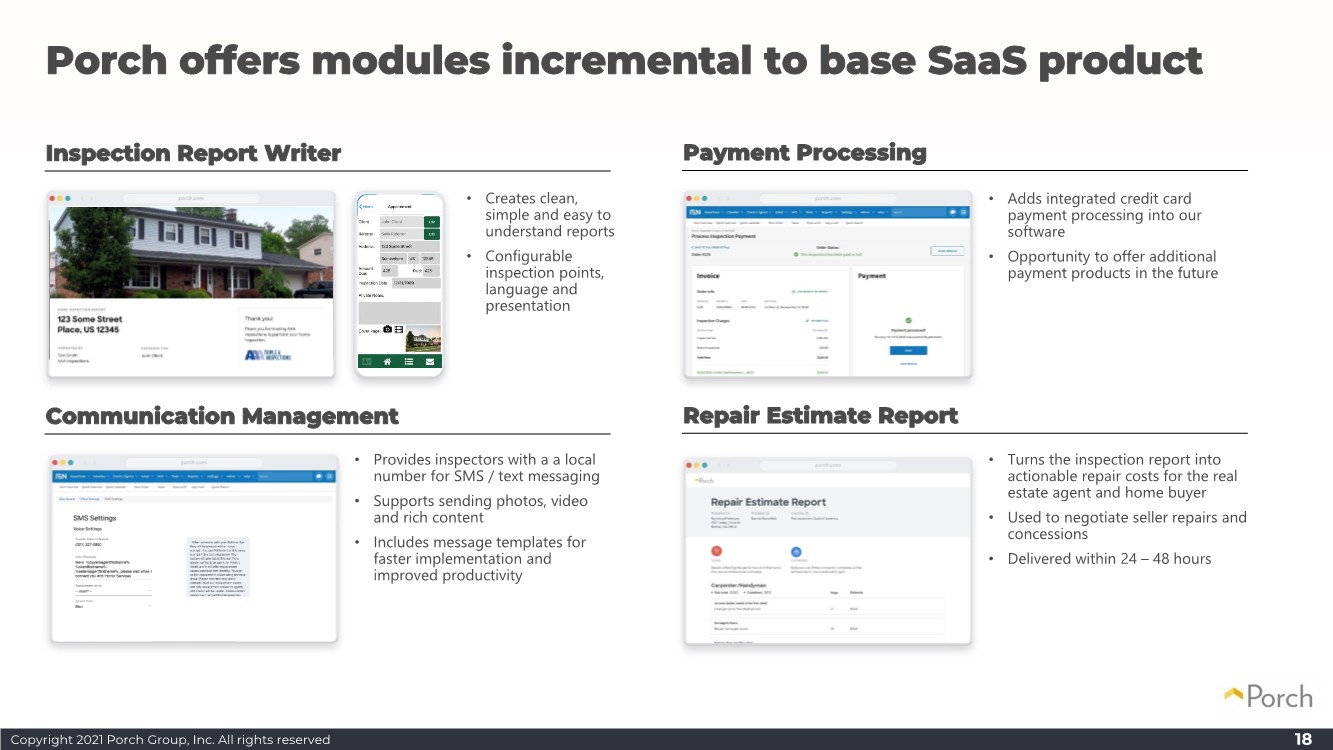
Copyright 2021 Porch Group, Inc. All rights reserved Porch offers modules incremental to base SaaS product 18 Inspection Report Writer Payment Processing Communication Management Repair Estimate Report • Adds integrated credit card payment processing into our software • Opportunity to offer additional payment products in the future • Turns the inspection report into actionable repair costs for the real estate agent and home buyer • Used to negotiate seller repairs and concessions • Delivered within 24 – 48 hours • Provides inspectors with a a local number for SMS / text messaging • Supports sending photos, video and rich content • Includes message templates for faster implementation and improved productivity • Creates clean, simple and easy to understand reports • Configurable inspection points, language and presentation

GRAPHIC

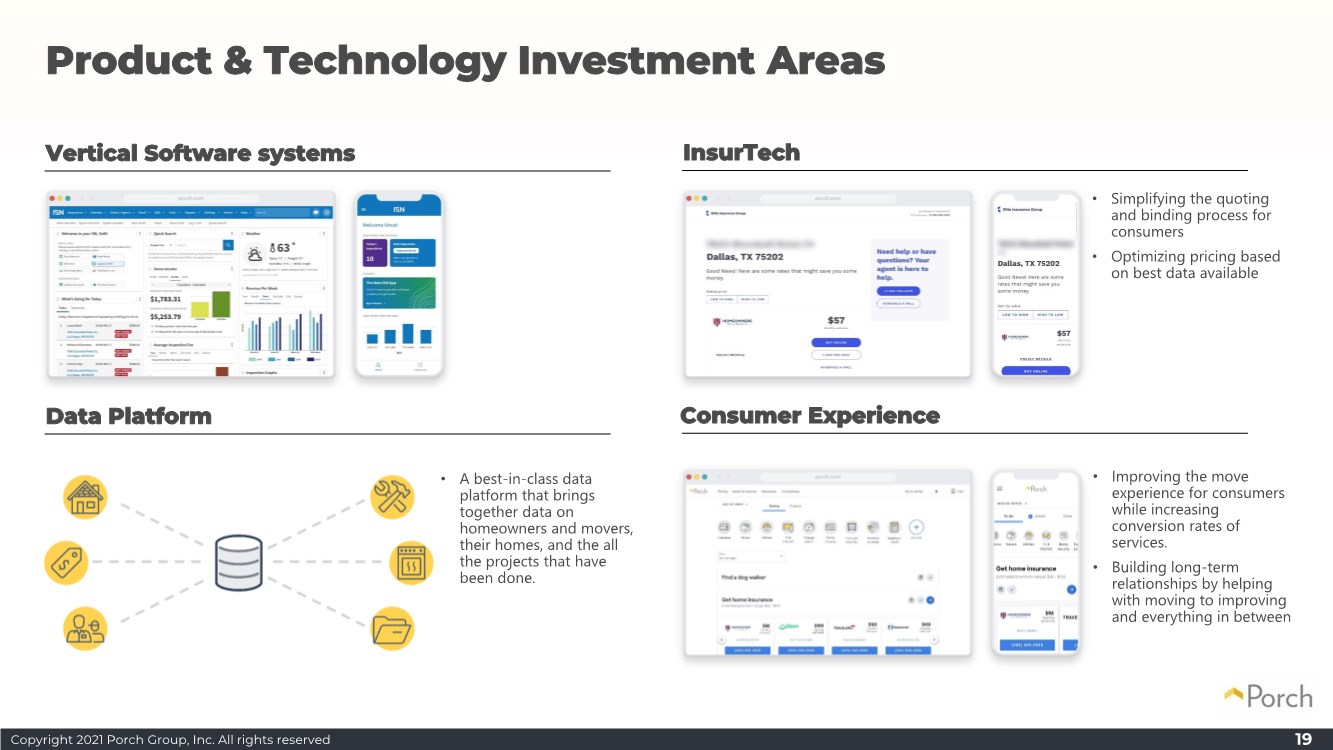
Copyright 2021 Porch Group, Inc. All rights reserved Product & Technology Investment Areas 19 Vertical Software systems InsurTech Data Platform Consumer Experience • Simplifying the quoting and binding process for consumers • Optimizing pricing based on best data available • Improving the move experience for consumers while increasing conversion rates of services. • Building long-term relationships by helping with moving to improving and everything in between • A best-in-class data platform that brings together data on homeowners and movers, their homes, and the all the projects that have been done.

GRAPHIC

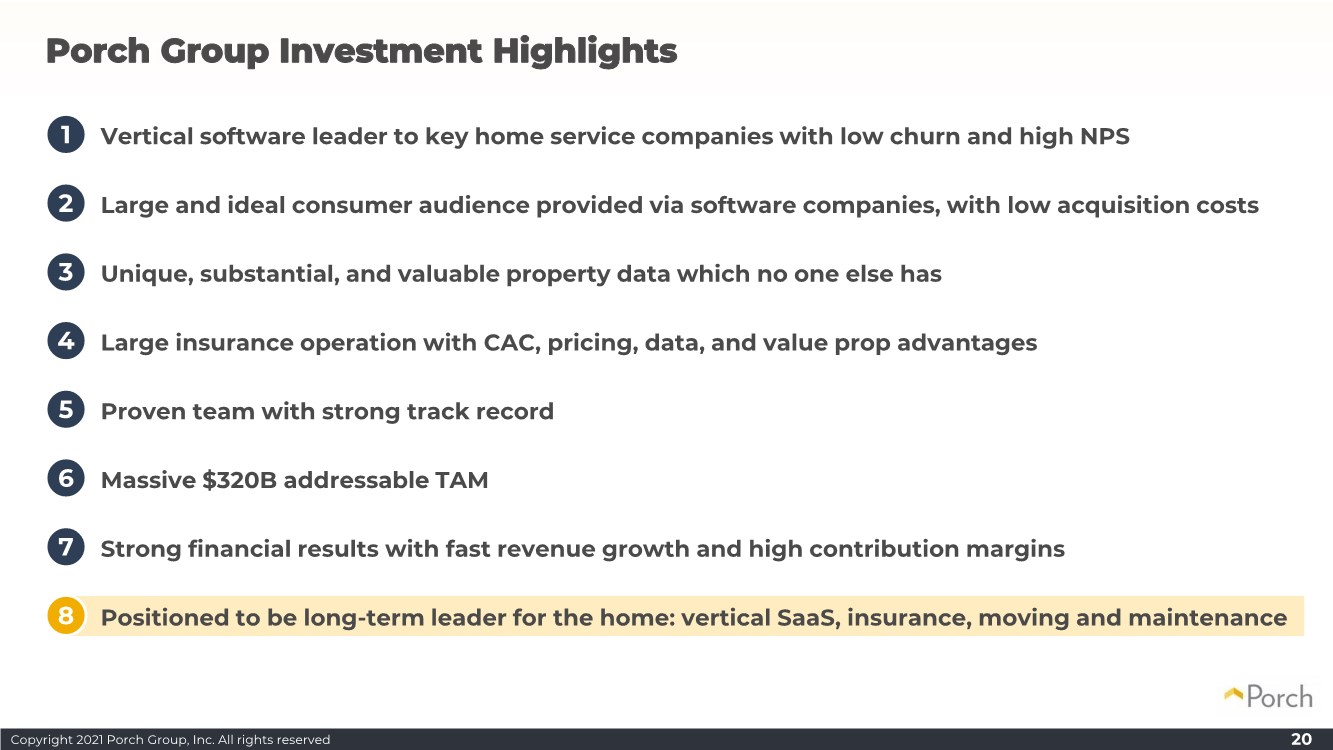
Copyright 2021 Porch Group, Inc. All rights reserved 20 Porch Group Investment Highlights 1. Vertical software leader to key home service companies with low churn and high NPS 2. Large and ideal consumer audience provided via software companies, with low acquisition costs 3. Unique, substantial, and valuable property data which no one else has 4. Large insurance operation with CAC, pricing, data, and value prop advantages 5. Proven team with strong track record 6. Massive $320B addressable TAM 7. Strong financial results with fast revenue growth and high contribution margins 8. Positioned to be long-term leader for the home: vertical SaaS, insurance, moving and maintenance 1 2 3 4 5 6 7 8

GRAPHIC

Copyright 2021 Porch Group, Inc. All rights reserved 21 Thank you Group

GRAPHIC

Copyright 2021 Porch Group, Inc. All rights reserved 22 Q&A Group

GRAPHIC

Copyright 2021 Porch Group, Inc. All rights reserved 23 Appendix Group

GRAPHIC

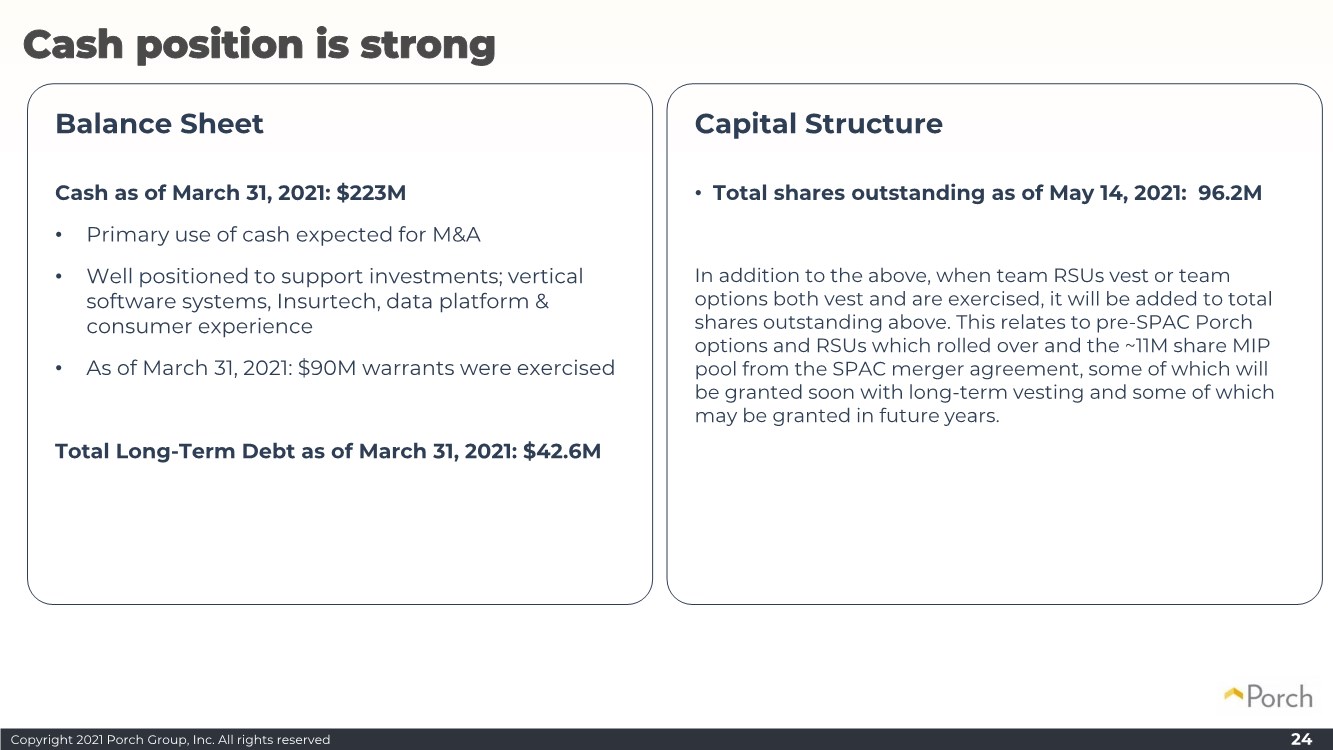
Copyright 2021 Porch Group, Inc. All rights reserved 24 Balance Sheet Cash as of March 31, 2021: $223M • Primary use of cash expected for M&A • Well positioned to support investments; vertical software systems, Insurtech, data platform & consumer experience • As of March 31, 2021: $90M warrants were exercised Total Long-Term Debt as of March 31, 2021: $42.6M Capital Structure • Total shares outstanding as of May 14, 2021: 96.2M In addition to the above, when team RSUs vest or team options both vest and are exercised, it will be added to total shares outstanding above. This relates to pre-SPAC Porch options and RSUs which rolled over and the ~11M share MIP pool from the SPAC merger agreement, some of which will be granted soon with long-term vesting and some of which may be granted in future years. Cash position is strong

GRAPHIC

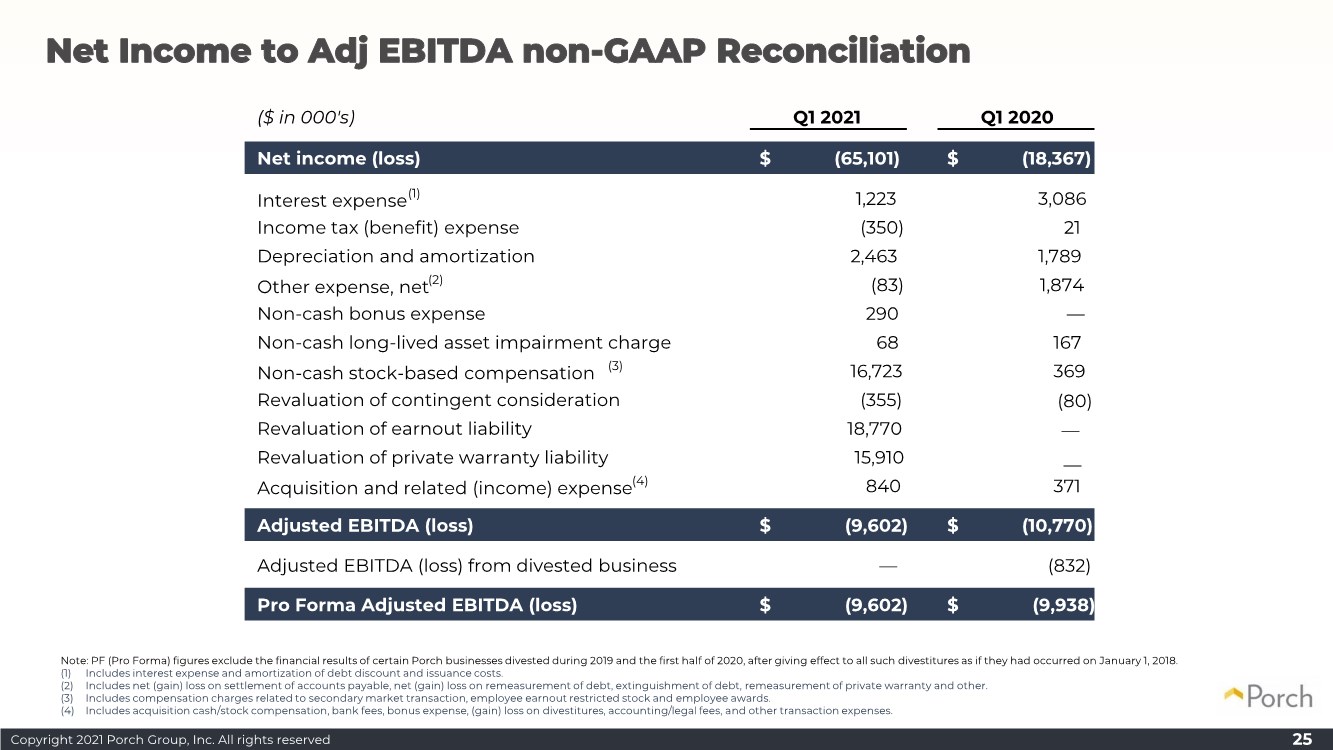
Copyright 2021 Porch Group, Inc. All rights reserved 25 Net Income to Adj EBITDA non-GAAP Reconciliation Note: PF (Pro Forma) figures exclude the financial results of certain Porch businesses divested during 2019 and the first half of 2020, after giving effect to all such divestitures as if they had occurred on January 1, 2018. (1) Includes interest expense and amortization of debt discount and issuance costs. (2) Includes net (gain) loss on settlement of accounts payable, net (gain) loss on remeasurement of debt, extinguishment of debt, remeasurement of private warranty and other. (3) Includes compensation charges related to secondary market transaction, employee earnout restricted stock and employee awards. (4) Includes acquisition cash/stock compensation, bank fees, bonus expense, (gain) loss on divestitures, accounting/legal fees, and other transaction expenses. ($ in 000's) Q1 2021 Q1 2020 Net income (loss) (65,101) $ (18,367) $ Interest expense(1) 1,223 3,086 Income tax (benefit) expense (350) 21 Depreciation and amortization 2,463 1,789 Other expense, net(2) (83) 1,874 Non-cash bonus expense 290 — Non-cash long-lived asset impairment charge 68 167 Non-cash stock-based compensation (3) 16,723 369 Revaluation of contingent consideration (355) (80) Revaluation of earnout liability 18,770 — Revaluation of private warranty liability 15,910 Acquisition and related (income) expense(4) 840 371 Adjusted EBITDA (loss) (9,602) $ (10,770) $ Adjusted EBITDA (loss) from divested business —(832) Pro Forma Adjusted EBITDA (loss) (9,602) $ (9,938) $ —

GRAPHIC

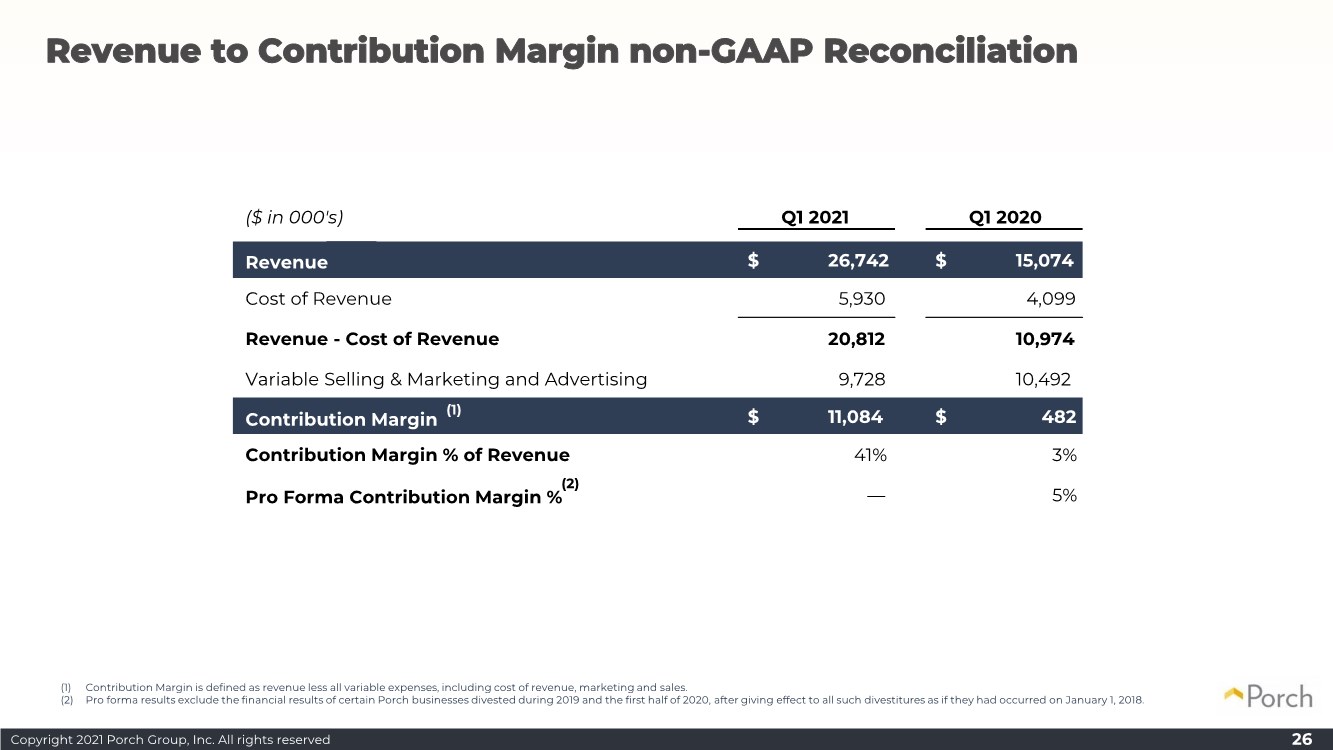
Copyright 2021 Porch Group, Inc. All rights reserved 26 Revenue to Contribution Margin non-GAAP Reconciliation (1) Contribution Margin is defined as revenue less all variable expenses, including cost of revenue, marketing and sales. (2) Pro forma results exclude the financial results of certain Porch businesses divested during 2019 and the first half of 2020, after giving effect to all such divestitures as if they had occurred on January 1, 2018. ($ in 000's) Q1 2021 Q1 2020 Revenue 26,742 $ 15,074 $ Cost of Revenue 5,930 4,099 Revenue - Cost of Revenue 20,812 10,974 Variable Selling & Marketing and Advertising 9,728 10,492 Contribution Margin (1) 11,084 $ 482 $ Contribution Margin % of Revenue 41% 3% Pro Forma Contribution Margin % (2) — 5%

GRAPHIC

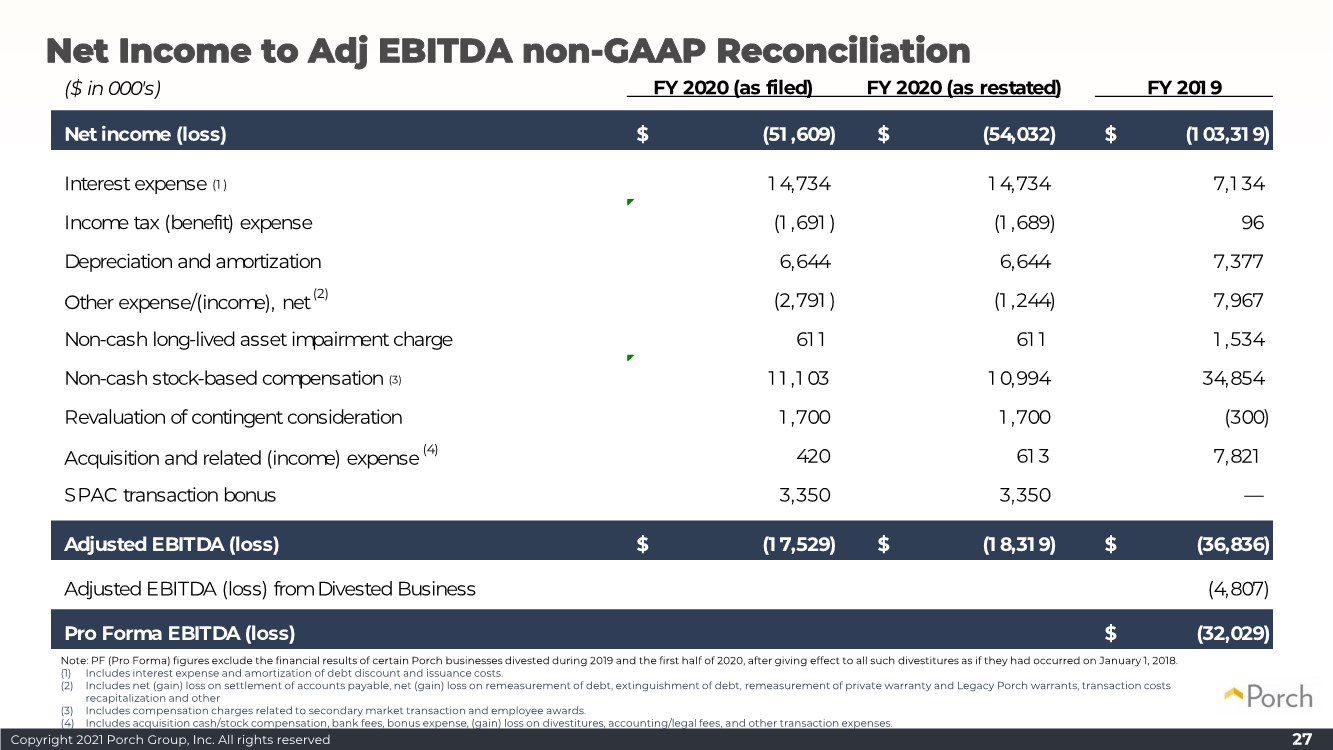
Copyright 2021 Porch Group, Inc. All rights reserved 27 Net Income to Adj EBITDA non-GAAP Reconciliation Note: PF (Pro Forma) figures exclude the financial results of certain Porch businesses divested during 2019 and the first half of 2020, after giving effect to all such divestitures as if they had occurred on January 1, 2018. (1) Includes interest expense and amortization of debt discount and issuance costs. (2) Includes net (gain) loss on settlement of accounts payable, net (gain) loss on remeasurement of debt, extinguishment of debt, remeasurement of private warranty and Legacy Porch warrants, transaction costs recapitalization and other (3) Includes compensation charges related to secondary market transaction and employee awards. (4) Includes acquisition cash/stock compensation, bank fees, bonus expense, (gain) loss on divestitures, accounting/legal fees, and other transaction expenses. ($ in 000's) FY 2020 (as filed) FY 2020 (as restated) FY 201 9 Net income (loss) (51 ,609) $ (54,032) $ (1 03,31 9) $ Interest expense (1 ) 1 4,734 1 4,734 7,1 34 Income tax (benefit) expense (1 ,691 ) (1 ,689) 96 Depreciation and amortization 6,644 6,644 7,377 Other expense/(income), net (2) (2,791 ) (1 ,244) 7,967 Non-cash long-lived asset impairment charge 61 1 61 1 1 ,534 Non-cash stock-based compensation (3) 1 1 ,1 03 1 0,994 34,854 Revaluation of contingent consideration 1 ,700 1 ,700 (300) Acquisition and related (income) expense (4) 420 61 3 7,821 SPAC transaction bonus 3,350 3,350 — Adjusted EBITDA (loss) (1 7,529) $ (1 8,31 9) $ (36,836) $ Adjusted EBITDA (loss) from Divested Business (4,807) Pro Forma EBITDA (loss) (32,029) $

GRAPHIC

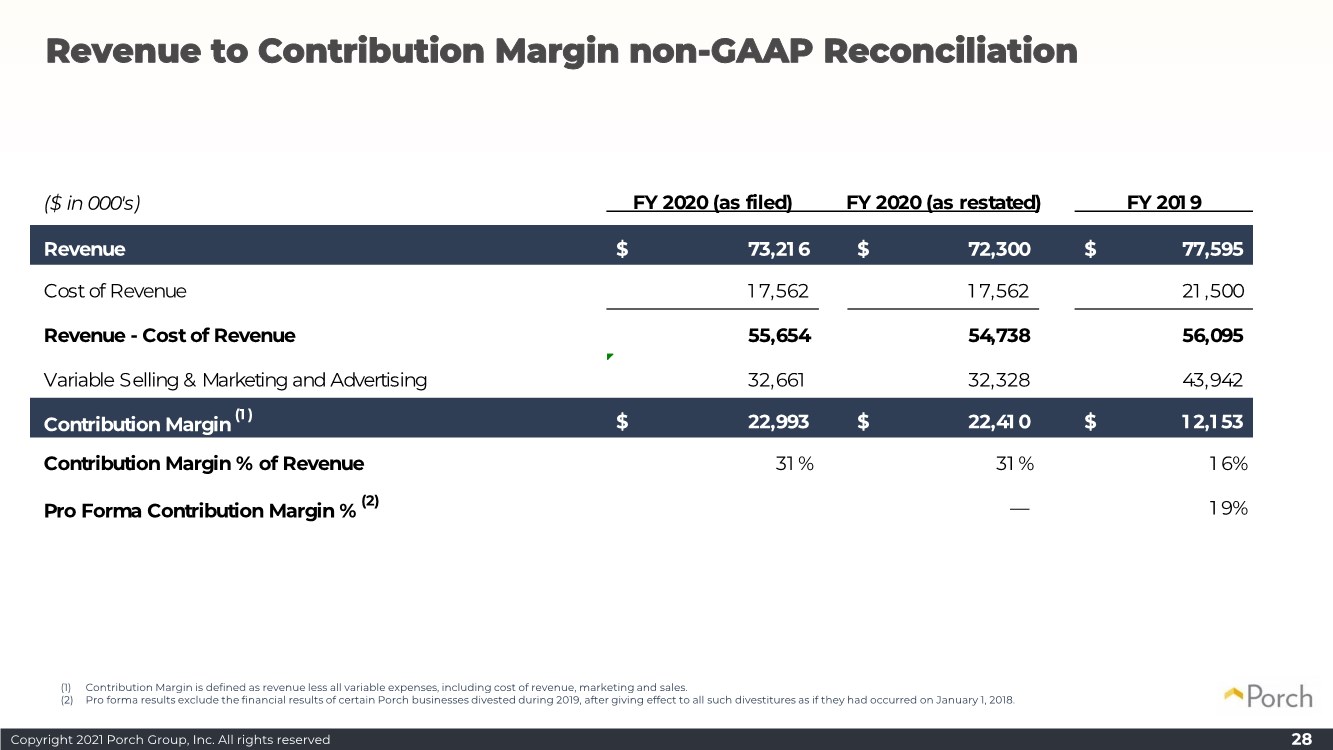
Copyright 2021 Porch Group, Inc. All rights reserved 28 Revenue to Contribution Margin non-GAAP Reconciliation (1) Contribution Margin is defined as revenue less all variable expenses, including cost of revenue, marketing and sales. (2) Pro forma results exclude the financial results of certain Porch businesses divested during 2019, after giving effect to all such divestitures as if they had occurred on January 1, 2018. ($ in 000's) FY 2020 (as filed) FY 2020 (as restated) FY 201 9 Revenue 73,21 6 $ 72,300 $ 77,595 $ Cost of Revenue 1 7,562 1 7,562 21 ,500 Revenue - Cost of Revenue 55,654 54,738 56,095 Variable Selling & Marketing and Advertising 32,661 32,328 43,942 Contribution Margin (1 ) 22,993 $ 22,410 $ 1 2,1 53 $ Contribution Margin % of Revenue 31 % 31 % 1 6% Pro Forma Contribution Margin % (2) — 1 9%

GRAPHIC

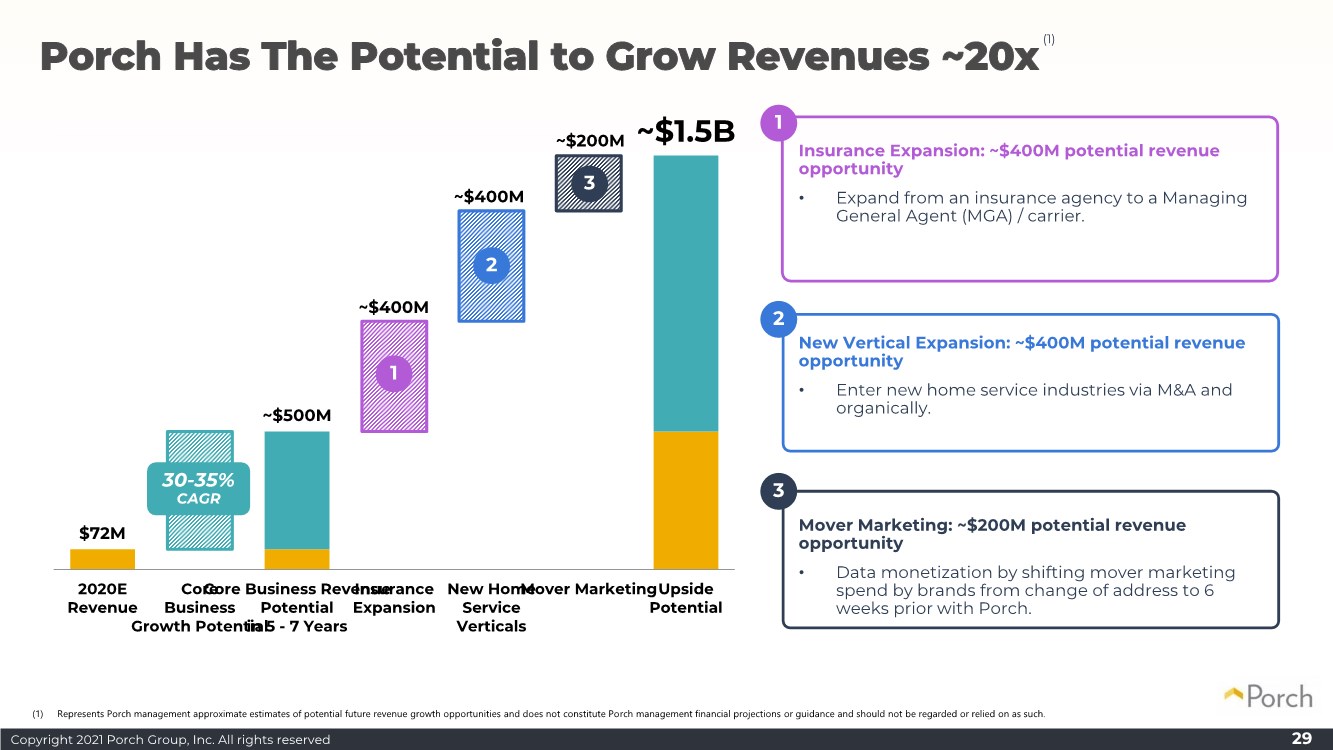
Copyright 2021 Porch Group, Inc. All rights reserved $72M ~$500M ~$1.5B - $200 $400 $600 $800 $1000 $1200 $1400 $1600 2020E Revenue Core Business Growth Potential Core Business Revenue Potential in 5 - 7 Years Insurance Expansion New Home Service Verticals Mover MarketingUpside Potential ~$400M ~$200M ~$400M Porch Has The Potential to Grow Revenues ~20x 29 Mover Marketing: ~$200M potential revenue opportunity • Data monetization by shifting mover marketing spend by brands from change of address to 6 weeks prior with Porch. 30-35% CAGR New Vertical Expansion: ~$400M potential revenue opportunity • Enter new home service industries via M&A and organically. Insurance Expansion: ~$400M potential revenue opportunity • Expand from an insurance agency to a Managing General Agent (MGA) / carrier. 3 2 1 1 2 3 (1) (1) Represents Porch management approximate estimates of potential future revenue growth opportunities and does not constitute Porch management financial projections or guidance and should not be regarded or relied on as such.

GRAPHIC

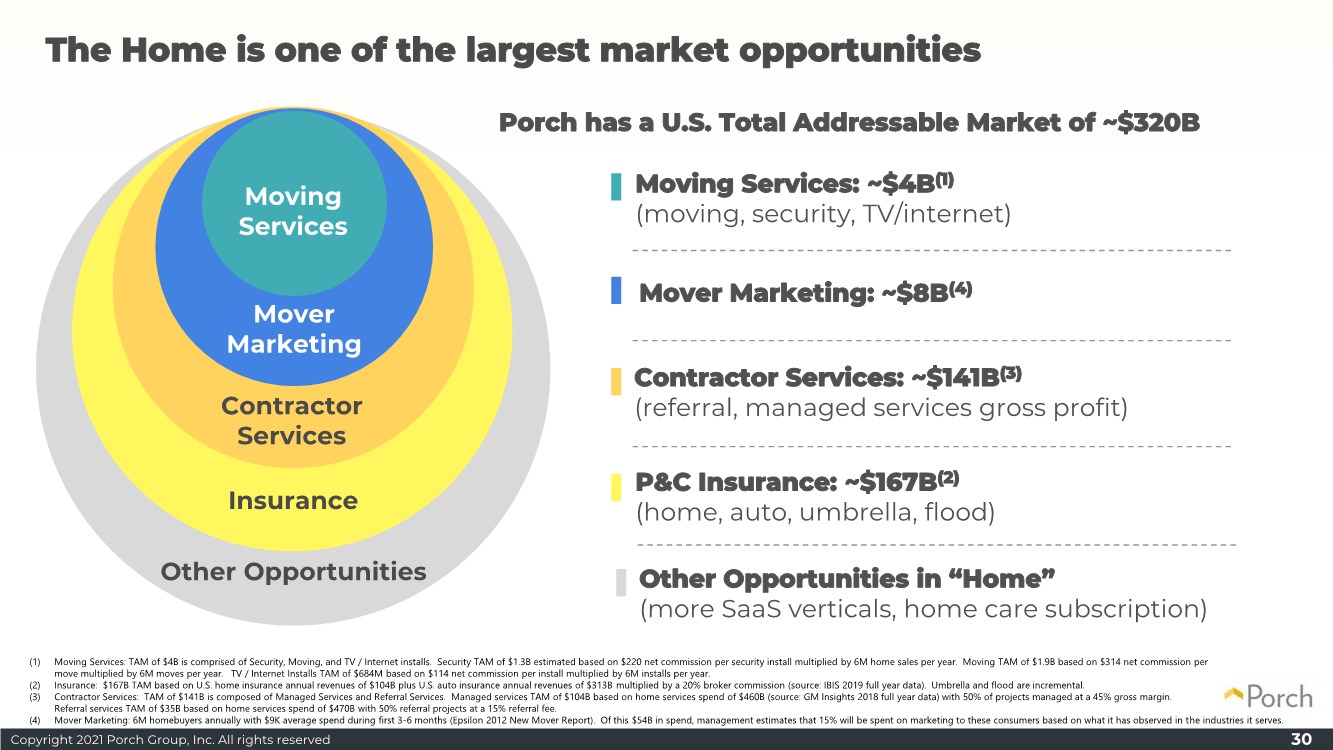
Copyright 2021 Porch Group, Inc. All rights reserved 30 Contractor Services: ~$141B(3) (referral, managed services gross profit) Contractor Services Moving Services Mover Marketing Moving Services: ~$4B(1) (moving, security, TV/internet) Porch has a U.S. Total Addressable Market of ~$320B The Home is one of the largest market opportunities Other Opportunities Mover Marketing: ~$8B(4) (1) Moving Services: TAM of $4B is comprised of Security, Moving, and TV / Internet installs. Security TAM of $1.3B estimated based on $220 net commission per security install multiplied by 6M home sales per year. Moving TAM of $1.9B based on $314 net commission per move multiplied by 6M moves per year. TV / Internet Installs TAM of $684M based on $114 net commission per install multiplied by 6M installs per year. (2) Insurance: $167B TAM based on U.S. home insurance annual revenues of $104B plus U.S. auto insurance annual revenues of $313B multiplied by a 20% broker commission (source: IBIS 2019 full year data). Umbrella and flood are incremental. (3) Contractor Services: TAM of $141B is composed of Managed Services and Referral Services. Managed services TAM of $104B based on home services spend of $460B (source: GM Insights 2018 full year data) with 50% of projects managed at a 45% gross margin. Referral services TAM of $35B based on home services spend of $470B with 50% referral projects at a 15% referral fee. (4) Mover Marketing: 6M homebuyers annually with $9K average spend during first 3-6 months (Epsilon 2012 New Mover Report). Of this $54B in spend, management estimates that 15% will be spent on marketing to these consumers based on what it has observed in the industries it serves. Other Opportunities in “Home” (more SaaS verticals, home care subscription) Insurance P&C Insurance: ~$167B(2) (home, auto, umbrella, flood)