
prg-20250723
false000180883400018088342025-07-232025-07-23

UNITED STATES
SECURITIES AND EXCHANGE COMMISSION

Washington, D.C. 20549
 ________________________________
 FORM 8-K
________________________________
CURRENT REPORT

Pursuant to Section 13 or 15(d) of the
Securities Exchange Act of 1934

Date of Report (Date of Earliest Event Reported): July 23, 2025
PROG HOLDINGS, INC.
(Exact name of Registrant as Specified in Charter)
Georgia
1-39628
85-2484385
(State or other Jurisdiction of Incorporation)
(Commission File
Number)
(IRS Employer
Identification No.)
256 W. Data DriveDraper,Utah84020-2315
(Address of principal executive offices)(Zip Code)
Registrant’s telephone number, including area code: (385) 351-1369
Not Applicable
(Former Name or Former Address, if Changed Since Last Report)
    Check the appropriate box below if the Form 8-K filing is intended to simultaneously satisfy the filing obligation of the registrant under any of the following provisions (see General Instruction A.2. below):
        Written communications pursuant to Rule 425 under the Securities Act (17 CFR 230.425)
        Soliciting material pursuant to Rule 14a-12 under the Exchange Act (17 CFR 240.14a-12)
        Pre-commencement communications pursuant to Rule 14d-2(b) under the Exchange Act (17 CFR 240.14d-2(b))
        Pre-commencement communications pursuant to Rule 13e-4(c) under the Exchange Act (17 CFR 240.13e-4(c))
Securities registered pursuant to Section 12(b) of the Act:
Title of each class Trading SymbolName of each exchange on which registered
Common Stock, $0.50 Par ValuePRGNew York Stock Exchange
    Indicate by check mark whether the registrant is an emerging growth company as defined in Rule 405 of the Securities Act of 1933 (§230.405 of this chapter) or Rule 12b-2 of the Securities Exchange Act of 1934 (§240.12b-2 of this chapter).
    Emerging growth company
If an emerging growth company, indicate by check mark if the registrant has elected not to use the extended transition period for complying with any new or revised financial accounting standards provided pursuant to Section 13(a) of the Exchange Act.


ITEM 2.02.     RESULTS OF OPERATIONS AND FINANCIAL CONDITION
On July 23, 2025, PROG Holdings, Inc. (the "Company") issued a press release (the "Press Release") announcing its financial results for the second quarter ended June 30, 2025. A copy of the Press Release is furnished herewith as Exhibit 99.1 and is incorporated herein by reference. The information contained in this paragraph, as well as Exhibit 99.1 referenced herein, shall not be deemed "filed" for purposes of Section 18 of the Securities Exchange Act of 1934, nor shall it be deemed incorporated by reference in any filing under the Securities Act of 1933.
ITEM 9.01.     FINANCIAL STATEMENTS AND EXHIBITS

(d)    Exhibits:

Exhibit No.
Description
104
The cover page from this Current Report on Form 8-K, formatted in Inline XBRL


SIGNATURES

    Pursuant to the requirements of the Securities Exchange Act of 1934, the registrant has duly caused this report to be signed on its behalf by the undersigned hereunto duly authorized.

PROG Holdings, Inc.
By:
/s/ Brian Garner
Date:
July 23, 2025
Brian Garner
Chief Financial Officer


Exhibit 99.1


PROG Holdings Reports Second Quarter 2025 Results
Consolidated revenues of $604.7 million; Net earnings of $38.5 million
Adjusted EBITDA of $73.5 million
Diluted EPS of $0.95; Non-GAAP Diluted EPS of $1.02
Progressive Leasing GMV of $413.9 million
Four Technologies grows GMV 166.5%; second consecutive quarter of positive pre-tax income

SALT LAKE CITY, July 23, 2025 - PROG Holdings, Inc. (NYSE:PRG), the fintech holding company for Progressive Leasing, Vive Financial, Four Technologies, and Build today announced financial results for the second quarter ended June 30, 2025.
"Our second quarter results once again demonstrate the resiliency of our Leasing business and our ability to manage through a period of high uncertainty and the loss of an important retail partner to liquidation," said Steve Michaels, President and CEO of PROG Holdings. "The revenue and earnings outperformance compared to guidance reflects strong execution in our Progressive Leasing business, where our teams took deliberate actions to preserve portfolio health while expanding balance of share with key retail partners - even as we navigated notable GMV headwinds. At the same time, Four Technologies delivered another outstanding quarter, with over 200% revenue growth and continued profitability. Four is delivering value to our ecosystem – driving cross-sell opportunities and enhancing customer engagement across our platform."
"At Progressive Leasing, we’re advancing our technology initiatives – deploying AI-powered tools, optimizing our digital funnel, and enhancing our mobile and web experiences to create a more seamless, personalized customer journey. These improvements are driving greater efficiency and top-of-funnel engagement, even as we make strategic decisions to moderate GMV growth and maintain portfolio performance within our targeted annual write-off range to fulfill our expectation of sustainable and profitable growth."
"I am extremely proud of our team's execution as we strike the balance of executing on growth objectives in our Progressive Leasing business and further developing our other suite of products which holds significant promise," Michaels concluded.


Consolidated Results
Consolidated revenues for the second quarter of 2025 were $604.7 million, an increase of 2.1% from the same period in 2024.
Consolidated net earnings for the quarter were $38.5 million, compared with $33.8 million in the prior year period. The effective income tax rate was 26.8% in the second quarter. Adjusted EBITDA for the quarter was $73.5 million, or 12.2% of revenues, compared with $72.3 million, or 12.2% of revenues for the same period in 2024.
Diluted earnings per share for the second quarter of 2025 were $0.95, compared with $0.77 in the year ago period. On a non-GAAP basis, diluted earnings per share were up 10.9% at $1.02 in the second quarter of 2025, compared with $0.92 for the same period in 2024. The Company's diluted weighted average shares outstanding in the second quarter were 7.2% lower year-over-year.
Progressive Leasing Results
Progressive Leasing's second quarter GMV of $413.9 million was down 8.9% compared to the same period in 2024. The provision for lease merchandise write-offs for the quarter was 7.5% of leasing revenues, within the Company's 6-8% targeted annual range.
Liquidity and Capital Allocation
PROG Holdings ended the second quarter of 2025 with cash of $222.0 million and gross debt of $600.0 million. The Company repurchased $25.7 million of its stock in the quarter at an average price of $28.51 per share, leaving $309.6 million of repurchase capacity under its $500 million share repurchase program. Additionally, the Company paid a quarterly cash dividend of $0.13 per share.


2025 Outlook
The Company is providing selective third quarter outlook metrics and updating its full year 2025 outlook by increasing the low end of our previous range on revenues and earnings metrics and maintaining the previous high ends of those same metrics. The updated outlook below assumes a difficult operating environment with soft demand for consumer durable goods, no material changes in the Company's current decisioning posture, an effective tax rate for Non-GAAP EPS of approximately 27%, and no impact from additional share repurchases.
Revised 2025 Outlook
Previous 2025 Outlook
(In thousands, except per share amounts)
Low
High
LowHigh
PROG Holdings - Total Revenues$2,450,000 $2,500,000 $2,425,000 $2,500,000 
PROG Holdings - Net Earnings120,000 125,000 109,000 125,000 
PROG Holdings - Adjusted EBITDA255,000 265,000 245,000 265,000 
PROG Holdings - Diluted EPS2.91 3.06 2.62 3.01 
PROG Holdings - Diluted Non-GAAP EPS3.20 3.35 2.90 3.30 
Progressive Leasing - Total Revenues2,325,000 2,360,000 2,300,000 2,360,000 
Progressive Leasing - Earnings Before Taxes179,000 185,000 168,000 185,000 
Progressive Leasing - Adjusted EBITDA255,000 261,000 245,000 261,000 
Vive - Total Revenues60,000 65,000 60,000 65,000 
Vive - Loss Before Taxes
(5,000)(3,500)(5,000)(3,500)
Vive - Adjusted EBITDA(2,500)(1,000)(2,500)(1,000)
Other - Total Revenues65,000 75,000 65,000 75,000 
Other - Loss Before Taxes(9,000)(7,500)(9,000)(7,500)
Other - Adjusted EBITDA2,500 5,000 2,500 5,000 
Three Months Ended
September 30, 2025 Outlook
(In thousands, except per share amounts)LowHigh
PROG Holdings - Total Revenues$580,000$595,000
PROG Holdings - Net Earnings26,00028,000
PROG Holdings - Adjusted EBITDA57,00062,000
PROG Holdings - Diluted EPS0.630.68
PROG Holdings - Diluted Non-GAAP EPS0.700.75


Conference Call and Webcast
The Company has scheduled a live webcast and conference call for Wednesday, July 23, 2025, at 8:30 A.M. ET to discuss its financial results for the second quarter of 2025. To access the live webcast, visit the Events and Presentations page of the Company’s Investor Relations website, https://investor.progholdings.com/.
About PROG Holdings, Inc.
PROG Holdings, Inc. (NYSE:PRG) is a fintech holding company headquartered in Salt Lake City, UT, that provides transparent and competitive payment options to consumers. The Company owns Progressive Leasing, a leading provider of e-commerce, app-based, and in-store point-of-sale lease-to-own solutions, Vive Financial, an omnichannel provider of second-look revolving credit products, Four Technologies, a provider of Buy Now, Pay Later payment options through its platform, Four, and Build, provider of personal credit building products. More information on PROG Holdings and its companies can be found at https://investor.progholdings.com/.
Forward Looking Statements:
Statements, estimates and projections in this press release regarding our business that are not historical facts are "forward-looking statements" that involve risks and uncertainties which could cause actual results to differ materially from those contained in the forward-looking statements. Such forward-looking statements generally can be identified by the use of forward-looking terminology, such as "delivering," "driving," "advancing," "expectation," "estimate," "target," "uncertainty," "outlook," "assumes," "intends" and similar forward-looking terminology. These risks and uncertainties include (i) continued volatility and challenges in the macroeconomic environment and their impact on: (a) consumer confidence and customer demand for the merchandise that our retail partners sell, in particular consumer durables, such as home appliances, electronics and furniture; (b) our customers’ disposable income and their ability to make the lease and loan payments they owe the Company; (c) the availability of consumer credit; and (d) our overall financial performance and outlook; (ii) the impact of the uncertain macroeconomic environment on our proprietary algorithms and decisioning tools that we use to approve customers such that they are no longer indicative of our customers’ ability to perform, which in turn may limit the ability of our businesses to manage risk, avoid lease and loan charge-offs and may result in insufficient reserves to cover actual losses; (iii) a large percentage of Progressive Leasing's revenue being concentrated with several key retail partners, and the loss of any of these retail partner relationships materially and adversely affecting several aspects of our performance; (iv) Progressive Leasing being unable to attract additional retail partners and retain and grow its relationships with its existing retail partners, resulting in several aspects of our performance being materially and adversely affected; (v) Progressive Leasing being unable to attract new consumers and retain and grow its relationships with its existing customers materially and adversely affecting several aspects of our performance; (vi) Vive and Four’s business models differing significantly from Progressive Leasing’s lease-to-own business, which means each of these businesses have different risk profiles; (vii) our efforts to modernize and enhance certain enterprise-wide information management systems


and technologies adversely impacting our businesses and operations; (viii) the inability of our businesses to successfully operate in highly and increasingly competitive industries materially and adversely affecting several aspects of our performance; (ix) our business, results of operations, financial condition, and prospects being materially and adversely affected due to Progressive Leasing failing to maintain a consistently high level of consumer satisfaction and trust in its brand; (x) our businesses being subject to extensive federal, state and local laws and regulations, including certain laws and regulations unique to the industries in which our businesses operate, that may subject them to government investigations and significant monetary penalties, remediation expenses and compliance-related burdens that may result in them changing the manner in which they operate, which may be materially adverse to several aspects of our performance; (xi) our performance being materially and adversely affected due to the transactions offered to consumers by our businesses being negatively characterized by federal, state and local government officials, consumer advocacy groups and the media; (xii) our inability to protect confidential, proprietary, or sensitive information, including the confidential information of our customers, being adversely affected by cyber-attacks or similar disruptions, which may result in significant costs, litigation and reputational damage or otherwise have a material adverse impact on several aspects of our performance; (xiii) any significant disruption in our vendors' information technology systems, or disruptions in the information our businesses rely on in their lease and loan decisioning, materially and adversely affecting several aspects of our performance; (xiv) our capital allocation strategy and financial policies, including our current stock repurchase and dividend programs, as well as any potential debt repurchase program not being effective at enhancing shareholder value, or providing other benefits we expect; and (xv) the other risks and uncertainties discussed under "Risk Factors" in the Company’s Annual Report on Form 10-K for the fiscal year ended December 31, 2024, filed with the SEC on February 19, 2025. Statements, estimates and projections in this press release that are "forward-looking" include without limitation statements, estimates and projections about: (i) growing our balance of share with key retail partners; (ii) the performance of our lease portfolio, including our annual write-offs; (iii) the progress of our Four Technologies business and the benefits we expect from that business; (iv) the advancement of our technology initiatives; (v) our ability to continue achieving sustainable and profitable growth; and (vi) our revised full year 2025 outlook and the guidance we provide for the third quarter. You are cautioned not to place undue reliance on these forward-looking statements, which speak only as of the date of this press release. Except as required by law, the Company undertakes no obligation to update these forward-looking statements to reflect subsequent events or circumstances after the date of this press release.
Investor Contact
John A. Baugh, CFA
Vice President, Investor Relations
[email protected]


PROG Holdings, Inc.
Consolidated Statements of Earnings
(In thousands, except per share data)

(Unaudited) 
 Three Months Ended
(Unaudited) 
 Six Months Ended
June 30,June 30,
2025202420252024
REVENUES:
Lease Revenues and Fees$569,674 $570,516 $1,221,231 $1,191,066 
Interest and Fees on Loans Receivable34,989 21,645 67,520 42,965 
604,663 592,161 1,288,751 1,234,031 
COSTS AND EXPENSES:
Depreciation of Lease Merchandise385,107 384,799 845,550 816,370 
Provision for Lease Merchandise Write-offs42,633 43,783 90,651 86,924 
Operating Expenses116,199 107,901 235,505 235,242 
543,939 536,483 1,171,706 1,138,536 
OPERATING PROFIT60,724 55,678 117,045 95,495 
Interest Expense, Net(8,149)(7,339)(17,239)(15,589)
EARNINGS BEFORE INCOME TAX EXPENSE
52,575 48,339 99,806 79,906 
INCOME TAX EXPENSE
14,092 14,565 26,605 24,166 
NET EARNINGS$38,483 $33,774 $73,201 $55,740 
EARNINGS PER SHARE
Basic$0.96 $0.79 $1.81 $1.29 
Diluted
$0.95 $0.77 $1.78 $1.26 
CASH DIVIDENDS DECLARED PER SHARE:
Common Stock$0.13 $0.12 $0.26 $0.24 
WEIGHTED AVERAGE SHARES OUTSTANDING:
Basic40,130 42,955 40,484 43,325 
Diluted
40,559 43,721 41,203 44,124 


PROG Holdings, Inc.
Consolidated Balance Sheets
(In thousands, except share data)

(Unaudited)
June 30,
2025
December 31,
2024
ASSETS:
Cash and Cash Equivalents$222,027 $95,655 
Accounts Receivable (net of allowances of $68,788 in 2025 and $71,607 in 2024)
60,531 80,225 
Lease Merchandise (net of accumulated depreciation and allowances of $440,339 in 2025 and $440,831 in 2024)
526,303 680,242 
Loans Receivable (net of allowances and unamortized fees of $58,930 in 2025 and $57,342 in 2024)
148,320 146,985 
Property and Equipment, Net21,179 21,443 
Operating Lease Right-of-Use Assets3,352 4,035 
Goodwill296,061 296,061 
Other Intangibles, Net65,774 73,775 
Income Tax Receivable8,817 10,644 
Deferred Income Tax Assets26,472 26,472 
Prepaid Expenses and Other Assets75,760 78,230 
Total Assets$1,454,596 $1,513,767 
LIABILITIES & SHAREHOLDERS’ EQUITY:
Accounts Payable and Accrued Expenses$92,765 $93,190 
Deferred Income Tax Liabilities54,271 74,320 
Customer Deposits and Advance Payments35,504 40,917 
Operating Lease Liabilities9,171 11,496 
Debt, Net
594,212 643,563 
Total Liabilities785,923 863,486 
SHAREHOLDERS' EQUITY:
Common Stock, Par Value $0.50 Per Share: Authorized: 225,000,000 Shares at June 30, 2025 and December 31, 2024; Shares Issued: 82,078,654 at June 30, 2025 and December 31, 2024
41,039 41,039 
Additional Paid-in Capital349,707 358,538 
Retained Earnings1,531,768 1,469,450 
1,922,514 1,869,027 
Less: Treasury Shares at Cost
Common Stock: 42,535,192 Shares at June 30, 2025 and 41,262,901 at December 31, 2024
(1,253,841)(1,218,746)
Total Shareholders’ Equity668,673 650,281 
Total Liabilities & Shareholders’ Equity$1,454,596 $1,513,767 


PROG Holdings, Inc.
Consolidated Statements of Cash Flows
(In thousands)
(Unaudited)
Six Months Ended June 30,
20252024
OPERATING ACTIVITIES:
Net Earnings$73,201 $55,740 
Adjustments to Reconcile Net Earnings to Cash Provided by Operating Activities:
Depreciation of Lease Merchandise845,550 816,370 
Other Depreciation and Amortization12,111 14,515 
Provisions for Accounts Receivable and Loan Losses198,650 174,822 
Stock-Based Compensation14,536 13,737 
Deferred Income Taxes(20,049)(16,973)
Impairment of Assets
— 6,018 
Non-Cash Lease Expense(1,642)(1,603)
Other Changes, Net(943)(155)
Changes in Operating Assets and Liabilities:
Additions to Lease Merchandise(784,951)(836,084)
Book Value of Lease Merchandise Sold or Disposed93,340 89,549 
Accounts Receivable(147,179)(145,312)
Prepaid Expenses and Other Assets5,480 377 
Income Tax Receivable and Payable1,749 26,206 
Accounts Payable and Accrued Expenses(4,620)(5,113)
Customer Deposits and Advance Payments(5,413)(967)
Cash Provided by Operating Activities279,820 191,127 
INVESTING ACTIVITIES:
Investments in Loans Receivable(370,099)(172,513)
Proceeds from Loans Receivable339,206 158,644 
Purchases of Property and Equipment
(3,896)(3,999)
Other Proceeds
— 46 
Cash Used in Investing Activities(34,789)(17,822)
FINANCING ACTIVITIES:
Repayments on Revolving Facility
(50,000)— 
Dividends Paid
(10,443)(10,346)
Acquisition of Treasury Stock
(51,775)(61,177)
Issuance of Stock Under Stock Option and Employee Purchase Plans1,028 799 
Cash Paid for Shares Withheld for Employee Taxes(7,385)(7,863)
Debt Issuance Costs(84)— 
Cash Used in Financing Activities(118,659)(78,587)
Increase in Cash and Cash Equivalents
126,372 94,718 
Cash and Cash Equivalents at Beginning of Period95,655 155,416 
Cash and Cash Equivalents at End of Period$222,027 $250,134 
Net Cash Paid During the Period:
Interest$18,795 $18,461 
Income Taxes$45,044 $12,728 


PROG Holdings, Inc.
Quarterly Revenues by Segment
(In thousands)

(Unaudited)
Three Months Ended
June 30, 2025
Progressive LeasingViveOtherConsolidated Total
Lease Revenues and Fees$569,674 $— $— $569,674 
Interest and Fees on Loans Receivable— 16,160 18,829 34,989 
Total Revenues$569,674 $16,160 $18,829 $604,663 

(Unaudited)
Three Months Ended
June 30, 2024
Progressive LeasingViveOtherConsolidated Total
Lease Revenues and Fees$570,516 $— $— $570,516 
Interest and Fees on Loans Receivable— 15,421 6,224 21,645 
Total Revenues$570,516 $15,421 $6,224 $592,161 


PROG Holdings, Inc.
Six Month Revenues by Segment
(In thousands)

(Unaudited)
Six Months Ended
June 30, 2025
Progressive LeasingViveOtherConsolidated Total
Lease Revenues and Fees$1,221,231 $— $— $1,221,231 
Interest and Fees on Loans Receivable— 31,820 35,700 67,520 
Total Revenues$1,221,231 $31,820 $35,700 $1,288,751 

(Unaudited)
Six Months Ended
June 30, 2024
Progressive LeasingViveOtherConsolidated Total
Lease Revenues and Fees$1,191,066 $— $— $1,191,066 
Interest and Fees on Loans Receivable— 31,471 11,494 42,965 
Total Revenues$1,191,066 $31,471 $11,494 $1,234,031 


PROG Holdings, Inc.
Quarterly Gross Merchandise Volume by Segment
(In thousands)

(Unaudited)
Three Months Ended June 30,
20252024
Progressive Leasing$413,872 $454,508 
Vive43,990 35,757 
Other149,632 56,139 
Total GMV$607,494 $546,404 


Use of Non-GAAP Financial Information:
Non-GAAP net earnings, non-GAAP diluted earnings per share, and adjusted EBITDA are supplemental measures of our performance that are not calculated in accordance with generally accepted accounting principles in the United States ("GAAP"). Non-GAAP diluted earnings per share for the full year 2025 and third quarter 2025 outlook excludes intangible amortization expense. Non-GAAP net earnings and non-GAAP diluted earnings per share for the three and six months ended June 30, 2025 exclude intangible amortization expense and costs related to the cybersecurity incident, net of insurance recoveries. Non-GAAP net earnings and non-GAAP diluted earnings per share for the three and six months ended June 30, 2024 exclude intangible amortization expense, restructuring expenses, costs related to the cybersecurity incident, and accrued interest on an uncertain tax position related to Progressive Leasing's $175 million settlement with the FTC in 2020. The amount for the after-tax non-GAAP adjustment, which is tax effected using our statutory tax rate, can be found in the reconciliation of net earnings and diluted earnings per share to non-GAAP net earnings and diluted earnings per share table in this press release.
The Adjusted EBITDA figures presented in this press release are calculated as the Company’s earnings before interest expense, net, depreciation on property and equipment, amortization of intangible assets and income taxes. Adjusted EBITDA for the full year 2025 and third quarter 2025 outlook excludes stock-based compensation expense. Adjusted EBITDA for the three and six months ended June 30, 2025 excludes stock-based compensation expense and costs related to the cybersecurity incident, net of insurance recoveries. Adjusted EBITDA for the three and six months ended June 30, 2024 excludes stock-based compensation expense, restructuring expenses, and costs related to the cybersecurity incident. The amounts for these pre-tax non-GAAP adjustments can be found in the segment EBITDA tables in this press release.
Management believes that non-GAAP net earnings, non-GAAP diluted earnings per share, and adjusted EBITDA provide relevant and useful information, and are widely used by analysts, investors and competitors in our industry as well as by our management in assessing both consolidated and business unit performance.
Non-GAAP net earnings, non-GAAP diluted earnings, and adjusted EBITDA provide management and investors with an understanding of the results from the primary operations of our business by excluding the effects of certain items that generally arose from larger, one-time transactions that are not reflective of the ordinary earnings activity of our operations or transactions that have variability and volatility of the amount. We believe the exclusion of stock-based compensation expense provides for a better comparison of our operating results with our peer companies as the calculations of stock-based compensation vary from period to period and company to company due to different valuation methodologies, subjective assumptions and the variety of award types. This measure may be useful to an investor in evaluating the underlying operating performance of our business.


Adjusted EBITDA also provides management and investors with an understanding of one aspect of earnings before the impact of investing and financing charges and income taxes. These measures may be useful to an investor in evaluating our operating performance because the measures:
Are widely used by investors to measure a company’s operating performance without regard to items excluded from the calculation of such measure, which can vary substantially from company to company depending upon accounting methods, book value of assets, capital structure and the method by which assets were acquired, among other factors.
Are used by rating agencies, lenders and other parties to evaluate our creditworthiness.
Are used by our management for various purposes, including as a measure of performance of our operating entities and as a basis for strategic planning and forecasting.
Non-GAAP financial measures, however, should not be used as a substitute for, or considered superior to, measures of financial performance prepared in accordance with GAAP, such as the Company’s GAAP basis net earnings and diluted earnings per share and the GAAP revenues and earnings before income taxes of the Company’s segments, which are also presented in the press release. Further, we caution investors that amounts presented in accordance with our definitions of non-GAAP net earnings, non-GAAP diluted earnings per share, and adjusted EBITDA may not be comparable to similar measures disclosed by other companies, because not all companies and analysts calculate these measures in the same manner.


PROG Holdings, Inc.
Reconciliation of Net Earnings and Diluted Earnings Per Share to
Non-GAAP Net Earnings and Diluted Earnings Per Share
(In thousands, except per share amounts)


(Unaudited)(Unaudited)
Three Months EndedSix Months Ended
June 30,June 30,
2025202420252024
Net Earnings$38,483 $33,774 $73,201 $55,740 
Add: Intangible Amortization Expense 4,000 4,239 8,001 9,889 
Add: Restructuring Expense— 2,886 — 20,900 
Add: Costs Related to the Cybersecurity Incident, Net of Insurance Recoveries
127 116 109 232 
Less: Tax Impact of Adjustments(1)
(1,073)(1,883)(2,109)(8,066)
Add: Accrued Interest on Uncertain Tax Position
— 1,078 — 2,156 
Non-GAAP Net Earnings$41,537 $40,210 $79,202 $80,851 
Diluted Earnings Per Share
$0.95 $0.77 $1.78 $1.26 
Add: Intangible Amortization Expense
0.10 0.10 0.19 0.23 
Add: Restructuring Expense— 0.07 — 0.47 
Add: Costs Related to the Cybersecurity Incident, Net of Insurance Recoveries
— — — 0.01 
Less: Tax Impact of Adjustments(1)
(0.03)(0.04)(0.05)(0.18)
Add: Accrued Interest on Uncertain Tax Position
— 0.02 — 0.05 
Non-GAAP Diluted Earnings Per Share(2)
$1.02 $0.92 $1.92 $1.83 
Diluted Weighted Average Shares Outstanding
40,559 43,721 41,203 44,124 
(1)Adjustments are tax-effected using an assumed statutory tax rate of 26%.
(2)In some cases, the sum of individual EPS amounts may not equal total non-GAAP EPS calculations due to rounding.


PROG Holdings, Inc.
Non-GAAP Financial Information
Quarterly Segment Adjusted EBITDA
(In thousands)

(Unaudited)
Three Months Ended
June 30, 2025
Progressive LeasingViveOtherConsolidated Total
Net Earnings$38,483 
Income Tax Expense(1)
14,092 
Earnings Before Income Tax Expense
$51,546 $509 $520 52,575 
Interest Expense, Net6,424 179 1,546 8,149 
Depreciation1,301 139 549 1,989 
Amortization3,771 — 229 4,000 
EBITDA63,042 827 2,844 66,713 
Stock-Based Compensation6,565 (106)175 6,634 
Costs Related to the Cybersecurity Incident, Net of Insurance Recoveries
127 — — 127 
Adjusted EBITDA$69,734 $721 $3,019 $73,474 
(1) Taxes are calculated on a consolidated basis and are not identifiable by Company segment.

(Unaudited)
Three Months Ended
June 30, 2024
Progressive LeasingViveOtherConsolidated Total
Net Earnings$33,774 
Income Tax Expense(1)
14,565 
Earnings (Loss) Before Income Tax Expense$53,966 $631 $(6,258)48,339 
Interest Expense, Net7,655 — (316)7,339 
Depreciation1,651 166 441 2,258 
Amortization4,009 — 230 4,239 
EBITDA67,281 797 (5,903)62,175 
Stock-Based Compensation6,135 360 600 7,095 
Restructuring Expense258 — 2,628 2,886 
Costs Related to the Cybersecurity Incident
116 — — 116 
Adjusted EBITDA$73,790 $1,157 $(2,675)$72,272 
(1) Taxes are calculated on a consolidated basis and are not identifiable by Company segment.


PROG Holdings, Inc.
Non-GAAP Financial Information
Six Month Segment Adjusted EBITDA
(In thousands)

(Unaudited)
Six Months Ended
June 30, 2025
Progressive LeasingViveOtherConsolidated Total
Net Earnings$73,201 
Income Tax Benefit(1)
26,605 
Earnings (Loss) Before Income Tax Benefit
$100,171 $(324)$(41)99,806 
Interest Expense, Net13,587 365 3,287 17,239 
Depreciation2,658 286 1,166 4,110 
Amortization7,542 — 459 8,001 
EBITDA123,958 327 4,871 129,156 
Stock-Based Compensation12,872 206 1,458 14,536 
Costs Related to the Cybersecurity Incident, Net of Insurance Recoveries
109 — — 109 
Adjusted EBITDA$136,939 $533 $6,329 $143,801 
(1) Taxes are calculated on a consolidated basis and are not identifiable by Company segment.

(Unaudited)
Six Months Ended
June 30, 2024
Progressive LeasingViveOtherConsolidated Total
Net Earnings$55,740 
Income Tax Expense(1)
24,166 
Earnings (Loss) Before Income Tax Expense$89,419 $1,549 $(11,062)79,906 
Interest Expense, Net16,222 — (633)15,589 
Depreciation3,461 332 833 4,626 
Amortization9,430 — 459 9,889 
EBITDA118,532 1,881 (10,403)110,010 
Stock-Based Compensation10,846 698 2,193 13,737 
Restructuring Expense18,272 — 2,628 20,900 
Costs Related to the Cybersecurity Incident
232 — — 232 
Adjusted EBITDA$147,882 $2,579 $(5,582)$144,879 
(1) Taxes are calculated on a consolidated basis and are not identifiable by Company segment.


PROG Holdings, Inc.
Non-GAAP Financial Information
Reconciliation of Full Year 2025 Outlook for Adjusted EBITDA
(In thousands)

Revised Fiscal Year 2025 Ranges
Progressive LeasingViveOtherConsolidated Total
Estimated Net Earnings$120,000 - $125,000
Income Tax Expense(1)
45,000 - 49,000
Projected Earnings (Loss) Before Income Tax Expense$179,000 - 185,000$(5,000) - $(3,500)$(9,000) - $(7,500)165,000 - 174,000
Interest Expense, Net30,000 - 28,0001,0006,00037,000 - 35,000
Depreciation5,000 - 6,0005002,5008,000 - 9,000
Amortization15,0001,00016,000
Projected EBITDA229,000 - 234,000(3,500) - (2,000)500 - 2,000226,000 - 234,000
Stock-Based Compensation26,000 - 27,0001,0002,000 - 3,00029,000 - 31,000
Projected Adjusted EBITDA$255,000 - $261,000$(2,500) - $(1,000)$2,500 - $5,000$255,000 - $265,000
(1) Taxes are calculated on a consolidated basis and are not identifiable by Company segment.


Previous Fiscal Year 2025 Ranges
Progressive LeasingViveOtherConsolidated Total
Estimated Net Earnings$109,000 - $125,000
Income Tax Expense(1)
45,000 - 49,000
Projected Earnings (Loss) Before Income Tax Expense$168,000 - $185,000$(5,000) - $(3,500)$(9,000) - $(7,500)154,000 - 174,000
Interest Expense, Net30,000 - 28,0001,0006,00037,000 - 35,000
Depreciation6,0005002,5009,000
Amortization15,0001,00016,000
Projected EBITDA219,000 - 234,000(3,500) - (2,000)500 - 2,000216,000 - 234,000
Stock-Based Compensation26,000 - 27,0001,0002,000 - 3,00029,000 - 31,000
Projected Adjusted EBITDA$245,000 - $261,000$(2,500) - $(1,000)$2,500 - $5,000$245,000 - $265,000
(1) Taxes are calculated on a consolidated basis and are not identifiable by Company segment.


PROG Holdings, Inc.
Non-GAAP Financial Information
Reconciliation of the Three Months Ended September 30, 2025 Outlook for Adjusted EBITDA
(In thousands)

Three Months Ended
September 30, 2025
Consolidated Total
Estimated Net Earnings
$26,000 - $28,000
Income Tax Expense(1)
11,000 - 12,000
Projected Earnings Before Income Tax Expense
37,000 - 40,000
Interest Expense, Net8,000
Depreciation2,000
Amortization4,000
Projected EBITDA
51,000 - 54,000
Stock-Based Compensation
6,000 - 8,000
Projected Adjusted EBITDA
$57,000 - $62,000
(1) Taxes are calculated on a consolidated basis and are not identifiable by Company segment.


PROG Holdings, Inc.
Reconciliation of Full Year 2025 Outlook for Diluted Earnings Per Share
to Non-GAAP Diluted Earnings Per Share

Revised
Full Year 2025 Ranges
LowHigh
Projected Diluted Earnings Per Share
$2.91 $3.06 
Add: Projected Intangible Amortization Expense0.39 0.39 
Subtract: Tax Effect on Non-GAAP Adjustments(1)
(0.10)(0.10)
Projected Non-GAAP Diluted Earnings Per Share(2)
$3.20 $3.35 
(1)Adjustments are tax-effected using an assumed statutory tax rate of 26%.
(2)In some cases, the sum of individual EPS amounts may not equal total non-GAAP EPS calculations due to rounding.


Previous
Full Year 2025 Ranges
LowHigh
Projected Diluted Earnings Per Share
$2.62 $3.01 
Add: Projected Intangible Amortization Expense0.39 0.39 
Subtract: Tax Effect on Non-GAAP Adjustments(1)
(0.10)(0.10)
Projected Non-GAAP Diluted Earnings Per Share(2)
$2.90 $3.30 
(1)Adjustments are tax-effected using an assumed statutory tax rate of 26%.
(2)In some cases, the sum of individual EPS amounts may not equal total non-GAAP EPS calculations due to rounding.


PROG Holdings, Inc.
Reconciliation of the Three Months Ended September 30, 2025 Outlook for Diluted
Earnings Per Share to Non-GAAP Diluted Earnings Per Share

Three Months Ended
September 30, 2025
LowHigh
Projected Diluted Earnings Per Share
$0.63 $0.68 
Add: Projected Intangible Amortization Expense0.10 0.10 
Subtract: Tax Effect on Non-GAAP Adjustments(1)
(0.03)(0.03)
Projected Non-GAAP Diluted Earnings Per Share(2)
$0.70 $0.75 
(1)Adjustments are tax-effected using an assumed statutory tax rate of 26%.
(2)In some cases, the sum of individual EPS amounts may not equal total non-GAAP EPS calculations due to rounding.

PROG Internal PROG Holdings, Inc. Q2 2025 Earnings Supplement July 23, 2025 Exhibit 99.2

 
2 Statements, estimates and projections in this earnings supplement regarding our business that are not historical facts are "forward-looking statements" that involve risks and uncertainties which could cause actual results to differ materially from those contained in the forward-looking statements. Such forward-looking statements generally can be identified by the use of forward-looking terminology, such as “delivering", “driving”, “advancing”, “expectations”, “estimate”, “target”, “uncertainty”, "outlook", “assumes”, “intends” and similar forward-looking terminology. These risks and uncertainties include (i) continued volatility and challenges in the macro-economic environment and their impact on: (a) consumer confidence and customer demand for the merchandise that our retail partners sell, in particular consumer durables, such as home appliances, electronics and furniture; (b) our customers’ disposable income and their ability to make the lease and loan payments they owe the Company; (c) the availability of consumer credit; and (d) our overall financial performance and outlook; (ii) the impact of the uncertain macro-economic environment on our proprietary algorithms and decisioning tools that we use to approve customers such that they are no longer indicative of our customers’ ability to perform, which in turn may limit the ability of our businesses to manage risk, avoid lease and loan charge-offs and may result in insufficient reserves to cover actual losses; (iii) a large percentage of Progressive Leasing's revenue being concentrated with several key retail partners, and the loss of any of these retail partner relationships materially and adversely affecting several aspects of our performance; (iv) Progressive Leasing being unable to attract additional retail partners and retain and grow its relationships with its existing retail partners, resulting in several aspects of our performance being materially and adversely affected; (v) Progressive Leasing being unable to attract new consumers and retain and grow its relationships with its existing customers materially and adversely affecting several aspects of our performance; (vi) Vive and Four’s business models differing significantly from Progressive Leasing’s lease-to-own business, which means each of these businesses have different risk profiles; (vii) our efforts to modernize and enhance certain enterprise-wide information management systems and technologies adversely impacting our businesses and operations; (viii) the inability of our businesses to successfully operate in highly and increasingly competitive industries materially and adversely affecting several aspects of our performance; (ix) our business, results of operations, financial condition, and prospects being materially and adversely affected due to Progressive Leasing failing to maintain a consistently high level of consumer satisfaction and trust in its brand; (x) our businesses being subject to extensive federal, state and local laws and regulations, including certain laws and regulations unique to the industries in which our businesses operate, that may subject them to government investigations and significant monetary penalties, remediation expenses and compliance-related burdens that may result in them changing the manner in which they operate, which may be materially adverse to several aspects of our performance; (xi) our performance being materially and adversely affected due to the transactions offered to consumers by our businesses being negatively characterized by federal, state and local government officials, consumer advocacy groups and the media; (xii) our inability to protect confidential, proprietary, or sensitive information, including the confidential information of our customers, being adversely affected by cyber-attacks or similar disruptions, which may result in significant costs, litigation and reputational damage or otherwise have a material adverse impact on several aspects of our performance; (xiii) any significant disruption in our vendors' information technology systems, or disruptions in the information our businesses rely on in their lease and loan decisioning, materially and adversely affecting several aspects of our performance; (xiv) our capital allocation strategy and financial policies, including our current stock repurchase and dividend programs, as well as any potential debt repurchase program not being effective at enhancing shareholder value, or providing other benefits we expect; and (xv) the other risks and uncertainties discussed under "Risk Factors" in the Company’s Annual Report on Form 10-K for the fiscal year ended December 31, 2024, filed with the SEC on February 19, 2025. Statements, estimates and projections in this earnings supplement that are "forward-looking" include without limitation statements, estimates and projections about: (i) growing our balance of share with key retail partners; (ii) the performance of our lease portfolio, including our annual write-offs; (iii) the progress of our Four Technologies business and the benefits we expect from that business; (iv) the advancement of our technology initiatives; (v) our ability to continue achieving sustainable and profitable growth; (vi) our revised full year 2025 outlook and the guidance we provide for the third quarter; and (vii) the impact of the Big Lots, Inc. bankruptcy with respect to Progressive Leasing’s 2025 financial performance. You are cautioned not to place undue reliance on these forward-looking statements, which speak only as of the date of this earnings supplement. Except as required by law, the Company undertakes no obligation to update these forward-looking statements to reflect subsequent events or circumstances after the date of this earnings supplement. Use of Forward-Looking Statements
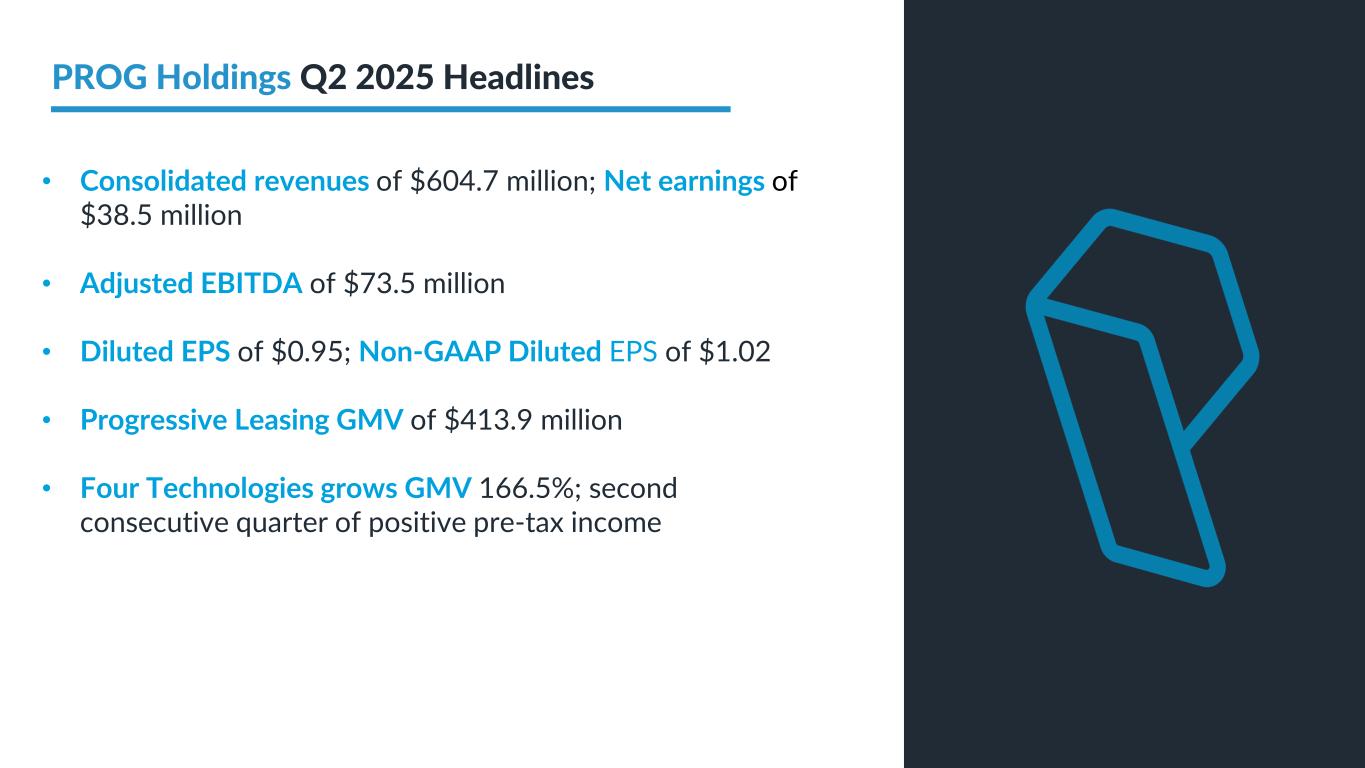

 
3 PROG Holdings Q2 2025 Headlines • Consolidated revenues of $604.7 million; Net earnings of $38.5 million • Adjusted EBITDA of $73.5 million • Diluted EPS of $0.95; Non-GAAP Diluted EPS of $1.02 • Progressive Leasing GMV of $413.9 million • Four Technologies grows GMV 166.5%; second consecutive quarter of positive pre-tax income
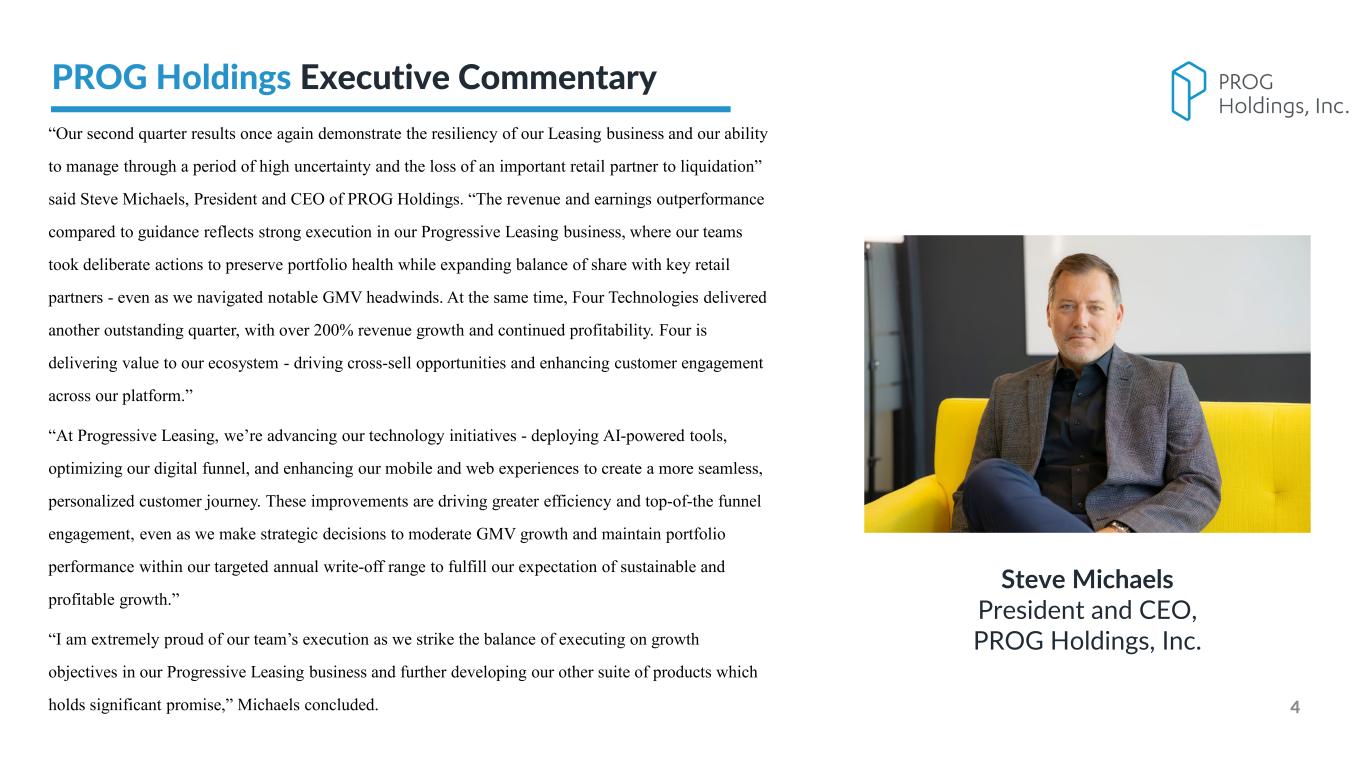

 
PROG Internal 4 “Our second quarter results once again demonstrate the resiliency of our Leasing business and our ability to manage through a period of high uncertainty and the loss of an important retail partner to liquidation” said Steve Michaels, President and CEO of PROG Holdings. “The revenue and earnings outperformance compared to guidance reflects strong execution in our Progressive Leasing business, where our teams took deliberate actions to preserve portfolio health while expanding balance of share with key retail partners - even as we navigated notable GMV headwinds. At the same time, Four Technologies delivered another outstanding quarter, with over 200% revenue growth and continued profitability. Four is delivering value to our ecosystem - driving cross-sell opportunities and enhancing customer engagement across our platform.” “At Progressive Leasing, we’re advancing our technology initiatives - deploying AI-powered tools, optimizing our digital funnel, and enhancing our mobile and web experiences to create a more seamless, personalized customer journey. These improvements are driving greater efficiency and top-of-the funnel engagement, even as we make strategic decisions to moderate GMV growth and maintain portfolio performance within our targeted annual write-off range to fulfill our expectation of sustainable and profitable growth.” “I am extremely proud of our team’s execution as we strike the balance of executing on growth objectives in our Progressive Leasing business and further developing our other suite of products which holds significant promise,” Michaels concluded. Steve Michaels President and CEO, PROG Holdings, Inc. PROG Holdings Executive Commentary
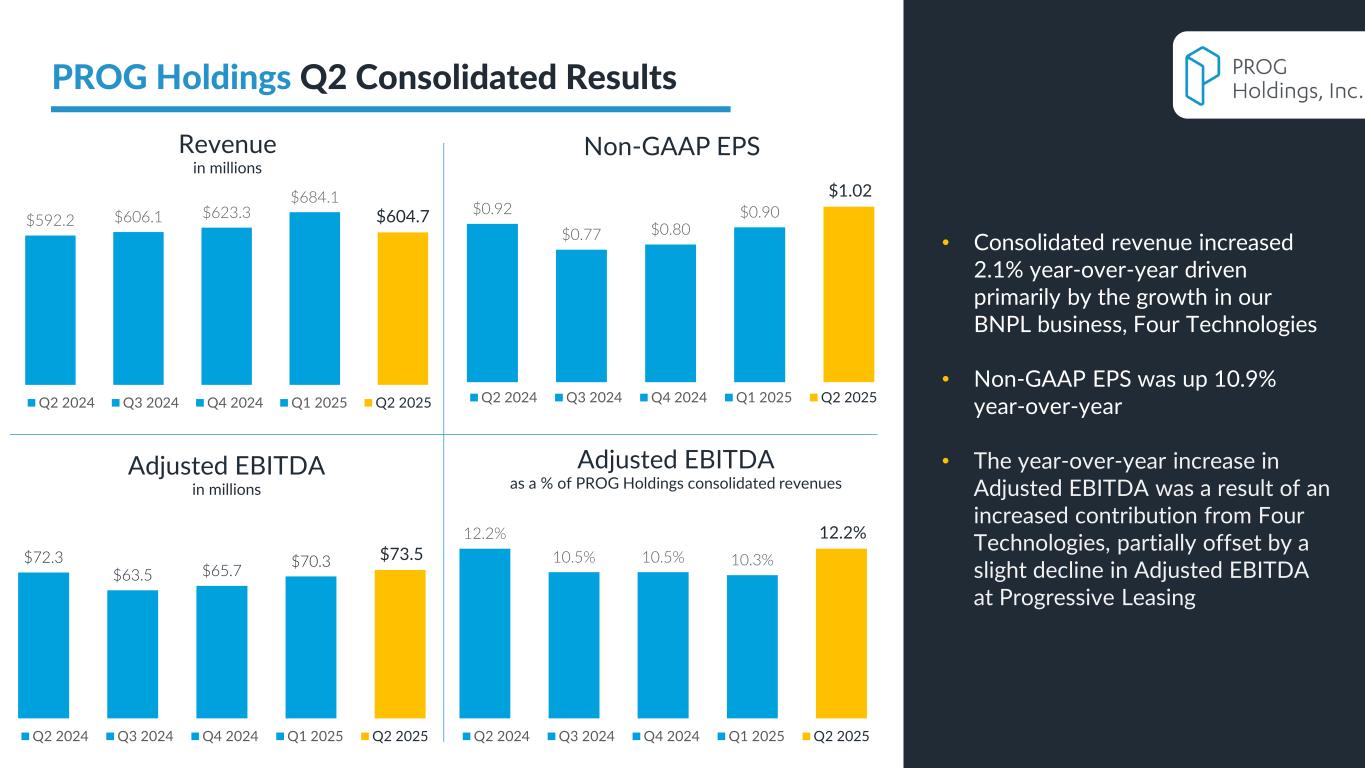

 
PROG Internal Adjusted EBITDA in millions 5 $592.2 $606.1 $623.3 $684.1 $604.7 Q2 2024 Q3 2024 Q4 2024 Q1 2025 Q2 2025 Non-GAAP EPSRevenue in millions 12.2% 10.5% 10.5% 10.3% 12.2% Q2 2024 Q3 2024 Q4 2024 Q1 2025 Q2 2025 Adjusted EBITDA as a % of PROG Holdings consolidated revenues PROG Holdings Q2 Consolidated Results $72.3 $63.5 $65.7 $70.3 $73.5 Q2 2024 Q3 2024 Q4 2024 Q1 2025 Q2 2025 $0.92 $0.77 $0.80 $0.90 $1.02 Q2 2024 Q3 2024 Q4 2024 Q1 2025 Q2 2025 • Consolidated revenue increased 2.1% year-over-year driven primarily by the growth in our BNPL business, Four Technologies • Non-GAAP EPS was up 10.9% year-over-year • The year-over-year increase in Adjusted EBITDA was a result of an increased contribution from Four Technologies, partially offset by a slight decline in Adjusted EBITDA at Progressive Leasing
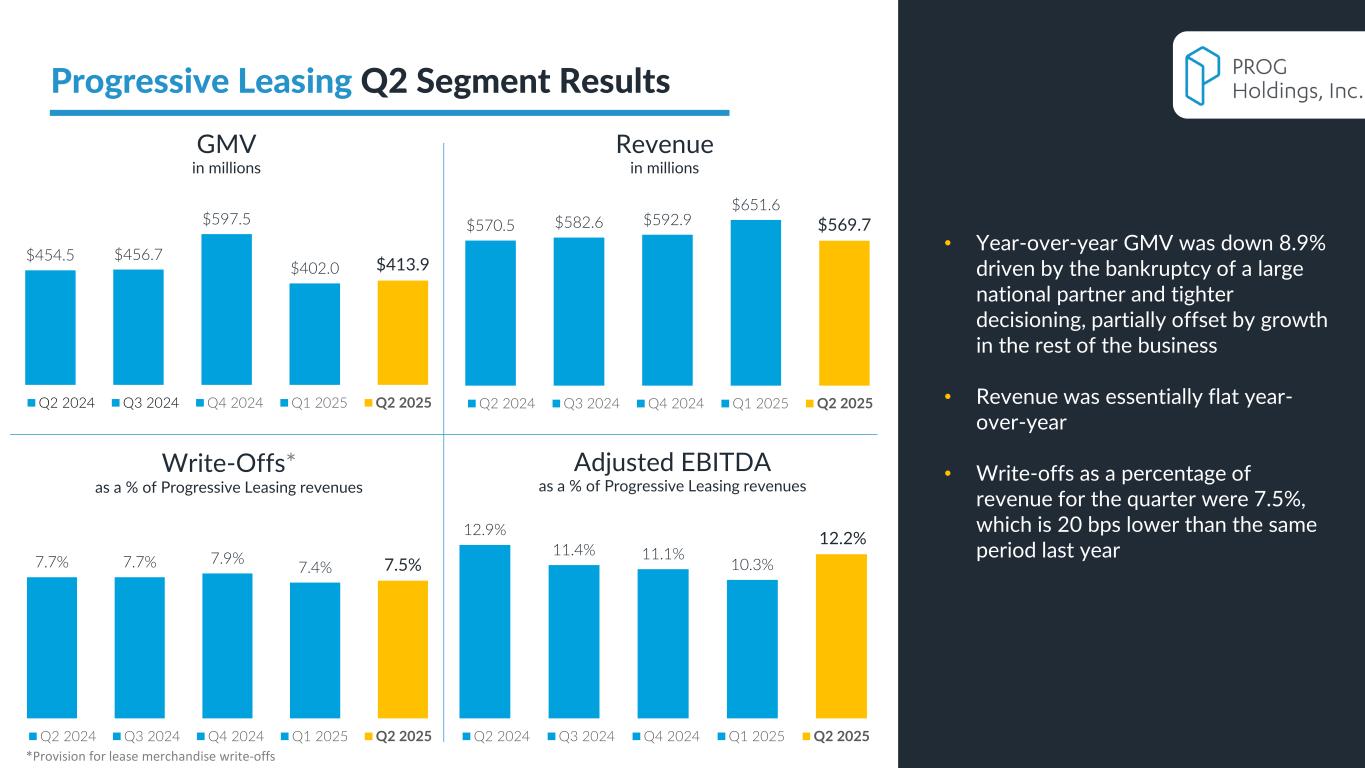

 
PROG Internal $570.5 $582.6 $592.9 $651.6 $569.7 Q2 2024 Q3 2024 Q4 2024 Q1 2025 Q2 2025 Write-Offs* as a % of Progressive Leasing revenues 6 $454.5 $456.7 $597.5 $402.0 $413.9 Q2 2024 Q3 2024 Q4 2024 Q1 2025 Q2 2025 GMV in millions 7.7% 7.7% 7.9% 7.4% 7.5% Q2 2024 Q3 2024 Q4 2024 Q1 2025 Q2 2025 Adjusted EBITDA as a % of Progressive Leasing revenues Progressive Leasing Q2 Segment Results Revenue in millions *Provision for lease merchandise write-offs 12.9% 11.4% 11.1% 10.3% 12.2% Q2 2024 Q3 2024 Q4 2024 Q1 2025 Q2 2025 • Year-over-year GMV was down 8.9% driven by the bankruptcy of a large national partner and tighter decisioning, partially offset by growth in the rest of the business • Revenue was essentially flat year- over-year • Write-offs as a percentage of revenue for the quarter were 7.5%, which is 20 bps lower than the same period last year


 
PROG Internal Results
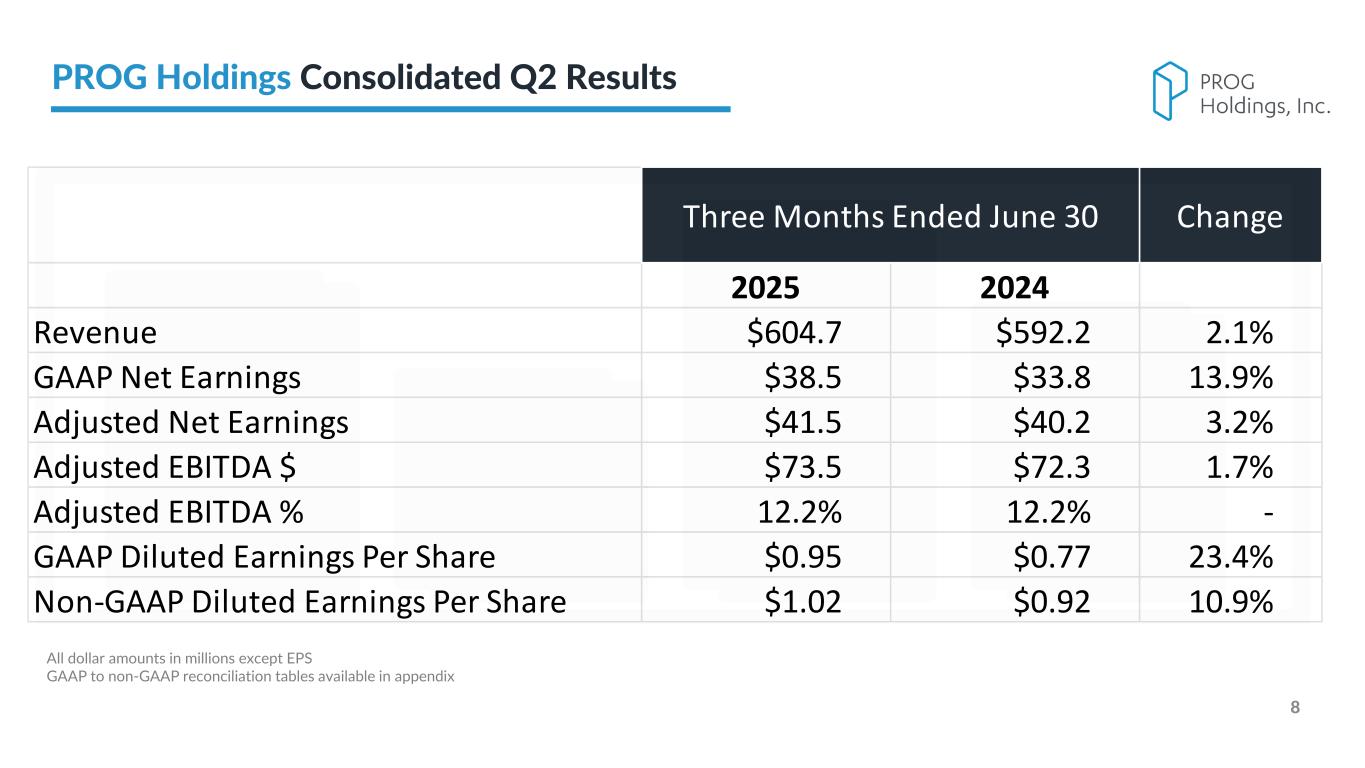

 
PROG Internal 8 2025 2024 Revenue $604.7 $592.2 2.1% GAAP Net Earnings $38.5 $33.8 13.9% Adjusted Net Earnings $41.5 $40.2 3.2% Adjusted EBITDA $ $73.5 $72.3 1.7% Adjusted EBITDA % 12.2% 12.2% - GAAP Diluted Earnings Per Share $0.95 $0.77 23.4% Non-GAAP Diluted Earnings Per Share $1.02 $0.92 10.9% Three Months Ended June 30 Change All dollar amounts in millions except EPS GAAP to non-GAAP reconciliation tables available in appendix PROG Holdings Consolidated Q2 Results
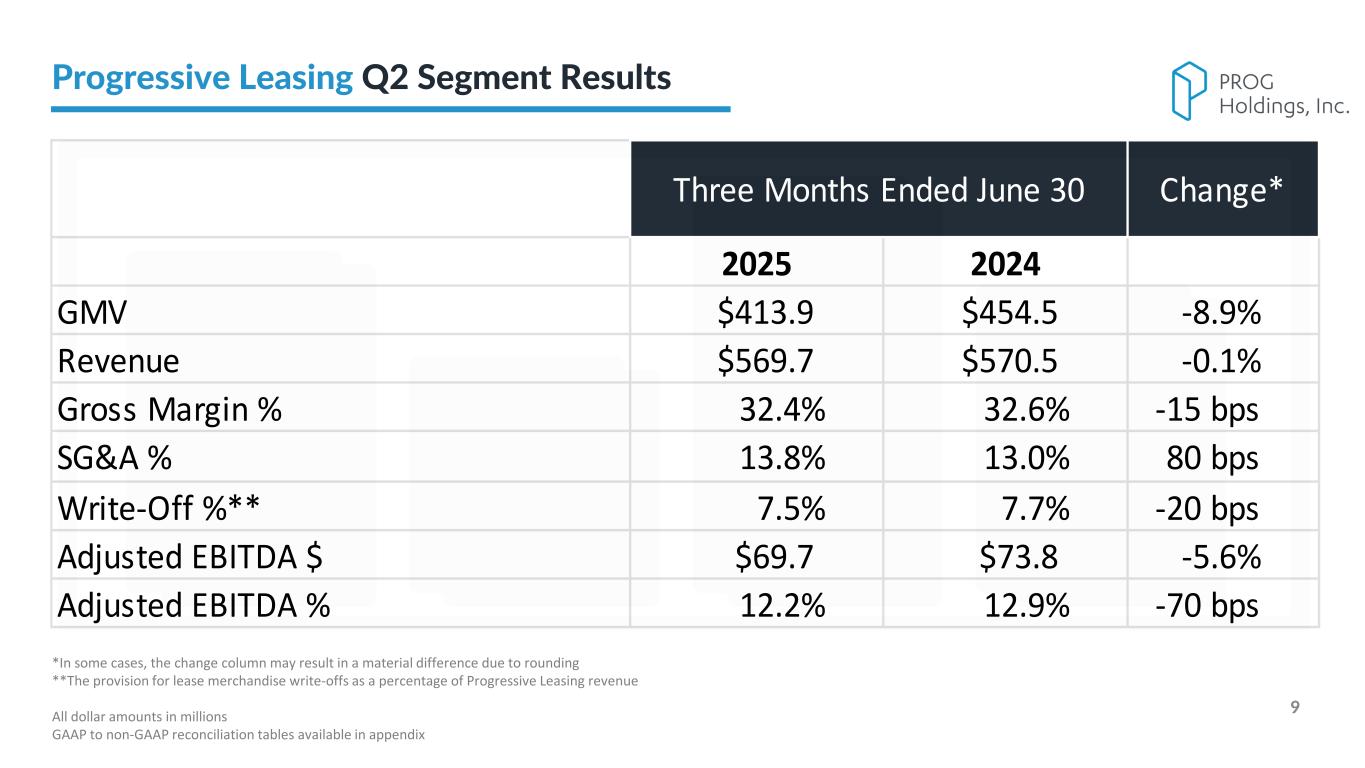

 
PROG Internal 9 2025 2024 GMV $413.9 $454.5 -8.9% Revenue $569.7 $570.5 -0.1% Gross Margin % 32.4% 32.6% -15 bps SG&A % 13.8% 13.0% 80 bps Write-Off %** 7.5% 7.7% -20 bps Adjusted EBITDA $ $69.7 $73.8 -5.6% Adjusted EBITDA % 12.2% 12.9% -70 bps Three Months Ended June 30 Change* *In some cases, the change column may result in a material difference due to rounding **The provision for lease merchandise write-offs as a percentage of Progressive Leasing revenue All dollar amounts in millions GAAP to non-GAAP reconciliation tables available in appendix Progressive Leasing Q2 Segment Results
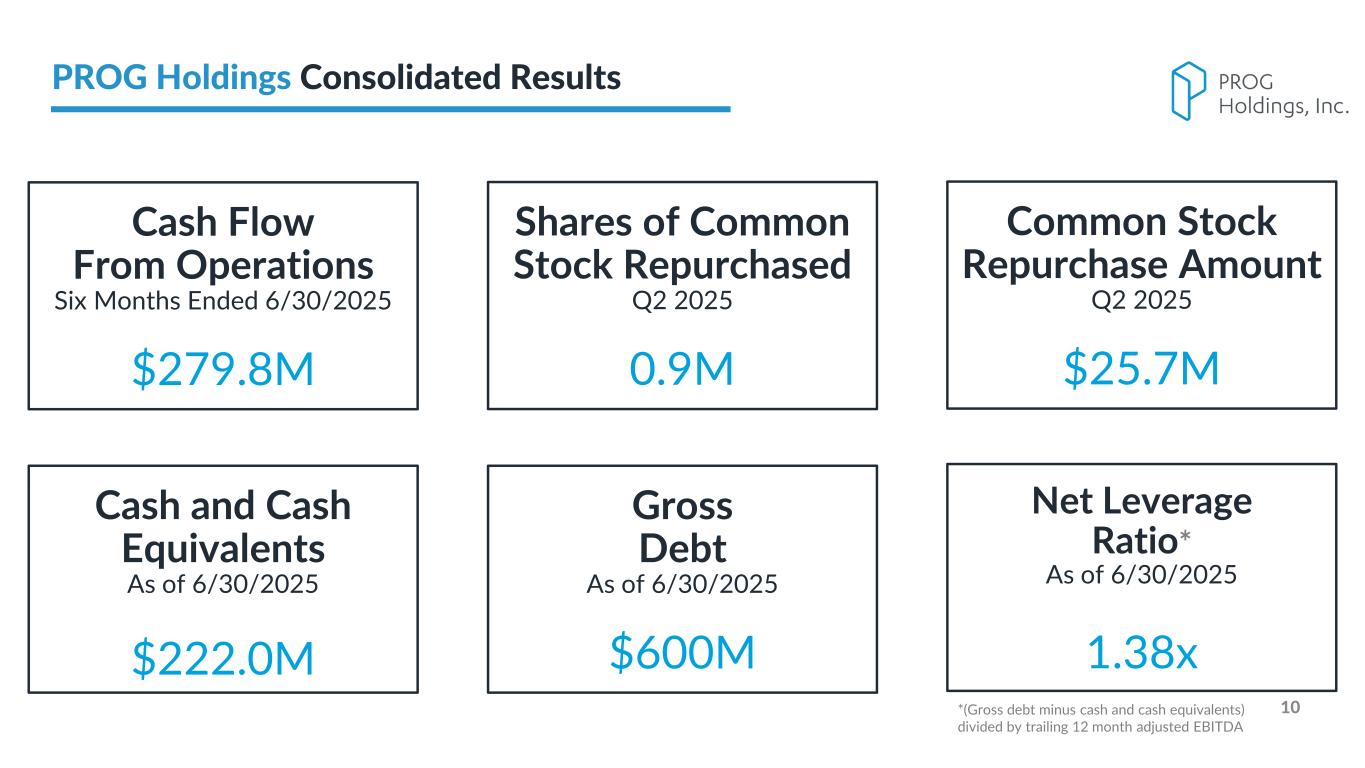

 
PROG Internal 10*(Gross debt minus cash and cash equivalents) divided by trailing 12 month adjusted EBITDA PROG Holdings Consolidated Results Shares of Common Stock Repurchased Q2 2025 0.9M Cash and Cash Equivalents As of 6/30/2025 $222.0M Gross Debt As of 6/30/2025 $600M Net Leverage Ratio* As of 6/30/2025 1.38x Cash Flow From Operations Six Months Ended 6/30/2025 $279.8M Common Stock Repurchase Amount Q2 2025 $25.7M
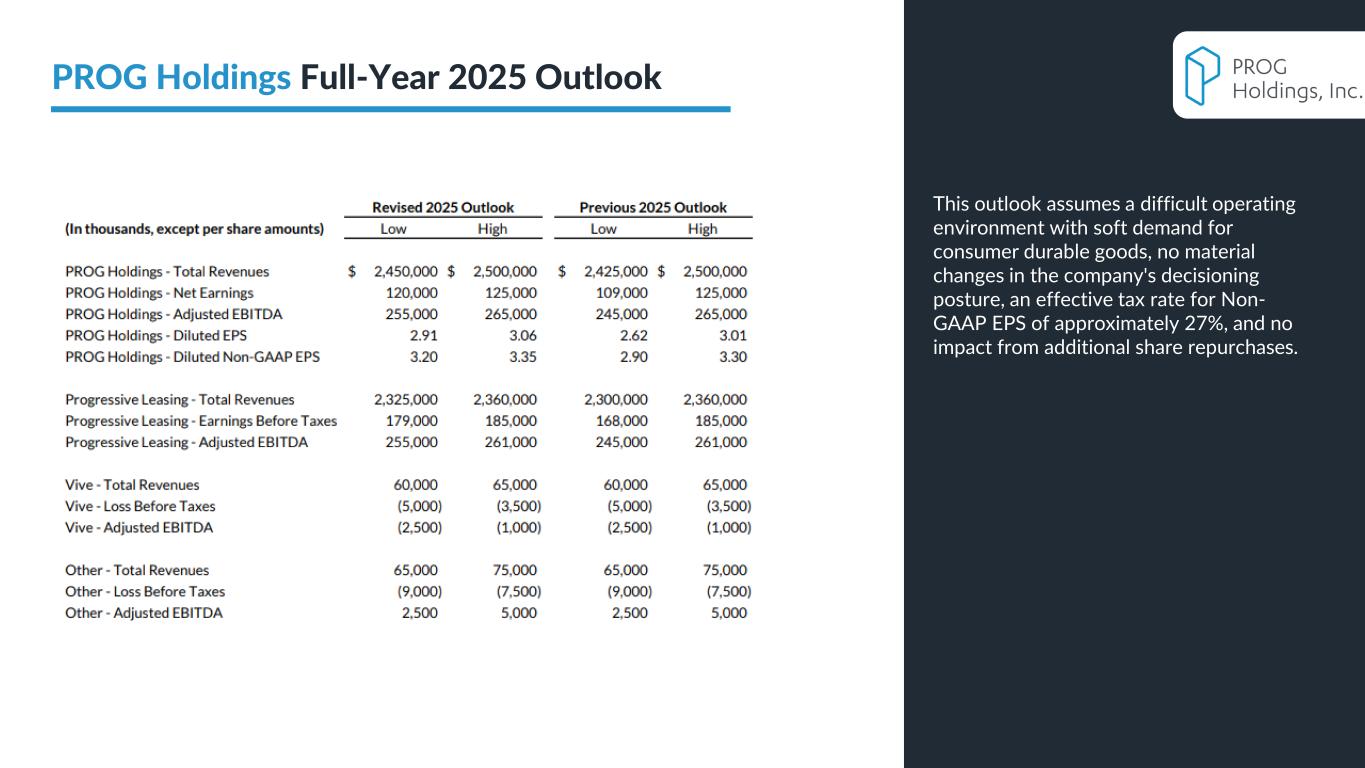

 
PROG Internal 11 PROG Holdings Full-Year 2025 Outlook This outlook assumes a difficult operating environment with soft demand for consumer durable goods, no material changes in the company's decisioning posture, an effective tax rate for Non- GAAP EPS of approximately 27%, and no impact from additional share repurchases.
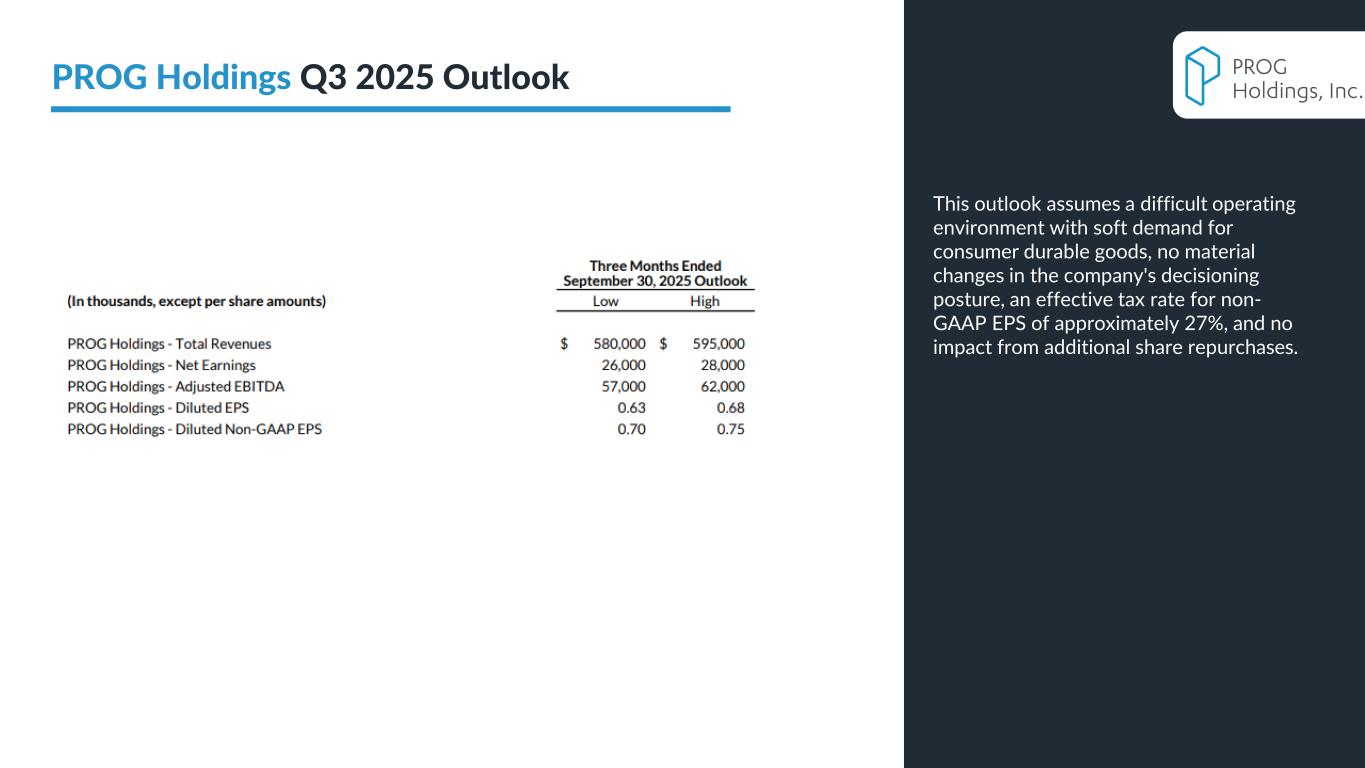

 
PROG Internal 12 PROG Holdings Q3 2025 Outlook This outlook assumes a difficult operating environment with soft demand for consumer durable goods, no material changes in the company's decisioning posture, an effective tax rate for non- GAAP EPS of approximately 27%, and no impact from additional share repurchases.


 
PROG Internal
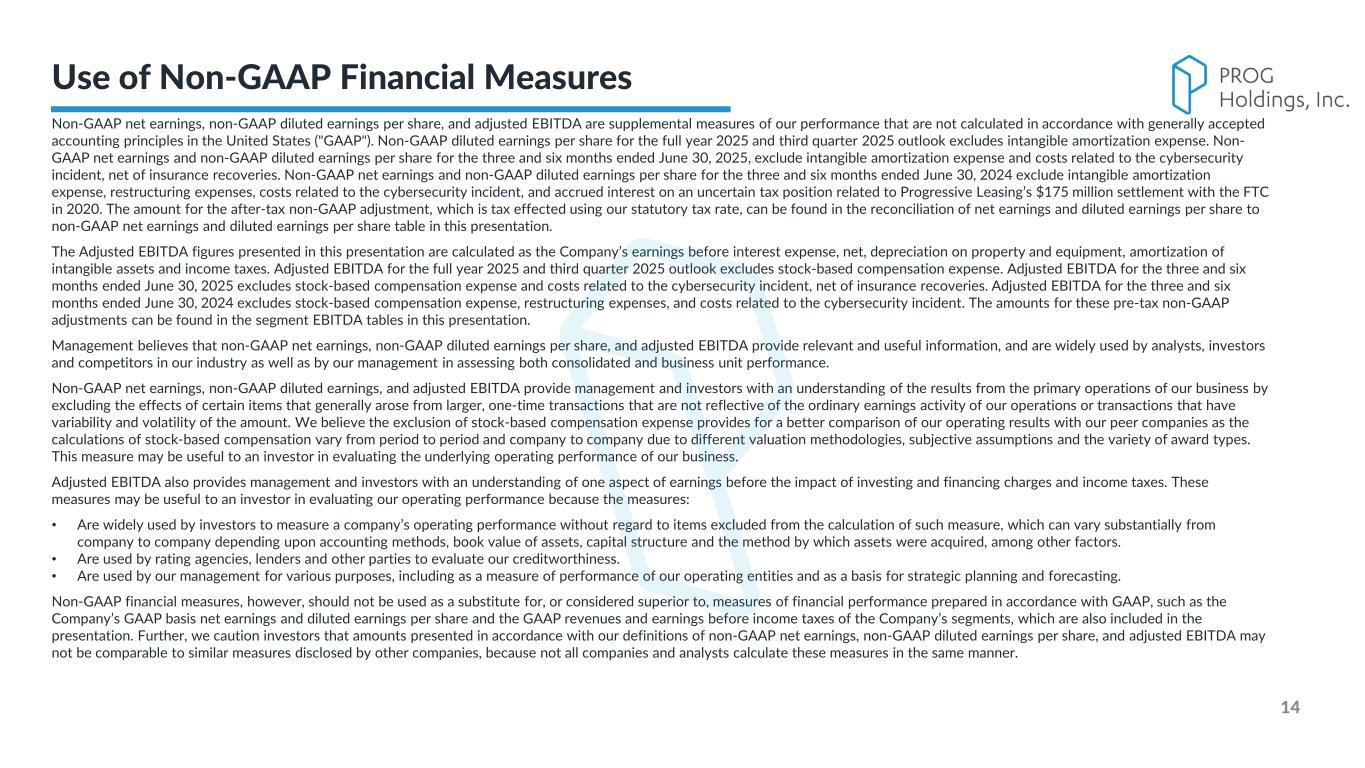

 
PROG Internal Non-GAAP net earnings, non-GAAP diluted earnings per share, and adjusted EBITDA are supplemental measures of our performance that are not calculated in accordance with generally accepted accounting principles in the United States ("GAAP"). Non-GAAP diluted earnings per share for the full year 2025 and third quarter 2025 outlook excludes intangible amortization expense. Non- GAAP net earnings and non-GAAP diluted earnings per share for the three and six months ended June 30, 2025, exclude intangible amortization expense and costs related to the cybersecurity incident, net of insurance recoveries. Non-GAAP net earnings and non-GAAP diluted earnings per share for the three and six months ended June 30, 2024 exclude intangible amortization expense, restructuring expenses, costs related to the cybersecurity incident, and accrued interest on an uncertain tax position related to Progressive Leasing’s $175 million settlement with the FTC in 2020. The amount for the after-tax non-GAAP adjustment, which is tax effected using our statutory tax rate, can be found in the reconciliation of net earnings and diluted earnings per share to non-GAAP net earnings and diluted earnings per share table in this presentation. The Adjusted EBITDA figures presented in this presentation are calculated as the Company’s earnings before interest expense, net, depreciation on property and equipment, amortization of intangible assets and income taxes. Adjusted EBITDA for the full year 2025 and third quarter 2025 outlook excludes stock-based compensation expense. Adjusted EBITDA for the three and six months ended June 30, 2025 excludes stock-based compensation expense and costs related to the cybersecurity incident, net of insurance recoveries. Adjusted EBITDA for the three and six months ended June 30, 2024 excludes stock-based compensation expense, restructuring expenses, and costs related to the cybersecurity incident. The amounts for these pre-tax non-GAAP adjustments can be found in the segment EBITDA tables in this presentation. Management believes that non-GAAP net earnings, non-GAAP diluted earnings per share, and adjusted EBITDA provide relevant and useful information, and are widely used by analysts, investors and competitors in our industry as well as by our management in assessing both consolidated and business unit performance. Non-GAAP net earnings, non-GAAP diluted earnings, and adjusted EBITDA provide management and investors with an understanding of the results from the primary operations of our business by excluding the effects of certain items that generally arose from larger, one-time transactions that are not reflective of the ordinary earnings activity of our operations or transactions that have variability and volatility of the amount. We believe the exclusion of stock-based compensation expense provides for a better comparison of our operating results with our peer companies as the calculations of stock-based compensation vary from period to period and company to company due to different valuation methodologies, subjective assumptions and the variety of award types. This measure may be useful to an investor in evaluating the underlying operating performance of our business. Adjusted EBITDA also provides management and investors with an understanding of one aspect of earnings before the impact of investing and financing charges and income taxes. These measures may be useful to an investor in evaluating our operating performance because the measures: • Are widely used by investors to measure a company’s operating performance without regard to items excluded from the calculation of such measure, which can vary substantially from company to company depending upon accounting methods, book value of assets, capital structure and the method by which assets were acquired, among other factors. • Are used by rating agencies, lenders and other parties to evaluate our creditworthiness. • Are used by our management for various purposes, including as a measure of performance of our operating entities and as a basis for strategic planning and forecasting. Non-GAAP financial measures, however, should not be used as a substitute for, or considered superior to, measures of financial performance prepared in accordance with GAAP, such as the Company’s GAAP basis net earnings and diluted earnings per share and the GAAP revenues and earnings before income taxes of the Company’s segments, which are also included in the presentation. Further, we caution investors that amounts presented in accordance with our definitions of non-GAAP net earnings, non-GAAP diluted earnings per share, and adjusted EBITDA may not be comparable to similar measures disclosed by other companies, because not all companies and analysts calculate these measures in the same manner. 14 Use of Non-GAAP Financial Measures
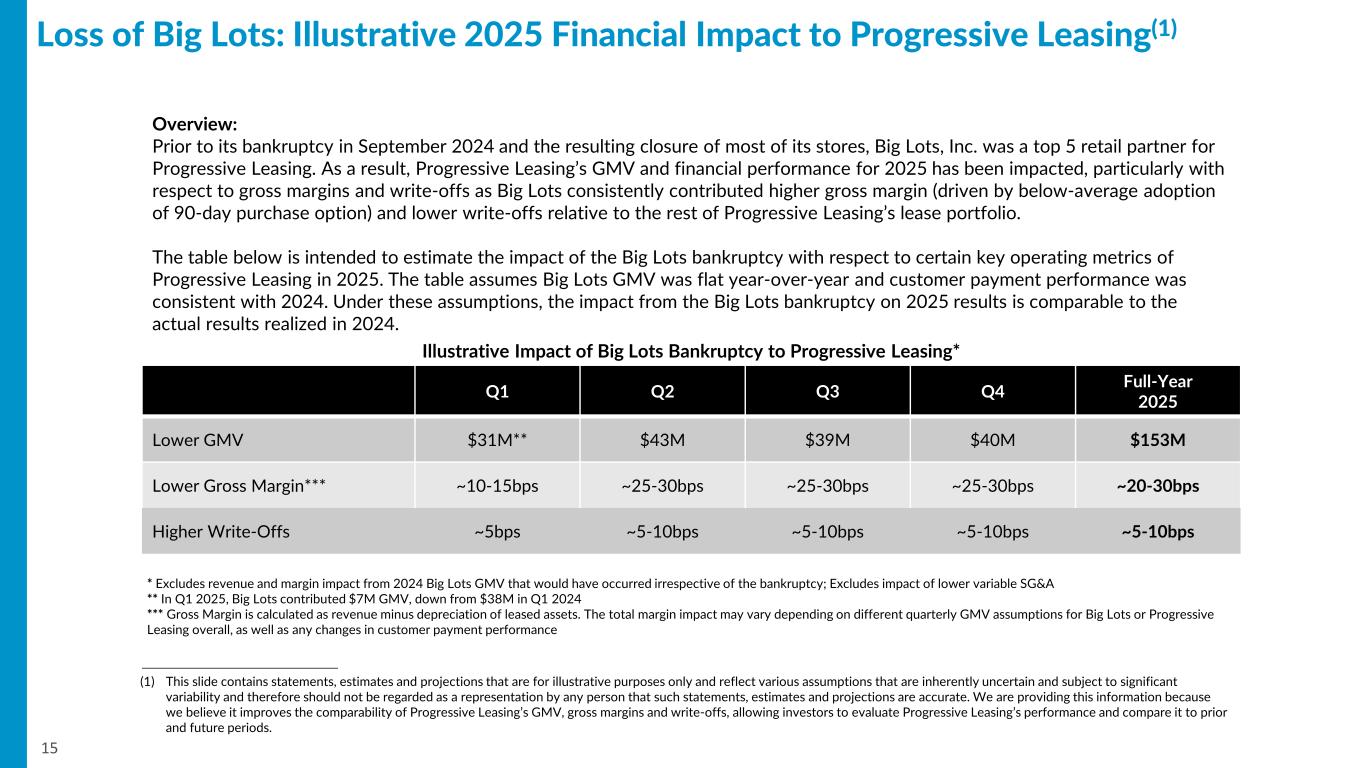

 
PROG Internal Loss of Big Lots: Illustrative 2025 Financial Impact to Progressive Leasing(1) 15 Q1 Q2 Q3 Q4 Full-Year 2025 Lower GMV $31M** $43M $39M $40M $153M Lower Gross Margin*** ~10-15bps ~25-30bps ~25-30bps ~25-30bps ~20-30bps Higher Write-Offs ~5bps ~5-10bps ~5-10bps ~5-10bps ~5-10bps Overview: Prior to its bankruptcy in September 2024 and the resulting closure of most of its stores, Big Lots, Inc. was a top 5 retail partner for Progressive Leasing. As a result, Progressive Leasing’s GMV and financial performance for 2025 has been impacted, particularly with respect to gross margins and write-offs as Big Lots consistently contributed higher gross margin (driven by below-average adoption of 90-day purchase option) and lower write-offs relative to the rest of Progressive Leasing’s lease portfolio. The table below is intended to estimate the impact of the Big Lots bankruptcy with respect to certain key operating metrics of Progressive Leasing in 2025. The table assumes Big Lots GMV was flat year-over-year and customer payment performance was consistent with 2024. Under these assumptions, the impact from the Big Lots bankruptcy on 2025 results is comparable to the actual results realized in 2024. * Excludes revenue and margin impact from 2024 Big Lots GMV that would have occurred irrespective of the bankruptcy; Excludes impact of lower variable SG&A ** In Q1 2025, Big Lots contributed $7M GMV, down from $38M in Q1 2024 *** Gross Margin is calculated as revenue minus depreciation of leased assets. The total margin impact may vary depending on different quarterly GMV assumptions for Big Lots or Progressive Leasing overall, as well as any changes in customer payment performance Illustrative Impact of Big Lots Bankruptcy to Progressive Leasing* (1) This slide contains statements, estimates and projections that are for illustrative purposes only and reflect various assumptions that are inherently uncertain and subject to significant variability and therefore should not be regarded as a representation by any person that such statements, estimates and projections are accurate. We are providing this information because we believe it improves the comparability of Progressive Leasing’s GMV, gross margins and write-offs, allowing investors to evaluate Progressive Leasing’s performance and compare it to prior and future periods.
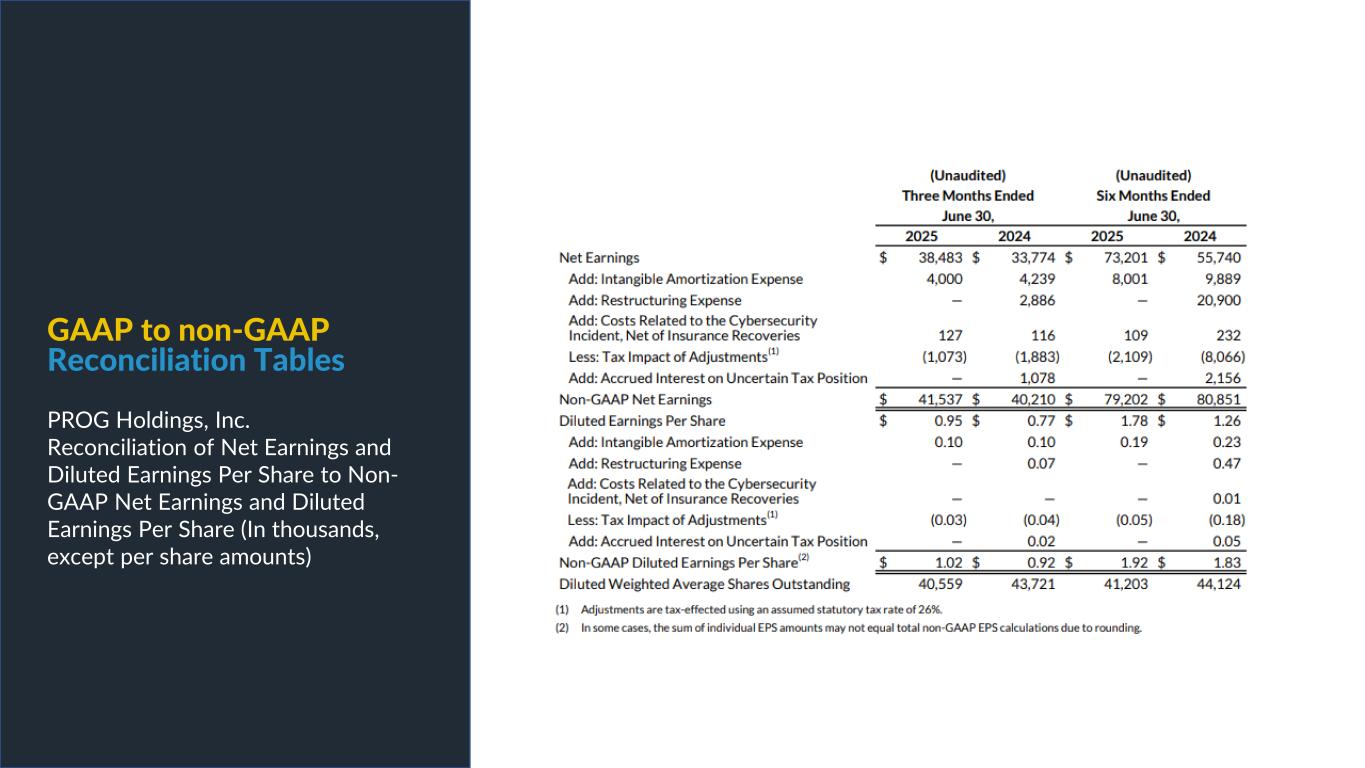

 
PROG Internal GAAP to non-GAAP Reconciliation Tables PROG Holdings, Inc. Reconciliation of Net Earnings and Diluted Earnings Per Share to Non- GAAP Net Earnings and Diluted Earnings Per Share (In thousands, except per share amounts)
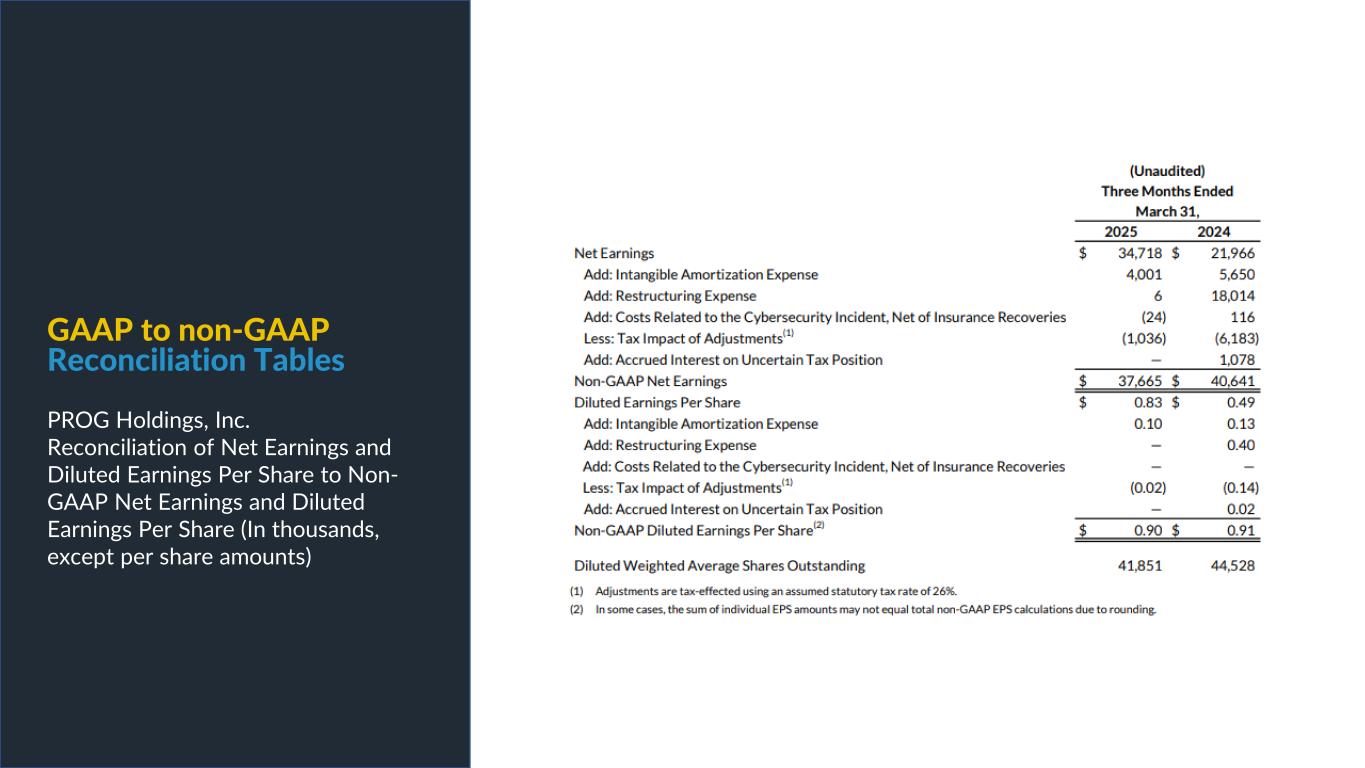

 
PROG Internal GAAP to non-GAAP Reconciliation Tables PROG Holdings, Inc. Reconciliation of Net Earnings and Diluted Earnings Per Share to Non- GAAP Net Earnings and Diluted Earnings Per Share (In thousands, except per share amounts)
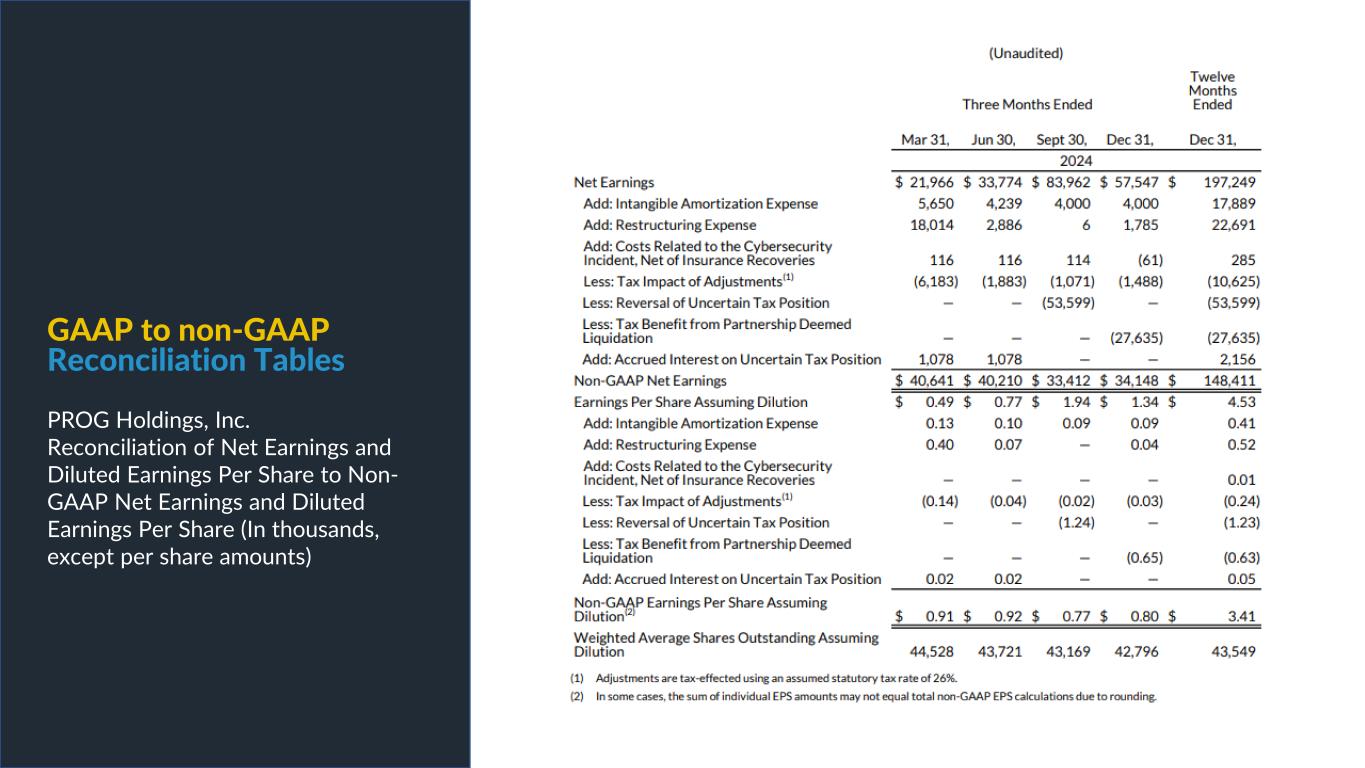

 
PROG Internal GAAP to non-GAAP Reconciliation Tables PROG Holdings, Inc. Reconciliation of Net Earnings and Diluted Earnings Per Share to Non- GAAP Net Earnings and Diluted Earnings Per Share (In thousands, except per share amounts)
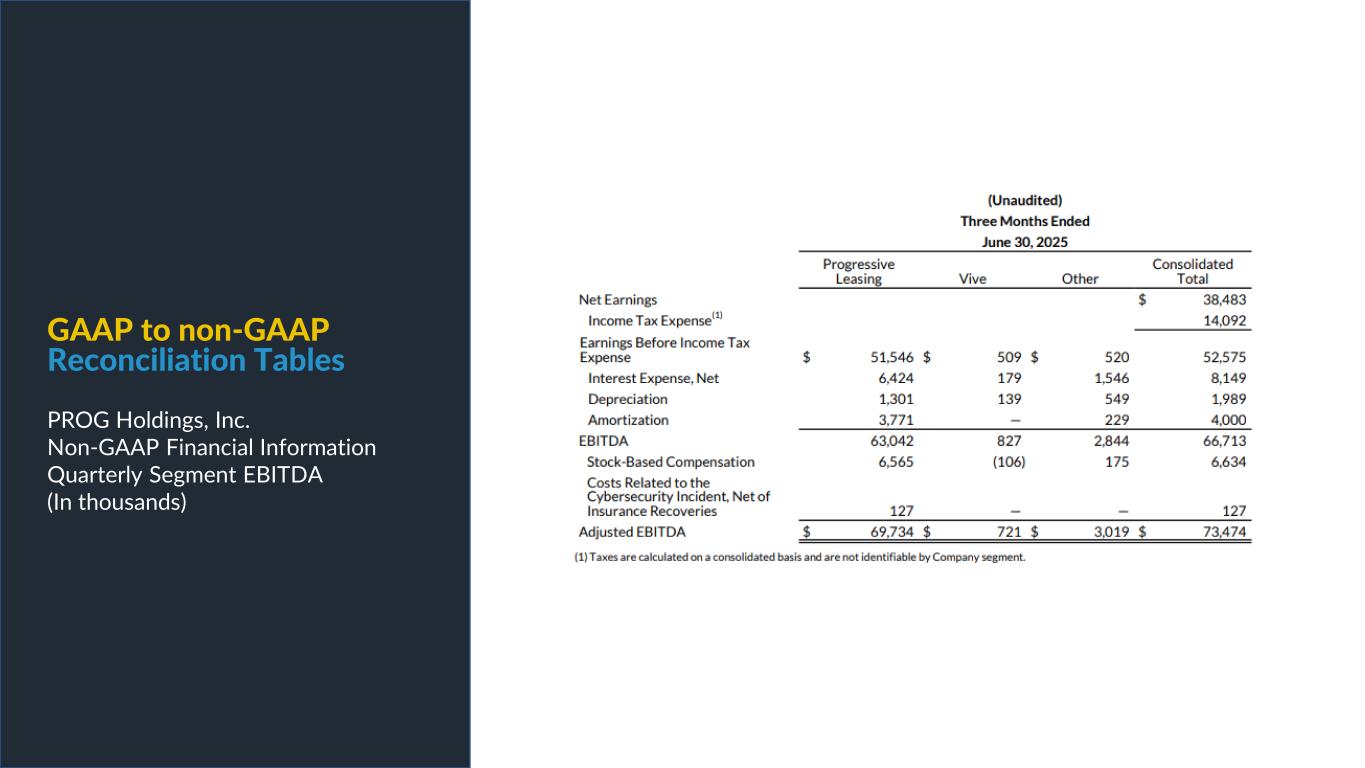

 
PROG Internal GAAP to non-GAAP Reconciliation Tables PROG Holdings, Inc. Non-GAAP Financial Information Quarterly Segment EBITDA (In thousands)
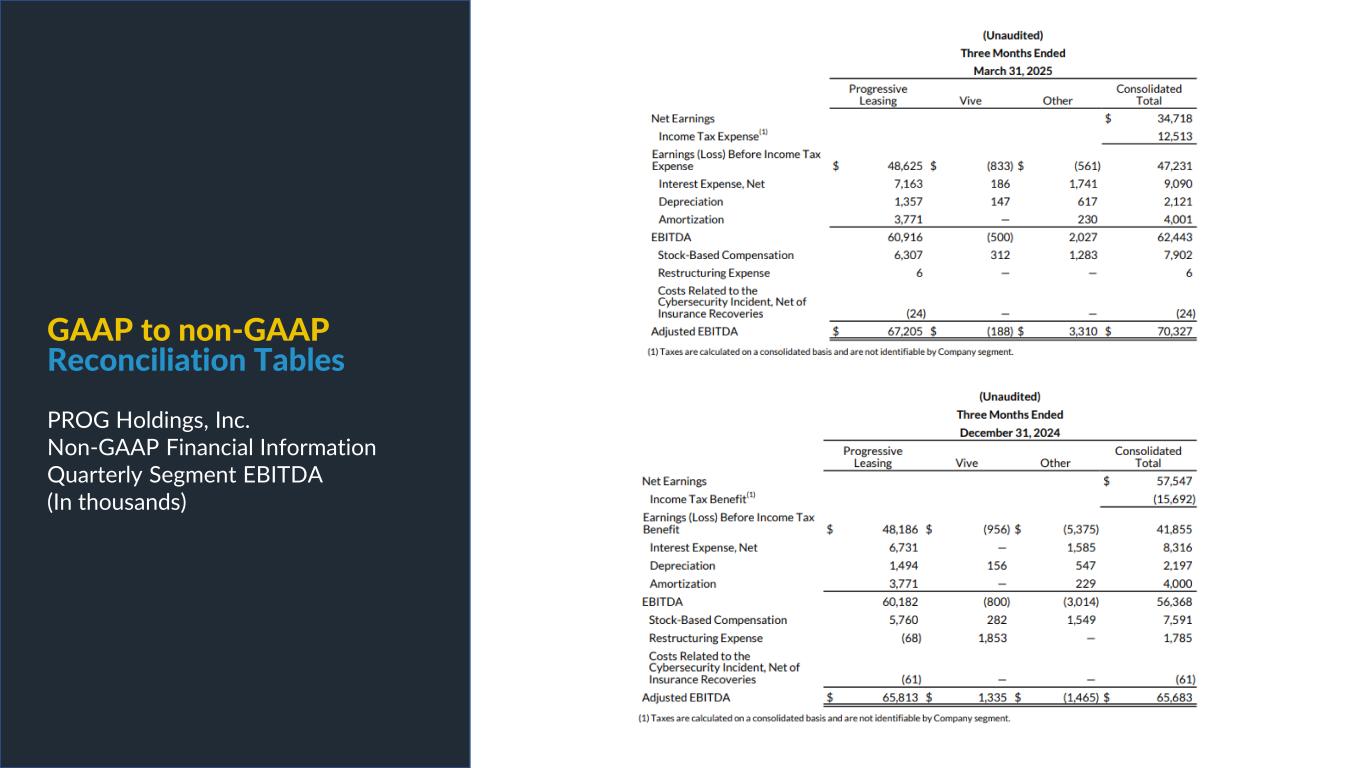

 
PROG Internal GAAP to non-GAAP Reconciliation Tables PROG Holdings, Inc. Non-GAAP Financial Information Quarterly Segment EBITDA (In thousands)
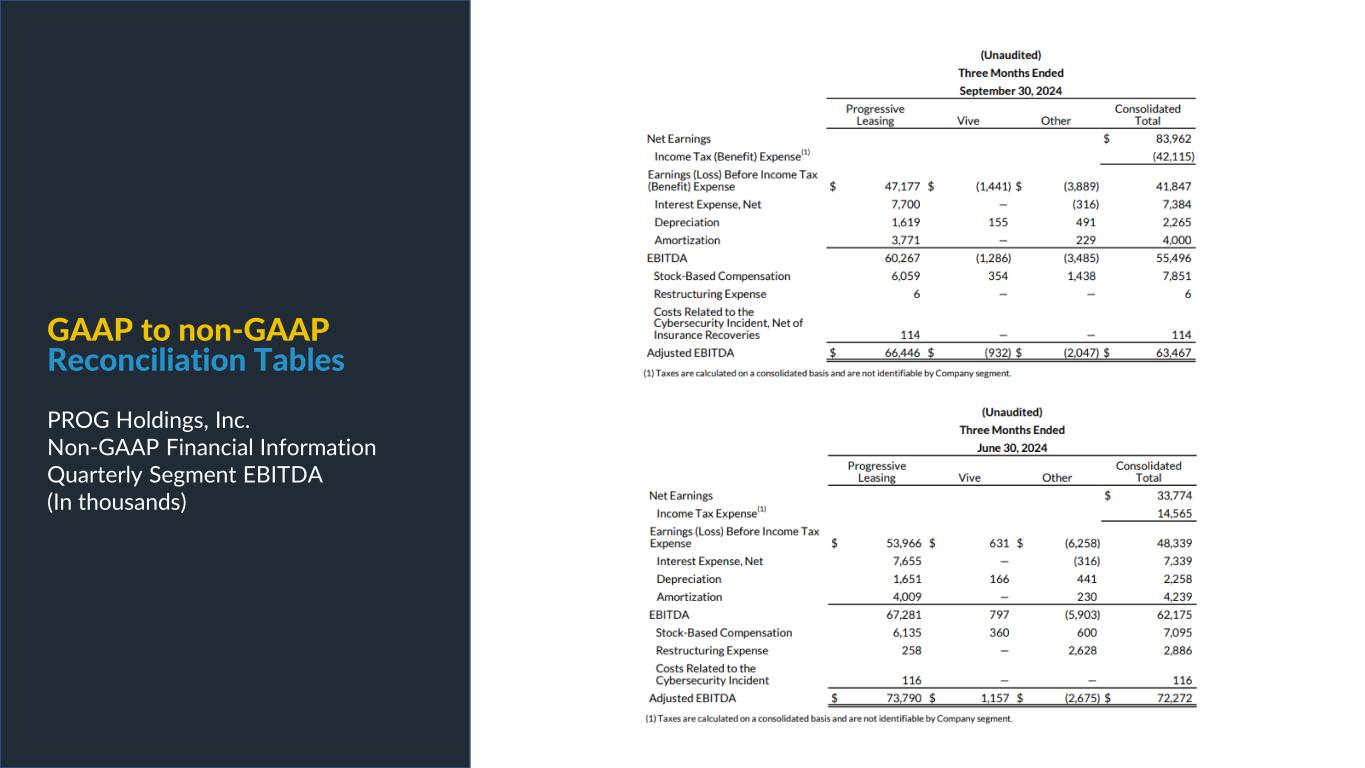

 
PROG Internal GAAP to non-GAAP Reconciliation Tables PROG Holdings, Inc. Non-GAAP Financial Information Quarterly Segment EBITDA (In thousands)
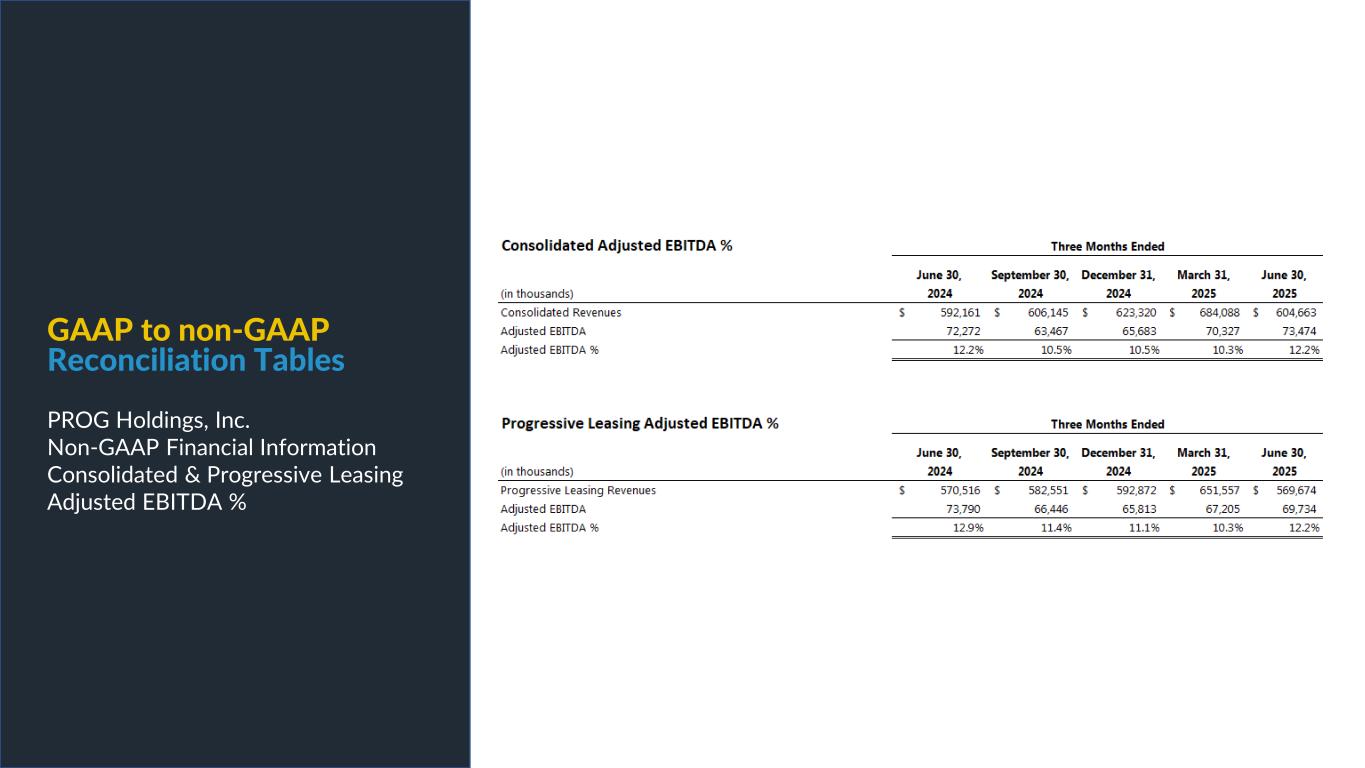

 
PROG Internal GAAP to non-GAAP Reconciliation Tables PROG Holdings, Inc. Non-GAAP Financial Information Consolidated & Progressive Leasing Adjusted EBITDA %
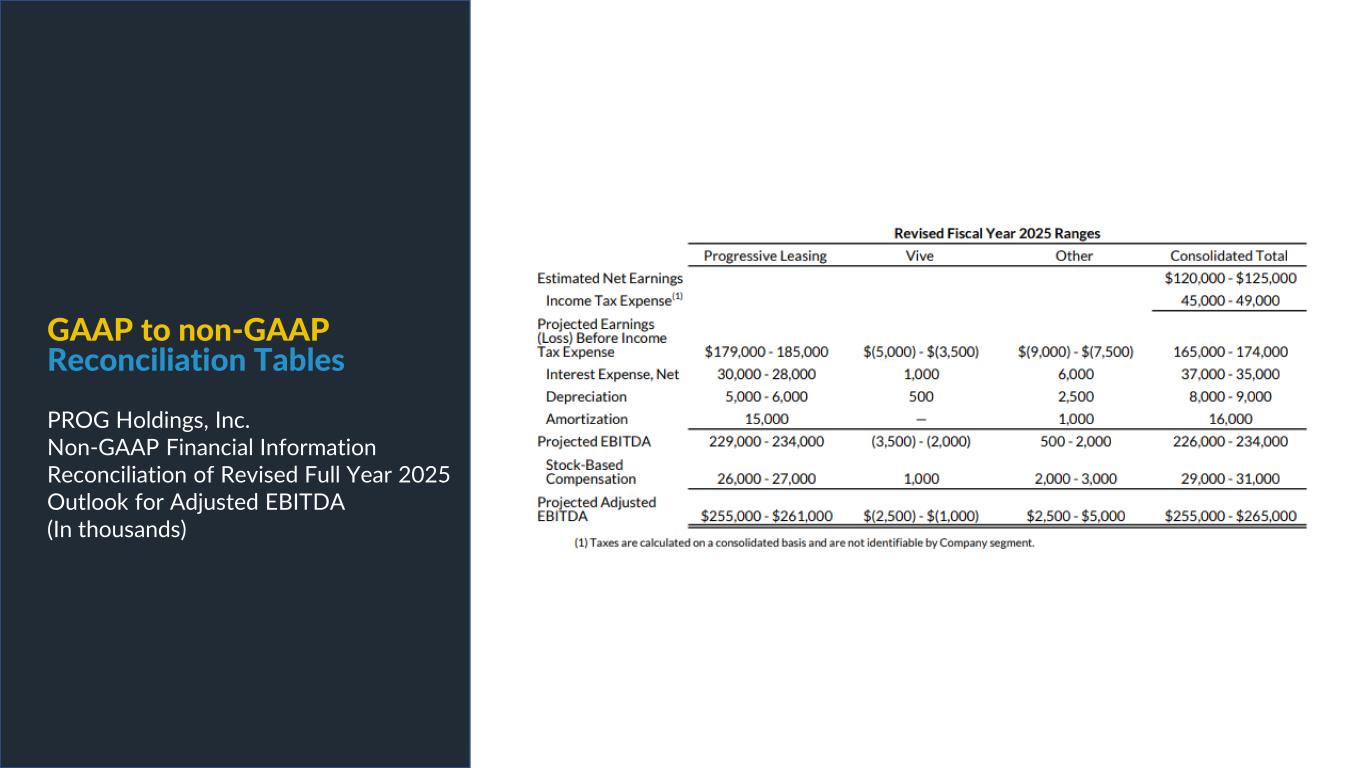

 
PROG Internal GAAP to non-GAAP Reconciliation Tables PROG Holdings, Inc. Non-GAAP Financial Information Reconciliation of Revised Full Year 2025 Outlook for Adjusted EBITDA (In thousands)
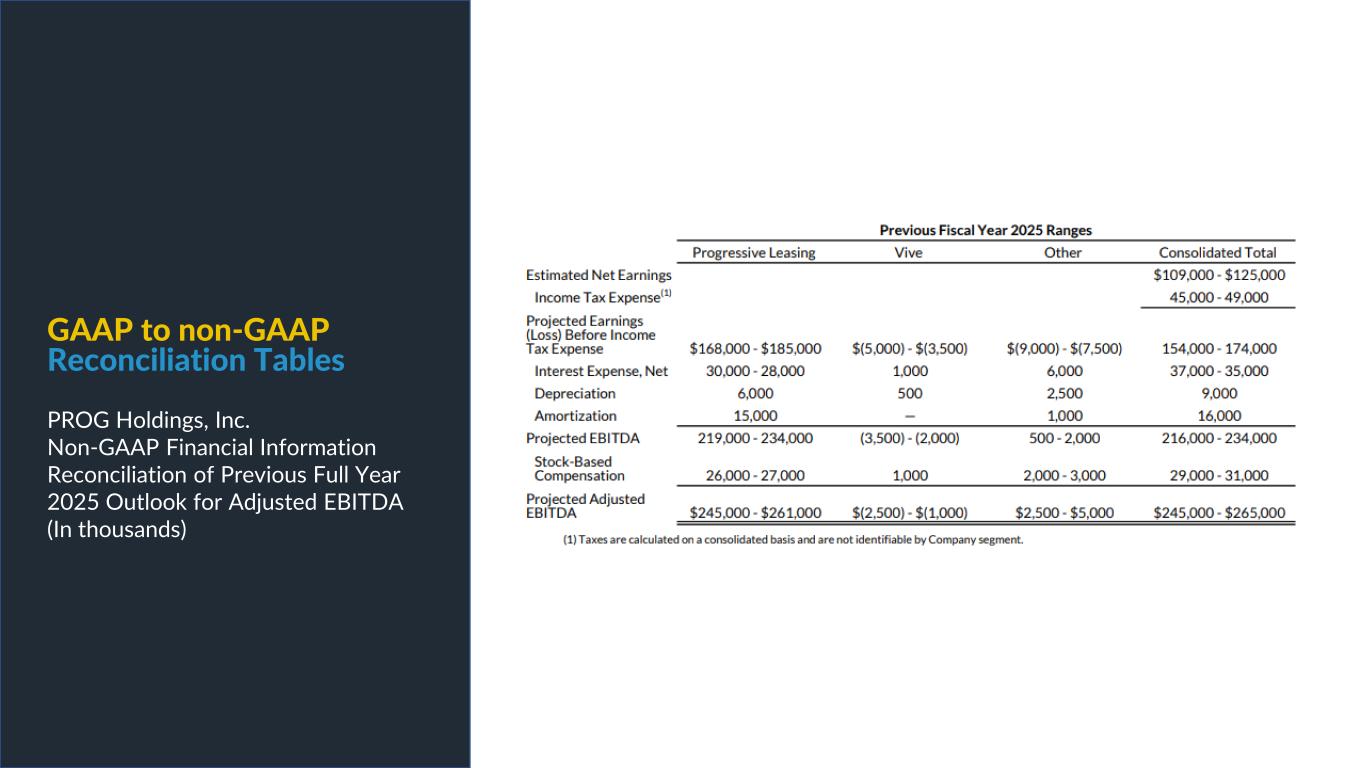

 
PROG Internal GAAP to non-GAAP Reconciliation Tables PROG Holdings, Inc. Non-GAAP Financial Information Reconciliation of Previous Full Year 2025 Outlook for Adjusted EBITDA (In thousands)
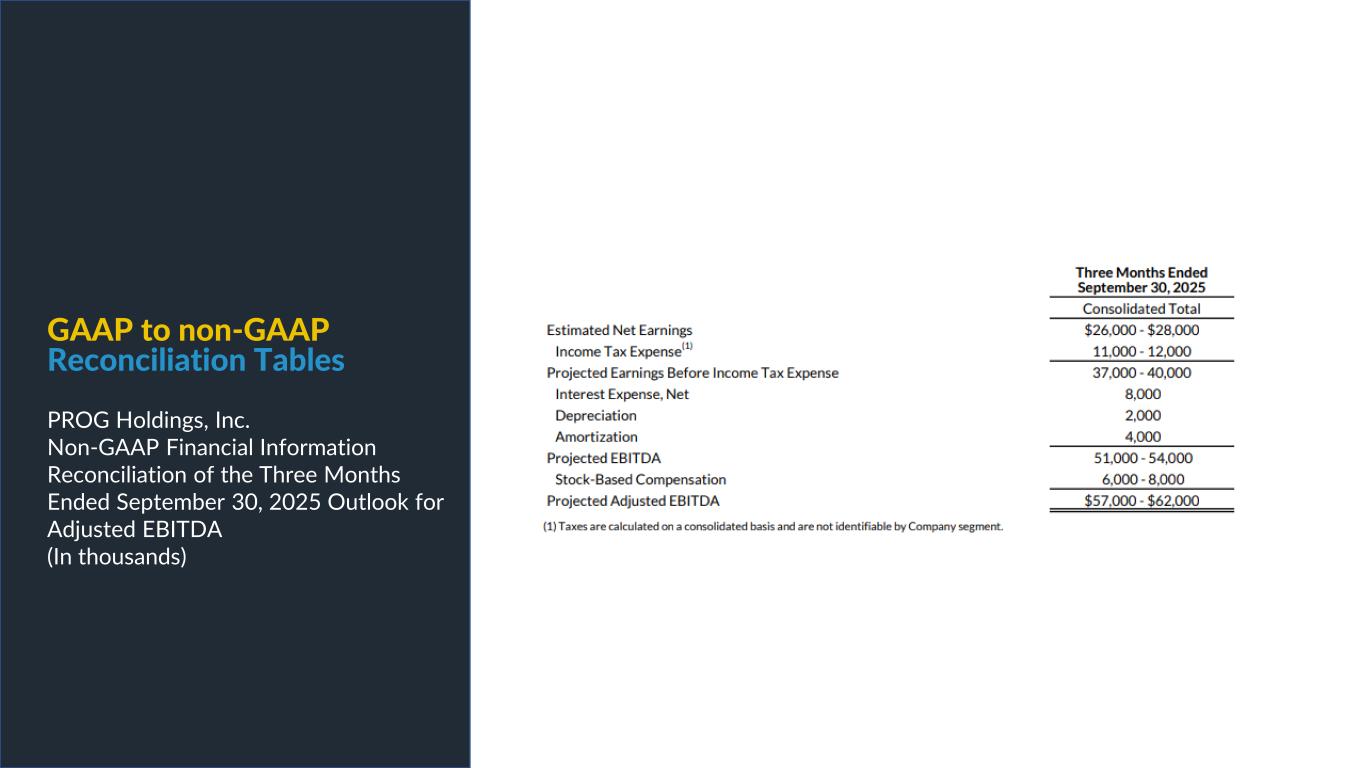

 
PROG Internal GAAP to non-GAAP Reconciliation Tables PROG Holdings, Inc. Non-GAAP Financial Information Reconciliation of the Three Months Ended September 30, 2025 Outlook for Adjusted EBITDA (In thousands)
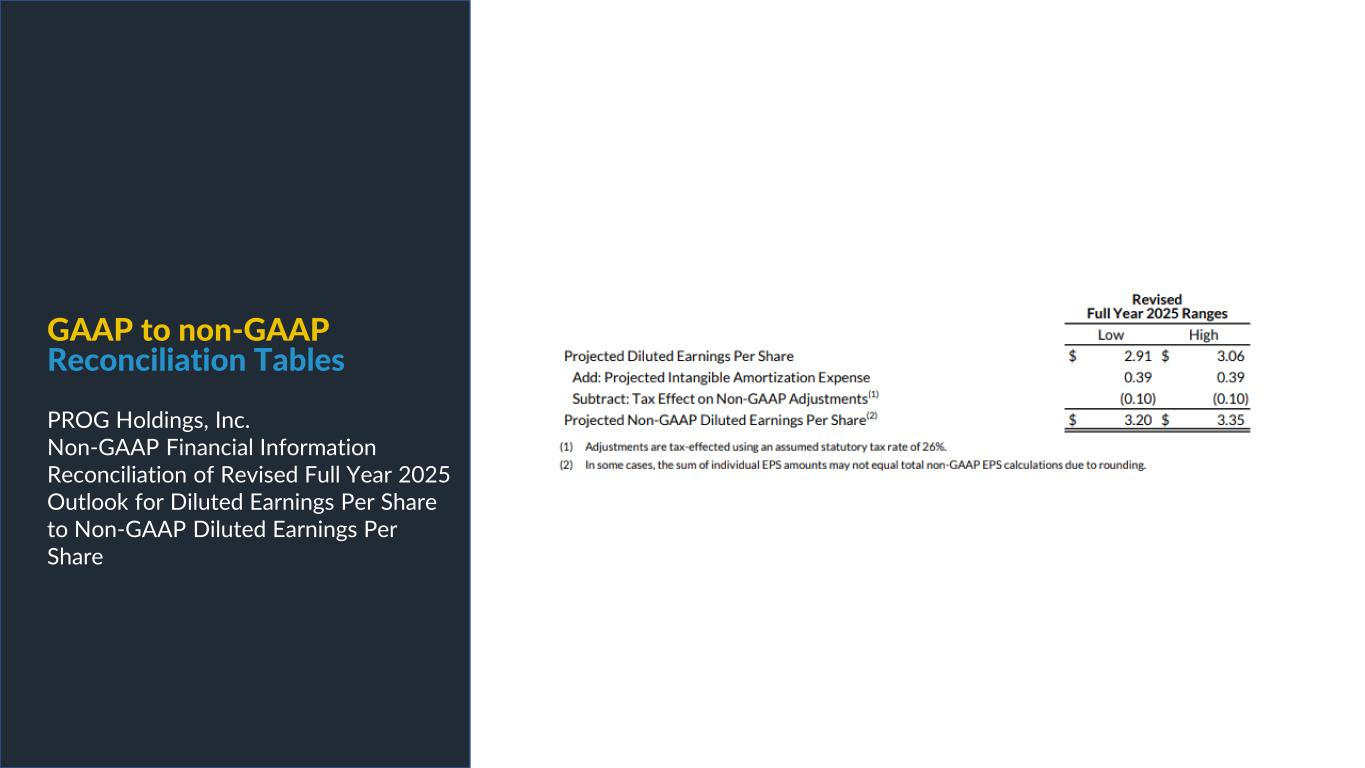

 
PROG Internal GAAP to non-GAAP Reconciliation Tables PROG Holdings, Inc. Non-GAAP Financial Information Reconciliation of Revised Full Year 2025 Outlook for Diluted Earnings Per Share to Non-GAAP Diluted Earnings Per Share
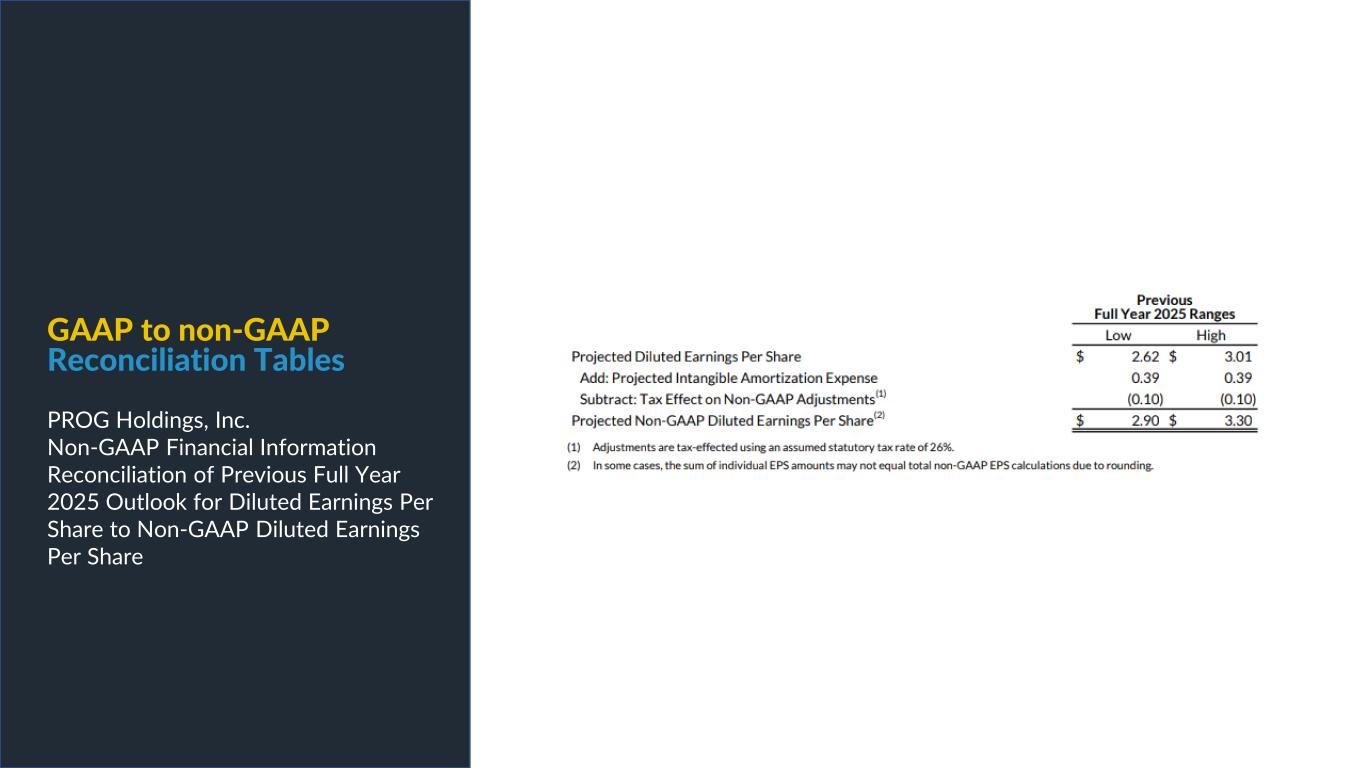

 
GAAP to non-GAAP Reconciliation Tables PROG Holdings, Inc. Non-GAAP Financial Information Reconciliation of Previous Full Year 2025 Outlook for Diluted Earnings Per Share to Non-GAAP Diluted Earnings Per Share
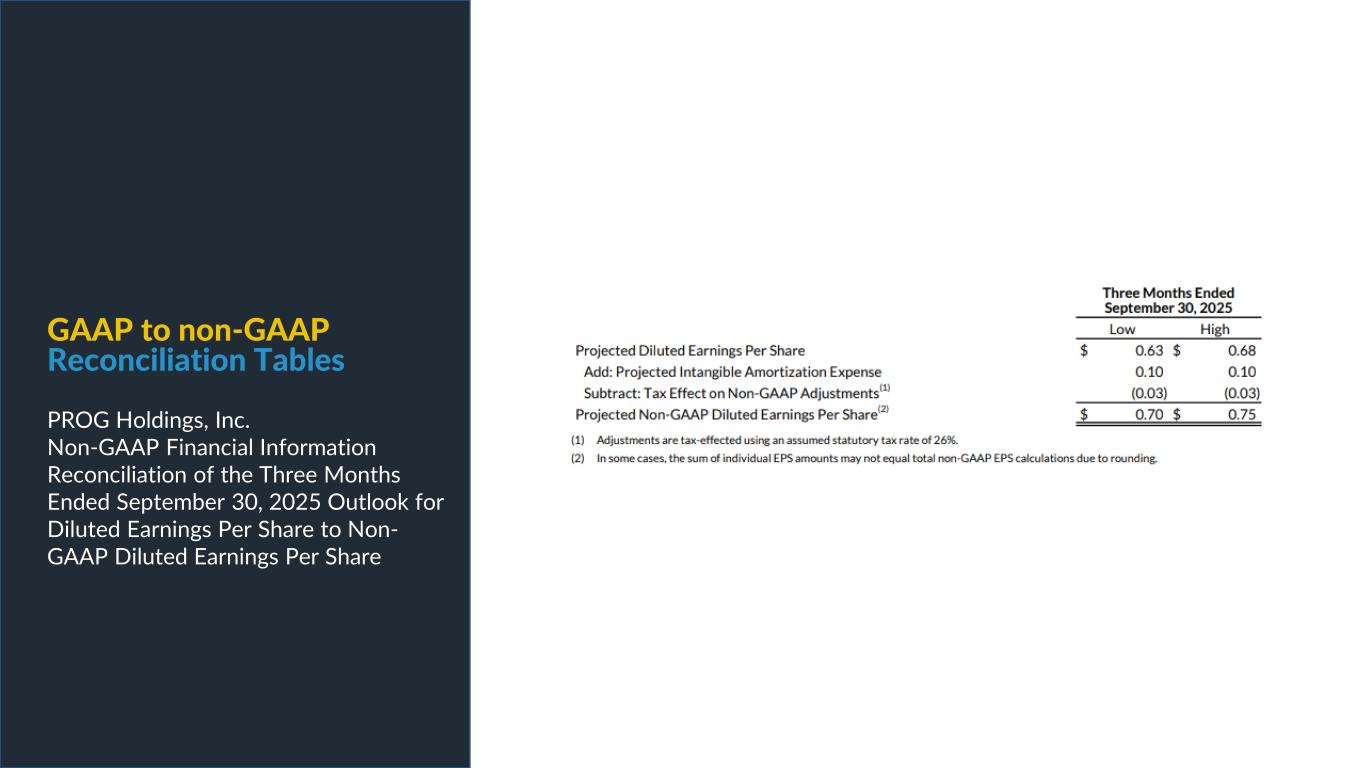

 
GAAP to non-GAAP Reconciliation Tables PROG Holdings, Inc. Non-GAAP Financial Information Reconciliation of the Three Months Ended September 30, 2025 Outlook for Diluted Earnings Per Share to Non- GAAP Diluted Earnings Per Share


 
PROG Internal