Priority Technology Holdings, Inc. Reports Third Quarter Financial Results
Third Quarter Performance Driven by Strength of Unified Commerce Platform
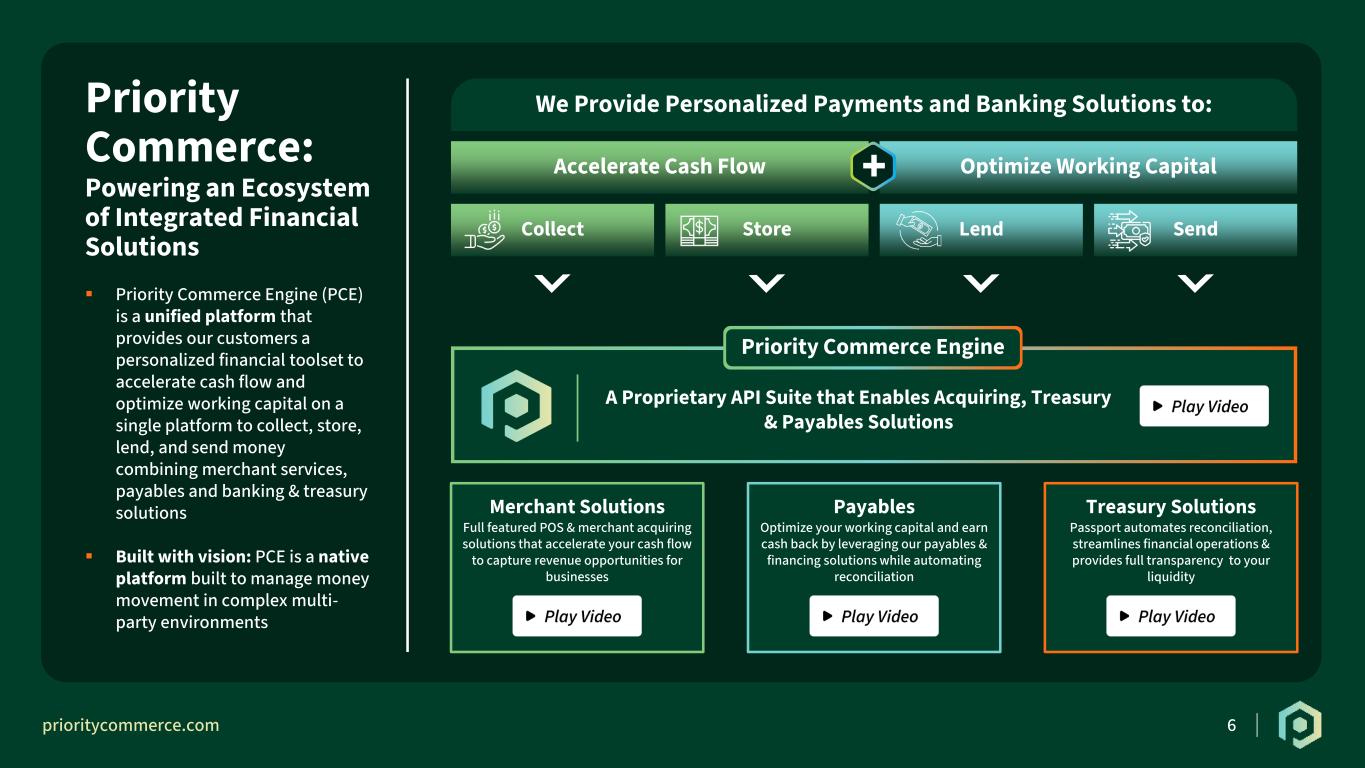
ALPHARETTA, GA - November 6, 2025 -- Priority Technology Holdings, Inc. (NASDAQ: PRTH) ("Priority" or the "Company"), the payments and banking solution that streamlines collecting, storing, lending, and sending money to unlock revenue opportunities, today announced its third quarter 2025 financial results including strong year-over-year diversified revenue growth.
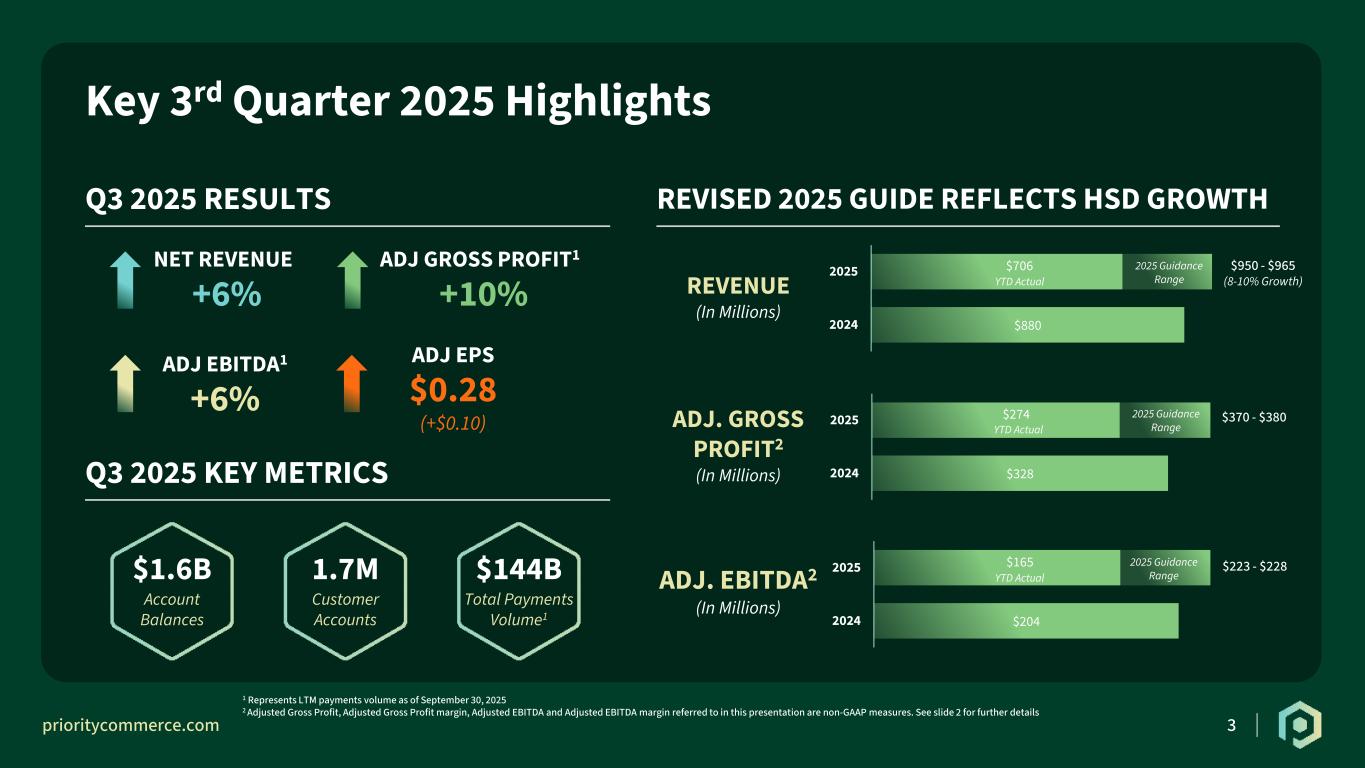
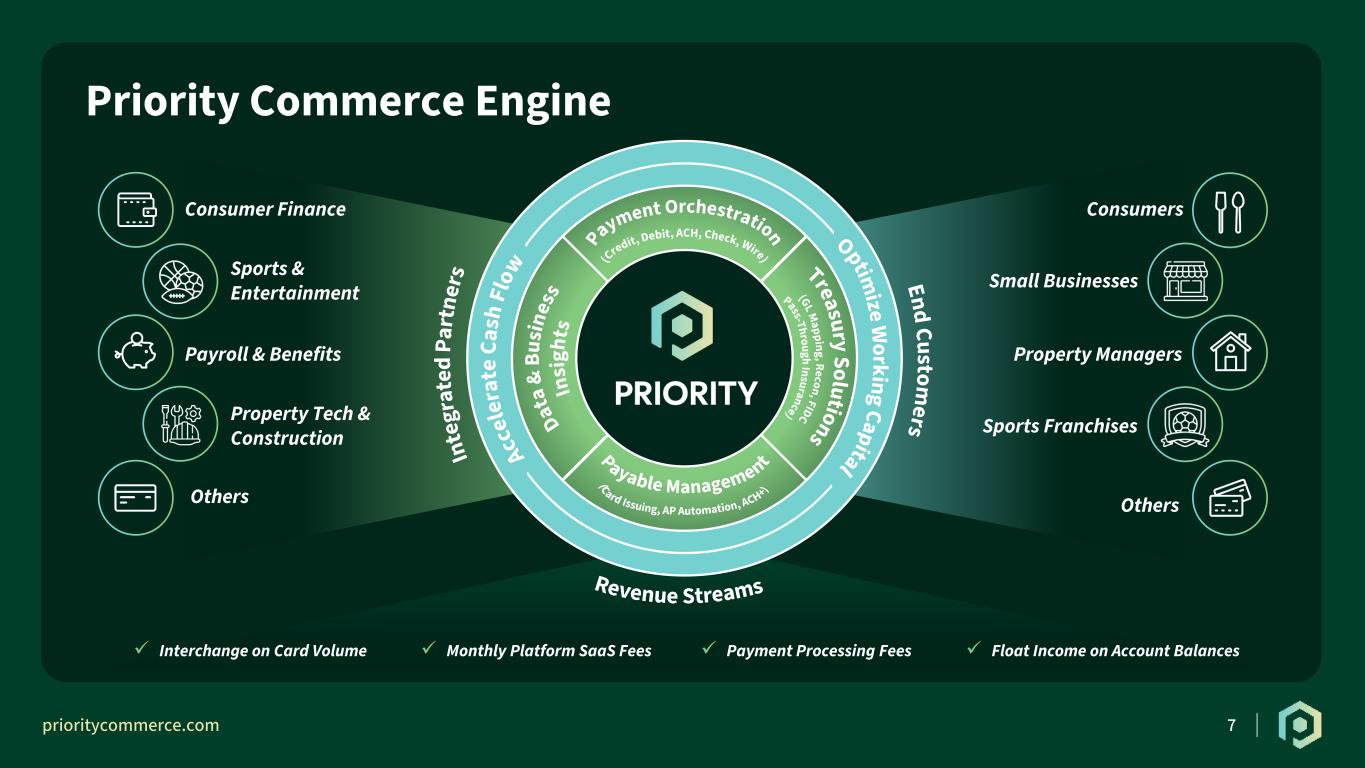
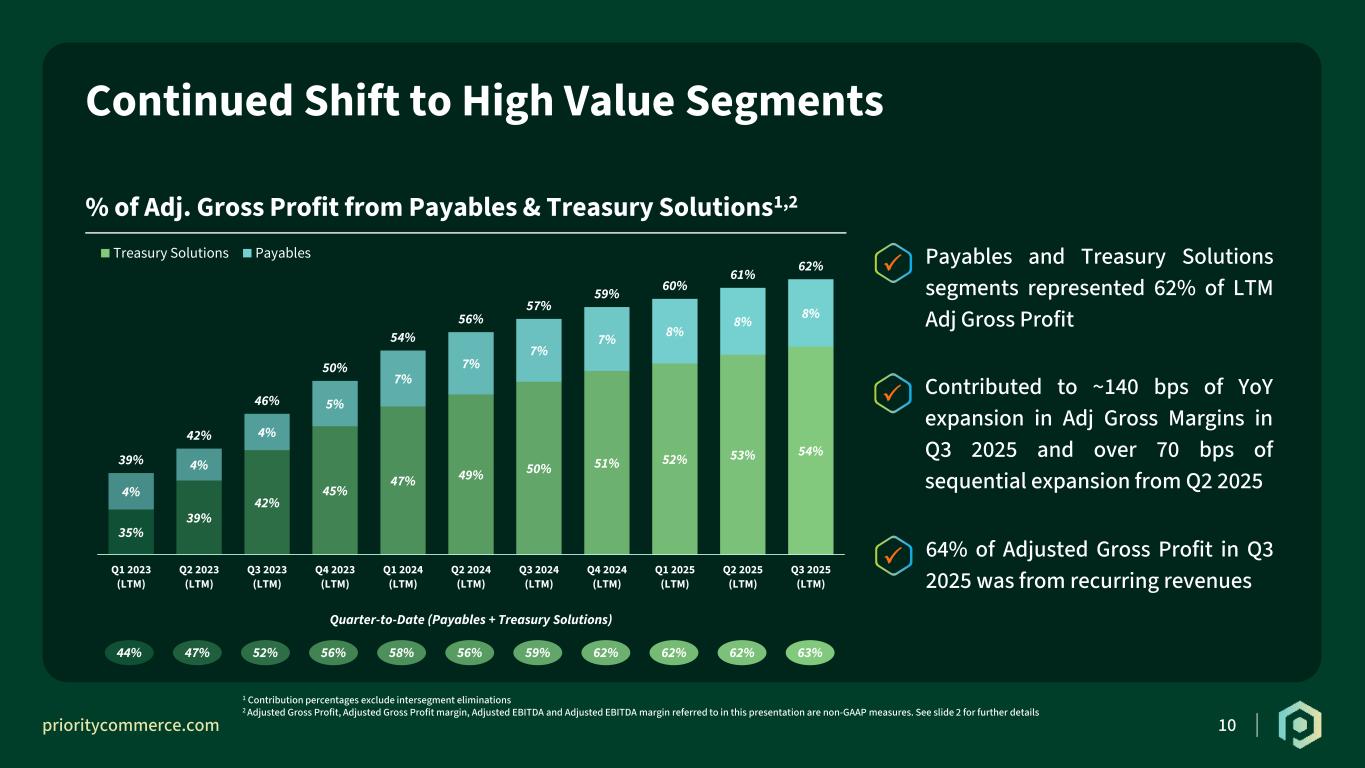
"Our third quarter results reflect the strength and diversification of Priority’s Connected Commerce platform, with over 6% revenue growth and 10% adjusted gross profit growth,” said Tom Priore, Chairman and CEO of Priority. “Our ability to connect payments and treasury solutions across our diverse business segments delivered over 18% revenue growth for Treasury Solutions and 14% growth for Payables, while adjusted gross profit margins expanded by nearly 140 basis points. In addition to the solid financial results, we had several key operational wins during the quarter - launching our dedicated residual financing facility to fuel ISO and ISV partner growth, activating card acquiring in Canada, adding real-time payments, and increasing deposits under administration by $200 million - along with the execution of accretive acquisitions and a 100 basis point reduction in our borrowing costs, reinforcing the strength of our platform which has produced 18% compound annual adjusted EBITDA growth since going public in 2018.”
Highlights of Consolidated Results and Additional Information1
Third Quarter 2025 Financial Highlights compared with Third Quarter 2024
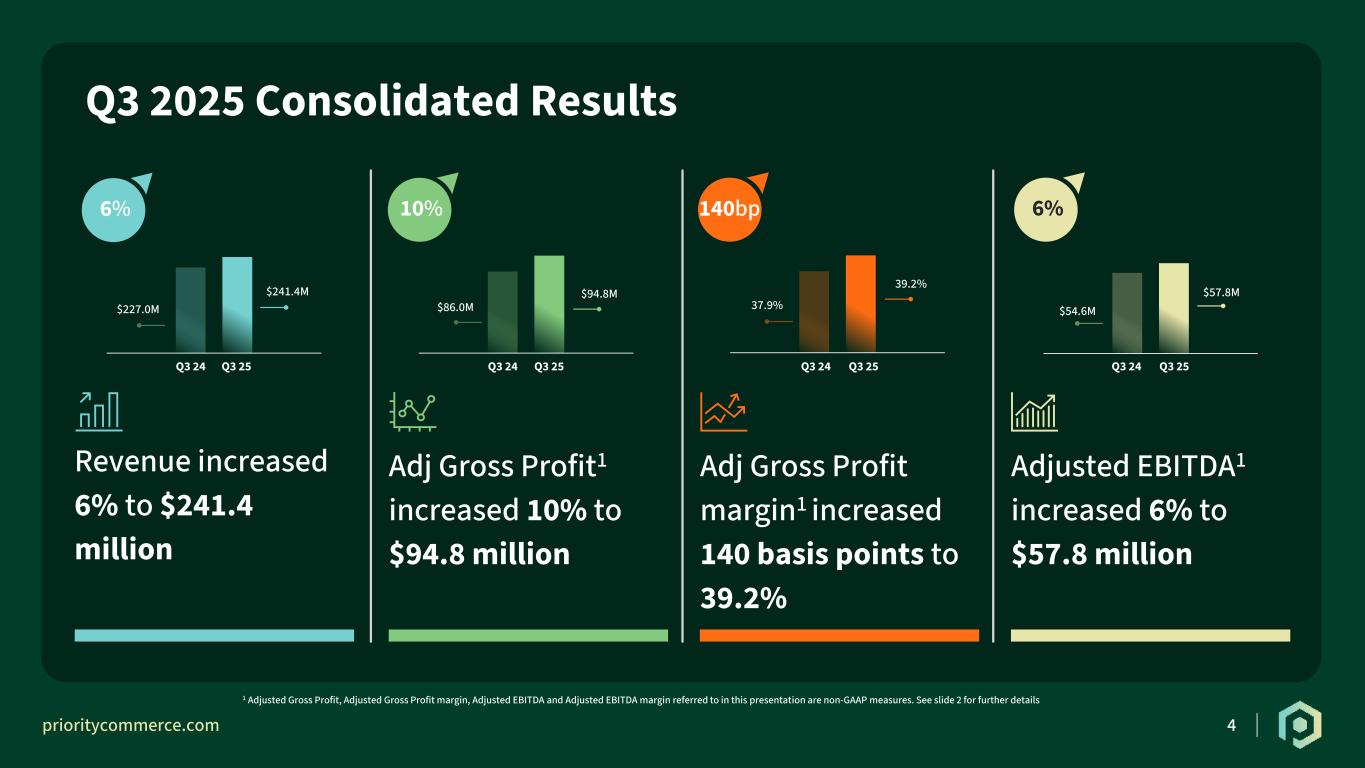
•Revenue of $241.4 million increased 6.3% from $227.0 million
•Adjusted gross profit (a non-GAAP measure2) of $94.8 million increased 10.2% from $86.0 million
•Adjusted gross profit margin (a non-GAAP measure2) of 39.2% increased by nearly 140 basis points from 37.9%
•Operating income of $37.8 million decreased 0.8% from $38.1 million
•Adjusted EBITDA (a non-GAAP measure2) of $57.8 million increased 5.7% from $54.6 million
•Adjusted EPS - diluted (a non-GAAP measure2) of $0.28 increased by $0.10, or 55.6%, from $0.18
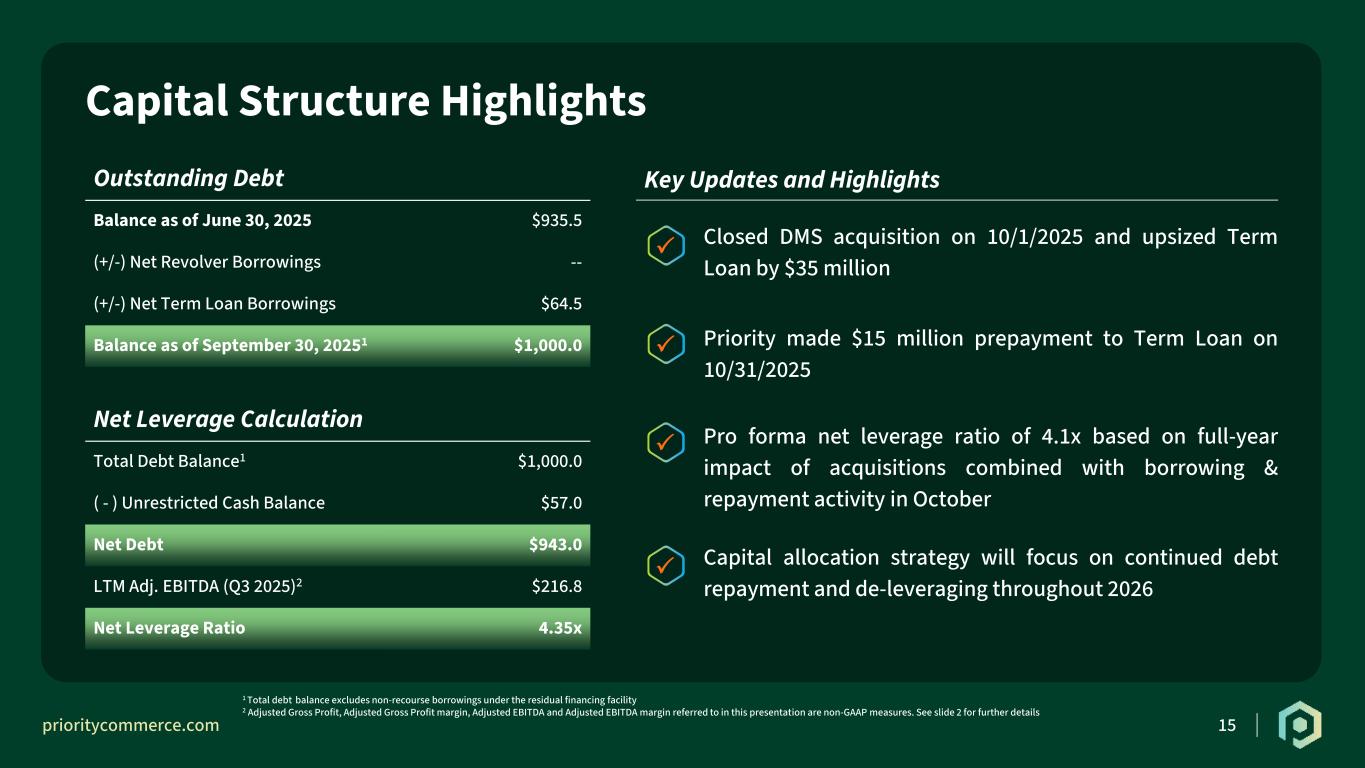
•Driven by strong cash flow performance in 2025, the Company made a $15.0 million voluntary prepayment on its term loan on October 31, 2025.
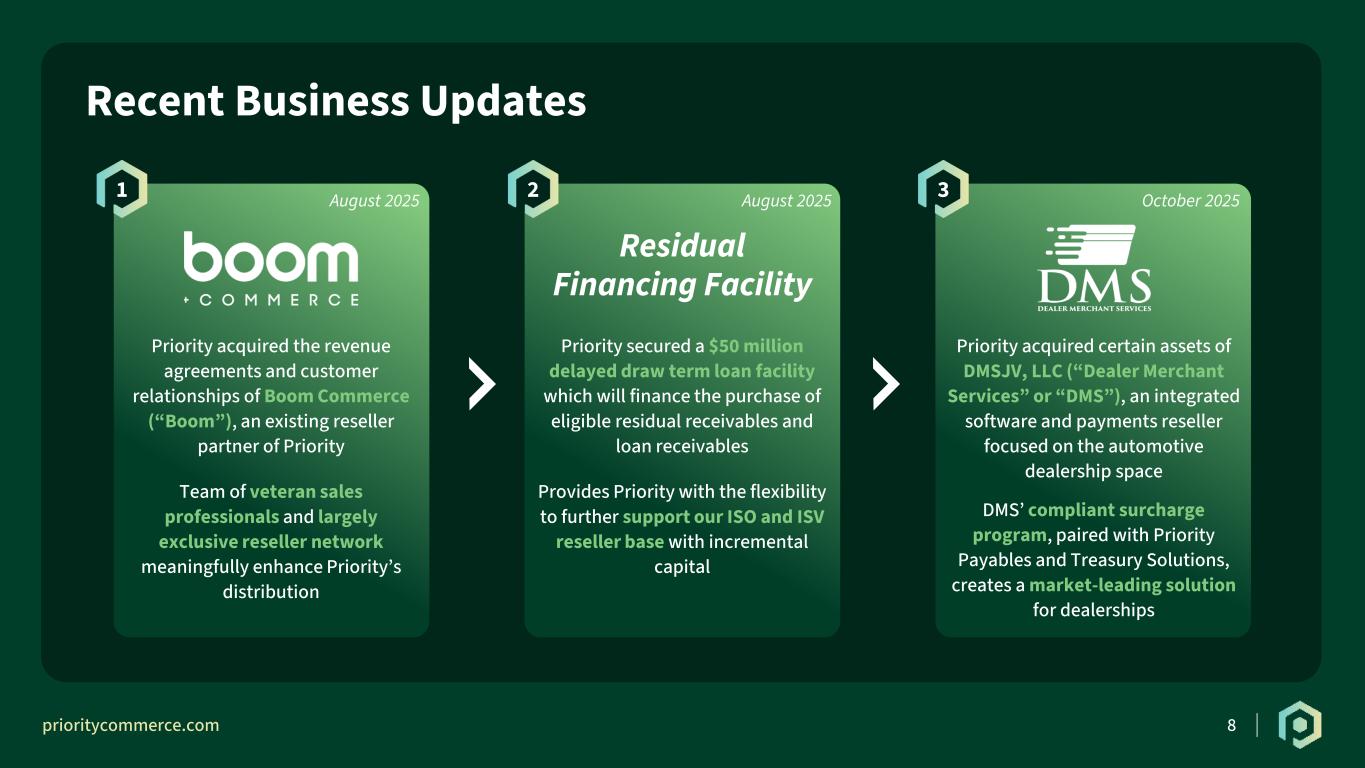
•The Company closed on a new $1.1 billion broadly syndicated credit facility on July 31, 2025, and lowered the interest rate by 100 basis points while increasing liquidity and extending maturity to 2032.
•In August 2025, the Company acquired the assets of Boom Commerce, an existing reseller partner of Priority with proven ability to attract enterprise customers and sell value added services.
•In October 2025, the Company acquired the assets of Dealer Merchant Services, a leading provider of vertically focused software and payments in the automotive dealership arena.
(1)Certain amounts/percentages may not compute accurately due to rounding.
(2)See "Non-GAAP Financial Measures" and the reconciliations of Adjusted Gross Profit (non-GAAP), Adjusted Gross Profit Margin (non-GAAP), Adjusted EBITDA, and Adjusted EPS- diluted (non-GAAP) to their most comparable GAAP measures provided within this document for additional information.
Full Year 2025 Financial Guidance
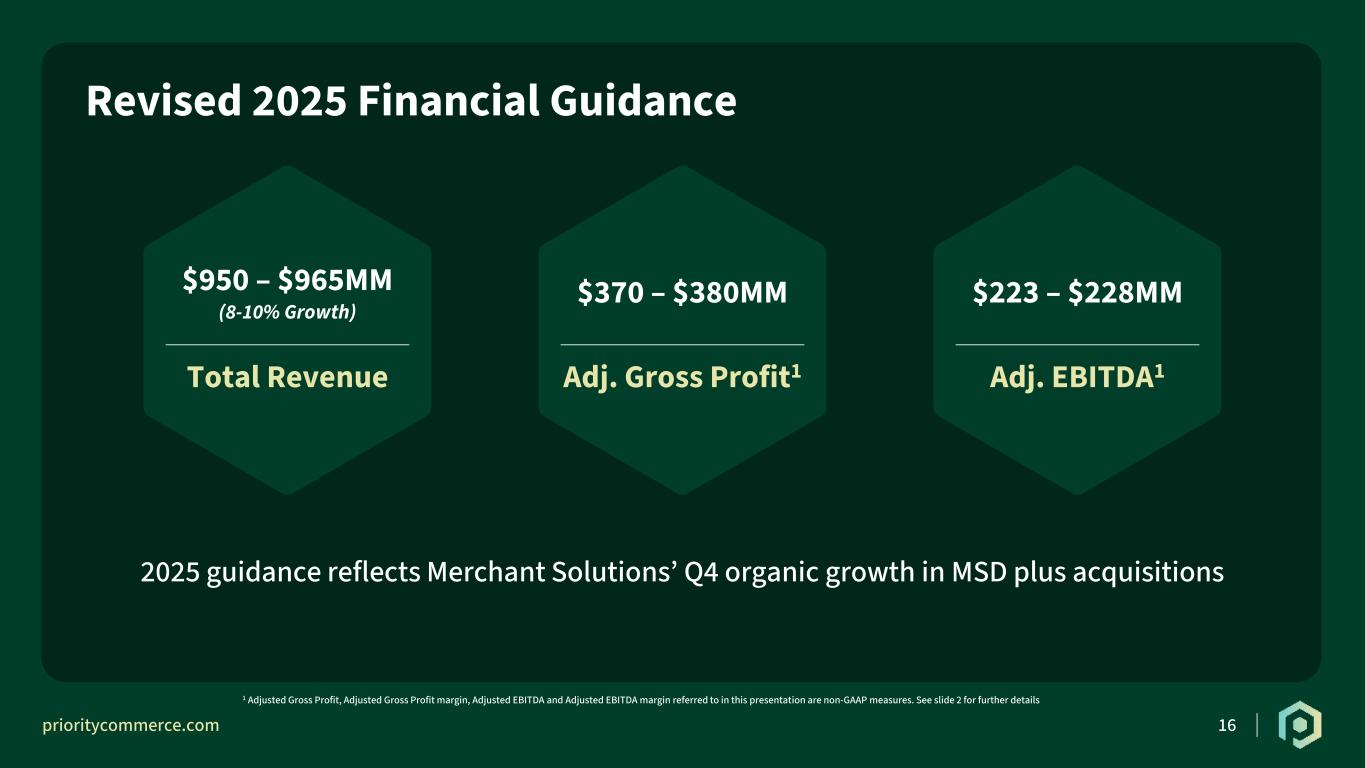
Priority's business remains strong, and we are adjusting our full year 2025 guidance to reflect year to date results combined with our current outlook for the fourth quarter. We anticipate continued strong double-digit revenue growth in Payables and Treasury Solutions will complement mid-single digit organic revenue growth in Merchant Solutions. The adjusted full year 2025 guidance is as follows:
•Revenue forecast to range between $950 million to $965 million, a growth rate of 8% to 10%, compared to fiscal 2024 results.
•Adjusted gross profit (a non-GAAP measure) forecast to range between $370 million and $380 million.
•Adjusted EBITDA (a non-GAAP measure) forecast to range between $223 million to $228 million.
Segment Reporting Update
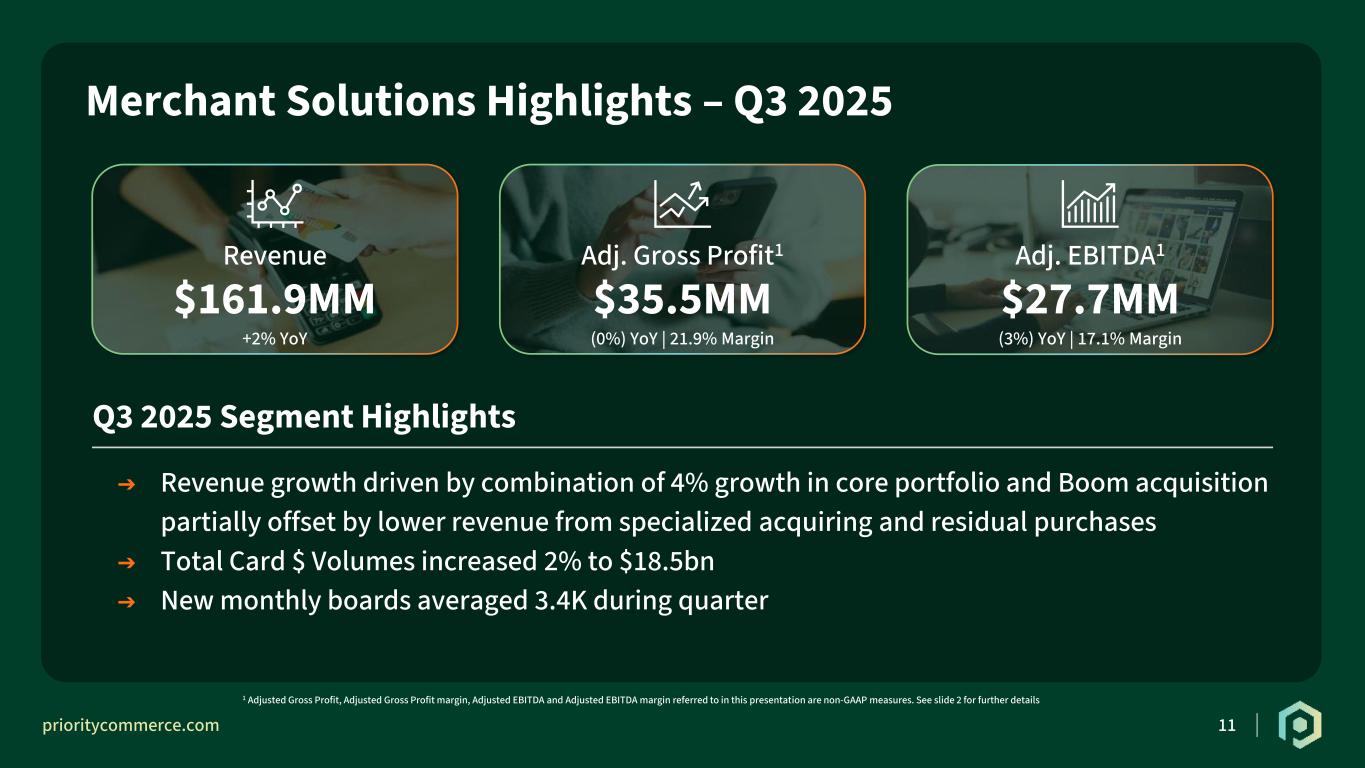
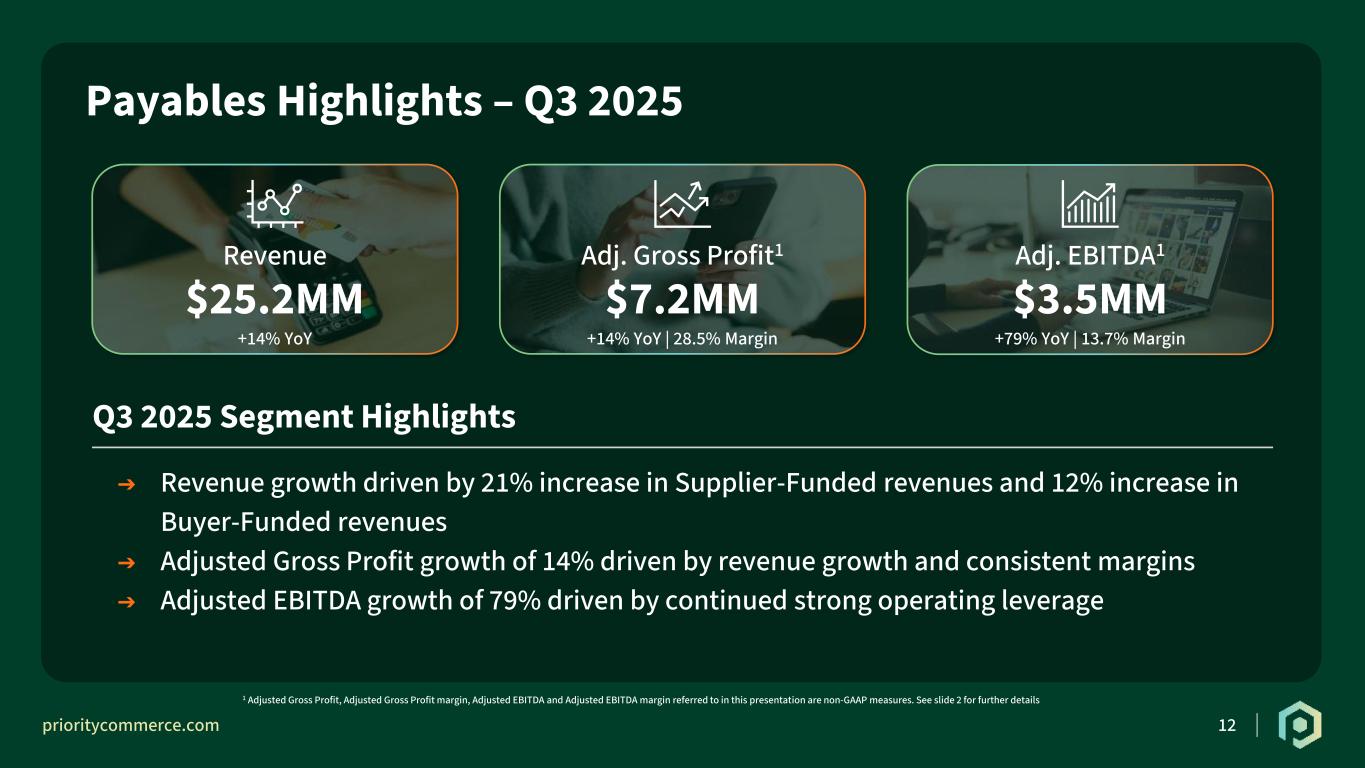
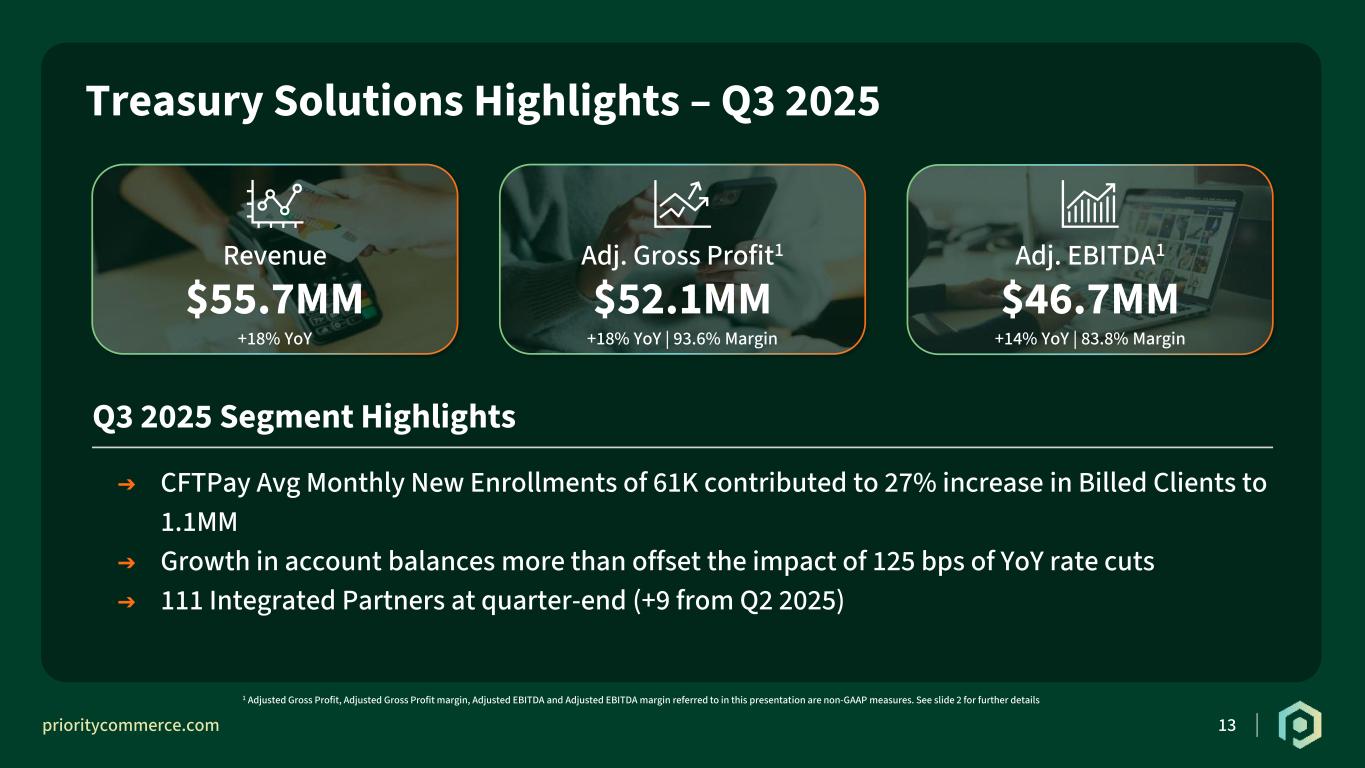
Consistent with the evolution of Priority from its origins as a monoline merchant acquirer over 20 years ago to a diversified commerce platform today, we are renaming our operating segments to better reflect not only their respective solution sets, but the diverse mix of increasingly larger customers they serve. Merchant Solutions, Payables and Treasury Solutions replace SMB, B2B and Enterprise, respectively. The financial results of each respective reporting segment do not change as a result of this rebranding.
Conference Call
The Company will host a conference call on Thursday, November 6, 2025 at 10:00 a.m. EST to discuss its third quarter financial results. Participants can access the call by phone in the U.S. or Canada at (833) 636-1319 or internationally at (412) 902-4286.
The Internet webcast link and accompanying slide presentation can be accessed at https://viavid.webcasts.com/starthere.jsp?ei=1732695&tp_key=493d4ecd35 and will also be posted in the "Investor Relations" section of the Company's website at www.prioritycommerce.com/investors.
An audio replay of the call will be available shortly after the conference call until November 20, 2025, at 11:59 p.m. EST. To listen to the audio replay, dial (844) 512-2921 or (412) 317-6671 and enter conference ID number 10202505. Alternatively, you may access the webcast replay in the "Investor Relations" section of the Company's website at https://ir.prioritycommerce.com/.
Non-GAAP Financial Measures
This communication includes certain non-GAAP financial measures that we regularly review to evaluate our business and trends, measure our performance, prepare financial projections, allocate resources, and make strategic decisions. We believe these non-GAAP measures help to illustrate the underlying financial and business trends relating to our results of operations and comparability between current and prior periods. We also use these non-GAAP measures to establish and monitor operational goals. However, these non-GAAP measures are not superior to or a substitute for prominent measurements calculated in accordance with GAAP. Rather, the non-GAAP measures are meant to be a complement to understanding measures prepared in accordance with GAAP.
Adjusted Gross Profit and Adjusted Gross Profit Margin
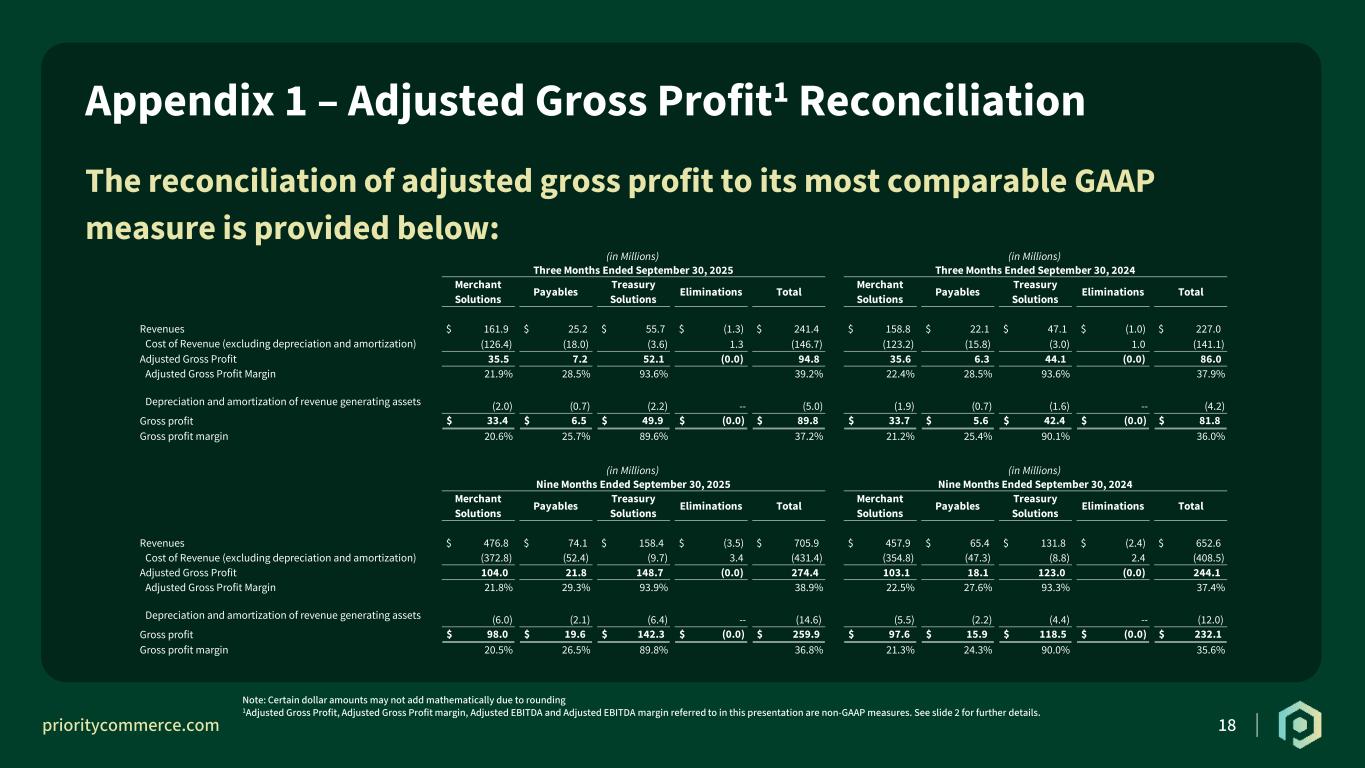
The Company's adjusted gross profit metric represents revenues less cost of revenue (excluding depreciation and amortization). Adjusted gross profit margin is adjusted gross profit divided by revenues. We review these non-GAAP measures to evaluate our underlying profit trends. The reconciliation of adjusted gross profit to its most comparable GAAP measure is provided below:
| | | | | | | | | | | | | | | | | | | | | | | | | | | |
| | | | | | | | | | | |
| (in thousands) | Three Months Ended September 30, | | Nine Months Ended September 30, | |
| 2025 | | 2024 | | 2025 | | 2024 | | | | |
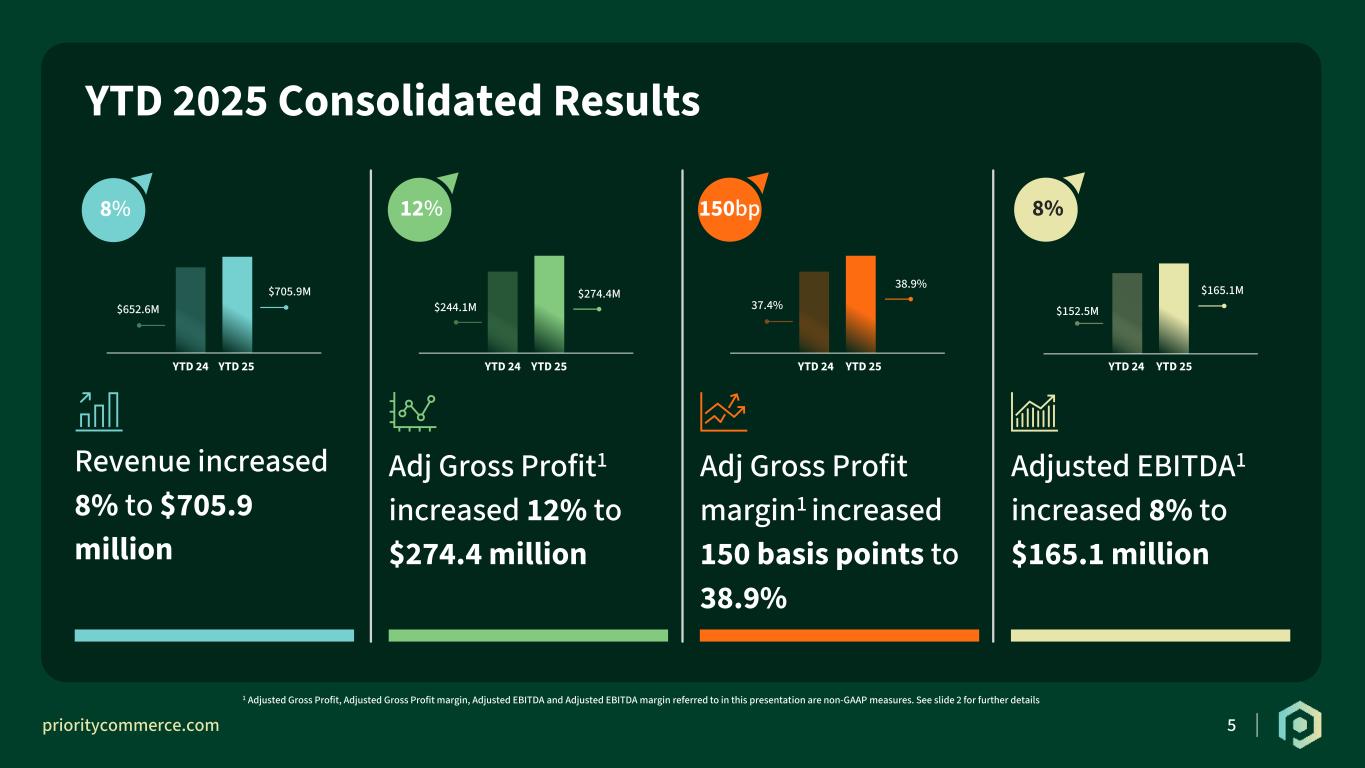
| Revenues | $ | 241,439 | | | $ | 227,049 | | | $ | 705,881 | | | $ | 652,635 | | | | | |
| Cost of revenue (excluding depreciation and amortization) | (146,681) | | | (141,070) | | | (431,433) | | | (408,486) | | | | | |
| Adjusted gross profit | $ | 94,758 | | | $ | 85,979 | | | $ | 274,448 | | | $ | 244,149 | | | | | |
| Adjusted gross profit margin | 39.2 | % | | 37.9 | % | | 38.9 | % | | 37.4 | % | | | | |
| Depreciation and amortization of revenue generating assets | (4,985) | | | (4,207) | | | (14,581) | | | (12,048) | | | | | |
| Gross profit | $ | 89,773 | | | $ | 81,772 | | | $ | 259,867 | | | $ | 232,101 | | | | | |
| Gross profit margin | 37.2 | % | | 36.0 | % | | 36.8 | % | | 35.6 | % | | | | |
EBITDA and Adjusted EBITDA
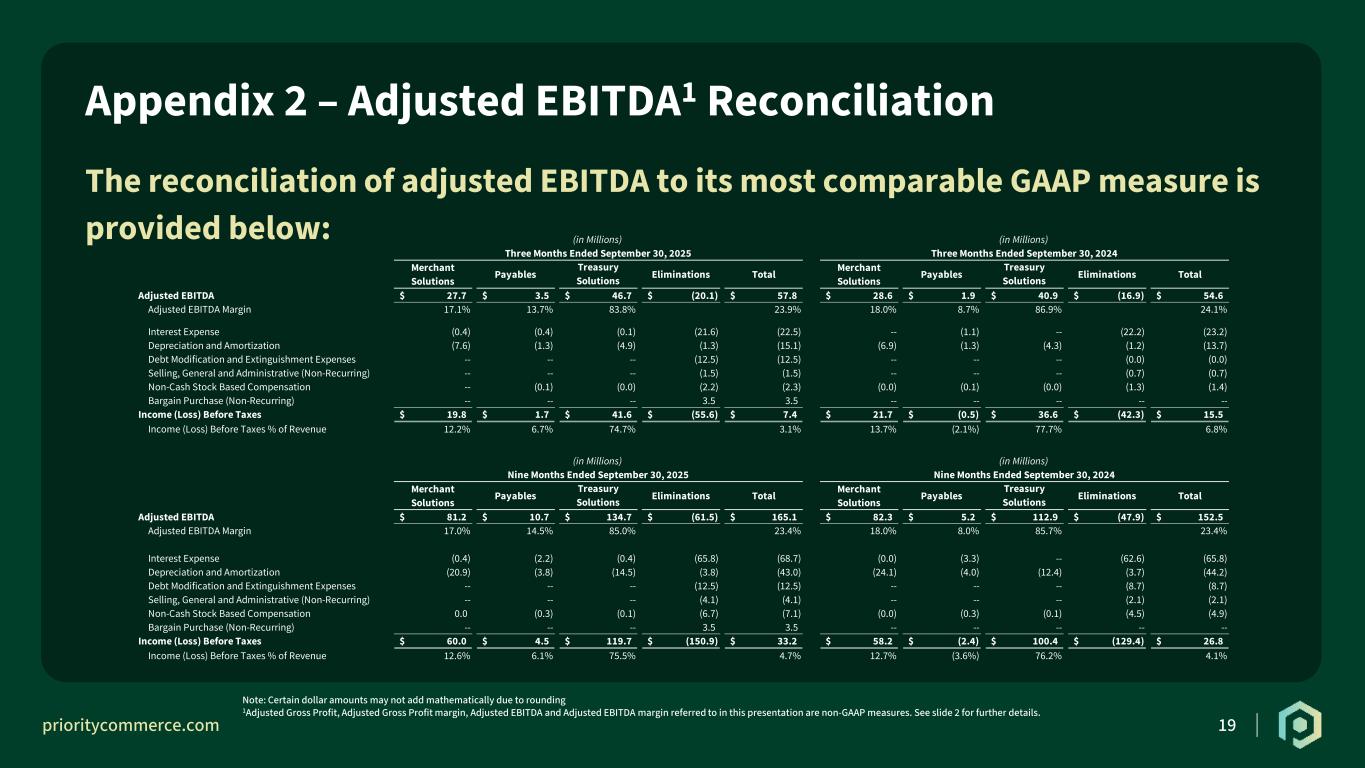
EBITDA and adjusted EBITDA are performance measures. EBITDA is earnings before interest, income tax, and depreciation and amortization expenses ("EBITDA"). Adjusted EBITDA begins with EBITDA but further excludes certain non-cash costs, such as stock-based compensation and the write-off of the carrying value of investments or other assets, as well as debt extinguishment and modification expenses and other expenses and income items considered non-recurring, such as acquisition integration expenses, certain professional fees, and litigation settlements. We review the non-GAAP adjusted EBITDA measure to evaluate our business and trends, measure our performance, prepare financial projections, allocate resources, and make strategic decisions.
The reconciliation of adjusted EBITDA to its most comparable GAAP measure is provided below:
| | | | | | | | | | | | | | | | | | | | | | | | | | | |
| (in thousands) | Three Months Ended September 30, | | Nine Months Ended September 30, | | |
| 2025 | | 2024 | | 2025 | | 2024 | | | | |
| Net income | $ | 27,588 | | | $ | 10,608 | | | $ | 46,735 | | | $ | 16,795 | | | | | |
| Interest expense | 22,463 | | | 23,246 | | | 68,693 | | | 65,836 | | | | | |
| Income tax (benefit) expense | (20,201) | | | 4,899 | | | (13,528) | | | 9,996 | | | | | |
| Depreciation and amortization | 15,122 | | | 13,733 | | | 42,992 | | | 44,230 | | | | | |
| EBITDA | 44,972 | | | 52,486 | | | 144,892 | | | 136,857 | | | | | |
| Debt modification and extinguishment expenses | 12,476 | | | 43 | | | 12,514 | | | 8,666 | | | | | |
| | | | | | | | | | | |
| Selling, general and administrative (non-recurring) | 1,491 | | | 696 | | | 4,085 | | | 2,131 | | | | | |
| Non-cash stock-based compensation | 2,327 | | | 1,416 | | | 7,119 | | | 4,878 | | | | | |
| Bargain purchase gain (non-recurring) | (3,507) | | | — | | | (3,507) | | | — | | | | | |
| Adjusted EBITDA | $ | 57,759 | | | $ | 54,641 | | | $ | 165,103 | | | $ | 152,532 | | | | | |
Further detail of certain of these adjustments, and where these items are recorded in our consolidated statements of operations, is provided below:
| | | | | | | | | | | | | | | | | | | | | | | | | | | |
| (in thousands) | Three Months Ended September 30, | | Nine Months Ended September 30, | |
| 2025 | | 2024 | | 2025 | | 2024 | | | | |
| Selling, general and administrative expenses (non-recurring): | | | | | | | | | | | |
| | | | | | | | | | | |
| Certain legal fees | 833 | | | 552 | | | 2,443 | | | 1,207 | | | | | |
| Professional, accounting and consulting fees | 115 | | | 128 | | | 1,223 | | | 627 | | | | | |
| Other (income) expenses, net | 253 | | | 16 | | | 289 | | | 186 | | | | | |
| | | | | | | | | | | |
| Litigation settlement | 290 | | | — | | | 130 | | | 111 | | | | | |
| $ | 1,491 | | | $ | 696 | | | $ | 4,085 | | | $ | 2,131 | | | | | |
Adjusted Earnings Per Share (Adjusted EPS)
Adjusted EPS is a performance measure. Adjusted EPS is calculated by dividing adjusted net income (loss) attributable to common shareholders by weighted average number shares outstanding for the respective periods.
Adjusted net income attributable to common shareholders begins with net income (loss) attributable to common shareholders adjusted to exclude various items listed below. We believe that adjusted EPS is a measure that is useful to investors and management in understanding our ongoing profitability and in analysis of ongoing profitability trends.
| | | | | | | | | | | | | | | | | | | | | | | | | | |
| (in thousands) | | Three Months Ended September 30, | | Nine Months Ended September 30, |
| | 2025 | | 2024 | | 2025 | | 2024 |
| Reconciliation of Adjusted EPS |
| Net income (loss) attributable to common shareholders | | $ | 27,588 | | | $ | 5,487 | | | $ | 46,735 | | | $ | (20,192) | |
| Non-recurring release of valuation allowance on deferred tax assets | | (21,170) | | | — | | | (20,670) | | | — | |
| Accelerated accretion expense and excise tax attributable to redeemable senior preferred stockholders | | — | | | — | | | — | | | 9,549 | |
| Debt extinguishment and modification costs | | 12,476 | | | 43 | | | 12,514 | | | 8,666 | |
| Stock based compensation | | 2,327 | | | 1,416 | | | 7,119 | | | 4,878 | |
| Other non-recurring expenses | | 1,491 | | | 696 | | | 4,085 | | | 2,131 | |
| Amortization of acquisition related intangible assets | | 10,334 | | | 9,813 | | | 29,065 | | | 32,930 | |
Tax impact of adjustments(1) | | (6,924) | | | (3,111) | | | (13,724) | | | (12,637) | |
| Bargain purchase gain (non-recurring) | | (3,507) | | | — | | | (3,507) | | | — | |
| Adjusted net income attributable to common share holders | | $ | 22,615 | | | $ | 14,344 | | | $ | 61,617 | | | $ | 25,325 | |
| | | | | | | | |
| Weighted average common shares outstanding (basic) | | 80,325 | | | 77,973 | | | 79,366 | | | 77,910 | |
| Effect of dilutive potential common shares | | 791 | | | 2,122 | | | 1,017 | | | — | |
| Weighted average common shares outstanding (diluted) | | 81,116 | | | 80,095 | | | 80,383 | | | 77,910 | |
| | | | | | | | |
| Earnings (loss) per common share: | | | | | | | | |
| Basic | | $ | 0.34 | | | $ | 0.07 | | | $ | 0.59 | | | $ | (0.26) | |
| Diluted | | $ | 0.34 | | | $ | 0.07 | | | $ | 0.58 | | | $ | (0.26) | |
| | | | | | | | |
| Adjusted earnings per common share | | | | | | | | |
| Basic | | $ | 0.28 | | | $ | 0.18 | | | $ | 0.78 | | | $ | 0.33 | |
| Diluted | | $ | 0.28 | | | $ | 0.18 | | | $ | 0.77 | | | $ | 0.33 | |
| | | | | | | | |
| | | | | | | | |
(1) The tax impact calculated using the blended statutory income tax rate (i.e. 26.0% for three and nine months ended September 30, 2025 and 2024)
Priority does not provide a reconciliation of forward-looking non-GAAP financial measures to their comparable GAAP financial measures because it could not do so without unreasonable effort due to the unavailability of the information needed to calculate reconciling items and due to the variability, complexity and limited visibility of the adjusting items that would be excluded from the non-GAAP financial measures in future periods. When planning, forecasting and analyzing future periods, the Company does so primarily on a non-GAAP basis without preparing a GAAP analysis as that would require estimates for various cash and non-cash reconciling items that would be difficult to predict with reasonable accuracy. For example, stock-based compensation expense would be difficult to estimate because it depends on the Company's future hiring and retention needs, as well as the future fair market value of the Company's common stock, all of which are difficult to predict and subject to constant change. As a result, the Company does not believe that a GAAP reconciliation would provide meaningful supplemental information about the Company's outlook.
About Priority Technology Holdings, Inc.
Priority is the payments and banking solution that enables businesses to collect, store, lend and send funds through a unified commerce engine. Our platform combines payables, merchant solutions, and treasury solutions so leaders can streamline financial operations efficiently — and our innovative industry experts help businesses navigate and build momentum on the path to growth. With the Priority Commerce Engine, leaders can accelerate cash flow, optimize working capital, reduce unnecessary costs, and unlock new revenue opportunities. To learn more about Priority (NASDAQ: PRTH), visit prioritycommerce.com
Forward-Looking Statements
This press release contains "forward-looking statements" within the meaning of the Private Securities Litigation Reform Act of 1995. Such statements include, but are not limited to, statements about future financial and operating results, our plans, objectives, expectations and intentions with respect to future operations, products and services, and other statements identified by words such as "may," "will," "should," "anticipates," "believes," "expects," "plans," "future," "intends," "could," "estimate," "predict," "projects," "targeting," "potential" or "contingent," "guidance," "outlook" or words of similar meaning. These forward-looking statements include, but are not limited to, our 2025 outlook and statements regarding our market and growth opportunities. Such forward-looking statements are based upon the current beliefs and expectations of our management and are inherently subject to significant business, economic and competitive risks, trends and uncertainties that could cause actual results to differ materially from those projected, expressed, or implied by such forward-looking statements. Our actual results could differ materially, and potentially adversely, from those discussed or implied herein.
We caution that it is very difficult to predict the impact of known factors, and it is impossible for us to anticipate all factors that could affect our actual results. All forward-looking statements are expressly qualified in their entirety by these cautionary statements. You should evaluate all forward-looking statements made in this press release in the context of the risks and uncertainties disclosed in our SEC filings, including our most recent Annual Report on Form 10-K filed with the SEC on March 6, 2025. These filings are available online at www.sec.gov or www.prioritycommerce.com.
We caution you that the important factors referenced above may not contain all of the factors that are important to you. In addition, we cannot assure you that we will realize the results or developments we expect or anticipate or, even if substantially realized, that they will result in the consequences we anticipate or affect us or our operations in the way we expect. You are cautioned not to place undue reliance on forward-looking statements as a predictor of future performance. The forward-looking statements included in this press release are made only as of the date hereof. We undertake no obligation to publicly update or revise any forward-looking statement as a result of new information, future events or otherwise, except as otherwise required by law. If we do update one or more forward-looking statements, no inference should be made that we will make additional updates with respect to those or other forward-looking statements. We qualify all of our forward-looking statements by these cautionary statements.
Priority Technology Holdings, Inc.
Unaudited Consolidated Statements of Operations and Comprehensive Income (Loss)
(in thousands, except per share amounts)
| | | | | | | | | | | | | | | | | | | | | | | |
| Three Months Ended September 30, | | Nine Months Ended September 30, |
| 2025 | | 2024 | | 2025 | | 2024 |
| Revenues | $ | 241,439 | | $ | 227,049 | | $ | 705,881 | | $ | 652,635 |
| Operating expenses | | | | | | | |
| Cost of revenue (excludes depreciation and amortization) | 146,681 | | 141,070 | | 431,433 | | 408,486 |
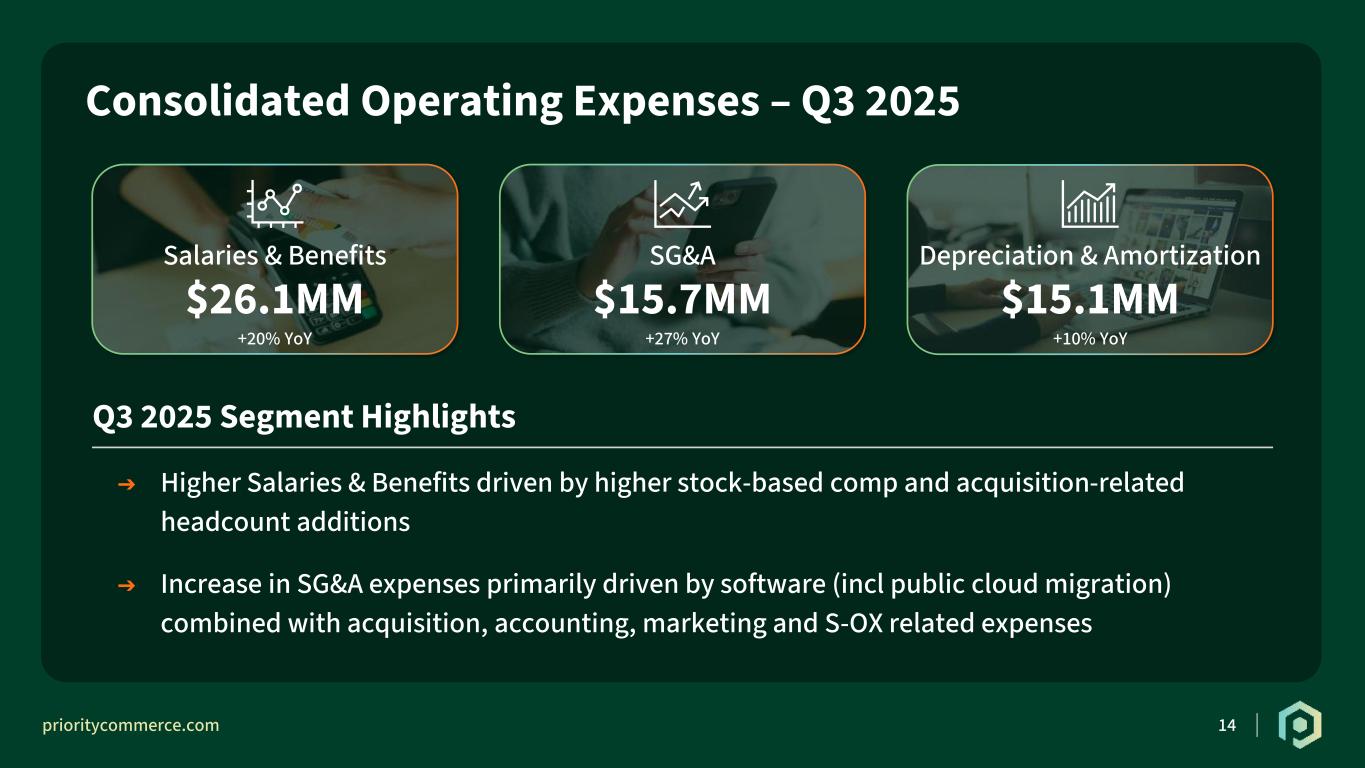
| Salary and employee benefits | 26,140 | | 21,748 | | 78,975 | | 66,017 |
| Depreciation and amortization | 15,122 | | 13,733 | | 42,992 | | 44,230 |
| Selling, general and administrative | 15,724 | | 12,413 | | 44,734 | | 34,620 |
| Total operating expenses | 203,667 | | 188,964 | | 598,134 | | 553,353 |
| Operating income | 37,772 | | 38,085 | | 107,747 | | 99,282 |
| Other (expense) income | | | | | | | |
| Interest expense | (22,463) | | (23,246) | | (68,693) | | (65,836) |
| Debt extinguishment and modification costs | (12,476) | | (43) | | (12,514) | | (8,666) |
| | | | | | | |
| Other income, net | 4,554 | | 711 | | 6,667 | | 2,011 |
| Total other expense, net | (30,385) | | (22,578) | | (74,540) | | (72,491) |
| Income before income taxes | 7,387 | | 15,507 | | 33,207 | | 26,791 |
| Income tax expense | (20,201) | | 4,899 | | (13,528) | | 9,996 |
| Net income | 27,588 | | 10,608 | | 46,735 | | 16,795 |
| Less: Dividends and accretion attributable to redeemable senior preferred stockholders | — | | (5,121) | | — | | (36,348) |
| Less: Return on redeemable NCI | — | | — | | — | | (639) |
| Net income (loss) attributable to common stockholders | 27,588 | | 5,487 | | $ | 46,735 | | $ | (20,192) |
| Other comprehensive income (loss) | | | | | | | |
| Foreign currency translation adjustments | (279) | | | (28) | | | (19) | | | (37) | |
| Comprehensive income (loss) | $ | 27,309 | | $ | 5,459 | | $ | 46,716 | | $ | (20,229) |
| | | | | | | |
| Earnings (loss) per common share: | | | | | | | |
| Basic | $ | 0.34 | | | $ | 0.07 | | | $ | 0.59 | | | $ | (0.26) | |
| | | | | | | |
| Diluted | $ | 0.34 | | | $ | 0.07 | | | $ | 0.58 | | | $ | (0.26) | |
| | | | | | | |
Adjusted earnings per common share(1): | | | | | | | |
| Basic | $ | 0.28 | | | $ | 0.18 | | | $ | 0.78 | | | $ | 0.33 | |
| Diluted | $ | 0.28 | | | $ | 0.18 | | | $ | 0.77 | | | $ | 0.33 | |
| | | | | | | |
| Weighted-average common shares outstanding: | | | | | | | |
| Basic | 80,325 | | | 77,973 | | | 79,366 | | | 77,910 | |
| Diluted | 81,116 | | | 80,095 | | | 80,383 | | | 77,910 | |
| | | | | | | |
| | | | | | | |
(1)Adjusted EPS in a non-GAAP earnings measure. See Adjusted EPS reconciliation for further detail.
Priority Technology Holdings, Inc.
Unaudited Consolidated Balance Sheets
(in thousands)
| | | | | | | | | | | |
| | | |
| September 30, 2025 | | December 31, 2024 |
| Assets | | | |
| Current assets: | | | |
| Cash and cash equivalents | $ | 56,978 | | | $ | 58,600 | |
| Restricted cash | 12,984 | | | 11,090 | |
| Accounts receivable, net of allowances | 92,437 | | | 67,969 | |
| Prepaid expenses and other current assets | 35,042 | | | 22,990 | |
| Current portion of notes receivable, net of allowance | 1,742 | | | 3,638 | |
| Settlement assets | 1,187,417 | | | 940,798 | |
| Total current assets | 1,386,600 | | | 1,105,085 | |
| Notes receivable, less current portion | 11,875 | | | 4,919 | |
| Property, equipment and software, net | 59,306 | | | 52,477 | |
| Goodwill | 382,388 | | | 376,091 | |
| Intangible assets, net | 302,435 | | | 240,874 | |
| Deferred income taxes, net | 50,428 | | | 24,697 | |
| Other noncurrent assets | 24,100 | | | 22,717 | |
| Total assets | $ | 2,217,132 | | | 1,826,860 | |
| Liabilities, Stockholders' Deficit and NCI | | | |
| Current liabilities: | | | |
| Accounts payable and accrued expenses | $ | 65,731 | | | $ | 62,149 | |
| Accrued residual commissions | 38,678 | | | 37,560 | |
| Customer deposits and advance payments | 2,150 | | | 2,246 | |
| Current portion of long-term debt | 10,000 | | | 9,503 | |
| Settlement obligations | 1,188,071 | | | 940,213 | |
| Total current liabilities | 1,304,630 | | | 1,051,671 | |
| Long-term debt, net of current portion, discounts and debt issuance costs | 997,549 | | | 920,888 | |
| Other noncurrent liabilities | 23,467 | | | 19,326 | |
| Total liabilities | 2,325,646 | | | 1,991,885 | |
| | | |
| | | |
| Stockholders' deficit: | | | |
| Preferred stock | — | | | — | |
| Common stock | 82 | | | 77 | |
| Treasury stock, at cost | (22,613) | | | (19,607) | |
| Additional paid-in capital | 12,827 | | | — | |
| Accumulated other comprehensive loss | (195) | | | (176) | |
| Accumulated deficit | (100,399) | | | (147,134) | |
| Total stockholders' deficit attributable to stockholders of Priority | (110,298) | | | (166,840) | |
| Non-controlling interests in consolidated subsidiaries | 1,784 | | | 1,815 | |
| Total stockholders' deficit | (108,514) | | | (165,025) | |
| Total liabilities, stockholders' deficit and NCI | $ | 2,217,132 | | | $ | 1,826,860 | |
Priority Technology Holdings, Inc.
Unaudited Consolidated Statements of Cash Flows
(in thousands)
| | | | | | | | | | | |
| Nine Months Ended September 30, |
| 2025 | | 2024 |
| Cash flows from operating activities: | | | |
| Net income | $ | 46,735 | | | $ | 16,795 | |
| Adjustments to reconcile net income to net cash provided by operating activities: | | | |
| | | |
| Depreciation and amortization of assets | 42,992 | | | 44,230 | |
| Stock-based compensation | 7,119 | | | 4,878 | |
| Amortization of debt issuance costs and discounts | 1,329 | | | 2,250 | |
| Debt extinguishment and modification costs | 12,514 | | | 8,666 | |
| Deferred income tax | (16,090) | | | (2,944) | |
| Change in deferred consideration | 2,449 | | | 3,280 | |
| | | |
| | | |
| Bargain purchase gain | (3,506) | | | |
| Other non-cash items, net | (130) | | | (37) | |
| Change in operating assets and liabilities: | | | |
| Accounts receivable | (22,995) | | | (15,712) | |
| Prepaid expenses and other current assets | (2,054) | | | (2,808) | |
| Income taxes (receivable) payable | (7,669) | | | (3,000) | |
| Notes receivable | — | | | (883) | |
| Accounts payable and accrued expenses | 1,498 | | | 12,864 | |
| Accrued residuals commissions | 1,118 | | | — | |
| Customer deposits and advance payments | (142) | | | 271 | |
| Other noncurrent assets and liabilities, net | (7) | | | (5,998) | |
| Net cash provided by operating activities | 63,161 | | | 61,852 | |
| Cash flows from investing activities: | | | |
| Acquisition of businesses, net of cash acquired | (77,369) | | | — | |
| | | |
| Additions to property, equipment and software | (18,952) | | | (17,044) | |
| Notes receivable, net | (5,060) | | | (216) | |
| Acquisitions of assets and other investing activities | (50,517) | | | (7,474) | |
| | | |
| Net cash used in investing activities | (151,898) | | | (24,734) | |
| Cash flows from financing activities: | | | |
| Proceeds from issuance of long-term debt, net of issue discount | 1,019,714 | | | 830,200 | |
| Debt issuance and modification costs paid | (4,725) | | | (6,901) | |
| Repayments of long-term debt | (945,537) | | | (656,460) | |
| | | |
| | | |
| | | |
| | | |
| Redemption of PHOT redeemable NCI | — | | | (2,130) | |
| Repurchases of shares withheld for taxes | (3,006) | | | (1,208) | |
| Redemption of senior preferred stock | — | | | (136,936) | |
| Redemption of accumulated unpaid dividend on redeemable senior preferred stock | — | | | (30,819) | |
| Dividends paid to redeemable senior preferred stockholders | — | | | (22,099) | |
| | | |
| Proceeds from exercise of stock options | 413 | | | — | |
| Settlement obligations, net | 247,531 | | | 116,065 | |
| Payment of deferred/contingent consideration related to business combination | (19,756) | | | (4,996) | |
| NCI repurchase | (6,000) | | | — | |
| Net cash provided by financing activities | 288,634 | | | 84,716 | |
Priority Technology Holdings, Inc.
Unaudited Consolidated Statements of Cash Flows
(in thousands)
| | | | | | | | | | | |
| Nine Months Ended September 30, |
| 2025 | | 2024 |
| Net change in cash and cash equivalents and restricted cash: | | | |
| Net increase in cash and cash equivalents, and restricted cash | 199,897 | | | 121,834 | |
| Cash and cash equivalents and restricted cash at beginning of period | 993,864 | | | 796,223 | |
| Cash and cash equivalents and restricted cash at end of period | $ | 1,193,761 | | | $ | 918,057 | |
| | | |
| Reconciliation of cash and cash equivalents, and restricted cash: | | | |
| Cash and cash equivalents | $ | 56,978 | | | $ | 41,072 | |
| Restricted cash | 12,984 | | | 13,398 | |
| Cash and cash equivalents included in settlement assets (restricted in nature) | 1,123,799 | | | 863,587 | |
| Total cash and cash equivalents, and restricted cash | $ | 1,193,761 | | | $ | 918,057 | |
Priority Technology Holdings, Inc.
Unaudited Reportable Segments' Results
(in thousands)
| | | | | | | | | | | | | | | | | | | | | | | |
| Three Months Ended September 30, | | Nine Months Ended September 30, |
| | 2025 | | 2024 | | 2025 | | 2024 |
| Merchant Solutions: | | | | | | | |
| Revenues | $ | 161,874 | | | $ | 158,770 | | | $ | 476,794 | | | $ | 457,875 | |
| Adjusted EBITDA | $ | 27,727 | | | $ | 28,644 | | | $ | 81,181 | | | $ | 82,265 | |
| | | | | | | |
| Key Indicators: | | | | | | | |
| Total card processing dollar value | $ | 18,469,447 | | | $ | 18,076,156 | | | $ | 54,822,837 | | | $ | 53,428,816 | |
| Total card transaction count | 230,741 | | | 223,700 | | | 671,233 | | | 642,827 | |
| | | | | | | |
| Payables: | | | | | | | |
| Revenues | $ | 25,162 | | | $ | 22,143 | | | $ | 74,113 | | | $ | 65,368 | |
| Adjusted EBITDA | $ | 3,455 | | | $ | 1,933 | | | $ | 10,741 | | | $ | 5,209 | |
| | | | | | | |
| Key Indicators: | | | | | | | |
| Buyer funded card processing dollar value | $ | 789,700 | | | $ | 700,510 | | | $ | 2,295,100 | | | $ | 2,082,590 | |
| Supplier funded issuing dollar value | $ | 230,882 | | | $ | 255,323 | | | $ | 688,399 | | | $ | 732,589 | |
| ACH transaction count | 14,451 | | | 11,042 | | | 41,085 | | | 29,621 | |
| | | | | | | |
| Treasury Solutions: | | | | | | | |
| Revenues | $ | 55,684 | | | $ | 47,099 | | | $ | 158,430 | | | $ | 131,758 | |
| Adjusted EBITDA | $ | 46,676 | | | $ | 40,940 | | | $ | 134,677 | | | $ | 112,911 | |
| | | | | | | |
| Key Indicators: | | | | | | | |
| Average CFTPay billed clients | 1,054,238 | | | 832,351 | | | 995,660 | | | 766,370 | |
| Average CFTPay monthly enrollments | 61,185 | | | 62,875 | | | 58,316 | | | 57,281 | |
Average total account balances(1) | $ | 1,248,432 | | | $ | 900,690 | | | $ | 1,145,164 | | | $ | 847,486 | |
| | | | | | | |
| | | | | | | |
| | | | | | | |
(1) This represents the average total account balance during the three and nine months ended on September 30, 2025, in the Treasury solutions segment, and excludes the deposits and balances maintained in the Merchant Solution and Payables segment. The total account and deposit balances as of September 30, 2025, were $1.6 billion.
Priority Technology Holdings, Inc.
Unaudited Reportable Segments' Results
(in thousands)
| | | | | | | | | | | | | | | | | | | | | | | | | | | | | | | | |
| | Three Months Ended September 30, 2025 |
| | Merchant Solutions | | Payables | | Treasury Solutions | | Corporate | | Total Consolidated |
| Reconciliation of Adjusted EBITDA to GAAP Measure: |
| Adjusted EBITDA | | $ | 27,727 | | | $ | 3,455 | | | $ | 46,676 | | | $ | (20,099) | | | $ | 57,759 | |
| Interest expense | | (357) | | | (361) | | | (143) | | | (21,602) | | | (22,463) | |
| Depreciation and amortization | | (7,607) | | | (1,275) | | | (4,924) | | | (1,316) | | | (15,122) | |
| Debt modification and extinguishment expenses | | — | | | — | | | — | | | (12,476) | | | (12,476) | |
| Selling, general and administrative (non-recurring) | | — | | | — | | | — | | | (1,491) | | | (1,491) | |
| Non-cash stock based compensation | | — | | | (133) | | | (33) | | | (2,161) | | | (2,327) | |
| Bargain purchase gain (non-recurring) | | — | | | — | | | — | | | 3,507 | | | 3,507 | |
| Income (loss) before taxes | | $ | 19,763 | | | $ | 1,686 | | | $ | 41,576 | | | $ | (55,638) | | | $ | 7,387 | |
| Income tax expense | | | | | | | | | | 20,201 | |
| Net income | | | | | | | | | | $ | 27,588 | |
| | | | | | | | | | |
| | | | | | | | | | | | | | | | | | | | | | | | | | | | | | | | |
| | Nine Months Ended September 30, 2025 |
| | Merchant Solutions | | Payables | | Treasury Solutions | | Corporate | | Total Consolidated |
| Reconciliation of Adjusted EBITDA to GAAP Measure: |
| Adjusted EBITDA | | $ | 81,181 | | | $ | 10,741 | | | $ | 134,677 | | | $ | (61,496) | | | $ | 165,103 | |
| Interest expense | | (357) | | | (2,158) | | | (385) | | | (65,793) | | | (68,693) | |
| Depreciation and amortization | | (20,865) | | | (3,798) | | | (14,507) | | | (3,822) | | | (42,992) | |
| Debt modification and extinguishment expenses | | — | | | — | | | — | | | (12,514) | | | (12,514) | |
| Selling, general and administrative (non-recurring) | | — | | | — | | | — | | | (4,085) | | | (4,085) | |
| Non-cash stock based compensation | | 1 | | | (301) | | | (98) | | | (6,721) | | | (7,119) | |
| Bargain purchase gain (non-recurring) | | — | | | — | | | — | | | 3,507 | | | 3,507 | |
| Income (loss) before taxes | | $ | 59,960 | | | $ | 4,484 | | | $ | 119,687 | | | $ | (150,924) | | | $ | 33,207 | |
| Income tax expense | | | | | | | | | | 13,528 | |
| Net income | | | | | | | | | | $ | 46,735 | |
| | | | | | | | | | |
| | | | | | | | | | | | | | | | | | | | | | | | | | | | | | | | |
| | Three Months Ended September 30, 2024 |
| | Merchant Solutions | | Payables | | Treasury Solutions | | Corporate | | Total Consolidated |
| Reconciliation of Adjusted EBITDA to GAAP Measure: |
| Adjusted EBITDA | | $ | 28,644 | | | $ | 1,933 | | | $ | 40,940 | | | $ | (16,876) | | | $ | 54,641 | |
| Interest expense | | — | | | (1,066) | | | — | | | (22,180) | | | (23,246) | |
| Depreciation and amortization | | (6,939) | | | (1,261) | | | (4,304) | | | (1,229) | | | (13,733) | |
| Debt modification and extinguishment expenses | | — | | | — | | | — | | | (43) | | | (43) | |
| Selling, general and administrative (non-recurring) | | — | | | — | | | — | | | (696) | | | (696) | |
| Non-cash stock based compensation | | (4) | | | (73) | | | (33) | | | (1,306) | | | (1,416) | |
| Income (loss) before taxes | | $ | 21,701 | | | $ | (467) | | | $ | 36,603 | | | $ | (42,330) | | | $ | 15,507 | |
| Income tax expense | | | | | | | | | | (4,899) | |
| Net income | | | | | | | | | | $ | 10,608 | |
Priority Technology Holdings, Inc.
Unaudited Reportable Segments' Results
(in thousands)
| | | | | | | | | | | | | | | | | | | | | | | | | | | | | | | | |
| | Nine Months Ended September 30, 2024 |
| | Merchant Solutions | | Payables | | Treasury Solutions | | Corporate | | Total Consolidated |
| Reconciliation of Adjusted EBITDA to GAAP Measure: |
| Adjusted EBITDA | | $ | 82,265 | | | $ | 5,209 | | | $ | 112,911 | | | $ | (47,853) | | | $ | 152,532 | |
| Interest expense | | (1) | | | (3,280) | | | — | | | (62,555) | | | (65,836) | |
| Depreciation and amortization | | (24,065) | | | (3,992) | | | (12,431) | | | (3,742) | | | (44,230) | |
| Debt modification and extinguishment expenses | | — | | | — | | | — | | | (8,666) | | | (8,666) | |
| Selling, general and administrative (non-recurring) | | — | | | — | | | — | | | (2,131) | | | (2,131) | |
| Non-cash stock based compensation | | (12) | | | (299) | | | (98) | | | (4,469) | | | (4,878) | |
| Income (loss) before taxes | | $ | 58,187 | | | $ | (2,362) | | | $ | 100,382 | | | $ | (129,416) | | | $ | 26,791 | |
| Income tax expense | | | | | | | | | | (9,996) | |
| Net income | | | | | | | | | | $ | 16,795 | |
| | | | | | | | | | |