pump-20220503
false0001680247true00016802472022-05-032022-05-030001680247pump:CommonStockParValue0.001PerShareMember2022-05-032022-05-030001680247pump:PreferredStockPurchaseRightsMember2022-05-032022-05-03

UNITED STATES
SECURITIES AND EXCHANGE COMMISSION
WASHINGTON, D.C. 20549 
FORM 8-K

CURRENT REPORT
PURSUANT TO SECTION 13 OR 15(d) OF THE
SECURITIES EXCHANGE ACT OF 1934
Date of report (Date of earliest event reported): May 3, 2022
ProPetro Holding Corp.
(Exact name of registrant as specified in its charter)
 
Delaware 001-38035 26-3685382
(State or Other Jurisdiction
of Incorporation)
 (Commission
File Number)
 (IRS Employer
Identification No.)

1706 South Midkiff,
Midland, Texas 79701
(Address of principal executive offices)
(432) 688-0012
(Registrant’s telephone number, including area code
Check the appropriate box below if the Form 8-K filing is intended to simultaneously satisfy the filing obligation of the registrant under any of the following provisions (see General Instruction A.2 below): 
Written communications pursuant to Rule 425 under the Securities Act (17 CFR 230.425)
Soliciting material pursuant to Rule 14a-12 under the Exchange Act (17 CFR 240.14a-12)
Pre-commencement communications pursuant to Rule 14d-2(b) under the Exchange Act (17 CFR 240.14d-2(b))
Pre-commencement communications pursuant to Rule 13e-4(c) under the Exchange Act (17 CFR 240.13e-4(c))
 
Securities registered pursuant to Section 12(b) of the Act:
Title of each classTrading Symbol(s)Name of each exchange on which registered
Common Stock, par value $0.001 per sharePUMPNew York Stock Exchange
Preferred Stock Purchase RightsN/ANew York Stock Exchange

Indicate by check mark whether the registrant is an emerging growth company as defined in Rule 405 of the Securities Act of 1933 (17 CFR230.405) of Rule 12b-2 of the Securities Exchange Act of 1934 (17 CFR 240.12b-2).
   Emerging growth company
If an emerging growth company, indicate by check mark if the registrant has elected not to use the extended transition period for complying with any new or revised financial accounting standards provided pursuant to Section 13(a) of the Exchange Act. o


Item 2.02 Results of Operations and Financial Condition.

          On May 3, 2022, ProPetro Holding Corp. (the “Company”) issued a press release announcing its results for the quarter ended March 31, 2022. The full text of the press release issued in connection with the announcement is furnished as Exhibit 99.1 to this Current Report on Form 8-K.
          On May 3, 2022, the Company posted an investor presentation to its website pertaining to the financial and operational results for the quarter ended March 31, 2022. The presentation is posted on the Company's website at ir.propetroservices.com/presentations and attached hereto as Exhibit 99.2.
          The information furnished with this report, including Exhibit 99.1 and Exhibit 99.2, shall not be deemed to be “filed” for purposes of Section 18 of the Securities Exchange Act of 1934, as amended (the “Exchange Act”), or otherwise subject to the liabilities of that section, nor shall it be deemed to be incorporated by reference into any other filing under the Securities Act of 1933, as amended, or the Exchange Act, except as expressly set forth by specific reference in such a filing.
Item 9.01 Financial Statements and Exhibits.

(d) Exhibits.
Exhibit
Number
 Description of Exhibit
  
99.1
99.2


SIGNATURE

Pursuant to the requirements of the Securities Exchange Act of 1934, the registrant has duly caused this report to be signed on its behalf by the undersigned hereunto duly authorized.

Date: May 3, 2021
 
PROPETRO HOLDING CORP.
 
/s/ David S. Schorlemer
David S. Schorlemer
Chief Financial Officer


EXHIBIT 99.1

ProPetro Reports Financial Results for the First Quarter of 2022
MIDLAND, TX, May 3, 2022, (Business Wire) – ProPetro Holding Corp. ("ProPetro" or "the Company") (NYSE: PUMP) today announced financial and operational results for the first quarter of 2022.
First Quarter 2022 and Recent Highlights
Total revenue for the quarter increased 15% to $283 million compared to $246 million for the fourth quarter of 2021.
Net income for the quarter was $12 million, or $0.11 per diluted share, compared to net loss of $20 million, or $0.20 per diluted share, for the fourth quarter of 2021.
Adjusted EBITDA(1) for the quarter increased 81% to $67 million or 24% of revenues compared to $37 million for the fourth quarter of 2021.
Effective utilization for the first quarter improved 9.6% to 13.7 fleets compared to 12.5 fleets for the fourth quarter of 2021 without expanding marketed fleet count.
Net cash provided by operating activities for the quarter of $25 million as compared to $45 million for the fourth quarter of 2021.
Negative Free Cash Flow(2) for the quarter was approximately $39 million as compared to positive Free Cash Flow of approximately $26 million for the fourth quarter of 2021.
Achieved a Company record of over 600 monthly pumping hours on a single Simul-Frac fleet in March.
(1) Adjusted EBITDA is a Non-GAAP financial measure and is described and reconciled to net income (loss) in the table under “Non-GAAP Financial Measures”.
(2) Free Cash Flow is a Non-GAAP financial measure and is described and reconciled to cash from operating activities in the table under “Non-GAAP Financial Measures".


Sam Sledge, Chief Executive Officer, commented, “Despite operational headwinds mainly attributable to sand-related issues in the first quarter, our team achieved healthy margin expansion and a high utilization rate without expanding our marketed fleet count from the previous quarter. We attribute this success to the hard work and effort our team put into executing on our returns-focused strategy to take advantage of improved market conditions and increased demand for our services, all bolstered by first-in-class service at the wellsite. We expect this trend to continue as we take deliveries and deploy more of our Tier IV Dynamic Gas Blending ("DGB" or "dual-fuel") conversions in the coming weeks and months. That said, we anticipate the balance of the year to be challenging as managing input costs, supply chain pressures, human capital, and operational risks will only become more difficult as the pressure pumping market tightens further."
1

EXHIBIT 99.1

David Schorlemer, Chief Financial Officer, commented, "We are encouraged with the significant improvement in our margins during the first quarter. However, we remain committed to our strict fleet deployment strategy and focus on our pursuit of margin-over-market share. Remaining focused on capital-efficient growth through pricing improvements and efficient operations, while continuing to make strategic investments to transition our pressure pumping assets to lower-emissions and natural gas-powered equipment, is the foundation of the Company's returns-focused strategy."
First Quarter 2022 Financial Summary
Revenue for the first quarter of 2022 was $283 million, compared to revenue of $246 million for the fourth quarter of 2021. The 15% increase was attributable to our increased effectively utilized fleet count of 13.7 fleets, from 12.5 fleets in the fourth quarter of 2021 and improved pricing across our fleets in the first quarter of 2022.
Cost of services, excluding depreciation and amortization of approximately $32 million, for the first quarter of 2022 increased to $197 million from $187 million during the fourth quarter of 2021. The 5% increase was attributable to the increased operational activity levels in the first quarter of 2022.
General and administrative expense of $32 million for the first quarter of 2022 increased from $24 million in the fourth quarter of 2021. General and administrative expense, exclusive of a net expense of $13 million relating to a non-recurring net legal expense of approximately $2 million and non-cash items consisting of stock-based compensation of approximately $11 million, was $19 million, or 7% of revenue, for the first quarter of 2022 compared to 9% of revenue for the fourth quarter of 2021. The decrease in our general and administrative expense as a percentage of revenue was driven by higher revenue in the first quarter and benefits from our cost optimization initiatives.
Net income for the first quarter of 2022 totaled $12 million, or $0.11 per diluted share, compared to net loss of $20 million, or $0.20 per diluted share, for the fourth quarter of 2021. Net income benefitted from a non-recurring state tax refund of approximately $11 million.
Adjusted EBITDA increased to $67 million for the first quarter of 2022 from $37 million for the fourth quarter of 2021. The increase in Adjusted EBITDA was primarily attributable to increased activity, fleet repositioning and improved pricing across our fleet.
Liquidity and Capital Spending
As of March 31, 2022, total cash was $71 million and the Company remained debt free. Total liquidity at the end of the first quarter of 2022 was $127 million including cash and $56 million of available capacity under the Company’s revolving credit facility.
2

EXHIBIT 99.1

Capital expenditures incurred during the first quarter of 2022 were $72 million, the majority of which related to maintenance expenditures and our previously announced Tier IV DGB conversions. Net cash used in investing activities from our statement of cash flow during the first quarter of 2022 was $64 million.
Outlook
Mr. Sledge concluded, "Our team is encouraged by the step change in performance during the first quarter. However, the operational and logistical headwinds we experienced validate our belief that operating margins in pressure pumping do not reflect levels needed to justify the additional risk ProPetro assumes in marketing and deploying any additional horsepower. This is especially true in a market that is currently near sold-out levels and where operating margins should continue to expand. As a result, we continue to concentrate efforts on optimizing the full-cycle cash-on-cash return profiles of our currently operating fleets and do not expect to market additional capacity in the second quarter.
As previously mentioned, we will continue to strategically convert many of our conventional diesel assets into more marketable natural gas-powered equipment that will be placed with E&P’s that have core acreage positions and sizeable drilling inventories. Above all else, we are most focused on operating our business and collaborating with customers in a manner that allows us to significantly expand our earnings power and create value for all stakeholders in the ProPetro value chain. This will be accomplished through intense operational and financial discipline that we believe mimics the actions exhibited by many of our upstream partners and customers over the past few years.”

Conference Call Information
The Company will host a conference call at 8:00 AM Central Time on Wednesday, May 4, 2022, to discuss financial and operating results for the first quarter of 2022. The call will also be webcast on ProPetro’s website at www.propetroservices.com. To access the conference call, U.S. callers may dial toll free 1-844-340-9046 and international callers may dial 1-412-858-5205. Please call ten minutes ahead of the scheduled start time to ensure a proper connection. A replay of the conference call will be available for one week following the call and can be accessed toll free by dialing 1-877-344-7529 for U.S. callers, 1-855-669-9658 for Canadian callers, as well as 1-412-317-0088 for international callers. The access code for the replay is 5730343.
About ProPetro
ProPetro Holding Corp. is a Midland, Texas-based oilfield services company providing pressure pumping and other complementary services to leading upstream oil and gas companies
3

EXHIBIT 99.1

engaged in the exploration and production of North American unconventional oil and natural gas resources. For more information visit www.propetroservices.com.
Forward-Looking Statements
Except for historical information contained herein, the statements and information in this news release are forward-looking statements that are made pursuant to the Safe Harbor Provisions of the Private Securities Litigation Reform Act of 1995. Statements that are predictive in nature, that depend upon or refer to future events or conditions or that include the words “may,” “could,” “plan,” “project,” “budget,” “predict,” “pursue,” “target,” “seek,” “objective,” “believe,” “expect,” “anticipate,” “intend,” “estimate,” and other expressions that are predictions of, or indicate, future events and trends and that do not relate to historical matters identify forward‑looking statements. Our forward‑looking statements include, among other matters, statements about our business strategy, industry, future profitability, expected fleet utilization, sustainability efforts, the future performance of newly improved technology, expected capital expenditures and the impact of such expenditures on our performance and capital programs. A forward‑looking statement may include a statement of the assumptions or bases underlying the forward‑looking statement. We believe that we have chosen these assumptions or bases in good faith and that they are reasonable.
Although forward‑looking statements reflect our good faith beliefs at the time they are made, forward-looking statements are subject to a number of risks and uncertainties that may cause actual events and results to differ materially from the forward-looking statements. Such risks and uncertainties include the volatility of oil prices, the operational disruption and market volatility resulting from the COVID-19 pandemic, the global macroeconomic uncertainty related to the Russia-Ukraine war, and other factors described in the Company's Annual Report on Form 10-K and Quarterly Reports on Form 10-Q, particularly the “Risk Factors” sections of such filings, and other filings with the Securities and Exchange Commission (the “SEC”). In addition, the Company may be subject to currently unforeseen risks that may have a materially adverse impact on it, including matters related to shareholder litigation. Accordingly, no assurances can be given that the actual events and results will not be materially different than the anticipated results described in the forward-looking statements. Readers are cautioned not to place undue reliance on such forward-looking statements and are urged to carefully review and consider the various disclosures made in the Company’s Annual Report on Form 10-K, Quarterly Reports on Form 10-Q and other filings made with the SEC from time to time that disclose risks and uncertainties that may affect the Company’s business. The forward-looking statements in this news release are made as of the date of this news release. ProPetro does not undertake, and expressly disclaims, any duty to publicly update these statements, whether as a result of new information, new developments or otherwise, except to the extent that disclosure is required by law.

4

EXHIBIT 99.1


Investor Contacts:

Josh Jones
Director of Finance
[email protected]
432-276-3389

Matt Augustine
Investor Relations
[email protected]
432-848-0871

###
5

EXHIBIT 99.1


PROPETRO HOLDING CORP.
CONDENSED CONSOLIDATED STATEMENTS OF OPERATIONS
(In thousands, except per share data)
(Unaudited)

Three Months Ended
March 31, 2022December 31, 2021March 31, 2021
REVENUE - Service revenue$    282,680$    246,070$    161,458
COSTS AND EXPENSES
Cost of services (exclusive of depreciation and amortization)197,271187,361123,378
General and administrative (inclusive of stock-based compensation)31,70723,84320,201
Depreciation and amortization31,85433,12433,478
Loss on disposal of assets16,11724,14513,052
Total costs and expenses276,949268,473190,109
OPERATING INCOME (LOSS)5,731(22,403)(28,651)
OTHER INCOME (EXPENSE):
Interest expense(134)(137)(176)
Other income (expense)10,357(305)1,789
Total other income (expense)10,223(442)1,613
INCOME (LOSS) BEFORE INCOME TAXES15,954(22,845)(27,038)
INCOME TAX (EXPENSE) BENEFIT(4,137)2,6136,663
NET INCOME (LOSS)$    11,817$    (20,232)$    (20,375)
NET INCOME (LOSS) PER COMMON SHARE:
Basic$    0.11$    (0.20)$    (0.20)
Diluted$    0.11$    (0.20)$    (0.20)
WEIGHTED AVERAGE COMMON SHARES OUTSTANDING:
Basic103,683103,390101,550
Diluted105,384103,390101,550

6

EXHIBIT 99.1


PROPETRO HOLDING CORP.
CONDENSED CONSOLIDATED BALANCE SHEETS
(In thousands, except share data)
(Unaudited)

March 31, 2022December 31, 2021
ASSETS
CURRENT ASSETS:
Cash and cash equivalents$    70,768$    111,918
Accounts receivable - net of allowance for credit losses of $217 and $217, respectively172,180128,148
Inventories2,2973,949
Prepaid expenses5,0926,752
Other current assets491297
Total current assets250,828251,064
PROPERTY AND EQUIPMENT - net of accumulated depreciation831,625808,494
OPERATING LEASE RIGHT-OF-USE ASSETS909409
OTHER NONCURRENT ASSETS:
Other noncurrent assets1,0891,269
Total other noncurrent assets1,0891,269
TOTAL ASSETS$    1,084,451$    1,061,236
LIABILITIES AND SHAREHOLDERS’ EQUITY
CURRENT LIABILITIES:
Accounts payable$    151,668$    152,649
Operating lease liabilities685369
Accrued and other current liabilities19,73820,767
Total current liabilities172,091173,785
DEFERRED INCOME TAXES64,87861,052
NONCURRENT OPERATING LEASE LIABILITIES27097
Total liabilities237,239234,934
COMMITMENTS AND CONTINGENCIES
SHAREHOLDERS’ EQUITY:
Preferred stock, $0.001 par value, 30,000,000 shares authorized, none issued, respectively
Common stock, $0.001 par value, 200,000,000 shares authorized, 103,999,626 and 103,437,177 shares issued, respectively104103
Additional paid-in capital853,921844,829
Accumulated deficit(6,813)(18,630)
Total shareholders’ equity847,212826,302
TOTAL LIABILITIES AND SHAREHOLDERS’ EQUITY$    1,084,451$    1,061,236
7

EXHIBIT 99.1


PROPETRO HOLDING CORP.
CONDENSED CONSOLIDATED STATEMENTS OF CASH FLOWS
(In thousands)
(Unaudited)
Three Months Ended March 31,
20222021
CASH FLOWS FROM OPERATING ACTIVITIES:
Net income (loss)$    11,817$    (20,375)
Adjustments to reconcile net income (loss) to net cash provided by operating activities:
Depreciation and amortization31,85433,478
Deferred income tax expense (benefit)3,826(6,663)
Amortization of deferred debt issuance costs134134
Stock-based compensation11,3642,487
Loss on disposal of assets16,11713,052
Changes in operating assets and liabilities:
Accounts receivable(44,032)(25,698)
Other current assets156325
Inventories1,653401
Prepaid expenses1,7073,383
Accounts payable(10,035)18,579
Accrued and other current liabilities609(2,095)
Net cash provided by operating activities25,17017,008
CASH FLOWS FROM INVESTING ACTIVITIES:
Capital expenditures(64,323)(22,494)
Proceeds from sale of assets275224
Net cash used in investing activities(64,048)(22,270)
CASH FLOWS FROM FINANCING ACTIVITIES:
Repayments of insurance financing(2,037)
Proceeds from exercise of equity awards419
Tax withholdings paid for net settlement of equity awards(2,691)(5,614)
Net cash used in financing activities(2,272)(7,651)
NET INCREASE (DECREASE) IN CASH AND CASH EQUIVALENTS(41,150)(12,913)
CASH AND CASH EQUIVALENTS - Beginning of period111,91868,772
CASH AND CASH EQUIVALENTS - End of period$    70,768$    55,859


8

EXHIBIT 99.1


Reportable Segment Information

Three Months Ended
March 31, 2022December 31, 2021
(in thousands)
Pressure
Pumping
All OtherTotal
Pressure
Pumping
All OtherTotal
Service revenue$    277,112$    5,568$    282,680$    240,349$    5,721$    246,070
Adjusted EBITDA$    76,995$    (10,462)$    66,533$    49,016$    (11,815)$    37,201
Depreciation and amortization$    30,930$    924$    31,854$    32,171$    953$    33,124
Capital expenditures$    71,602$    126$    71,728$    48,374$    480$    48,854

Non-GAAP Financial Measures

Adjusted EBITDA and Free Cash Flow are not financial measures presented in accordance with GAAP. We believe that the presentation of these non-GAAP financial measures provide useful information to investors in assessing our financial condition and results of operations. Net income (loss) is the GAAP measure most directly comparable to Adjusted EBITDA, and net cash from operating activities is the GAAP measure most directly comparable to Free Cash Flow. Non-GAAP financial measures should not be considered as alternatives to the most directly comparable GAAP financial measures. Non-GAAP financial measures have important limitations as analytical tools because they exclude some, but not all, items that affect the most directly comparable GAAP financial measures. You should not consider Adjusted EBITDA or Free Cash Flow in isolation or as a substitute for an analysis of our results as reported under GAAP. Because Adjusted EBITDA and Free Cash Flow may be defined differently by other companies in our industry, our definitions of these non-GAAP financial measures may not be comparable to similarly titled measures of other companies, thereby diminishing their utility.


9

EXHIBIT 99.1


Reconciliation of Net Loss to Adjusted EBITDA

Three Months Ended
March 31, 2022December 31, 2021
(in thousands)Pressure PumpingAll OtherTotalPressure PumpingAll OtherTotal
Net income (loss)$    29,370$    (17,553)$    11,817$    (7,296)$    (12,936)$    (20,232)
Depreciation and amortization30,93092431,85432,17195333,124
Interest expense134134137137
Income tax expense (benefit)4,1374,137(2,613)(2,613)
Loss (gain) on disposal of assets16,421(304)16,11724,1113424,145
Stock-based compensation11,36411,3643,1143,114
Other expense (income)(2)
(10,357)(10,357)305305
Other general and administrative expense, net(1)
2741,1931,467(800)(800)
Severance expense30(10)20
Adjusted EBITDA$    76,995$    (10,462)$    66,533$    49,016$    (11,816)$    37,200

(1)Other general and administrative expense, (net) relates to nonrecurring professional fees paid to external consultants in connection with the Company's pending SEC investigation and shareholder litigation, net of insurance recoveries. During the three months ended March 31, 2022 and December 31, 2021, we received approximately $1.0 million and $1.7 million, respectively, from our insurance carriers in connection with the SEC investigation and Shareholder litigation.
(2)Includes $10.7 million of net tax refund received from the Comptroller of Texas in connection with sales and use tax audit for periods 2015 through 2018.
Reconciliation of Cash from Operating Activities to Free Cash Flow

Three Months Ended
(in thousands)March 31, 2022December 31, 2021
Cash from Operating Activities$    25,170$    45,455
Cash used in Investing Activities(64,048)(18,743)
Free Cash Flow$    (38,878)$    26,712

10
© 2022 ProPetro Holding Corp. All Rights Reserved. Q1 2022 INVESTOR PRESENTATION May 3, 2022 EXHIBIT 99.2

 
2© 2022 ProPetro Holding Corp. All Rights Reserved. FORWARD-LOOKING STATEMENTS Except for historical information contained herein, the statements and information in this presentation, including the oral statements made in connection herewith, are forward-looking statements that are made pursuant to the Safe Harbor Provisions of the Private Securities Litigation Reform Act of 1995. Statements that are predictive in nature, that depend upon or refer to future events or conditions or that include the words “may,” “could,” “plan,” “project,” “budget,” “predict,” “pursue,” “target,” “seek,” “objective,” “believe,” “expect,” “anticipate,” “intend,” “estimate,” and other expressions that are predictions of, or indicate, future events and trends and that do not relate to historical matters identify forward-looking statements. Our forward-looking statements include, among other matters, statements about our business strategy, industry, future profitability, expected fleet utilization, sustainability efforts, the future performance of newly improved technology, expected capital expenditures and the impact of such expenditures on our performance and capital programs. A forward-looking statement may include a statement of the assumptions or bases underlying the forward-looking statement. We believe that we have chosen these assumptions or bases in good faith and that they are reasonable. Although forward-looking statements reflect our good faith beliefs at the time they are made, forward-looking statements are subject to a number of risks and uncertainties that may cause actual events and results to differ materially from the forward-looking statements. Such risks and uncertainties include the volatility of and recent declines in oil prices, the operational disruption and market volatility resulting from the COVID-19 pandemic, the global macroeconomic uncertainty related to the Russia-Ukraine war, and other factors described in our Annual Report on Form 10-K and Quarterly Reports on Form 10-Q, particularly the “Risk Factors” sections of such filings, and other filings with the Securities and Exchange Commission (the “SEC”). In addition, we may be subject to currently unforeseen risks that may have a materially adverse impact on us, including matters related to shareholder litigation and the SEC investigation. Accordingly, no assurances can be given that the actual events and results will not be materially different than the anticipated results described in the forward-looking statements. Readers are cautioned not to place undue reliance on such forward-looking statements and are urged to carefully review and consider the various disclosures made in our Annual Report on Form 10-K, Quarterly Reports on Form 10-Q and other filings made with the SEC from time to time that disclose risks and uncertainties that may affect our business. The forward-looking statements in this presentation are made as of the date of this presentation. We do not undertake, and expressly disclaim, any duty to publicly update these statements, whether as a result of new information, new developments or otherwise, except to the extent that disclosure is required by law. EXHIBIT 99.2
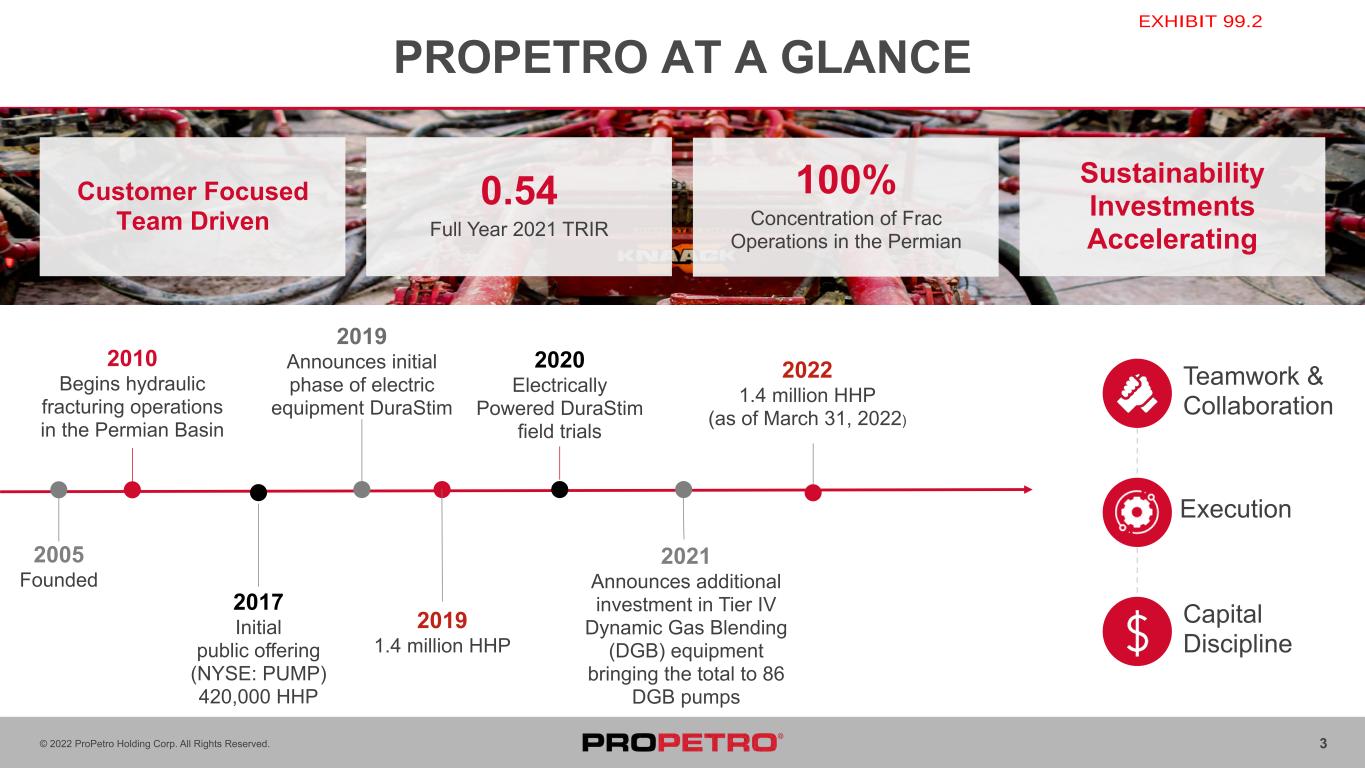

 
3© 2022 ProPetro Holding Corp. All Rights Reserved. PROPETRO AT A GLANCE 2005 Founded 2010 Begins hydraulic fracturing operations in the Permian Basin 2019 Announces initial phase of electric equipment DuraStim 2020 Electrically Powered DuraStim field trials 2021 Announces additional investment in Tier IV Dynamic Gas Blending (DGB) equipment bringing the total to 86 DGB pumps Teamwork & Collaboration Execution Capital Discipline 0.54 Full Year 2021 TRIR Customer Focused Team Driven Sustainability Investments Accelerating 100% Concentration of Frac Operations in the Permian 2017 Initial public offering (NYSE: PUMP) 420,000 HHP 2019 1.4 million HHP 2022 1.4 million HHP (as of March 31, 2022) EXHIBIT 99.2
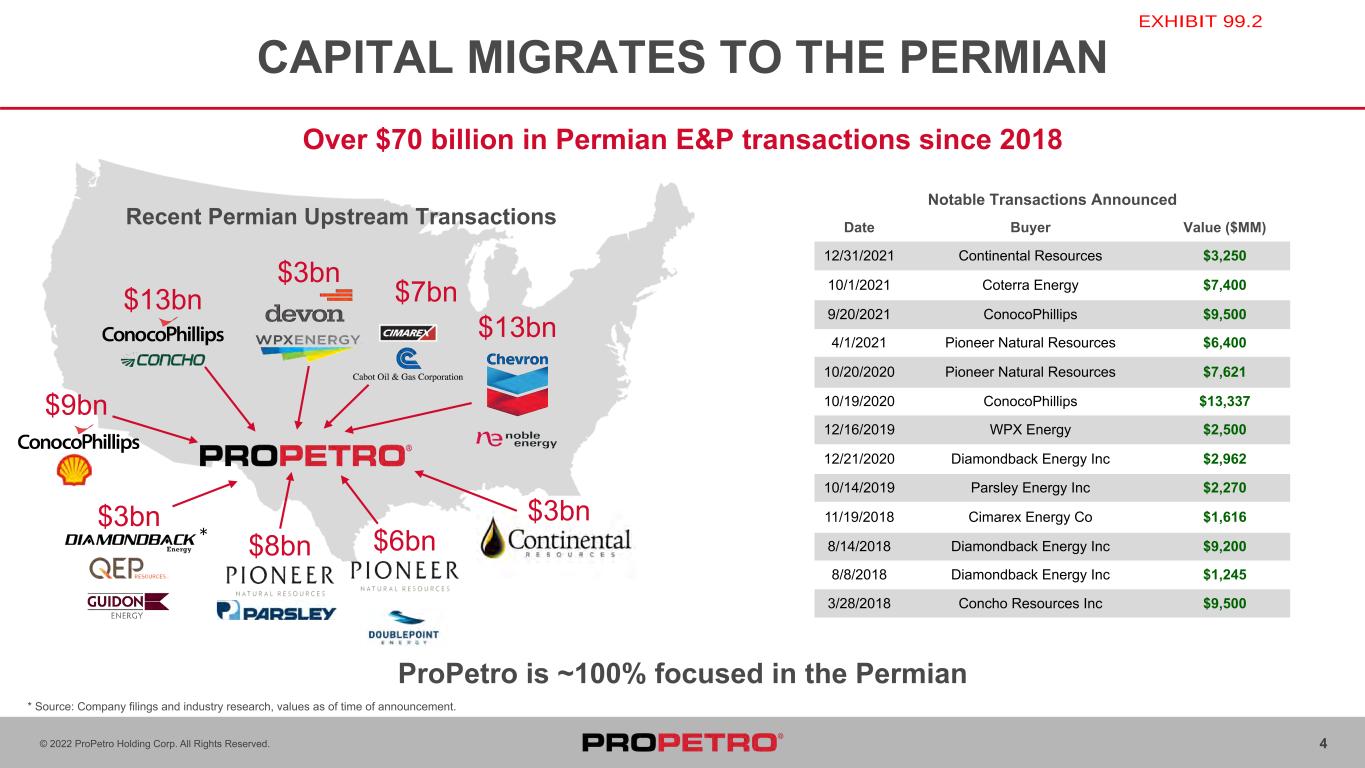

 
4© 2022 ProPetro Holding Corp. All Rights Reserved. ProPetro is ~100% focused in the Permian CAPITAL MIGRATES TO THE PERMIAN Over $70 billion in Permian E&P transactions since 2018 $6bn $13bn $3bn $3bn $13bn Notable Transactions Announced Date Buyer Value ($MM) 12/31/2021 Continental Resources $3,250 10/1/2021 Coterra Energy $7,400 9/20/2021 ConocoPhillips $9,500 4/1/2021 Pioneer Natural Resources $6,400 10/20/2020 Pioneer Natural Resources $7,621 10/19/2020 ConocoPhillips $13,337 12/16/2019 WPX Energy $2,500 12/21/2020 Diamondback Energy Inc $2,962 10/14/2019 Parsley Energy Inc $2,270 11/19/2018 Cimarex Energy Co $1,616 8/14/2018 Diamondback Energy Inc $9,200 8/8/2018 Diamondback Energy Inc $1,245 3/28/2018 Concho Resources Inc $9,500 Recent Permian Upstream Transactions * Source: Company filings and industry research, values as of time of announcement. $8bn $7bn $9bn $3bn * EXHIBIT 99.2
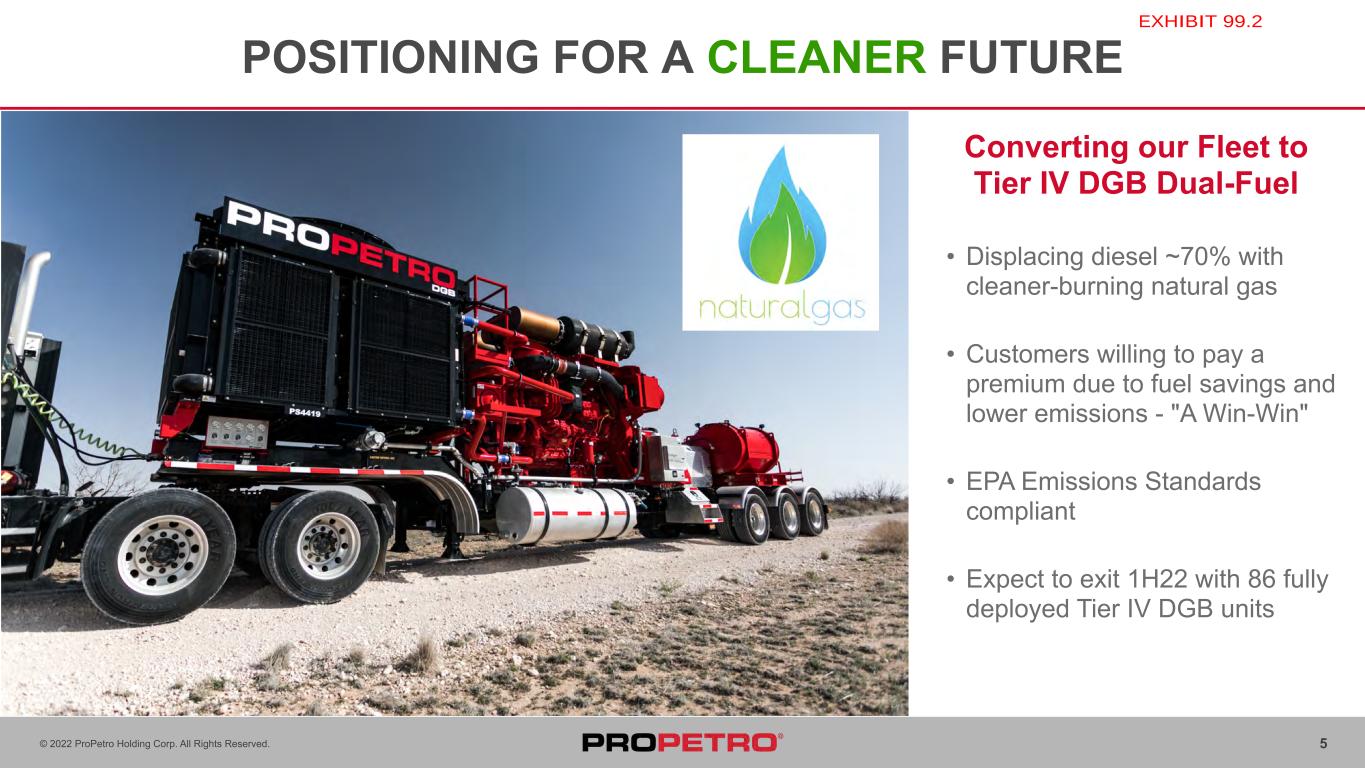

 
5© 2022 ProPetro Holding Corp. All Rights Reserved. POSITIONING FOR A CLEANER FUTURE Converting our Fleet to Tier IV DGB Dual-Fuel • Displacing diesel ~70% with cleaner-burning natural gas • Customers willing to pay a premium due to fuel savings and lower emissions - "A Win-Win" • EPA Emissions Standards compliant • Expect to exit 1H22 with 86 fully deployed Tier IV DGB units EXHIBIT 99.2
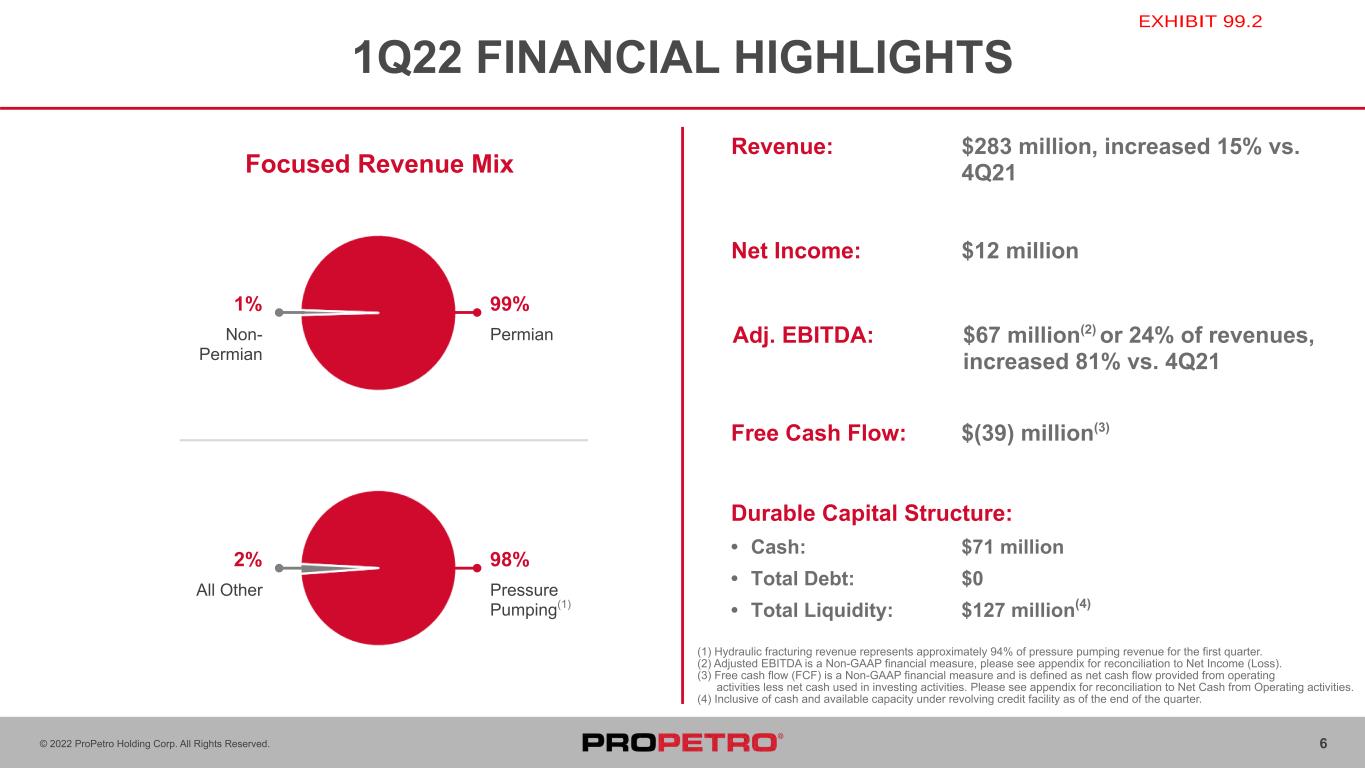

 
6© 2022 ProPetro Holding Corp. All Rights Reserved. Net Income: $12 million 1Q22 FINANCIAL HIGHLIGHTS Adj. EBITDA: $67 million(2) or 24% of revenues, increased 81% vs. 4Q21 Free Cash Flow: $(39) million(3) (1) Hydraulic fracturing revenue represents approximately 94% of pressure pumping revenue for the first quarter. (2) Adjusted EBITDA is a Non-GAAP financial measure, please see appendix for reconciliation to Net Income (Loss). (3) Free cash flow (FCF) is a Non-GAAP financial measure and is defined as net cash flow provided from operating activities less net cash used in investing activities. Please see appendix for reconciliation to Net Cash from Operating activities. (4) Inclusive of cash and available capacity under revolving credit facility as of the end of the quarter. Durable Capital Structure: • Cash: $71 million • Total Debt: $0 • Total Liquidity: $127 million(4) Focused Revenue Mix 99% Permian 1% Non- Permian 98% Pressure Pumping(1) 2% All Other Revenue: $283 million, increased 15% vs. 4Q21 EXHIBIT 99.2
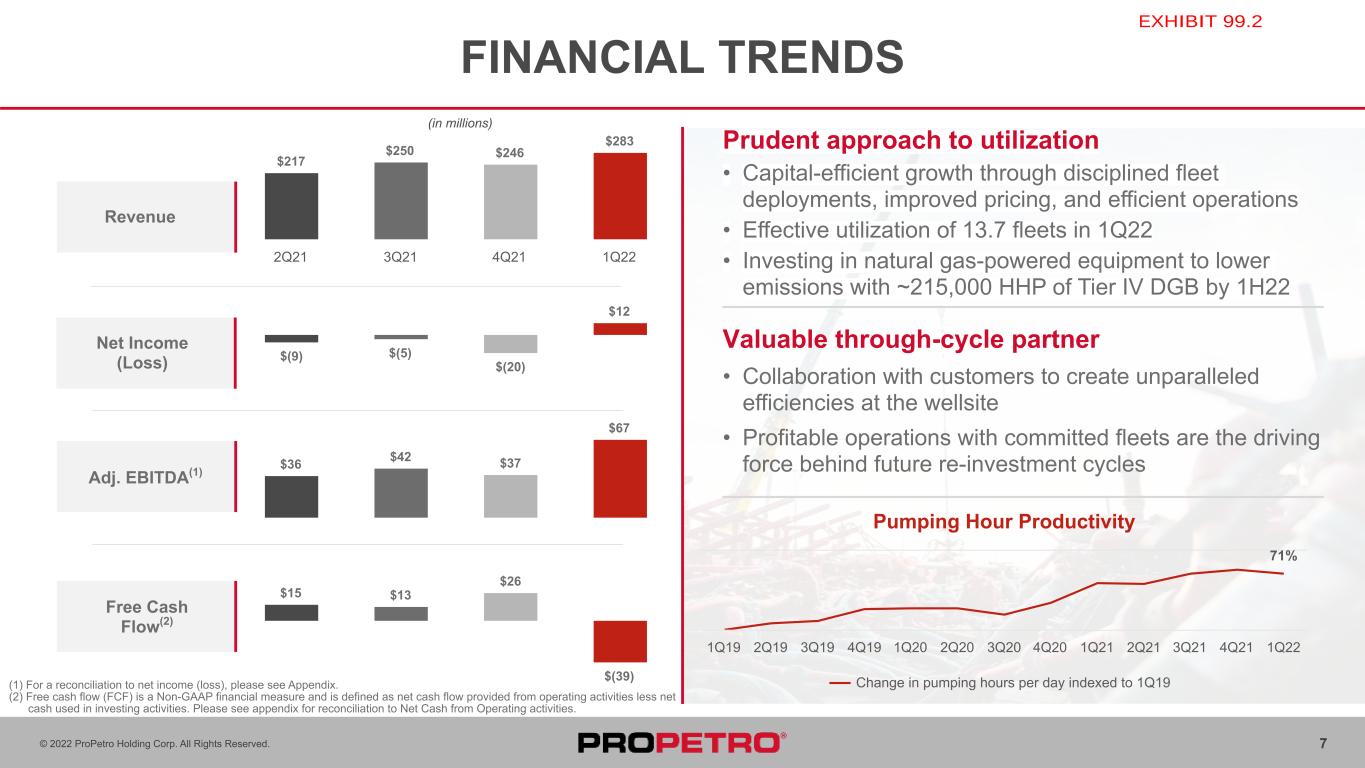

 
7© 2022 ProPetro Holding Corp. All Rights Reserved. FINANCIAL TRENDS (1) For a reconciliation to net income (loss), please see Appendix. (2) Free cash flow (FCF) is a Non-GAAP financial measure and is defined as net cash flow provided from operating activities less net cash used in investing activities. Please see appendix for reconciliation to Net Cash from Operating activities. Prudent approach to utilization • Capital-efficient growth through disciplined fleet deployments, improved pricing, and efficient operations • Effective utilization of 13.7 fleets in 1Q22 • Investing in natural gas-powered equipment to lower emissions with ~215,000 HHP of Tier IV DGB by 1H22 Valuable through-cycle partner • Collaboration with customers to create unparalleled efficiencies at the wellsite • Profitable operations with committed fleets are the driving force behind future re-investment cycles Revenue Adj. EBITDA(1) Free Cash Flow(2) Net Income (Loss) (in millions) $217 $250 $246 $283 2Q21 3Q21 4Q21 1Q22 $(9) $(5) $(20) $12 $36 $42 $37 $67 $15 $13 $26 $(39) Pumping Hour Productivity 71% Change in pumping hours per day indexed to 1Q19 1Q19 2Q19 3Q19 4Q19 1Q20 2Q20 3Q20 4Q20 1Q21 2Q21 3Q21 4Q21 1Q22 EXHIBIT 99.2
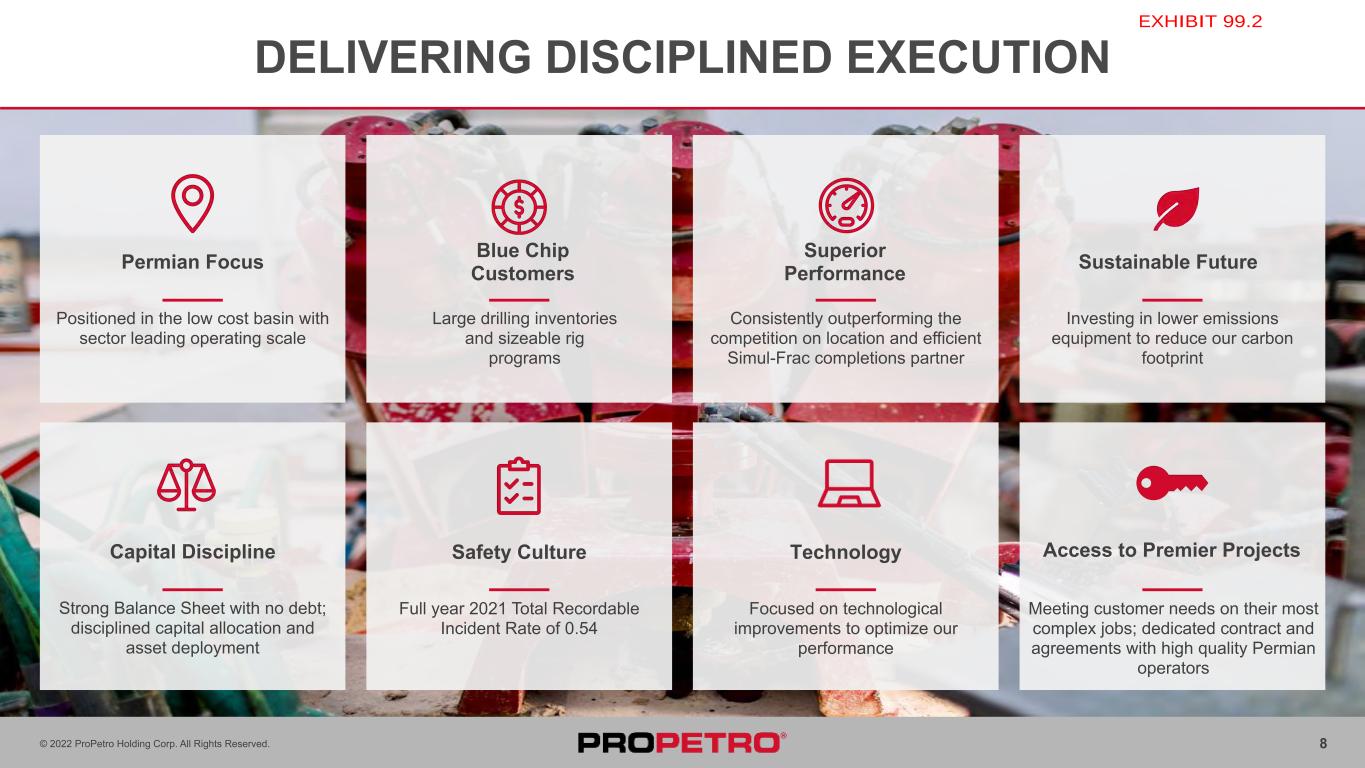

 
© 2022 ProPetro Holding Corp. All Rights Reserved. 8 DELIVERING DISCIPLINED EXECUTION Permian Focus Positioned in the low cost basin with sector leading operating scale Blue Chip Customers Large drilling inventories and sizeable rig programs Superior Performance Consistently outperforming the competition on location and efficient Simul-Frac completions partner Sustainable Future Investing in lower emissions equipment to reduce our carbon footprint Capital Discipline Strong Balance Sheet with no debt; disciplined capital allocation and asset deployment Safety Culture Full year 2021 Total Recordable Incident Rate of 0.54 Access to Premier Projects Meeting customer needs on their most complex jobs; dedicated contract and agreements with high quality Permian operators Technology Focused on technological improvements to optimize our performance EXHIBIT 99.2

 
© 2022 ProPetro Holding Corp. All Rights Reserved. Appendix EXHIBIT 99.2
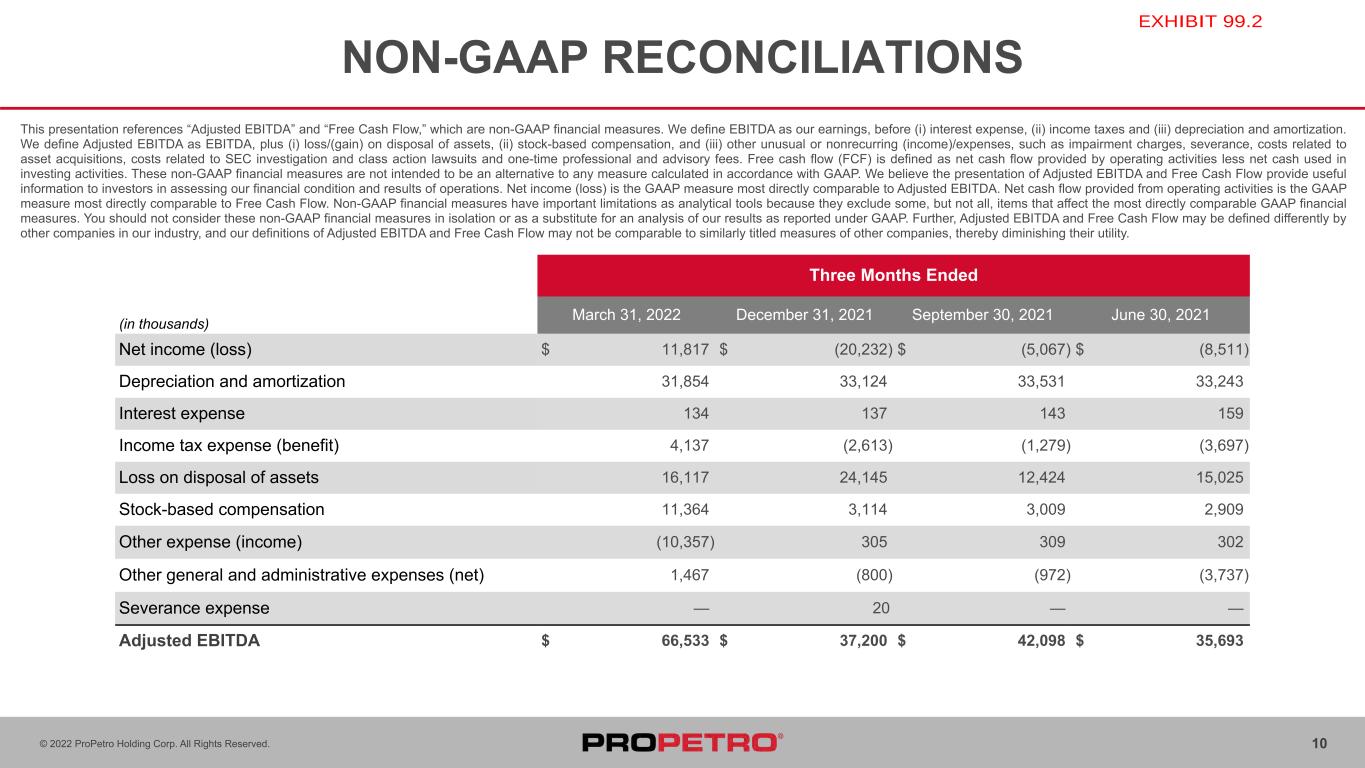

 
10© 2022 ProPetro Holding Corp. All Rights Reserved. NON-GAAP RECONCILIATIONS Three Months Ended (in thousands) March 31, 2022 December 31, 2021 September 30, 2021 June 30, 2021 Net income (loss) $ 11,817 $ (20,232) $ (5,067) $ (8,511) Depreciation and amortization 31,854 33,124 33,531 33,243 Interest expense 134 137 143 159 Income tax expense (benefit) 4,137 (2,613) (1,279) (3,697) Loss on disposal of assets 16,117 24,145 12,424 15,025 Stock-based compensation 11,364 3,114 3,009 2,909 Other expense (income) (10,357) 305 309 302 Other general and administrative expenses (net) 1,467 (800) (972) (3,737) Severance expense — 20 — — Adjusted EBITDA $ 66,533 $ 37,200 $ 42,098 $ 35,693 This presentation references “Adjusted EBITDA” and “Free Cash Flow,” which are non-GAAP financial measures. We define EBITDA as our earnings, before (i) interest expense, (ii) income taxes and (iii) depreciation and amortization. We define Adjusted EBITDA as EBITDA, plus (i) loss/(gain) on disposal of assets, (ii) stock-based compensation, and (iii) other unusual or nonrecurring (income)/expenses, such as impairment charges, severance, costs related to asset acquisitions, costs related to SEC investigation and class action lawsuits and one-time professional and advisory fees. Free cash flow (FCF) is defined as net cash flow provided by operating activities less net cash used in investing activities. These non-GAAP financial measures are not intended to be an alternative to any measure calculated in accordance with GAAP. We believe the presentation of Adjusted EBITDA and Free Cash Flow provide useful information to investors in assessing our financial condition and results of operations. Net income (loss) is the GAAP measure most directly comparable to Adjusted EBITDA. Net cash flow provided from operating activities is the GAAP measure most directly comparable to Free Cash Flow. Non-GAAP financial measures have important limitations as analytical tools because they exclude some, but not all, items that affect the most directly comparable GAAP financial measures. You should not consider these non-GAAP financial measures in isolation or as a substitute for an analysis of our results as reported under GAAP. Further, Adjusted EBITDA and Free Cash Flow may be defined differently by other companies in our industry, and our definitions of Adjusted EBITDA and Free Cash Flow may not be comparable to similarly titled measures of other companies, thereby diminishing their utility. EXHIBIT 99.2
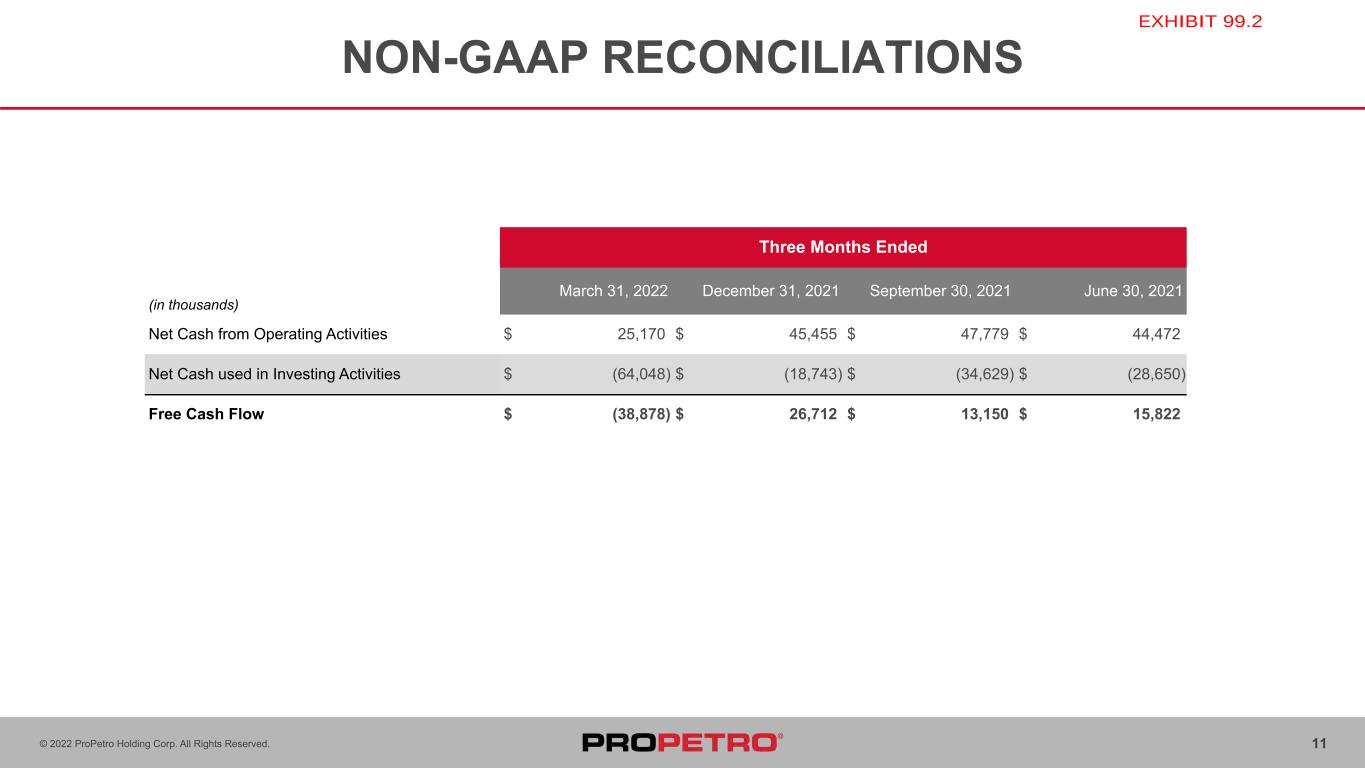

 
11© 2022 ProPetro Holding Corp. All Rights Reserved. NON-GAAP RECONCILIATIONS Three Months Ended (in thousands) March 31, 2022 December 31, 2021 September 30, 2021 June 30, 2021 Net Cash from Operating Activities $ 25,170 $ 45,455 $ 47,779 $ 44,472 Net Cash used in Investing Activities $ (64,048) $ (18,743) $ (34,629) $ (28,650) Free Cash Flow $ (38,878) $ 26,712 $ 13,150 $ 15,822 EXHIBIT 99.2

 
12© 2022 ProPetro Holding Corp. All Rights Reserved. CONTACT INFORMATION www.propetroservices.com Corporate Headquarters Investor Relations 1706 South Midkiff Road Midland, TX 79701 432.688.0012 Josh Jones, Director of Finance [email protected] Direct 432.276.3389 Matt Augustine, Investor Relations [email protected] Direct 432.848.0871 EXHIBIT 99.2