r-20210211
RYDER SYSTEM, INC.0000085961false00000859612020-04-292020-04-2900000859612020-10-012020-12-31

UNITED STATES
SECURITIES AND EXCHANGE COMMISSION
Washington, D.C. 20549
 
FORM 8-K
 
CURRENT REPORT
Pursuant to Section 13 OR 15(d) of The Securities Exchange Act of 1934


Date of Report (Date of earliest event reported): February 11, 2021
 
RYDER SYSTEM, INC.
(Exact name of registrant as specified in its charter) 
Florida1-436459-0739250
(State or other jurisdiction
of incorporation)
(Commission
File Number)
(I.R.S. Employer
Identification No.)

11690 NW 105th Street33178
Miami, Florida(Zip Code)
(Address of principal executive offices)

Registrant’s telephone number, including area code: (305) 500-3726

Not Applicable
(Former name or former address, if changed since last report.)
 
Check the appropriate box below if the Form 8-K filing is intended to simultaneously satisfy the filing obligation of the registrant under any of the following provisions (see General Instruction A.2. below):

Written communications pursuant to Rule 425 under the Securities Act (17 CFR 230.425)

Soliciting material pursuant to Rule 14a-12 under the Exchange Act (17 CFR 240.14a-12)

Pre-commencement communications pursuant to Rule 14d-2(b) under the Exchange Act (17 CFR 240.14d-2(b))

Pre-commencement communications pursuant to Rule 13e-4(c) under the Exchange Act (17 CFR 240.13e-4(c))

Securities registered pursuant to Section 12(b) of the Act:
Title of each classTrading Symbol(s)Name of each exchange on which registered
Common StockRNew York Stock Exchange

Indicate by check mark whether the registrant is an emerging growth company as defined in Rule 405 of the Securities Act of 1933 (§230.405 of this chapter) or Rule 12b-2 of the Securities Exchange Act of 1934 (§240.12b-2 of this chapter).

Emerging growth company    

If an emerging growth company, indicate by check mark if the registrant has elected not to use the extended transition period for complying with any new or revised financial accounting standards provided pursuant to Section 13(a) of the Exchange Act.    


Item 2.02 Results of Operations and Financial Condition

On February 11, 2021, we issued a press release reporting our financial results for the three and twelve months ended December 31, 2020 (the “Press Release”). The Press Release is available on our website at http://investors.ryder.com.

Item 7.01 Regulation FD Disclosure

We are hosting a conference call and webcast on February 11, 2021 during which we will make a presentation on our financial results for the three and twelve months ended December 31, 2020 (the "Presentation"). The Presentation has been made available on our website at http://investors.ryder.com.

The information in this Report, including Exhibit 99.1 and Exhibit 99.2, are being furnished pursuant to Item 2.02 of Form 8-K, and General Instruction B.2 thereunder and shall not be deemed to be incorporated by reference in any filing under the Securities Act of 1933 or the Securities Exchange Act of 1934, except as expressly set forth by specific reference to such filing.

Item 9.01(d) Exhibits

The following exhibits are furnished as part of this report on Form 8-K:
 
Exhibit 99.1
Exhibit 99.2
Exhibit 104Cover Page Interactive Data File - The Cover page of this Current Report on Form 8-K, formatted in Inline XBRL.


SIGNATURE

Pursuant to the requirements of the Securities Exchange Act of 1934, the registrant has duly caused this report to be signed on its behalf by the undersigned hereunto duly authorized.
 
Date: February 11, 2021
RYDER SYSTEM, INC.
(Registrant)
 By:/s/ Scott T. Parker
  Scott T. Parker
Executive Vice President, Chief Financial Officer


News Release

Ryder Reports Fourth Quarter and Full Year 2020 Results

Fourth Quarter 2020
Total revenue of $2.2 billion, down 3% reflecting lower fuel revenue
Operating revenue (non-GAAP) of $1.8 billion, unchanged as higher revenues in supply chain were offset by lower revenues in fleet management and dedicated businesses
GAAP EPS from continuing operations of $0.48 versus a loss of $(1.02) in prior year, primarily reflecting improved results in used vehicle sales (including gains), lease, and rental
Comparable EPS (non-GAAP) from continuing operations of $0.83 (includes $0.38 one-time expense for frontline employee bonus) versus a loss of $(0.01) in prior year
Full year 2020 operating cash flow was $2.2 billion and free cash flow was $1.6 billion

2021 Outlook
GAAP EPS forecast of $4.18 - $4.68; comparable EPS (non-GAAP) forecast of $4.15 - $4.65
Operating cash flow forecast of $2.2 billion; free cash flow forecast of $400M - $700M
Expect to approach our interim target for adjusted ROE

MIAMI, February 11, 2021 – Ryder System, Inc. (NYSE: R), a leader in supply chain, dedicated transportation, and fleet management solutions, reported results for the three months ended December 31 as follows:
(In millions, except EPS)Earnings (Loss)
Before Taxes
Earnings (Loss)Diluted Earnings (Loss)
Per Share
202020192020201920202019
Continuing operations (GAAP)$23.3 $(122.2)$25.8 $(53.1)$0.48 $(1.02)
Non-operating pension costs1.8 40.3 0.6 30.6 0.01 0.59 
Restructuring and other, net8.8 21.6 7.4 16.1 0.14 0.31 
ERP implementation costs7.1 7.6 5.3 5.7 0.10 0.11 
Gains on sale of properties(1.7)— (1.6)— (0.02)— 
Early redemption of medium-term notes9.0 — 6.9 — 0.13 — 
Tax adjustments, net— — (0.4)— (0.01)— 
Comparable (non-GAAP)$48.3 $(52.7)$43.9 $(0.7)$0.83 $(0.01)
Note: Amounts may not be additive due to rounding.

Total and operating revenue for the three months ended December 31 were as follows:
(In millions)Total RevenueOperating Revenue
(non-GAAP)
20202019Change20202019Change
Total$2,213 2,277 (3)%$1,839 1,839 —%
Fleet Management Solutions (FMS)$1,335 1,432 (7)%$1,193 1,224 (3)%
Supply Chain Solutions (SCS)$711 649 10%$506 466 8%
Dedicated Transportation Solutions (DTS)$301 346 (13)%$231 241 (4)%


CEO Comment

Commenting on the company's results and outlook, Ryder Chairman and CEO Robert Sanchez said, "I am pleased that we delivered significantly higher year over year earnings in the fourth quarter and made progress on our initiatives to improve returns. We generated $1.6 billion of free cash flow in 2020 in line with our goal to deliver positive free cash flow over the cycle.

"Improving used vehicle market conditions resulted in gains on sale in the second half of 2020 and enabled us to reduce inventory levels to within our target range. Actions taken to align the rental fleet size with lower demand conditions following the pandemic have been successful, resulting in fourth quarter utilization levels higher than prior year. ChoiceLease pricing initiatives continue to benefit returns and are resulting in higher revenue per new lease vehicle. Ongoing progress on our multi-year maintenance cost-savings initiative generated $30 million in savings in 2020.

"Efforts to accelerate growth in SCS and DTS continue and include the launch of our national multimedia advertising campaign, which has generated an increase in sales leads and traffic to Ryder.com. The 2020 launch of RyderShare, our digital platform for real-time freight visibility and collaboration, continues to gain traction as the platform has been used to track almost two million shipments for supply chain and dedicated customers.

“Finally, I'm extremely grateful to Ryder's frontline employees who have continued to deliver in a very difficult environment, and in recognition we awarded them one-time bonuses totaling $28 million."

Outlook
Full Year 2021
Total Revenue Growthmid-single digits
Operating Revenue Growthmid-single digits
FY21 GAAP EPS$4.18 - $4.68
FY21 Comparable EPS$4.15 - $4.65
YOY Earnings Benefit from Lower Depreciation Impact (excl. UVS, net)~$220M
Tax Ratehigh 20's
Adjusted Return on Equity (1)
10% - 11%
Cash from Operating Activities $2.20B
Free Cash Flow$400M - $700M
Capital Expenditures$2.0B - 2.3B
First Quarter 2021
1Q21 GAAP EPS$0.30 - $0.40
1Q21 Comparable EPS$0.50 - $0.60
YOY Earnings Benefit from Lower Depreciation Impact (excl. UVS, net)~$50M
(1) The non-GAAP elements of the calculation have been reconciled to the corresponding GAAP measures. A numerical reconciliation of net earnings to adjusted net earnings and average shareholders' equity to adjusted average equity is provided below.

2


"While the 2021 market environment remains uncertain and may be impacted by developments related to COVID-19 and other factors, we expect improving economic conditions, continued secular trends that favor outsourcing, and progress on our strategic initiatives. Based on this outlook and an improved deal pipeline, we expect higher contractual sales activity. Operating revenue growth in SCS and DTS is expected to be within the high-single-digit target range, with FMS growth near the lower end of the mid-single digit target range.

"The expected earnings benefit related to a lower depreciation expense impact from prior residual value estimate changes, better rental performance, and our actions to improve returns are expected to be the key contributors to approaching our interim target for adjusted ROE of 11% in 2021. Used vehicle market pricing is anticipated to modestly improve throughout the year. We're planning to grow the rental fleet to capture increased demand from a strong e-commerce and freight environment. The benefits from higher lease pricing and our maintenance cost-savings initiative are expected to be partially offset by a smaller lease fleet. We expect to deliver strong free cash flow this year, consistent with our goal to generate positive free cash flow over the cycle.

"We are accelerating investments in strategic initiatives to capitalize on the growing market demand for innovative supply chain solutions, improve the customer experience, expand sales capabilities, and achieve our growth and return targets over time."


Fourth Quarter Business Segment Operating Results

Fleet Management Solutions: Earnings Increased Primarily Reflecting Improved Used Vehicle Sales Results, Including Declining Impact of Depreciation Expense from Prior Residual Value Estimate Changes, and Better Results in Lease and Rental
(In millions)4Q204Q19Change
Total Revenue$1,3351,432(7)%
Operating Revenue (1)
$1,1931,224(3)%
Earnings Before Tax (EBT) (2)
$60(80)NM
FMS EBT as a % of FMS total revenue4.5%(5.6)%NM
FMS EBT as a % of FMS operating revenue (1)
5.0%(6.6)%NM
Full-year EBT as % of total and operating revenueFY20FY19Change
FMS EBT as a % of FMS total revenue(2.7)%(1.3)%(140) bps
FMS EBT as a % of FMS operating revenue (1)
(3.1)%(1.5)%(160) bps
(1) Non-GAAP financial measure excluding fuel and lease liability insurance revenue.
(2) EBT in 4Q20 and 4Q19 included $86M and $148M of depreciation expense, respectively, from the impact of policy and accelerated depreciation and used vehicle sales results due to 2020 and 2019 residual values estimate changes.
NM - Not Meaningful

In the Fleet Management Solutions (FMS) business segment, total revenue declined due to lower fuel and operating revenue. Operating revenue declined due primarily to a 7% decrease in rental revenue from lower demand on a smaller fleet.

3


FMS EBT increased by $141 million reflecting a declining impact of depreciation expense from prior vehicle residual value estimate changes and higher gains on used vehicles sold together totaling $62 million. We significantly reduced our used vehicle inventory to within our target range at year-end. Lease results benefited from lower insurance costs from the discontinuance of the lease liability product and higher pricing on lease vehicles. Rental power fleet utilization in the quarter was strong at 79%, up from 76% in the prior year on a 16% smaller fleet. Utilization increased due to improving economic conditions and actions taken to align the fleet with market demand. Rental results benefited from lower maintenance costs, including benefits from our cost-savings initiative, and higher pricing. FMS earnings before tax as a percentage of FMS operating revenue is below the company's long-term target of high single digits, reflecting depreciation from prior residual value estimate changes.


Supply Chain Solutions: Results Benefited from Higher Pricing and Growth
(In millions)4Q204Q19Change
Total Revenue$711 649 10%
Operating Revenue (1)
$506 466 8%
Earnings Before Tax (EBT)$34 32 5%
EBT as a % of total revenue4.8%5.0%(20) bps
EBT as a % of operating revenue (1)
6.8%6.9%(10) bps
Full-year EBT as % of total and operating revenueFY20FY19Change
EBT as a % of total revenue6.3%5.7%60 bps
EBT as a % of operating revenue (1)
8.6%7.7%90 bps
(1) Non-GAAP financial measure excluding fuel and subcontracted transportation.

In the Supply Chain Solutions (SCS) business segment, total revenue and operating revenue increased primarily due to new business, increased pricing, and higher volumes. Revenue increases reflect growth in consumer packaged goods, retail, and automotive.

SCS earnings before tax increased due to higher pricing and new business, partially offset by favorable insurance claims development in the prior year and higher compensation-related costs. SCS EBT as a percentage of SCS operating revenue is below the company's long-term target of high single digits for the fourth quarter, but is within the target range for full year 2020.
4


Dedicated Transportation Solutions: Lower Earnings Primarily Due to Prior Year Favorable Insurance Claims, Partially Offset by Improved Operating Performance
(In millions)4Q204Q19Change
Total Revenue$301 346 (13)%
Operating Revenue (1)
$231 241 (4)%
Earnings Before Tax (EBT)$15 18 (16)%
EBT as a % of total revenue5.1%5.2%(10) bps
EBT as a % of operating revenue (1)
6.6%7.5%(90) bps
Full-year EBT as % of total and operating revenue FY20FY19Change
EBT as a % of total revenue6.0%5.7%30 bps
EBT as a % of operating revenue (1)
7.9%8.3%(40) bps
(1) Non-GAAP financial measure excluding fuel and subcontracted transportation.

In the Dedicated Transportation Solutions (DTS) business segment, total revenue and operating revenue declined primarily due to lower contractual sales in late 2019 and early 2020.

DTS earnings before tax decreased primarily due to a favorable insurance claims development in the prior year, partially offset by improved operating performance. DTS EBT as a percentage of DTS operating revenue is below the company's long-term target of high single digits for the fourth quarter, but is within the target range for full year 2020.

Corporate Financial Information

Unallocated Central Support Services
In the fourth quarter of 2020, unallocated CSS costs were $49 million as compared to $15 million in the prior year, primarily reflecting a previously announced one-time expense of $28 million for a recognition and retention bonus paid to frontline workers.

Income Taxes
Our effective income tax rate from continuing operations for the fourth quarter of 2020 was a benefit of 10.6% as compared to a benefit of 56.6% in the prior year. Tax rates in both periods were impacted by lower earnings due to prior residual value estimate changes. The comparable effective income tax rate (a non-GAAP measure) from continuing operations for the fourth quarter of 2020 was an expense of 9.0% as compared to a benefit of 98.7% in the prior year. The fourth quarter effective tax rate reflects the impact of favorable discrete items on a low level of earnings before taxes.

Capital Expenditures, Cash Flow, and Leverage
Full year gross capital expenditures decreased to $1.1 billion in 2020 compared with $3.6 billion in 2019 due to lower investments in the lease and rental fleets.

5


Full year operating cash flow was $2.2 billion in 2020, up from $2.1 billion in 2019. Free cash flow (a non-GAAP measure) was positive $1.6 billion, up from negative $(1.1) billion in 2019, reflecting decreased capital spending as well as improved working capital.

Debt-to-equity as of December 31, 2020 declined to 293% from 320% at year-end 2019, and is now within the company's long-term target of 250-300%. The decrease in debt-to-equity from year-end 2019 primarily reflects the reduction in debt due to higher free cash flow.
6


Supplemental Company Information

Fourth Quarter Net Earnings
(In millions, except EPS)EarningsDiluted EPS
2020201920202019
Earnings (loss) from continuing operations$25.8 (53.1)$0.48 (1.02)
Discontinued operations(0.1)(0.4)— (0.01)
Net earnings (loss)$25.6 (53.5)$0.48 (1.02)

Full Year Operating Results
(In millions, except EPS)Years ended December 31,
20202019Change
Total revenue$8,420 8,926    (6)%
Operating revenue (non-GAAP)$7,024 7,189    (2)%
Earnings (loss) from continuing operations$(112.0)(23.3)NM
Comparable earnings (loss) from continuing operations (non-GAAP)$(13.8)53.6 NM
Net earnings (loss)$(122.3)(24.4)NM
Earnings (loss) per common share (EPS) - Diluted
Continuing operations$(2.15)(0.45)NM
Comparable (non-GAAP)$(0.27)1.01 NM
Net earnings (loss)$(2.34)(0.47)NM

Business Description

Ryder System, Inc. is a leading supply chain, dedicated transportation, and fleet management solutions company. Ryder’s stock (NYSE: R) is a component of the Dow Jones Transportation Average and the S&P MidCap 400® index. The company’s financial performance is reported in the following three, inter-related business segments:
Supply Chain Solutions – Ryder’s SCS business segment optimizes logistics networks to make them more responsive and able to be leveraged as a competitive advantage. Globally-recognized brands in the automotive, consumer goods, food and beverage, healthcare, industrial, oil and gas, technology, and retail industries rely on Ryder’s leading-edge technologies and world-class logistics engineers to help them deliver the goods that consumers use every day.
Dedicated Transportation Solutions – Ryder’s DTS business segment combines the best of Ryder’s leasing and maintenance capability with the safest and most professional drivers in the industry. With a dedicated transportation solution, Ryder helps customers increase their competitive position, reduce risk, and integrate their transportation needs with their overall supply chain.
Fleet Management Solutions – Ryder’s FMS business segment provides a broad range of services to help businesses of all sizes, across virtually every industry, deliver for their customers. From leasing, maintenance, and fueling, to rental and used vehicle sales, customers rely on Ryder’s expertise to help them lower their costs, redirect capital to other parts of their business, and focus on what they do best – so they can grow.

For more information on Ryder System, Inc., visit investors.ryder.com and ryder.com.

###

7


Note: Regarding Forward-Looking Statements

Certain statements and information included in this news release are “forward-looking statements” under the Federal Private Securities Litigation Reform Act of 1995, including our forecast, outlook, expectations regarding market trends and economic environment; impact of the COVID-19 pandemic on market conditions, e-commerce trends, freight environment, earnings, depreciation, commercial rental demand and utilization, and used vehicle sales volume and pricing, expected benefits from our strategic initiatives and our multi-year maintenance cost-savings initiatives; expected benefits of lease pricing initiatives; our ability to implement our asset management strategy to right size our fleet; performance, including sales and revenue growth, in our product lines and segments; residual values and depreciation expense; used vehicle inventory; rental utilization; free cash flow; operating cash flow; capital expenditures; fleet growth; profitability of our Ryder Last Mile operations; resumption of the anti-dilutive share repurchase program; and our ability to obtain our projected benefits from our investments and partnerships through the RyderVentures capital fund. Our forward-looking statements also include our estimates of the impact of our changes to residual value estimates on earnings and depreciation expense. The expected impact of the change in residual value estimates is based on our current assessment of the residual values and useful lives of revenue-earning equipment based on multi-year trends and our outlook for the expected near-term used vehicle market. Our assessment is subject to risks, uncertainties, and assumptions as to future events that may not prove to be accurate. Factors that could cause actual results related to vehicle residual values to materially differ from estimates include, but are not limited to, changes in supply and demand, including due to COVID-19 impacts and other factors, competitor pricing, regulatory requirements, driver shortages, requirements and preferences, as well as changes in underlying assumption factors.

All of our forward-looking statements should be evaluated with consideration given to the many risks and uncertainties inherent in our business that could cause actual results and events to differ materially from those in the forward-looking statements. Important factors that could cause such differences include, among others, the duration and severity of the COVID-19 pandemic and governmental responses thereto; our ability to adapt to changing market conditions, lower than expected contractual sales, decreases in commercial rental demand or utilization or poor acceptance of rental pricing, worsening of market demand for or excess supply of used vehicles impacting current and/or estimated pricing and our anticipated proportion of retail versus wholesale sales; lack of customer demand for our services; higher than expected maintenance costs; lower than expected benefits from our cost-savings initiatives; lower than expected benefits from our sales, marketing and new product initiatives; higher than expected costs related to our ERP implementation; setbacks or uncertainty in the economic market or in our ability to grow and retain profitable customer accounts; implementation or enforcement of regulations; decreases in freight demand or volumes; used vehicle inventory levels; poor operational execution including with respect to new accounts and product launches; our difficulty in obtaining adequate profit margins for our services; our inability to maintain current pricing levels due to soft economic conditions; business interruptions or expenditures due to labor disputes; severe weather or natural occurrences; competition from other service providers and new entrants; lower than anticipated customer retention levels; loss of key customers; driver and technician shortages resulting in higher procurement costs and turnover rates; higher than expected bad debt reserves or write-offs; changes in customers' business environments that will limit their ability to commit to long-term vehicle leases; a decrease in credit ratings; increased debt costs; adequacy of accounting estimates; higher than expected reserves and accruals particularly with respect to pension, taxes, depreciation, insurance and revenue; impact of changes in our residual value estimates and accounting policies, including our depreciation policy; the sudden or unusual changes in fuel prices; unanticipated currency exchange rate fluctuations; our ability to manage our cost structure; and the risks described in our filings with the Securities and Exchange Commission (SEC). The risks included here are not exhaustive. New risks emerge from time to time and it is not possible for management to predict all such risk factors or to assess the impact of such risks on our business. Accordingly, we undertake no obligation to publicly update or revise any forward-looking statements, whether as a result of new information, future events, or otherwise.

Note: Regarding Non-GAAP Financial Measures

This news release includes certain non-GAAP financial measures as defined under SEC rules. Refer to Appendix - Non-GAAP Financial Measure Reconciliations at the end of the tables following this press release for reconciliations of the non-GAAP financial measures contained in this release to the nearest GAAP measure and why management believes that presentation of each measure provides useful information to investors. Additional information regarding non-GAAP financial measures as required by Regulation G and Item 10(e) of Regulation S-K can be found in our most recent Form 10-K, Form 10-Q and our Form 8-K filed as of the date of this release with the SEC, which are available at http://investors.ryder.com.

8


CONFERENCE CALL AND WEBCAST INFORMATION

Ryder’s earnings conference call and webcast is scheduled for February 11, 2021 at 11:00 a.m. ET. To join, click here.

LIVE AUDIO VIA PHONE
Toll Free Number:    888-352-6803
USA Toll Number:    323-701-0225
Audio Passcode:        Ryder
Conference Leader:    Bob Brunn

AUDIO REPLAY VIA PHONE
An audio replay of the call will be available one hour after call ends for 30 days. 
Toll Free Number:    888-203-1112
USA Toll Number:    719-457-0820
Replay Passcode:        1420126

AUDIO REPLAY VIA MP3 DOWNLOAD
A podcast will be available within 24 hours after the end of the call. Click here then select Financials/Quarterly Reports and the date.

AUDIO & SLIDE REPLAY VIA INTERNET
An audio replay including the slide presentation will be available on the Internet within two hours following the call. Click here then select Financials/Quarterly Reports and the date.

Contacts:    Media:                        Investor Relations:
        Amy Federman                    Bob Brunn
        (305) 500-4989                    (305) 500-4053


Financial = ryder-financial
USA = ryder-usa

9


RYDER SYSTEM, INC. AND SUBSIDIARIES
CONDENSED CONSOLIDATED STATEMENTS OF EARNINGS - UNAUDITED
Periods ended December 31, 2020 and 2019
(In millions, except per share amounts)
Three MonthsTwelve Months
2020201920202019
Lease & related maintenance and rental revenues$973.9 992.2 $3,704.0 3,784.7 
Services revenue1,143.0 1,143.6 4,318.0 4,555.7 
Fuel services revenue96.1 140.7 398.1 585.4 
Total revenues2,212.9 2,276.5 8,420.1 8,925.8 
Cost of lease & related maintenance and rental756.8 874.1 3,108.8 3,103.7 
Cost of services972.8 983.7 3,653.1 3,879.9 
Cost of fuel services91.4 139.8 382.7 571.7 
Other operating expenses30.0 29.8 123.4 122.0 
Selling, general and administrative expenses277.7 233.7 921.6 907.4 
Non-operating pension costs1.8 40.3 11.2 60.4 
Used vehicle sales, net(17.7)9.6 (0.4)58.7 
Interest expense68.9 62.8 261.3 241.4 
Miscellaneous (income) loss, net(10.0)(4.2)(21.9)(33.6)
Restructuring and other items, net18.0 29.2 110.6 56.6 
2,189.6 2,398.8 8,550.5 8,968.1 
Earnings (loss) from continuing operations before income taxes23.3 (122.2)(130.4)(42.3)
Provision for (benefit from) income taxes(2.5)(69.2)(18.4)(19.0)
Earnings (loss) from continuing operations25.8 (53.1)(112.0)(23.3)
Earnings (loss) from discontinued operations, net of tax(0.1)(0.4)(10.3)(1.1)
Net earnings (loss)$25.6 (53.5)$(122.3)(24.4)
Earnings (loss) per common share — Diluted
Continuing operations$0.48 (1.02)$(2.15)(0.45)
Discontinued operations— (0.01)(0.21)(0.03)
Net earnings (loss)$0.48 (1.02)$(2.34)(0.47)
Earnings (loss) available to common shareholders
Earnings (loss) from continuing operations$25.8 (53.1)$(112.0)(23.3)
Less: Distributed and undistributed earnings allocated to unvested stock(0.1)(0.1)(0.5)(0.5)
Earnings (loss) from continuing operations available to common stockholders$25.6 (53.2)$(112.5)(23.7)
Weighted-average common shares outstanding — Diluted53.0 52.3 52.4 52.3 
EPS from continuing operations$0.48 (1.02)$(2.15)(0.45)
Non-operating pension costs0.01 0.59 0.10 0.85 
Restructuring and other, net 0.14 0.31 0.84 0.51 
ERP implementation costs0.10 0.11 0.49 0.30 
Gains on sale of properties(0.02)— (0.10)(0.26)
Early redemption of medium-term notes0.13 — 0.13 — 
Tax adjustments, net(0.01)— 0.42 0.06 
Comparable EPS from continuing operations *$0.83 (0.01)$(0.27)1.01 
*Non-GAAP financial measure. A reconciliation of GAAP EPS from continuing operations to comparable EPS from continuing operations is set forth in this table.
Note: Amounts may not be additive due to rounding.
10


RYDER SYSTEM, INC. AND SUBSIDIARIES
CONDENSED CONSOLIDATED BALANCE SHEETS - UNAUDITED
(In millions)


December 31,
2020
December 31,
2019
Assets:
Cash and cash equivalents$151.3 73.6 
Other current assets1,444.2 1,488.5 
Revenue earning equipment, net8,777.0 10,427.7 
Operating property and equipment, net927.1 917.8 
Other assets1,632.4 1,567.8 
$12,932.0 14,475.3 
Liabilities and shareholders' equity:
Current liabilities$1,536.6 1,470.8 
Total debt (including current portion)6,610.2 7,924.8 
Other non-current liabilities (including deferred income taxes)2,529.6 2,603.4 
Shareholders' equity2,255.6 2,476.3 
$12,932.0 14,475.3 

SELECTED KEY RATIOS AND METRICS
December 31,
2020
December 31,
2019
Debt to equity293 %320 %
Annual effective interest rate (average cost of debt)3.6 %3.3 %

Three months ended December 31,
Twelve months ended December 31,
2020201920202019
Comparable EBITDA*$567.5 557.8 $2,258.3 2,243.4 


Twelve months ended December 31,
20202019
Net cash provided by operating activities from continuing operations$2,181.3 2,140.5 
Proceeds from sales (primarily revenue earning equipment)552.2 518.0 
Capital expenditures paid1,146.5 3,735.2 
Gross capital expenditures (accrual basis)$1,070.0 3,620.4 
Proceeds from sales (primarily revenue earning equipment)(552.2)(518.0)
Net capital expenditures$517.8 3,102.4 

Twelve months ended December 31,
20202019
Adjusted return on equity *(1.3)%0.3 %
Adjusted return on capital *1.8 %1.9 %
Weighted average cost of capital4.7 %4.8 %
Adjusted return on capital spread **(2.9)%(2.9)%

* Non-GAAP financial measure. See reconciliation of the non-GAAP elements of this calculation reconciled to the corresponding GAAP measures included in the Appendix - Non-GAAP Financial Measures section at the end of this release. Comparable EBITDA has been recast to exclude gains/losses from the sale of used vehicles.
** Non-GAAP financial measure. Adjusted return on capital spread is calculated as the difference of the adjusted return on capital and the weighted average cost of capital.
Note: Amounts may not be additive due to rounding.
11


RYDER SYSTEM, INC. AND SUBSIDIARIES
BUSINESS SEGMENT REVENUE AND EARNINGS - UNAUDITED
Periods ended December 31, 2020 and 2019
(In millions)

Three MonthsTwelve Months
20202019B(W)20202019B(W)
Total Revenue:
Fleet Management Solutions:
ChoiceLease$813.4 809.0 %$3,159.9 3,077.1 %
SelectCare123.9 135.8 (9)%514.3 541.4 (5)%
Commercial rental239.2 256.1 (7)%834.2 1,009.1 (17)%
Other16.6 23.6 (30)%69.1 92.3 (25)%
Fuel services revenue139.6 197.5 (29)%569.1 816.4 (30)%
ChoiceLease liability insurance revenue2.1 9.6 (78)%23.8 35.3 (32)%
Total Fleet Management Solutions1,334.8 1,431.5 (7)%5,170.5 5,571.4 (7)%
Supply Chain Solutions711.2 648.7 10 %2,544.4 2,551.3 — %
Dedicated Transportation Solutions300.9 346.4 (13)%1,229.4 1,417.5 (13)%
Eliminations(134.0)(150.1)11 %(524.2)(614.4)15 %
Total revenue$2,212.9 2,276.5 (3)%$8,420.1 8,925.8 (6)%
Operating Revenue: *
Fleet Management Solutions$1,193.2 1,224.5 (3)%$4,577.6 4,719.8 (3)%
Supply Chain Solutions505.7 466.4 %1,870.4 1,880.0 (1)%
Dedicated Transportation Solutions231.0 241.3 (4)%929.2 972.7 (4)%
Eliminations(90.5)(93.4)%(353.2)(383.4)%
Operating revenue$1,839.4 1,838.8 — %$7,024.0 7,189.1 (2)%
Business Segment Earnings:
Earnings (loss) from continuing operations
before income taxes:
Fleet Management Solutions$60.2 (80.4)NM$(142.0)(70.3)NM
Supply Chain Solutions34.2 32.4 %159.9 145.1 10 %
Dedicated Transportation Solutions15.3 18.1 (16)%73.4 81.1 (9)%
Eliminations(12.1)(8.1)(48)%(42.8)(50.7)16 %
97.6 (38.0)NM48.6 105.2 (54)%
Unallocated Central Support Services(49.3)(14.7)NM(77.4)(49.1)(58)%
Non-operating pension costs(1.8)(40.3)96 %(11.2)(60.4)82 %
Other items impacting comparability, net(23.2)(29.2)20 %(90.4)(38.0)NM
Earnings (loss) from continuing operations
before income taxes
23.3 (122.2)NM(130.4)(42.3)NM
Provision for (benefit from) income taxes(2.5)(69.2)(96)%(18.4)(19.0)(3)%
Earnings (loss) from continuing operations$25.8 (53.1)NM$(112.0)(23.3)NM

* Non-GAAP financial measure. See reconciliation of GAAP total revenue to operating revenue in the Appendix - Non-GAAP Financial Measures section at the end of this release.
Note: Amounts may not be additive due to rounding.
NM - Not Meaningful


12


RYDER SYSTEM, INC. AND SUBSIDIARIES
BUSINESS SEGMENT INFORMATION - UNAUDITED
Periods ended December 31, 2020 and 2019
(In millions)

Three MonthsTwelve Months
20202019B(W)20202019B(W)
Fleet Management Solutions
FMS total revenue$1,334.8 1,431.5 (7)%$5,170.5 5,571.4 (7)%
Fuel services revenue(a)
(139.6)(197.5)(29)%(569.1)(816.4)(30)%
ChoiceLease liability insurance revenue(2.1)(9.6)(78)%(23.8)(35.3)(32)%
FMS operating revenue *$1,193.2 1,224.5 (3)%$4,577.6 4,719.8 (3)%
Segment earnings (loss) before income taxes$60.2 (80.4)NM$(142.0)(70.3)NM
FMS earnings (loss) before income taxes as % of FMS
total revenue
4.5%(5.6)%(2.7)%(1.3)%
FMS earnings (loss) before income taxes as % of FMS
operating revenue *
5.0%(6.6)%(3.1)%(1.5)%
Supply Chain Solutions
SCS total revenue$711.2 648.7 10 %$2,544.4 2,551.3 — %
Subcontracted transportation(184.0)(154.3)19 %(593.9)(554.7)%
Fuel(21.5)(28.0)(23)%(80.1)(116.6)(31)%
SCS operating revenue *$505.7 466.4 %$1,870.4 1,880.0 (1)%
Segment earnings before income taxes$34.2 32.4 %$159.9 145.1 10 %
SCS earnings before income taxes as % of SCS total
revenue
4.8%5.0%6.3%5.7%
SCS earnings before income taxes as % of SCS
operating revenue *
6.8%6.9%8.6%7.7%
Dedicated Transportation Solutions
DTS total revenue$300.9 346.4 (13)%$1,229.4 1,417.5 (13)%
Subcontracted transportation(43.4)(69.5)(38)%(191.9)(299.5)(36)%
Fuel(26.5)(35.6)(26)%(108.2)(145.3)(26)%
DTS operating revenue *$231.0 241.3 (4)%$929.2 972.7 (4)%
Segment earnings before income taxes$15.3 18.1 (16)%$73.4 81.1 (9)%
DTS earnings before income taxes as % of DTS total
revenue
5.1%5.2%6.0%5.7%
DTS earnings before income taxes as % of DTS
operating revenue *
6.6%7.5%7.9%8.3%

* Non-GAAP financial measure. A reconciliation of (1) GAAP total revenue to operating revenue for each business segment (FMS, SCS and DTS) and (2) segment earnings before taxes (EBT) as % of segment total revenue to segment EBT as % of segment operating revenue for each business segment is set forth in this table.
Note: Amounts may not be additive due to rounding.

(a) Includes intercompany fuel sales from FMS to SCS and DTS.
13


RYDER SYSTEM, INC. AND SUBSIDIARIES
BUSINESS SEGMENT INFORMATION - UNAUDITED
KEY PERFORMANCE INDICATORS

Three months ended December 31,Twelve months ended December 31,2020/2019
2020201920202019Three MonthsTwelve Months
ChoiceLease
Average fleet count150,400 160,200 154,800 156,600 (6)%(1)%
End of period fleet count149,600 159,800 149,600 159,800 (6)%(6)%
Miles/unit per day change - % (a)
0.4 %0.9 %(2.2)%0.2 %
Average Active ChoiceLease vehicles (b)
143,100 146,900 145,500 144,300 (3)%1%
Revenue per active ChoiceLease vehicle (c)
$5,700 $5,500 $21,700 $21,300 4%2%
Commercial rental
Average fleet count35,100 43,300 37,500 44,100 (19)%(15)%
End of period fleet count35,000 41,900 35,000 41,900 (16)%(16)%
Rental utilization - power units79.1 %76.0 %67.4 %75.0 %310bps(760)bps
Rental rate change - % (d)
6.0 %2.4 %4.4 %2.4 %
Customer vehicles under
SelectCare contracts
Average fleet count52,700 56,900 54,900 56,300 (7)%(2)%
End of period fleet count50,300 55,800 50,300 55,800 (10)%(10)%
Customer vehicles under
SelectCare on-demand (e)
Fleet serviced during the period6,400 8,500 18,800 23,200 (25)%(19)%
SCS
Average fleet count (f)
9,500 9,700 9,600 9,700 (2)%(1)%
End of period fleet count (f)
9,400 9,700 9,400 9,700 (3)%(3)%
DTS
Average fleet count (f)
9,300 9,500 9,400 9,600 (2)%(2)%
End of period fleet count (f)
9,200 9,400 9,200 9,400 (2)%(2)%
Used vehicle sales (UVS)
Average UVS inventory9,000 8,200 11,300 7,800 10%45%
End of period fleet count7,700 9,400 7,700 9,400 (18)%(18)%
Used vehicles sold7,000 6,000 27,600 21,300 17%30%
UVS pricing change (g)
Tractors15 %(25)%(14)%(3)%
Trucks22 %(10)%%(6)%
Notes:
(a)Represents percentage change compared to prior year period in miles driven per vehicle per workday on US lease power units.
(b)Active ChoiceLease vehicles are calculated as those units currently earning revenue and not classified as not yet earning or no longer earning units.
(c)Calculated based on the reported quarterly and year-to-date ChoiceLease revenue.
(d)Represents percentage change compared to prior year period in average global rental rate per day on power units using constant currency.
(e)Comprised of the number of vehicles serviced under on-demand maintenance agreements. Vehicles included in the end of period count may have been serviced more than one time during the respective period.
(f)These vehicle counts are also included within the average fleet counts for ChoiceLease, Commercial rental and SelectCare.
(g)Represents percentage change compared to prior year period in average sales proceeds on used vehicle sales using constant currency.
14


RYDER SYSTEM, INC. AND SUBSIDIARIES
APPENDIX - NON-GAAP FINANCIAL MEASURE RECONCILIATIONS - UNAUDITED

This press release and accompanying tables include “non-GAAP financial measures” as defined by SEC rules. As required by SEC rules, we provide a reconciliation of each non-GAAP financial measure to the most comparable GAAP measure. Non-GAAP financial measures should be considered in addition to, but not as a substitute for or superior to, other measures of financial performance prepared in accordance with GAAP.

Specifically, the following non-GAAP financial measures are included in this press release:

Non-GAAP Financial MeasureComparable GAAP MeasureReconciliation in Section Entitled
Operating Revenue Measures:
Operating RevenueTotal RevenueAppendix - Non-GAAP Financial Measure Reconciliations
FMS Operating RevenueFMS Total RevenueBusiness Segment Information - Unaudited
SCS Operating RevenueSCS Total Revenue
DTS Operating RevenueDTS Total Revenue
FMS EBT as a % of FMS Operating RevenueFMS EBT as a % of FMS Total RevenueBusiness Segment Information - Unaudited
SCS EBT as a % of SCS Operating RevenueSCS EBT as a % of SCS Total Revenue
DTS EBT as a % of DTS Operating RevenueDTS EBT as a % of DTS Total Revenue
Comparable Earnings Measures:
Comparable Earnings (Loss) Before Income Tax and Comparable Tax RateEarnings (Loss) Before Income Tax and Effective Tax Rate from Continuing OperationsAppendix - Non-GAAP Financial Measure Reconciliations
Comparable Earnings (Loss)Earnings (Loss) from Continuing OperationsAppendix - Non-GAAP Financial Measure Reconciliations
Comparable EPS EPS from Continuing Operations Condensed Consolidated Statements of Earnings - Unaudited
Adjusted Return on Equity (ROE)Not Applicable. However, the non-GAAP elements of the calculation have been reconciled to the corresponding GAAP measures. A numerical reconciliation of net earnings to adjusted net earnings and average shareholders' equity to adjusted average equity is provided in the following reconciliations.Appendix - Non-GAAP Financial Measure Reconciliations
Adjusted Return on Capital (ROC) and Adjusted ROC SpreadNot Applicable. However, non-GAAP elements of the calculation have been reconciled to the corresponding GAAP measures. A numerical reconciliation of net earnings to adjusted net earnings and average total debt and average shareholders' equity to adjusted average total capital is provided.Appendix - Non-GAAP Financial Measure Reconciliations
Comparable Earnings Before Interest, Taxes, Depreciation and AmortizationNet Earnings (Loss)Appendix - Non-GAAP Financial Measure Reconciliations
Cash Flow Measures:
Total Cash Generated and Free Cash FlowCash Provided by Operating ActivitiesAppendix - Non-GAAP Financial Measure Reconciliations


15


RYDER SYSTEM, INC. AND SUBSIDIARIES
APPENDIX - NON-GAAP FINANCIAL MEASURE RECONCILIATIONS - UNAUDITED

Set forth in the table below is an overview of each non-GAAP financial measure and why management believes that presentation of each non-GAAP financial measure provides useful information to investors. See reconciliations for each of these measures following this table.
Operating Revenue Measures:
Operating Revenue

FMS Operating Revenue

SCS Operating Revenue

DTS Operating Revenue

FMS EBT as a % of FMS Operating Revenue

SCS EBT as a % of SCS Operating Revenue

DTS EBT as a % of DTS Operating Revenue

Operating revenue is defined as total revenue for Ryder System, Inc. or each business segment (FMS, SCS and DTS) excluding any (1) fuel and (2) subcontracted transportation, as well as (3) revenue from our ChoiceLease liability insurance program which was discontinued in early 2020. We believe operating revenue provides useful information to investors as we use it to evaluate the operating performance of our core businesses and as a measure of sales activity at the consolidated level for Ryder System, Inc., as well as for each of our business segments. We also use segment EBT as a percentage of segment operating revenue for each business segment for the same reason. Note: FMS EBT, SCS EBT and DTS EBT, our primary measures of segment performance, are not non-GAAP measures.

Fuel: We exclude FMS, SCS and DTS fuel from the calculation of our operating revenue measures, as fuel is an ancillary service that we provide our customers, which is impacted by fluctuations in market fuel prices and the costs are largely a pass-through to our customers, resulting in minimal changes in our profitability during periods of steady market fuel prices. However, profitability may be positively or negatively impacted by rapid changes in market fuel prices during a short period of time, as customer pricing for fuel services is established based on trailing market fuel costs.

Subcontracted transportation: We also exclude subcontracted transportation from the calculation of our operating revenue measures, as these services are also typically a pass-through to our customers and, therefore, fluctuations result in minimal changes to our profitability. While our SCS and DTS business segments subcontract certain transportation services to third party providers, our FMS business segment does not engage in subcontracted transportation and, therefore, this item is not applicable to FMS.

ChoiceLease liability Insurance: We exclude ChoiceLease liability insurance as we announced our plan in the first quarter of 2020 to exit the extension of our liability insurance coverage for ChoiceLease customers. The exit of this program is estimated to be completed in the second quarter of 2021. We are excluding the revenues associated with this program for better comparability of our on-going operations.
16


Comparable Earnings Measures:
Comparable Earnings (Loss) Before Income Taxes (EBT) and Comparable Tax Rate

Comparable Earnings

Comparable Earnings per Diluted Common Share (EPS)

Adjusted Return on Equity (ROE)

Adjusted Return on Capital (ROC) and Adjusted ROC Spread


Comparable EBT, comparable earnings and comparable EPS are defined, respectively, as GAAP EBT, earnings and EPS, all from continuing operations, excluding (1) non-operating pension costs and (2) any other significant items that are not representative of our business operations. We believe these comparable earnings measures provide useful information to investors and allow for better year-over-year comparison of operating performance.
Non-operating pension costs: Our comparable earnings measures exclude non-operating pension costs, which include the amortization of net actuarial loss and prior service cost, interest cost and expected return on plan assets components of pension and postretirement benefit costs, as well as a settlement or curtailment of a plan if one has occurred. We exclude non-operating pension costs because we consider these to be impacted by financial market performance and outside the operational performance of our business.

Other Items Impacting Comparability: Our comparable and adjusted earnings measures also exclude other significant items that are not representative of our business operations as detailed in the reconciliation table below. These other significant items vary from period to period and, in some periods, there may be no such significant items.

Calculation of comparable tax rate: The comparable provision for income taxes is computed using the same methodology as the GAAP provision for income taxes. Income tax effects of non-GAAP adjustments are calculated based on the statutory tax rates of the jurisdictions to which the non-GAAP adjustments relate.

Adjusted ROE: Adjusted ROE is defined as adjusted net earnings divided by adjusted average shareholders' equity and represents the rate of return on shareholders' investment. Other items impacting comparability described above are excluded, as applicable, from the calculation of net earnings and average shareholders' equity. We use adjusted ROE as an internal measure of how effectively we use the owned capital invested in our operations.

Adjusted ROC: Adjusted ROC is defined as adjusted net earnings divided by average total capital and represents the rate of return generated by the capital deployed in our business. Other items impacting comparability described above are excluded, as applicable, from the calculation of net earnings and average shareholders' equity (a component of average total capital).We use adjusted ROC as an internal measure of how effectively we use the capital invested (borrowed or owned) in our operations. Adjusted return on capital spread is calculated as the difference of the adjusted return on capital and the weighted average cost of capital.
Comparable Earnings Before Interest, Taxes, Depreciation and Amortization
Comparable EBITDA is defined as earnings from continuing operations, net of tax, first adjusted to exclude the following items, all from continuing operations: (1) non-operating pension costs and (2) any other items that are not representative of our business operations (these items are the same items that are excluded from comparable earnings measures for the relevant periods and are described under Comparable Earnings Measures above) and then adjusted further for (1) interest expense, (2) income taxes, (3) depreciation, (4) used vehicle sales results and (5) amortization.

We believe comparable EBITDA provides investors with useful information, as it is a standard measure commonly reported and widely used by analysts, investors and other interested parties to measure financial performance and our ability to service debt and meet our payment obligations. In addition, we believe that the inclusion of comparable EBITDA provides consistency in financial reporting and enables analysts and investors to perform meaningful comparisons of past, present and future operating results. Other companies may calculate comparable EBITDA differently; therefore, our presentation of comparable EBITDA may not be comparable to similarly-titled measures used by other companies.

Comparable EBITDA should not be considered as an alternative to earnings from continuing operations before income taxes or earnings from continuing operations determined in accordance with GAAP, as an indicator of the Company’s operating performance, as an alternative to cash flows from operating activities (determined in accordance with GAAP), as an indicator of cash flows, or as a measure of liquidity.
17


Cash Flow Measures:
Total Cash Generated

Free Cash Flow
We consider total cash generated and free cash flow to be important measures of comparative operating performance, as our principal sources of operating liquidity are cash from operations and proceeds from the sale of revenue earning equipment.
 
Total Cash Generated: Total cash generated is defined as the sum of (1) net cash provided by operating activities, (2) net cash provided by the sale of revenue earning equipment, (3) net cash provided by the sale of operating property and equipment, and (4) other cash inflows from investing activities. We believe total cash generated is an important measure of total cash flows generated from our ongoing business activities.

Free Cash Flow: We refer to the net amount of cash generated from operating activities and investing activities (excluding acquisitions) from continuing operations as “free cash flow”. We calculate free cash flow as the sum of (1) net cash provided by operating activities, (2) net cash provided by the sale of revenue earning equipment, (3) net cash provided by the sale of operating property and equipment, and (4) other cash inflows from investing activities, less (5) purchases of property and revenue earning equipment. We believe free cash flow provides investors with an important perspective on the cash available for debt service and for shareholders, after making capital investments required to support ongoing business operations. Our calculation of free cash flow may be different from the calculation used by other companies and, therefore, comparability may be limited.


18


RYDER SYSTEM, INC. AND SUBSIDIARIES
APPENDIX - NON-GAAP FINANCIAL MEASURE RECONCILIATIONS - UNAUDITED
(In millions)

OPERATING REVENUE RECONCILIATION
Three months ended December 31,Twelve months ended December 31,
2020201920202019
Total revenue$2,212.9 2,276.5 $8,420.1 8,925.8 
Fuel(144.1)(204.3)(586.4)(847.3)
Subcontracted transportation(227.4)(223.8)(785.8)(854.1)
ChoiceLease liability insurance revenue(2.1)(9.6)(23.8)(35.3)
Operating revenue *$1,839.4 1,838.8 $7,024.0 7,189.1 

TOTAL CASH GENERATED / FREE CASH FLOW RECONCILIATION
Twelve months ended December 31,
20202019
Net cash provided by operating activities from continuing operations$2,181.3 2,140.5 
Proceeds from sales (primarily revenue earning equipment) (a)
538.9 465.7 
Sales of operating property and equipment13.3 52.3 
Total cash generated *2,733.5 2,658.5 
Purchases of property and revenue earning equipment (a)
(1,146.5)(3,735.2)
Free cash flow *$1,587.0 (1,076.7)
Memo:
Net cash used in investing activities$(601.0)(3,217.2)
Net cash provided by (used in) financing activities$(1,507.2)1,084.1 

Notes:
(a)Included in cash flows from investing activities.

* Non-GAAP financial measure. See definition above.
Note: Amounts may not be additive due to rounding.


19


RYDER SYSTEM, INC. AND SUBSIDIARIES
APPENDIX - NON-GAAP FINANCIAL MEASURE RECONCILIATIONS - UNAUDITED
(In millions)


ADJUSTED RETURN ON EQUITY RECONCILIATION
Twelve months ended December 31,
20202019
Net earnings (loss) (12-month rolling period)$(122.3)(24.4)
+ Other items impacting comparability *90.4 38.0 
+ Income taxes (a)
(18.3)(19.0)
Adjusted earnings before income taxes(50.2)(5.4)
- Adjusted income taxes (b)
20.9 13.0 
= Adjusted net earnings for ROE (numerator)** [A]$(29.3)7.6 
Average shareholders' equity$2,256.8 2,532.9 
Adjustment to equity (c)
59.7 15.0 
Adjusted average total equity (denominator)** [B]$2,316.5 2,547.9 
Adjusted ROE ** [A]/[B](1.3)%0.3 %

Notes:
(a)Includes income taxes on discontinued operations.
(b)Represents the tax provision on adjusted earnings before income taxes.
(c)Represents the impact to equity of items to arrive at adjusted earnings.

* Other items impacting comparability includes the following:
Twelve months ended December 31,
20202019
Restructuring and other, net$52.5 35.3 
ERP implementation costs34.3 21.3 
Gains on sale of properties(5.4)(18.6)
Early redemption of medium-term notes9.0 — 
Other items impacting comparability$90.4 38.0 

** Non-GAAP financial measure. Non-GAAP elements of the calculation have been reconciled to the corresponding GAAP measures. A numerical reconciliation of net earnings to adjusted net earnings and average shareholders' equity to adjusted average total equity set forth in this table.


Note: Amounts may not be additive due to rounding.


20


RYDER SYSTEM, INC. AND SUBSIDIARIES
APPENDIX - NON-GAAP FINANCIAL MEASURE RECONCILIATIONS - UNAUDITED
(In millions)


ADJUSTED RETURN ON CAPITAL RECONCILIATION
Twelve months ended December 31,
20202019
Net earnings (loss) (12-month rolling period)$(122.3)(24.4)
+ Other items impacting comparability *90.4 38.0 
+ Income taxes (a)
(18.3)(19.0)
Adjusted earnings before income taxes(50.2)(5.4)
 + Interest expense (b)
252.3 241.5 
 - Adjusted income taxes (c)
(24.0)(43.2)
= Adjusted net earnings for ROC (numerator)** [A]$178.2 192.9 
Average total debt$7,658.7 7,427.2 
Average shareholders' equity2,256.8 2,532.9 
Adjustment to equity (d)
59.7 15.0 
Adjusted average total capital (denominator)** [B]$9,975.2 9,975.1 
Adjusted ROC ** [A]/[B]1.8 %1.9 %
Weighted average cost of capital4.7 %4.8 %
Adjusted return on capital spread***(2.9)%(2.9)%

Notes:
(a)Includes income taxes on discontinued operations.
(b)Excludes interest expense of $9 million recorded for the early redemption of two medium-term notes as it is presented above in "Other items impacting comparability, net."
(c)Represents the tax provision on adjusted earnings before income taxes and adjusted interest expense.
(d)Represents the impact to equity of items to arrive at adjusted earnings.

* See our Adjusted Return on Equity Reconciliation above for further details regarding other items impacting comparability.
** Non-GAAP financial measure. Non-GAAP elements of the calculation have been reconciled to the corresponding GAAP measures. A numerical reconciliation of net earnings to adjusted net earnings and average total debt and average shareholders' equity to adjusted average total capital set forth in this table.
*** Non-GAAP financial measure. Adjusted return on capital spread is calculated as the difference of the adjusted return on capital and the weighted average cost of capital.

Note: Amounts may not be additive due to rounding.


21


RYDER SYSTEM, INC. AND SUBSIDIARIES
APPENDIX - NON-GAAP FINANCIAL MEASURE RECONCILIATIONS - UNAUDITED
(In millions)


COMPARABLE EARNINGS BEFORE INTEREST, TAXES, DEPRECIATION AND AMORTIZATION

Three months ended December 31,Twelve months ended December 31,
2020201920202019
Net earnings (loss)$25.6 (53.5)$(122.3)(24.4)
+(Earnings) loss from discontinued operations, net of tax0.1 0.4 10.3 1.1 
+ Provision for (benefit from) income taxes(2.5)(69.2)(18.4)(19.0)
Earnings before income taxes from continuing operations23.3 (122.2)(130.4)(42.3)
+ Non-operating pension costs1.8 40.3 11.2 60.4 
+ Restructuring and other, net10.8 21.6 76.4 35.3 
+ ERP implementation costs7.1 7.6 34.3 21.3 
+ Gains on sale of properties(1.7)— (5.4)(18.6)
+ Early redemption of medium-term notes9.0 — 9.0 — 
+ ChoiceLease liability insurance revenue(2.1)— (23.8)— 
Comparable earnings (loss) before income taxes48.3 (52.7)(28.8)56.1 
+ Interest expense59.9 62.8 252.3 241.4 
+ Depreciation475.1 536.2 2,027.4 1,878.9 
+ Used vehicle sales, net(17.7)9.6 (0.4)58.7 
+ Amortization1.9 2.0 7.7 8.3 
Comparable EBITDA *$567.5 557.8 $2,258.3 2,243.4 


* Non-GAAP financial measure. Non-GAAP elements of the calculation have been reconciled to the corresponding GAAP measures. A numerical reconciliation of earnings before income taxes from continuing operations to comparable earnings before income taxes from continuing operations is set forth in this table. Comparable EBITDA has been recast to exclude gains/losses from the sale of used vehicles.

Note: Amounts may not be additive due to rounding.


22


RYDER SYSTEM, INC. AND SUBSIDIARIES
APPENDIX - NON-GAAP FINANCIAL MEASURE RECONCILIATIONS - UNAUDITED
(In millions)

COMPARABLE EARNINGS BEFORE INCOME TAXES / EARNINGS / TAX RATE RECONCILIATION
Three months ended December 31,Twelve months ended December 31,
2020201920202019
Earnings (loss) from continuing operations
before income taxes
$23.3 (122.2)$(130.4)(42.3)
Non-operating pension costs1.8 40.3 11.2 60.4 
Restructuring and other, net10.8 21.6 76.4 35.3 
ERP implementation costs7.1 7.6 34.3 21.3 
Gains on sale of properties(1.7)— (5.4)(18.6)
Early redemption of medium-term notes9.0 — 9.0 — 
ChoiceLease liability insurance revenue(2.1)— (23.8)— 
Comparable earnings (loss) before income taxes*$48.3 (52.7)$(28.8)56.1 
Provision for (benefit from) income taxes$(2.5)(69.2)$(18.4)(19.0)
Tax adjustments, net (1)
0.4 — (22.1)(3.5)
Income tax effects of non-GAAP adjustments**6.5 17.1 25.4 25.0 
Comparable provision for (benefit from) income taxes
$4.4 (52.0)$(15.0)2.5 
Earnings (loss) from continuing operations$25.8 (53.1)$(112.0)(23.3)
Non-operating pension costs0.6 30.6 5.3 44.9 
Restructuring and other, net7.4 16.1 43.6 26.5 
ERP implementation costs5.3 5.7 25.4 15.8 
Gains on sale of properties(1.6)— (5.0)(13.8)
Early redemption of medium-term notes6.9 — 6.9 — 
Tax adjustments, net(0.4)— 22.1 3.5 
Comparable earnings (loss) from continuing
operations*
$43.9 (0.7)$(13.8)53.6 
Tax rate on continuing operations(10.6)%(56.6)%(14.1)%(44.9)%
Tax adjustments and income tax effects of non-GAAP
adjustments**
19.6 %(42.1)%(38.0)%49.4 %
Comparable tax rate on continuing operations**9.0 %(98.7)%(52.1)%4.5 %
(1) For the three months ended December 31, 2020, tax adjustments, net included an expense relating to expiring state net operating losses of $0.4 million. For the twelve months ended December 31, 2020, tax adjustments, net included expenses related to a valuation allowance of $13 million on our U.K. deferred tax assets and expiring state net operating losses of $7 million. For the twelve months ended December 31, 2019, tax adjustments, net primarily included an expense relating to expiring state net operating losses of $5 million.

* Non-GAAP financial measure. See definition above.
** The comparable provision for income taxes is computed using the same methodology as the GAAP provision for income taxes. Income tax effects of non-GAAP adjustments are calculated based on the statutory tax rates of the jurisdictions to which the non-GAAP adjustments relate.

Note: Amounts may not be additive due to rounding.


23


RYDER SYSTEM, INC. AND SUBSIDIARIES
APPENDIX - NON-GAAP FINANCIAL MEASURE RECONCILIATIONS - UNAUDITED

COMPARABLE EARNINGS PER SHARE FORECAST RECONCILIATION
First Quarter 2021Full Year 2021
EPS from continuing operations$0.30 - $0.40$4.18 - $4.68
Non-operating pension costs(0.03)(0.13)
Restructuring and other, net0.11 (0.10)
ERP implementation costs0.11 0.16 
Tax adjustments0.01 0.04 
Comparable earnings (loss) per share from continuing operations forecast:*$0.50 - $0.60$4.15 - $4.65

* Non-GAAP financial measure. See definition above.

TOTAL CASH GENERATED / FREE CASH FLOW FORECAST RECONCILIATION
2021 Forecast
Net cash provided by operating activities from continuing operations$2,200 
Proceeds from sales (primarily revenue earning equipment) (1)
500 
Total cash generated *2,700 
Capital expenditures (1)(2)
(2,300 - 2,000)
Free cash flow *$400M - $700M
Memo:
Net cash used in investing activities$(1,600)
Net cash provided by (used in) financing activities$(700)

(1) Included in cash flows from investing activities.
(2) Capital expenditures presented net of changes in accounts payable related to purchases of revenue earning equipment.

* Non-GAAP financial measure. See definition above.

ADJUSTED RETURN ON EQUITY FORECAST RECONCILIATION
2021 Forecast
Net earnings (12-month rolling period)$240
+ Other items impacting comparability *10
+ Income taxes (a)
85
Adjusted earnings before income taxes335
- Adjusted income taxes (b)
(90)
= Adjusted net earnings for ROE (numerator)** [A]$245
Average shareholders' equity$2,300
Adjustment to equity (c)
20
Adjusted average total equity (denominator)** [B]$2,320
Adjusted ROE ** [A]/[B]10.5%
Notes:
(a)Includes income taxes on discontinued operations.
(b)Represents the tax provision on adjusted earnings before income taxes.
(c)Represents the impact to equity of items to arrive at adjusted earnings.

* Forecasted other items impacting comparability includes Restructuring and Other, net of $20 million, gain on sale of property of $(20) million and ERP implementation costs of $10 million.
** Non-GAAP financial measure. Non-GAAP elements of the calculation have been reconciled to the corresponding GAAP measures. A numerical reconciliation of net earnings to adjusted net earnings and average shareholders' equity to adjusted average total equity set forth in this table.

Note: Amounts may not be additive due to rounding.
24
        
Proprietary and Confidential Fourth Quarter 2020 Earnings & 2021 Outlook Conference Call February 11, 2021
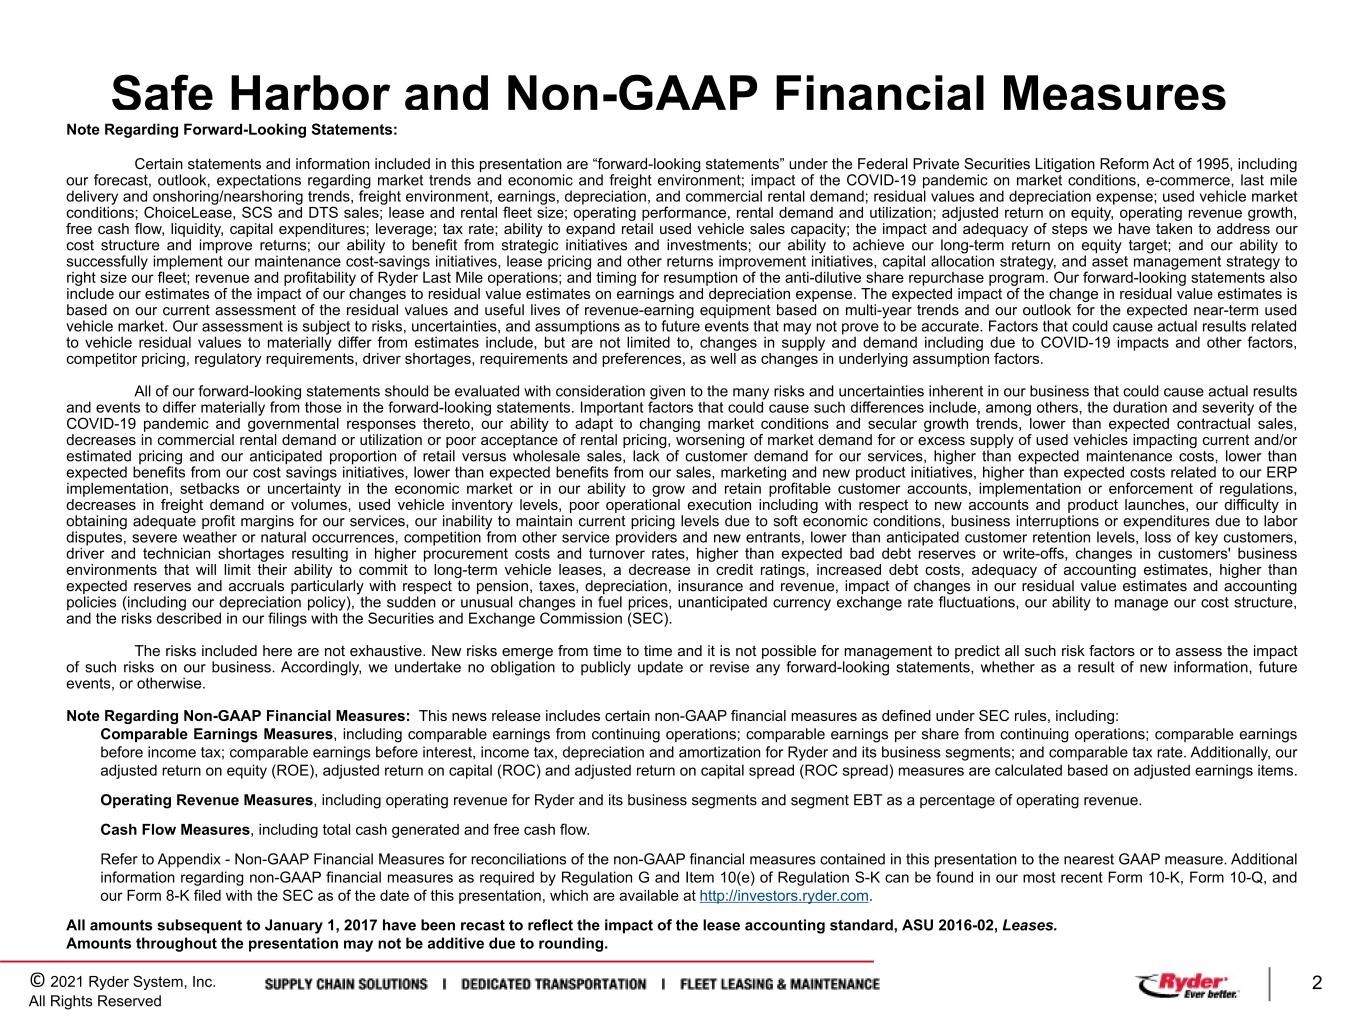

 
© 2021 Ryder System, Inc. All Rights Reserved 2 Safe Harbor and Non-GAAP Financial Measures Note Regarding Forward-Looking Statements: Certain statements and information included in this presentation are “forward-looking statements” under the Federal Private Securities Litigation Reform Act of 1995, including our forecast, outlook, expectations regarding market trends and economic and freight environment; impact of the COVID-19 pandemic on market conditions, e-commerce, last mile delivery and onshoring/nearshoring trends, freight environment, earnings, depreciation, and commercial rental demand; residual values and depreciation expense; used vehicle market conditions; ChoiceLease, SCS and DTS sales; lease and rental fleet size; operating performance, rental demand and utilization; adjusted return on equity, operating revenue growth, free cash flow, liquidity, capital expenditures; leverage; tax rate; ability to expand retail used vehicle sales capacity; the impact and adequacy of steps we have taken to address our cost structure and improve returns; our ability to benefit from strategic initiatives and investments; our ability to achieve our long-term return on equity target; and our ability to successfully implement our maintenance cost-savings initiatives, lease pricing and other returns improvement initiatives, capital allocation strategy, and asset management strategy to right size our fleet; revenue and profitability of Ryder Last Mile operations; and timing for resumption of the anti-dilutive share repurchase program. Our forward-looking statements also include our estimates of the impact of our changes to residual value estimates on earnings and depreciation expense. The expected impact of the change in residual value estimates is based on our current assessment of the residual values and useful lives of revenue-earning equipment based on multi-year trends and our outlook for the expected near-term used vehicle market. Our assessment is subject to risks, uncertainties, and assumptions as to future events that may not prove to be accurate. Factors that could cause actual results related to vehicle residual values to materially differ from estimates include, but are not limited to, changes in supply and demand including due to COVID-19 impacts and other factors, competitor pricing, regulatory requirements, driver shortages, requirements and preferences, as well as changes in underlying assumption factors. All of our forward-looking statements should be evaluated with consideration given to the many risks and uncertainties inherent in our business that could cause actual results and events to differ materially from those in the forward-looking statements. Important factors that could cause such differences include, among others, the duration and severity of the COVID-19 pandemic and governmental responses thereto, our ability to adapt to changing market conditions and secular growth trends, lower than expected contractual sales, decreases in commercial rental demand or utilization or poor acceptance of rental pricing, worsening of market demand for or excess supply of used vehicles impacting current and/or estimated pricing and our anticipated proportion of retail versus wholesale sales, lack of customer demand for our services, higher than expected maintenance costs, lower than expected benefits from our cost savings initiatives, lower than expected benefits from our sales, marketing and new product initiatives, higher than expected costs related to our ERP implementation, setbacks or uncertainty in the economic market or in our ability to grow and retain profitable customer accounts, implementation or enforcement of regulations, decreases in freight demand or volumes, used vehicle inventory levels, poor operational execution including with respect to new accounts and product launches, our difficulty in obtaining adequate profit margins for our services, our inability to maintain current pricing levels due to soft economic conditions, business interruptions or expenditures due to labor disputes, severe weather or natural occurrences, competition from other service providers and new entrants, lower than anticipated customer retention levels, loss of key customers, driver and technician shortages resulting in higher procurement costs and turnover rates, higher than expected bad debt reserves or write-offs, changes in customers' business environments that will limit their ability to commit to long-term vehicle leases, a decrease in credit ratings, increased debt costs, adequacy of accounting estimates, higher than expected reserves and accruals particularly with respect to pension, taxes, depreciation, insurance and revenue, impact of changes in our residual value estimates and accounting policies (including our depreciation policy), the sudden or unusual changes in fuel prices, unanticipated currency exchange rate fluctuations, our ability to manage our cost structure, and the risks described in our filings with the Securities and Exchange Commission (SEC). The risks included here are not exhaustive. New risks emerge from time to time and it is not possible for management to predict all such risk factors or to assess the impact of such risks on our business. Accordingly, we undertake no obligation to publicly update or revise any forward-looking statements, whether as a result of new information, future events, or otherwise. Note Regarding Non-GAAP Financial Measures: This news release includes certain non-GAAP financial measures as defined under SEC rules, including: Comparable Earnings Measures, including comparable earnings from continuing operations; comparable earnings per share from continuing operations; comparable earnings before income tax; comparable earnings before interest, income tax, depreciation and amortization for Ryder and its business segments; and comparable tax rate. Additionally, our adjusted return on equity (ROE), adjusted return on capital (ROC) and adjusted return on capital spread (ROC spread) measures are calculated based on adjusted earnings items. Operating Revenue Measures, including operating revenue for Ryder and its business segments and segment EBT as a percentage of operating revenue. Cash Flow Measures, including total cash generated and free cash flow. Refer to Appendix - Non-GAAP Financial Measures for reconciliations of the non-GAAP financial measures contained in this presentation to the nearest GAAP measure. Additional information regarding non-GAAP financial measures as required by Regulation G and Item 10(e) of Regulation S-K can be found in our most recent Form 10-K, Form 10-Q, and our Form 8-K filed with the SEC as of the date of this presentation, which are available at http://investors.ryder.com. All amounts subsequent to January 1, 2017 have been recast to reflect the impact of the lease accounting standard, ASU 2016-02, Leases. Amounts throughout the presentation may not be additive due to rounding.
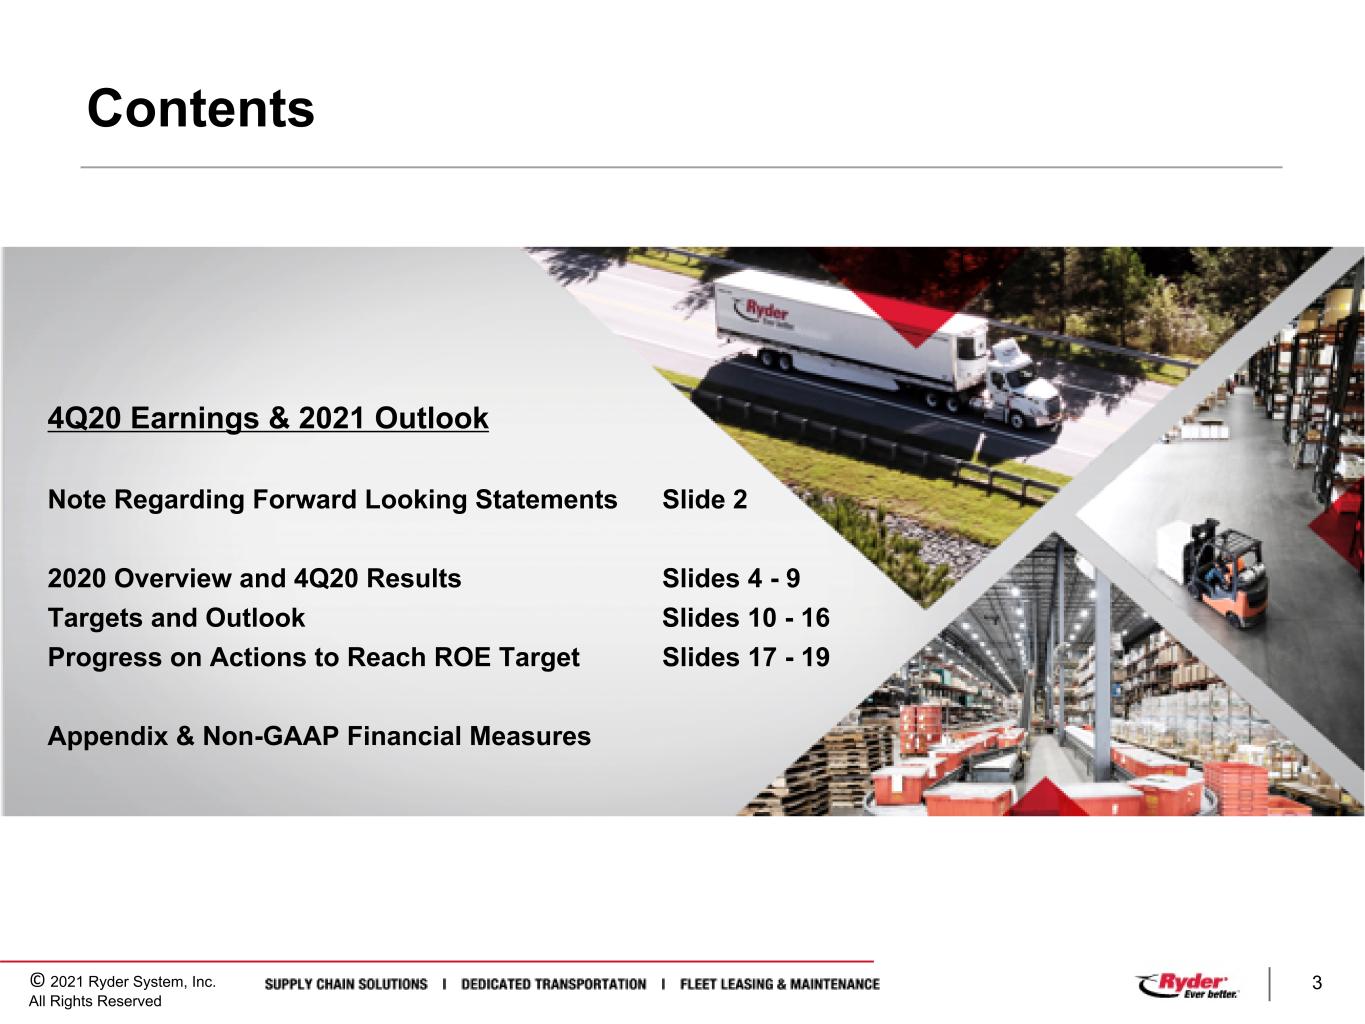

 
© 2021 Ryder System, Inc. All Rights Reserved 3 Contents 4Q20 Earnings & 2021 Outlook Note Regarding Forward Looking Statements Slide 2 2020 Overview and 4Q20 Results Slides 4 - 9 Targets and Outlook Slides 10 - 16 Progress on Actions to Reach ROE Target Slides 17 - 19 Appendix & Non-GAAP Financial Measures
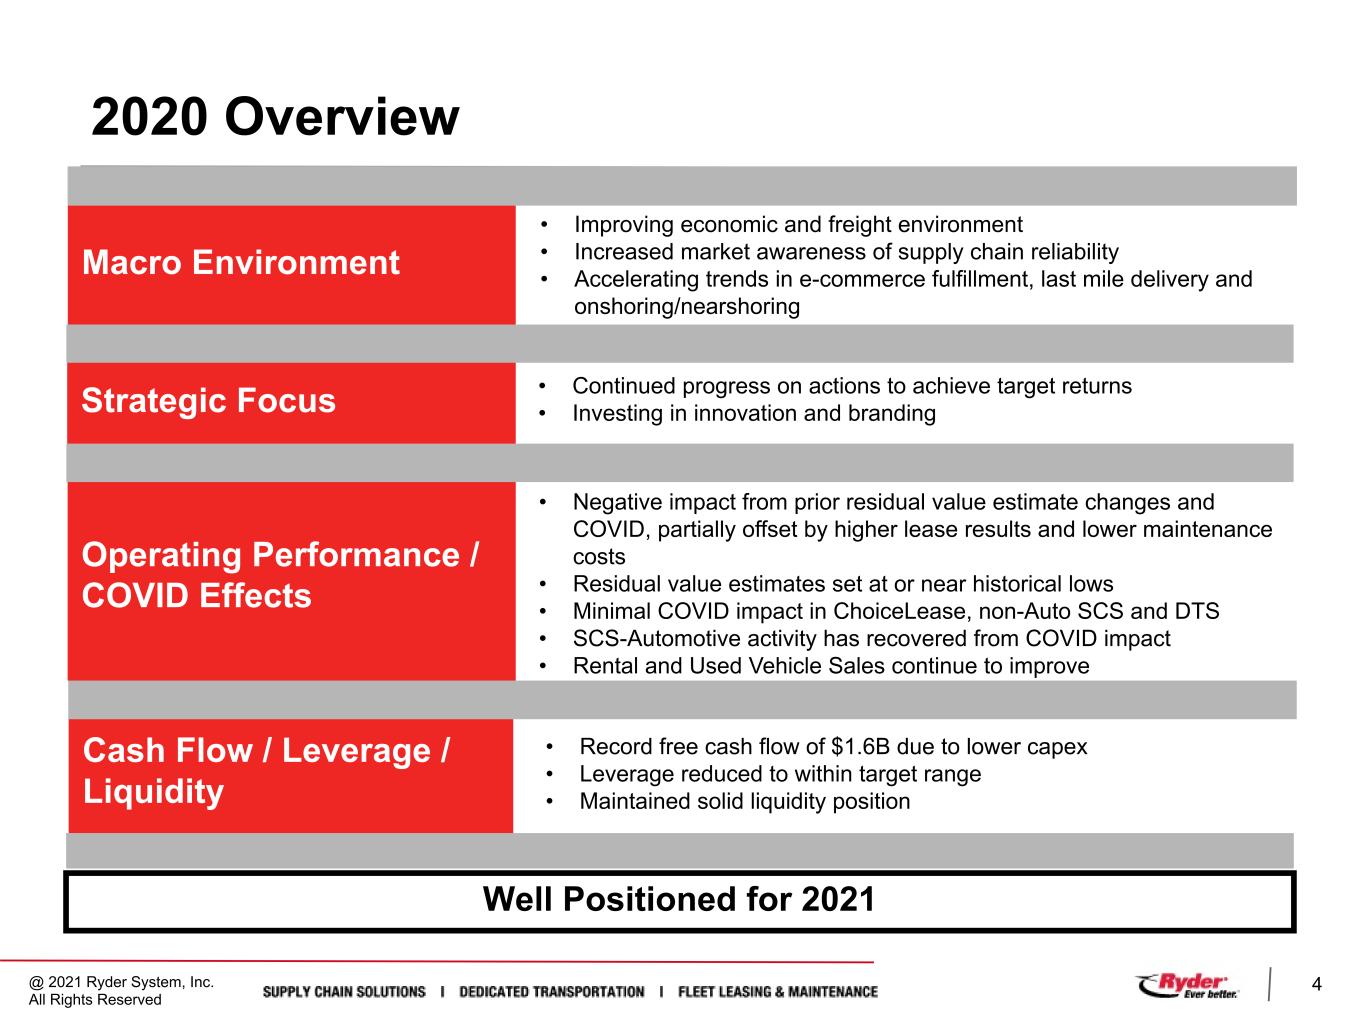

 
@ 2021 Ryder System, Inc. All Rights Reserved 4 2020 Overview Cash Flow / Leverage / Liquidity Operating Performance / COVID Effects Macro Environment Strategic Focus • Negative impact from prior residual value estimate changes and COVID, partially offset by higher lease results and lower maintenance costs • Residual value estimates set at or near historical lows • Minimal COVID impact in ChoiceLease, non-Auto SCS and DTS • SCS-Automotive activity has recovered from COVID impact • Rental and Used Vehicle Sales continue to improve • Record free cash flow of $1.6B due to lower capex • Leverage reduced to within target range • Maintained solid liquidity position • Improving economic and freight environment • Increased market awareness of supply chain reliability • Accelerating trends in e-commerce fulfillment, last mile delivery and onshoring/nearshoring • Continued progress on actions to achieve target returns • Investing in innovation and branding Well Positioned for 2021
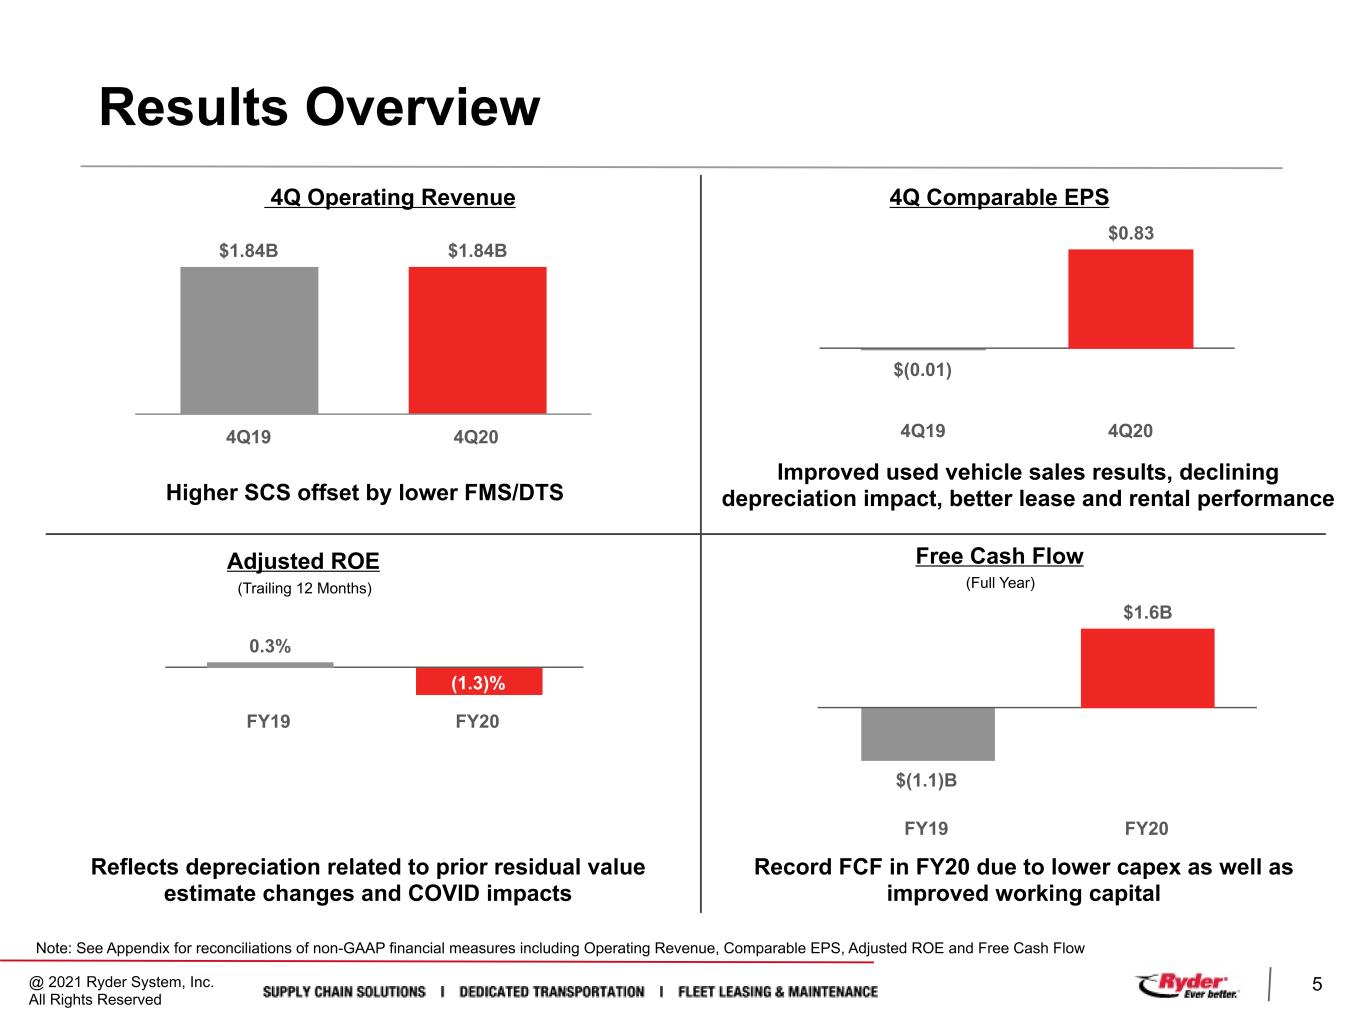

 
@ 2021 Ryder System, Inc. All Rights Reserved 5 Results Overview Note: See Appendix for reconciliations of non-GAAP financial measures including Operating Revenue, Comparable EPS, Adjusted ROE and Free Cash Flow $1.84B $1.84B 4Q19 4Q20 4Q Operating Revenue Higher SCS offset by lower FMS/DTS $(1.1)B $1.6B FY19 FY20 $(0.01) $0.83 4Q19 4Q20 4Q Comparable EPS Improved used vehicle sales results, declining depreciation impact, better lease and rental performance 0.3% (1.3)% FY19 FY20 Adjusted ROE Reflects depreciation related to prior residual value estimate changes and COVID impacts Free Cash Flow Record FCF in FY20 due to lower capex as well as improved working capital (Trailing 12 Months) (Full Year)
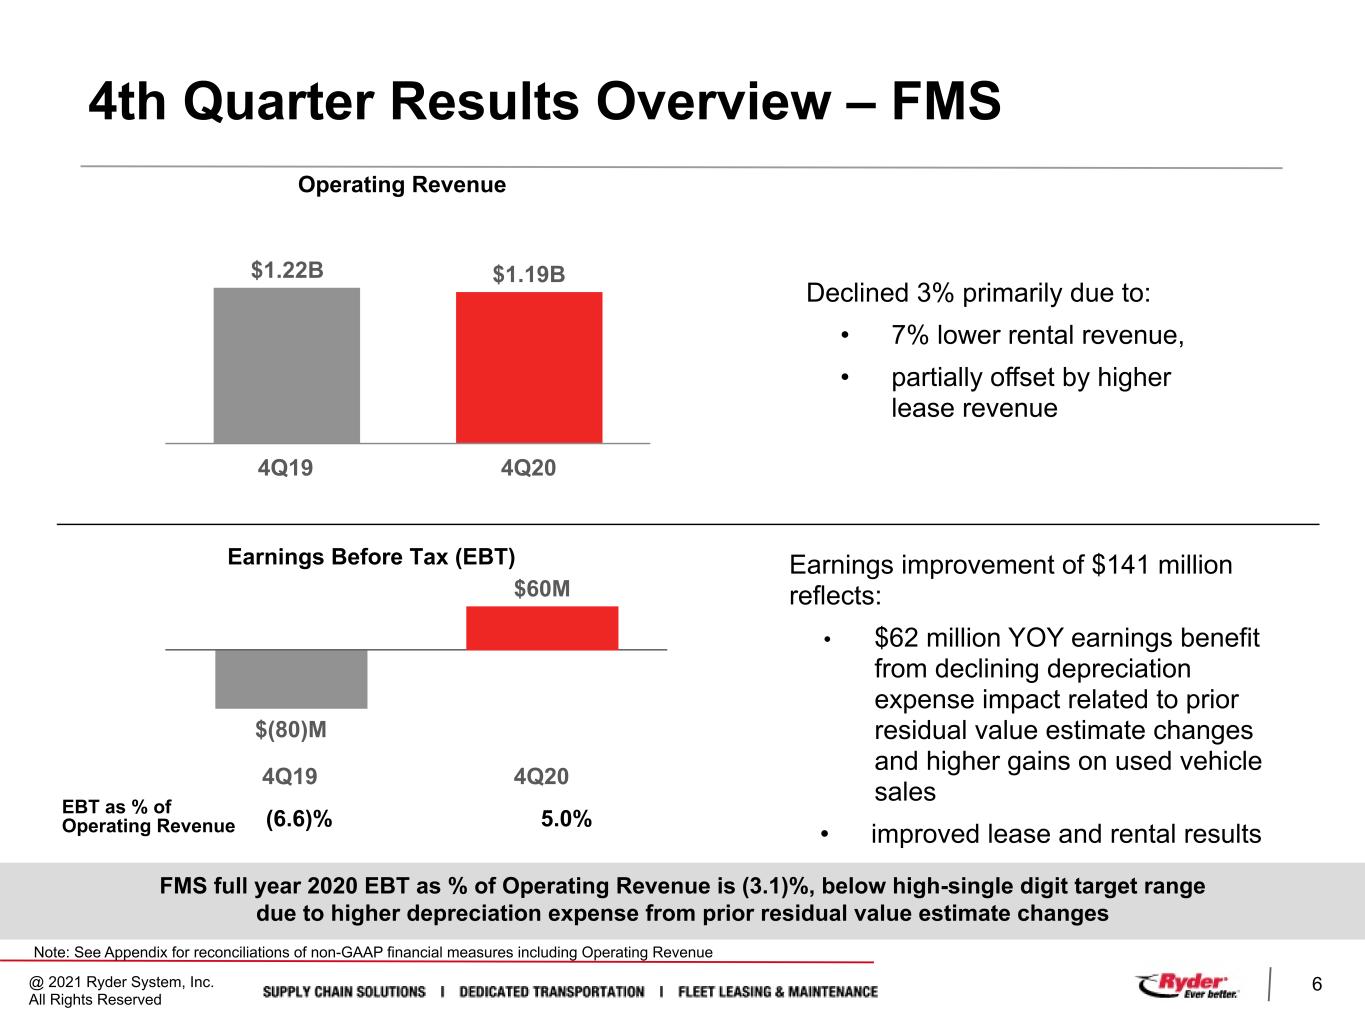

 
@ 2021 Ryder System, Inc. All Rights Reserved 6 4th Quarter Results Overview – FMS Declined 3% primarily due to: • 7% lower rental revenue, • partially offset by higher lease revenue Earnings improvement of $141 million reflects: • $62 million YOY earnings benefit from declining depreciation expense impact related to prior residual value estimate changes and higher gains on used vehicle sales • improved lease and rental results Operating Revenue Earnings Before Tax (EBT) $1.22B $1.19B 4Q19 4Q20 $(80)M $60M 4Q19 4Q20 (6.6)% 5.0%EBT as % of Operating Revenue Note: See Appendix for reconciliations of non-GAAP financial measures including Operating Revenue FMS full year 2020 EBT as % of Operating Revenue is (3.1)%, below high-single digit target range due to higher depreciation expense from prior residual value estimate changes
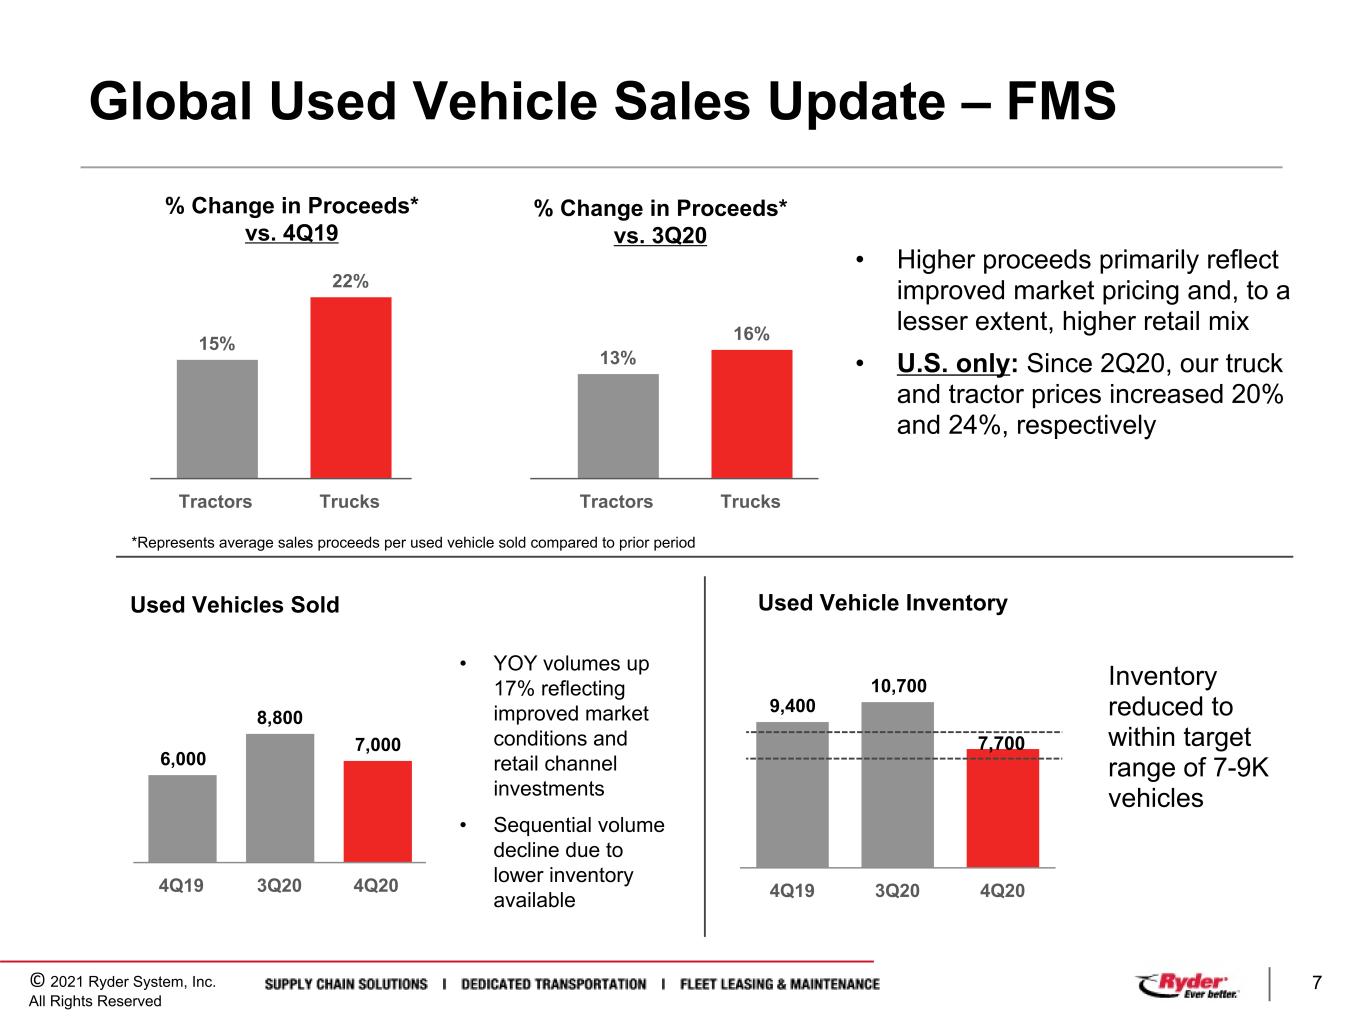

 
© 2021 Ryder System, Inc. All Rights Reserved 7 Global Used Vehicle Sales Update – FMS 15% 22% 13% 16% Tractors Trucks Tractors Trucks % Change in Proceeds* vs. 4Q19 • Higher proceeds primarily reflect improved market pricing and, to a lesser extent, higher retail mix • U.S. only: Since 2Q20, our truck and tractor prices increased 20% and 24%, respectively 6,000 8,800 7,000 4Q19 3Q20 4Q20 Used Vehicles Sold 9,400 10,700 4Q19 3Q20 4Q20 Used Vehicle Inventory *Represents average sales proceeds per used vehicle sold compared to prior period % Change in Proceeds* vs. 3Q20 • YOY volumes up 17% reflecting improved market conditions and retail channel investments • Sequential volume decline due to lower inventory available Inventory reduced to within target range of 7-9K vehicles 7,700
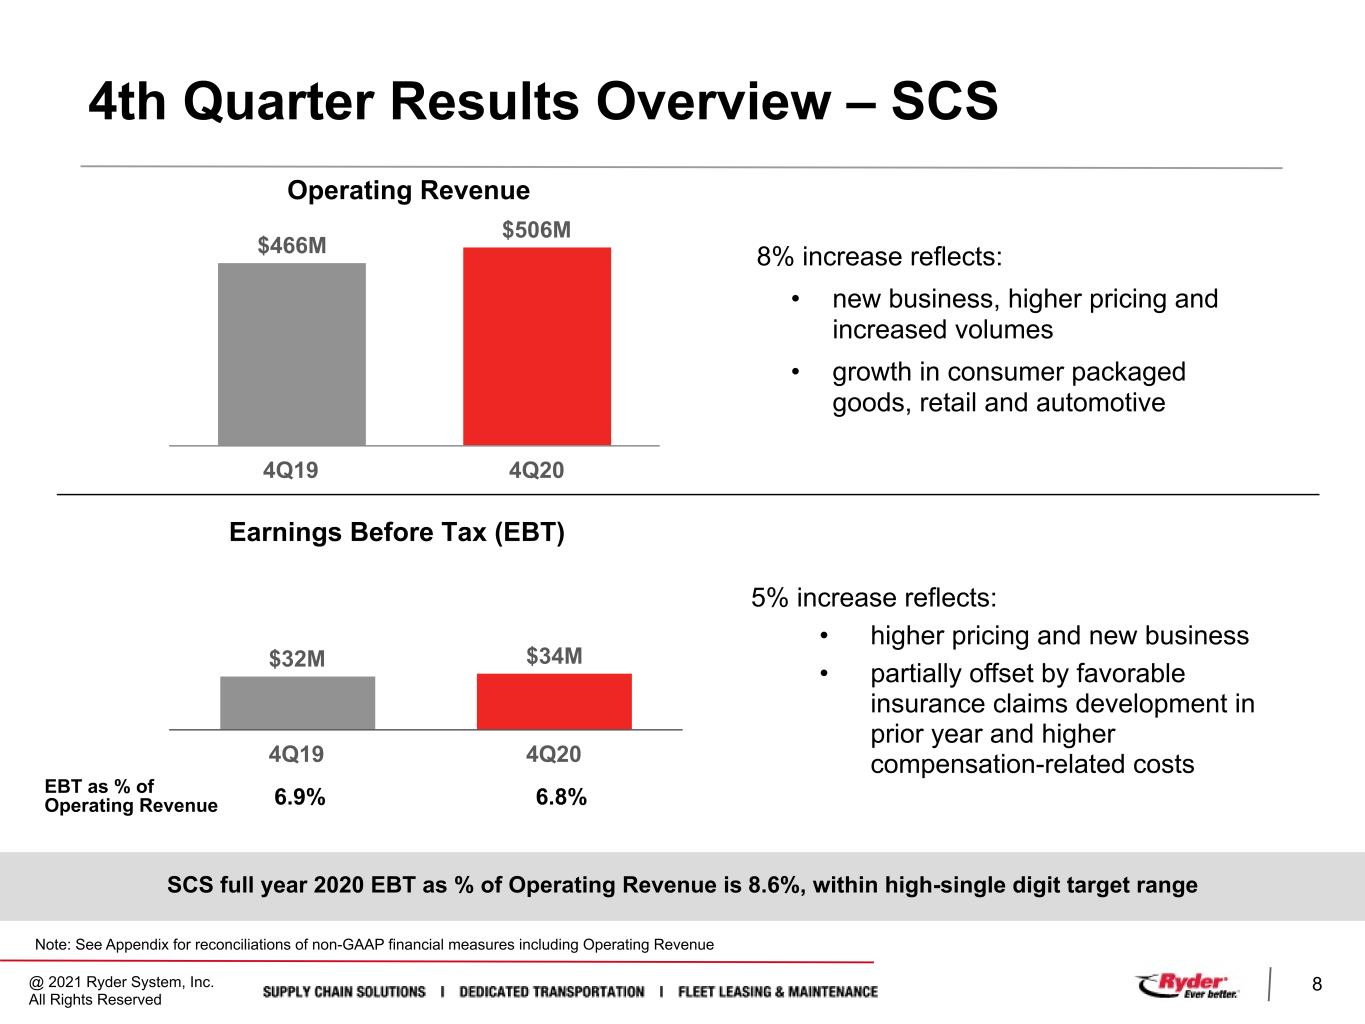

 
@ 2021 Ryder System, Inc. All Rights Reserved 8 4th Quarter Results Overview – SCS 8% increase reflects: • new business, higher pricing and increased volumes • growth in consumer packaged goods, retail and automotive 5% increase reflects: • higher pricing and new business • partially offset by favorable insurance claims development in prior year and higher compensation-related costs Operating Revenue Earnings Before Tax (EBT) $466M $506M 4Q19 4Q20 $32M $34M 4Q19 4Q20 6.9% 6.8%EBT as % of Operating Revenue 7.7% 8.6% Note: See Appendix for reconciliations of non-GAAP financial measures including Operating Revenue SCS full year 2020 EBT as % of Operating Revenue is 8.6%, within high-single digit target range
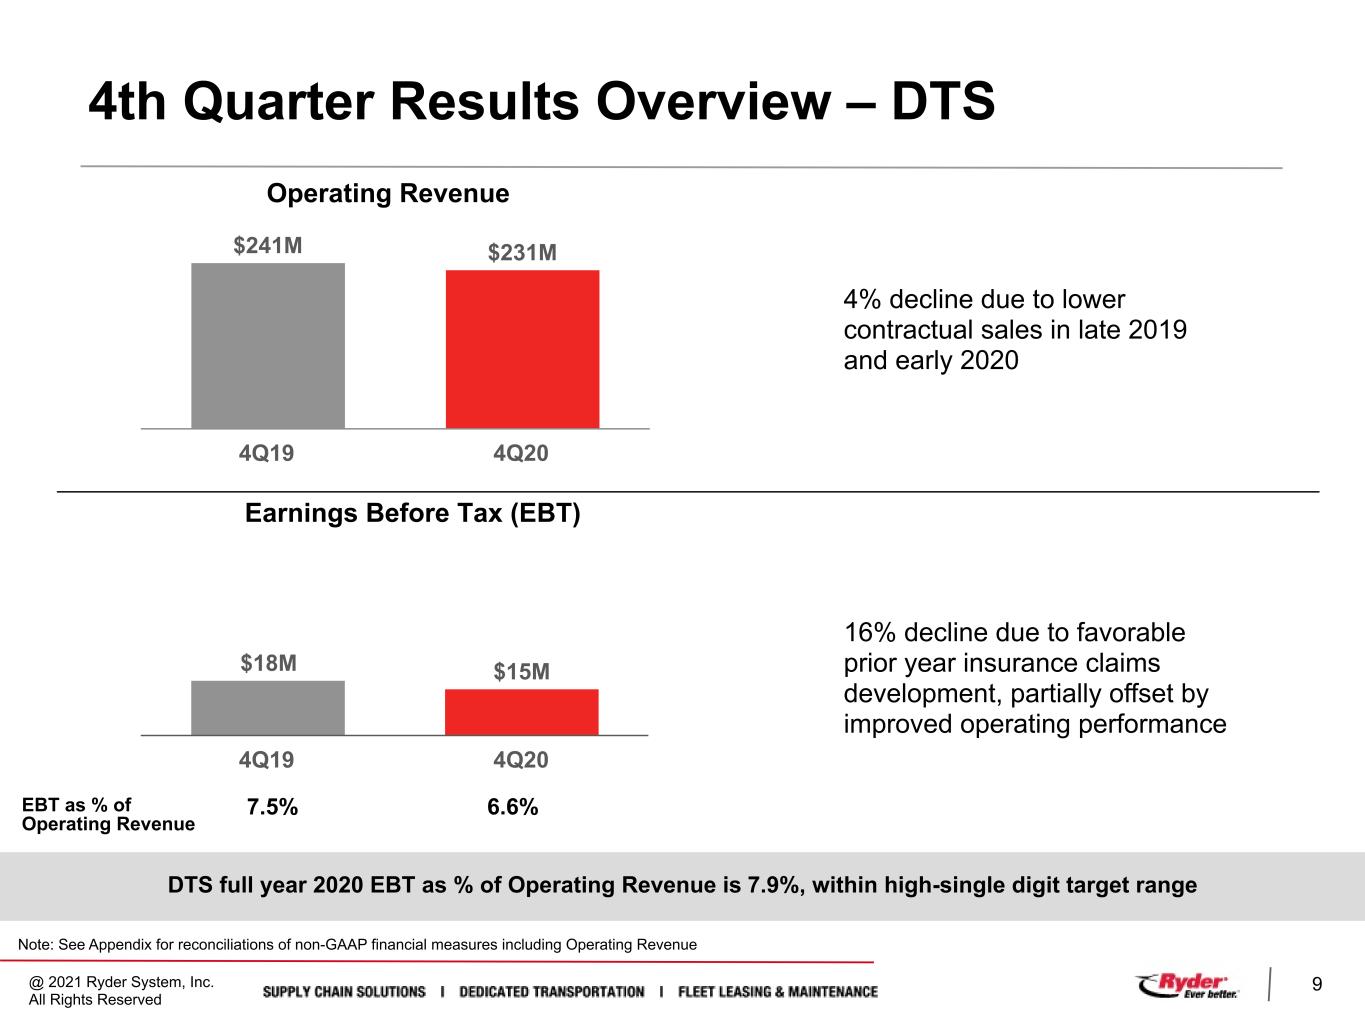

 
@ 2021 Ryder System, Inc. All Rights Reserved 9 4th Quarter Results Overview – DTS Operating Revenue Earnings Before Tax (EBT) $241M $231M 4Q19 4Q20 $18M $15M 4Q19 4Q20 7.5% 6.6%EBT as % of Operating Revenue 4% decline due to lower contractual sales in late 2019 and early 2020 16% decline due to favorable prior year insurance claims development, partially offset by improved operating performance Note: See Appendix for reconciliations of non-GAAP financial measures including Operating Revenue DTS full year 2020 EBT as % of Operating Revenue is 7.9%, within high-single digit target range
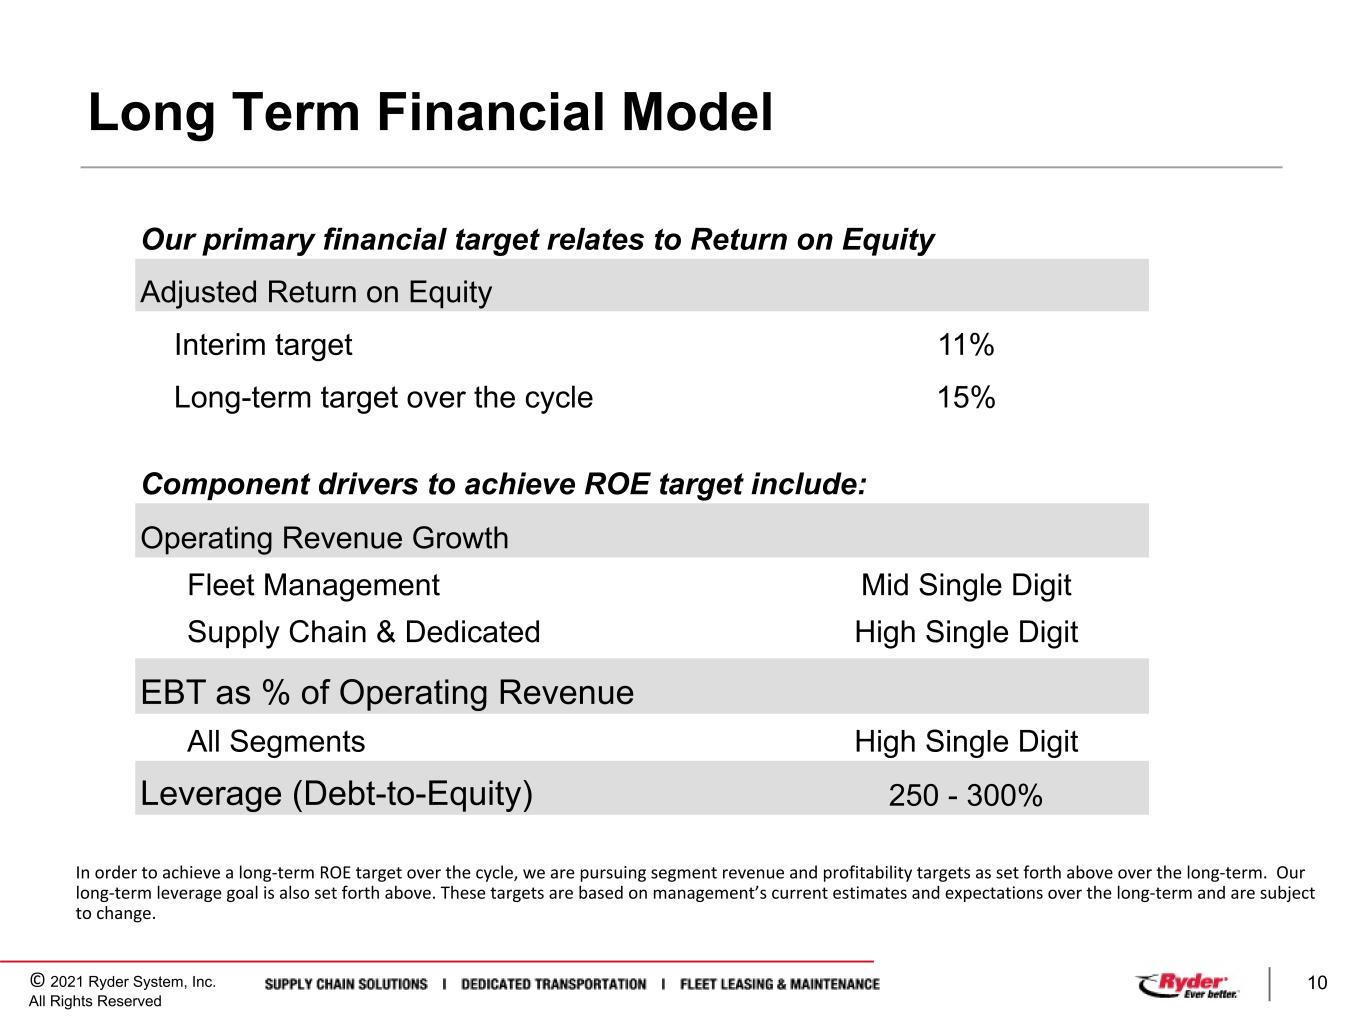

 
© 2021 Ryder System, Inc. All Rights Reserved 10 Our primary financial target relates to Return on Equity Adjusted Return on Equity Interim target 11% Long-term target over the cycle 15% Component drivers to achieve ROE target include: Operating Revenue Growth Fleet Management Mid Single Digit Supply Chain & Dedicated High Single Digit EBT as % of Operating Revenue All Segments High Single Digit Leverage (Debt-to-Equity) 250 - 300% Long Term Financial Model In order to achieve a long-term ROE target over the cycle, we are pursuing segment revenue and profitability targets as set forth above over the long-term. Our long-term leverage goal is also set forth above. These targets are based on management’s current estimates and expectations over the long-term and are subject to change.
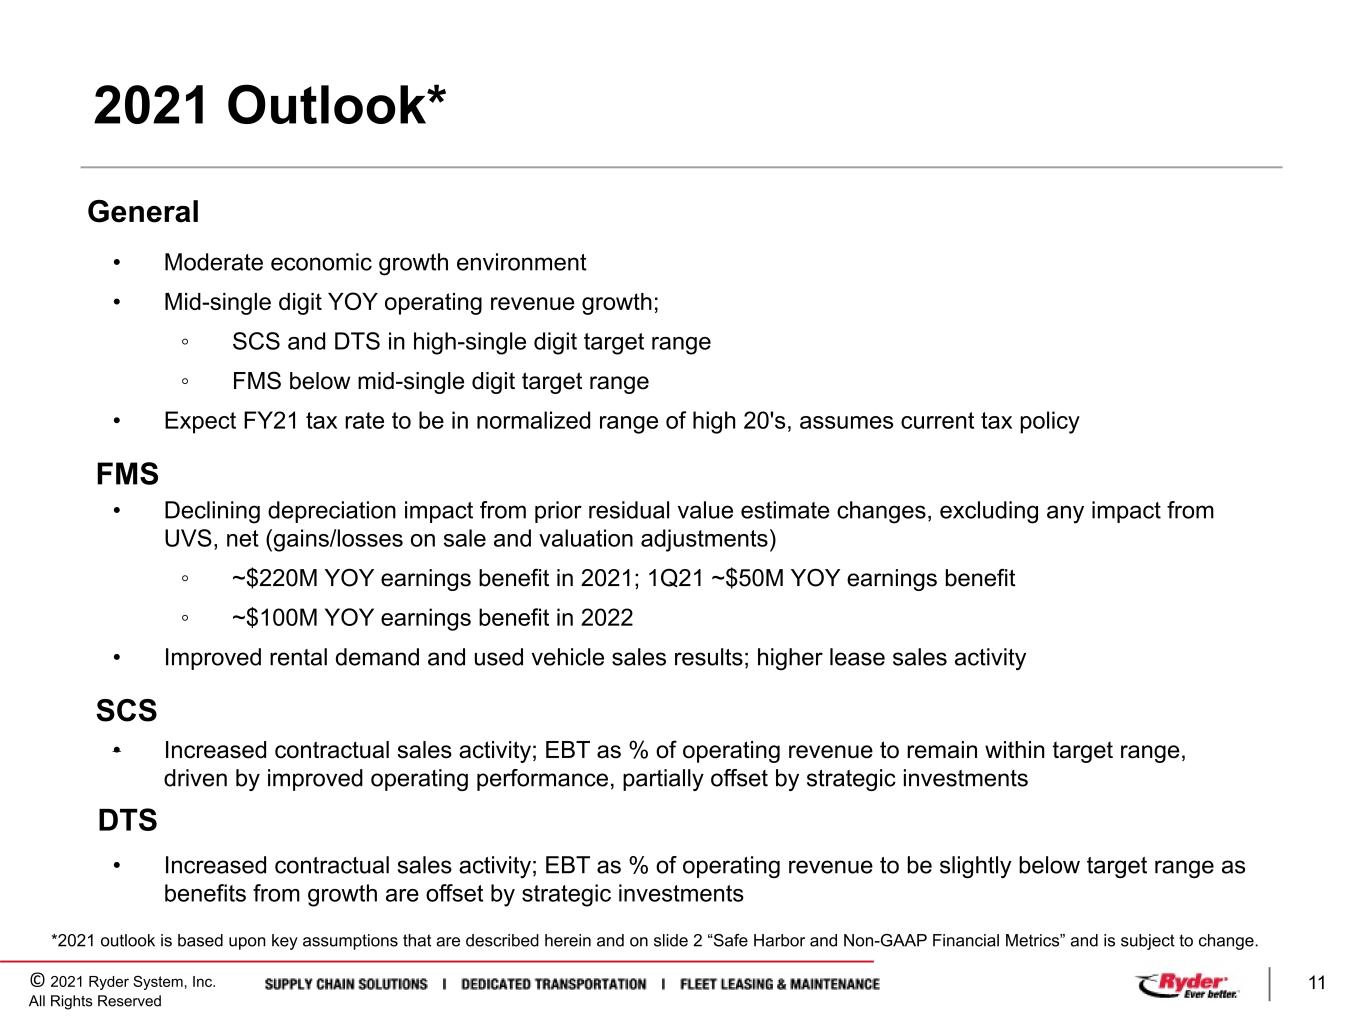

 
© 2021 Ryder System, Inc. All Rights Reserved 11 2021 Outlook* General • Moderate economic growth environment • Mid-single digit YOY operating revenue growth; ◦ SCS and DTS in high-single digit target range ◦ FMS below mid-single digit target range • Expect FY21 tax rate to be in normalized range of high 20's, assumes current tax policy FMS • Declining depreciation impact from prior residual value estimate changes, excluding any impact from UVS, net (gains/losses on sale and valuation adjustments) ◦ ~$220M YOY earnings benefit in 2021; 1Q21 ~$50M YOY earnings benefit ◦ ~$100M YOY earnings benefit in 2022 • Improved rental demand and used vehicle sales results; higher lease sales activity SCS • Increased contractual sales activity; EBT as % of operating revenue to remain within target range, driven by improved operating performance, partially offset by strategic investments DTS • Increased contractual sales activity; EBT as % of operating revenue to be slightly below target range as benefits from growth are offset by strategic investments *2021 outlook is based upon key assumptions that are described herein and on slide 2 “Safe Harbor and Non-GAAP Financial Metrics” and is subject to change.
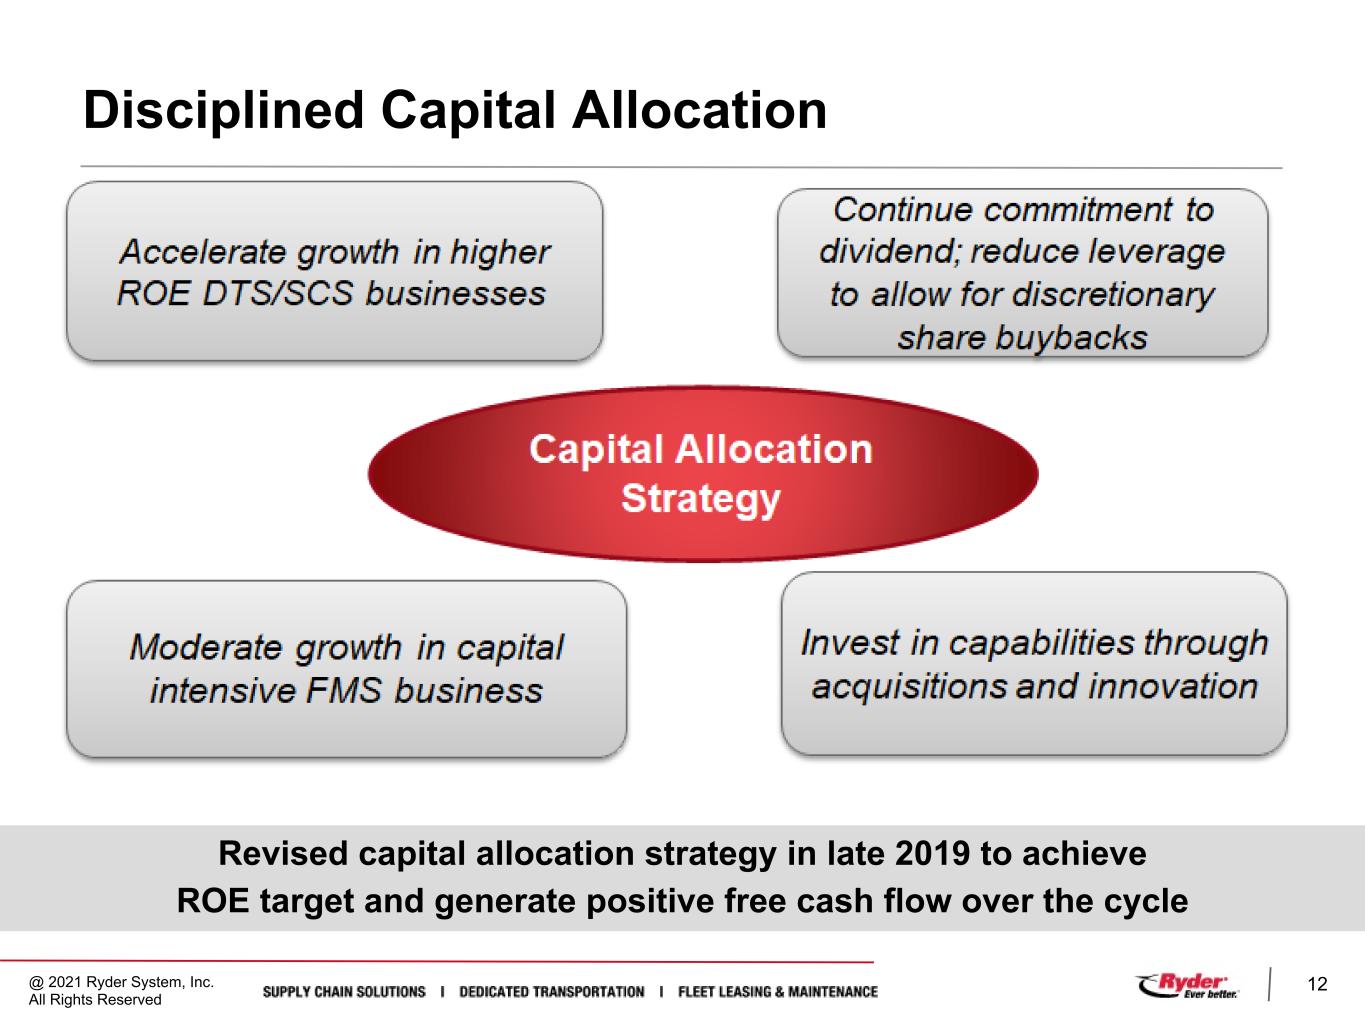

 
@ 2021 Ryder System, Inc. All Rights Reserved 12 Disciplined Capital Allocation Revised capital allocation strategy in late 2019 to achieve ROE target and generate positive free cash flow over the cycle
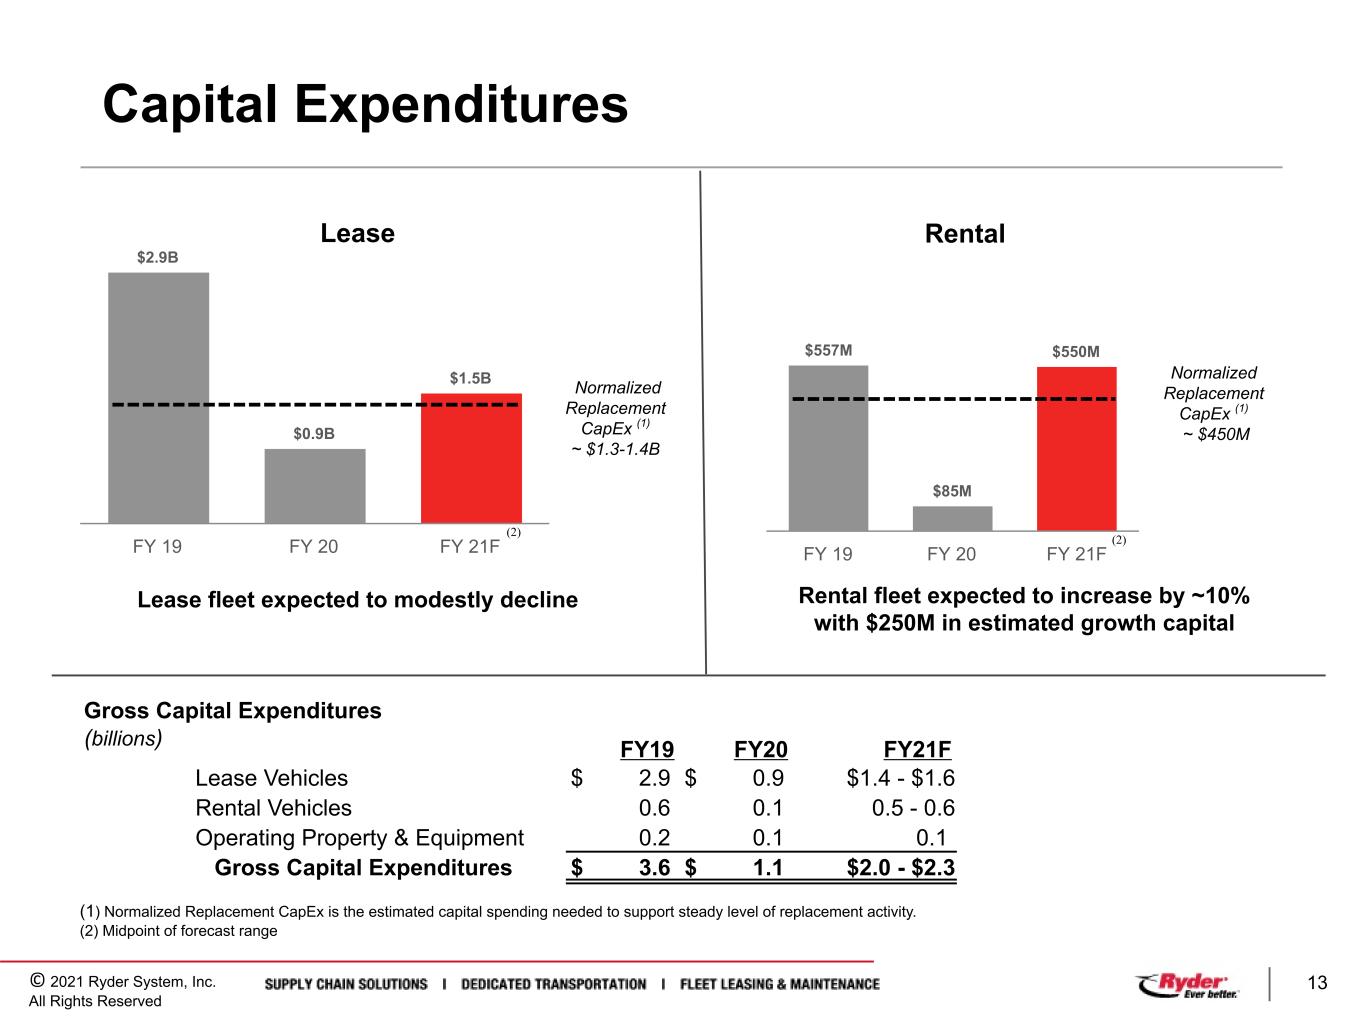

 
© 2021 Ryder System, Inc. All Rights Reserved 13 Capital Expenditures Lease Rental Normalized Replacement CapEx (1) ~ $450M $2.9B $0.9B $1.5B FY 19 FY 20 FY 21F $557M $85M $550M FY 19 FY 20 FY 21F Normalized Replacement CapEx (1) ~ $1.3-1.4B Lease fleet expected to modestly decline Rental fleet expected to increase by ~10% with $250M in estimated growth capital FY19 FY20 FY21F Lease Vehicles $ 2.9 $ 0.9 $1.4 - $1.6 Rental Vehicles 0.6 0.1 0.5 - 0.6 Operating Property & Equipment 0.2 0.1 0.1 Gross Capital Expenditures $ 3.6 $ 1.1 $2.0 - $2.3 Gross Capital Expenditures (billions) (2) (1) Normalized Replacement CapEx is the estimated capital spending needed to support steady level of replacement activity. (2) Midpoint of forecast range (2)
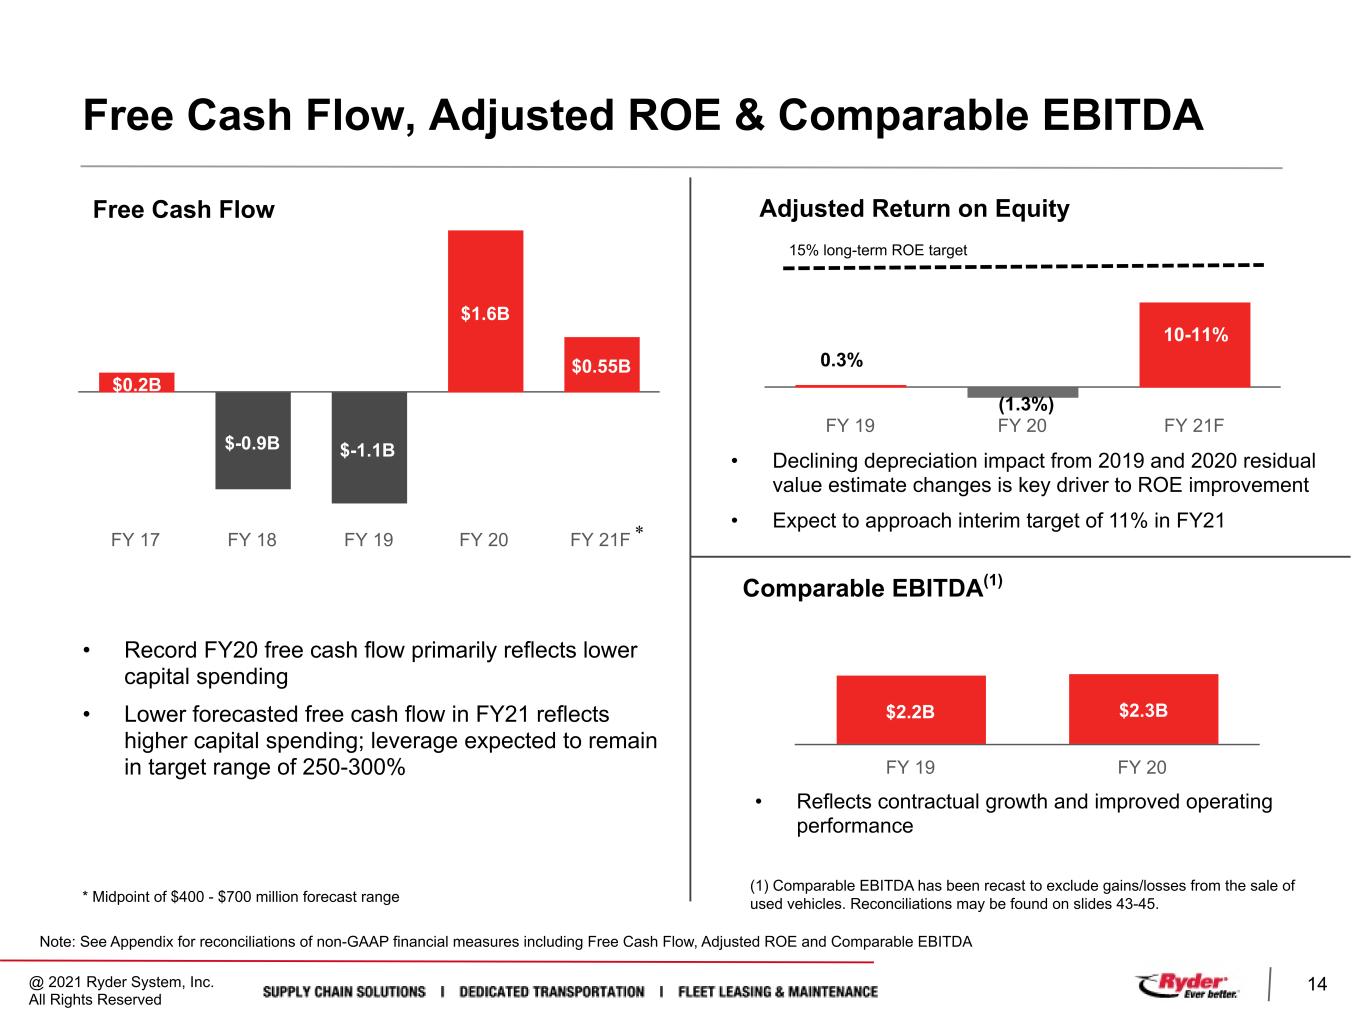

 
@ 2021 Ryder System, Inc. All Rights Reserved 14 Free Cash Flow, Adjusted ROE & Comparable EBITDA $0.2B $-0.9B $-1.1B $1.6B $0.55B FY 17 FY 18 FY 19 FY 20 FY 21F Free Cash Flow * Midpoint of $400 - $700 million forecast range * • Declining depreciation impact from 2019 and 2020 residual value estimate changes is key driver to ROE improvement • Expect to approach interim target of 11% in FY21 • Record FY20 free cash flow primarily reflects lower capital spending • Lower forecasted free cash flow in FY21 reflects higher capital spending; leverage expected to remain in target range of 250-300% Adjusted Return on Equity FY 19 FY 20 FY 21F 15% long-term ROE target 0.3% Note: See Appendix for reconciliations of non-GAAP financial measures including Free Cash Flow, Adjusted ROE and Comparable EBITDA -1.3% 10-11% • Reflects contractual growth and improved operating performance $2.2B $2.3B FY 19 FY 20 Comparable EBITDA(1) (1) Comparable EBITDA has been recast to exclude gains/losses from the sale of used vehicles. Reconciliations may be found on slides 43-45. (1.3%)
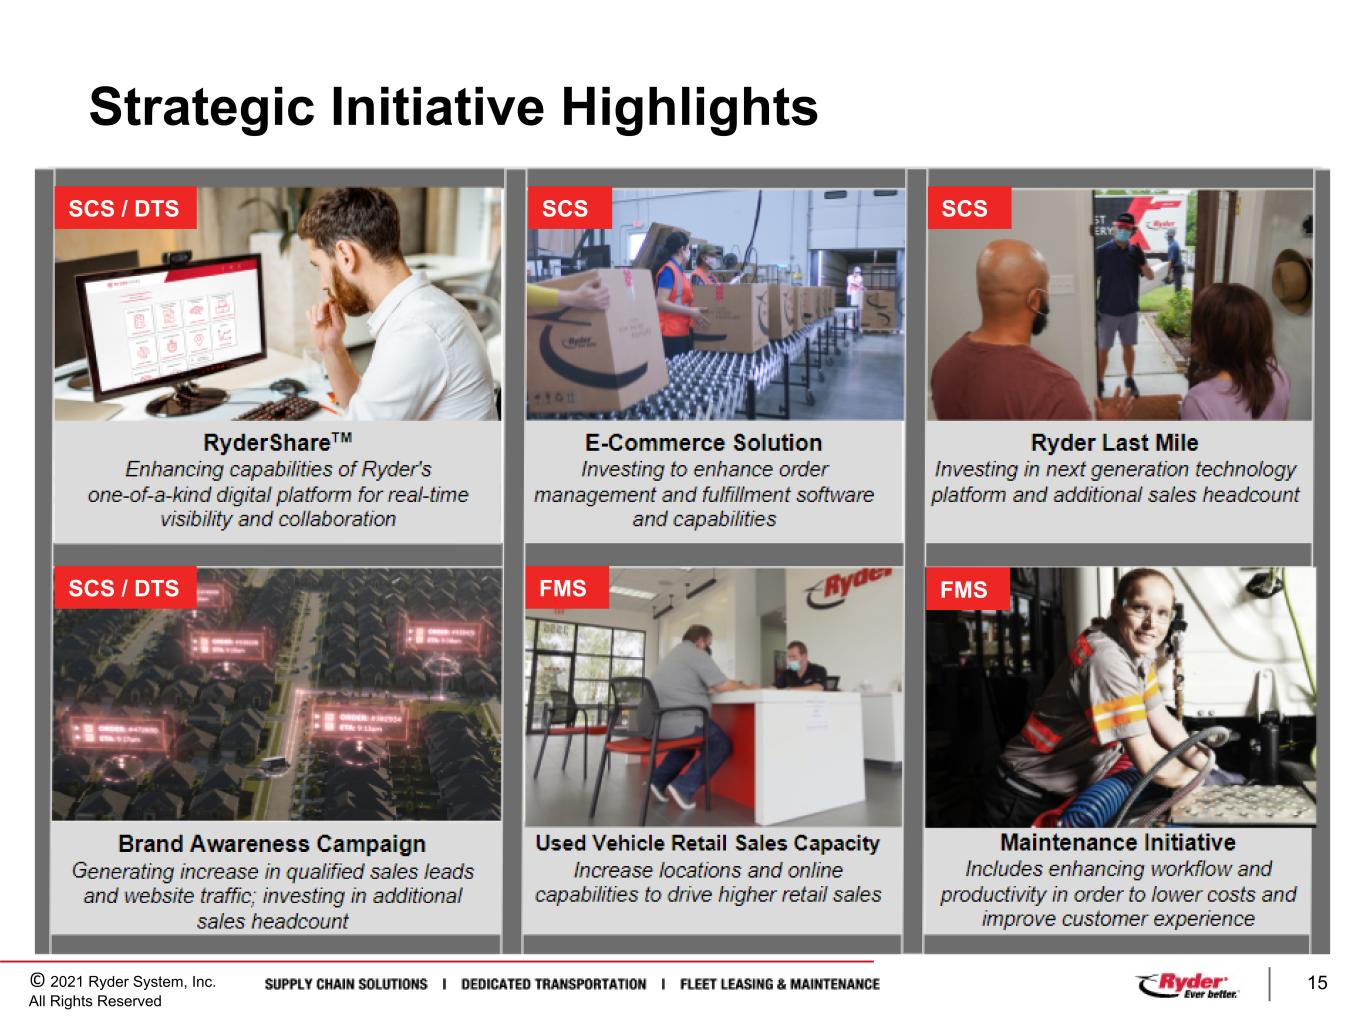

 
© 2021 Ryder System, Inc. All Rights Reserved 15 Strategic Initiative Highlights SCS / DTS SCS SCS FMS FMSSCS / DTS
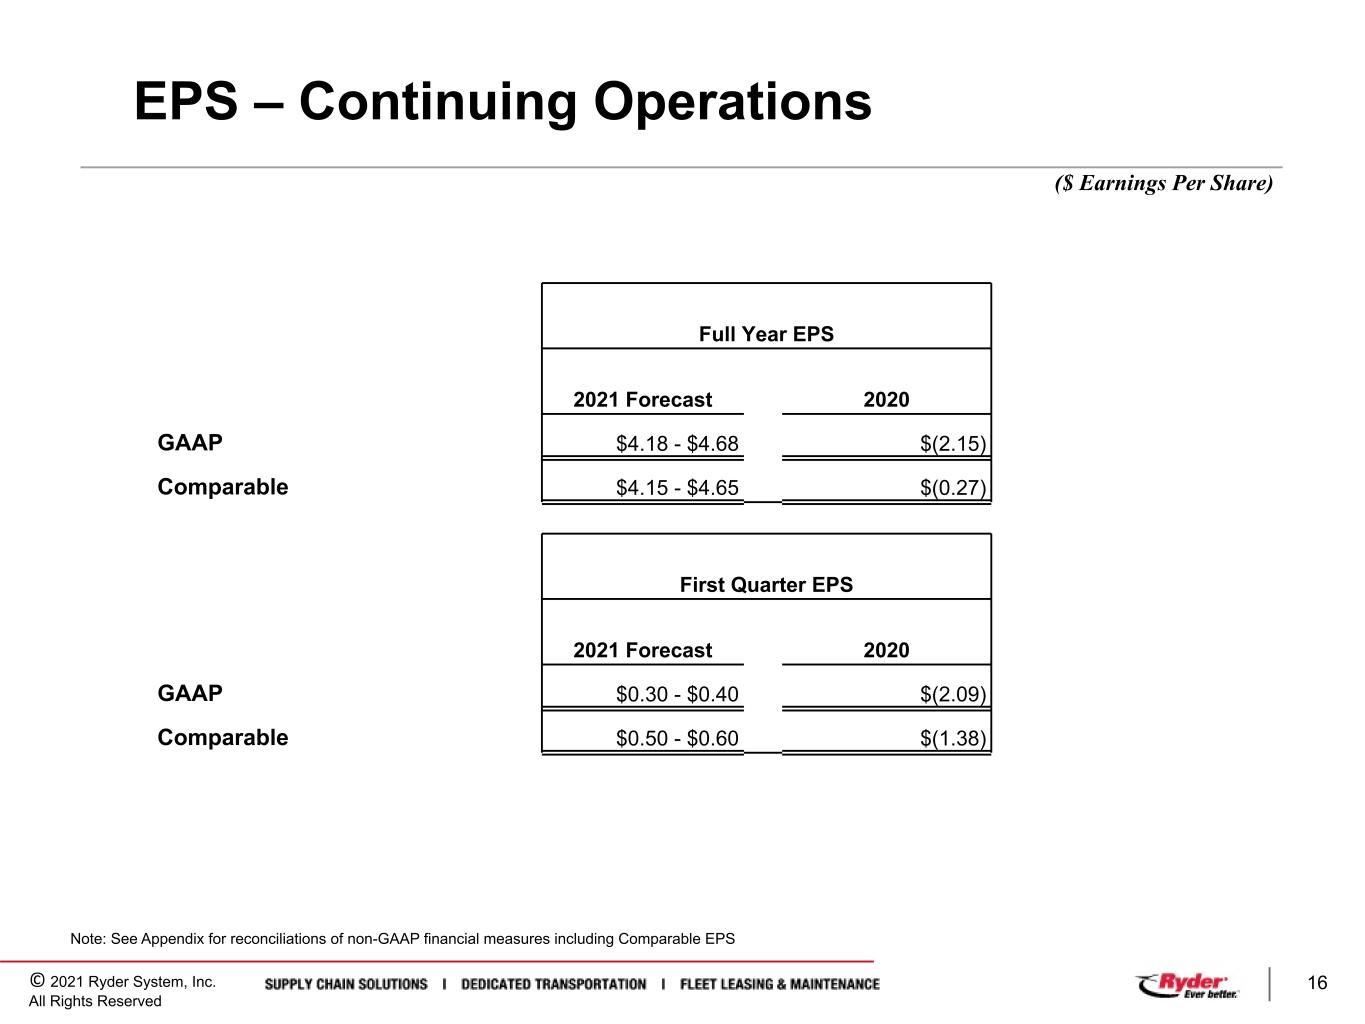

 
© 2021 Ryder System, Inc. All Rights Reserved 16 EPS – Continuing Operations ($ Earnings Per Share) Full Year EPS 2021 Forecast 2020 GAAP $4.18 - $4.68 $(2.15) Comparable $4.15 - $4.65 $(0.27) First Quarter EPS 2021 Forecast 2020 GAAP $0.30 - $0.40 $(2.09) Comparable $0.50 - $0.60 $(1.38) Note: See Appendix for reconciliations of non-GAAP financial measures including Comparable EPS
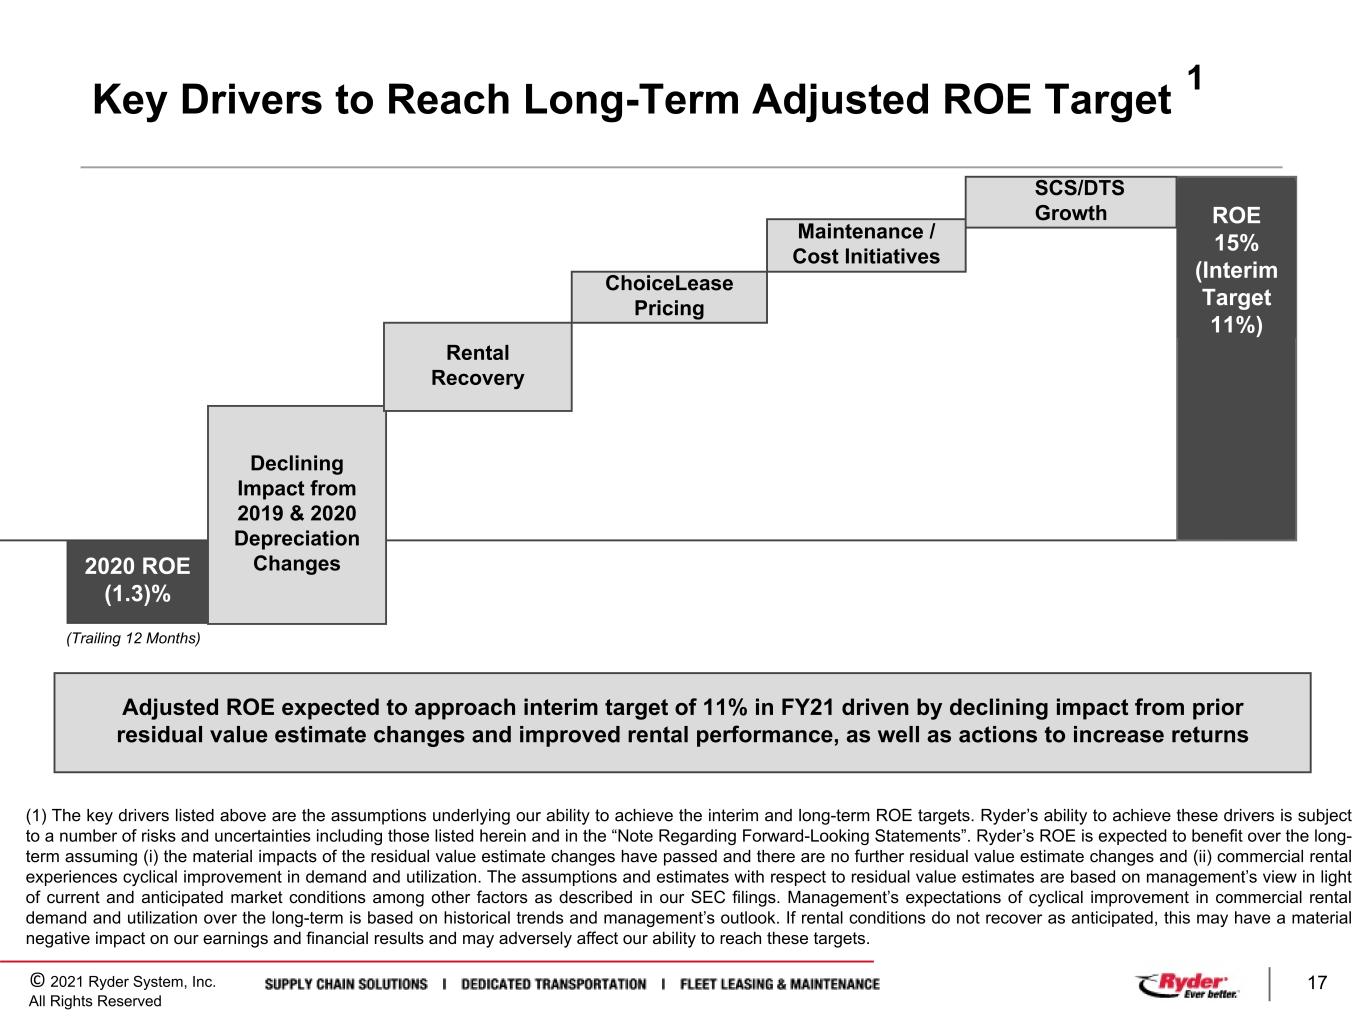

 
© 2021 Ryder System, Inc. All Rights Reserved 17 Key Drivers to Reach Long-Term Adjusted ROE Target 1 2020 ROE (1.3)% Declining Impact from 2019 & 2020 Depreciation Changes Rental Recovery Maintenance / Cost Initiatives SCS/DTS Growth Adjusted ROE expected to approach interim target of 11% in FY21 driven by declining impact from prior residual value estimate changes and improved rental performance, as well as actions to increase returns (1) The key drivers listed above are the assumptions underlying our ability to achieve the interim and long-term ROE targets. Ryder’s ability to achieve these drivers is subject to a number of risks and uncertainties including those listed herein and in the “Note Regarding Forward-Looking Statements”. Ryder’s ROE is expected to benefit over the long- term assuming (i) the material impacts of the residual value estimate changes have passed and there are no further residual value estimate changes and (ii) commercial rental experiences cyclical improvement in demand and utilization. The assumptions and estimates with respect to residual value estimates are based on management’s view in light of current and anticipated market conditions among other factors as described in our SEC filings. Management’s expectations of cyclical improvement in commercial rental demand and utilization over the long-term is based on historical trends and management’s outlook. If rental conditions do not recover as anticipated, this may have a material negative impact on our earnings and financial results and may adversely affect our ability to reach these targets. ROE 15% (Interim Target 11%) ChoiceLease Pricing (Trailing 12 Months)
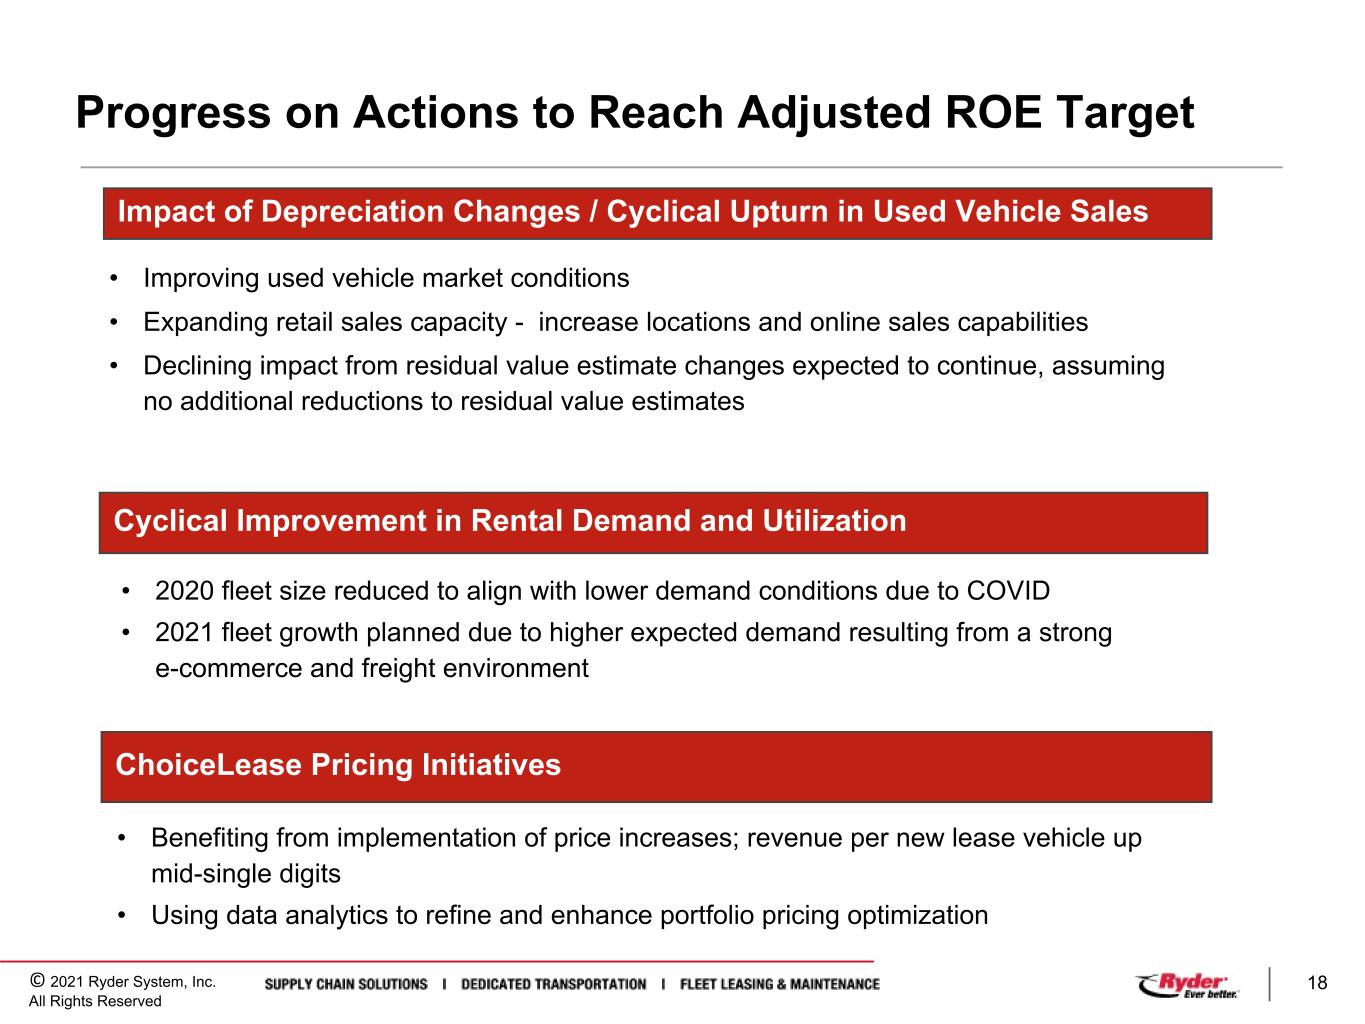

 
© 2021 Ryder System, Inc. All Rights Reserved 18 Progress on Actions to Reach Adjusted ROE Target Impact of Depreciation Changes / Cyclical Upturn in Used Vehicle Sales • Improving used vehicle market conditions • Expanding retail sales capacity - increase locations and online sales capabilities • Declining impact from residual value estimate changes expected to continue, assuming no additional reductions to residual value estimates Cyclical Improvement in Rental Demand and Utilization • 2020 fleet size reduced to align with lower demand conditions due to COVID • 2021 fleet growth planned due to higher expected demand resulting from a strong e-commerce and freight environment ChoiceLease Pricing Initiatives • Benefiting from implementation of price increases; revenue per new lease vehicle up mid-single digits • Using data analytics to refine and enhance portfolio pricing optimization
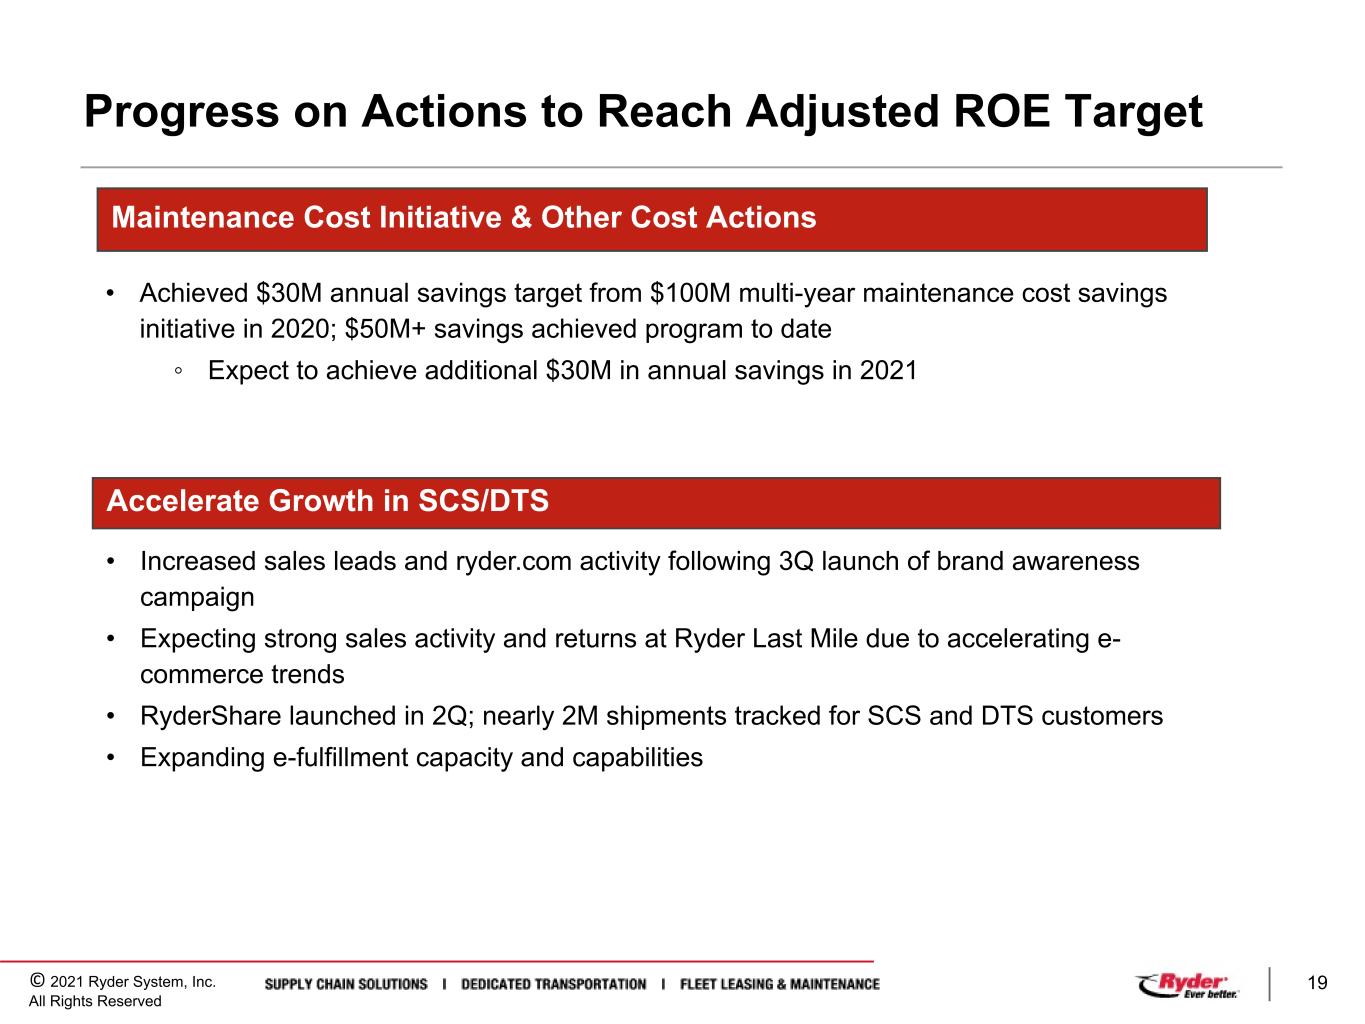

 
© 2021 Ryder System, Inc. All Rights Reserved 19 Progress on Actions to Reach Adjusted ROE Target Maintenance Cost Initiative & Other Cost Actions • Achieved $30M annual savings target from $100M multi-year maintenance cost savings initiative in 2020; $50M+ savings achieved program to date ◦ Expect to achieve additional $30M in annual savings in 2021 Accelerate Growth in SCS/DTS • Increased sales leads and ryder.com activity following 3Q launch of brand awareness campaign • Expecting strong sales activity and returns at Ryder Last Mile due to accelerating e- commerce trends • RyderShare launched in 2Q; nearly 2M shipments tracked for SCS and DTS customers • Expanding e-fulfillment capacity and capabilities

 
© 2021 Ryder System, Inc. All Rights Reserved 20 Q&A

 
© 2021 Ryder System, Inc. All Rights Reserved 21 Appendix Segment Comparable EBITDA ChoiceLease Fleet Count - Active Fleet Key Financial Statistics Business Segment Detail Central Support Services Balance Sheet Segment Balance Sheet Asset Management Non-GAAP Financial Measures & Reconciliations
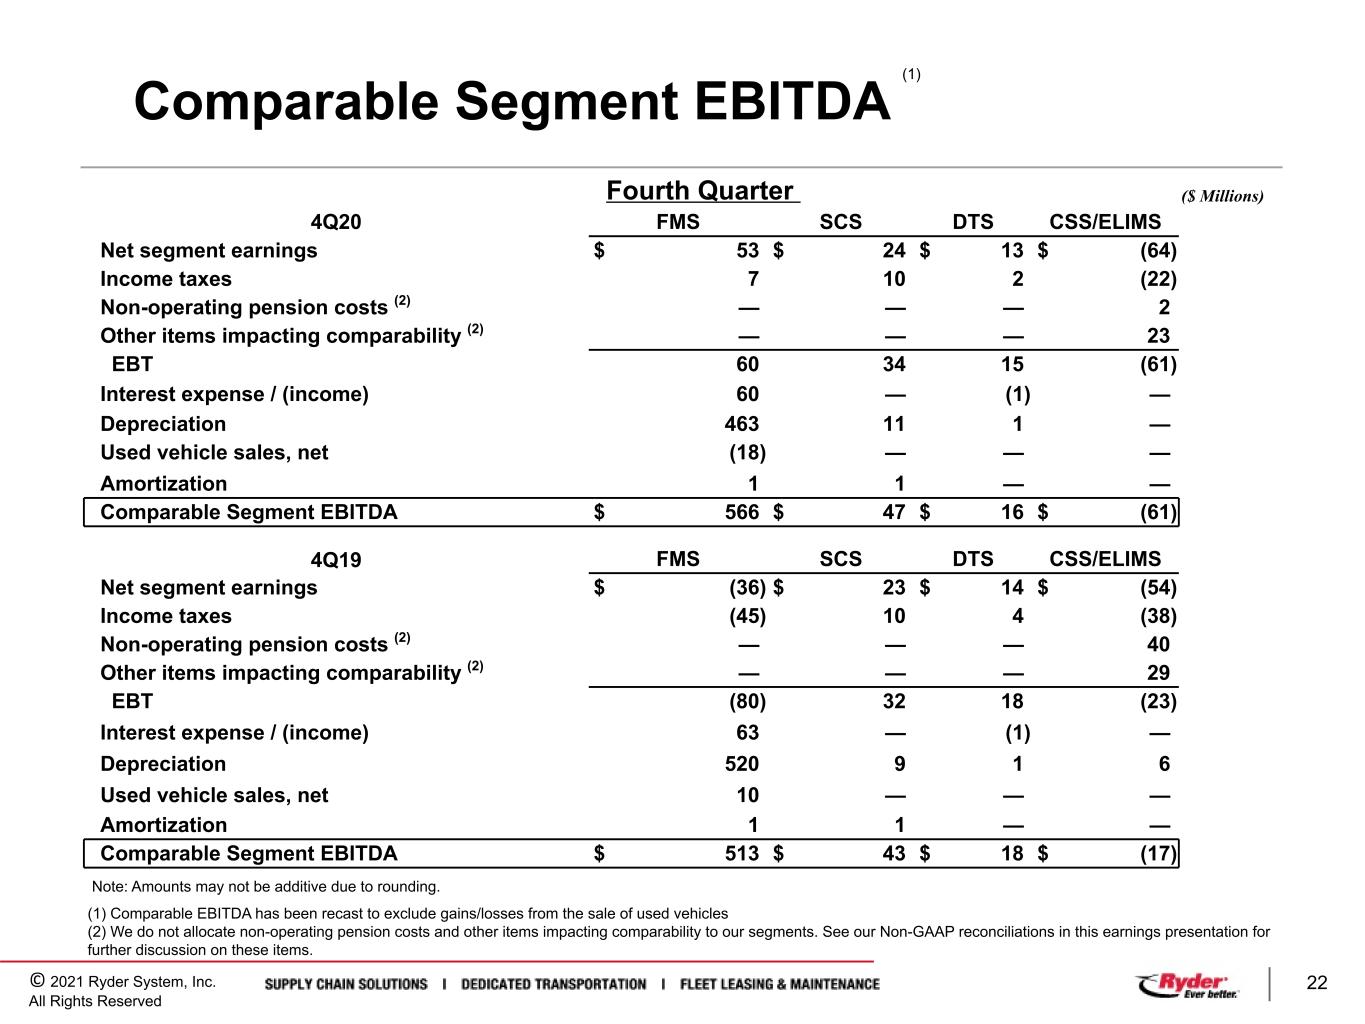

 
© 2021 Ryder System, Inc. All Rights Reserved 22 Fourth Quarter Comparable Segment EBITDA 4Q20 FMS SCS DTS CSS/ELIMS Net segment earnings $ 53 $ 24 $ 13 $ (64) Income taxes 7 10 2 (22) Non-operating pension costs (2) — — — 2 Other items impacting comparability (2) — — — 23 EBT 60 34 15 (61) Interest expense / (income) 60 — (1) — Depreciation 463 11 1 — Used vehicle sales, net (18) — — — Amortization 1 1 — — Comparable Segment EBITDA $ 566 $ 47 $ 16 $ (61) 4Q19 FMS SCS DTS CSS/ELIMS Net segment earnings $ (36) $ 23 $ 14 $ (54) Income taxes (45) 10 4 (38) Non-operating pension costs (2) — — — 40 Other items impacting comparability (2) — — — 29 EBT (80) 32 18 (23) Interest expense / (income) 63 — (1) — Depreciation 520 9 1 6 Used vehicle sales, net 10 — — — Amortization 1 1 — — Comparable Segment EBITDA $ 513 $ 43 $ 18 $ (17) ($ Millions) (1) Comparable EBITDA has been recast to exclude gains/losses from the sale of used vehicles (2) We do not allocate non-operating pension costs and other items impacting comparability to our segments. See our Non-GAAP reconciliations in this earnings presentation for further discussion on these items. Note: Amounts may not be additive due to rounding. (1)
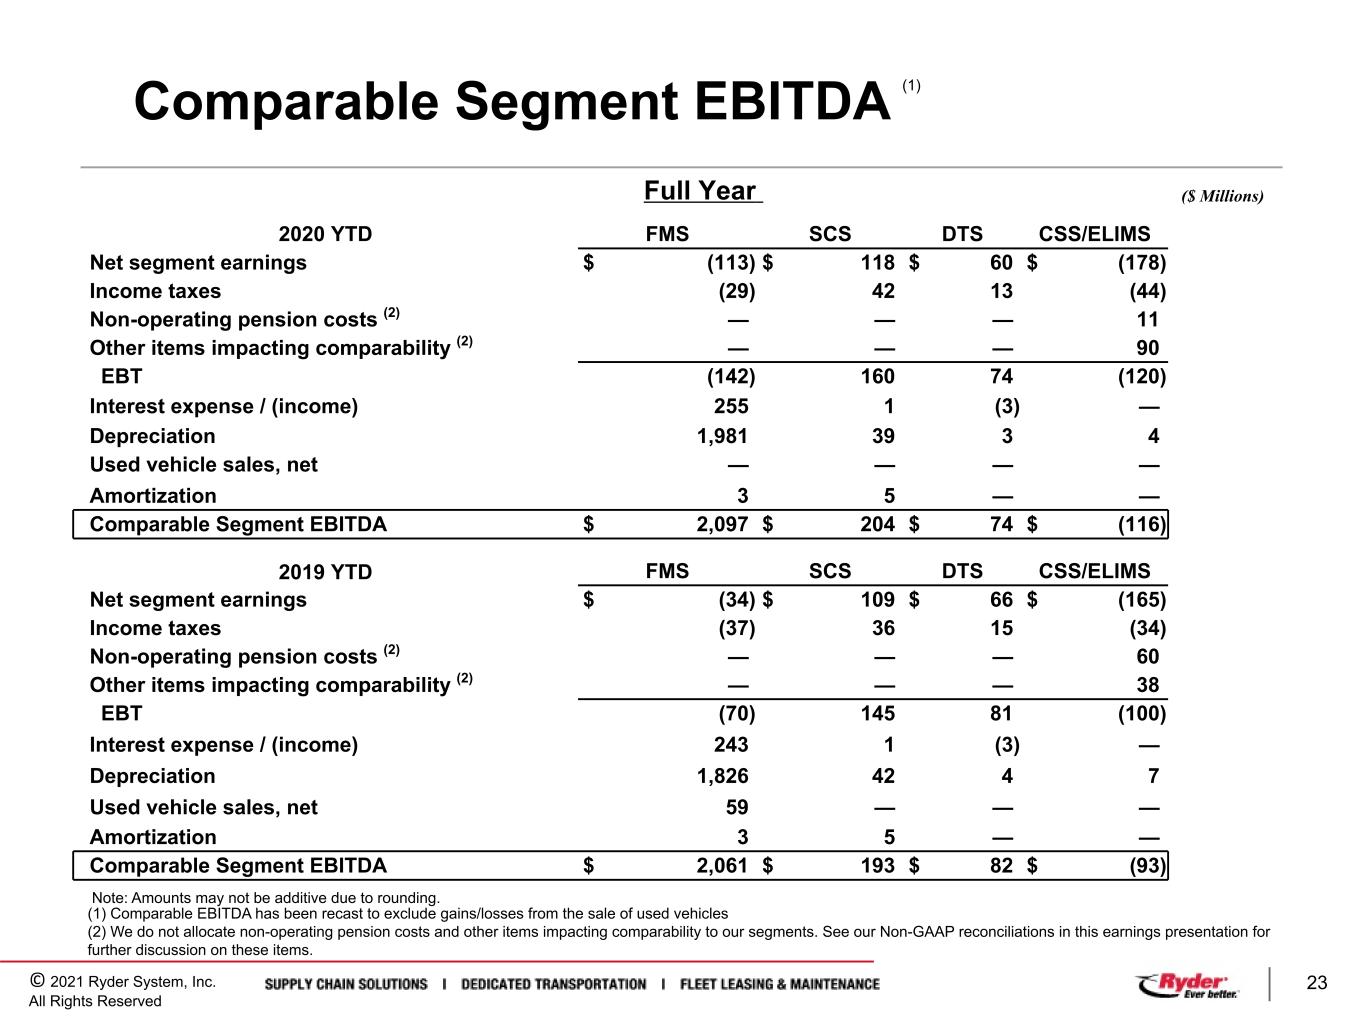

 
© 2021 Ryder System, Inc. All Rights Reserved 23 Full Year Comparable Segment EBITDA 2020 YTD FMS SCS DTS CSS/ELIMS Net segment earnings $ (113) $ 118 $ 60 $ (178) Income taxes (29) 42 13 (44) Non-operating pension costs (2) — — — 11 Other items impacting comparability (2) — — — 90 EBT (142) 160 74 (120) Interest expense / (income) 255 1 (3) — Depreciation 1,981 39 3 4 Used vehicle sales, net — — — — Amortization 3 5 — — Comparable Segment EBITDA $ 2,097 $ 204 $ 74 $ (116) 2019 YTD FMS SCS DTS CSS/ELIMS Net segment earnings $ (34) $ 109 $ 66 $ (165) Income taxes (37) 36 15 (34) Non-operating pension costs (2) — — — 60 Other items impacting comparability (2) — — — 38 EBT (70) 145 81 (100) Interest expense / (income) 243 1 (3) — Depreciation 1,826 42 4 7 Used vehicle sales, net 59 — — — Amortization 3 5 — — Comparable Segment EBITDA $ 2,061 $ 193 $ 82 $ (93) ($ Millions) Note: Amounts may not be additive due to rounding. (1) Comparable EBITDA has been recast to exclude gains/losses from the sale of used vehicles (2) We do not allocate non-operating pension costs and other items impacting comparability to our segments. See our Non-GAAP reconciliations in this earnings presentation for further discussion on these items. (1)
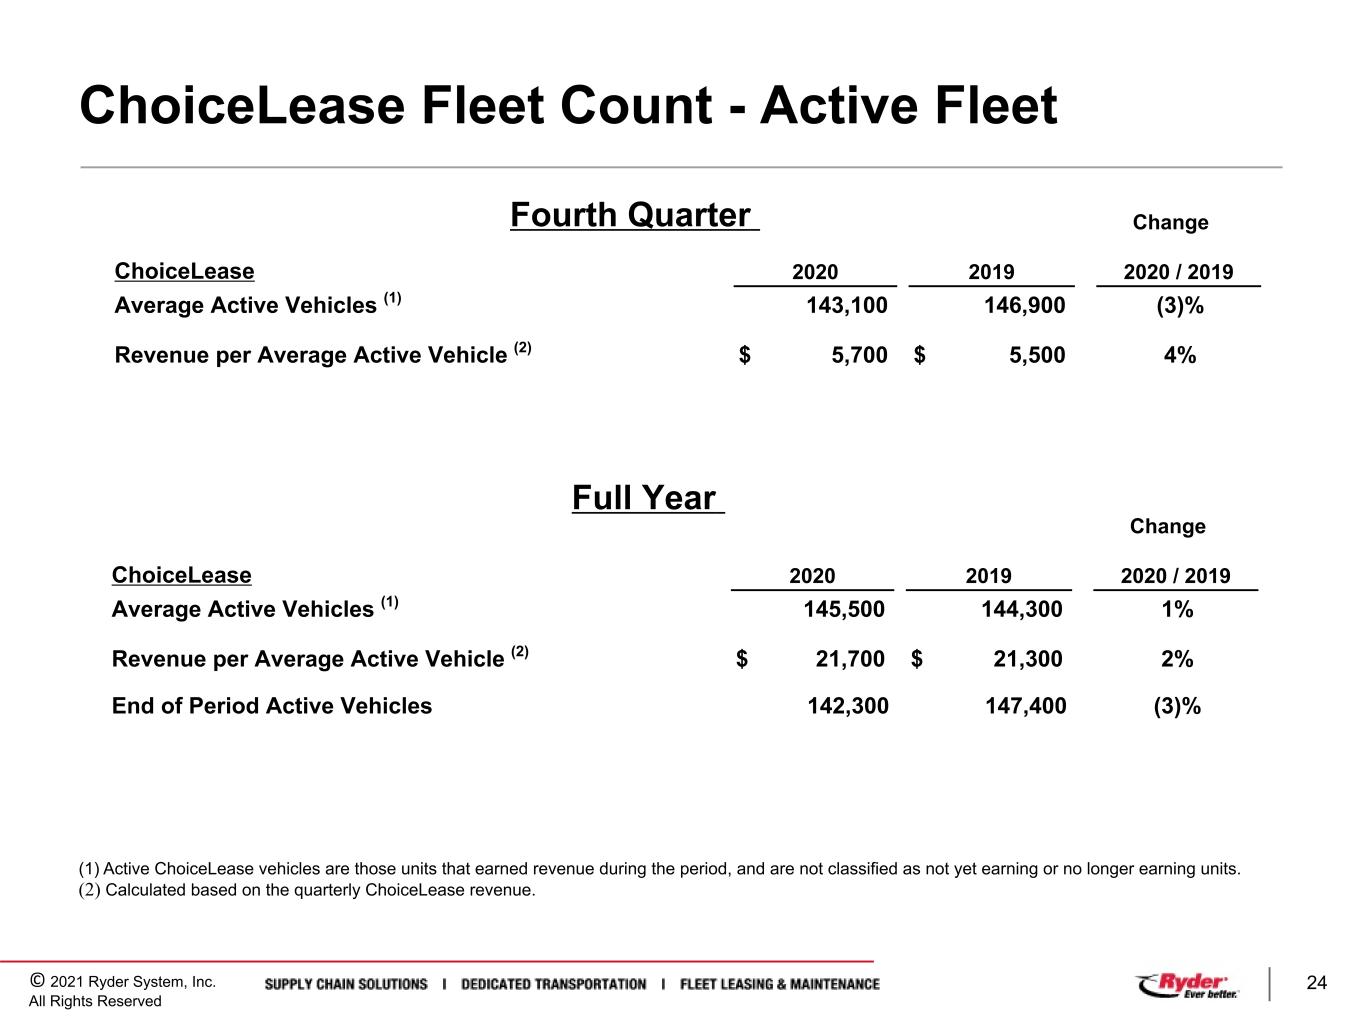

 
© 2021 Ryder System, Inc. All Rights Reserved 24 ChoiceLease Fleet Count - Active Fleet Change ChoiceLease 2020 2019 2020 / 2019 Average Active Vehicles (1) 145,500 144,300 1% Revenue per Average Active Vehicle (2) $ 21,700 $ 21,300 2% End of Period Active Vehicles 142,300 147,400 (3)% (1) Active ChoiceLease vehicles are those units that earned revenue during the period, and are not classified as not yet earning or no longer earning units. (2) Calculated based on the quarterly ChoiceLease revenue. Change ChoiceLease 2020 2019 2020 / 2019 Average Active Vehicles (1) 143,100 146,900 (3)% Revenue per Average Active Vehicle (2) $ 5,700 $ 5,500 4% Fourth Quarter Full Year
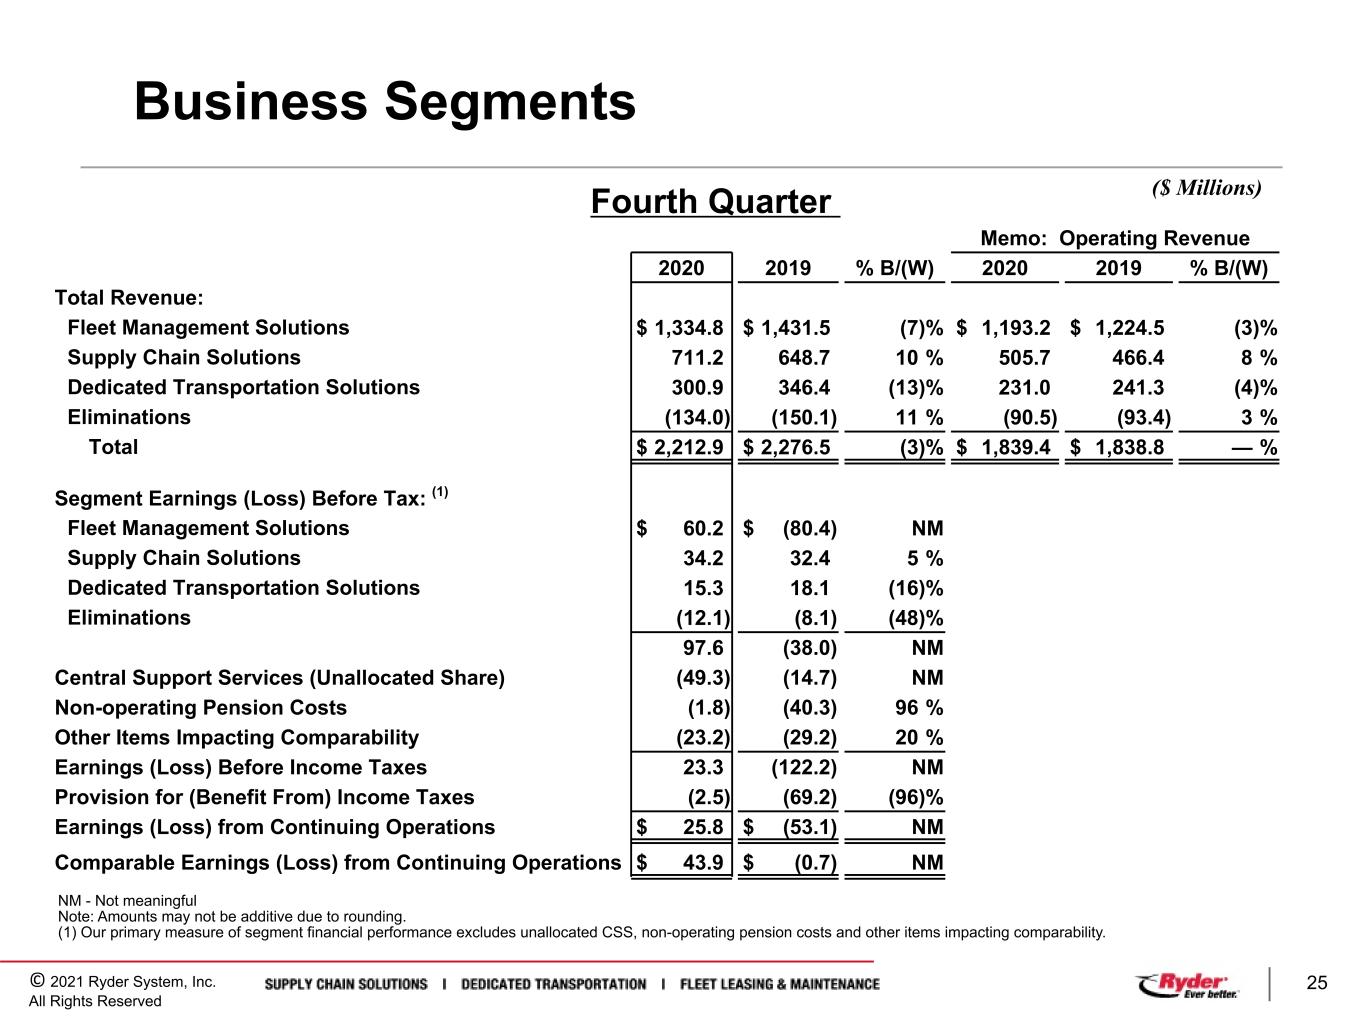

 
© 2021 Ryder System, Inc. All Rights Reserved 25 Business Segments NM - Not meaningful Note: Amounts may not be additive due to rounding. (1) Our primary measure of segment financial performance excludes unallocated CSS, non-operating pension costs and other items impacting comparability. ($ Millions)Fourth Quarter Memo: Operating Revenue 2020 2019 % B/(W) 2020 2019 % B/(W) Total Revenue: Fleet Management Solutions $ 1,334.8 $ 1,431.5 (7) % $ 1,193.2 $ 1,224.5 (3) % Supply Chain Solutions 711.2 648.7 10 % 505.7 466.4 8 % Dedicated Transportation Solutions 300.9 346.4 (13) % 231.0 241.3 (4) % Eliminations (134.0) (150.1) 11 % (90.5) (93.4) 3 % Total $ 2,212.9 $ 2,276.5 (3) % $ 1,839.4 $ 1,838.8 — % Segment Earnings (Loss) Before Tax: (1) Fleet Management Solutions $ 60.2 $ (80.4) NM Supply Chain Solutions 34.2 32.4 5 % Dedicated Transportation Solutions 15.3 18.1 (16) % Eliminations (12.1) (8.1) (48) % 97.6 (38.0) NM Central Support Services (Unallocated Share) (49.3) (14.7) NM Non-operating Pension Costs (1.8) (40.3) 96 % Other Items Impacting Comparability (23.2) (29.2) 20 % Earnings (Loss) Before Income Taxes 23.3 (122.2) NM Provision for (Benefit From) Income Taxes (2.5) (69.2) (96) % Earnings (Loss) from Continuing Operations $ 25.8 $ (53.1) NM Comparable Earnings (Loss) from Continuing Operations $ 43.9 $ (0.7) NM
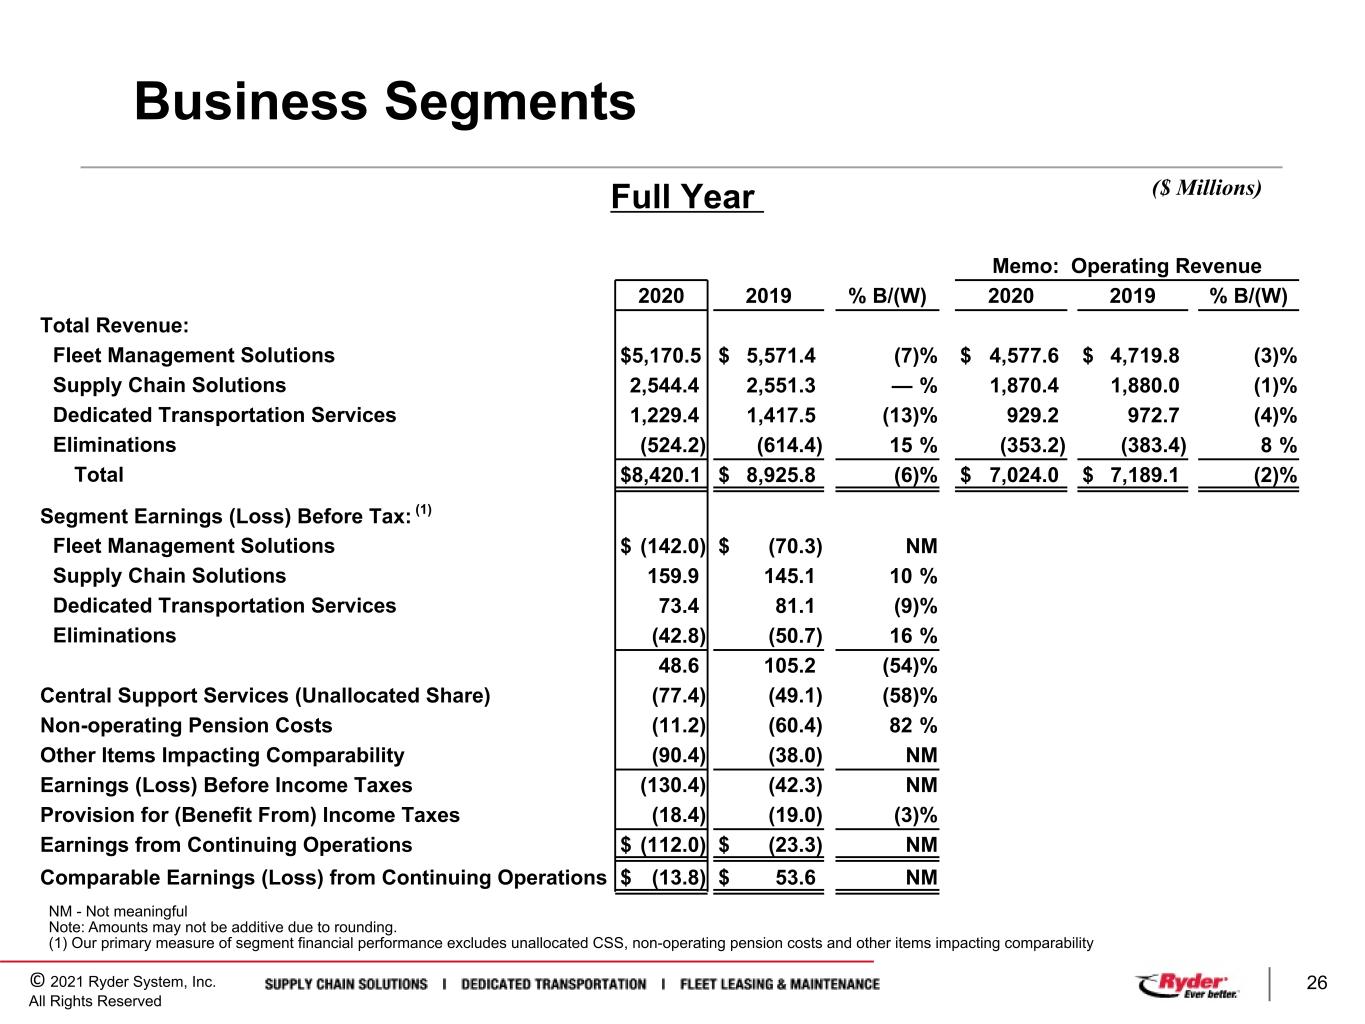

 
© 2021 Ryder System, Inc. All Rights Reserved 26 Business Segments Memo: Operating Revenue 2020 2019 % B/(W) 2020 2019 % B/(W) Total Revenue: Fleet Management Solutions $ 5,170.5 $ 5,571.4 (7) % $ 4,577.6 $ 4,719.8 (3) % Supply Chain Solutions 2,544.4 2,551.3 — % 1,870.4 1,880.0 (1) % Dedicated Transportation Services 1,229.4 1,417.5 (13) % 929.2 972.7 (4) % Eliminations (524.2) (614.4) 15 % (353.2) (383.4) 8 % Total $ 8,420.1 $ 8,925.8 (6) % $ 7,024.0 $ 7,189.1 (2) % Segment Earnings (Loss) Before Tax: (1) Fleet Management Solutions $ (142.0) $ (70.3) NM Supply Chain Solutions 159.9 145.1 10 % Dedicated Transportation Services 73.4 81.1 (9) % Eliminations (42.8) (50.7) 16 % 48.6 105.2 (54) % Central Support Services (Unallocated Share) (77.4) (49.1) (58) % Non-operating Pension Costs (11.2) (60.4) 82 % Other Items Impacting Comparability (90.4) (38.0) NM Earnings (Loss) Before Income Taxes (130.4) (42.3) NM Provision for (Benefit From) Income Taxes (18.4) (19.0) (3) % Earnings from Continuing Operations $ (112.0) $ (23.3) NM Comparable Earnings (Loss) from Continuing Operations $ (13.8) $ 53.6 NM Full Year NM - Not meaningful Note: Amounts may not be additive due to rounding. (1) Our primary measure of segment financial performance excludes unallocated CSS, non-operating pension costs and other items impacting comparability ($ Millions)
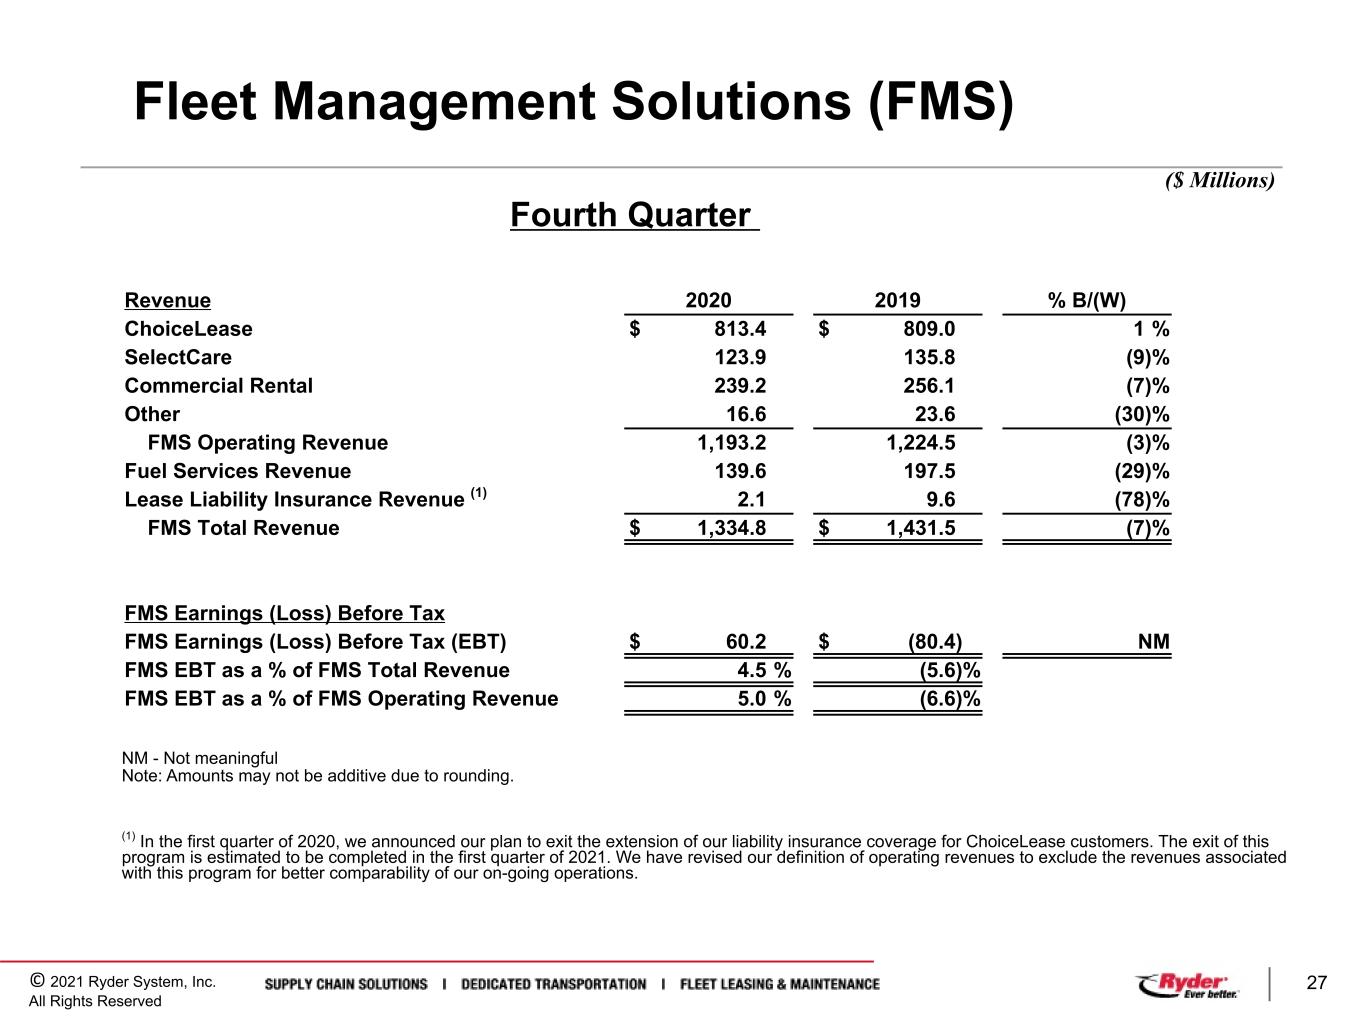

 
© 2021 Ryder System, Inc. All Rights Reserved 27 Fleet Management Solutions (FMS) Fourth Quarter ($ Millions) Revenue 2020 2019 % B/(W) ChoiceLease $ 813.4 $ 809.0 1 % SelectCare 123.9 135.8 (9) % Commercial Rental 239.2 256.1 (7) % Other 16.6 23.6 (30) % FMS Operating Revenue 1,193.2 1,224.5 (3) % Fuel Services Revenue 139.6 197.5 (29) % Lease Liability Insurance Revenue (1) 2.1 9.6 (78) % FMS Total Revenue $ 1,334.8 $ 1,431.5 (7) % FMS Earnings (Loss) Before Tax FMS Earnings (Loss) Before Tax (EBT) $ 60.2 $ (80.4) NM FMS EBT as a % of FMS Total Revenue 4.5 % (5.6) % FMS EBT as a % of FMS Operating Revenue 5.0 % (6.6) % NM - Not meaningful Note: Amounts may not be additive due to rounding. (1) In the first quarter of 2020, we announced our plan to exit the extension of our liability insurance coverage for ChoiceLease customers. The exit of this program is estimated to be completed in the first quarter of 2021. We have revised our definition of operating revenues to exclude the revenues associated with this program for better comparability of our on-going operations.
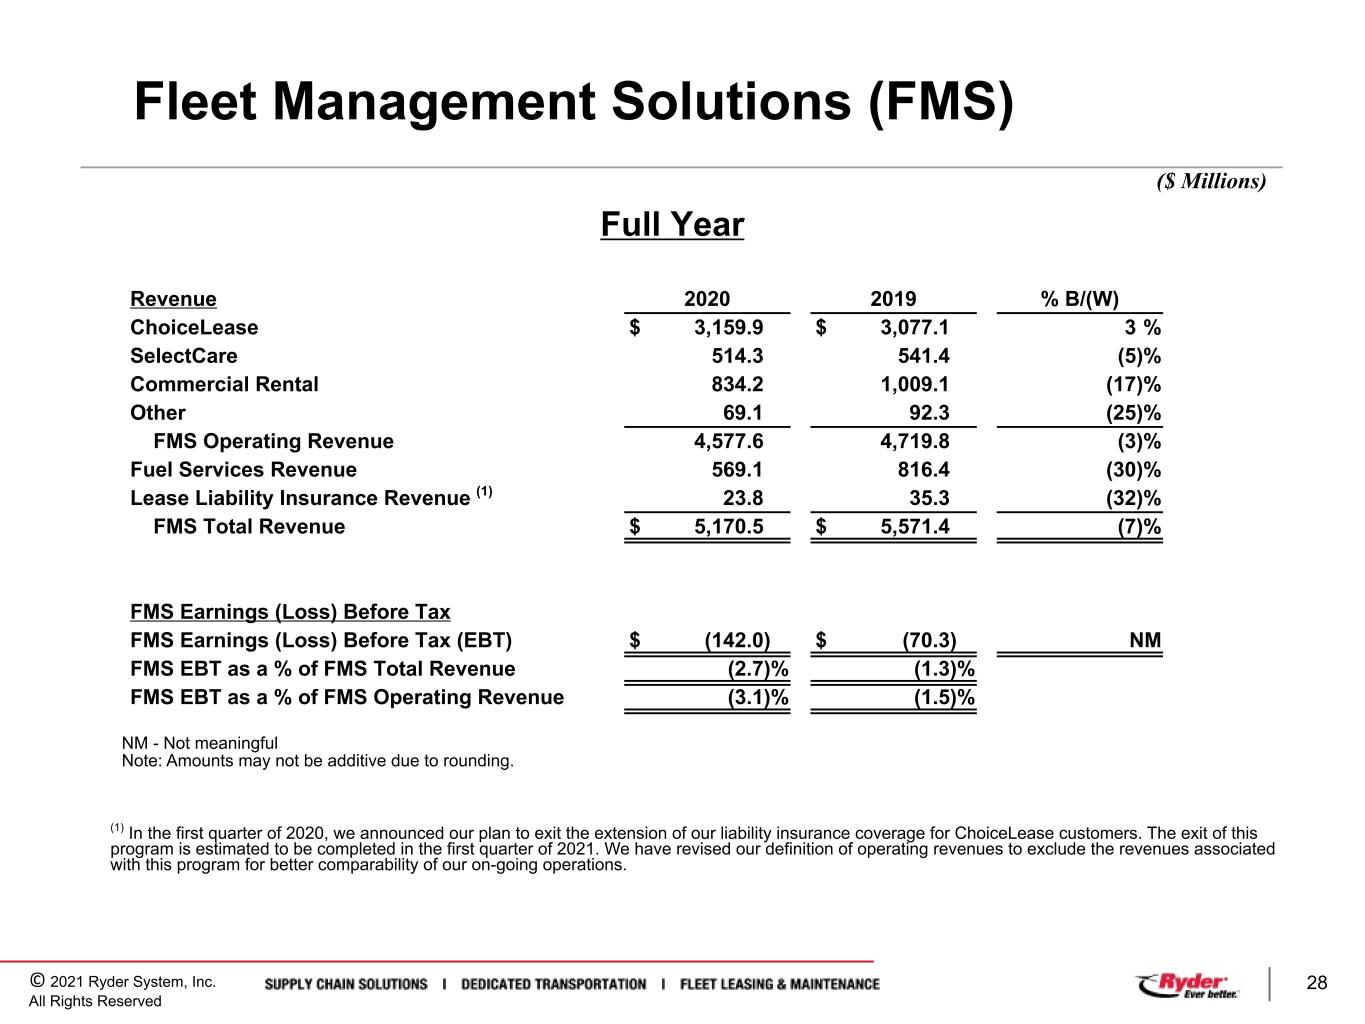

 
© 2021 Ryder System, Inc. All Rights Reserved 28 Fleet Management Solutions (FMS) Revenue 2020 2019 % B/(W) ChoiceLease $ 3,159.9 $ 3,077.1 3 % SelectCare 514.3 541.4 (5) % Commercial Rental 834.2 1,009.1 (17) % Other 69.1 92.3 (25) % FMS Operating Revenue 4,577.6 4,719.8 (3) % Fuel Services Revenue 569.1 816.4 (30) % Lease Liability Insurance Revenue (1) 23.8 35.3 (32) % FMS Total Revenue $ 5,170.5 $ 5,571.4 (7) % FMS Earnings (Loss) Before Tax FMS Earnings (Loss) Before Tax (EBT) $ (142.0) $ (70.3) NM FMS EBT as a % of FMS Total Revenue (2.7) % (1.3) % FMS EBT as a % of FMS Operating Revenue (3.1) % (1.5) % Full Year ($ Millions) NM - Not meaningful Note: Amounts may not be additive due to rounding. (1) In the first quarter of 2020, we announced our plan to exit the extension of our liability insurance coverage for ChoiceLease customers. The exit of this program is estimated to be completed in the first quarter of 2021. We have revised our definition of operating revenues to exclude the revenues associated with this program for better comparability of our on-going operations.
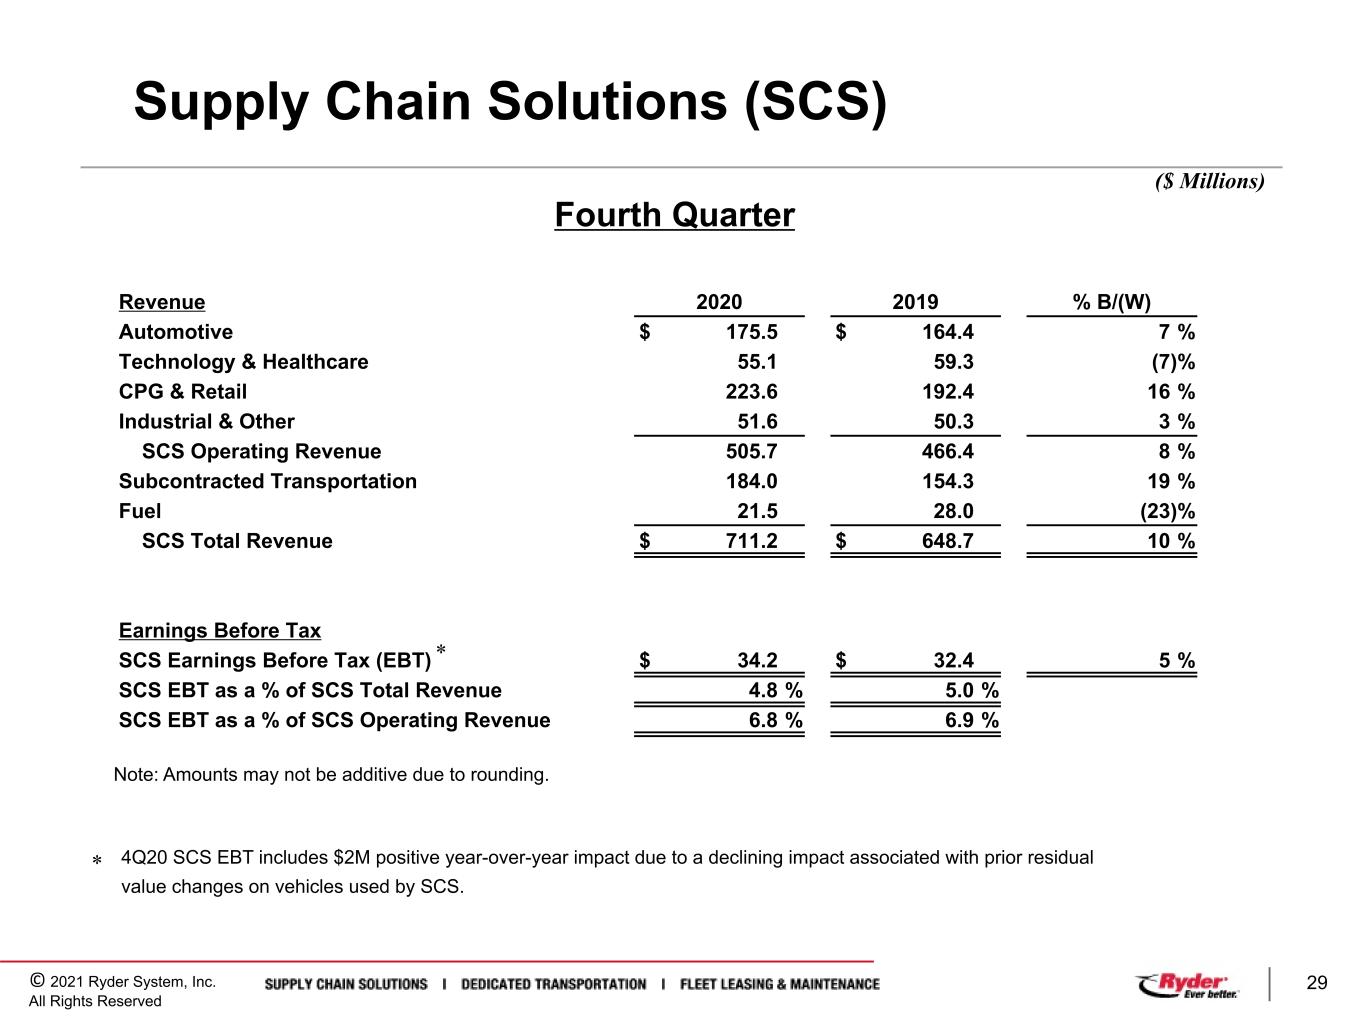

 
© 2021 Ryder System, Inc. All Rights Reserved 29 Supply Chain Solutions (SCS) ($ Millions) Fourth Quarter Revenue 2020 2019 % B/(W) Automotive $ 175.5 $ 164.4 7 % Technology & Healthcare 55.1 59.3 (7) % CPG & Retail 223.6 192.4 16 % Industrial & Other 51.6 50.3 3 % SCS Operating Revenue 505.7 466.4 8 % Subcontracted Transportation 184.0 154.3 19 % Fuel 21.5 28.0 (23) % SCS Total Revenue $ 711.2 $ 648.7 10 % Earnings Before Tax SCS Earnings Before Tax (EBT) $ 34.2 $ 32.4 5 % SCS EBT as a % of SCS Total Revenue 4.8 % 5.0 % SCS EBT as a % of SCS Operating Revenue 6.8 % 6.9 % Note: Amounts may not be additive due to rounding. 4Q20 SCS EBT includes $2M positive year-over-year impact due to a declining impact associated with prior residual value changes on vehicles used by SCS. * *
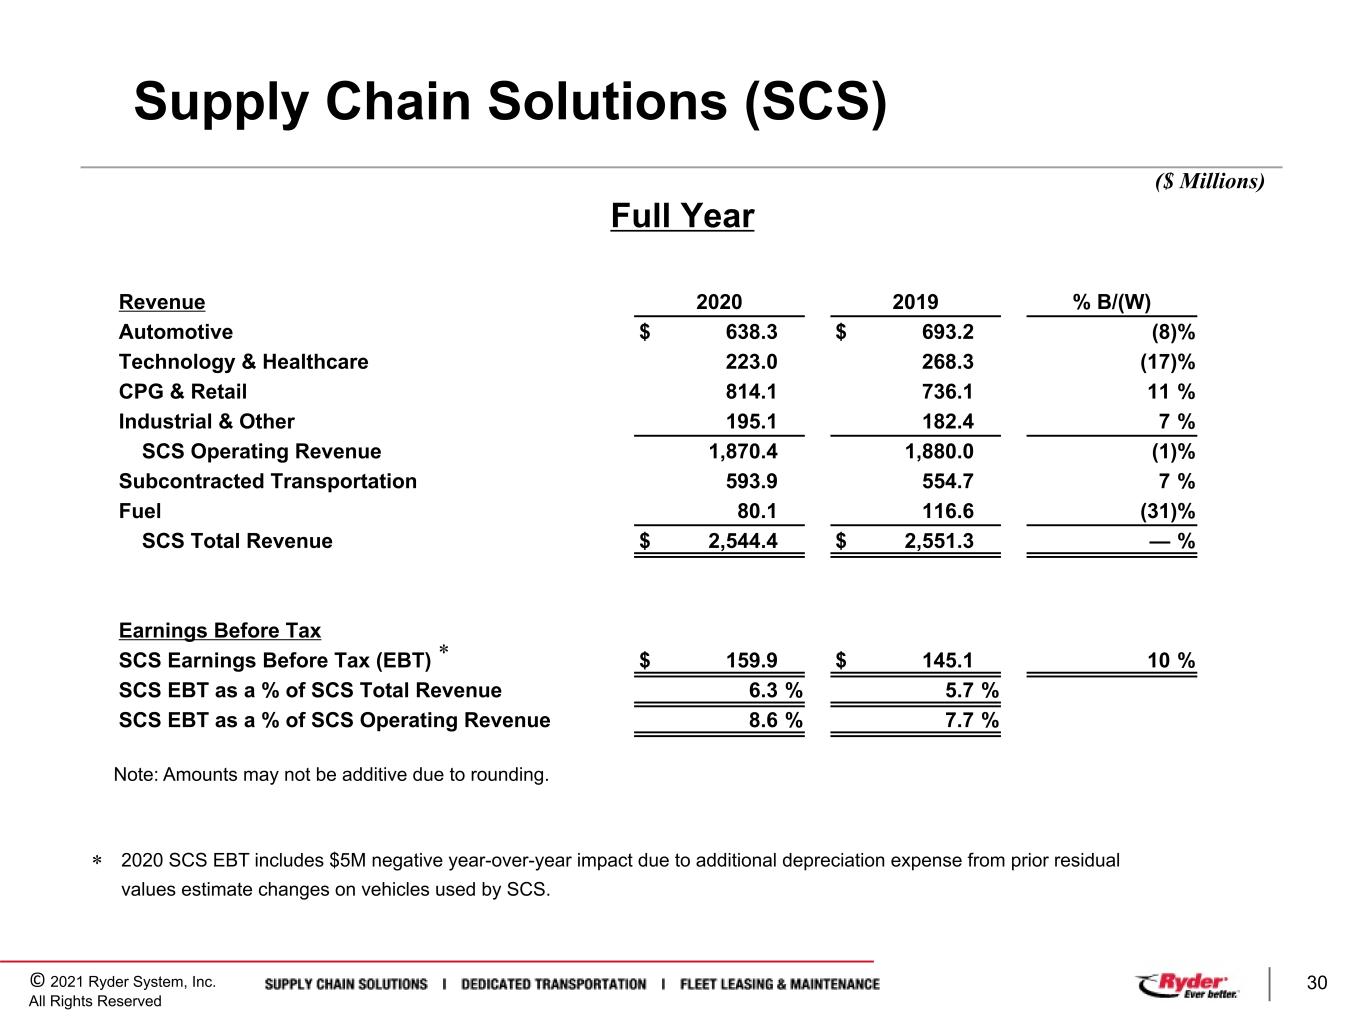

 
© 2021 Ryder System, Inc. All Rights Reserved 30 Supply Chain Solutions (SCS) ($ Millions) Revenue 2020 2019 % B/(W) Automotive $ 638.3 $ 693.2 (8) % Technology & Healthcare 223.0 268.3 (17) % CPG & Retail 814.1 736.1 11 % Industrial & Other 195.1 182.4 7 % SCS Operating Revenue 1,870.4 1,880.0 (1) % Subcontracted Transportation 593.9 554.7 7 % Fuel 80.1 116.6 (31) % SCS Total Revenue $ 2,544.4 $ 2,551.3 — % Earnings Before Tax SCS Earnings Before Tax (EBT) $ 159.9 $ 145.1 10 % SCS EBT as a % of SCS Total Revenue 6.3 % 5.7 % SCS EBT as a % of SCS Operating Revenue 8.6 % 7.7 % Full Year 2020 SCS EBT includes $5M negative year-over-year impact due to additional depreciation expense from prior residual values estimate changes on vehicles used by SCS. * * Note: Amounts may not be additive due to rounding.
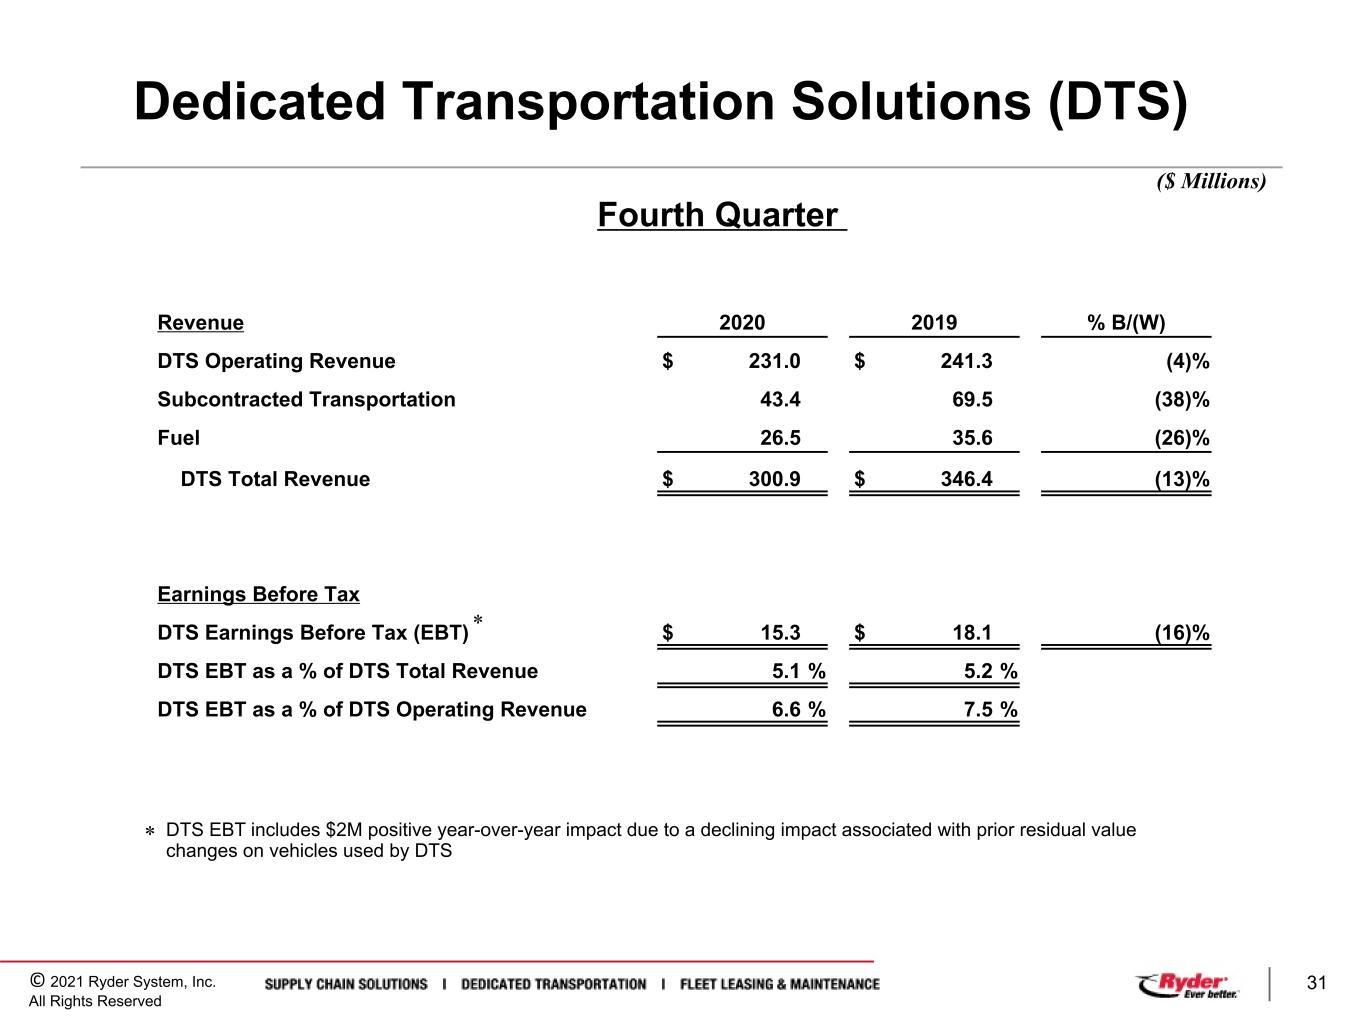

 
© 2021 Ryder System, Inc. All Rights Reserved 31 Dedicated Transportation Solutions (DTS) ($ Millions) Fourth Quarter Revenue 2020 2019 % B/(W) DTS Operating Revenue $ 231.0 $ 241.3 (4) % Subcontracted Transportation 43.4 69.5 (38) % Fuel 26.5 35.6 (26) % DTS Total Revenue $ 300.9 $ 346.4 (13) % Earnings Before Tax DTS Earnings Before Tax (EBT) $ 15.3 $ 18.1 (16) % DTS EBT as a % of DTS Total Revenue 5.1 % 5.2 % DTS EBT as a % of DTS Operating Revenue 6.6 % 7.5 % DTS EBT includes $2M positive year-over-year impact due to a declining impact associated with prior residual value changes on vehicles used by DTS * *
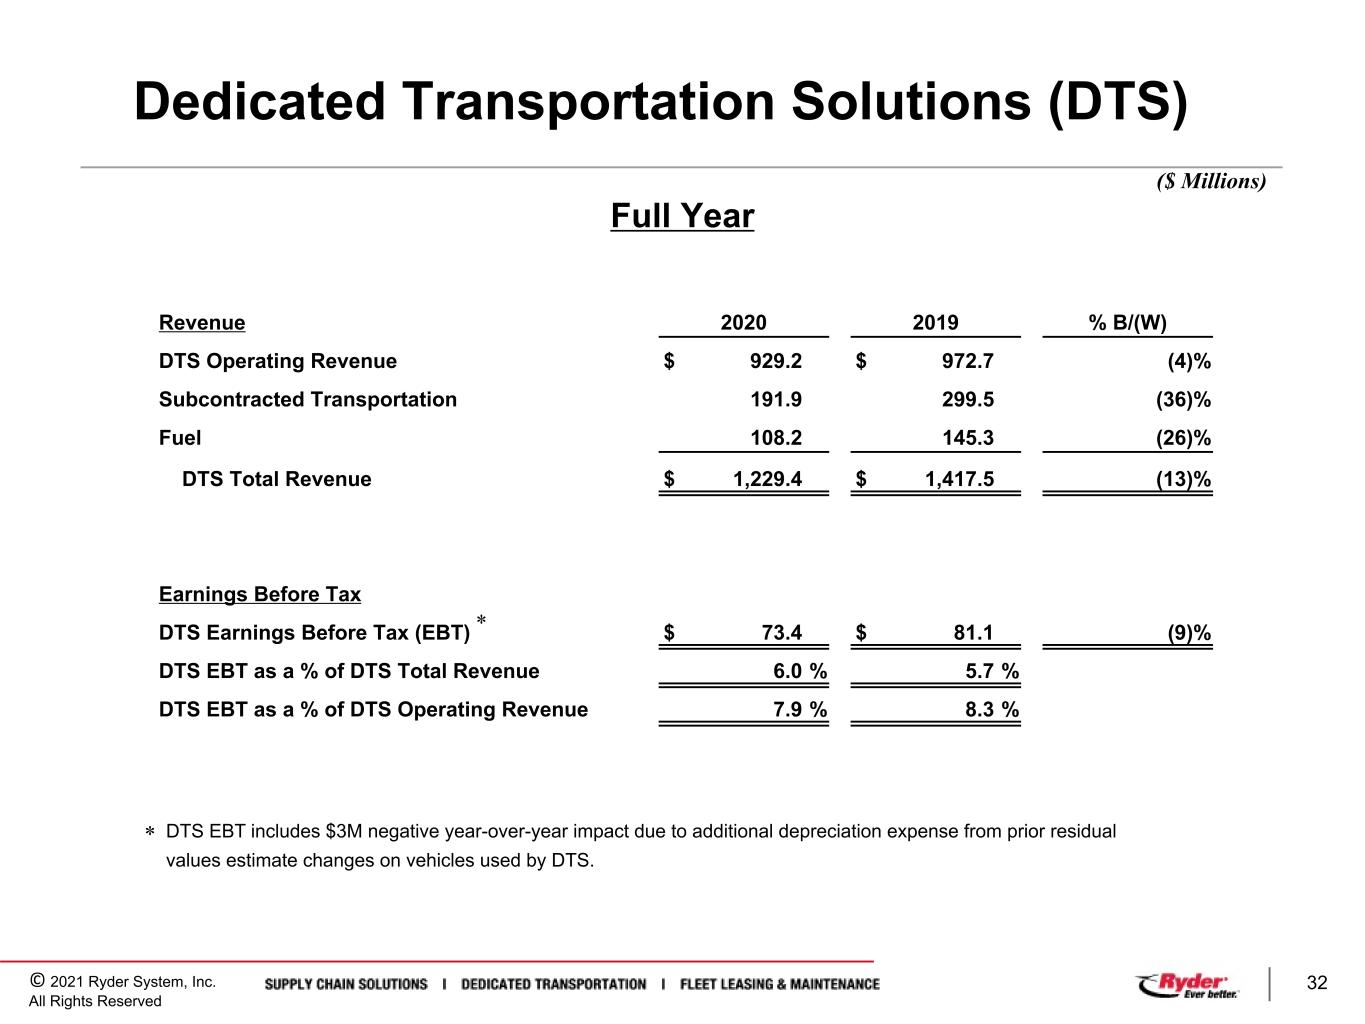

 
© 2021 Ryder System, Inc. All Rights Reserved 32 Dedicated Transportation Solutions (DTS) ($ Millions) Revenue 2020 2019 % B/(W) DTS Operating Revenue $ 929.2 $ 972.7 (4) % Subcontracted Transportation 191.9 299.5 (36) % Fuel 108.2 145.3 (26) % DTS Total Revenue $ 1,229.4 $ 1,417.5 (13) % Earnings Before Tax DTS Earnings Before Tax (EBT) $ 73.4 $ 81.1 (9) % DTS EBT as a % of DTS Total Revenue 6.0 % 5.7 % DTS EBT as a % of DTS Operating Revenue 7.9 % 8.3 % Full Year DTS EBT includes $3M negative year-over-year impact due to additional depreciation expense from prior residual values estimate changes on vehicles used by DTS. * *
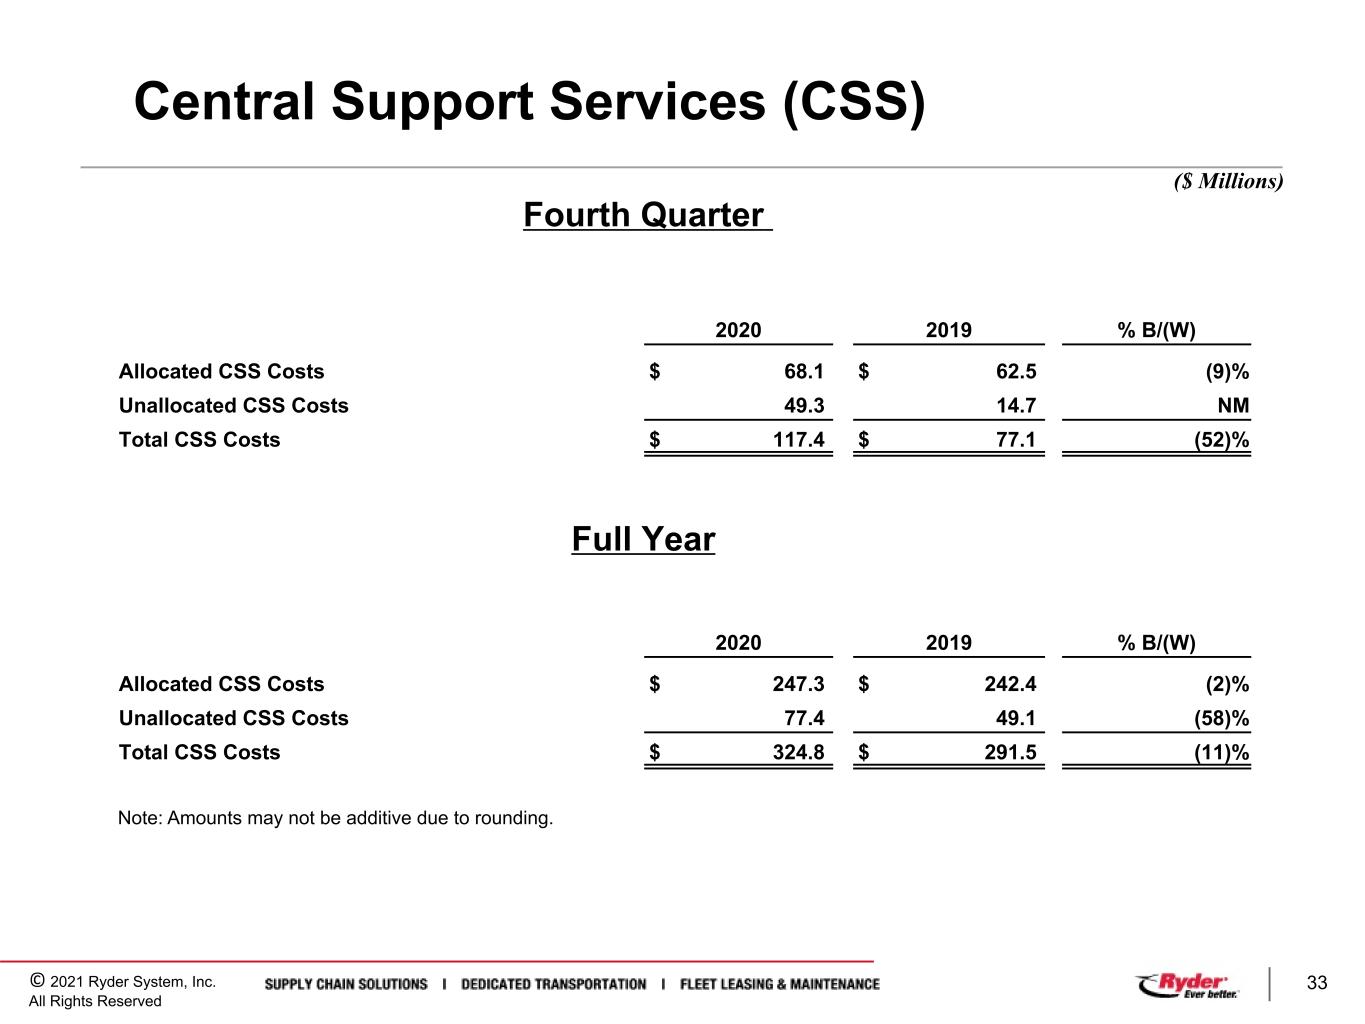

 
© 2021 Ryder System, Inc. All Rights Reserved 33 Central Support Services (CSS) Fourth Quarter ($ Millions) 2020 2019 % B/(W) Allocated CSS Costs $ 68.1 $ 62.5 (9) % Unallocated CSS Costs 49.3 14.7 NM Total CSS Costs $ 117.4 $ 77.1 (52) % 2020 2019 % B/(W) Allocated CSS Costs $ 247.3 $ 242.4 (2) % Unallocated CSS Costs 77.4 49.1 (58) % Total CSS Costs $ 324.8 $ 291.5 (11) % Full Year Note: Amounts may not be additive due to rounding.
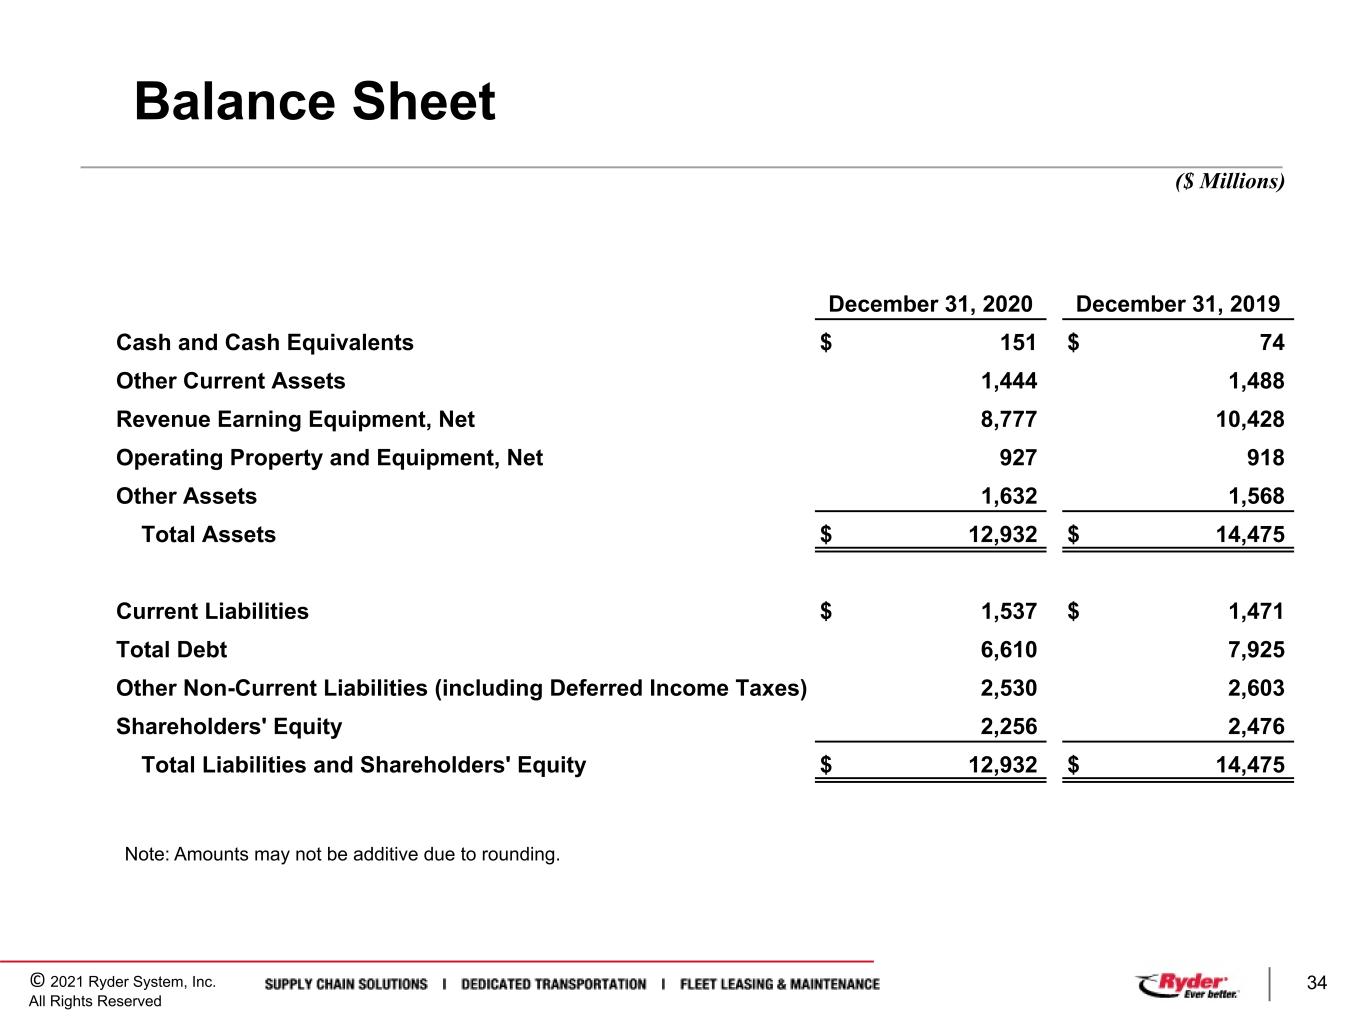

 
© 2021 Ryder System, Inc. All Rights Reserved 34 Balance Sheet ($ Millions) December 31, 2020 December 31, 2019 Cash and Cash Equivalents $ 151 $ 74 Other Current Assets 1,444 1,488 Revenue Earning Equipment, Net 8,777 10,428 Operating Property and Equipment, Net 927 918 Other Assets 1,632 1,568 Total Assets $ 12,932 $ 14,475 Current Liabilities $ 1,537 $ 1,471 Total Debt 6,610 7,925 Other Non-Current Liabilities (including Deferred Income Taxes) 2,530 2,603 Shareholders' Equity 2,256 2,476 Total Liabilities and Shareholders' Equity $ 12,932 $ 14,475 Note: Amounts may not be additive due to rounding.
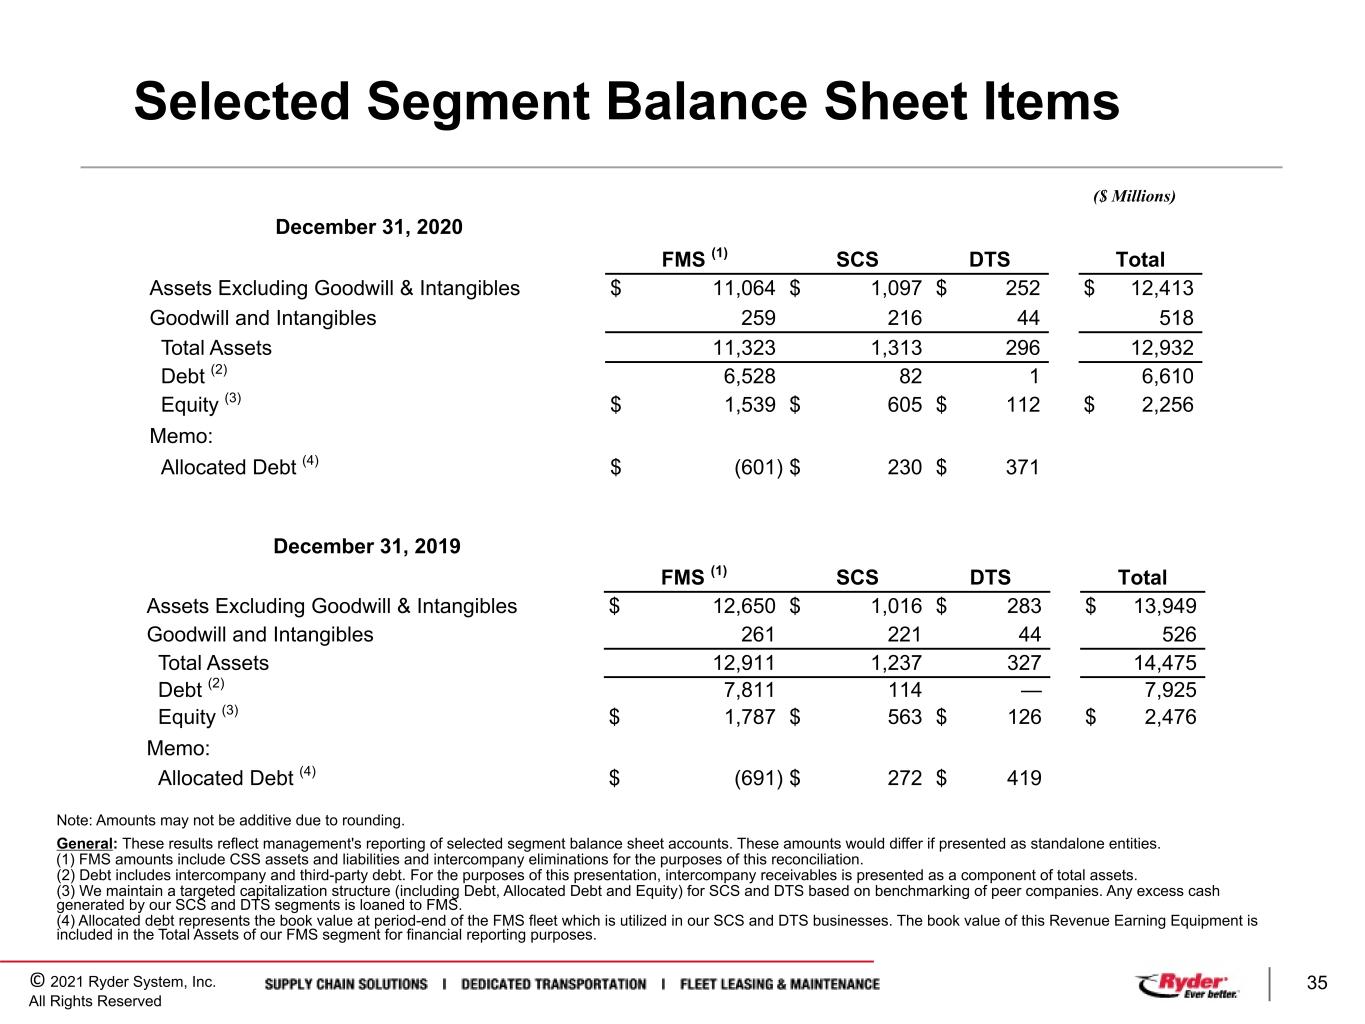

 
© 2021 Ryder System, Inc. All Rights Reserved 35 Selected Segment Balance Sheet Items ($ Millions) General: These results reflect management's reporting of selected segment balance sheet accounts. These amounts would differ if presented as standalone entities. (1) FMS amounts include CSS assets and liabilities and intercompany eliminations for the purposes of this reconciliation. (2) Debt includes intercompany and third-party debt. For the purposes of this presentation, intercompany receivables is presented as a component of total assets. (3) We maintain a targeted capitalization structure (including Debt, Allocated Debt and Equity) for SCS and DTS based on benchmarking of peer companies. Any excess cash generated by our SCS and DTS segments is loaned to FMS. (4) Allocated debt represents the book value at period-end of the FMS fleet which is utilized in our SCS and DTS businesses. The book value of this Revenue Earning Equipment is included in the Total Assets of our FMS segment for financial reporting purposes. December 31, 2020 FMS (1) SCS DTS Total Assets Excluding Goodwill & Intangibles $ 11,064 $ 1,097 $ 252 $ 12,413 Goodwill and Intangibles 259 216 44 518 Total Assets 11,323 1,313 296 12,932 Debt (2) 6,528 82 1 6,610 Equity (3) $ 1,539 $ 605 $ 112 $ 2,256 Memo: Allocated Debt (4) $ (601) $ 230 $ 371 Note: Amounts may not be additive due to rounding. December 31, 2019 FMS (1) SCS DTS Total Assets Excluding Goodwill & Intangibles $ 12,650 $ 1,016 $ 283 $ 13,949 Goodwill and Intangibles 261 221 44 526 Total Assets 12,911 1,237 327 14,475 Debt (2) 7,811 114 — 7,925 Equity (3) $ 1,787 $ 563 $ 126 $ 2,476 Memo: Allocated Debt (4) $ (691) $ 272 $ 419
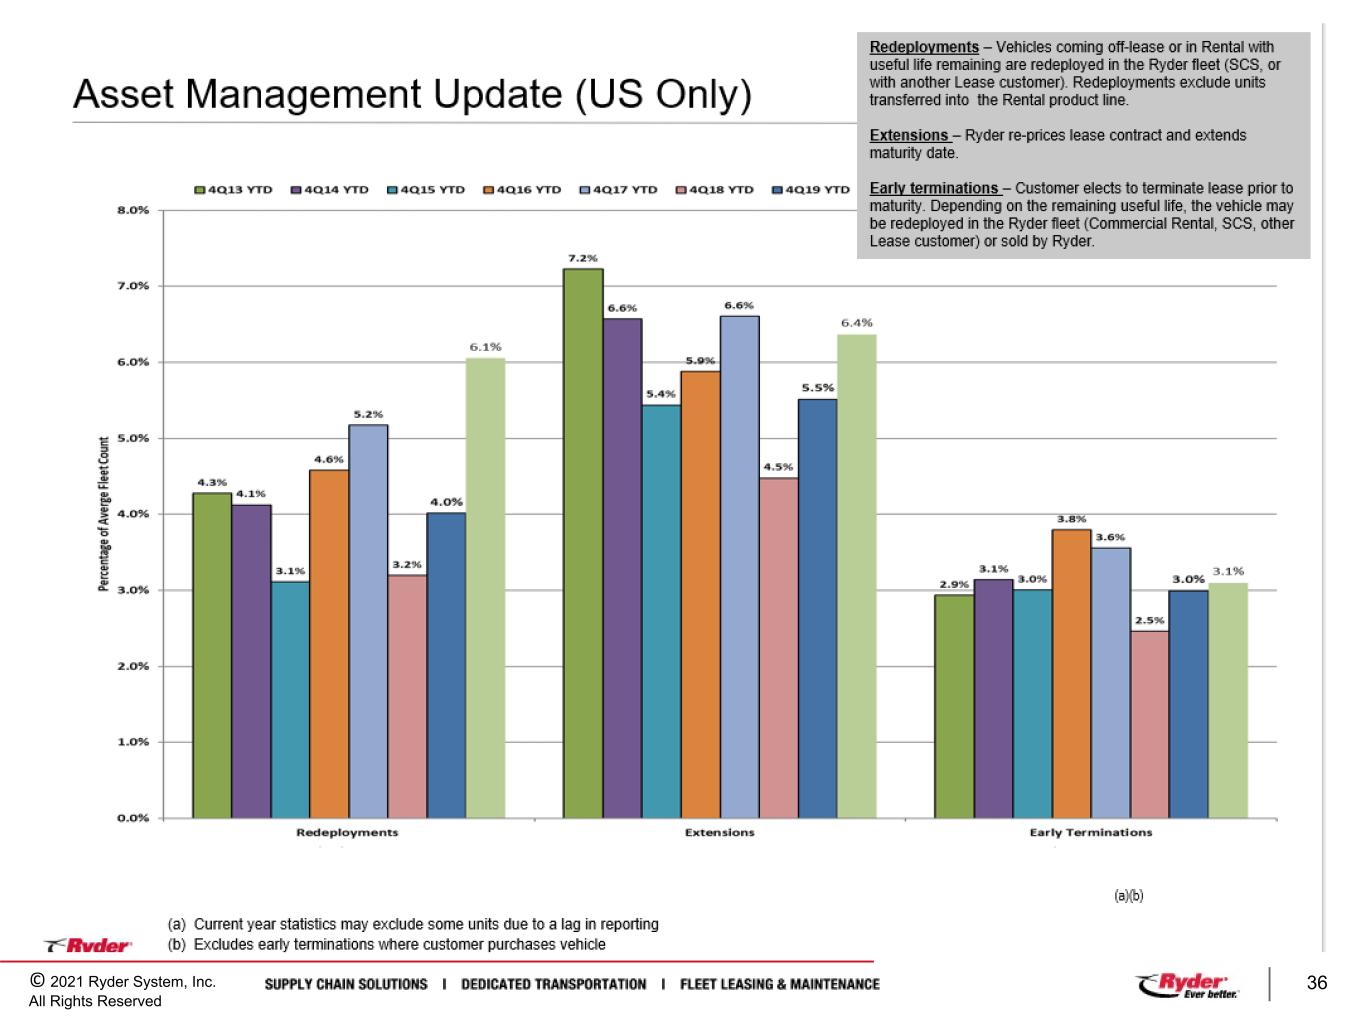

 
© 2021 Ryder System, Inc. All Rights Reserved 36
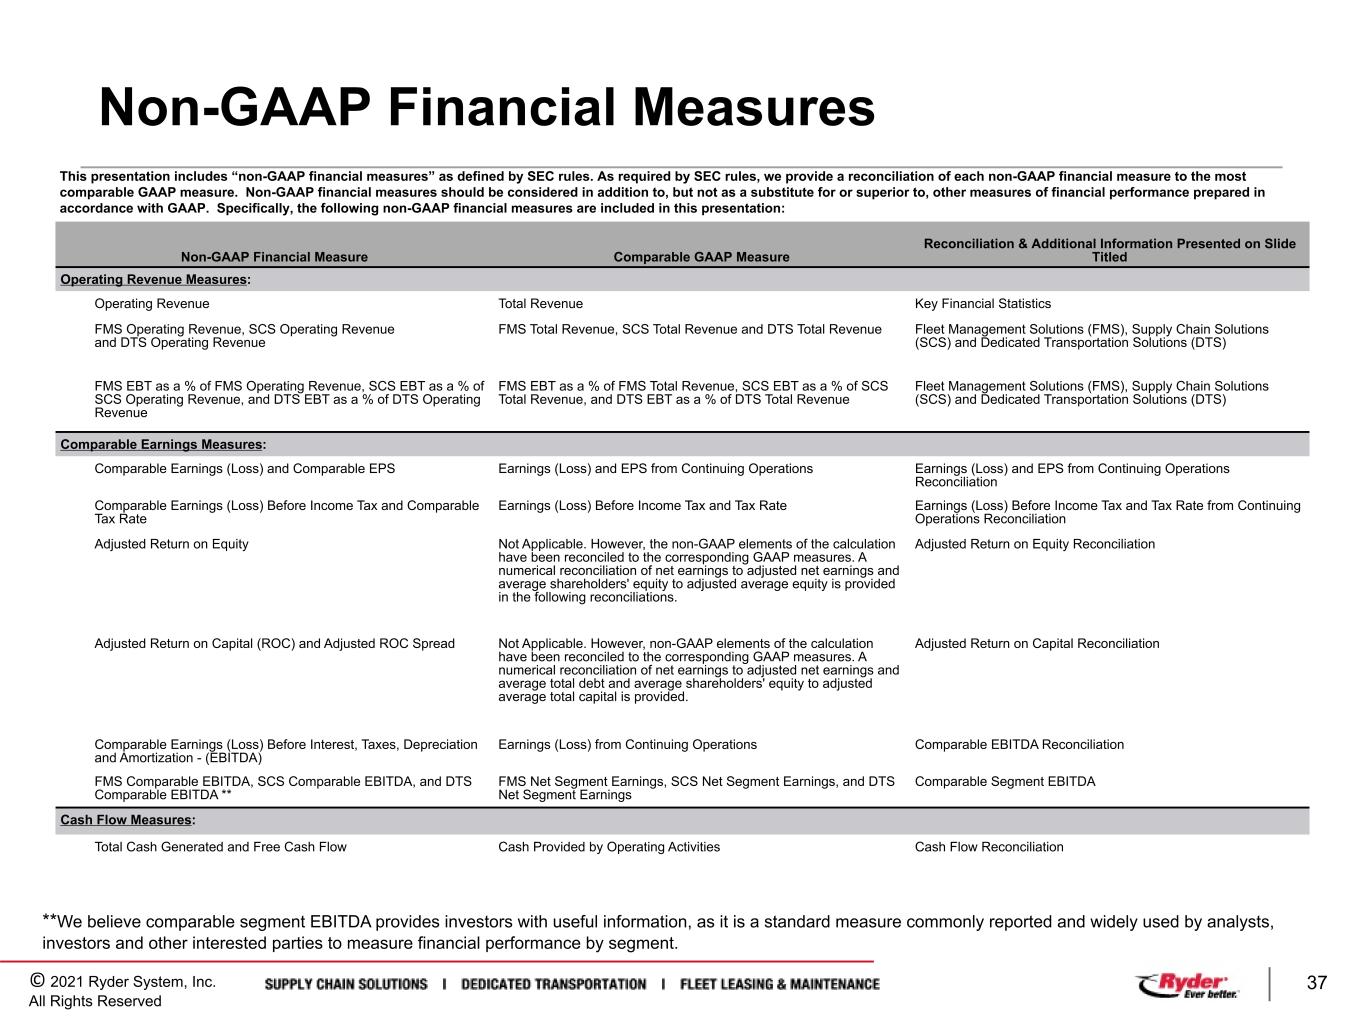

 
© 2021 Ryder System, Inc. All Rights Reserved 37 Non-GAAP Financial Measures This presentation includes “non-GAAP financial measures” as defined by SEC rules. As required by SEC rules, we provide a reconciliation of each non-GAAP financial measure to the most comparable GAAP measure. Non-GAAP financial measures should be considered in addition to, but not as a substitute for or superior to, other measures of financial performance prepared in accordance with GAAP. Specifically, the following non-GAAP financial measures are included in this presentation: Non-GAAP Financial Measure Comparable GAAP Measure Reconciliation & Additional Information Presented on Slide Titled Operating Revenue Measures: Operating Revenue Total Revenue Key Financial Statistics FMS Operating Revenue, SCS Operating Revenue and DTS Operating Revenue FMS Total Revenue, SCS Total Revenue and DTS Total Revenue Fleet Management Solutions (FMS), Supply Chain Solutions (SCS) and Dedicated Transportation Solutions (DTS) FMS EBT as a % of FMS Operating Revenue, SCS EBT as a % of SCS Operating Revenue, and DTS EBT as a % of DTS Operating Revenue FMS EBT as a % of FMS Total Revenue, SCS EBT as a % of SCS Total Revenue, and DTS EBT as a % of DTS Total Revenue Fleet Management Solutions (FMS), Supply Chain Solutions (SCS) and Dedicated Transportation Solutions (DTS) Comparable Earnings Measures: Comparable Earnings (Loss) and Comparable EPS Earnings (Loss) and EPS from Continuing Operations Earnings (Loss) and EPS from Continuing Operations Reconciliation Comparable Earnings (Loss) Before Income Tax and Comparable Tax Rate Earnings (Loss) Before Income Tax and Tax Rate Earnings (Loss) Before Income Tax and Tax Rate from Continuing Operations Reconciliation Adjusted Return on Equity Not Applicable. However, the non-GAAP elements of the calculation have been reconciled to the corresponding GAAP measures. A numerical reconciliation of net earnings to adjusted net earnings and average shareholders' equity to adjusted average equity is provided in the following reconciliations. Adjusted Return on Equity Reconciliation Adjusted Return on Capital (ROC) and Adjusted ROC Spread Not Applicable. However, non-GAAP elements of the calculation have been reconciled to the corresponding GAAP measures. A numerical reconciliation of net earnings to adjusted net earnings and average total debt and average shareholders' equity to adjusted average total capital is provided. Adjusted Return on Capital Reconciliation Comparable Earnings (Loss) Before Interest, Taxes, Depreciation and Amortization - (EBITDA) Earnings (Loss) from Continuing Operations Comparable EBITDA Reconciliation FMS Comparable EBITDA, SCS Comparable EBITDA, and DTS Comparable EBITDA ** FMS Net Segment Earnings, SCS Net Segment Earnings, and DTS Net Segment Earnings Comparable Segment EBITDA Cash Flow Measures: Total Cash Generated and Free Cash Flow Cash Provided by Operating Activities Cash Flow Reconciliation **We believe comparable segment EBITDA provides investors with useful information, as it is a standard measure commonly reported and widely used by analysts, investors and other interested parties to measure financial performance by segment.
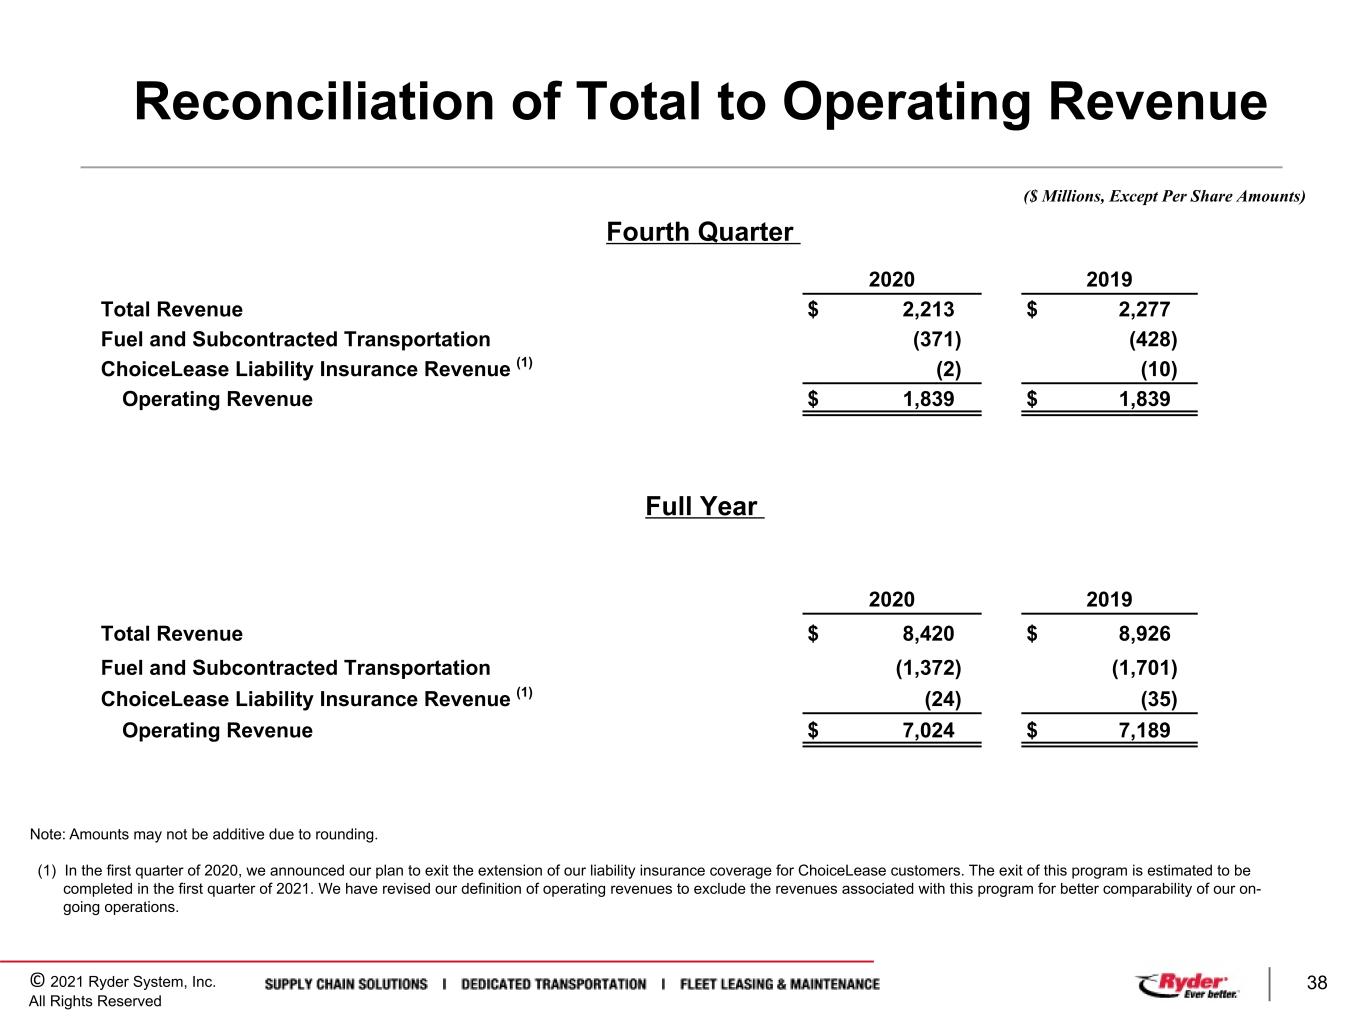

 
© 2021 Ryder System, Inc. All Rights Reserved 38 Reconciliation of Total to Operating Revenue Full Year 2020 2019 Total Revenue $ 2,213 $ 2,277 Fuel and Subcontracted Transportation (371) (428) ChoiceLease Liability Insurance Revenue (1) (2) (10) Operating Revenue $ 1,839 $ 1,839 2020 2019 Total Revenue $ 8,420 $ 8,926 Fuel and Subcontracted Transportation (1,372) (1,701) ChoiceLease Liability Insurance Revenue (1) (24) (35) Operating Revenue $ 7,024 $ 7,189 ($ Millions, Except Per Share Amounts) (1) In the first quarter of 2020, we announced our plan to exit the extension of our liability insurance coverage for ChoiceLease customers. The exit of this program is estimated to be completed in the first quarter of 2021. We have revised our definition of operating revenues to exclude the revenues associated with this program for better comparability of our on- going operations. Note: Amounts may not be additive due to rounding. Fourth Quarter
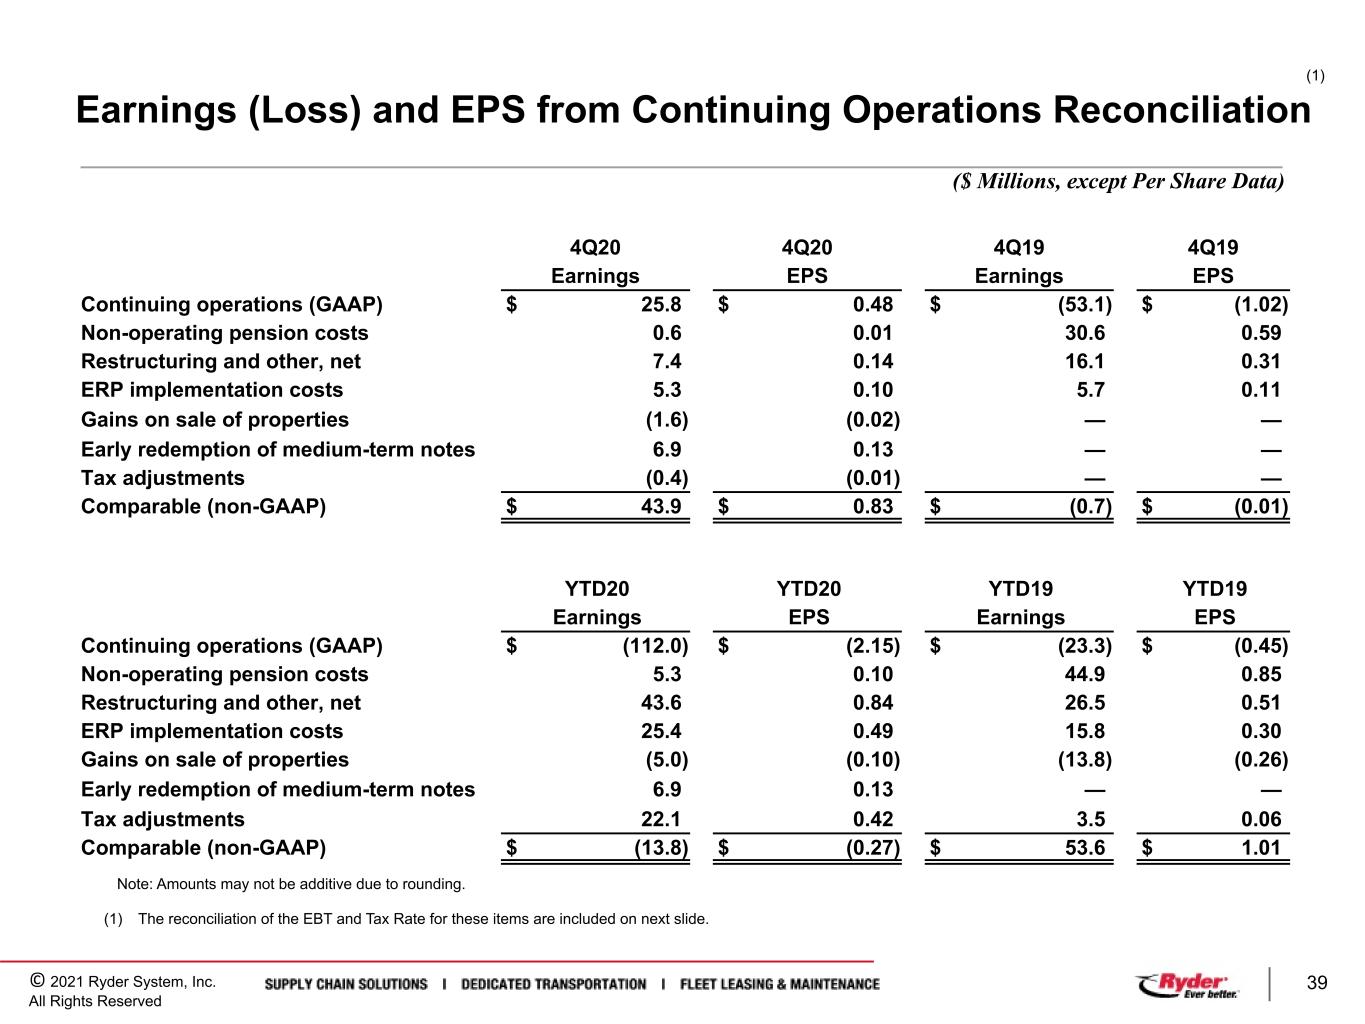

 
© 2021 Ryder System, Inc. All Rights Reserved 39 Earnings (Loss) and EPS from Continuing Operations Reconciliation ($ Millions, except Per Share Data) 4Q20 4Q20 4Q19 4Q19 Earnings EPS Earnings EPS Continuing operations (GAAP) $ 25.8 $ 0.48 $ (53.1) $ (1.02) Non-operating pension costs 0.6 0.01 30.6 0.59 Restructuring and other, net 7.4 0.14 16.1 0.31 ERP implementation costs 5.3 0.10 5.7 0.11 Gains on sale of properties (1.6) (0.02) — — Early redemption of medium-term notes 6.9 0.13 — — Tax adjustments (0.4) (0.01) — — Comparable (non-GAAP) $ 43.9 $ 0.83 $ (0.7) $ (0.01) YTD20 YTD20 YTD19 YTD19 Earnings EPS Earnings EPS Continuing operations (GAAP) $ (112.0) $ (2.15) $ (23.3) $ (0.45) Non-operating pension costs 5.3 0.10 44.9 0.85 Restructuring and other, net 43.6 0.84 26.5 0.51 ERP implementation costs 25.4 0.49 15.8 0.30 Gains on sale of properties (5.0) (0.10) (13.8) (0.26) Early redemption of medium-term notes 6.9 0.13 — — Tax adjustments 22.1 0.42 3.5 0.06 Comparable (non-GAAP) $ (13.8) $ (0.27) $ 53.6 $ 1.01 (1) The reconciliation of the EBT and Tax Rate for these items are included on next slide. (1) Note: Amounts may not be additive due to rounding.
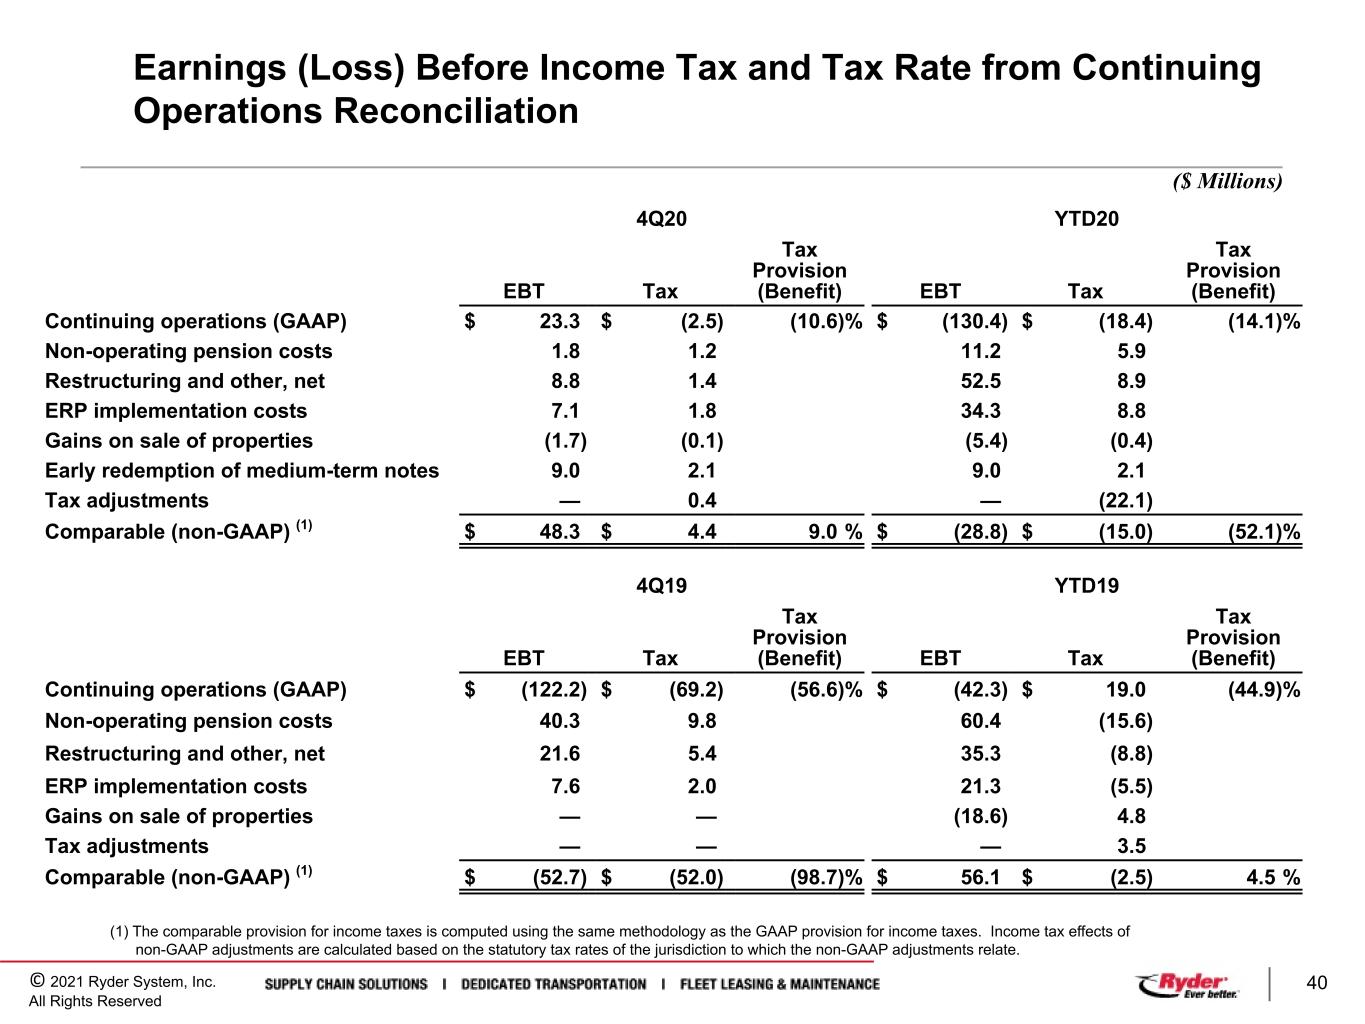

 
© 2021 Ryder System, Inc. All Rights Reserved 40 Earnings (Loss) Before Income Tax and Tax Rate from Continuing Operations Reconciliation ($ Millions) 4Q20 YTD20 EBT Tax Tax Provision (Benefit) EBT Tax Tax Provision (Benefit) Continuing operations (GAAP) $ 23.3 $ (2.5) (10.6) % $ (130.4) $ (18.4) (14.1) % Non-operating pension costs 1.8 1.2 11.2 5.9 Restructuring and other, net 8.8 1.4 52.5 8.9 ERP implementation costs 7.1 1.8 34.3 8.8 Gains on sale of properties (1.7) (0.1) (5.4) (0.4) Early redemption of medium-term notes 9.0 2.1 9.0 2.1 Tax adjustments — 0.4 — (22.1) Comparable (non-GAAP) (1) $ 48.3 $ 4.4 9.0 % $ (28.8) $ (15.0) (52.1) % 4Q19 YTD19 EBT Tax Tax Provision (Benefit) EBT Tax Tax Provision (Benefit) Continuing operations (GAAP) $ (122.2) $ (69.2) (56.6) % $ (42.3) $ 19.0 (44.9) % Non-operating pension costs 40.3 9.8 60.4 (15.6) Restructuring and other, net 21.6 5.4 35.3 (8.8) ERP implementation costs 7.6 2.0 21.3 (5.5) Gains on sale of properties — — (18.6) 4.8 Tax adjustments — — — 3.5 Comparable (non-GAAP) (1) $ (52.7) $ (52.0) (98.7) % $ 56.1 $ (2.5) 4.5 % (1) The comparable provision for income taxes is computed using the same methodology as the GAAP provision for income taxes. Income tax effects of non-GAAP adjustments are calculated based on the statutory tax rates of the jurisdiction to which the non-GAAP adjustments relate.
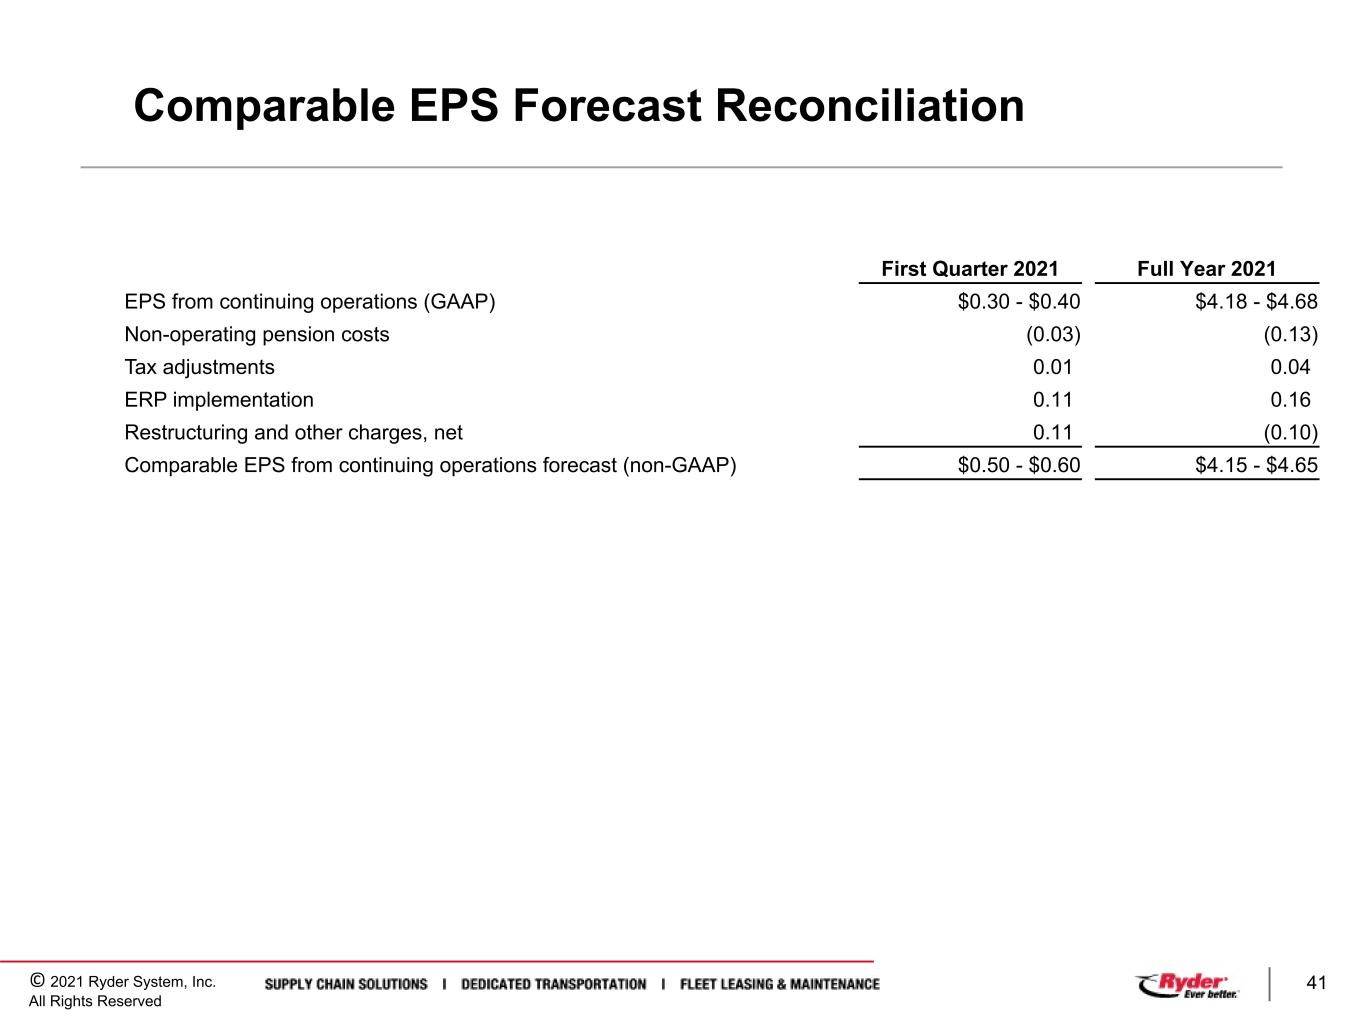

 
© 2021 Ryder System, Inc. All Rights Reserved 41 Comparable EPS Forecast Reconciliation First Quarter 2021 Full Year 2021 EPS from continuing operations (GAAP) $0.30 - $0.40 $4.18 - $4.68 Non-operating pension costs (0.03) (0.13) Tax adjustments 0.01 0.04 ERP implementation 0.11 0.16 Restructuring and other charges, net 0.11 (0.10) Comparable EPS from continuing operations forecast (non-GAAP) $0.50 - $0.60 $4.15 - $4.65
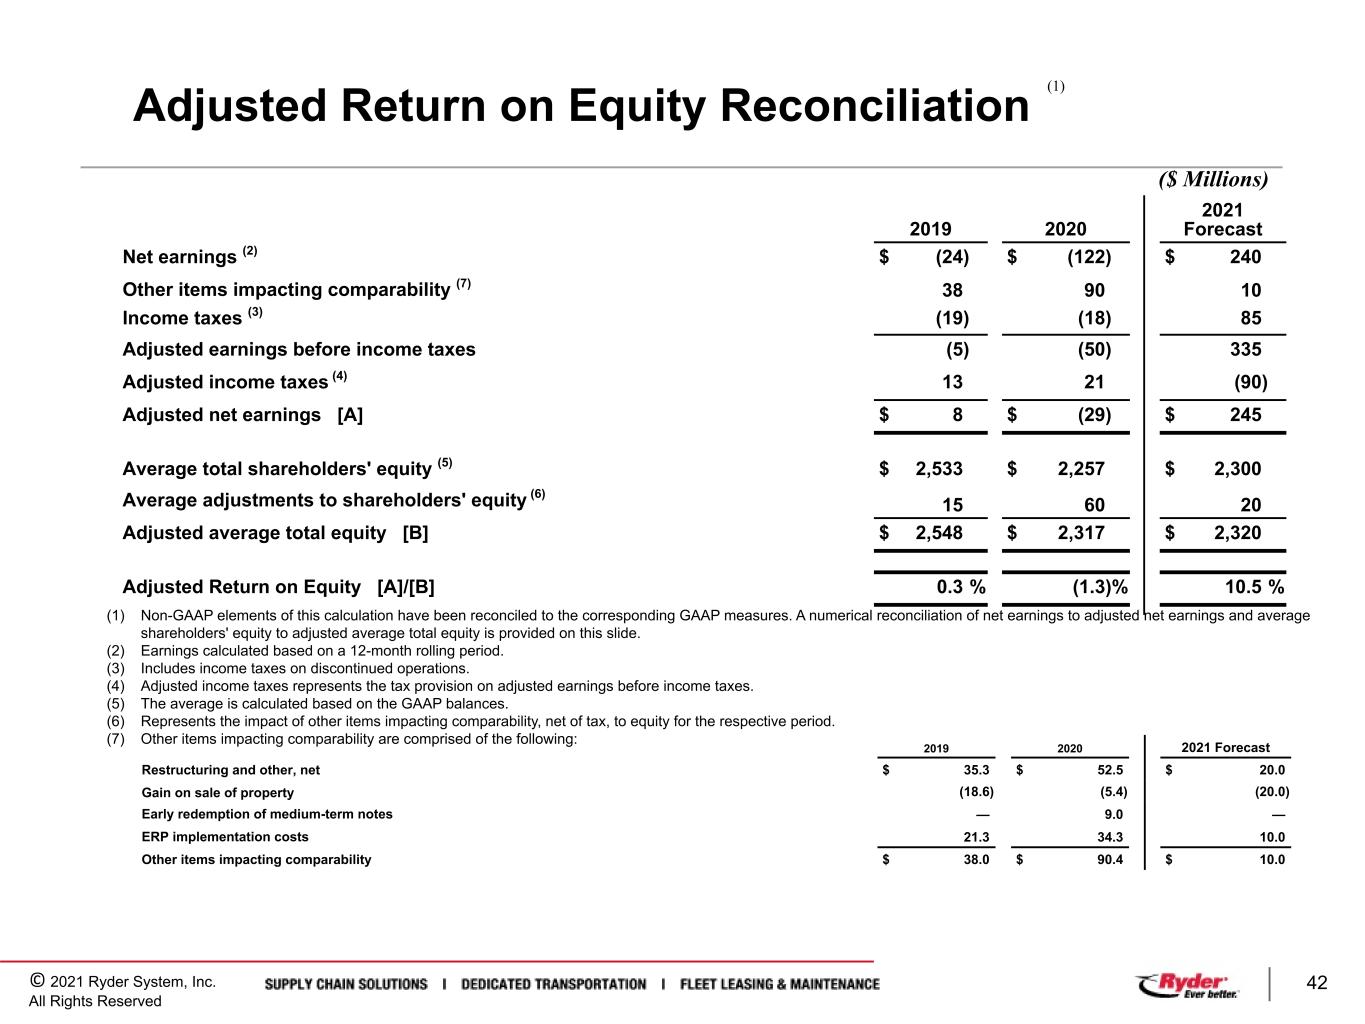

 
© 2021 Ryder System, Inc. All Rights Reserved 42 Adjusted Return on Equity Reconciliation ($ Millions) 2019 2020 2021 Forecast Net earnings (2) $ (24) $ (122) $ 240 Other items impacting comparability (7) 38 90 10 Income taxes (3) (19) (18) 85 Adjusted earnings before income taxes (5) (50) 335 Adjusted income taxes (4) 13 21 (90) Adjusted net earnings [A] $ 8 $ (29) $ 245 Average total shareholders' equity (5) $ 2,533 $ 2,257 $ 2,300 Average adjustments to shareholders' equity (6) 15 60 20 Adjusted average total equity [B] $ 2,548 $ 2,317 $ 2,320 Adjusted Return on Equity [A]/[B] 0.3 % (1.3) % 10.5 % (1) (1) Non-GAAP elements of this calculation have been reconciled to the corresponding GAAP measures. A numerical reconciliation of net earnings to adjusted net earnings and average shareholders' equity to adjusted average total equity is provided on this slide. (2) Earnings calculated based on a 12-month rolling period. (3) Includes income taxes on discontinued operations. (4) Adjusted income taxes represents the tax provision on adjusted earnings before income taxes. (5) The average is calculated based on the GAAP balances. (6) Represents the impact of other items impacting comparability, net of tax, to equity for the respective period. (7) Other items impacting comparability are comprised of the following: 2019 2020 2021 Forecast Restructuring and other, net $ 35.3 $ 52.5 $ 20.0 Gain on sale of property (18.6) (5.4) (20.0) Early redemption of medium-term notes — 9.0 — ERP implementation costs 21.3 34.3 10.0 Other items impacting comparability $ 38.0 $ 90.4 $ 10.0
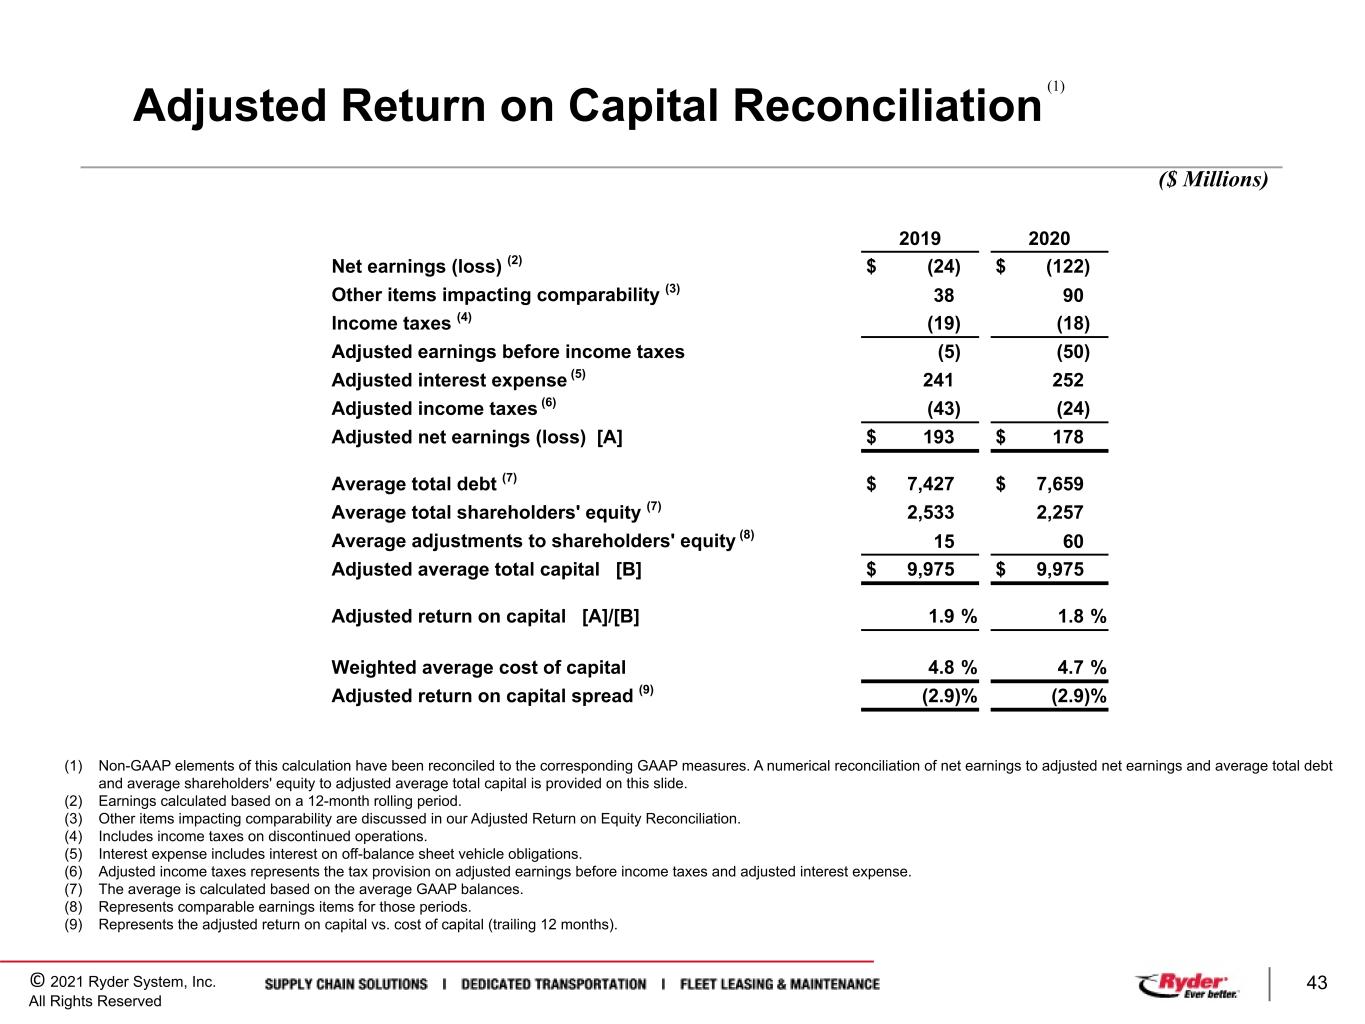

 
© 2021 Ryder System, Inc. All Rights Reserved 43 Adjusted Return on Capital Reconciliation ($ Millions) (1) Non-GAAP elements of this calculation have been reconciled to the corresponding GAAP measures. A numerical reconciliation of net earnings to adjusted net earnings and average total debt and average shareholders' equity to adjusted average total capital is provided on this slide. (2) Earnings calculated based on a 12-month rolling period. (3) Other items impacting comparability are discussed in our Adjusted Return on Equity Reconciliation. (4) Includes income taxes on discontinued operations. (5) Interest expense includes interest on off-balance sheet vehicle obligations. (6) Adjusted income taxes represents the tax provision on adjusted earnings before income taxes and adjusted interest expense. (7) The average is calculated based on the average GAAP balances. (8) Represents comparable earnings items for those periods. (9) Represents the adjusted return on capital vs. cost of capital (trailing 12 months). 2019 2020 Net earnings (loss) (2) $ (24) $ (122) Other items impacting comparability (3) 38 90 Income taxes (4) (19) (18) Adjusted earnings before income taxes (5) (50) Adjusted interest expense (5) 241 252 Adjusted income taxes (6) (43) (24) Adjusted net earnings (loss) [A] $ 193 $ 178 Average total debt (7) $ 7,427 $ 7,659 Average total shareholders' equity (7) 2,533 2,257 Average adjustments to shareholders' equity (8) 15 60 Adjusted average total capital [B] $ 9,975 $ 9,975 Adjusted return on capital [A]/[B] 1.9 % 1.8 % Weighted average cost of capital 4.8 % 4.7 % Adjusted return on capital spread (9) (2.9) % (2.9) % (1)
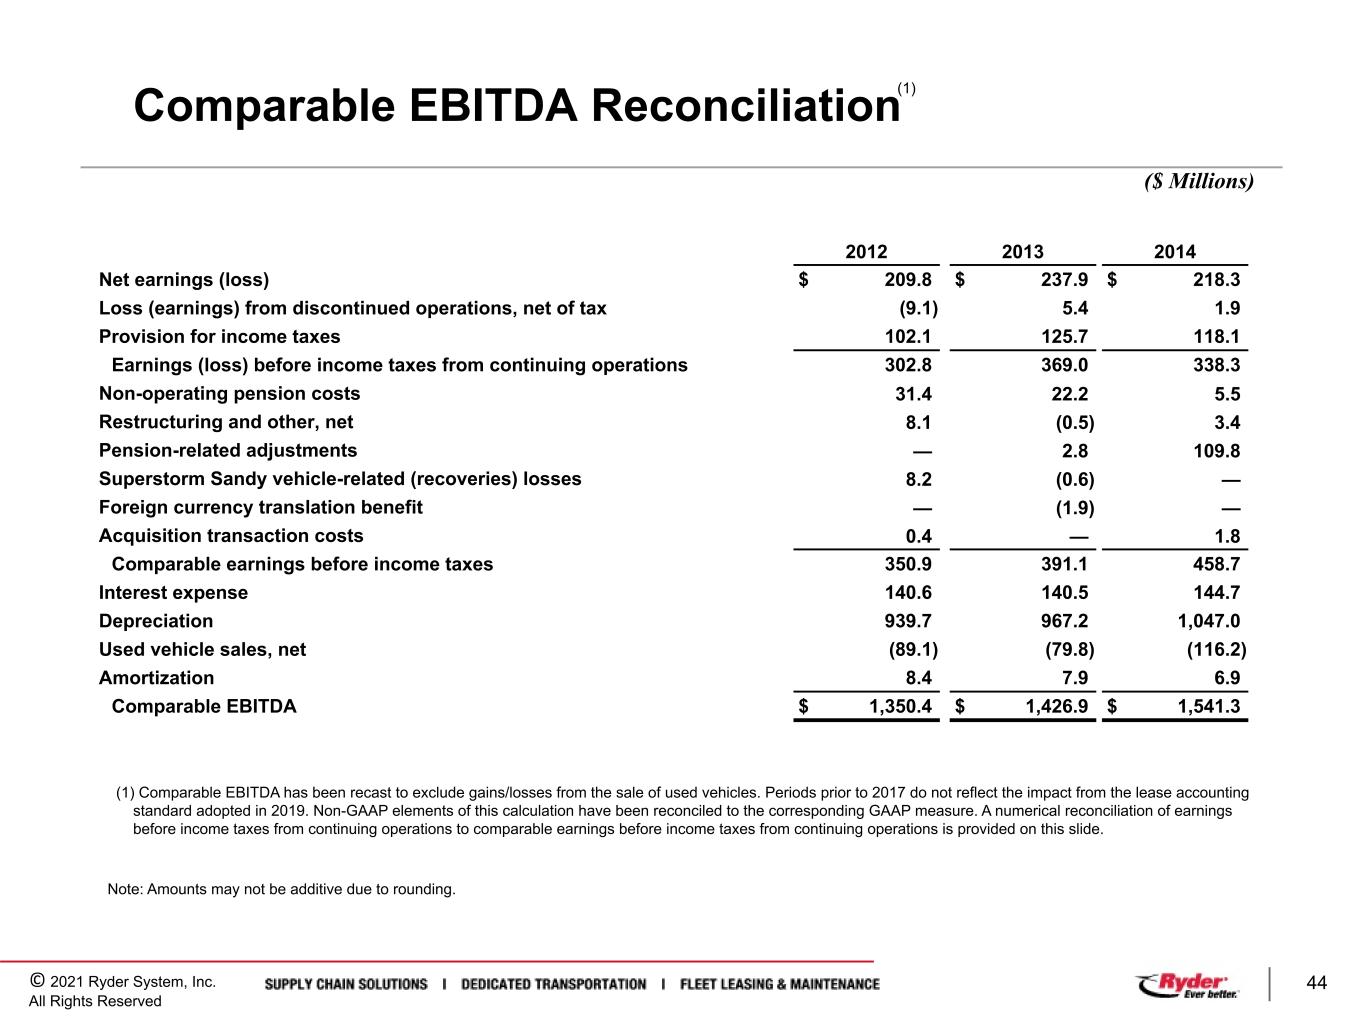

 
© 2021 Ryder System, Inc. All Rights Reserved 44 Comparable EBITDA Reconciliation ($ Millions) 2012 2013 2014 Net earnings (loss) $ 209.8 $ 237.9 $ 218.3 Loss (earnings) from discontinued operations, net of tax (9.1) 5.4 1.9 Provision for income taxes 102.1 125.7 118.1 Earnings (loss) before income taxes from continuing operations 302.8 369.0 338.3 Non-operating pension costs 31.4 22.2 5.5 Restructuring and other, net 8.1 (0.5) 3.4 Pension-related adjustments — 2.8 109.8 Superstorm Sandy vehicle-related (recoveries) losses 8.2 (0.6) — Foreign currency translation benefit — (1.9) — Acquisition transaction costs 0.4 — 1.8 Comparable earnings before income taxes 350.9 391.1 458.7 Interest expense 140.6 140.5 144.7 Depreciation 939.7 967.2 1,047.0 Used vehicle sales, net (89.1) (79.8) (116.2) Amortization 8.4 7.9 6.9 Comparable EBITDA $ 1,350.4 $ 1,426.9 $ 1,541.3 (1) Note: Amounts may not be additive due to rounding. (1) Comparable EBITDA has been recast to exclude gains/losses from the sale of used vehicles. Periods prior to 2017 do not reflect the impact from the lease accounting standard adopted in 2019. Non-GAAP elements of this calculation have been reconciled to the corresponding GAAP measure. A numerical reconciliation of earnings before income taxes from continuing operations to comparable earnings before income taxes from continuing operations is provided on this slide.
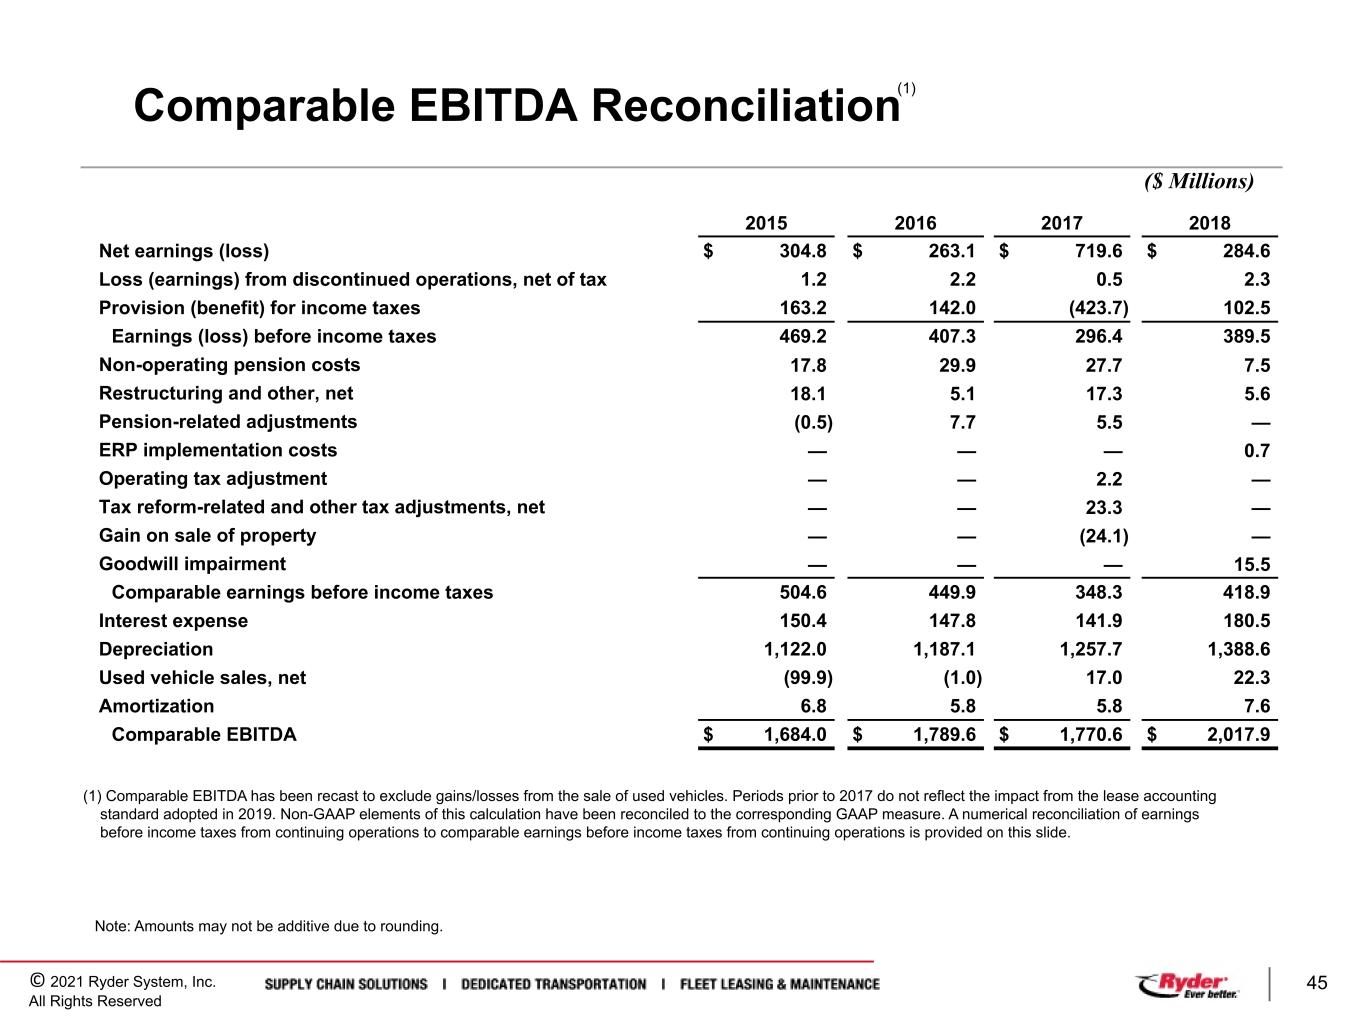

 
© 2021 Ryder System, Inc. All Rights Reserved 45 Comparable EBITDA Reconciliation ($ Millions) 2015 2016 2017 2018 Net earnings (loss) $ 304.8 $ 263.1 $ 719.6 $ 284.6 Loss (earnings) from discontinued operations, net of tax 1.2 2.2 0.5 2.3 Provision (benefit) for income taxes 163.2 142.0 (423.7) 102.5 Earnings (loss) before income taxes 469.2 407.3 296.4 389.5 Non-operating pension costs 17.8 29.9 27.7 7.5 Restructuring and other, net 18.1 5.1 17.3 5.6 Pension-related adjustments (0.5) 7.7 5.5 — ERP implementation costs — — — 0.7 Operating tax adjustment — — 2.2 — Tax reform-related and other tax adjustments, net — — 23.3 — Gain on sale of property — — (24.1) — Goodwill impairment — — — 15.5 Comparable earnings before income taxes 504.6 449.9 348.3 418.9 Interest expense 150.4 147.8 141.9 180.5 Depreciation 1,122.0 1,187.1 1,257.7 1,388.6 Used vehicle sales, net (99.9) (1.0) 17.0 22.3 Amortization 6.8 5.8 5.8 7.6 Comparable EBITDA $ 1,684.0 $ 1,789.6 $ 1,770.6 $ 2,017.9 (1) Note: Amounts may not be additive due to rounding. (1) Comparable EBITDA has been recast to exclude gains/losses from the sale of used vehicles. Periods prior to 2017 do not reflect the impact from the lease accounting standard adopted in 2019. Non-GAAP elements of this calculation have been reconciled to the corresponding GAAP measure. A numerical reconciliation of earnings before income taxes from continuing operations to comparable earnings before income taxes from continuing operations is provided on this slide.
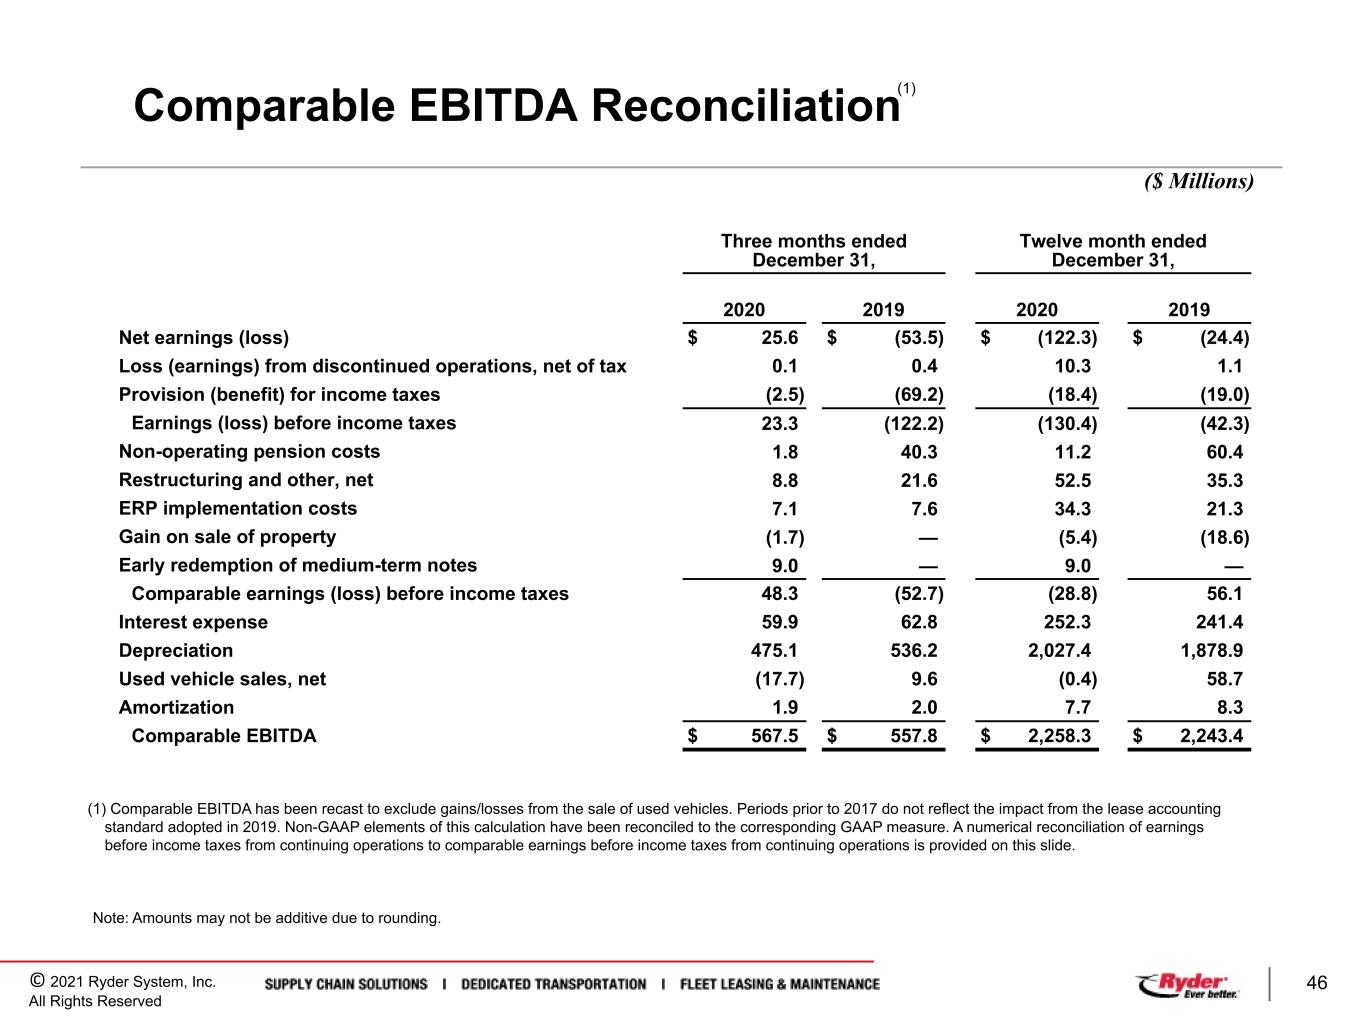

 
© 2021 Ryder System, Inc. All Rights Reserved 46 Comparable EBITDA Reconciliation ($ Millions) Three months ended December 31, Twelve month ended December 31, 2020 2019 2020 2019 Net earnings (loss) $ 25.6 $ (53.5) $ (122.3) $ (24.4) Loss (earnings) from discontinued operations, net of tax 0.1 0.4 10.3 1.1 Provision (benefit) for income taxes (2.5) (69.2) (18.4) (19.0) Earnings (loss) before income taxes 23.3 (122.2) (130.4) (42.3) Non-operating pension costs 1.8 40.3 11.2 60.4 Restructuring and other, net 8.8 21.6 52.5 35.3 ERP implementation costs 7.1 7.6 34.3 21.3 Gain on sale of property (1.7) — (5.4) (18.6) Early redemption of medium-term notes 9.0 — 9.0 — Comparable earnings (loss) before income taxes 48.3 (52.7) (28.8) 56.1 Interest expense 59.9 62.8 252.3 241.4 Depreciation 475.1 536.2 2,027.4 1,878.9 Used vehicle sales, net (17.7) 9.6 (0.4) 58.7 Amortization 1.9 2.0 7.7 8.3 Comparable EBITDA $ 567.5 $ 557.8 $ 2,258.3 $ 2,243.4 (1) Note: Amounts may not be additive due to rounding. (1) Comparable EBITDA has been recast to exclude gains/losses from the sale of used vehicles. Periods prior to 2017 do not reflect the impact from the lease accounting standard adopted in 2019. Non-GAAP elements of this calculation have been reconciled to the corresponding GAAP measure. A numerical reconciliation of earnings before income taxes from continuing operations to comparable earnings before income taxes from continuing operations is provided on this slide.
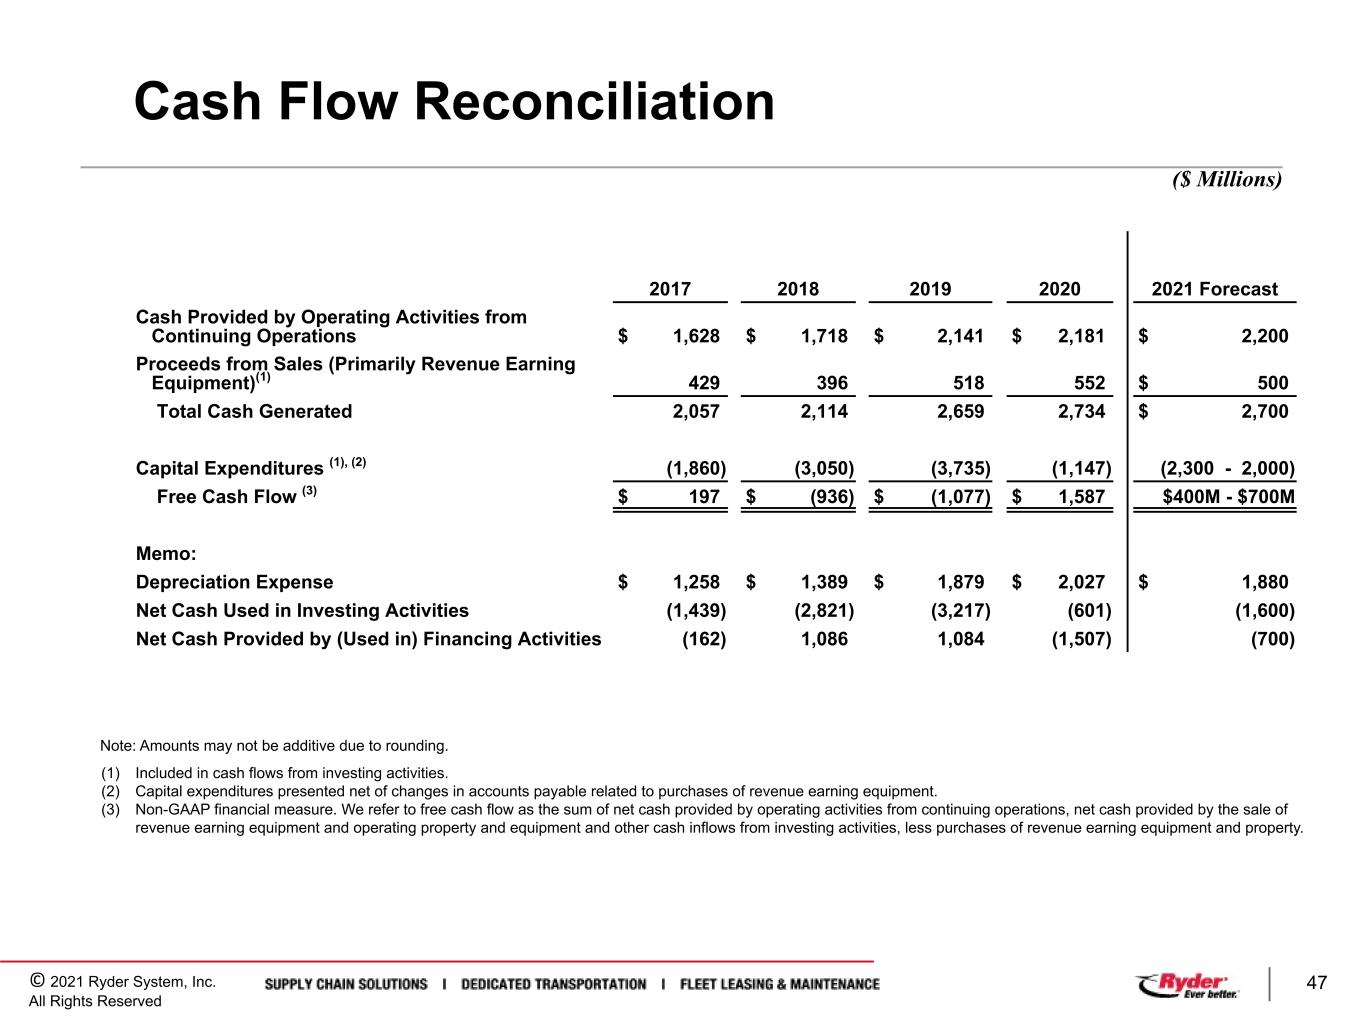

 
© 2021 Ryder System, Inc. All Rights Reserved 47 Cash Flow Reconciliation ($ Millions) 2017 2018 2019 2020 2021 Forecast Cash Provided by Operating Activities from Continuing Operations $ 1,628 $ 1,718 $ 2,141 $ 2,181 $ 2,200 Proceeds from Sales (Primarily Revenue Earning Equipment)(1) 429 396 518 552 $ 500 Total Cash Generated 2,057 2,114 2,659 2,734 $ 2,700 Capital Expenditures (1), (2) (1,860) (3,050) (3,735) (1,147) (2,300 - 2,000) Free Cash Flow (3) $ 197 $ (936) $ (1,077) $ 1,587 $400M - $700M Memo: Depreciation Expense $ 1,258 $ 1,389 $ 1,879 $ 2,027 $ 1,880 Net Cash Used in Investing Activities (1,439) (2,821) (3,217) (601) (1,600) Net Cash Provided by (Used in) Financing Activities (162) 1,086 1,084 (1,507) (700) (5) (1) Included in cash flows from investing activities. (2) Capital expenditures presented net of changes in accounts payable related to purchases of revenue earning equipment. (3) Non-GAAP financial measure. We refer to free cash flow as the sum of net cash provided by operating activities from continuing operations, net cash provided by the sale of revenue earning equipment and operating property and equipment and other cash inflows from investing activities, less purchases of revenue earning equipment and property. Note: Amounts may not be additive due to rounding.


 
© 2021 Ryder System, Inc. All Rights Reserved 48