Press Release
FreightCar America, Inc. Reports Third Quarter 2024 Results
Company delivers 83% year-over-year revenue growth with strong gross margin
Raises mid-point of full year Adjusted EBITDA guidance
CHICAGO, November 12, 2024 – FreightCar America, Inc. (NASDAQ: RAIL) (“FreightCar America” or the “Company”), a diversified manufacturer and supplier of railroad freight cars, railcar parts and components, today reported results for the third quarter ended September 30, 2024.
Third Quarter 2024 Highlights
•Revenues of $113.3 million on 961 railcar deliveries, compared to revenues of $61.9 million on 503 railcar deliveries in the third quarter of 2023, up 83% and 91% respectively
•Gross margin of 14.3% with gross profit of $16.2 million, compared to gross margin of 14.9% with gross profit of $9.2 million in the third quarter of 2023
•Net loss of ($107.0) million, or ($3.57) per share and Adjusted net income of $7.3 million, or $0.08 per share, driven by a ($110.0) million non-cash loss on warrant liability due to a significant appreciation in share price
•Adjusted EBITDA of $10.9 million, compared to Adjusted EBITDA of $3.5 million in the third quarter of 2023, up 211%
•Ended the quarter with a backlog of 3,611 units valued at $372 million
“We again demonstrate the power of our disciplined approach to growth and operational excellence. Delivering another solid quarter, that continues the momentum for a record-setting year out of our operating facility. Our team has consistently followed through on our commitments, with robust product shipments and adaptable operating capabilities. This reinforces our ability to meet our customers’ needs while improving our gross margins, and further demonstrates the power of our value proposition. We continue to showcase our ability to secure business through innovative solutions, and our ease of doing business which has led to a consistent higher quality of earnings” commented Nick Randall, President and Chief Executive Officer of FreightCar America.
Randall continued, “Our pipeline is invigorated, with consistent demand across a broad range of railcar types. As we head into the fourth quarter, we are well positioned to sustain this momentum through our differentiated offerings and unique market approach. Our commitment to innovation and operational flexibility sets us apart in the industry, ensuring that we deliver long-term value for our customers and shareholders.”
Fiscal Year 2024 Outlook
The Company has updated its outlook for fiscal year 2024 as follows:
|
|
|
|
Fiscal 2024 Outlook |
Year-over-Year Growth at Midpoint |
Revenue |
$560 - $600 million |
62.0% |
Adjusted EBITDA1 |
$37 - $39 million |
89.0% |
Railcar Deliveries |
4,300 – 4,700 Railcars |
48.9% |
1. The Company does not provide a reconciliation of forward-looking Adjusted EBITDA due to the inherent difficulty in forecasting and quantifying the adjustments that are necessary to calculate such non-GAAP measure without unreasonable effort. Material changes to any one of these items could have a significant effect on future GAAP results.
Mike Riordan, Chief Financial Officer of FreightCar America, commented, “Given our strong order activity and delivery performance year to date, we are narrowing and raising the mid-point of our previously issued full-year EBITDA guidance to between $37 million and $39 million while reaffirming our previously stated revenue and delivery guidance. As we move forward, I am confident in our ability to achieve profitable growth and cash generation across the enterprise with an even stronger financial profile.”
Third Quarter 2024 Conference Call & Webcast Information
The Company will host a conference call and live webcast on Tuesday, November 12 at 11:00 a.m. (Eastern Time) to discuss its third quarter 2024 financial results. FreightCar America invites shareholders and other interested parties to listen to its financial results conference call via the following live and recorded methods:
Live Webcast: https://viavid.webcasts.com/starthere.jsp?ei=1693396&tp_key=feca4932b6
Recorded Webcast: A recorded webcast will be available until Tuesday, November 26, 2024, on FreightCar America’s website following the conference call date at: https://investors.freightcaramerica.com/news-events/event-calendar/
Teleconference: Dial-in numbers for the live Conference Call are (877) 407-0789 or (201) 689-8562. Please call in at least 10 minutes prior to the start time of the call. An audio replay may be accessed at (844) 512-2921 or (412) 317-6671; Passcode: 13749627.
About FreightCar America
FreightCar America, headquartered in Chicago, Illinois, is a leading designer, producer and supplier of railroad freight cars, railcar parts and components. We also specialize in railcar repairs, complete railcar rebody services and railcar conversions that repurpose idled rail assets back into revenue service. Since 1901, our customers have trusted us to build quality railcars that are critical to economic growth and instrumental to the North American supply chain. To learn more about FreightCar America, visit www.freightcaramerica.com.
Forward-Looking Statements
This press release contains statements relating to our expected financial performance, financial condition, and/or future business prospects, events and/or plans that are “forward-looking statements” as defined under the Private Securities Litigation Reform Act of 1995. Forward-looking statements represent our estimates and assumptions only as of the date of this press release. Our actual results may differ materially from the results described in or anticipated by our forward-looking statements due to certain risks and uncertainties. These risks and uncertainties relate to, among other things, the cyclical nature of our business; adverse geopolitical, economic and market conditions, including inflation; material disruption in the movement of rail traffic for deliveries; fluctuating costs of raw materials including steel and aluminum; future changes in U.S. tax laws and regulations or interpretations thereof; delays in the delivery of raw materials; our ability to maintain relationships with our suppliers of railcar components; our reliance upon a small number of customers that represent a large percentage of our sales; the variable purchase patterns of our customers and the timing of completion, delivery and customer acceptance of orders; the highly competitive nature of our industry; the risk of lack of acceptance of our new railcar offerings, and other competitive factors. The factors listed above are not exhaustive. New factors emerge from time to time that may cause our business not to develop as we expect, and it is not possible for us to predict all of them. We expressly disclaim any duty to provide updates to any forward-looking statements made in this press release, whether as a result of new information, future events or otherwise.
Non-GAAP Financial Measures
This press release includes measures not derived in accordance with generally accepted accounting principles (“GAAP”), such as EBITDA, Adjusted EBITDA, Adjusted net income (loss) and Adjusted EPS. These non-GAAP measures should not be considered in isolation or as a substitute for any measure derived in accordance with GAAP and may also be inconsistent with similar measures presented by other companies. Reconciliations of these measures to the applicable most closely comparable GAAP measures, and reasons for the Company’s use of these measures, are presented in the attached pages.
# # #
FreightCar America, Inc.
Consolidated Balance Sheets
(In thousands, except for share data)
|
|
|
|
|
|
|
|
|
|
|
September 30,
2024 |
|
|
December 31,
2023 |
|
Assets |
|
|
|
Current assets |
|
|
|
|
|
|
Cash, cash equivalents and restricted cash equivalents |
|
$ |
44,830 |
|
|
$ |
40,560 |
|
Accounts receivable, net of allowance for credit losses of $74 and $18 respectively |
|
|
24,319 |
|
|
|
6,408 |
|
VAT receivable |
|
|
2,489 |
|
|
|
2,926 |
|
Inventories, net |
|
|
84,812 |
|
|
|
125,022 |
|
Assets held for sale |
|
|
629 |
|
|
|
— |
|
Related party asset |
|
|
936 |
|
|
|
638 |
|
Prepaid expenses |
|
|
10,100 |
|
|
|
4,867 |
|
Total current assets |
|
|
168,115 |
|
|
|
180,421 |
|
Property, plant and equipment, net |
|
|
30,461 |
|
|
|
31,258 |
|
Railcars available for lease, net |
|
|
— |
|
|
|
2,842 |
|
Right of use asset operating lease |
|
|
2,514 |
|
|
|
2,826 |
|
Right of use asset finance lease |
|
|
43,823 |
|
|
|
40,277 |
|
Other long-term assets |
|
|
1,036 |
|
|
|
1,835 |
|
Total assets |
|
$ |
245,949 |
|
|
$ |
259,459 |
|
|
|
|
|
|
|
|
|
|
Liabilities, Mezzanine Equity and Stockholders’ Deficit |
|
|
|
|
|
|
Current liabilities |
|
|
|
|
|
|
Accounts and contractual payables |
|
$ |
74,355 |
|
|
$ |
84,417 |
|
Related party accounts payable |
|
|
2,493 |
|
|
|
2,478 |
|
Accrued payroll and other employee costs |
|
|
7,447 |
|
|
|
5,738 |
|
Accrued warranty |
|
|
1,493 |
|
|
|
1,602 |
|
Customer deposits |
|
|
8,865 |
|
|
|
— |
|
Current portion of long-term debt |
|
|
— |
|
|
|
29,415 |
|
Other current liabilities |
|
|
10,196 |
|
|
|
13,711 |
|
Total current liabilities |
|
|
104,849 |
|
|
|
137,361 |
|
Warrant liability |
|
|
162,382 |
|
|
|
36,801 |
|
Accrued pension costs |
|
|
1,226 |
|
|
|
1,046 |
|
Lease liability operating lease, long-term |
|
|
2,778 |
|
|
|
3,164 |
|
Lease liability finance lease, long-term |
|
|
45,482 |
|
|
|
41,273 |
|
Other long-term liabilities |
|
|
1,660 |
|
|
|
2,562 |
|
Total liabilities |
|
|
318,377 |
|
|
|
222,207 |
|
|
|
|
|
|
|
|
|
|
Commitments and contingencies |
|
|
|
|
|
|
Mezzanine equity |
|
|
|
|
|
|
Series C Preferred stock, $0.01 par value, 85,412 shares authorized, 85,412 shares issued and outstanding at each of September 30, 2024 and December 31, 2023, respectively. Liquidation value $108,388 and $95,048 at September 30, 2024 and December 31, 2023, respectively. |
|
|
83,889 |
|
|
|
83,458 |
|
Stockholders’ deficit |
|
|
|
|
|
|
Preferred stock, $0.01 par value, 2,500,000 shares authorized (100,000 shares each
designated as Series A voting and Series B non-voting, 0 shares issued and outstanding
at September 30, 2024 and December 31, 2023) |
|
|
— |
|
|
|
— |
|
Common stock, $0.01 par value, 50,000,000 shares authorized, 18,884,838 and 17,903,437
shares issued and outstanding at September 30, 2024 and December 31, 2023, respectively |
|
|
220 |
|
|
|
210 |
|
Additional paid-in capital |
|
|
97,098 |
|
|
|
94,067 |
|
Accumulated other comprehensive income |
|
|
84 |
|
|
|
2,365 |
|
Accumulated deficit |
|
|
(253,719 |
) |
|
|
(142,848 |
) |
Total stockholders’ deficit |
|
|
(156,317 |
) |
|
|
(46,206 |
) |
Total liabilities, mezzanine equity and stockholders’ deficit |
|
$ |
245,949 |
|
|
$ |
259,459 |
|
FreightCar America, Inc.
Consolidated Statements of Operations
(In thousands, except for share and per share data)
|
|
|
|
|
|
|
|
|
|
|
|
|
|
|
|
|
|
|
Three Months Ended |
|
|
Nine Months Ended |
|
|
|
September 30, |
|
|
September 30, |
|
|
|
2024 |
|
|
2023 |
|
|
2024 |
|
|
2023 |
|
|
|
|
|
Revenues |
|
$ |
113,255 |
|
|
$ |
61,894 |
|
|
$ |
421,729 |
|
|
$ |
231,489 |
|
Cost of sales |
|
|
97,059 |
|
|
|
52,669 |
|
|
|
375,700 |
|
|
|
201,824 |
|
Gross profit |
|
|
16,196 |
|
|
|
9,225 |
|
|
|
46,029 |
|
|
|
29,665 |
|
Selling, general and administrative expenses |
|
|
7,538 |
|
|
|
7,511 |
|
|
|
23,541 |
|
|
|
19,750 |
|
Gain on sale of railcars available for lease |
|
|
— |
|
|
|
— |
|
|
|
— |
|
|
|
(622 |
) |
Loss on pension settlement |
|
|
— |
|
|
|
313 |
|
|
|
|
|
|
313 |
|
Litigation settlement |
|
|
— |
|
|
|
— |
|
|
|
(3,214 |
) |
|
|
— |
|
Operating income |
|
|
8,658 |
|
|
|
1,401 |
|
|
|
25,702 |
|
|
|
10,224 |
|
Interest expense |
|
|
(1,577 |
) |
|
|
(2,037 |
) |
|
|
(5,815 |
) |
|
|
(12,988 |
) |
(Loss) gain on change in fair market value of Warrant liability |
|
|
(110,040 |
) |
|
|
4,273 |
|
|
|
(125,581 |
) |
|
|
(1,869 |
) |
Loss on extinguishment of debt |
|
|
— |
|
|
|
— |
|
|
|
— |
|
|
|
(14,880 |
) |
Other expense |
|
|
(680 |
) |
|
|
(228 |
) |
|
|
(1,419 |
) |
|
|
(333 |
) |
(Loss) income before income taxes |
|
|
(103,639 |
) |
|
|
3,409 |
|
|
|
(107,113 |
) |
|
|
(19,846 |
) |
Income tax provision |
|
|
3,407 |
|
|
|
216 |
|
|
|
3,327 |
|
|
|
887 |
|
Net (loss) income |
|
$ |
(107,046 |
) |
|
$ |
3,193 |
|
|
$ |
(110,440 |
) |
|
$ |
(20,733 |
) |
Net loss per common share – basic |
|
$ |
(3.57 |
) |
|
$ |
(0.03 |
) |
|
$ |
(4.07 |
) |
|
$ |
(0.94 |
) |
Net loss per common share – diluted |
|
$ |
(3.57 |
) |
|
$ |
(0.03 |
) |
|
$ |
(4.07 |
) |
|
$ |
(0.94 |
) |
Weighted average common shares outstanding – basic |
|
|
31,353,997 |
|
|
|
29,543,963 |
|
|
|
30,519,545 |
|
|
|
28,064,410 |
|
Weighted average common shares outstanding – diluted |
|
|
31,353,997 |
|
|
|
29,543,963 |
|
|
|
30,519,545 |
|
|
|
28,064,410 |
|
FreightCar America, Inc.
Segment Data
(In thousands)
|
|
|
|
|
|
|
|
|
|
|
|
|
|
|
|
|
|
|
|
Three Months Ended |
|
|
|
Nine Months Ended |
|
|
|
September 30, |
|
|
|
September 30, |
|
|
|
2024 |
|
|
2023 |
|
|
|
2024 |
|
|
2023 |
|
Revenues: |
|
|
|
|
|
|
|
|
|
|
|
|
|
Manufacturing |
|
$ |
109,080 |
|
|
$ |
58,554 |
|
|
|
$ |
407,336 |
|
|
$ |
221,877 |
|
Corporate and Other |
|
|
4,175 |
|
|
|
3,340 |
|
|
|
|
14,393 |
|
|
|
9,612 |
|
Consolidated revenues |
|
$ |
113,255 |
|
|
$ |
61,894 |
|
|
|
$ |
421,729 |
|
|
$ |
231,489 |
|
|
|
|
|
|
|
|
|
|
|
|
|
|
|
Operating income (loss): |
|
|
|
|
|
|
|
|
|
|
|
|
|
Manufacturing |
|
$ |
13,823 |
|
|
$ |
7,378 |
|
|
|
$ |
40,816 |
|
|
$ |
24,775 |
|
Corporate and Other |
|
|
(5,165 |
) |
|
|
(5,977 |
) |
|
|
|
(15,114 |
) |
|
|
(14,551 |
) |
Consolidated operating income |
|
$ |
8,658 |
|
|
$ |
1,401 |
|
|
|
$ |
25,702 |
|
|
$ |
10,224 |
|
FreightCar America, Inc.
Consolidated Statements of Cash Flows
(In thousands)
|
|
|
|
|
|
|
|
|
|
|
Nine Months Ended September 30, |
|
|
|
2024 |
|
|
2023 |
|
Cash flows from operating activities |
|
|
|
Net loss |
|
$ |
(110,440 |
) |
|
$ |
(20,733 |
) |
Adjustments to reconcile net loss to net cash flows provided by (used in) operating activities: |
|
|
|
|
|
|
Depreciation and amortization |
|
|
4,252 |
|
|
|
3,189 |
|
Non-cash lease expense on right-of-use assets |
|
|
2,226 |
|
|
|
1,873 |
|
Loss on change in fair market value for Warrant liability |
|
|
125,581 |
|
|
|
1,869 |
|
Loss on pension settlement |
|
|
— |
|
|
|
313 |
|
Stock-based compensation recognized |
|
|
2,330 |
|
|
|
524 |
|
Non-cash interest expense |
|
|
3,638 |
|
|
|
8,980 |
|
Loss on extinguishment of debt |
|
|
— |
|
|
|
14,880 |
|
Other non-cash items, net |
|
|
(1,589 |
) |
|
|
(435 |
) |
Changes in operating assets and liabilities: |
|
|
|
|
|
|
Accounts receivable |
|
|
(17,911 |
) |
|
|
(1,126 |
) |
VAT receivable |
|
|
465 |
|
|
|
2,320 |
|
Inventories |
|
|
40,859 |
|
|
|
(57,213 |
) |
Accounts and contractual payables |
|
|
(8,300 |
) |
|
|
2,739 |
|
Income taxes payable, net |
|
|
(2,179 |
) |
|
|
(1,490 |
) |
Lease liability |
|
|
(2,802 |
) |
|
|
(2,779 |
) |
Customer deposits |
|
|
8,865 |
|
|
|
19,644 |
|
Other assets and liabilities |
|
|
(5,948 |
) |
|
|
1,035 |
|
Net cash flows provided by (used in) operating activities |
|
|
39,047 |
|
|
|
(26,410 |
) |
|
|
|
|
|
|
|
|
|
Cash flows from investing activities |
|
|
|
|
|
|
Purchase of property, plant and equipment |
|
|
(3,731 |
) |
|
|
(8,971 |
) |
Proceeds from sale of railcars available for lease, net of selling costs |
|
|
— |
|
|
|
8,356 |
|
Net cash flows used in investing activities |
|
|
(3,731 |
) |
|
|
(615 |
) |
|
|
|
|
|
|
|
|
|
Cash flows from financing activities |
|
|
|
|
|
|
Proceeds from issuance of preferred shares, net of issuance costs |
|
|
— |
|
|
|
13,254 |
|
Deferred financing costs |
|
|
— |
|
|
|
(300 |
) |
Borrowings on revolving line of credit |
|
|
26,595 |
|
|
|
115,172 |
|
Repayments on revolving line of credit |
|
|
(56,010 |
) |
|
|
(123,062 |
) |
Employee stock settlement |
|
|
(40 |
) |
|
|
(106 |
) |
Payment for stock appreciation rights exercised |
|
|
— |
|
|
|
(6 |
) |
Financing lease payments |
|
|
(1,591 |
) |
|
|
(460 |
) |
Net cash flows (used in) provided by financing activities |
|
|
(31,046 |
) |
|
|
4,492 |
|
Net increase (decrease) in cash and cash equivalents |
|
|
4,270 |
|
|
|
(22,533 |
) |
Cash, cash equivalents and restricted cash equivalents at beginning of period |
|
|
40,560 |
|
|
|
37,912 |
|
Cash, cash equivalents and restricted cash equivalents at end of period |
|
$ |
44,830 |
|
|
$ |
15,379 |
|
|
|
|
|
|
|
|
|
|
Supplemental cash flow information |
|
|
|
|
|
|
Interest paid |
|
$ |
2,177 |
|
|
$ |
3,961 |
|
Income taxes paid |
|
$ |
5,061 |
|
|
$ |
1,857 |
|
Non-cash transactions |
|
|
|
|
|
|
Change in unpaid construction in process |
|
$ |
(226 |
) |
|
$ |
51 |
|
Accrued PIK interest paid through issuance of PIK Note |
|
$ |
— |
|
|
$ |
3,161 |
|
Issuance of preferred shares in exchange of term loan |
|
$ |
— |
|
|
$ |
72,688 |
|
Issuance of warrants |
|
$ |
— |
|
|
$ |
3,014 |
|
Issuance of equity fee |
|
$ |
— |
|
|
$ |
685 |
|
|
|
|
|
|
|
|
Non-GAAP Financial Measures
FreightCar America, Inc.
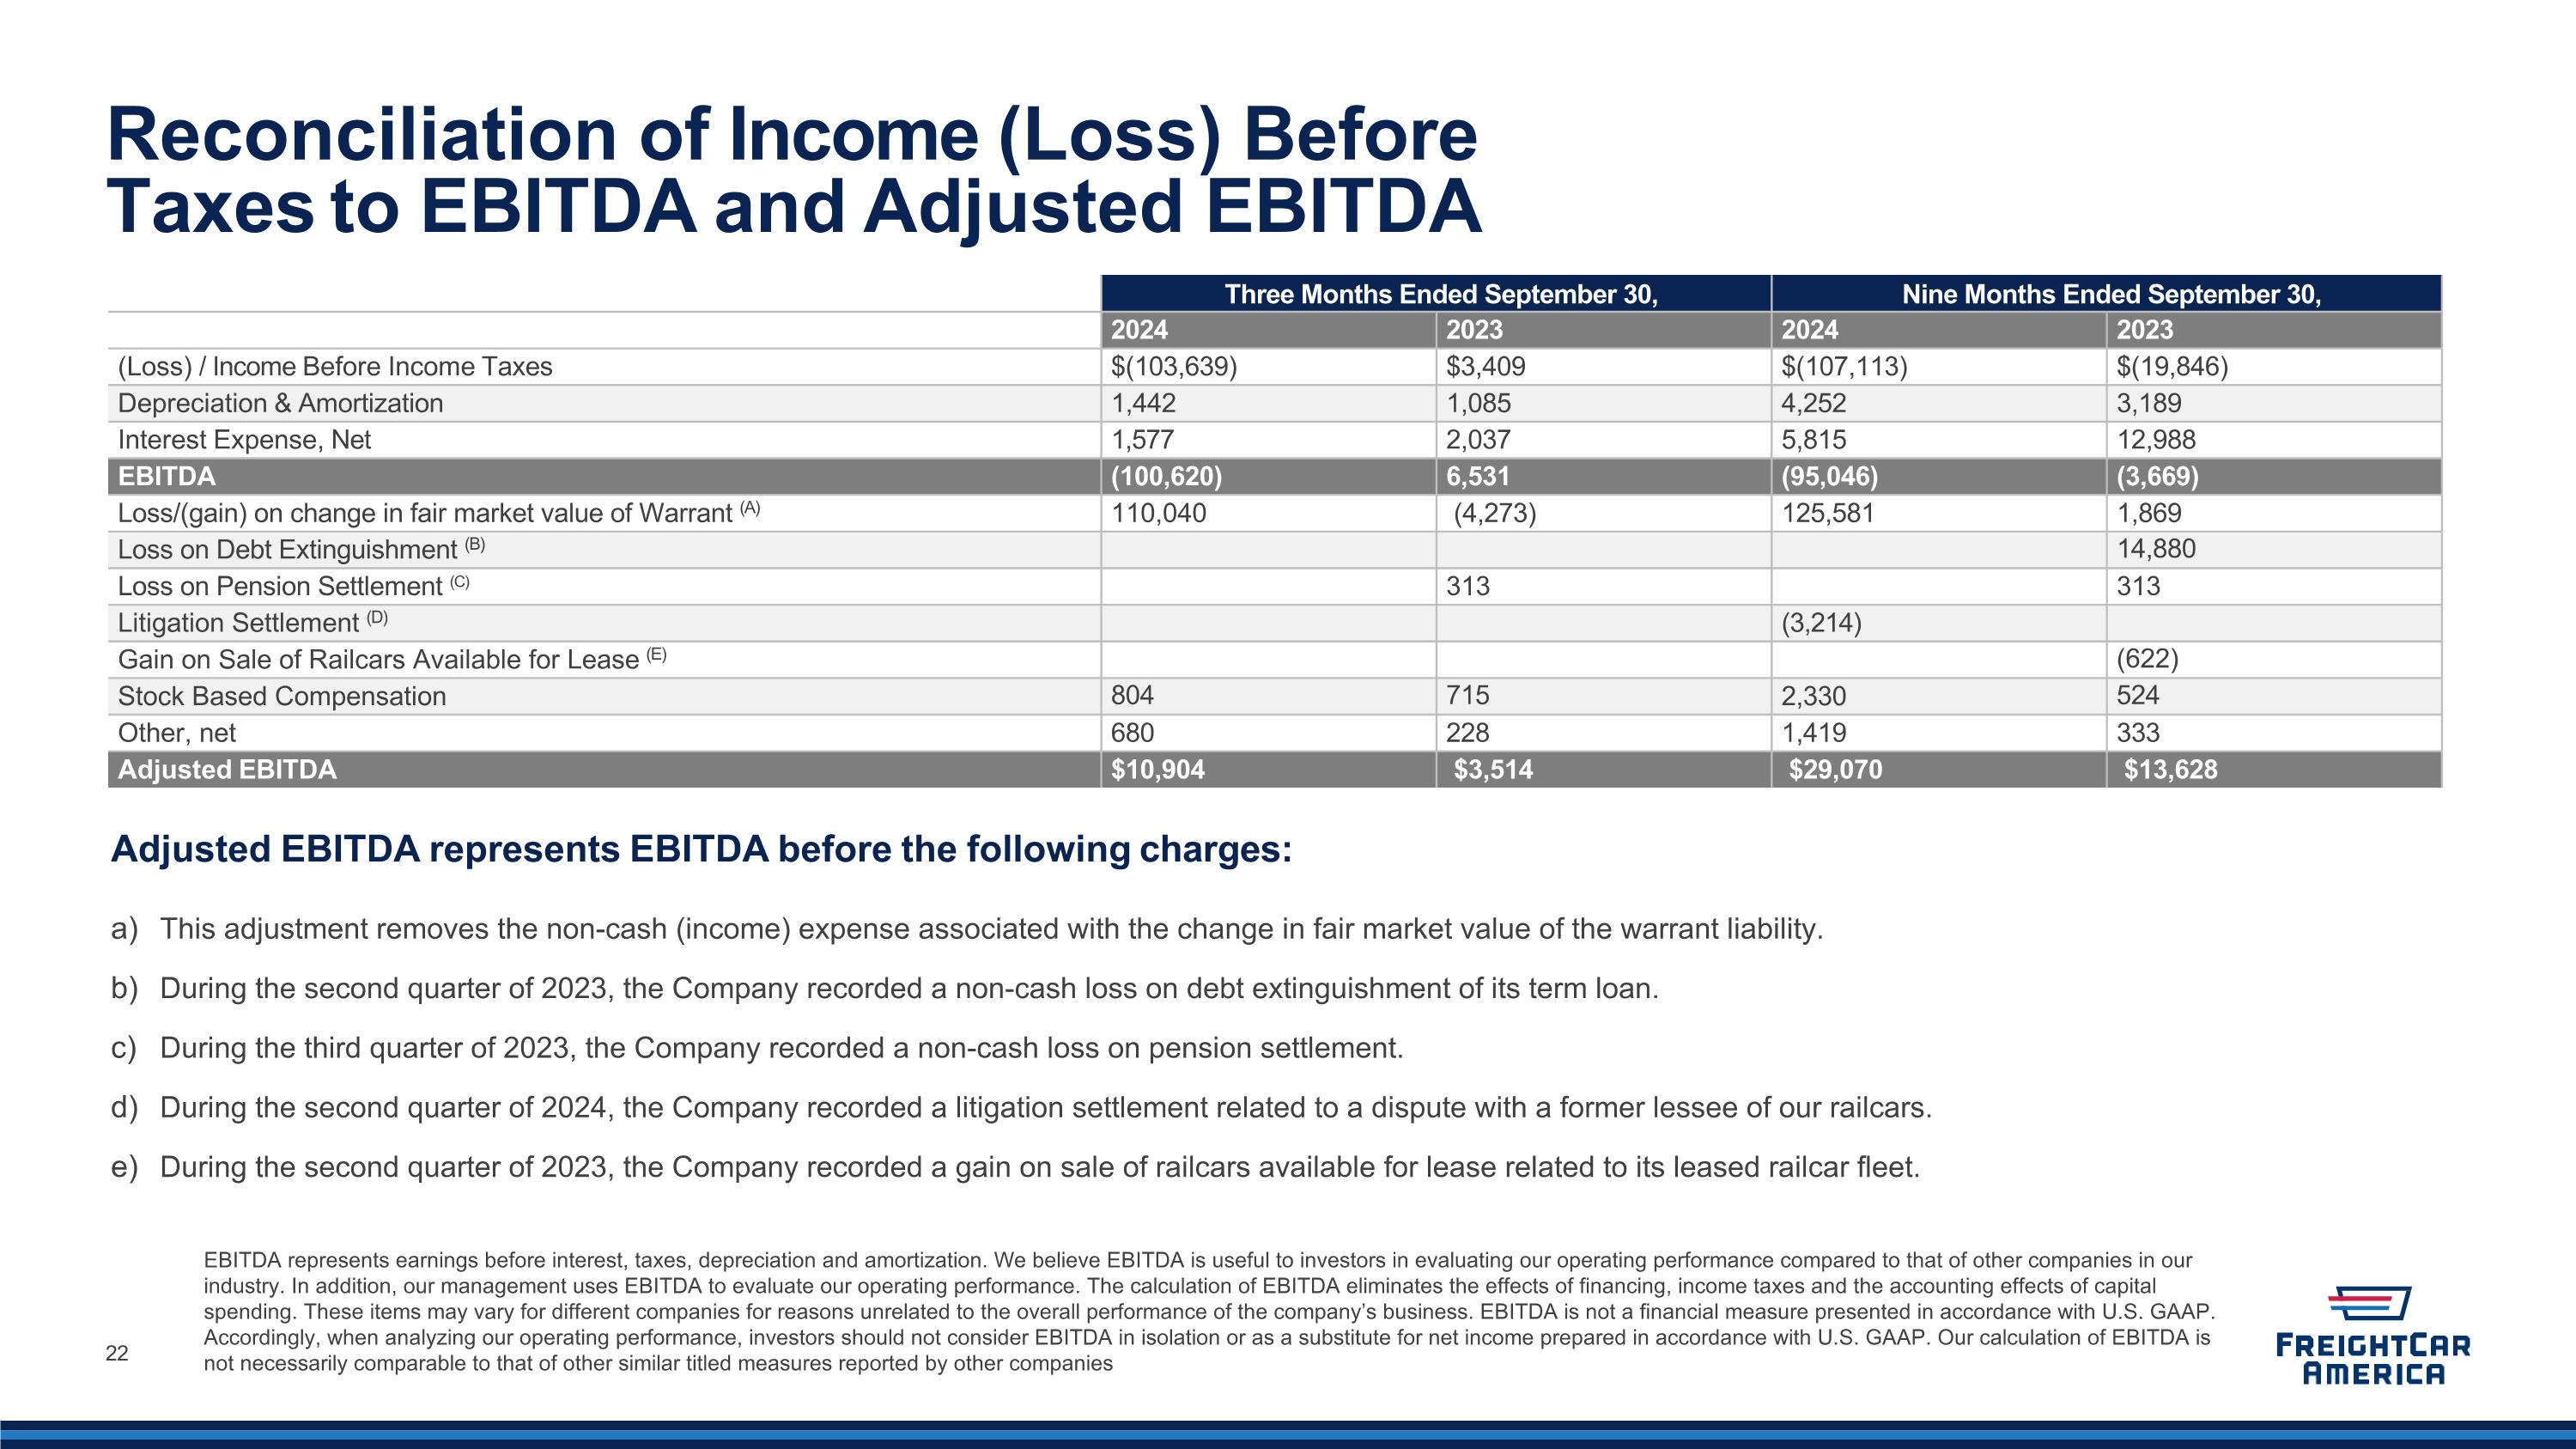
Reconciliation of (Loss) income before taxes to EBITDA(1) and Adjusted EBITDA(2)
(In thousands)
(Unaudited)
|
|
|
|
|
|
|
|
|
|
|
|
|
|
|
|
|
|
|
|
|
|
|
|
|
|
|
|
|
|
|
|
|
|
|
|
Three Months Ended
September 30, |
|
|
Nine Months Ended
September 30, |
|
|
|
|
|
2024 |
|
|
2023 |
|
|
2024 |
|
|
2023 |
|
|
|
|
|
|
|
|
|
|
|
|
|
|
|
|
|
|
(Loss) income before income taxes |
|
$ |
(103,639 |
) |
|
$ |
3,409 |
|
|
$ |
(107,113 |
) |
|
$ |
(19,846 |
) |
|
|
Depreciation & Amortization |
|
|
1,442 |
|
|
|
1,085 |
|
|
|
4,252 |
|
|
|
3,189 |
|
|
|
Interest Expense, net |
|
|
1,577 |
|
|
|
2,037 |
|
|
|
5,815 |
|
|
|
12,988 |
|
|
|
EBITDA |
|
|
(100,620 |
) |
|
|
6,531 |
|
|
|
(97,046 |
) |
|
|
(3,669 |
) |
|
|
|
|
|
|
|
|
|
|
|
|
|
|
|
|
|
Change in Fair Value of Warrant (a) |
|
|
110,040 |
|
|
|
(4,273 |
) |
|
|
125,581 |
|
|
|
1,869 |
|
|
|
Loss on Debt Extinguishment (b) |
|
|
- |
|
|
|
- |
|
|
|
- |
|
|
|
14,880 |
|
|
|
Loss on Pension Settlement (c) |
|
|
- |
|
|
|
313 |
|
|
|
- |
|
|
|
313 |
|
|
|
Litigation Settlement (d) |
|
|
- |
|
|
|
- |
|
|
|
(3,214 |
) |
|
|
- |
|
|
|
Gain on Sale of Railcars Available for Lease (e) |
|
|
- |
|
|
|
- |
|
|
|
- |
|
|
|
(622 |
) |
|
|
Stock Based Compensation |
|
|
804 |
|
|
|
715 |
|
|
|
2,330 |
|
|
|
524 |
|
|
|
Other, net |
|
|
680 |
|
|
|
228 |
|
|
|
1,419 |
|
|
|
333 |
|
|
|
Adjusted EBITDA |
|
$ |
10,904 |
|
|
$ |
3,514 |
|
|
$ |
29,070 |
|
|
$ |
13,628 |
|
|
|
(1) EBITDA represents earnings before interest, taxes, depreciation and amortization. We believe EBITDA is useful to investors in evaluating our operating performance compared to that of other companies in our industry. In addition, our management uses EBITDA to evaluate our operating performance. The calculation of EBITDA eliminates the effects of financing, income taxes and the accounting effects of capital spending. These items may vary for different companies for reasons unrelated to the overall performance of the company’s business. EBITDA is not a financial measure presented in accordance with U.S. GAAP. Accordingly, when analyzing our operating performance, investors should not consider EBITDA in isolation or as a substitute for net income, cash flows from operating activities or other statements of operations or statements of cash flow data prepared in accordance with U.S. GAAP. Our calculation of EBITDA is not necessarily comparable to that of other similar titled measures reported by other companies.
(2) Adjusted EBITDA represents EBITDA before the following charges:
(a)This adjustment removes the non-cash expense (income) associated with the change in fair market value of the Company’s warrant liability.
(b)During the second quarter of 2023, the Company recorded a non-cash loss on debt extinguishment of its term loan.
(c)During the third quarter of 2023, the Company recorded a non-cash loss on pension settlement.
(d)During the second quarter of 2024, the Company recorded a litigation settlement related to a dispute with a former lessee of our railcars.
(e)During the second quarter of 2023, the Company recorded a gain on sale of railcars available for lease related to its leased railcar fleet.
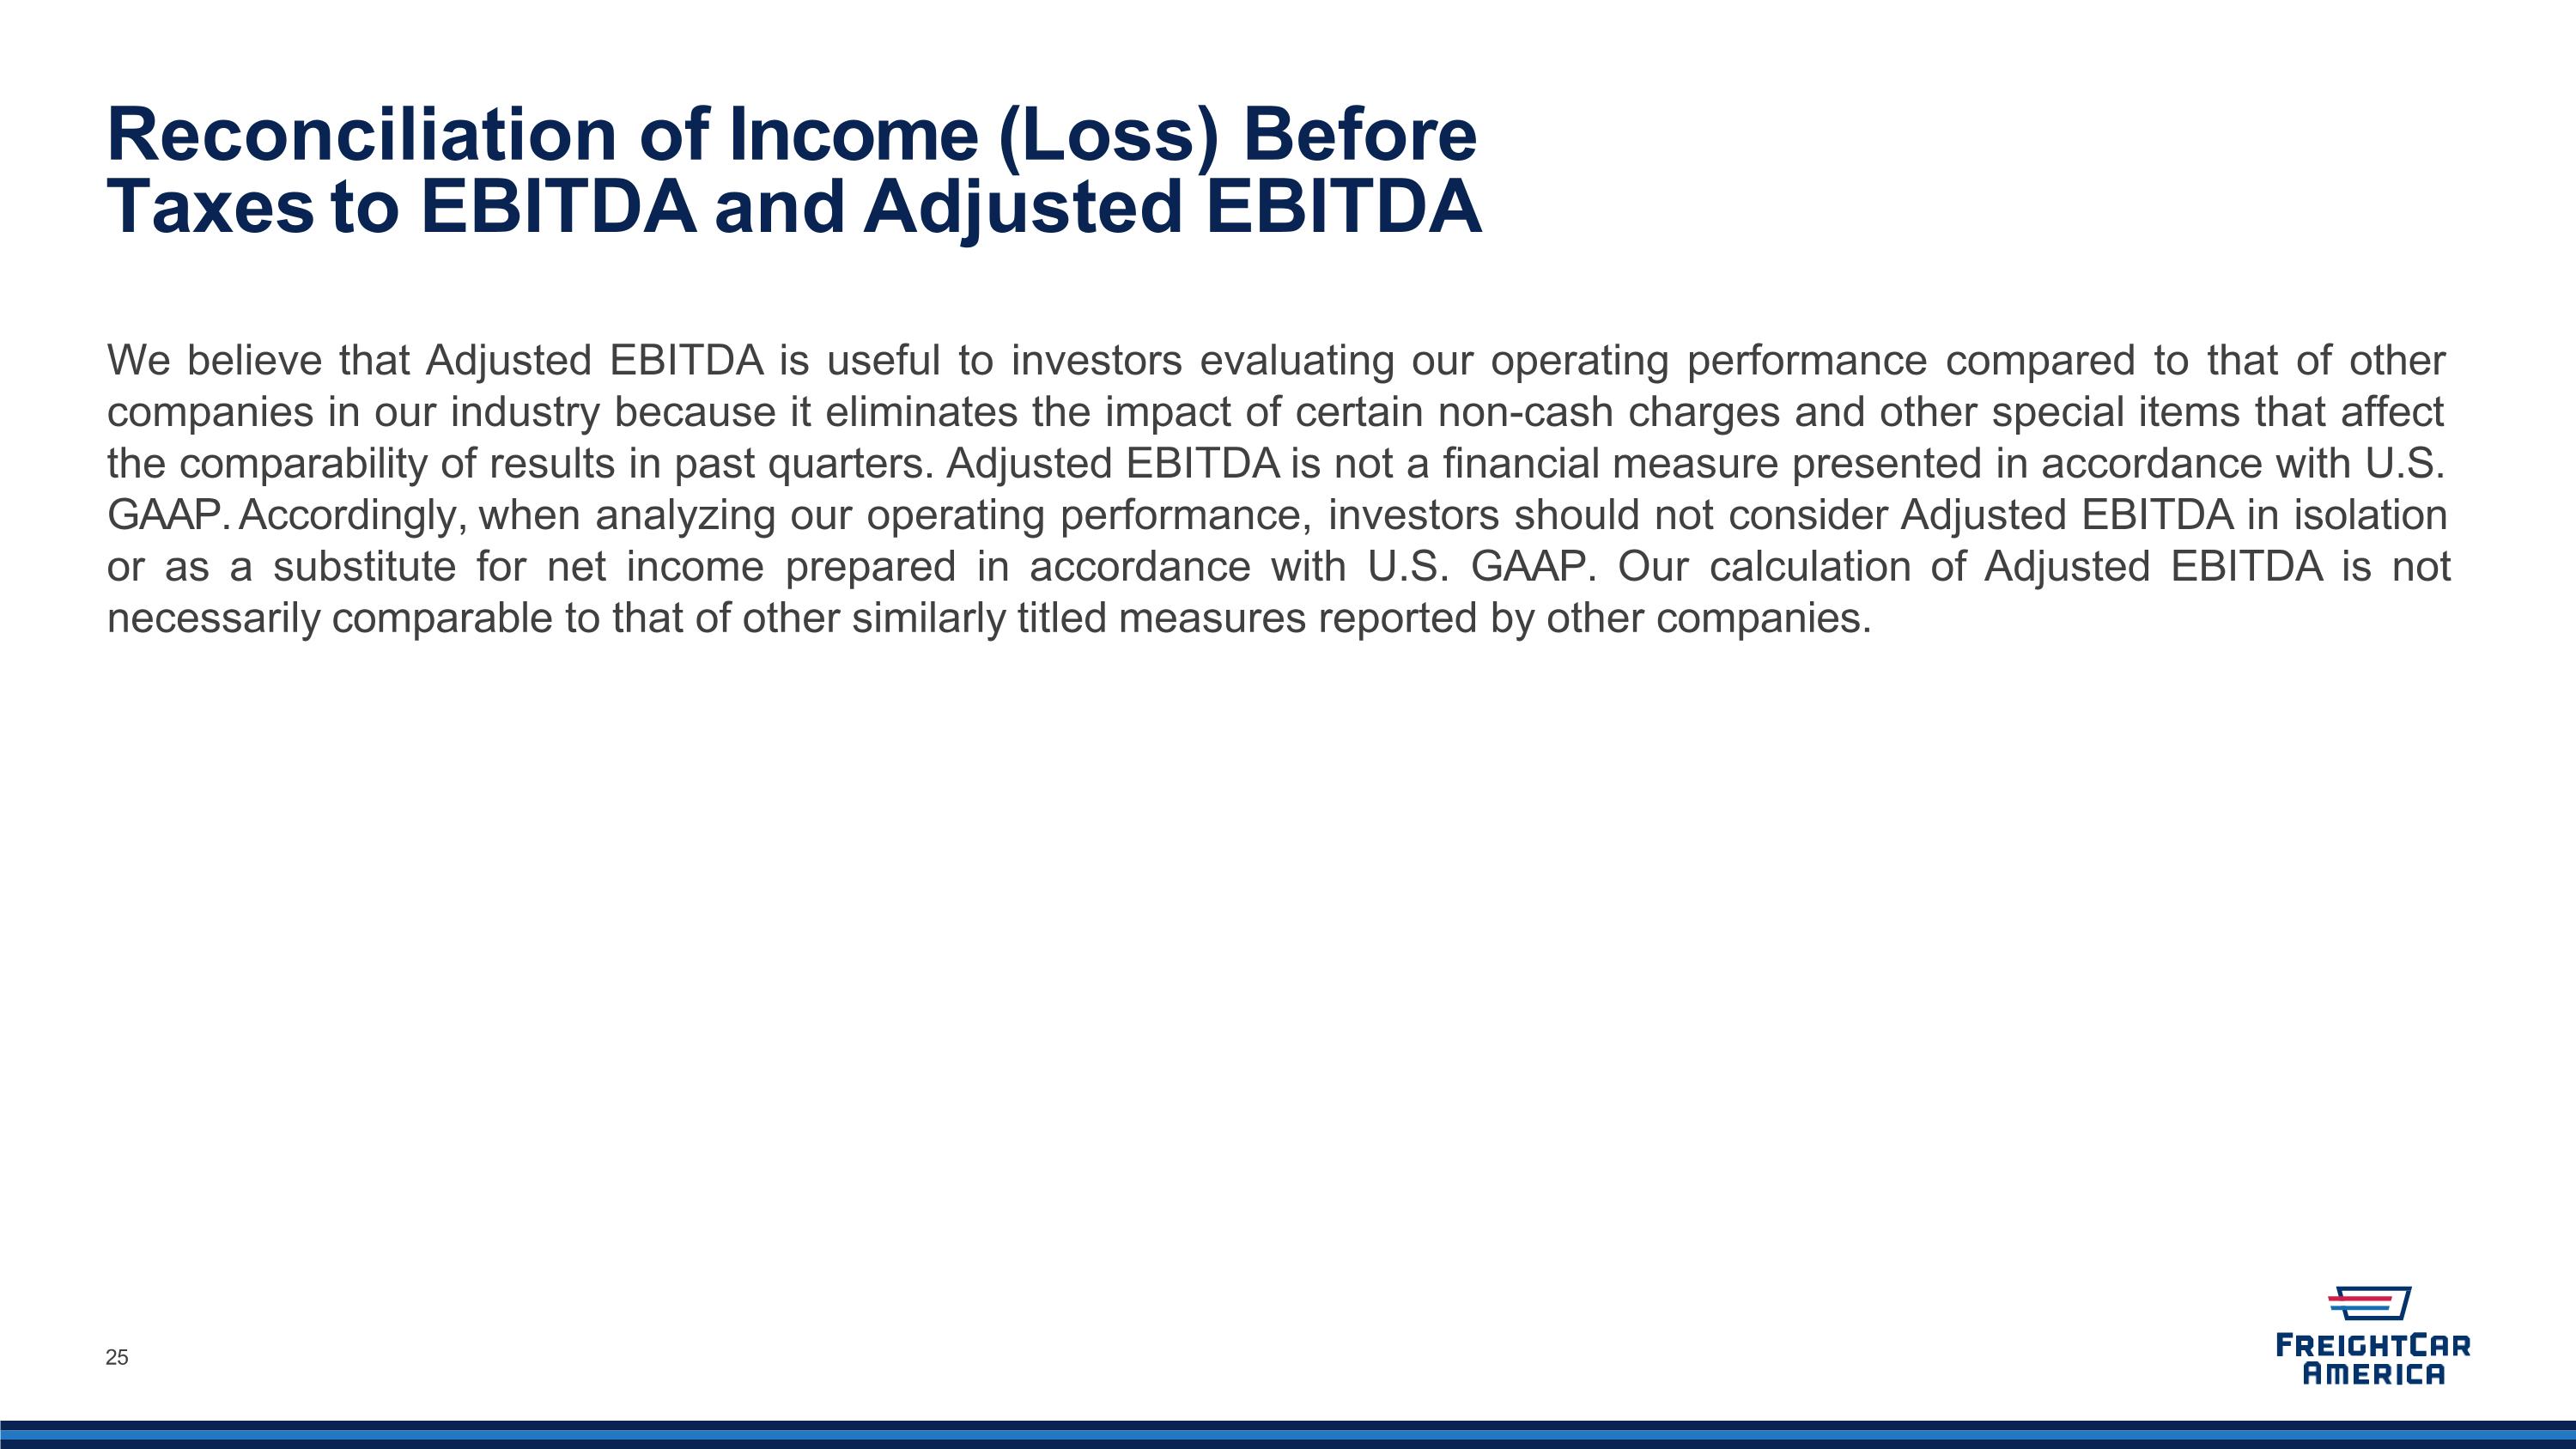
We believe that Adjusted EBITDA is useful to investors evaluating our operating performance compared to that of other companies in our industry because it eliminates the impact of certain non-cash charges and other special items
that affect the comparability of results in past quarters. Adjusted EBITDA is not a financial measure presented in accordance with U.S. GAAP. Accordingly, when analyzing our operating performance, investors should not consider Adjusted EBITDA in isolation or as a substitute for net income, cash flows from operating activities or other statements of operations or statements of cash flow data prepared in accordance with U.S. GAAP. Our calculation of Adjusted EBITDA is not necessarily comparable to that of other similarly titled measures reported by other companies.
FreightCar America, Inc.
Reconciliation of Net (loss) income and Adjusted net income (loss)(1)
(Unaudited)
|
|
|
|
|
|
|
|
|
|
|
|
|
|
|
|
|
|
|
|
|
|
|
|
|
|
|
|
|
|
|
|
|
|
|
|
Three Months Ended
September 30, |
|
|
Nine Months Ended
September 30, |
|
|
|
|
|
2024 |
|
|
2023 |
|
|
2024 |
|
|
2023 |
|
|
|
|
|
|
|
|
|
|
|
|
|
|
|
|
|
|
Net (loss) income |
|
$ |
(107,046 |
) |
|
$ |
3,193 |
|
|
$ |
(110,440 |
) |
|
$ |
(20,733 |
) |
|
|
|
|
|
|
|
|
|
|
|
|
|
|
|
|
|
Change in Fair Value of Warrant (a) |
|
|
110,040 |
|
|
|
(4,273 |
) |
|
|
125,581 |
|
|
|
1,869 |
|
|
|
Loss on Debt Extinguishment (b) |
|
|
- |
|
|
|
- |
|
|
|
- |
|
|
|
14,880 |
|
|
|
Loss on Pension Settlement (c) |
|
|
- |
|
|
|
313 |
|
|
|
- |
|
|
|
313 |
|
|
|
Impairment Recovery on Leased Railcars (d) |
|
|
- |
|
|
|
- |
|
|
|
(3,214 |
) |
|
|
- |
|
|
|
Gain on Sale of Railcars Available for Lease (e) |
|
|
- |
|
|
|
- |
|
|
|
- |
|
|
|
(622 |
) |
|
|
Stock Based Compensation |
|
|
804 |
|
|
|
715 |
|
|
|
2,330 |
|
|
|
524 |
|
|
|
Other, net |
|
|
680 |
|
|
|
228 |
|
|
|
1,419 |
|
|
|
333 |
|
|
|
Total non-GAAP adjustments |
|
|
111,524 |
|
|
|
(3,017 |
) |
|
|
126,116 |
|
|
|
17,297 |
|
|
|
Income tax impact on non-GAAP adjustments (f) |
|
|
2,797 |
|
|
|
588 |
|
|
|
906 |
|
|
|
686 |
|
|
|
Adjusted net income (loss) |
|
$ |
7,275 |
|
|
$ |
764 |
|
|
$ |
16,582 |
|
|
$ |
(2,750 |
) |
|
|
(1) Adjusted net income (loss) represents net (loss) income before the following charges:
a)This adjustment removes the non-cash expense (income) associated with the change in fair market value of the Company’s warrant liability.
b)During the second quarter of 2023, the Company recorded a non-cash loss on debt extinguishment of its term loan.
c)During the third quarter of 2023, the Company recorded a non-cash loss on pension settlement.
d)During the second quarter of 2024, the Company recorded a litigation settlement related to a dispute with a former lessee of our railcars.
e)During the second quarter of 2023, the Company recorded a gain on sale of railcars available for lease related to its leased railcar fleet.
f)Income tax impact on non-GAAP adjustments represents the tax impact of the presented adjustments on the Company’s income tax provision calculation.
We believe that Adjusted net income (loss) is useful to investors evaluating our operating performance compared to that of other companies in our industry because it eliminates the impact of certain non-cash charges and other special items that affect the comparability of results in past quarters. Adjusted net income (loss) is not a financial measure presented in accordance with U.S. GAAP. Accordingly, when analyzing our operating performance, investors should not consider Adjusted net income (loss) in isolation or as a substitute for net income, cash flows from operating activities or other statements of operations or statements of cash flow data prepared in accordance with U.S. GAAP. Our calculation of Adjusted net income (loss) is not necessarily comparable to that of other similarly titled measures reported by other companies.
FreightCar America, Inc.
Reconciliation of EPS and Adjusted EPS(1)
(Unaudited)
|
|
|
|
|
|
|
|
|
|
|
|
|
|
|
|
|
|
|
|
|
|
|
|
|
|
|
|
|
|
|
|
|
|
|
|
Three Months Ended
September 30, |
|
|
Nine Months Ended
September 30, |
|
|
|
|
|
2024 |
|
|
2023 |
|
|
2024 |
|
|
2023 |
|
|
|
|
|
|
|
|
|
|
|
|
|
|
|
|
|
|
EPS |
|
$ |
(3.57 |
) |
|
$ |
(0.03 |
) |
|
$ |
(4.07 |
) |
|
$ |
(0.94 |
) |
|
|
|
|
|
|
|
|
|
|
|
|
|
|
|
|
|
Change in Fair Value of Warrant (a) |
|
$ |
3.51 |
|
|
$ |
(0.15 |
) |
|
$ |
4.11 |
|
|
$ |
0.07 |
|
|
|
Loss on Debt Extinguishment (b) |
|
|
- |
|
|
|
- |
|
|
|
- |
|
|
|
0.53 |
|
|
|
Loss on Pension Settlement (c) |
|
|
- |
|
|
|
0.01 |
|
|
|
- |
|
|
|
0.01 |
|
|
|
Litigation Settlement (d) |
|
|
- |
|
|
|
- |
|
|
|
(0.11 |
) |
|
|
- |
|
|
|
Gain on Sale of Railcars Available for Lease (e) |
|
|
- |
|
|
|
- |
|
|
|
- |
|
|
|
(0.02 |
) |
|
|
Stock Based Compensation |
|
|
0.03 |
|
|
|
0.02 |
|
|
|
0.08 |
|
|
|
0.02 |
|
|
|
Other, net |
|
|
0.02 |
|
|
|
0.01 |
|
|
|
0.05 |
|
|
|
0.01 |
|
|
|
Total non-GAAP adjustments pre-tax per-share |
|
|
3.56 |
|
|
|
(0.11 |
) |
|
|
4.13 |
|
|
|
0.62 |
|
|
|
Income tax impact on non-GAAP adjustments per share (f) |
|
|
0.09 |
|
|
|
0.02 |
|
|
|
0.03 |
|
|
|
0.02 |
|
|
|
Adjusted EPS |
|
$ |
0.08 |
|
|
$ |
(0.12 |
) |
|
$ |
0.09 |
|
|
$ |
(0.30 |
) |
|
|
(1) Adjusted EPS represents basic and diluted EPS before the following charges:
a)This adjustment removes the non-cash expense (income) associated with the change in fair market value of the Company’s warrant liability.
b)During the second quarter of 2023, the Company recorded a non-cash loss on debt extinguishment of its term loan.
c)During the third quarter of 2023, the Company recorded a non-cash loss on pension settlement.
d)During the second quarter of 2024, the Company recorded a litigation settlement related to a dispute with a former lessee of our railcars.
e)During the second quarter of 2023, the Company recorded a gain on sale of railcars available for lease related to its leased railcar fleet.
f)Income tax impact on non-GAAP adjustments per share represents the tax impact of the presented adjustments on the Company’s income tax provision calculation.
We believe that Adjusted EPS is useful to investors evaluating our operating performance compared to that of other companies in our industry because it eliminates the impact of certain non-cash charges and other special items that affect the comparability of results in past quarters. Adjusted EPS is not a financial measure presented in accordance with U.S. GAAP. Accordingly, when analyzing our operating performance, investors should not consider Adjusted EPS in isolation or as a substitute for net income, or other statements of operations or statements of cash flow data prepared in accordance with U.S. GAAP. Our calculation of Adjusted EPS is not necessarily comparable to that of other similarly titled measures reported by other companies.

Investor Presentation November 2024
Disclosures Forward-Looking Statements This presentation contains statements relating to our expected financial performance, financial condition, and/or future business prospects, events and/or plans that are “forward-looking statements” as defined under the Private Securities Litigation Reform Act of 1995. Forward-looking statements represent our estimates and assumptions only as of the date of this press release. Our actual results may differ materially from the results described in or anticipated by our forward-looking statements due to certain risks and uncertainties. These risks and uncertainties relate to, among other things, the cyclical nature of our business; adverse geopolitical, economic and market conditions, including inflation; material disruption in the movement of rail traffic for deliveries; fluctuating costs of raw materials including steel and aluminum; future changes in U.S. tax laws and regulations or interpretations thereof; delays in the delivery of raw materials; our ability to maintain relationships with our suppliers of railcar components; our reliance upon a small number of customers that represent a large percentage of our sales; the variable purchase patterns of our customers and the timing of completion, delivery and customer acceptance of orders; the highly competitive nature of our industry; the risk of lack of acceptance of our new railcar offerings, and other competitive factors. The factors listed above are not exhaustive. New factors emerge from time to time that may cause our business not to develop as we expect, and it is not possible for us to predict all of them. We expressly disclaim any duty to provide updates to any forward-looking statements made in this press release, whether as a result of new information, future events or otherwise. Non-GAAP Financial Measures This presentation includes measures not derived in accordance with generally accepted accounting principles (“GAAP”), such as EBITDA, Adjusted EBITDA, Adjusted net income (loss) and Adjusted EPS. These non-GAAP measures should not be considered in isolation or as a substitute for any measure derived in accordance with GAAP and may also be inconsistent with similar measures presented by other companies. Reconciliations of these measures to the applicable most closely comparable GAAP measures, and reasons for the Company’s use of these measures, are presented in the “Appendix.”

Company Overview
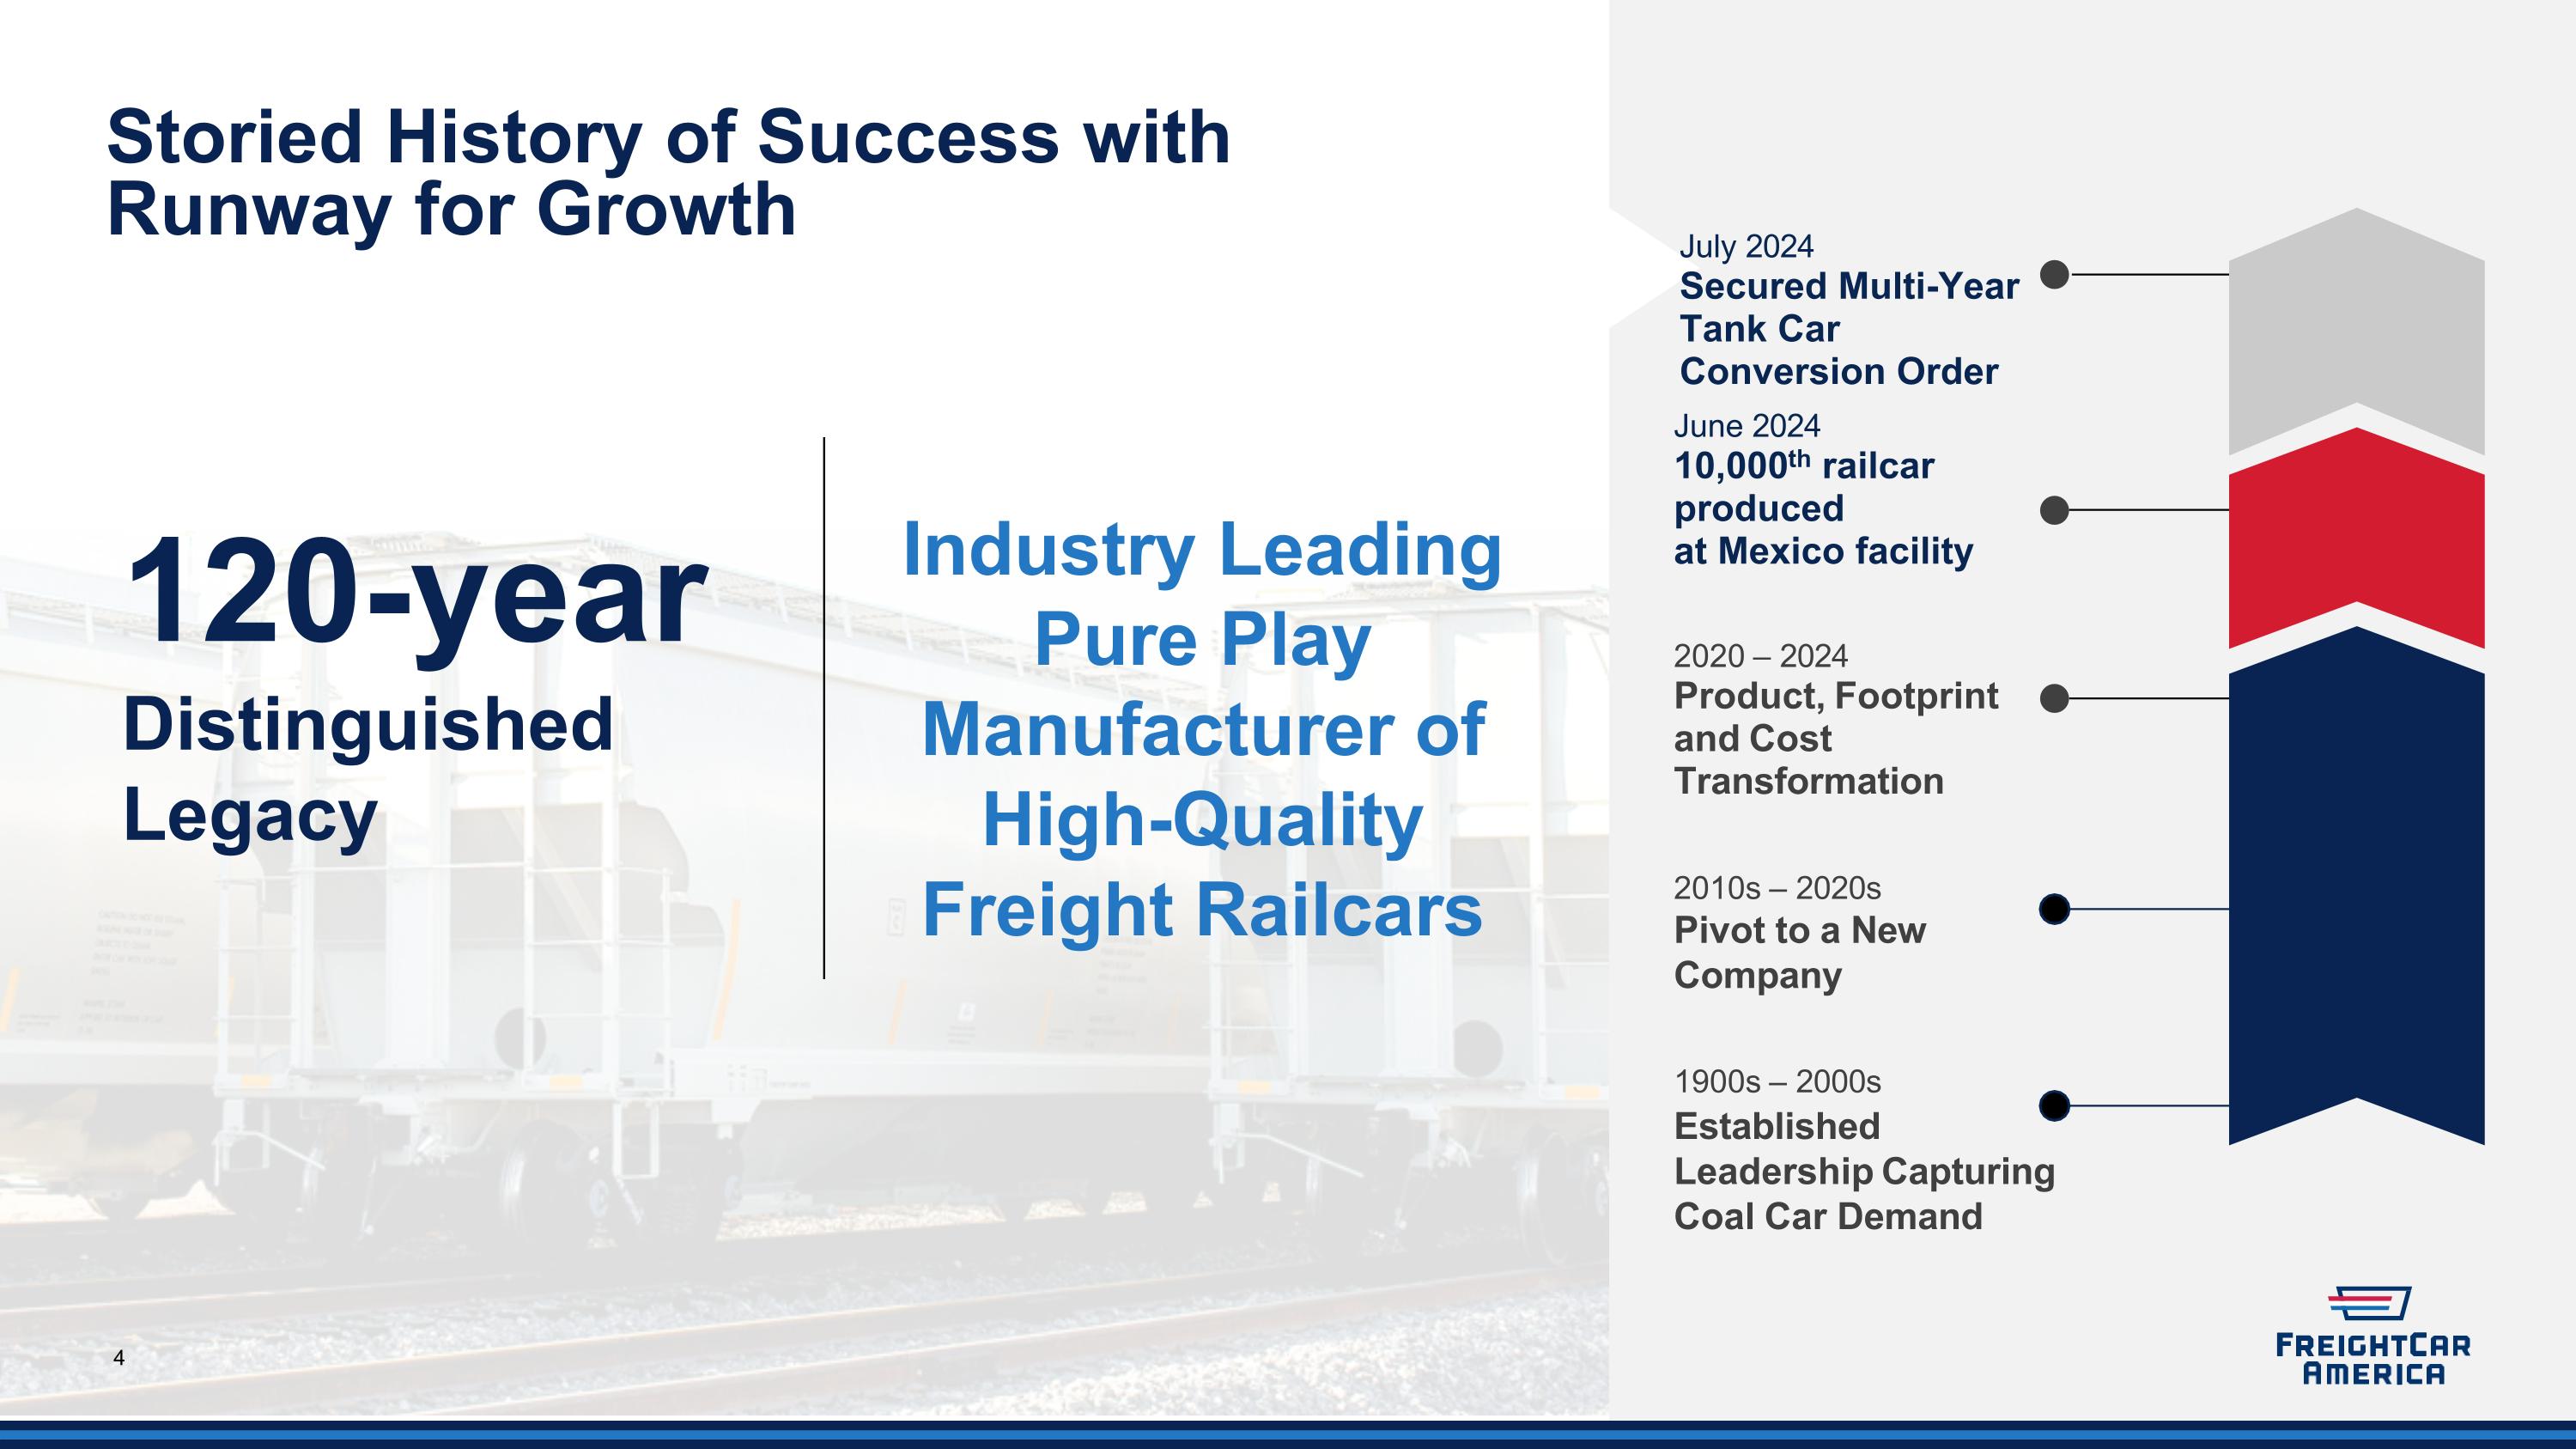
Storied History of Success with Runway for Growth 120-year Distinguished Legacy Industry Leading Pure Play Manufacturer of High-Quality Freight Railcars 2020 – 2024 Product, Footprint and Cost Transformation 1900s – 2000s Established Leadership Capturing Coal Car Demand 2010s – 2020s Pivot to a New Company June 2024 10,000th railcar produced at Mexico facility July 2024 Secured Multi-Year Tank Car Conversion Order
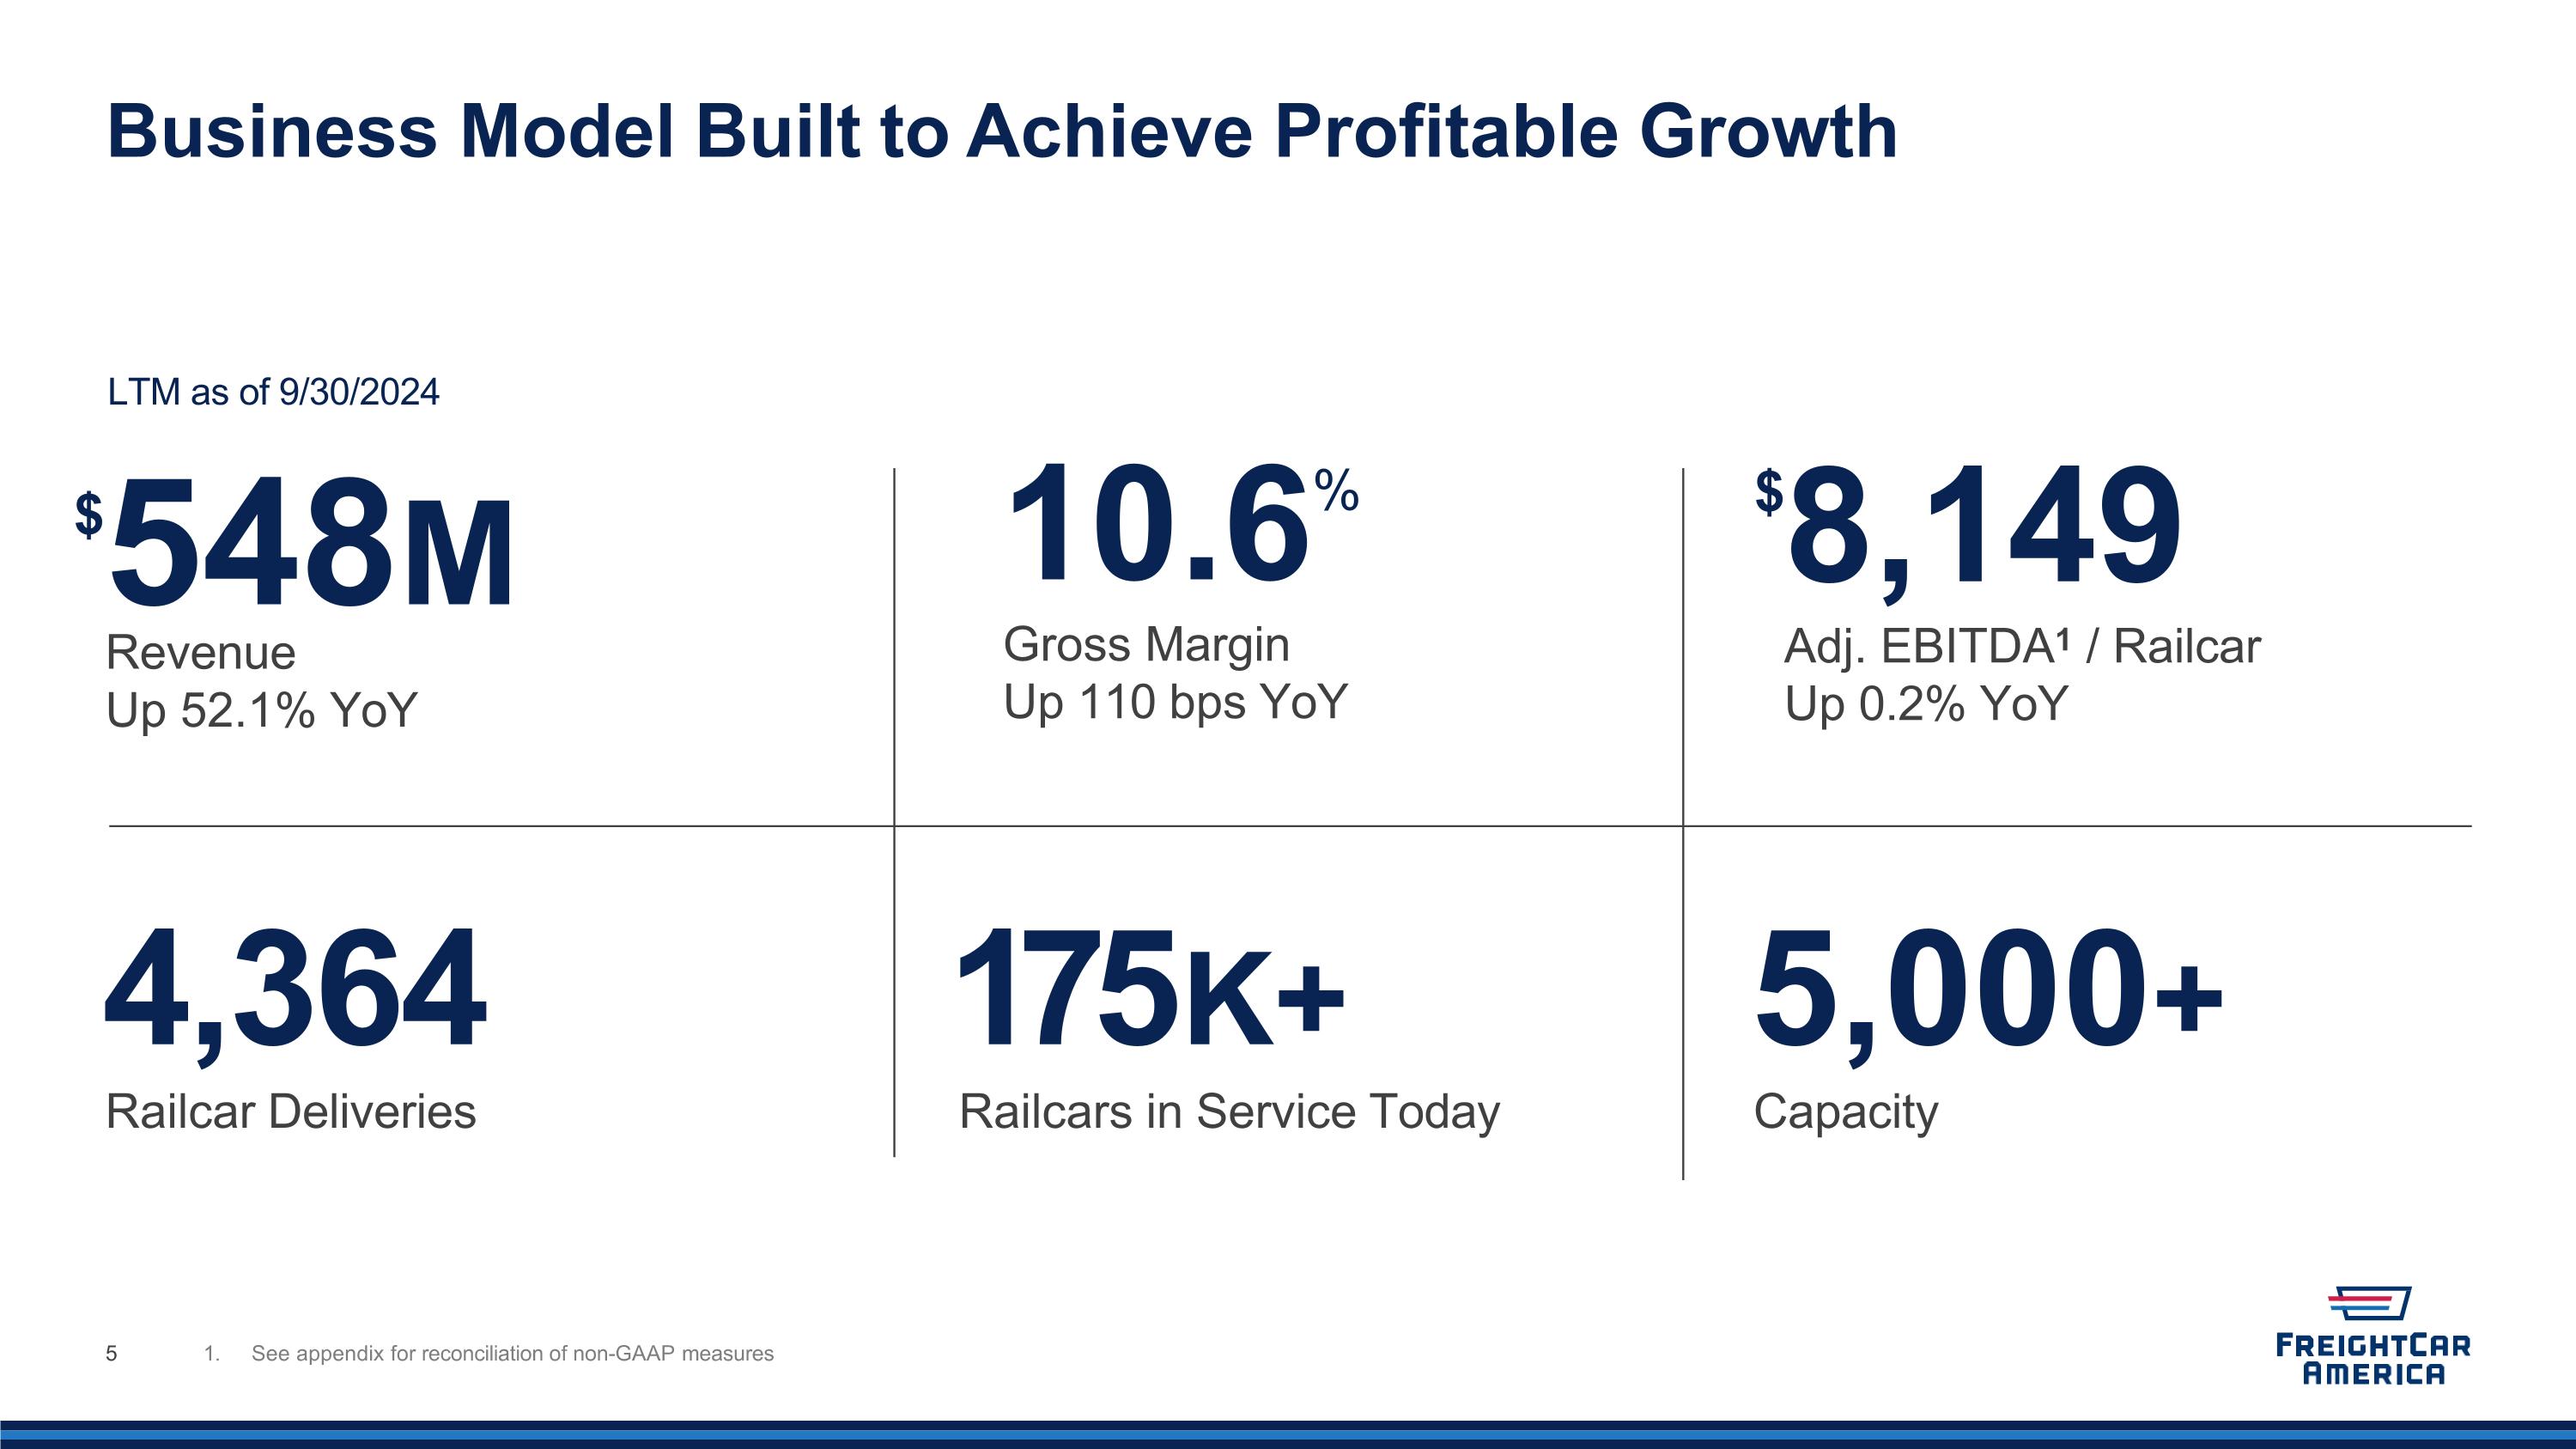
Business Model Built to Achieve Profitable Growth $548M Revenue Up 52.1% YoY 1. See appendix for reconciliation of non-GAAP measures 4,364 Railcar Deliveries 175K+ Railcars in Service Today LTM as of 9/30/2024 10.6% Gross Margin Up 110 bps YoY 5,000+ Capacity $8,149 Adj. EBITDA1 / Railcar Up 0.2% YoY
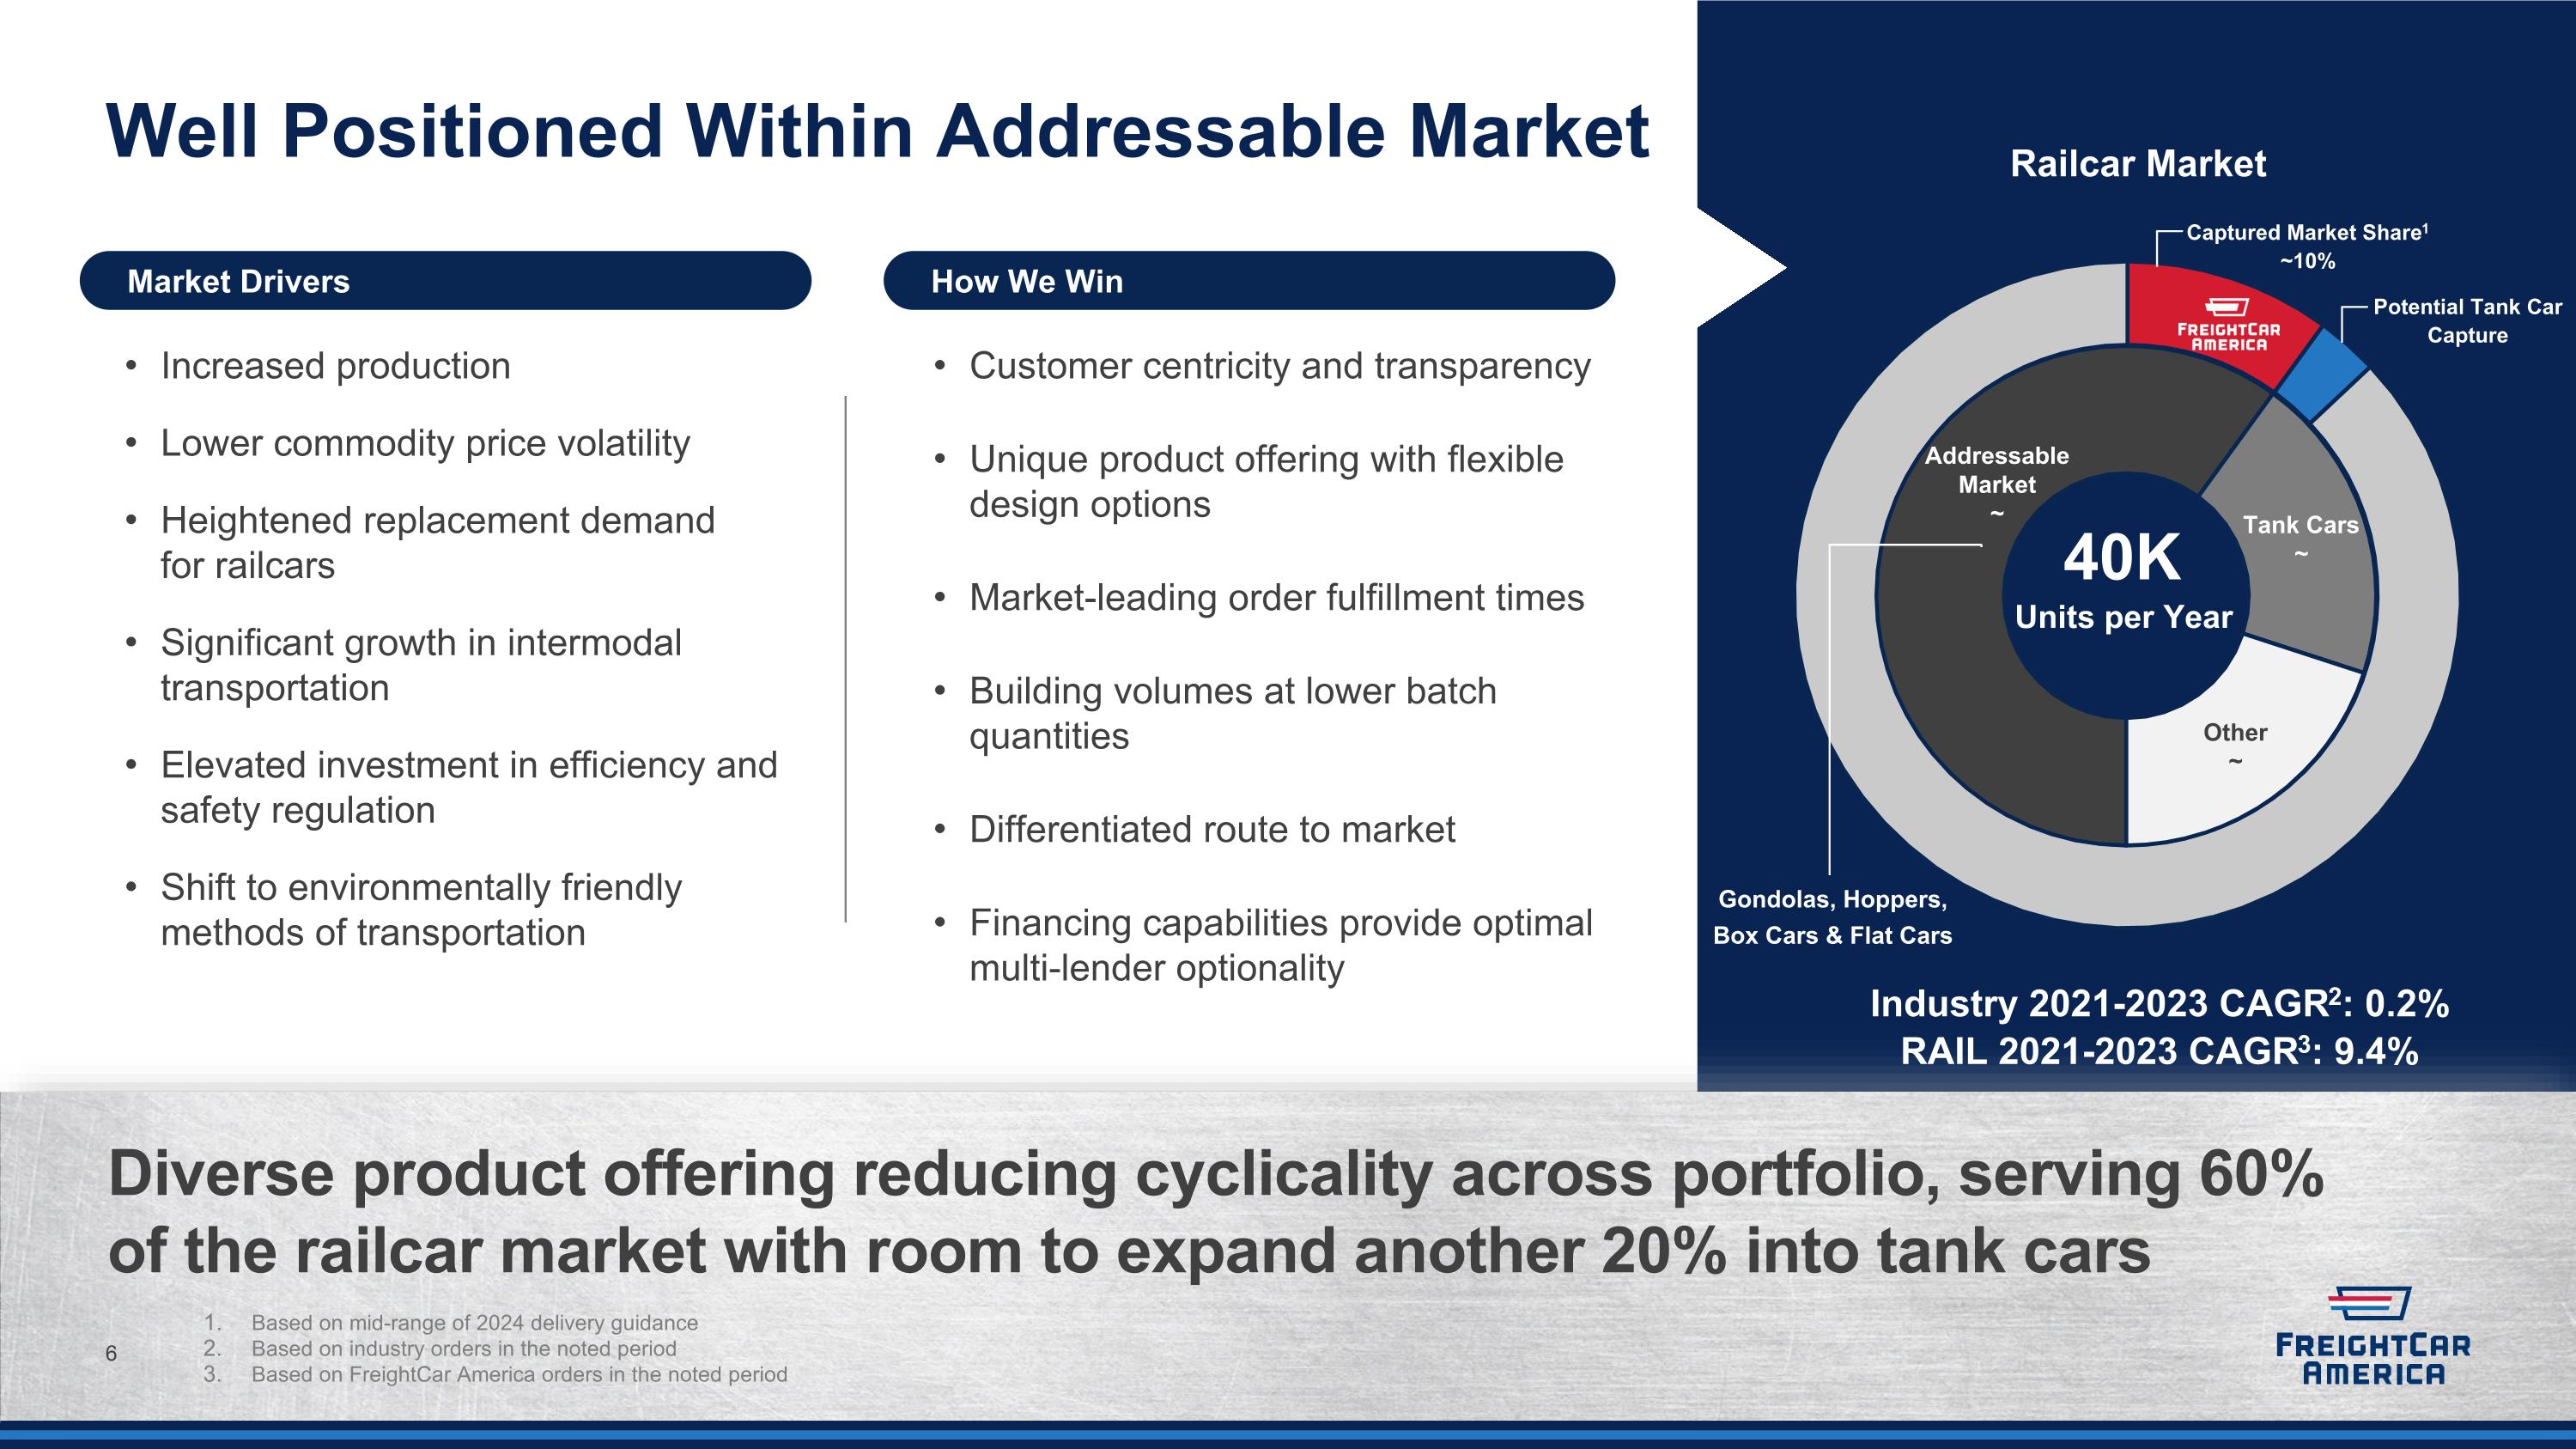
40K Units per Year Well Positioned Within Addressable Market Railcar Market Diverse product offering reducing cyclicality across portfolio, serving 60% of the railcar market with room to expand another 20% into tank cars Increased production Lower commodity price volatility Heightened replacement demand �for railcars Significant growth in intermodal transportation Elevated investment in efficiency and safety regulation Shift to environmentally friendly methods of transportation Market Drivers How We Win Customer centricity and transparency Unique product offering with flexible design options Market-leading order fulfillment times Building volumes at lower batch quantities Differentiated route to market Financing capabilities provide optimal multi-lender optionality Based on mid-range of 2024 delivery guidance Based on industry orders in the noted period Based on FreightCar America orders in the noted period Captured Market Share1 ~10% Potential Tank Car Capture Gondolas, Hoppers, Box Cars & Flat Cars Industry 2021-2023 CAGR2: 0.2% RAIL 2021-2023 CAGR3: 9.4%
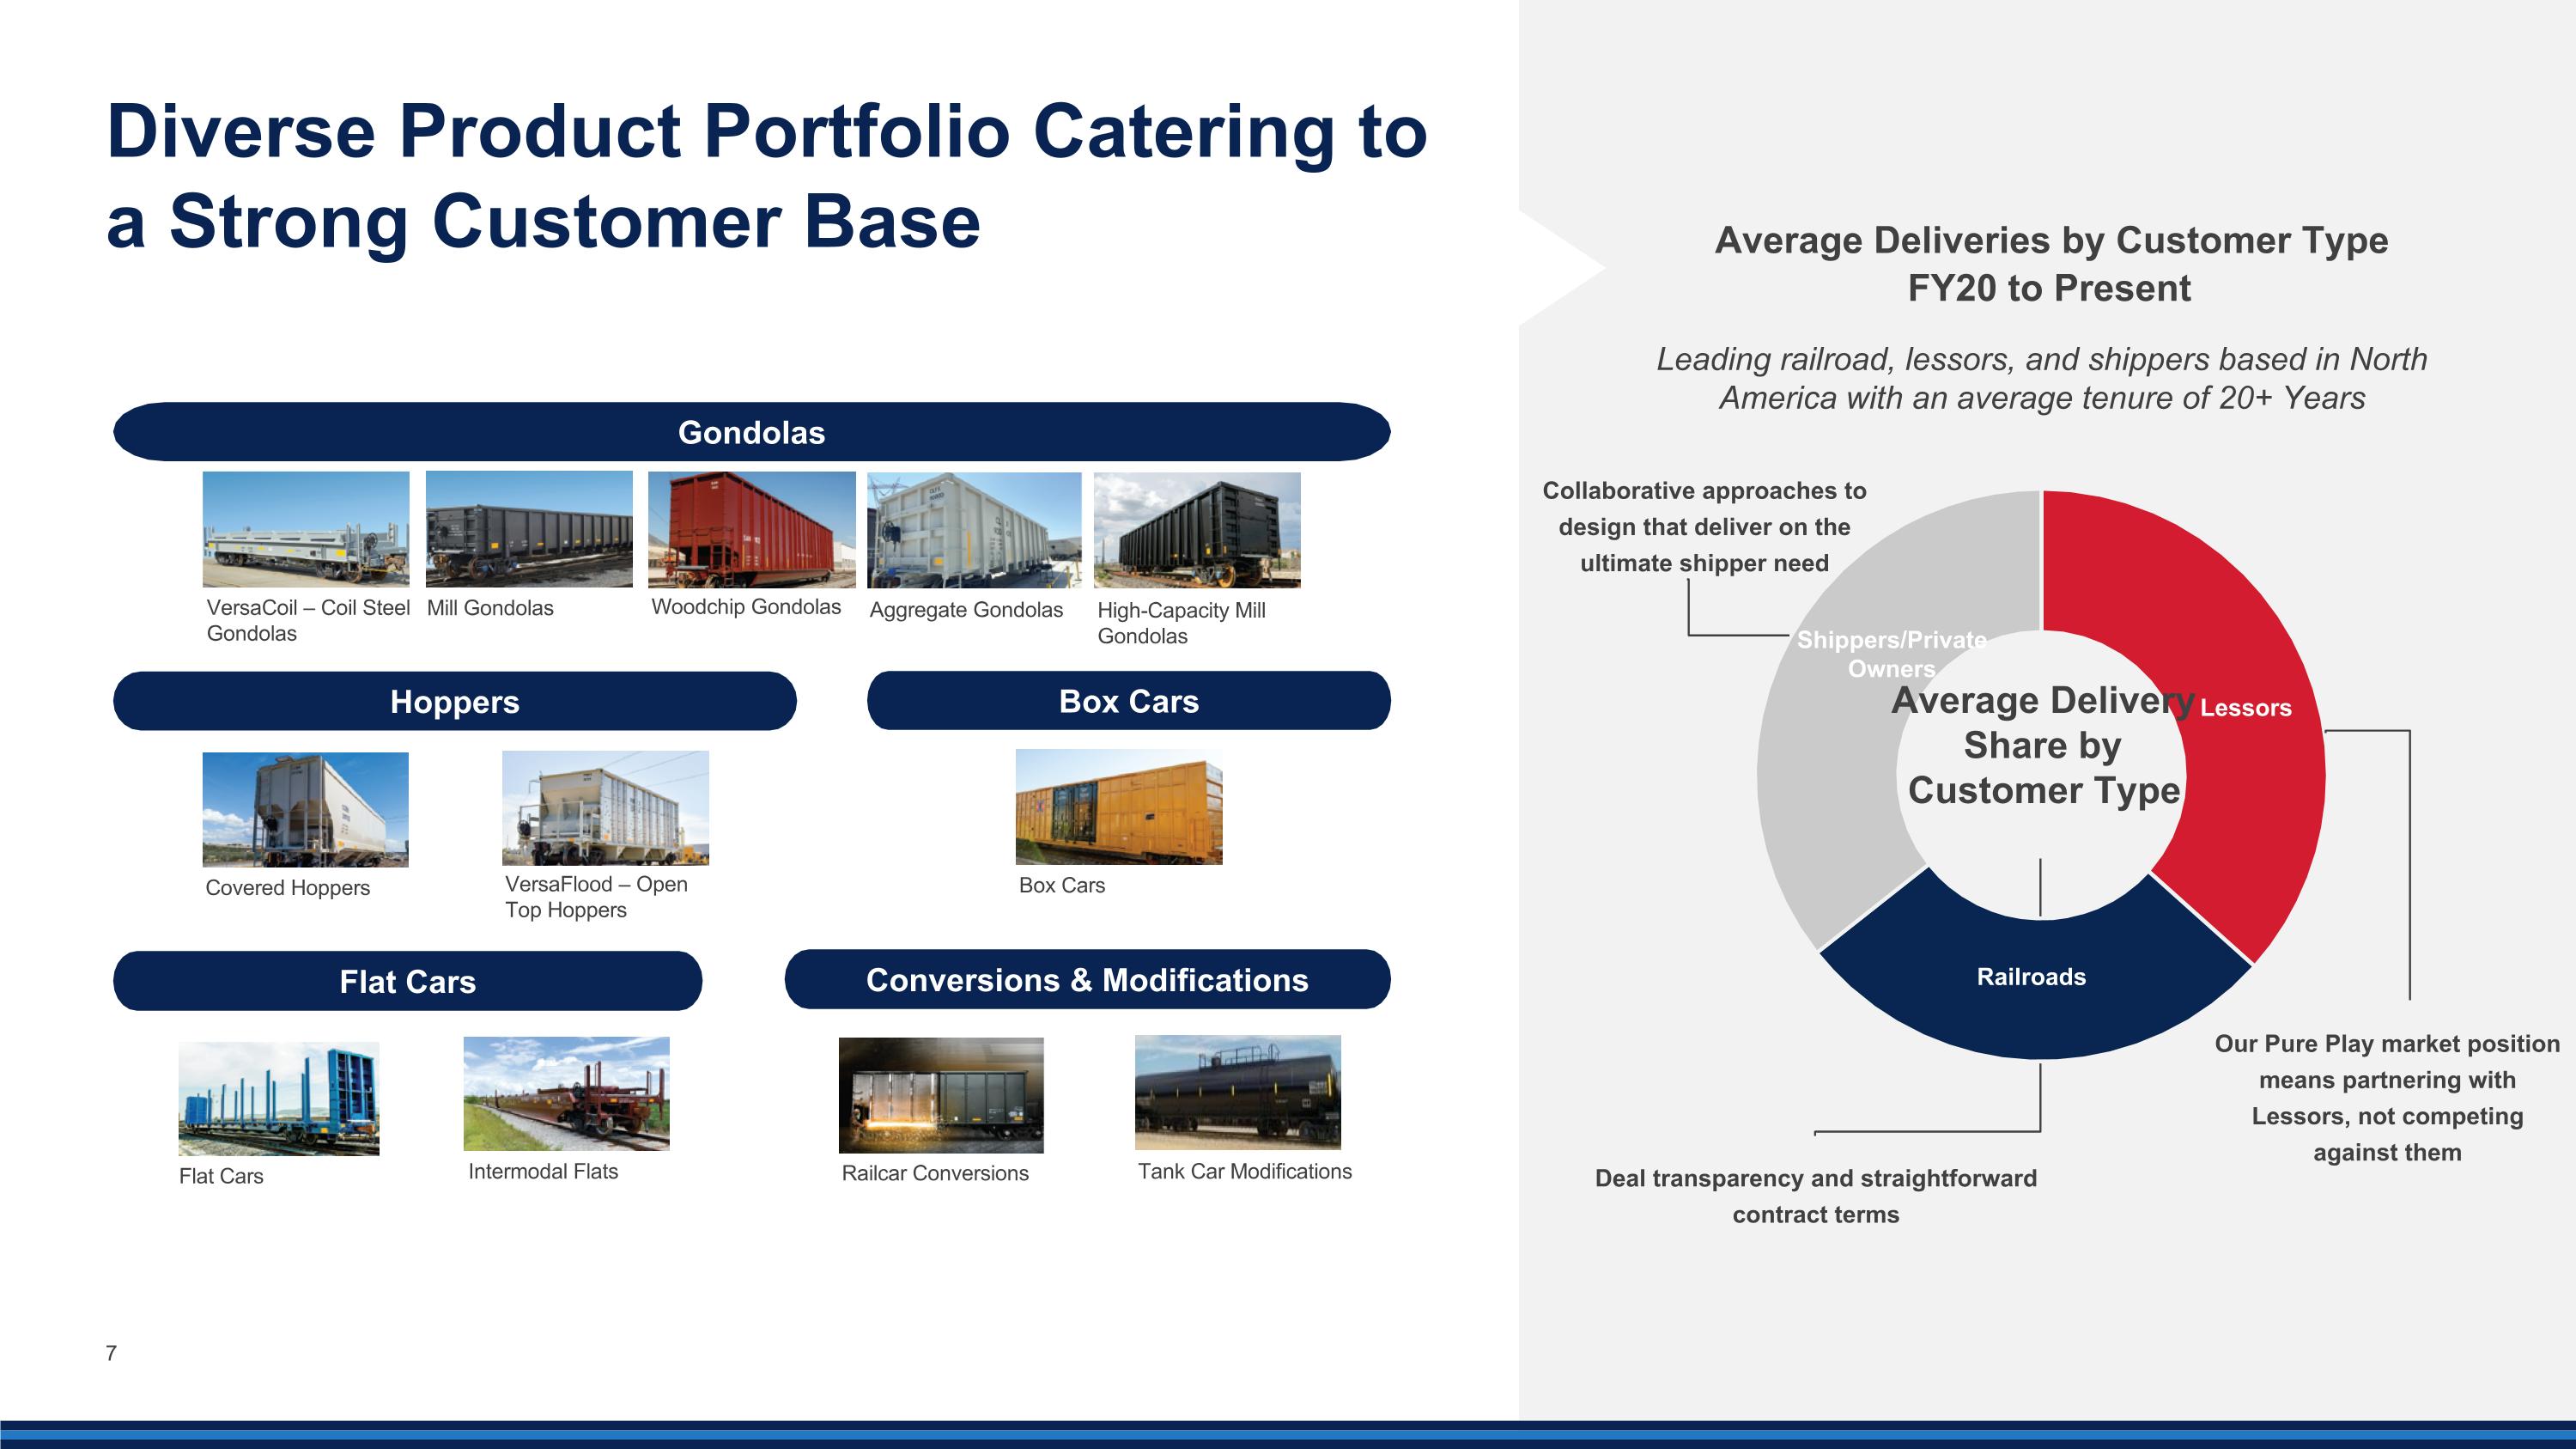
Diverse Product Portfolio Catering to �a Strong Customer Base Gondolas Flat Cars Conversions & Modifications Leading railroad, lessors, and shippers based in North America with an average tenure of 20+ Years VersaCoil – Coil Steel Gondolas Covered Hoppers Hoppers Mill Gondolas Woodchip Gondolas High-Capacity Mill Gondolas Aggregate Gondolas Box Cars VersaFlood – Open Top Hoppers Box Cars Railcar Conversions Intermodal Flats Flat Cars Average Deliveries by Customer Type FY20 to Present Average Delivery Share by Customer Type Tank Car Modifications Our Pure Play market position means partnering with Lessors, not competing against them Collaborative approaches to design that deliver on the ultimate shipper need Deal transparency and straightforward contract terms

Company Leadership Michael Riordan Chief Financial Officer Joined FCA in 2020 as part of turn-around team Focused on strategic planning and capital management 17+ years in finance, accounting and operations Matthew Tonn Chief Commercial Officer Joined FCA in 2019 to lead Company’s realignment in the broader freight and third- party lessor markets Proven track record for business development, growth and start-ups 30+ years of experience in the rail equipment markets Nicholas Randall Chief Executive Officer Joined FCA in 2023 to prepare Company for its next phase of development Technical expertise in manufacturing excellence and supply chain management 20+ years of expertise in leading automotive and aerospace companies Joined FCA in 2022 to lead Legal and Compliance Business-minded attorney with deep commercial and M&A experience 15+ years in the legal industry, with a mix of private practice, in-house and government experience 80+ years of industrial manufacturing experience 6 Celia Perez General Counsel
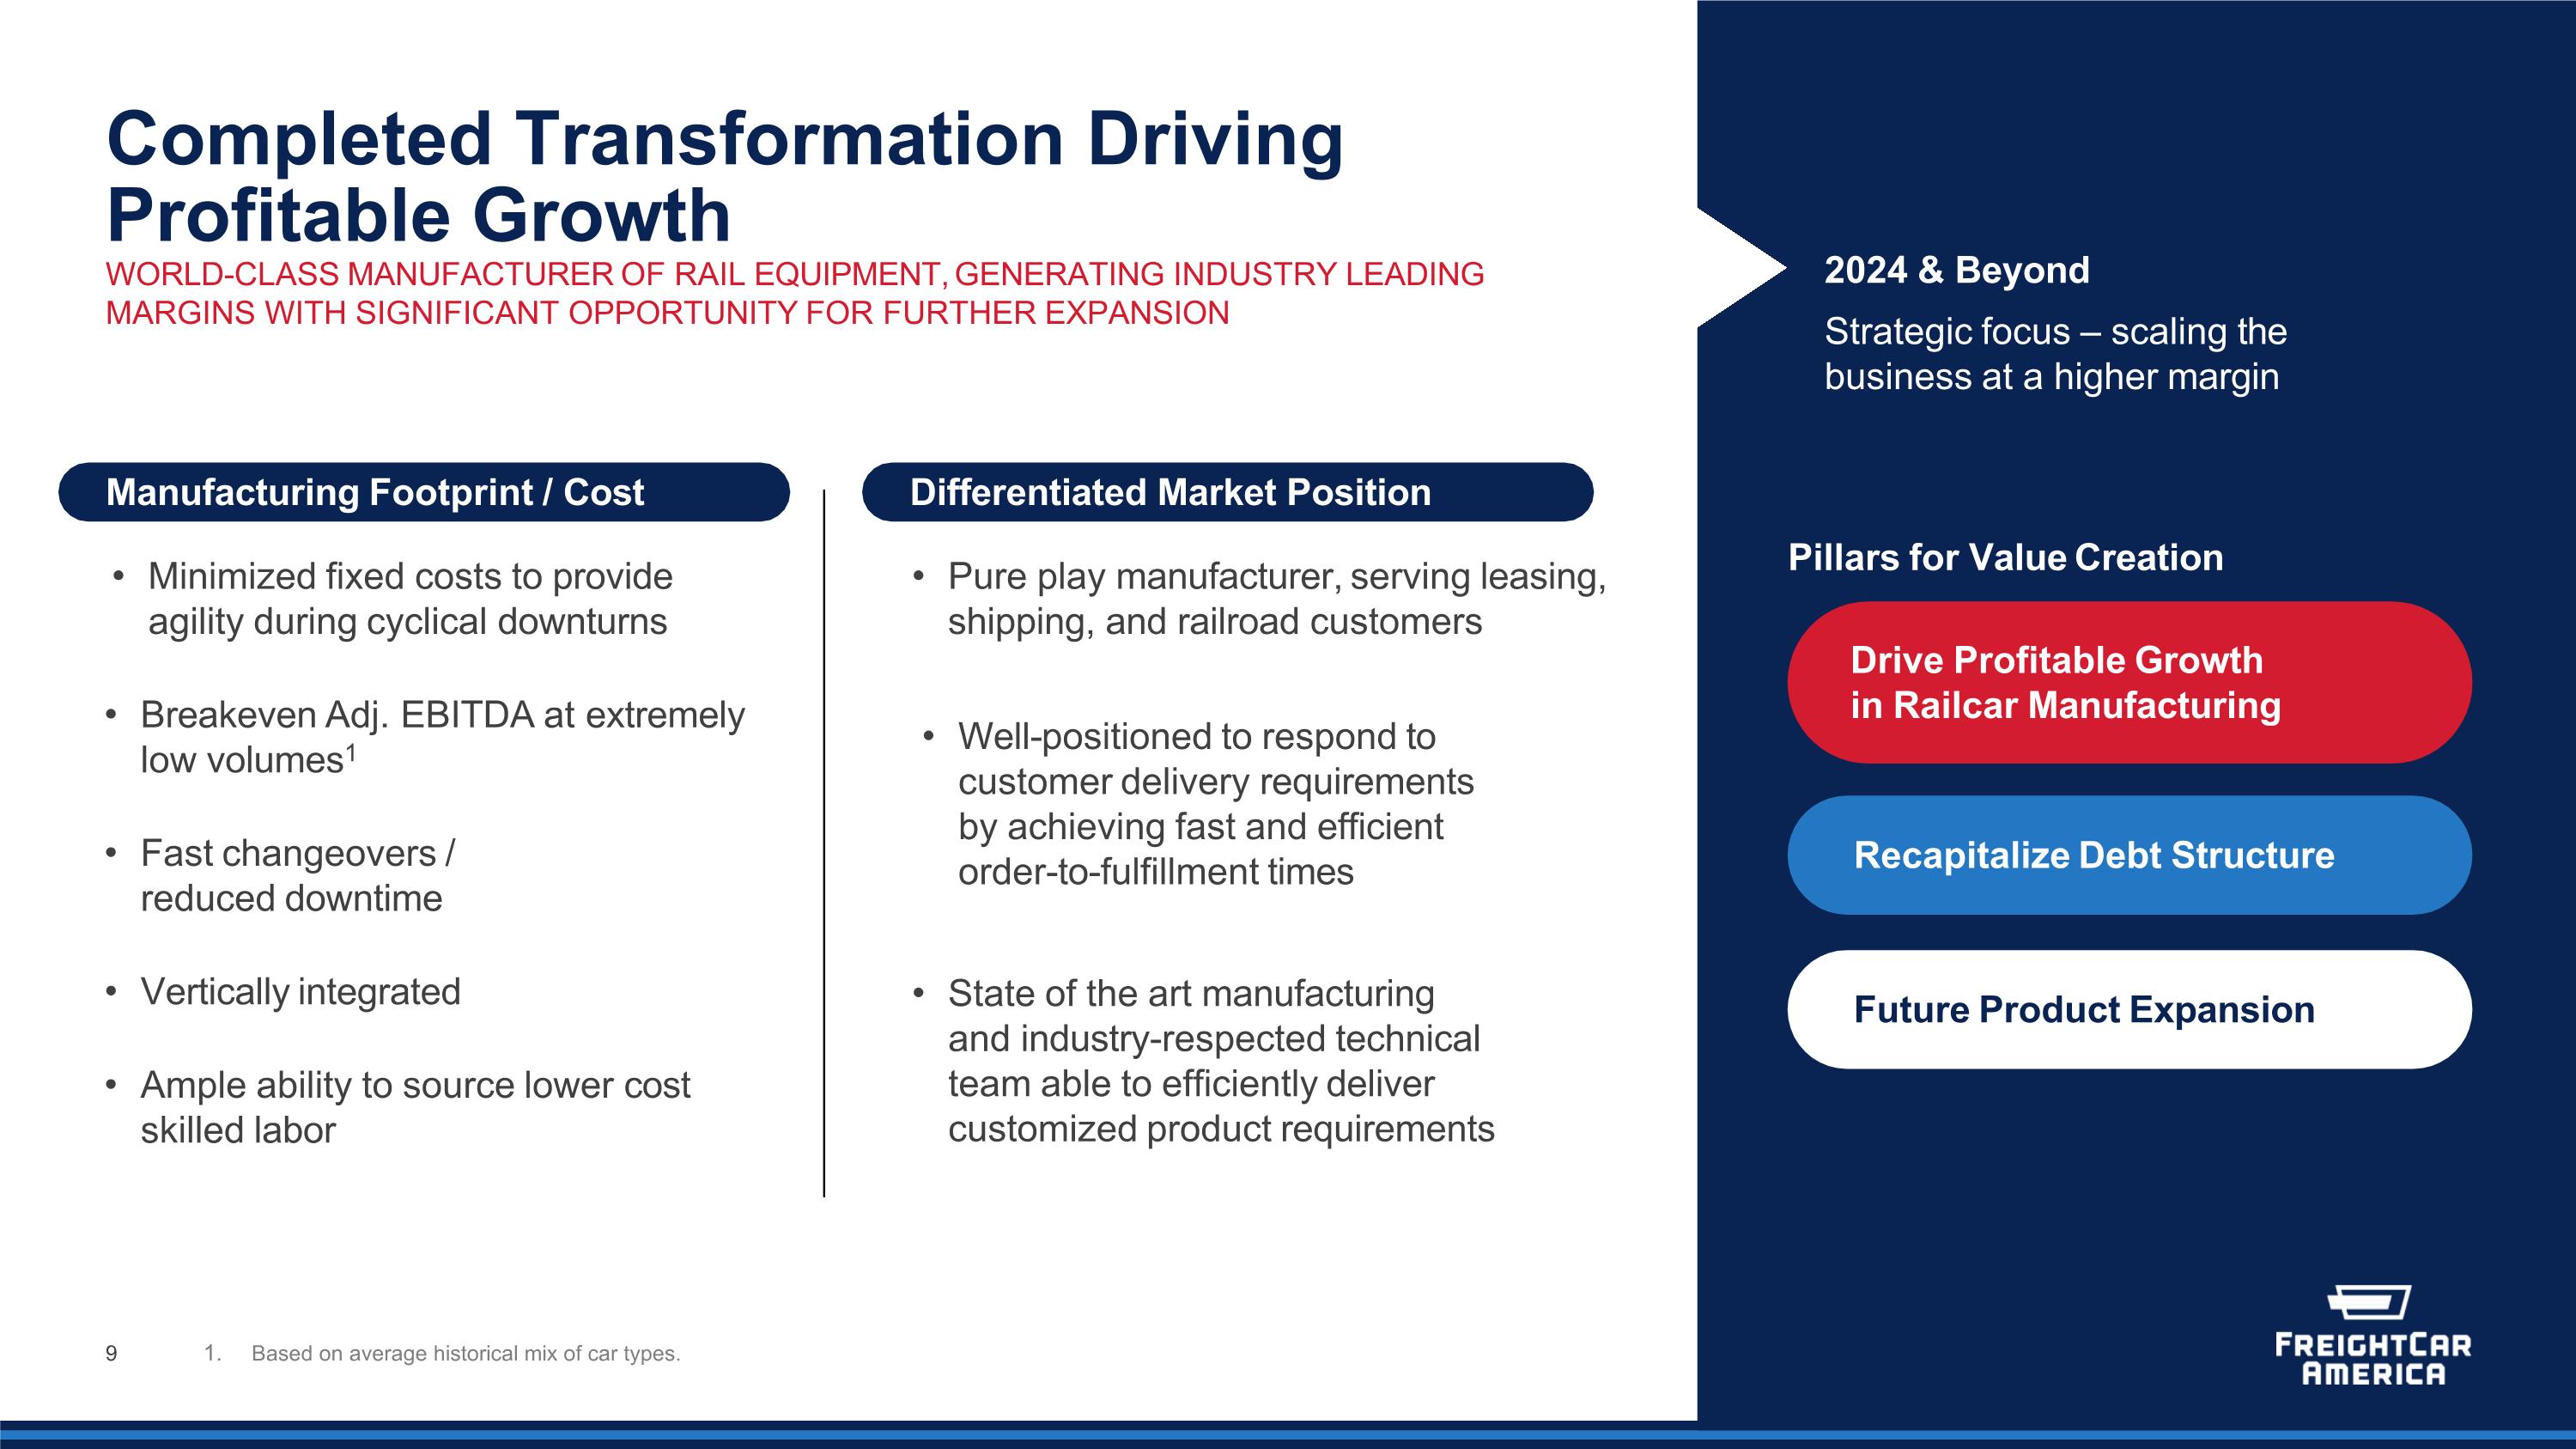
WORLD-CLASS MANUFACTURER OF RAIL EQUIPMENT, GENERATING INDUSTRY LEADING MARGINS WITH SIGNIFICANT OPPORTUNITY FOR FURTHER EXPANSION Completed Transformation Driving Profitable Growth Minimized fixed costs to provide agility during cyclical downturns Breakeven Adj. EBITDA at extremely low volumes1 Fast changeovers / reduced downtime Vertically integrated Ample ability to source lower cost skilled labor Manufacturing Footprint / Cost Differentiated Market Position Pillars for Value Creation 2024 & Beyond Strategic focus – scaling the business at a higher margin Drive Profitable Growth in Railcar Manufacturing Recapitalize Debt Structure Future Product Expansion Pure play manufacturer, serving leasing, shipping, and railroad customers Well-positioned to respond to customer delivery requirements by achieving fast and efficient order-to-fulfillment times State of the art manufacturing and industry-respected technical team able to efficiently deliver customized product requirements Based on average historical mix of car types.
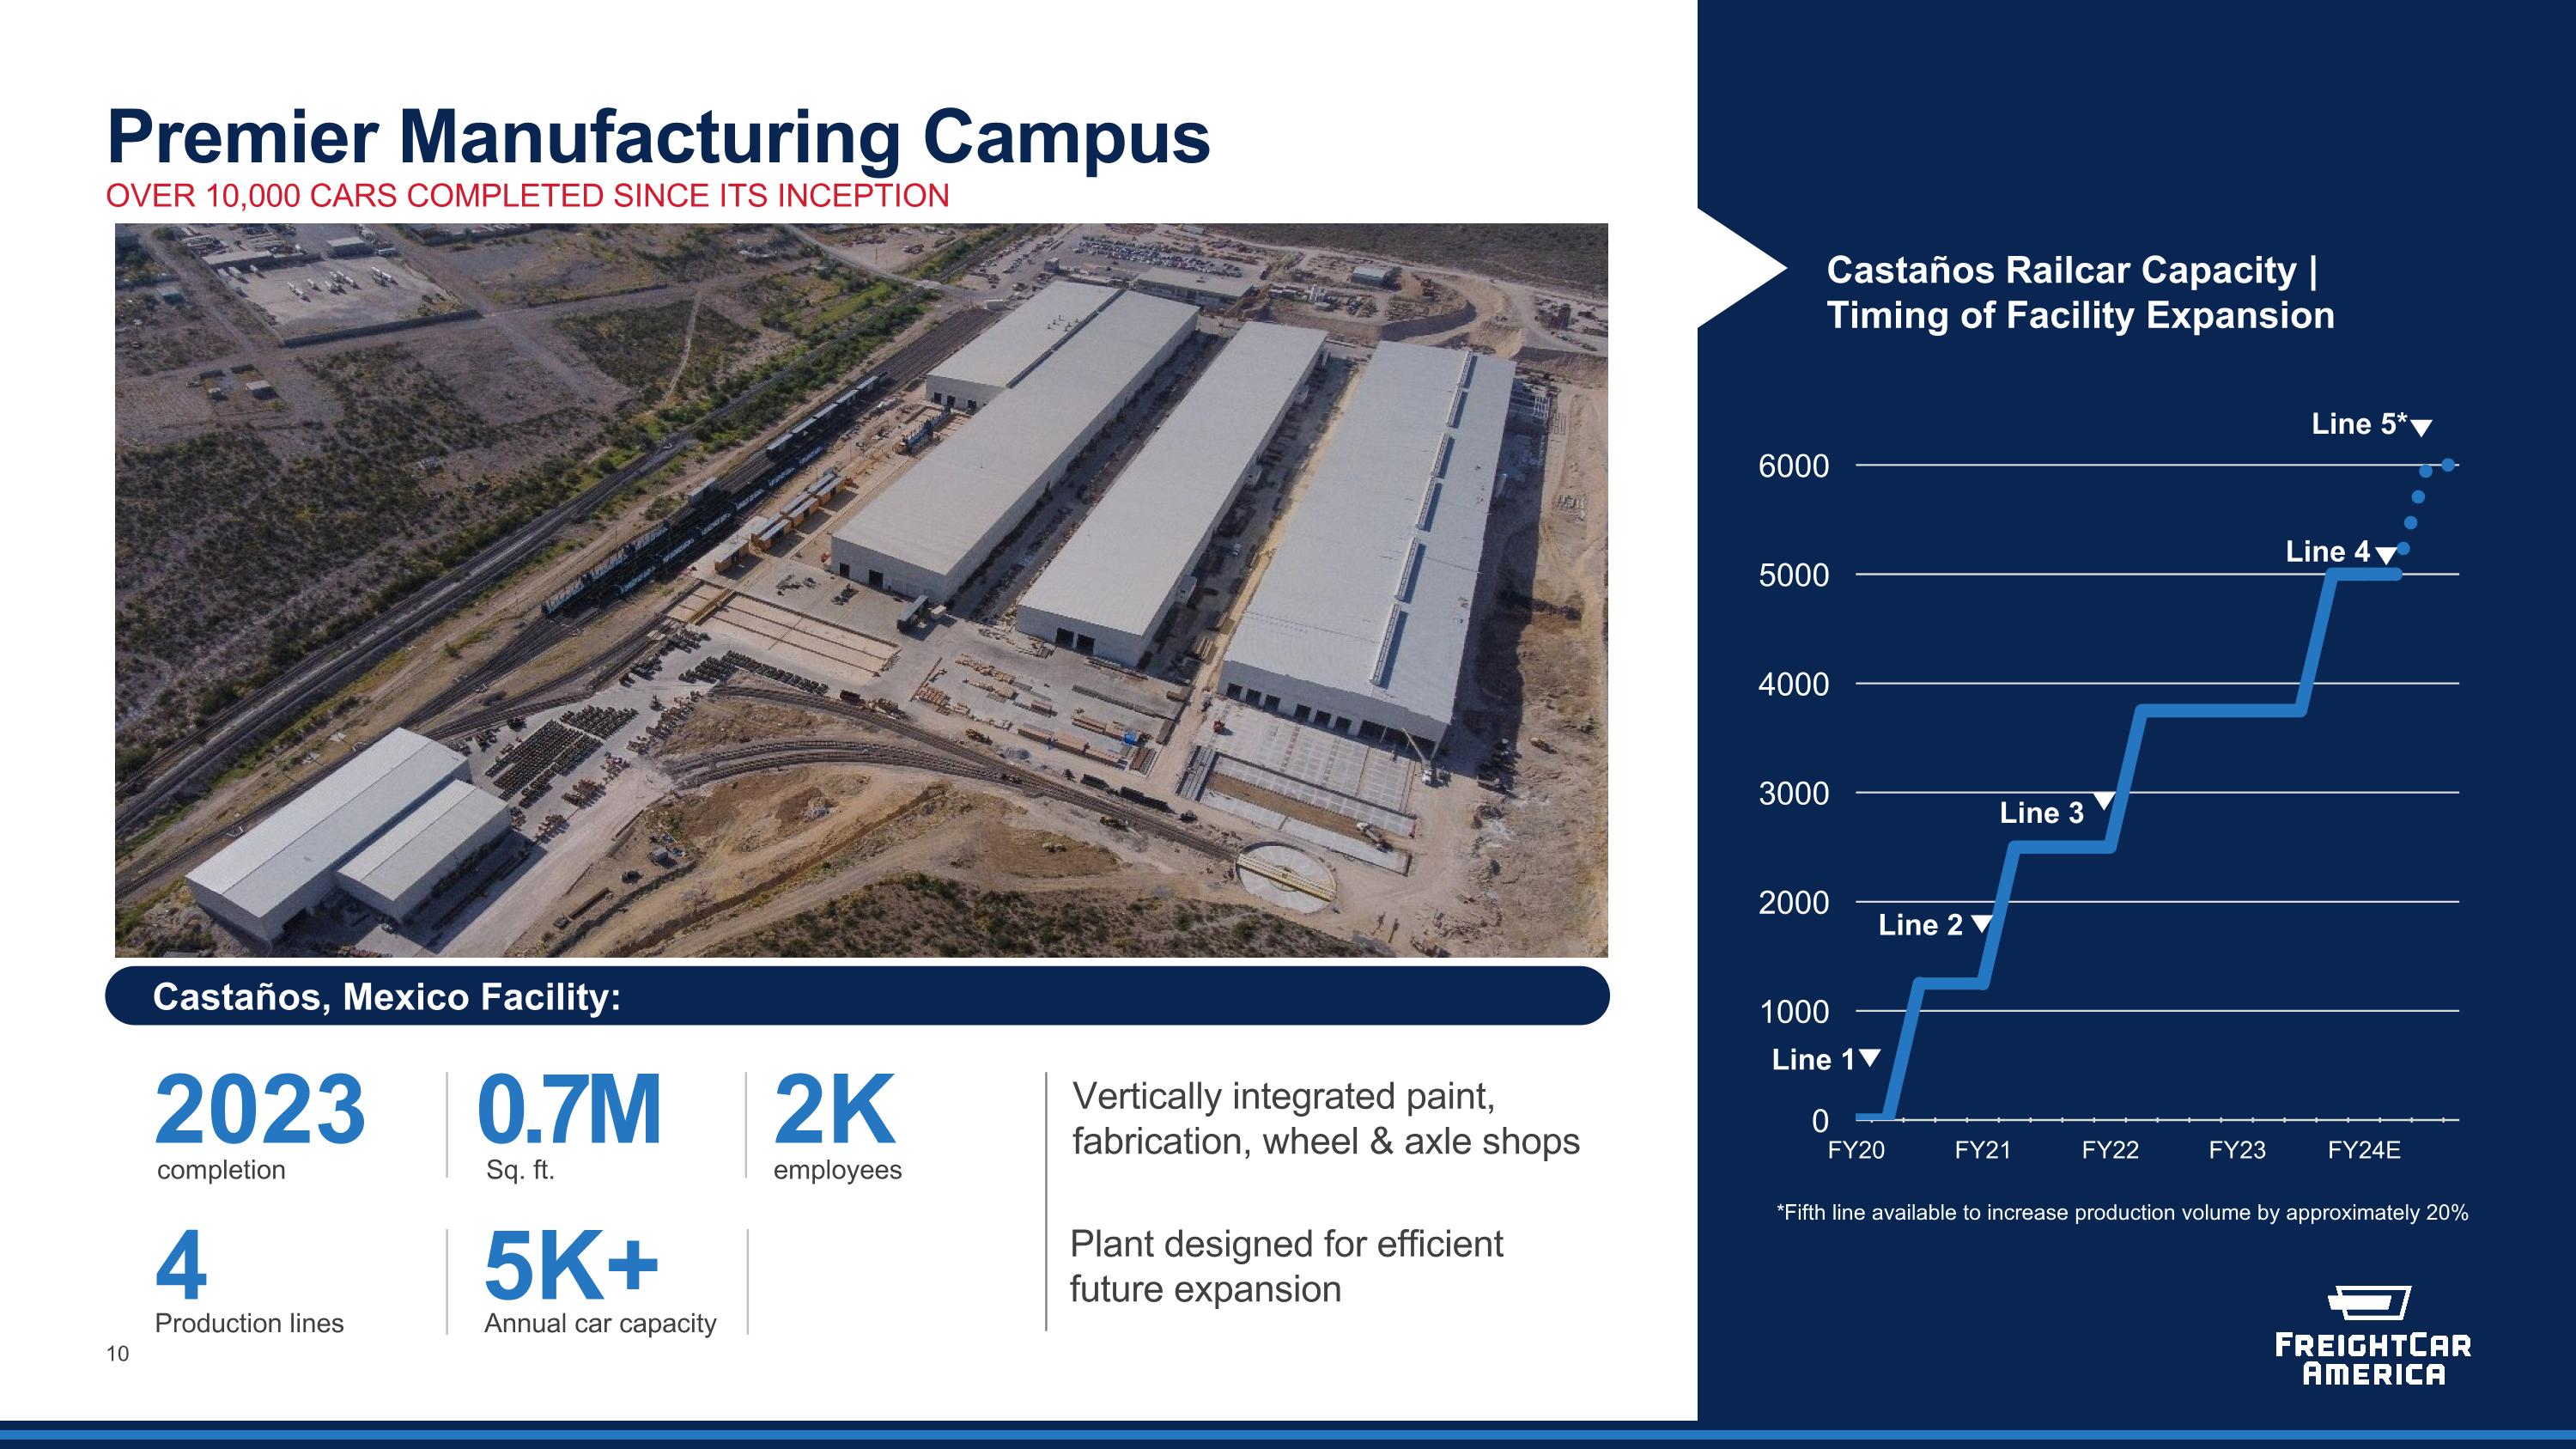
Premier Manufacturing Campus Castaños, Mexico Facility: Plant designed for efficient future expansion Castaños Railcar Capacity | Timing of Facility Expansion Line 4 Line 3 Line 2 Line 1 0.7M 2K 5K+ Sq. ft. employees Annual car capacity 2023 completion 4 Production lines Vertically integrated paint, fabrication, wheel & axle shops 10 Line 5* *Fifth line available to increase production volume by approximately 20% OVER 10,000 CARS COMPLETED SINCE ITS INCEPTION Update photo
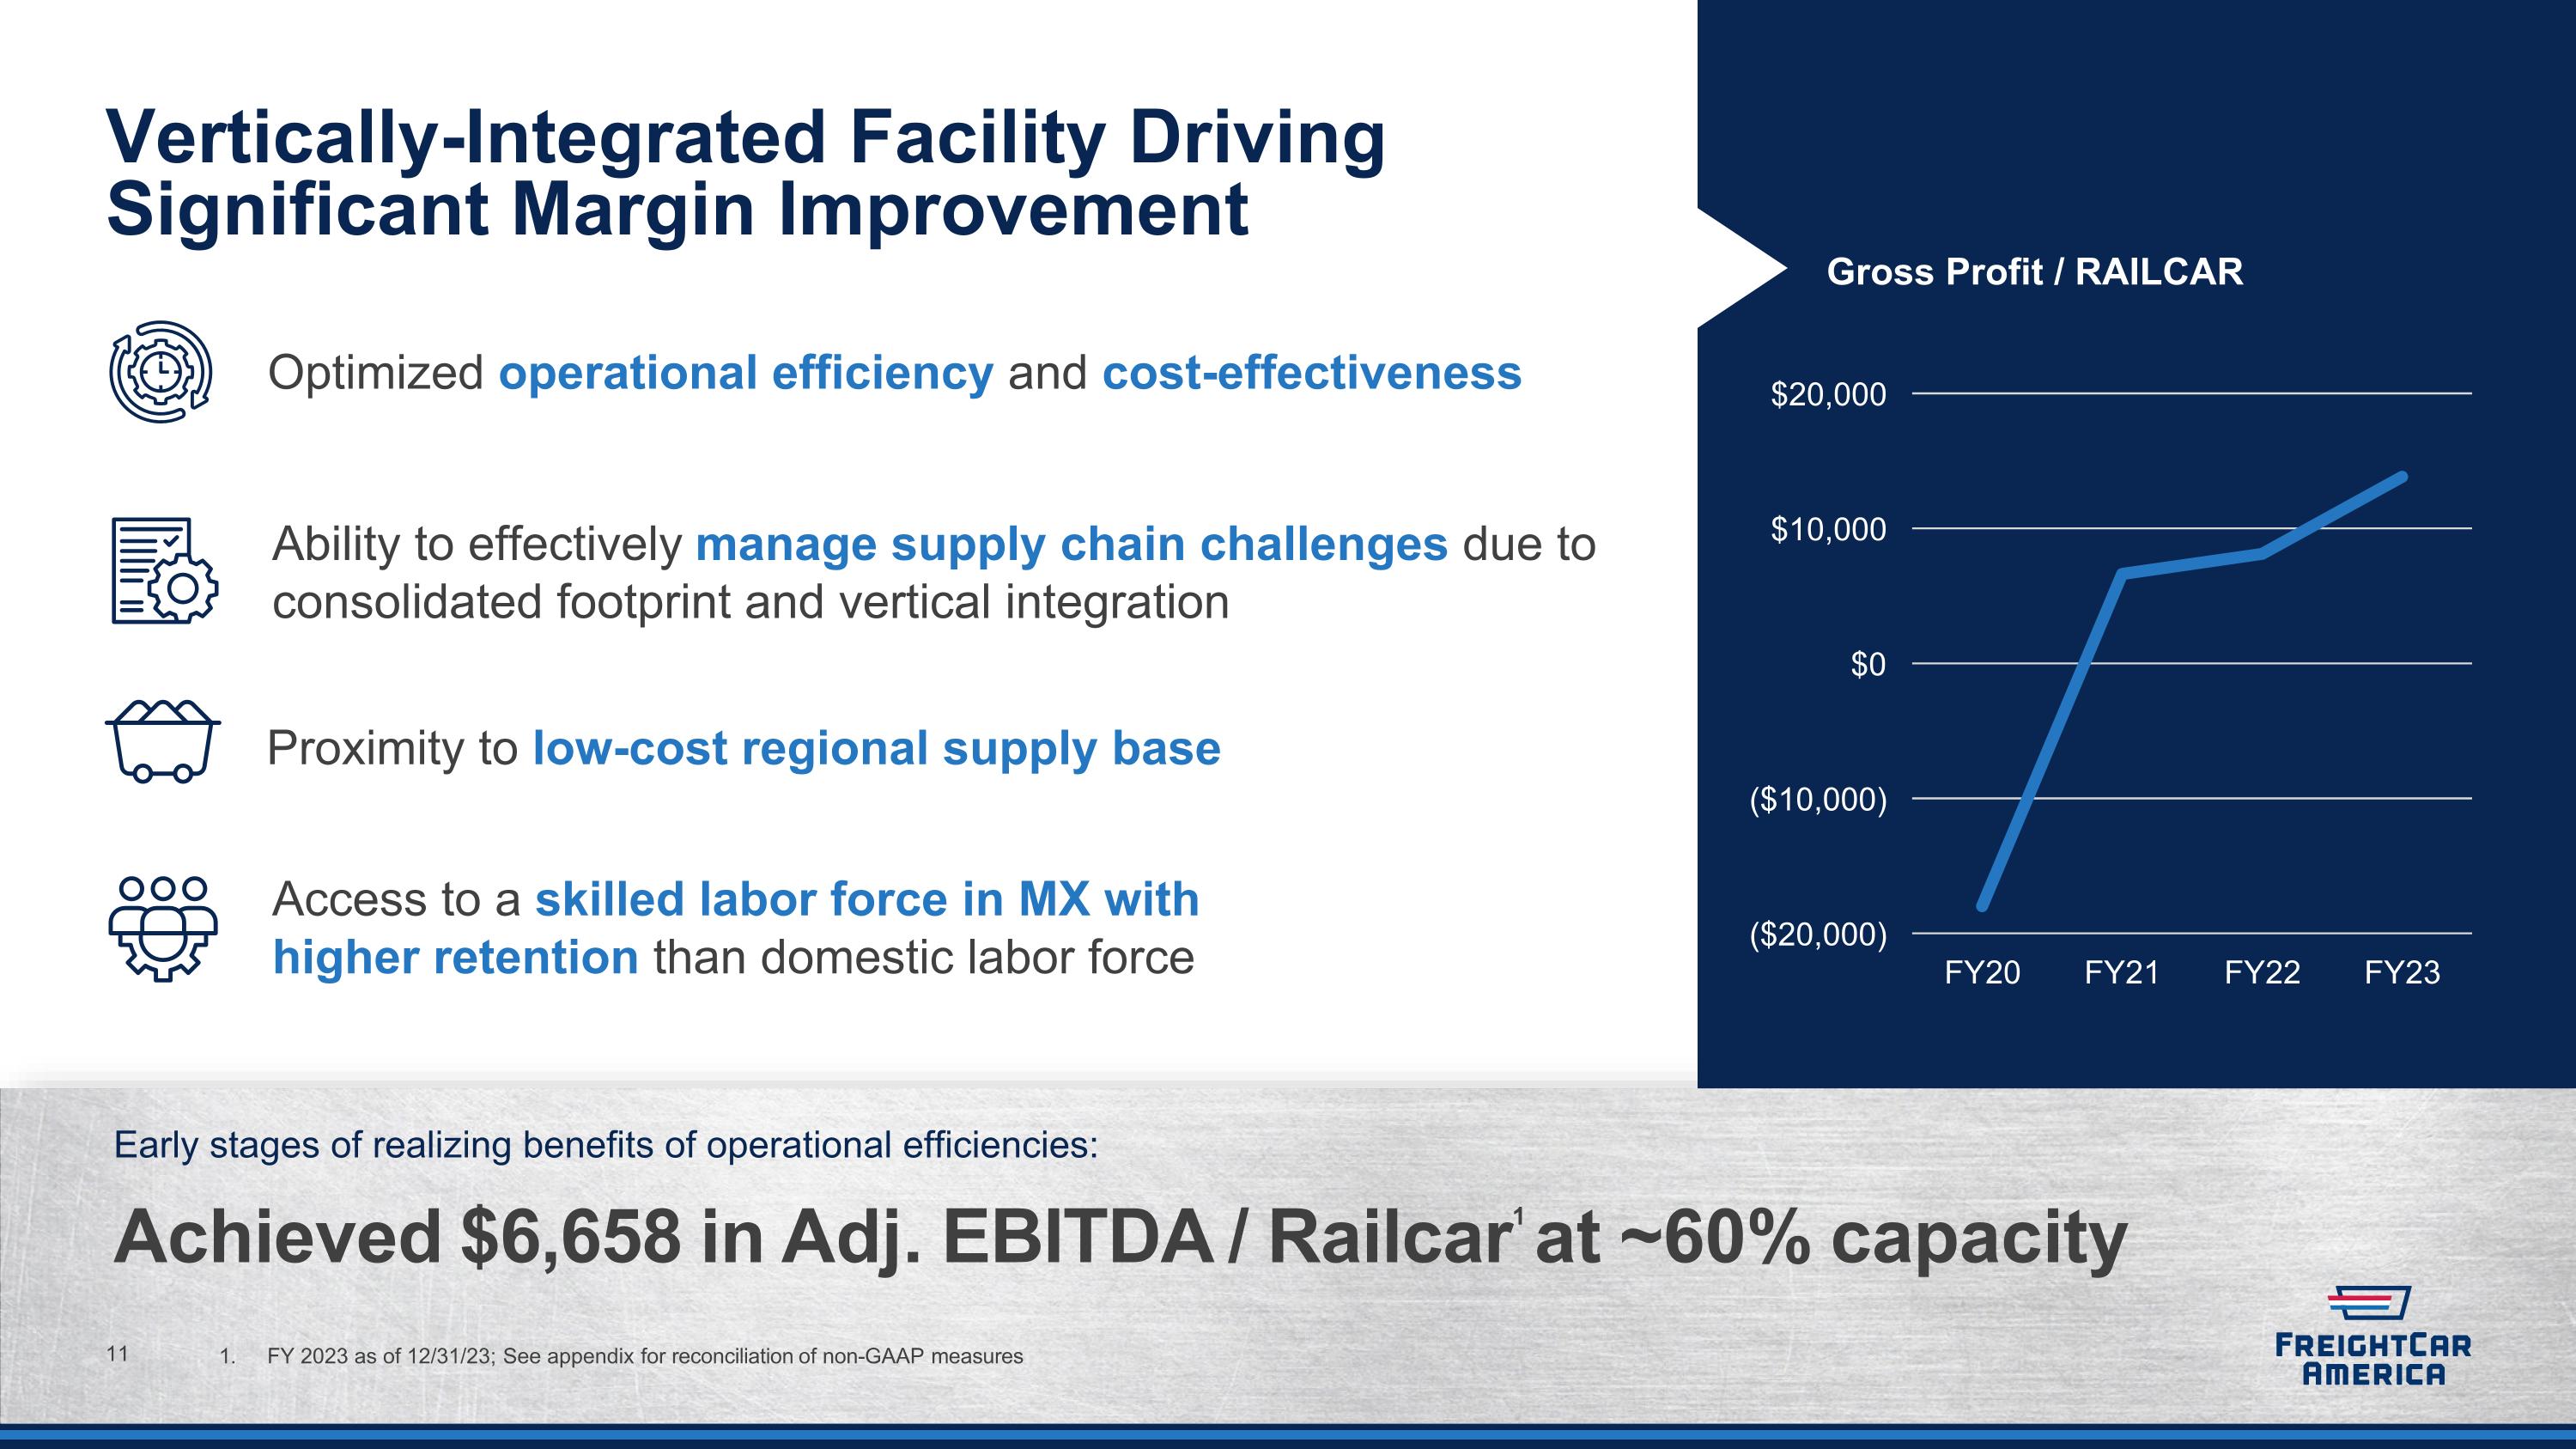
Vertically-Integrated Facility Driving Significant Margin Improvement Optimized operational efficiency and cost-effectiveness 11 Proximity to low-cost regional supply base Gross Profit / RAILCAR Ability to effectively manage supply chain challenges due to �consolidated footprint and vertical integration Access to a skilled labor force in MX with higher retention than domestic labor force Achieved $6,658 in Adj. EBITDA / Railcar1 at ~60% capacity 1. FY 2023 as of 12/31/23; See appendix for reconciliation of non-GAAP measures Early stages of realizing benefits of operational efficiencies: 11
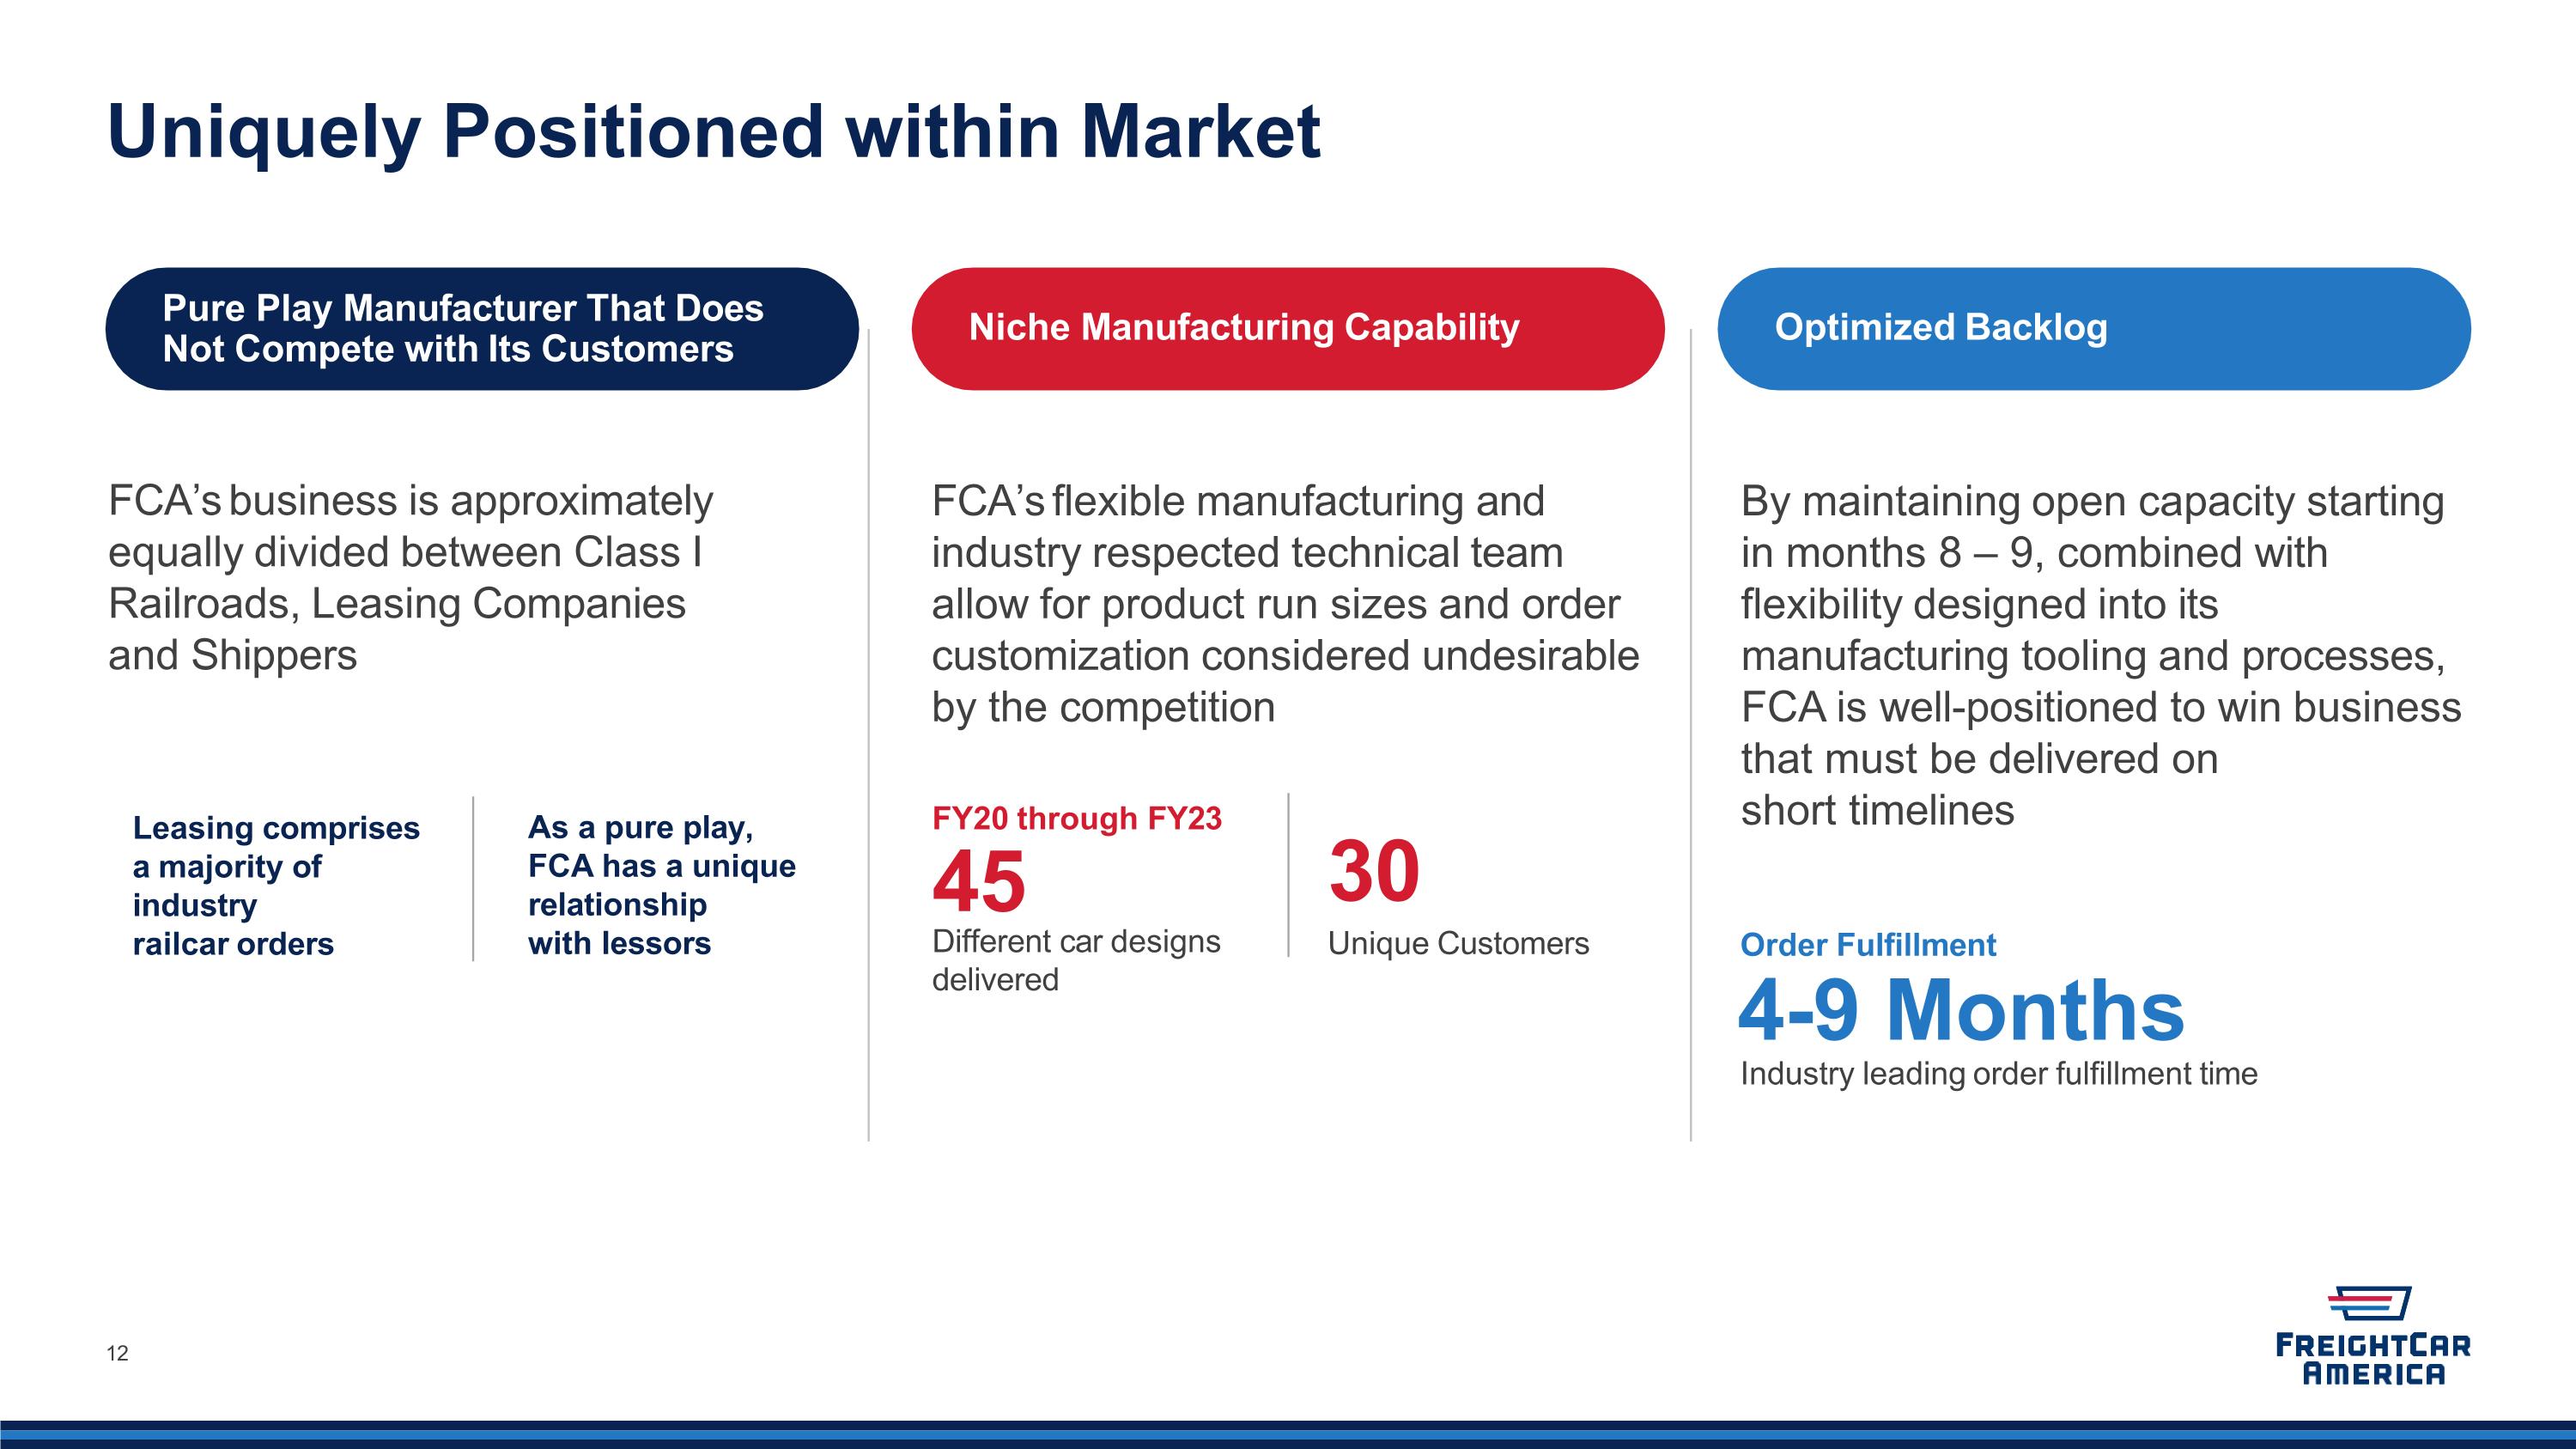
Uniquely Positioned within Market FCA’s flexible manufacturing and industry respected technical team allow for product run sizes and order customization considered undesirable by the competition By maintaining open capacity starting in months 8 – 9, combined with flexibility designed into its manufacturing tooling and processes, FCA is well-positioned to win business that must be delivered on short timelines FCA’s business is approximately equally divided between Class I Railroads, Leasing Companies and Shippers FY20 through FY23 45 Different car designs delivered 30 Unique Customers Order Fulfillment 4-9 Months Industry leading order fulfillment time As a pure play, FCA has a unique relationship with lessors Pure Play Manufacturer That Does Not Compete with Its Customers Niche Manufacturing Capability Optimized Backlog Leasing comprises a majority of industry railcar orders
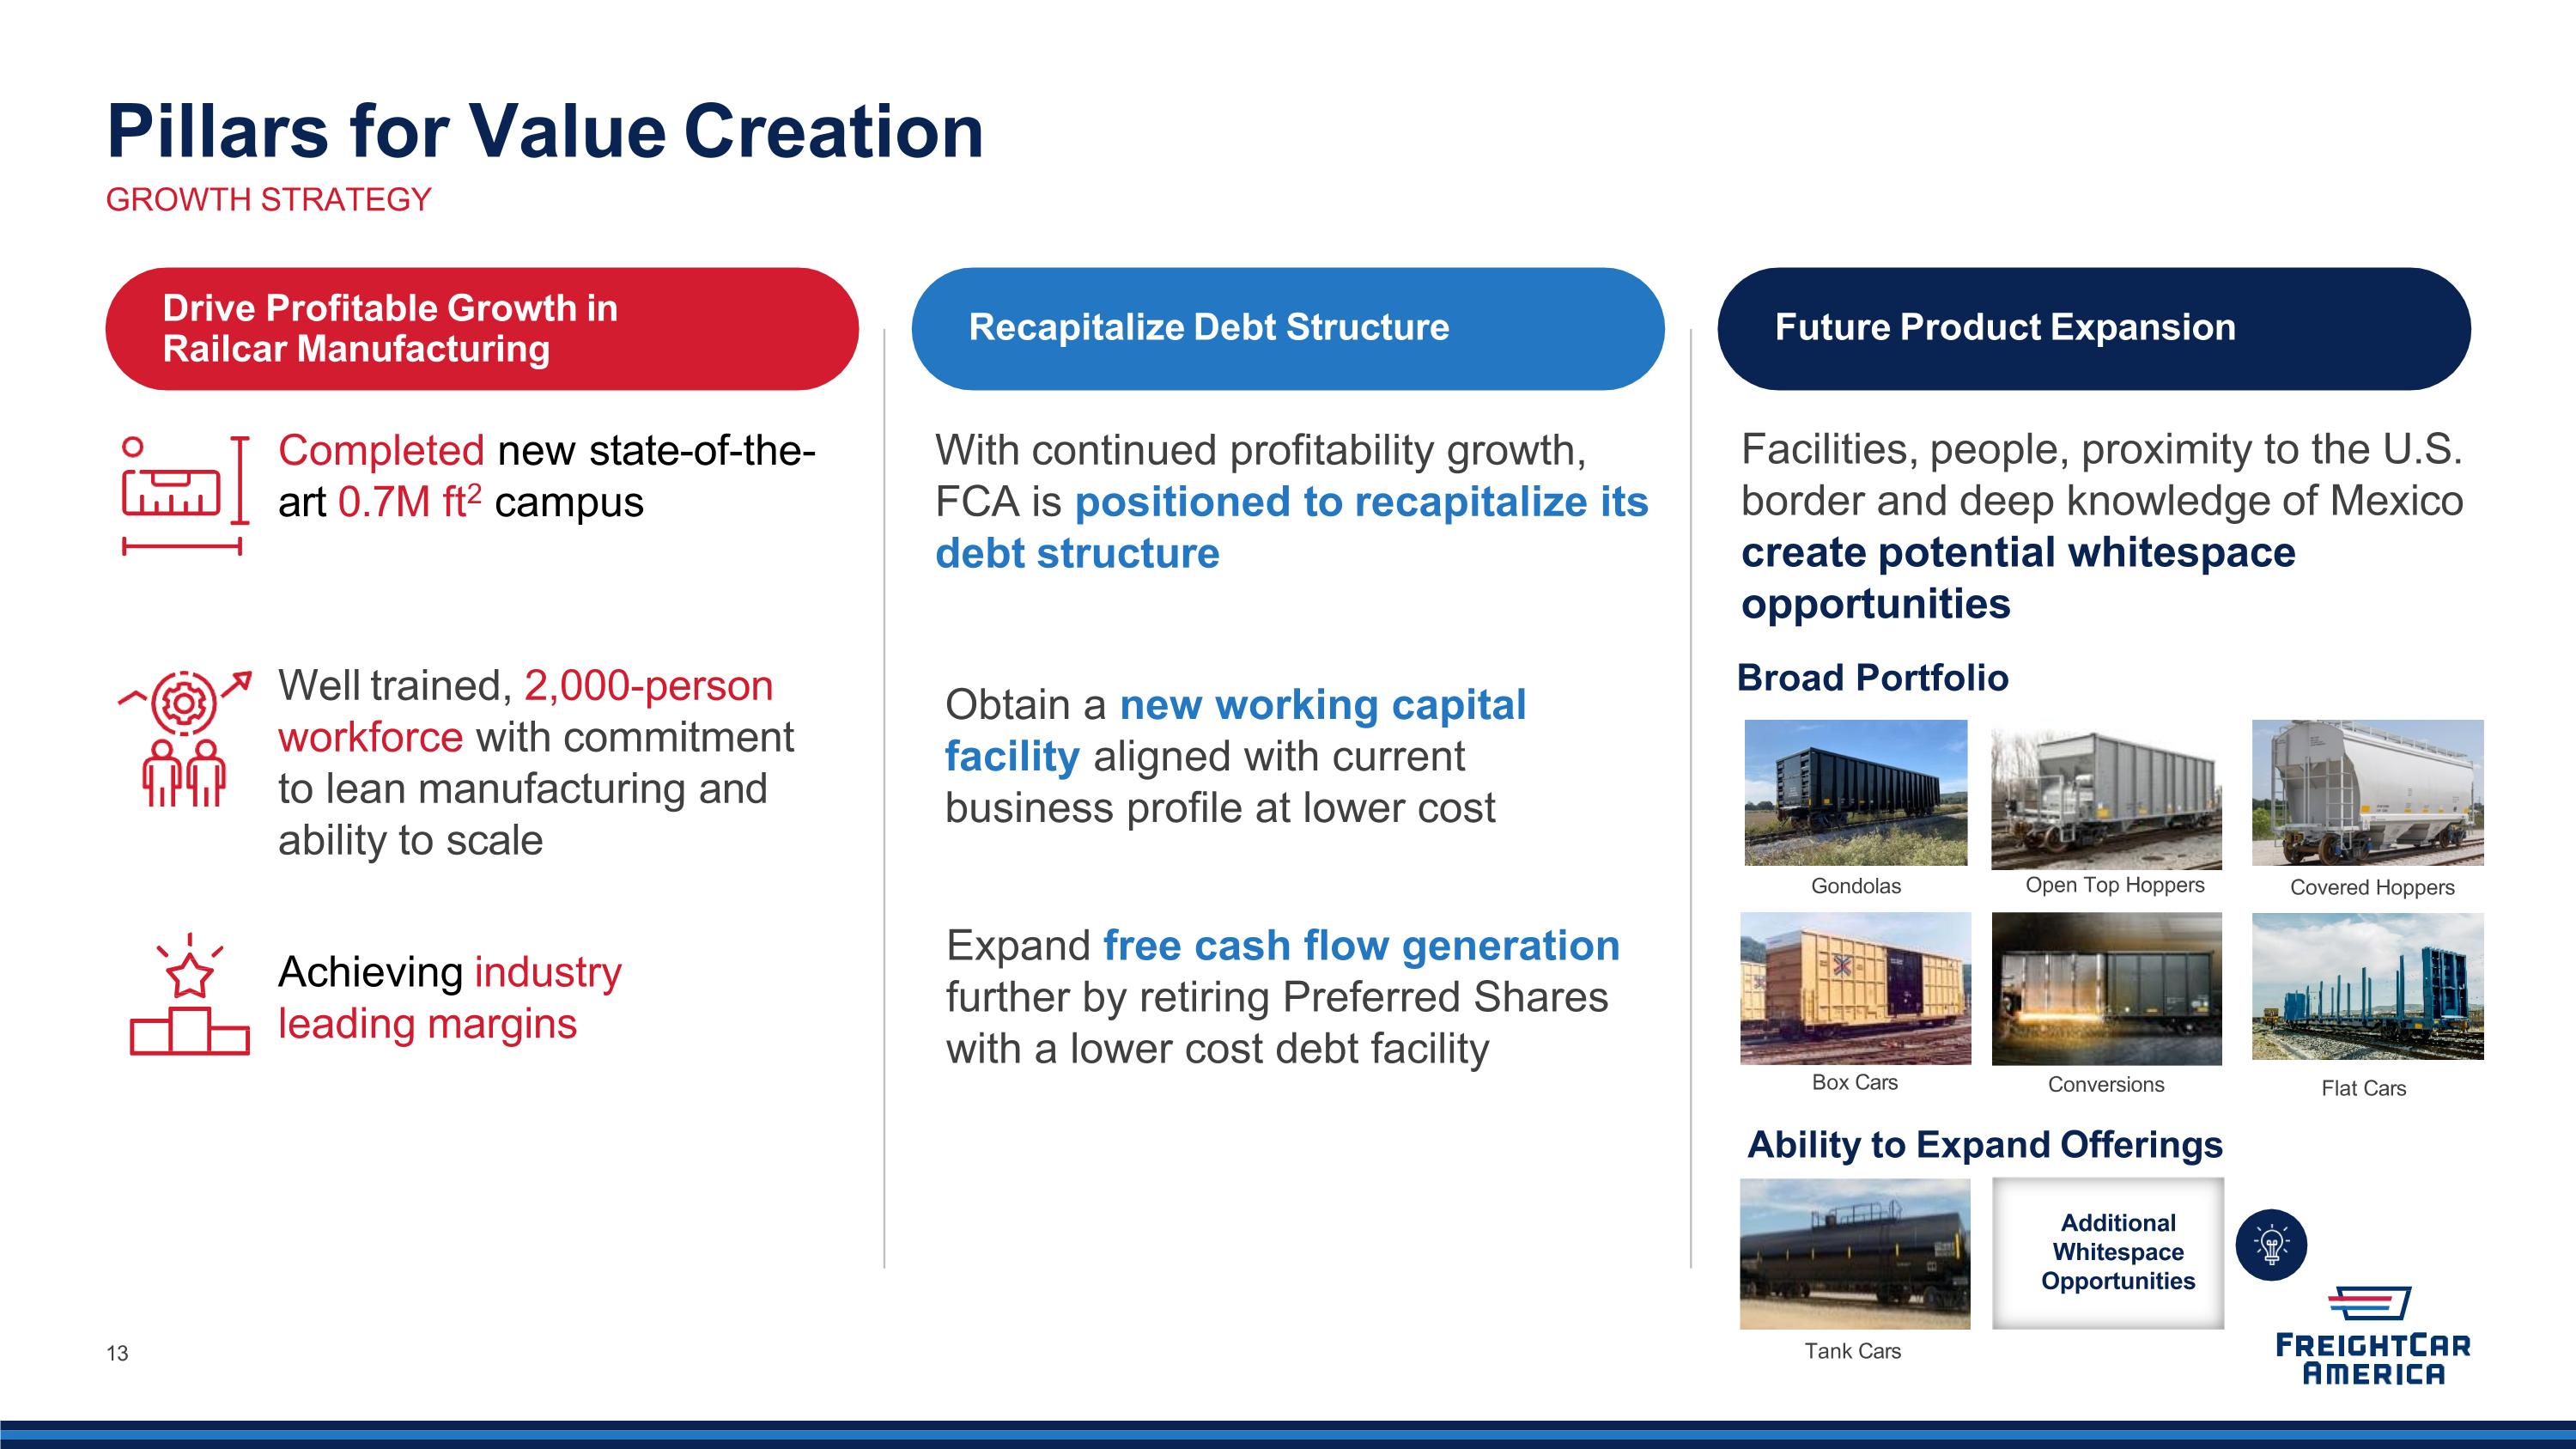
Obtain a new working capital facility aligned with current business profile at lower cost Pillars for Value Creation GROWTH STRATEGY With continued profitability growth, FCA is positioned to recapitalize its debt structure Completed new state-of-the-art 0.7M ft2 campus Well trained, 2,000-person workforce with commitment to lean manufacturing and ability to scale Achieving industry leading margins Facilities, people, proximity to the U.S. border and deep knowledge of Mexico create potential whitespace opportunities Broad Portfolio Drive Profitable Growth in Railcar Manufacturing Recapitalize Debt Structure Future Product Expansion Gondolas Open Top Hoppers Flat Cars Box Cars Conversions Additional Whitespace Opportunities Covered Hoppers Ability to Expand Offerings Tank Cars Expand free cash flow generation further by retiring Preferred Shares with a lower cost debt facility

Financial Overview
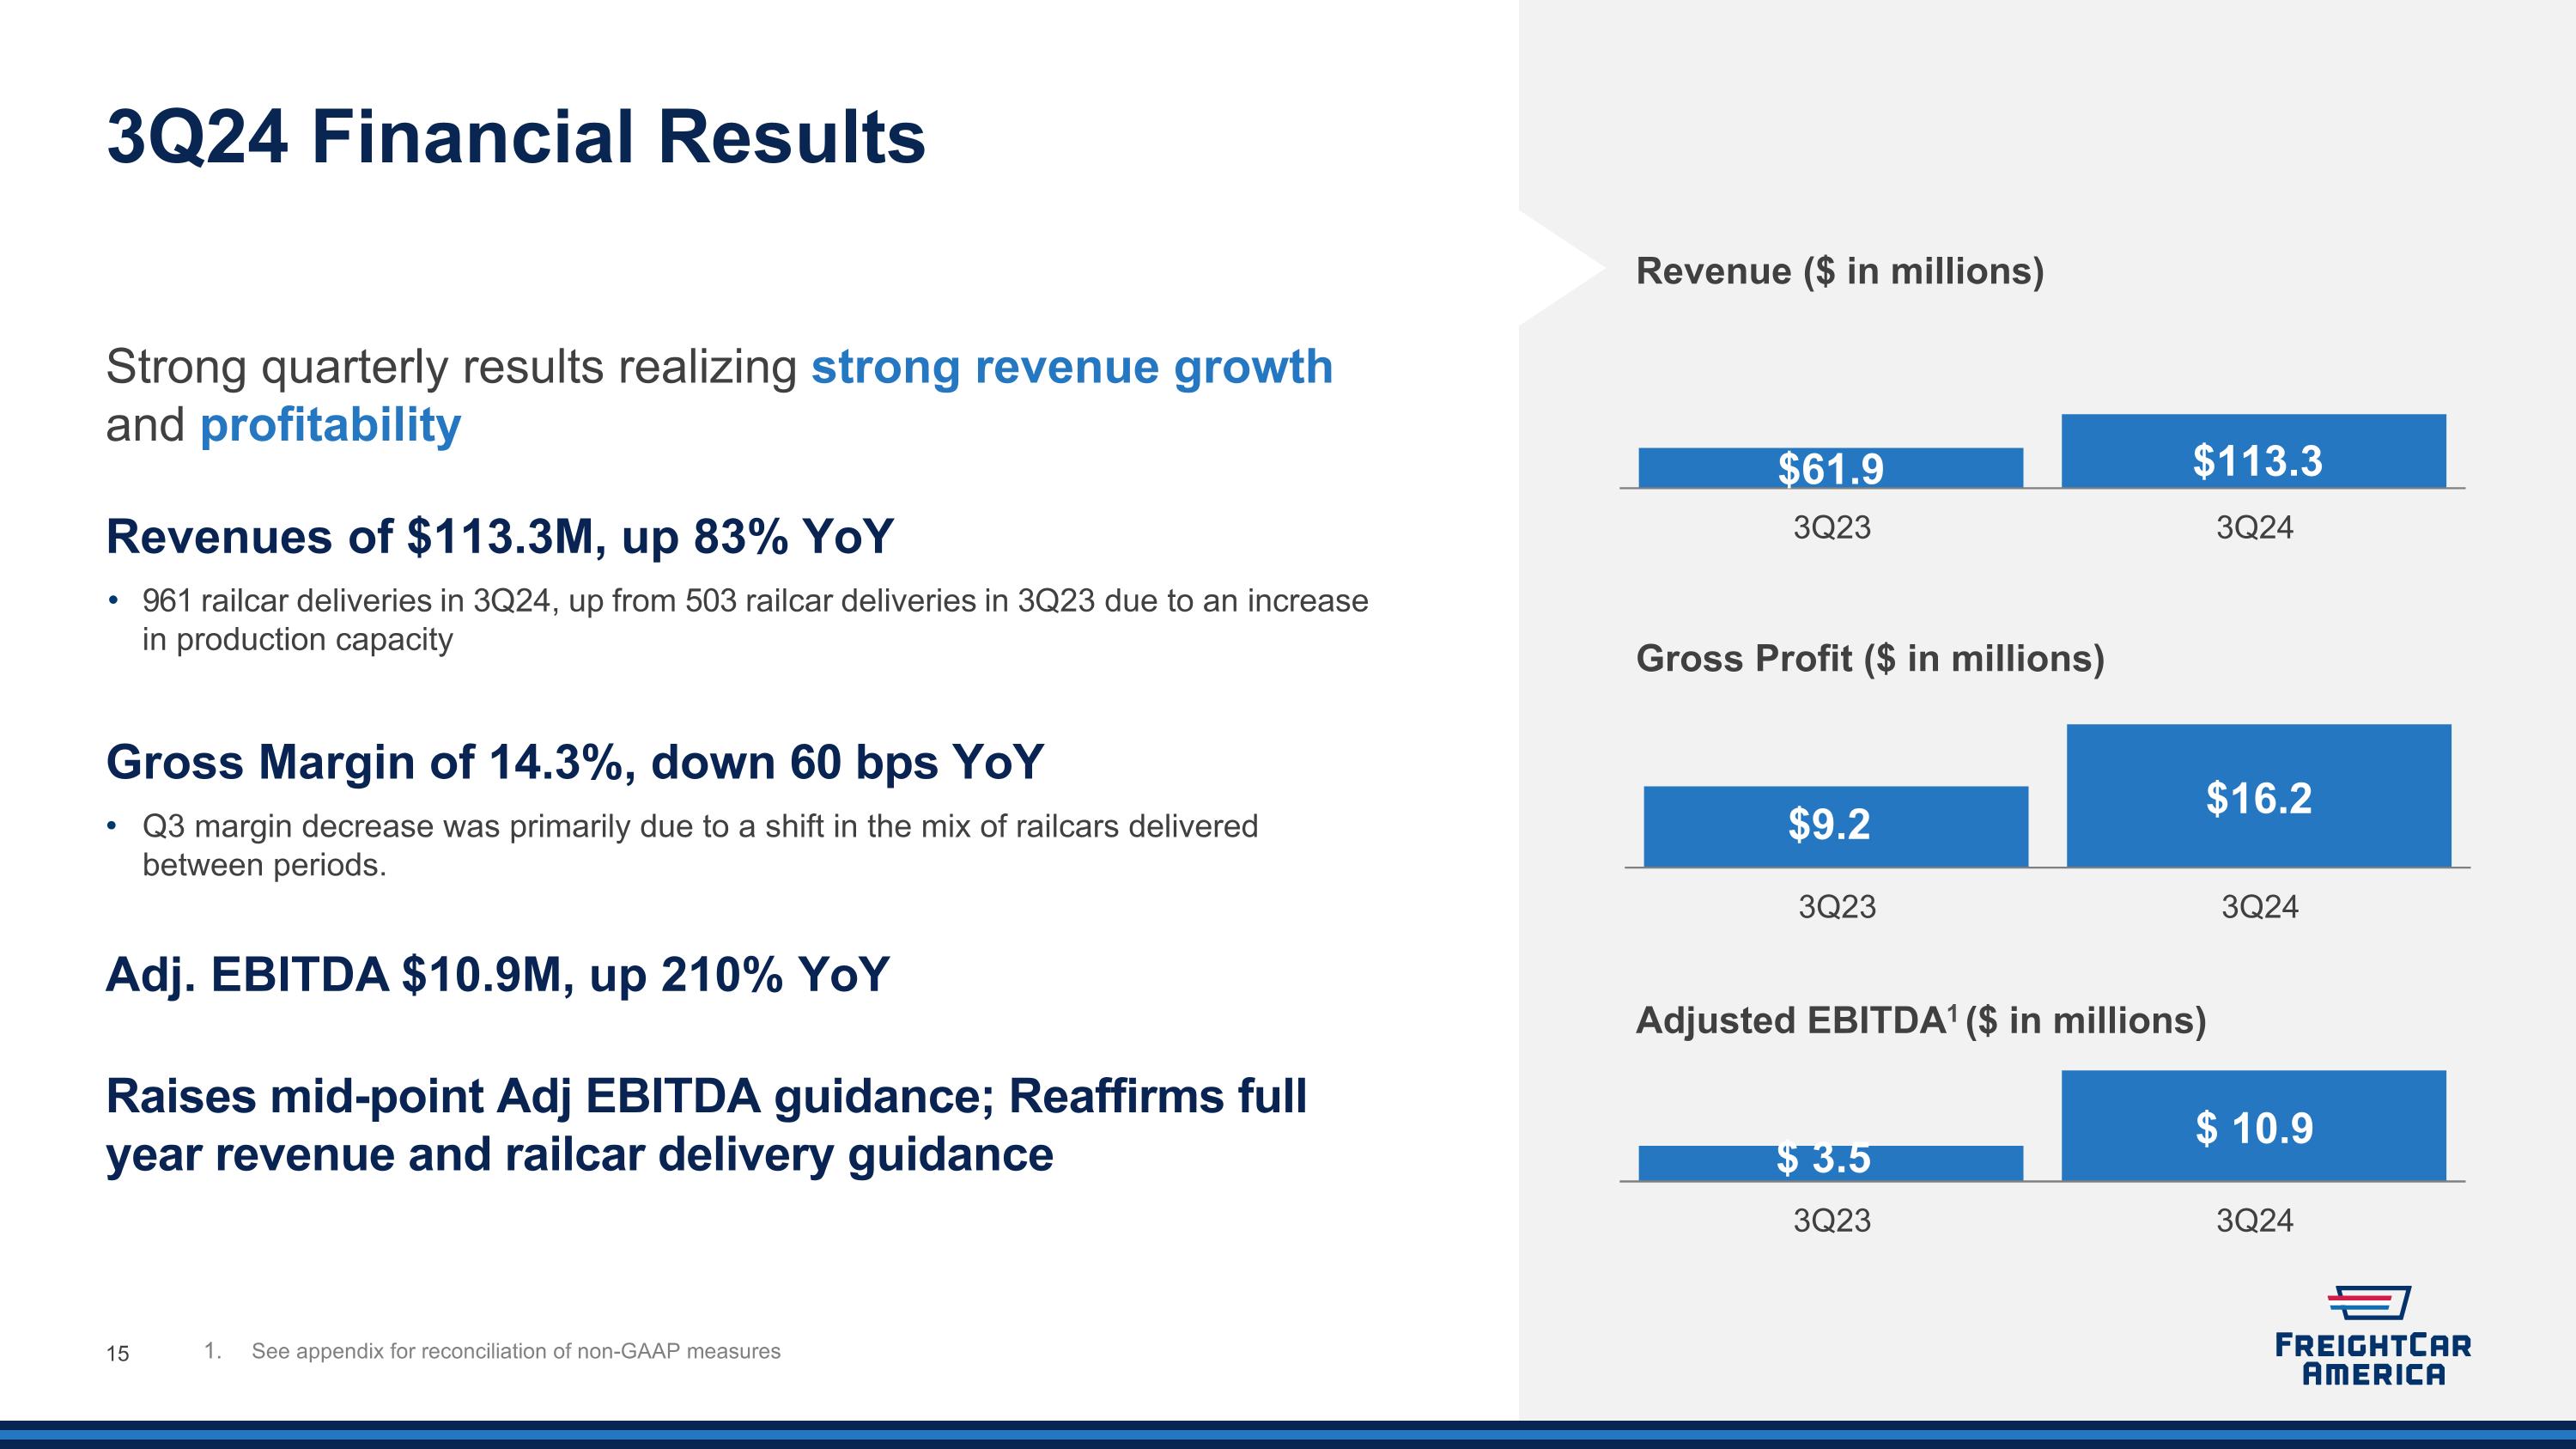
3Q24 Financial Results Adjusted EBITDA1 ($ in millions) Strong quarterly results realizing strong revenue growth and profitability 15 Revenue ($ in millions) Gross Profit ($ in millions) See appendix for reconciliation of non-GAAP measures Revenues of $113.3M, up 83% YoY 961 railcar deliveries in 3Q24, up from 503 railcar deliveries in 3Q23 due to an increase in production capacity Gross Margin of 14.3%, down 60 bps YoY Q3 margin decrease was primarily due to a shift in the mix of railcars delivered between periods. Adj. EBITDA $10.9M, up 210% YoY Raises mid-point Adj EBITDA guidance; Reaffirms full year revenue and railcar delivery guidance
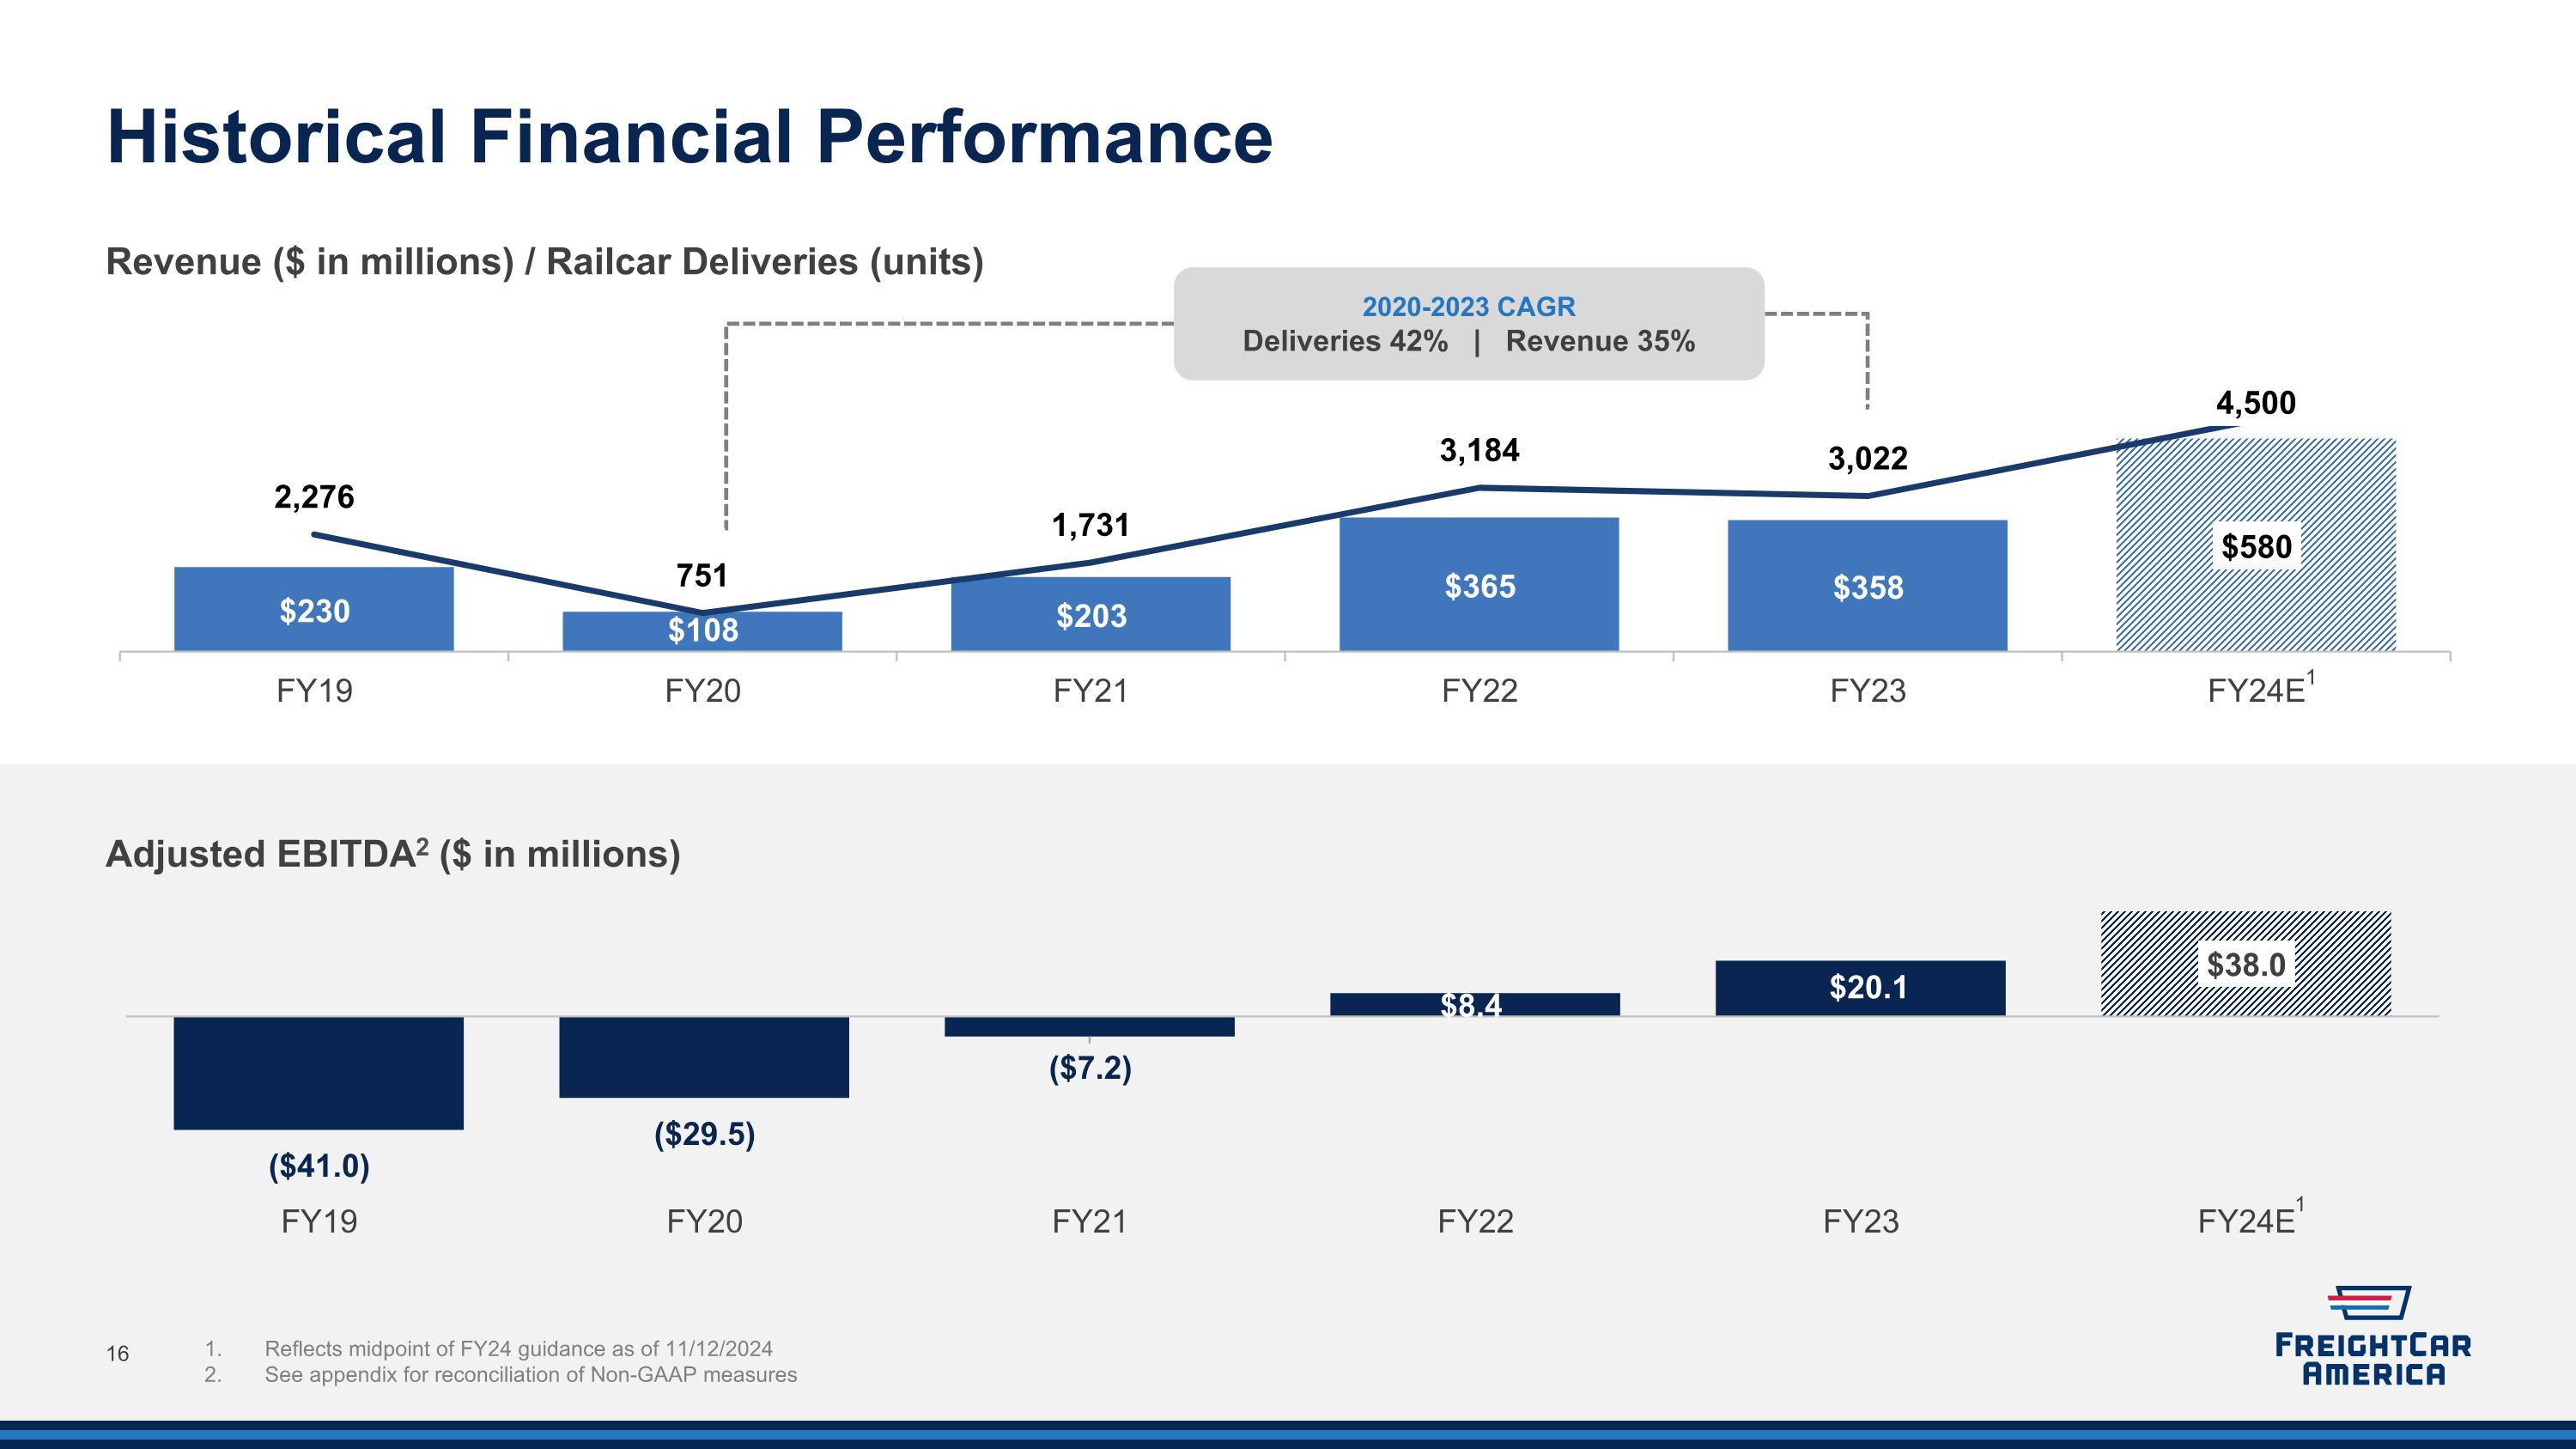
Historical Financial Performance Adjusted EBITDA2 ($ in millions) 16 1. Reflects midpoint of FY24 guidance as of 11/12/2024 2. See appendix for reconciliation of Non-GAAP measures Revenue ($ in millions) / Railcar Deliveries (units) 2020-2023 CAGR Deliveries 42% | Revenue 35% 1 1
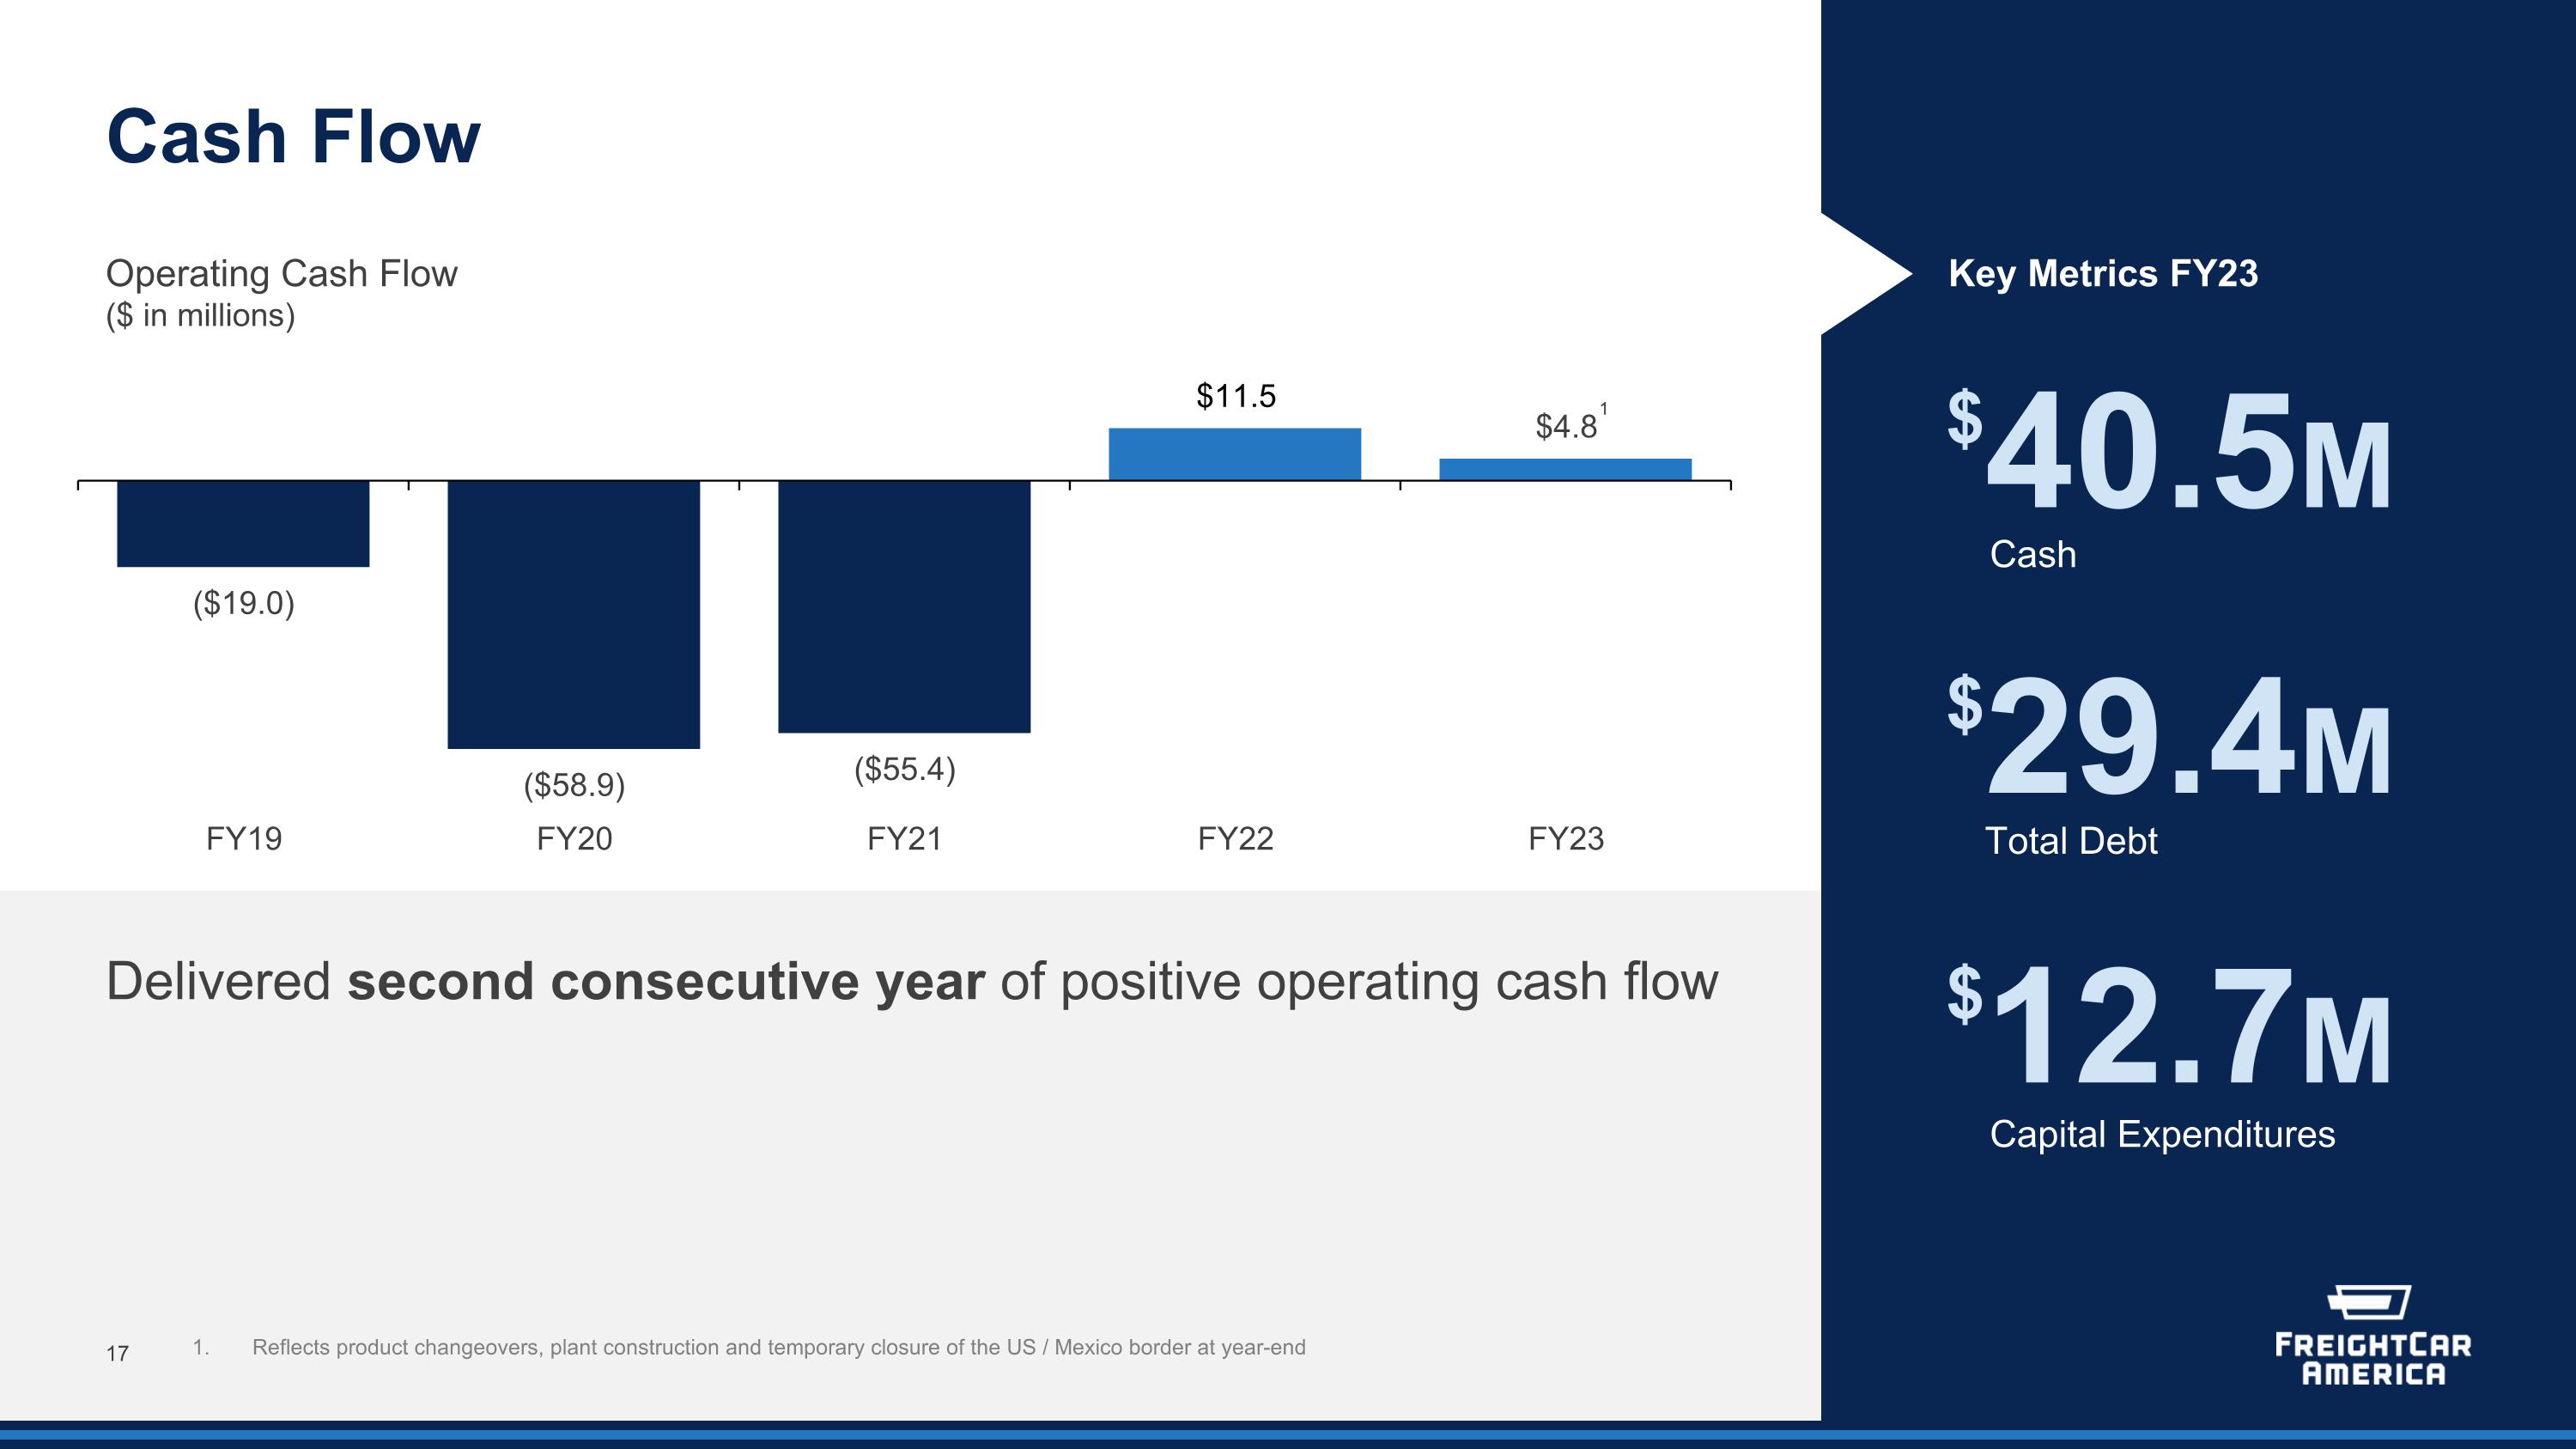
Cash Flow Operating Cash Flow ($ in millions) Key Metrics FY23 Delivered second consecutive year of positive operating cash flow $40.5M Cash $29.4M Total Debt $12.7M Capital Expenditures 17 1 1. Reflects product changeovers, plant construction and temporary closure of the US / Mexico border at year-end
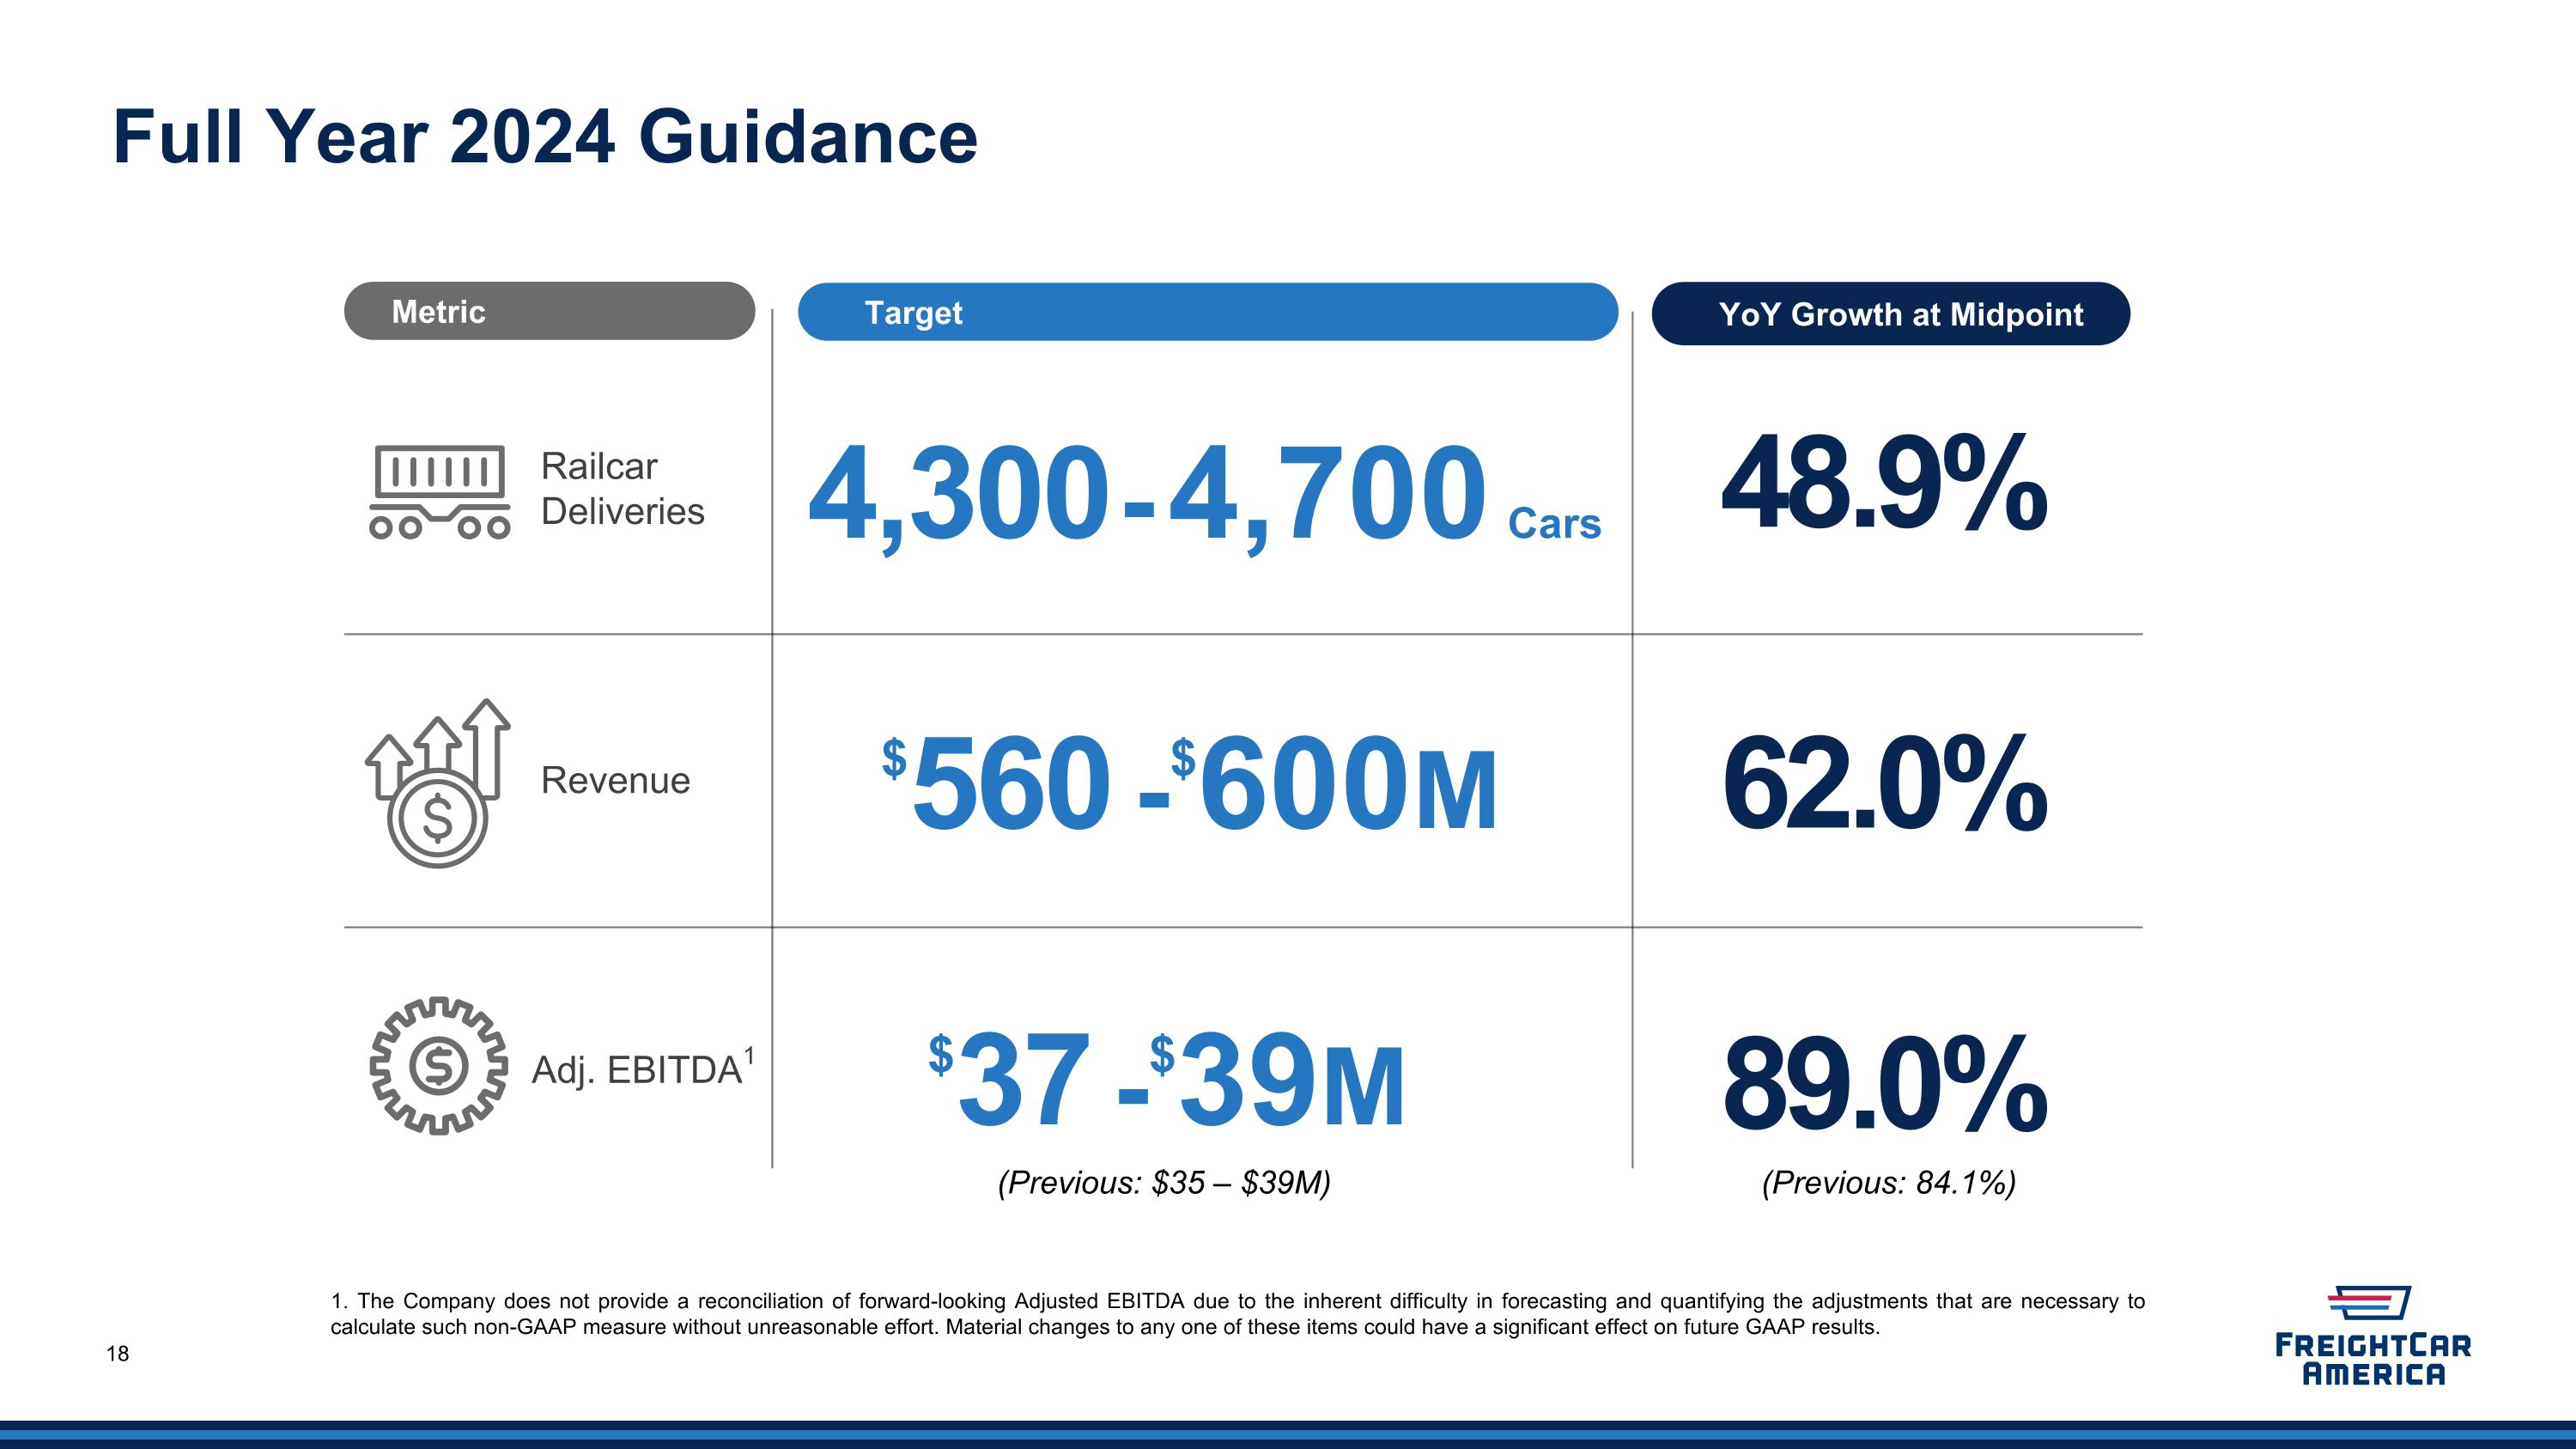
Full Year 2024 Guidance 18 Metric 4,300 - 4,700 $560 -$600M $37 -$39M Railcar Deliveries Revenue Adj. EBITDA1 Target YoY Growth at Midpoint Cars 1. The Company does not provide a reconciliation of forward-looking Adjusted EBITDA due to the inherent difficulty in forecasting and quantifying the adjustments that are necessary to calculate such non-GAAP measure without unreasonable effort. Material changes to any one of these items could have a significant effect on future GAAP results. 48.9% 62.0% 89.0% (Previous: $35 – $39M) (Previous: 84.1%)
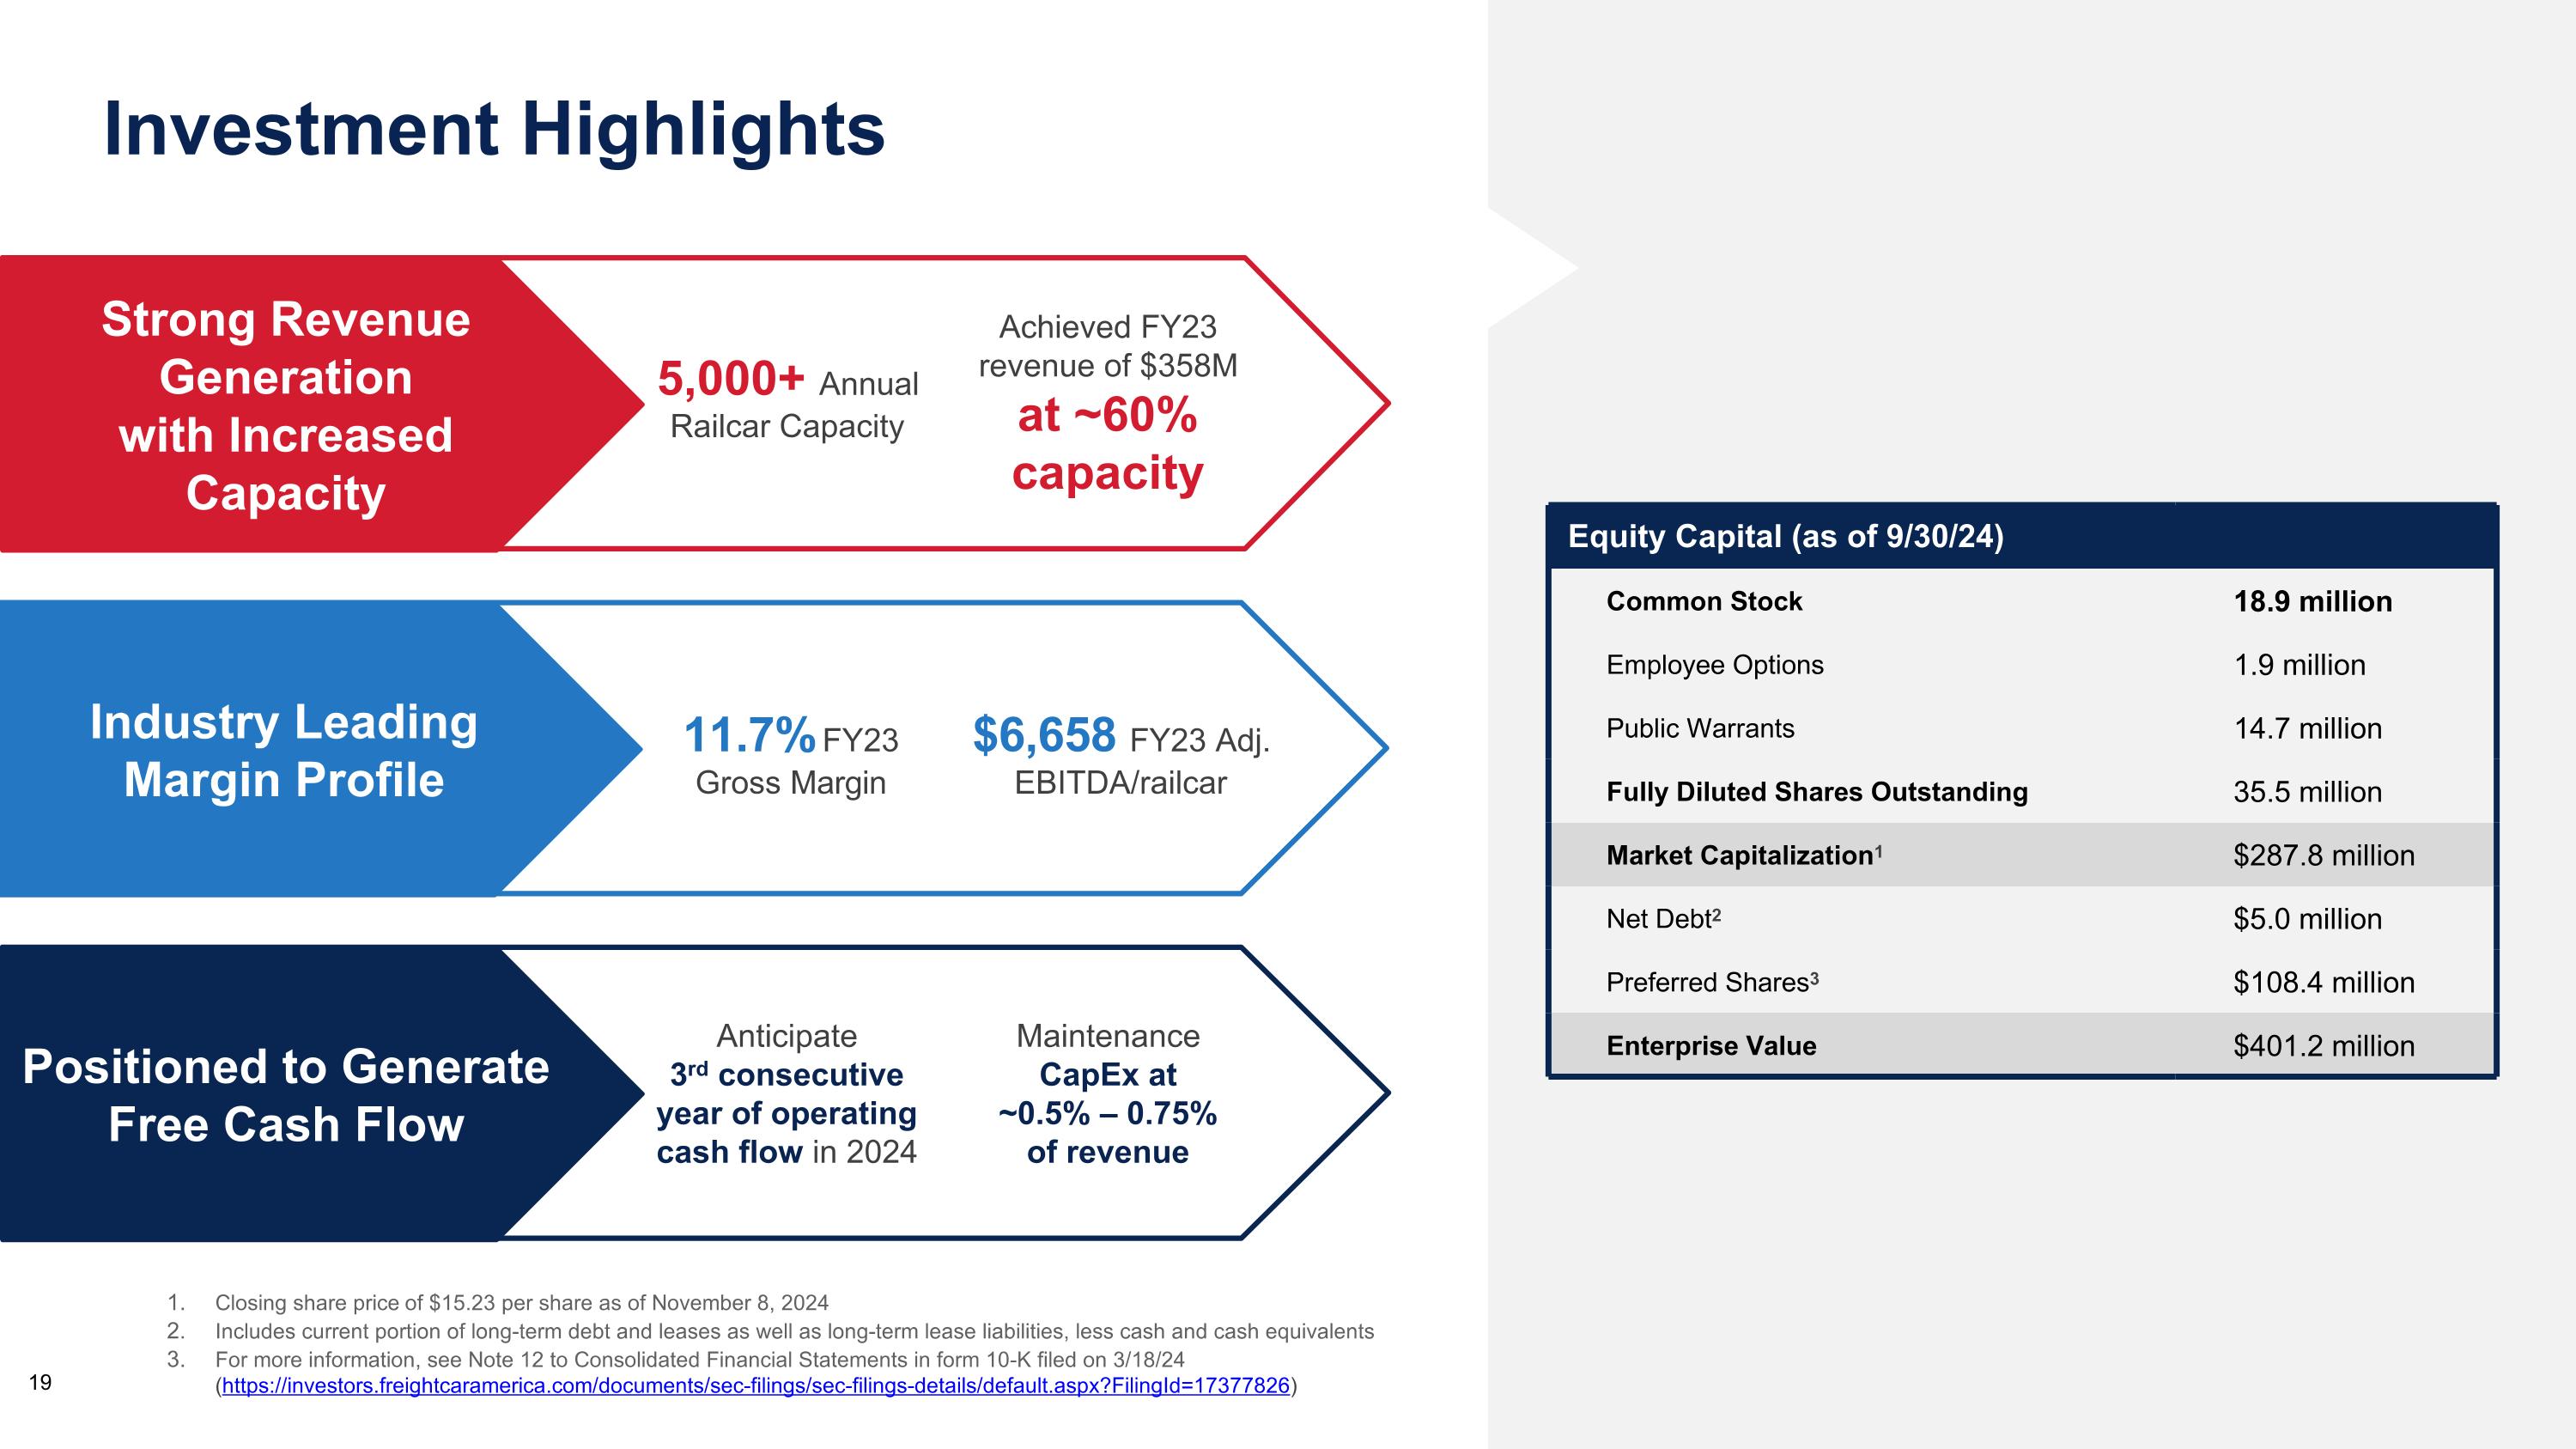
Revenue / Capacity Strong Revenue Generation �with Increased Capacity 5,000+ Annual Railcar Capacity Achieved FY23 revenue of $358M at ~60% capacity Investment Highlights Common Stock 18.9 million Employee Options 1.9 million Public Warrants 14.7 million Fully Diluted Shares Outstanding 35.5 million Market Capitalization1 $287.8 million Net Debt2 $5.0 million Preferred Shares3 $108.4 million Enterprise Value $401.2 million Closing share price of $15.23 per share as of November 8, 2024 Includes current portion of long-term debt and leases as well as long-term lease liabilities, less cash and cash equivalents For more information, see Note 12 to Consolidated Financial Statements in form 10-K filed on 3/18/24 (https://investors.freightcaramerica.com/documents/sec-filings/sec-filings-details/default.aspx?FilingId=17377826) Equity Capital (as of 9/30/24) Revenue / Capacity Industry Leading �Margin Profile 11.7% FY23 �Gross Margin $6,658 FY23 Adj. EBITDA/railcar Revenue / Capacity Positioned to Generate Free Cash Flow Anticipate 3rd consecutive year of operating cash flow in 2024 Maintenance CapEx at ~0.5% – 0.75% of revenue 19

Appendix
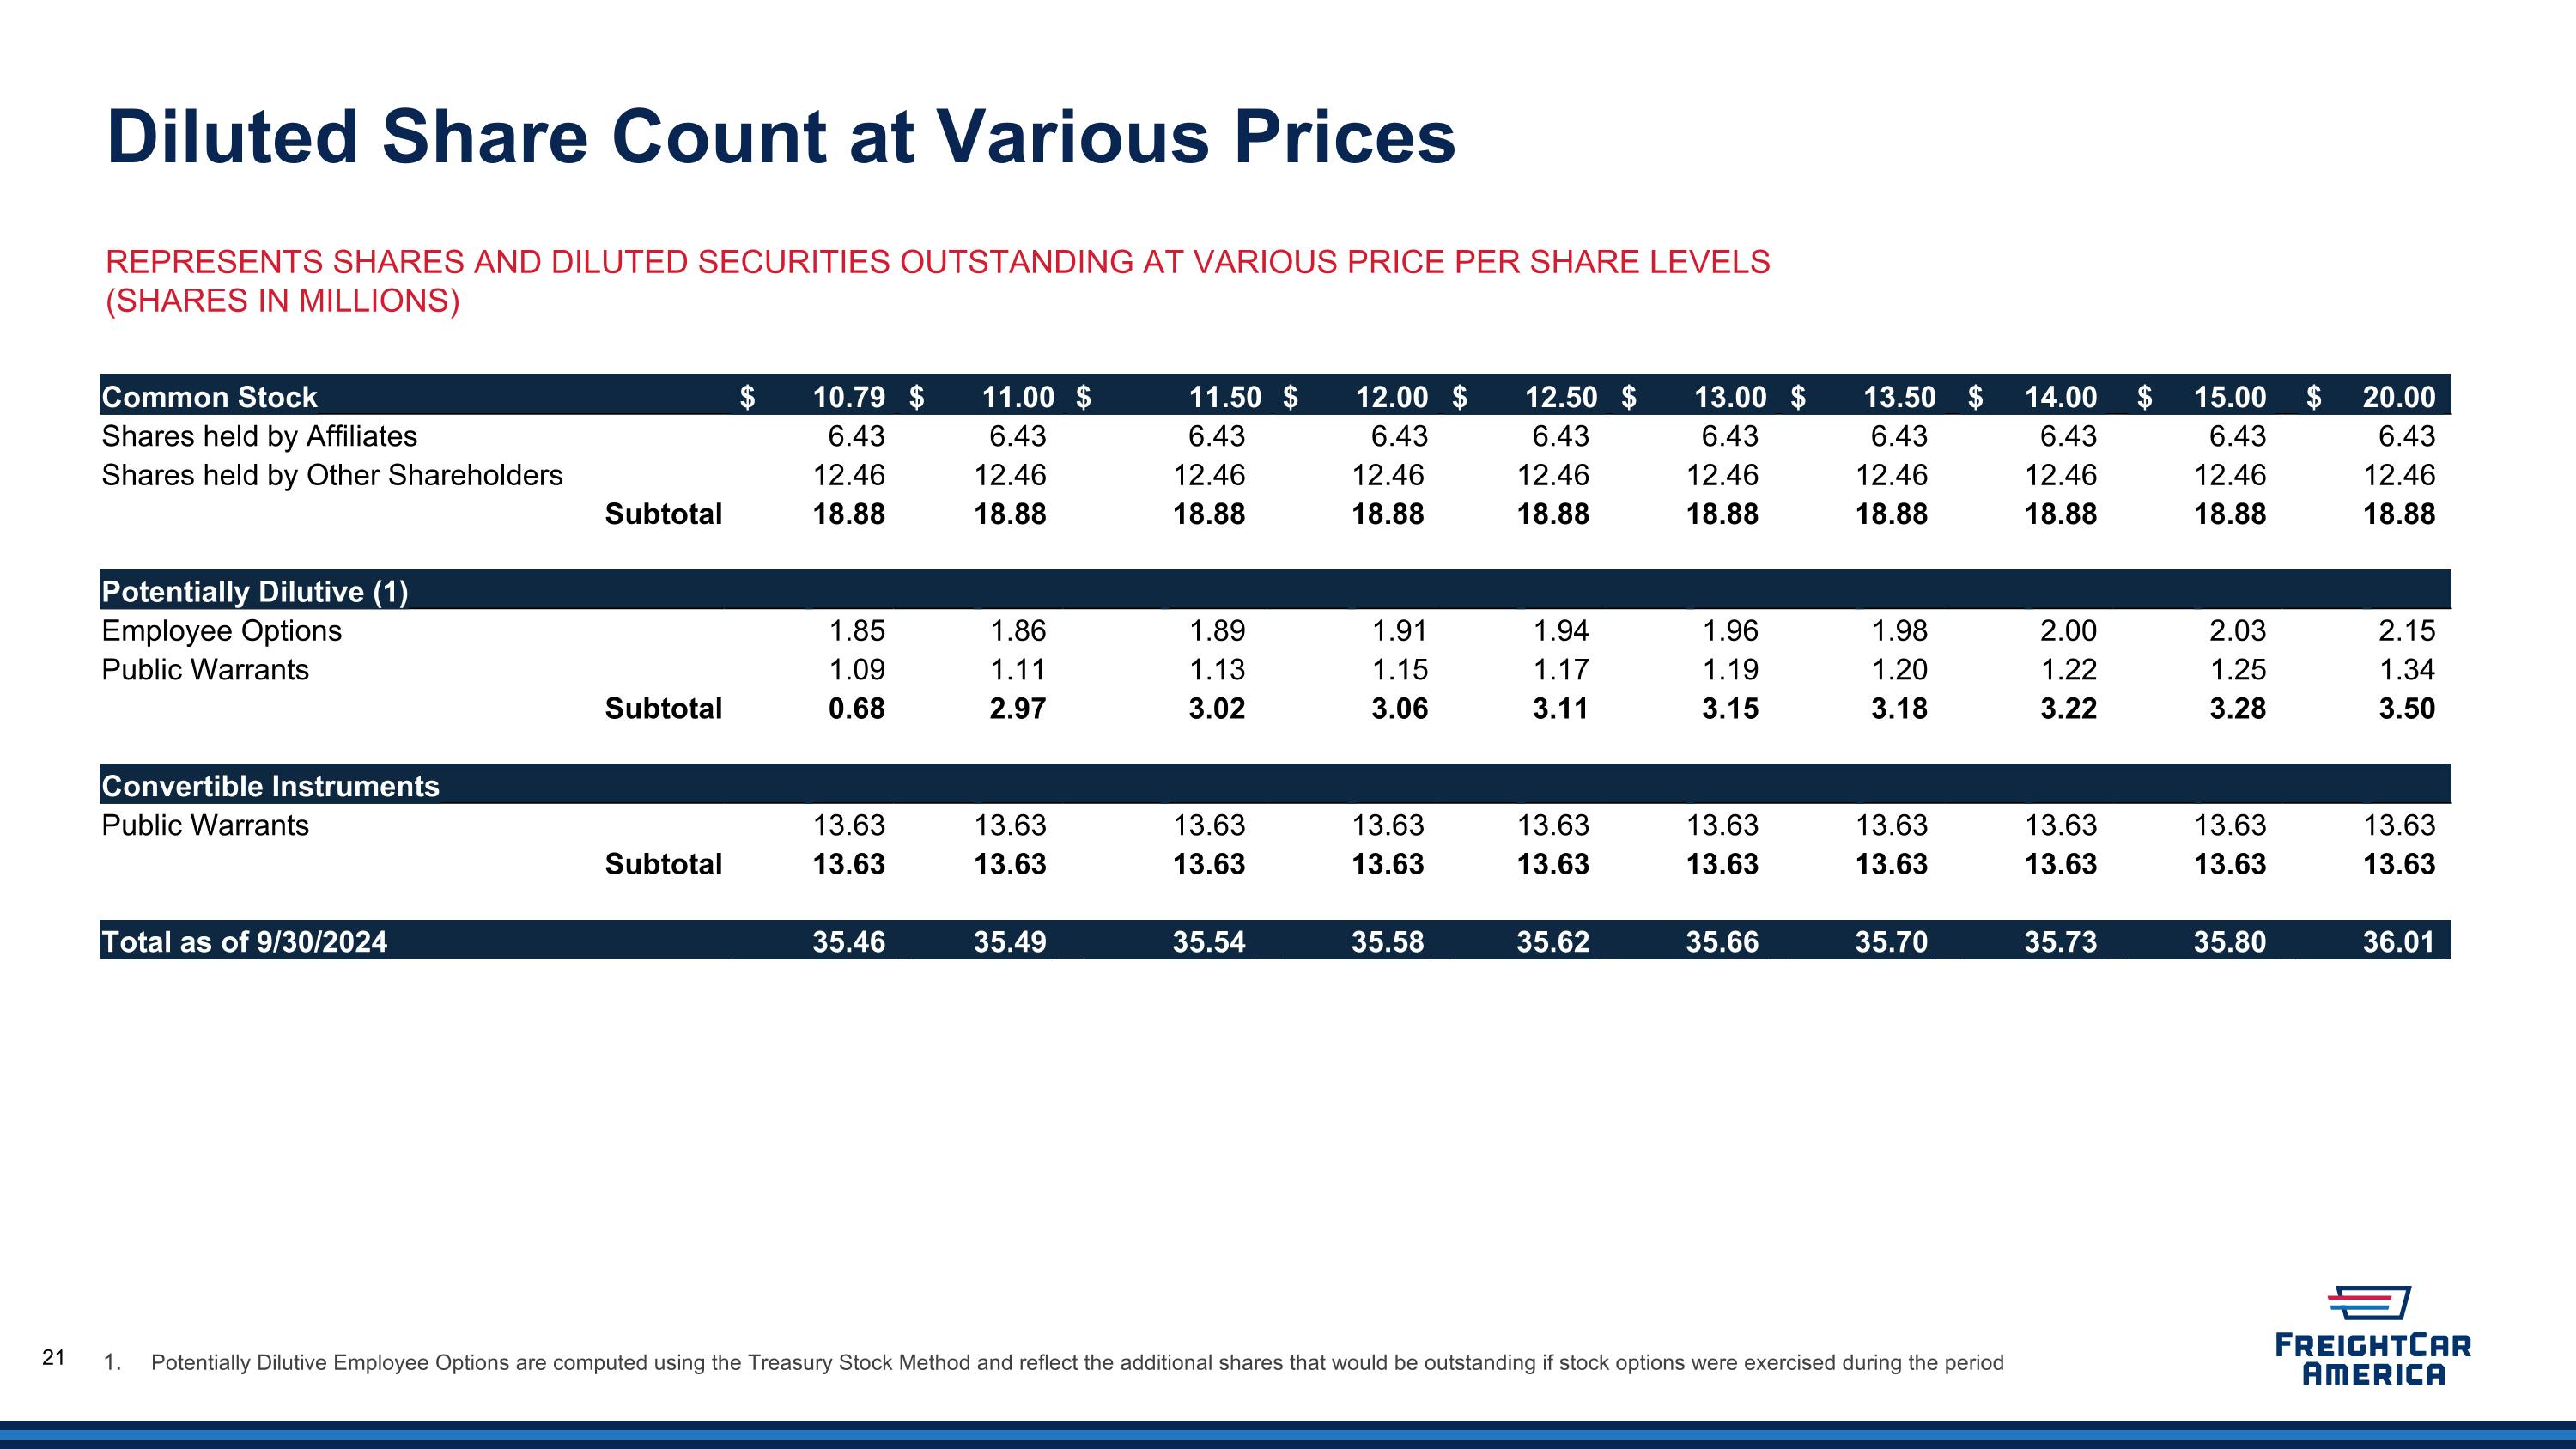
Common Stock $ 10.79 $ 11.00 $ 11.50 $ 12.00 $ 12.50 $ 13.00 $ 13.50 $ 14.00 $ 15.00 $ 20.00 Shares held by Affiliates 6.43 6.43 6.43 6.43 6.43 6.43 6.43 6.43 6.43 6.43 Shares held by Other Shareholders 12.46 12.46 12.46 12.46 12.46 12.46 12.46 12.46 12.46 12.46 Subtotal 18.88 18.88 18.88 18.88 18.88 18.88 18.88 18.88 18.88 18.88 Potentially Dilutive (1) Employee Options 1.85 1.86 1.89 1.91 1.94 1.96 1.98 2.00 2.03 2.15 Public Warrants 1.09 1.11 1.13 1.15 1.17 1.19 1.20 1.22 1.25 1.34 Subtotal 0.68 2.97 3.02 3.06 3.11 3.15 3.18 3.22 3.28 3.50 Convertible Instruments Public Warrants 13.63 13.63 13.63 13.63 13.63 13.63 13.63 13.63 13.63 13.63 Subtotal 13.63 13.63 13.63 13.63 13.63 13.63 13.63 13.63 13.63 13.63 Total as of 9/30/2024 35.46 35.49 35.54 35.58 35.62 35.66 35.70 35.73 35.80 36.01 Represents shares and diluted securities outstanding at various price per share levels �(Shares in millions) Diluted Share Count at Various Prices Potentially Dilutive Employee Options are computed using the Treasury Stock Method and reflect the additional shares that would be outstanding if stock options were exercised during the period 21
Reconciliation of Income (Loss) Before Taxes to EBITDA and Adjusted EBITDA EBITDA represents earnings before interest, taxes, depreciation and amortization. We believe EBITDA is useful to investors in evaluating our operating performance compared to that of other companies in our industry. In addition, our management uses EBITDA to evaluate our operating performance. The calculation of EBITDA eliminates the effects of financing, income taxes and the accounting effects of capital spending. These items may vary for different companies for reasons unrelated to the overall performance of the company’s business. EBITDA is not a financial measure presented in accordance with U.S. GAAP. Accordingly, when analyzing our operating performance, investors should not consider EBITDA in isolation or as a substitute for net income prepared in accordance with U.S. GAAP. Our calculation of EBITDA is not necessarily comparable to that of other similar titled measures reported by other companies 22 This adjustment removes the non-cash (income) expense associated with the change in fair market value of the warrant liability. During the second quarter of 2023, the Company recorded a non-cash loss on debt extinguishment of its term loan. During the third quarter of 2023, the Company recorded a non-cash loss on pension settlement. During the second quarter of 2024, the Company recorded a litigation settlement related to a dispute with a former lessee of our railcars. During the second quarter of 2023, the Company recorded a gain on sale of railcars available for lease related to its leased railcar fleet. Adjusted EBITDA represents EBITDA before the following charges: Three Months Ended September 30, Nine Months Ended September 30, 2024 2023 2024 2023 (Loss) / Income Before Income Taxes $(103,639) $3,409 $(107,113) $(19,846) Depreciation & Amortization 1,442 1,085 4,252 3,189 Interest Expense, Net 1,577 2,037 5,815 12,988 EBITDA (100,620) 6,531 (95,046) (3,669) Loss/(gain) on change in fair market value of Warrant (A) 110,040 (4,273) 125,581 1,869 Loss on Debt Extinguishment (B) 14,880 Loss on Pension Settlement (C) 313 313 Litigation Settlement (D) (3,214) Gain on Sale of Railcars Available for Lease (E) (622) Stock Based Compensation 804 715 2,330 524 Other, net 680 228 1,419 333 Adjusted EBITDA $10,904 $3,514 $29,070 $13,628
Reconciliation of Loss Before Taxes to EBITDA and Adjusted EBITDA EBITDA represents earnings before interest, taxes, depreciation and amortization. We believe EBITDA is useful to investors in evaluating our operating performance compared to that of other companies in our industry. In addition, our management uses EBITDA to evaluate our operating performance. The calculation of EBITDA eliminates the effects of financing, income taxes and the accounting effects of capital spending. These items may vary for different companies for reasons unrelated to the overall performance of the company’s business. EBITDA is not a financial measure presented in accordance with U.S. GAAP. Accordingly, when analyzing our operating performance, investors should not consider EBITDA in isolation or as a substitute for net income prepared in accordance with U.S. GAAP. Our calculation of EBITDA is not necessarily comparable to that of other similar titled measures reported by other companies 23 FY FY FY FY FY 2019 2020 2021 2022 2023 Loss Before Income Taxes $(75,353) $(85,899) $(40,034) $(36,535) $(22,088) Depreciation & Amortization 12,438 9,202 4,304 4,135 4,606 Interest Expense, Net 609 2,225 13,317 25,423 15,031 EBITDA (62,306) (74,472) (22,413) (6,977) (2,451) Loss/(gain) on change in fair market value of Warrant (A) 3,657 14,894 (1,486) 2,229 Restructuring and Impairment Charges (B) 22,371 18,325 6,530 Impairment on Leased Railcars (C) 18,951 158 4,515 4,091 Gain on OPEB Settlement (D) (6,637) (Gain)/Loss on Debt Extinguishment (E) (10,122) 14,880 Alabama Grant Amortization (F) (2,219) (2,219) (2,216) (1,857) Mexican Permanent VAT (G) 2,769 Loss on Pension Settlement (H) 8,105 313 Transaction Costs (I) 465 491 153 Startup Costs (J) 1,113 Consulting Costs (K) 129 1,073 Corporate Realignment (L) 1,323 Retention and Success (M) 144 3,130 Legal Reserve (N) 756 Plant Transition Costs (O) 2,239 2,386 Loss/(Gain) on Sale of Railcars Available for Lease (P) 7,266 (622) Stock Based Compensation (Q) 1,225 1,034 2,977 2,106 1,240 Other, Net (858) (576) (817) (2,426) 440 Adjusted EBITDA $(41,014) $(29,466) $(7,247) $8,411 $20,120
This adjustment removes the non-cash expense associated with the change in fair market value of warrant liability. Incurred certain restructuring costs related to severance and other costs related to shutdown of the Shoals and Roanoke facilities. During the fourth quarters of 2020, 2021, 2022 and 2023, recorded a non-cash impairment charge on leased railcar fleet. During the fourth quarter of 2019, recognized a non-cash gain on the settlement of the OPEB plan. Recorded a non-cash gain on extinguishment of PPP Loan in the third quarter of 2021, and a non-cash loss on debt extinguishment of term loan in the second quarter of 2023. Amortized deferred grant income to cost of goods sold that represents a non-cash reduction to gross margin (loss). Transitioned to tolling manufacturing structure in the third quarter of 2022 and as a result incurred permanent VAT costs. Recorded a non-cash pre-tax pension settlement loss in the third quarter of 2023 and 2022. Incurred certain costs in the fourth quarter of 2020 for nonrecurring professional services associated with the acquisition of Castaños joint venture. Incurred certain costs during 2022 related to new production line. Incurred certain non-recurring consulting costs during 2021 and 2022. Incurred certain non-recurring corporate realignment costs in 2022. m) During 2019, implemented retention and success bonus programs for certain employees during restructuring. During the first and fourth quarters of 2021, recognized charges related to a legal dispute. During 2020, implemented a program to shift production originally planned for U.S. plants to the Castaños facility. This adjustment represents non-recurring costs associated with moving inventory and equipment to the Castaños facility. Recognized a pre-tax loss on sale of railcars available for lease during 2019 and a pre-tax gain related to sales of leased railcar fleet in the second quarter of 2023. This adjustment removes the non-cash expense associated with the stock-based compensation. Reconciliation of Loss Before Taxes to EBITDA and Adjusted EBITDA Adjusted EBITDA represents EBITDA before the following charges:
We believe that Adjusted EBITDA is useful to investors evaluating our operating performance compared to that of other companies in our industry because it eliminates the impact of certain non-cash charges and other special items that affect the comparability of results in past quarters. Adjusted EBITDA is not a financial measure presented in accordance with U.S. GAAP. Accordingly, when analyzing our operating performance, investors should not consider Adjusted EBITDA in isolation or as a substitute for net income prepared in accordance with U.S. GAAP. Our calculation of Adjusted EBITDA is not necessarily comparable to that of other similarly titled measures reported by other companies. Reconciliation of Income (Loss) Before Taxes to EBITDA and Adjusted EBITDA

Thank you!