rblx-20230809
FALSE000131509800013150982023-08-092023-08-09

UNITED STATES
SECURITIES AND EXCHANGE COMMISSION
WASHINGTON, D.C. 20549
____________________________
FORM 8-K
____________________________
CURRENT REPORT
Pursuant to Section 13 or 15(d)
of the Securities Exchange Act of 1934
Date of Report (Date of earliest event reported): August 9, 2023
____________________________
Roblox Corporation
(Exact name of Registrant as Specified in Its Charter)
____________________________
Delaware001-3976320-0991664
(State or Other Jurisdiction
of Incorporation)
(Commission
File Number)
(IRS Employer
Identification No.)
970 Park Place,
San Mateo, California
94403
(Address of Principal Executive Offices)(Zip Code)
Registrant’s Telephone Number, Including Area Code: (888) 858-2569
Not Applicable
(Former Name or Former Address, if Changed Since Last Report)
____________________________
Check the appropriate box below if the Form 8-K filing is intended to simultaneously satisfy the filing obligation of the registrant under any of the following provisions:
Written communications pursuant to Rule 425 under the Securities Act (17 CFR 230.425)
Soliciting material pursuant to Rule 14a-12 under the Exchange Act (17 CFR 240.14a-12)
Pre-commencement communications pursuant to Rule 14d-2(b) under the Exchange Act (17 CFR 240.14d-2(b))
Pre-commencement communications pursuant to Rule 13e-4(c) under the Exchange Act (17 CFR 240.13e-4(c))
Securities registered pursuant to Section 12(b) of the Act:
Title of each class
Trading
Symbol(s)
Name of each exchange
on which registered
Class A Common Stock, $0.0001 par valueRBLXThe New York Stock Exchange
Indicate by check mark whether the registrant is an emerging growth company as defined in Rule 405 of the Securities Act of 1933 (§ 230.405 of this chapter) or Rule 12b-2 of the Securities Exchange Act of 1934 (§ 240.12b-2 of this chapter).
Emerging growth company  
If an emerging growth company, indicate by check mark if the registrant has elected not to use the extended transition period for complying with any new or revised financial accounting standards provided pursuant to Section 13(a) of the Exchange Act.  ☐


Item 2.02    Results of Operations and Financial Condition.
On August 9, 2023, Roblox Corporation (the “Company”) issued a press release announcing financial results for its second quarter ended June 30, 2023. The Company also posted on its investor relations website (ir.roblox.com) a shareholder letter and supplemental materials for its second quarter ended June 30, 2023. A copy of the press release and shareholder letter are furnished as Exhibit 99.1 and Exhibit 99.2, respectively, to this Current Report on Form 8-K and are incorporated by reference herein. Information on the Company’s website is not, and will not be deemed, a part of this report or incorporated into this or any other filings that the Company makes with the Securities and Exchange Commission.
The information in Item 2.02 of this Current Report on Form 8-K, including Exhibit 99.1 and Exhibit 99.2 attached hereto, shall not be deemed “filed” for purposes of Section 18 of the Securities Exchange Act of 1934, as amended (the “Exchange Act”) or otherwise subject to the liabilities of that section, nor shall it be deemed incorporated by reference in any filing under the Securities Act of 1933, as amended, or the Exchange Act, except as shall be expressly set forth by specific reference in such a filing.
Item 9.01    Financial Statements and Exhibits.
(d)Exhibits
Exhibit
Number
Description
99.1
99.2
104Cover Page Interactive Data File (formatted as inline XBRL)
1


SIGNATURES
Pursuant to the requirements of the Securities Exchange Act of 1934, the registrant has duly caused this report to be signed on its behalf by the undersigned thereunto duly authorized.
ROBLOX CORPORATION
Date: August 9, 2023By:/s/ Michael Guthrie
Michael Guthrie
Chief Financial Officer
(Principal Financial Officer)
2


Exhibit 99.1
roblox_logox2022-11.jpg
Roblox Reports Second Quarter 2023 Financial Results
Strong year over year growth in Daily Active Users, Hours Engaged, Revenue, and Bookings
SAN MATEO, Calif., August 9, 2023 - Roblox Corporation (NYSE: RBLX), a global platform bringing millions of people together through shared experiences, released its second quarter 2023 financial and operational results today. Separately, Roblox posted a letter to shareholders and supplemental materials on the Roblox investor relations website at ir.roblox.com.
Second Quarter 2023 Financial and Operational Highlights
Revenue was $680.8 million, up 15% year-over-year, and up 17% year-over-year on a constant currency basis1.
Bookings were $780.7 million, up 22% year-over-year, and also up 22% year-over-year on a constant currency basis1.
Net loss attributable to common stockholders was $282.8 million.
Net cash provided by operating activities was $28.4 million.
Average Daily Active Users (“DAUs”) were 65.5 million, up 25% year-over-year.
Average monthly unique payers were 13.5 million, up 19% year-over-year.
Hours engaged were 14.0 billion, up 24% year-over-year.
Average bookings per DAU (“ABPDAU”) was $11.92, down 3% year-over-year, and down 2% year-over-year on a constant currency basis1. Average bookings per monthly unique payer was $19.32, up 3% year-over-year, and also up 3% year-over-year on a constant currency basis1.
“We continue to drive high rates of organic growth in DAUs, Hours, and Bookings. We are growing among users of all ages and across all geographies. We remain focused on extending our product leadership to drive value for creators and brands, and even more innovative and immersive avatars and experiences for our users,” said David Baszucki, founder and CEO of Roblox.
“This is our second consecutive quarter with year-over-year bookings growth in the low-20s. During the quarter, we also built the plans that we believe will enable us to generate operating leverage against infrastructure and trust & safety spend starting next quarter and against compensation expense starting in the first quarter of 2024,” said Michael Guthrie, chief financial officer of Roblox.
Earnings Q&A Session
Roblox will host a live Q&A session to answer questions regarding their second quarter 2023 results on Wednesday, August 9, 2023 at 5:30 a.m. Pacific Time/8:30 a.m. Eastern Time. The webcast will be open to the public at ir.roblox.com or by clicking here.
1 Constant currency is calculated by converting our current period revenue, bookings, ABPDAU, and average bookings per monthly unique payer into U.S. dollars using the comparative prior period’s monthly exchange rates for our non-USD currencies, rather than the actual average exchange rates in effect during the current period. By adjusting revenue, bookings, ABPDAU, and average bookings per monthly unique payer for constant currency, we are able to provide a framework for assessing how our business performed excluding the effect of foreign currency rate fluctuations.


Forward-Looking Statements
This press release contains “forward-looking statements” within the meaning of the “safe harbor” provisions of the Private Securities Litigation Reform Act of 1995, including but not limited to, statements regarding our vision to connect our users, our efforts to improve the Roblox Platform, our immersive advertising efforts, the use of artificial intelligence (“AI”) on our platform, branding and new partnerships, our business, product, strategy and user growth, our investment strategy, including our opportunities for and expectations of improvements in financial and operating metrics, including operating leverage, our expectation of successfully executing such strategies and plans, disclosures and future growth rates, and our expectations of future net losses and net cash generation from operating activities, and statements by our Chief Executive Officer and Chief Financial Officer. These forward-looking statements are made as of the date they were first issued and were based on current plans, expectations, estimates, forecasts, and projections as well as the beliefs and assumptions of management. Words such as “expect,” “vision,” “envision,” “anticipate,” “maintain,” “should,” “believe,” “continue,” “plan,” “goal,” “opportunity,” “estimate,” “predict,” “may,” “will,” “could,” and “would,” and variations of these terms or the negative of these terms and similar expressions are intended to identify these forward-looking statements. Forward-looking statements are subject to a number of risks and uncertainties, many of which involve factors or circumstances that are beyond our control. Our actual results could differ materially from those stated or implied in forward-looking statements due to a number of factors, including but not limited to risks detailed in our filings with the Securities and Exchange Commission (the “SEC”), including our annual reports on Form 10-K, our quarterly reports on Form 10-Q and other filings and reports we make with the SEC from time to time. In particular, the following factors, among others, could cause results to differ materially from those expressed or implied by such forward-looking statements: our ability to successfully execute our business and growth strategy; the sufficiency of our cash and cash equivalents to meet our liquidity needs, including the repayment of our senior notes; the demand for our platform in general; our ability to retain and increase our number of users, developers, and creators; the impact of the COVID-19 pandemic and the easing of restrictions related to the COVID-19 pandemic; the impact of inflation and global economic conditions on our operations; the impact of changing legal and regulatory requirements on our business; our ability to develop enhancements to our platform, and bring them to market in a timely manner; our ability to develop and protect our brand and build new partnerships; any misuse of user data or other undesirable activity by third parties on our platform; our ability to maintain the security and availability of our platform; our ability to detect and minimize unauthorized use of our platform; and the impact of AI on our platform, users, creators and developers. Additional information regarding these and other risks and uncertainties that could cause actual results to differ materially from our expectations is included in the reports we have filed or will file with the SEC, including our annual reports on Form 10-K and our quarterly reports on Form 10-Q.
The forward-looking statements included in this press release represent our views as of the date of this press release. We anticipate that subsequent events and developments will cause our views to change. However, we undertake no intention or obligation to update or revise any forward-looking statements, whether as a result of new information, future events or otherwise. These forward-looking statements should not be relied upon as representing our views as of any date subsequent to the date of this press release.


ROBLOX CORPORATION
CONDENSED CONSOLIDATED BALANCE SHEETS
(in thousands, except par values)
(unaudited)
As of
June 30, 2023December 31, 2022
Assets
Current assets:
Cash and cash equivalents$520,264 $2,977,474 
Short-term investments1,599,602 — 
Accounts receivable—net of allowances257,355 379,353 
Prepaid expenses and other current assets69,107 61,641 
Deferred cost of revenue, current portion447,962 420,136 
Total current assets2,894,290 3,838,604 
Long-term investments904,897 — 
Property and equipment—net684,734 592,346 
Operating lease right-of-use assets674,928 526,030 
Deferred cost of revenue, long-term235,903 225,132 
Intangible assets, net59,176 54,717 
Goodwill134,335 134,335 
Other assets11,014 4,323 
Total assets$5,599,277 $5,375,487 
Liabilities and Stockholders’ equity
Current liabilities:
Accounts payable$72,829 $71,182 
Accrued expenses and other current liabilities216,273 236,006 
Developer exchange liability220,548 231,704 
Deferred revenue—current portion2,117,043 1,941,943 
Total current liabilities2,626,693 2,480,835 
Deferred revenue—net of current portion1,149,346 1,095,291 
Operating lease liabilities641,664 494,590 
Long-term debt, net1,004,335 988,984 
Other long-term liabilities13,039 10,752 
Total liabilities5,435,077 5,070,452 
Stockholders’ equity
Common stock, $0.0001 par value; 5,000,000 authorized as of June 30, 2023 and December 31, 2022, 616,301 and 604,674 shares issued and outstanding as of June 30, 2023 and December 31, 2022, respectively; Class A common stock—4,935,000 shares authorized as of June 30, 2023 and December 31, 2022, 566,215 and 553,337 shares issued and outstanding as of June 30, 2023 and December 31, 2022, respectively; Class B common stock—65,000 shares authorized as of June 30, 2023 and December 31, 2022, 50,086 and 51,337 shares issued and outstanding as of June 30, 2023 and December 31, 2022, respectively
60 59 
Additional paid-in capital2,641,929 2,213,603 
Accumulated other comprehensive income/(loss)(14,095)671 
Accumulated deficit(2,459,397)(1,908,307)
Total Roblox Corporation Stockholders’ equity168,497 306,026 
Noncontrolling interests(4,297)(991)
Total Stockholders’ equity164,200 305,035 
Total Liabilities and Stockholders’ equity$5,599,277 $5,375,487 


ROBLOX CORPORATION
CONDENSED CONSOLIDATED STATEMENTS OF OPERATIONS
(in thousands, except per share amounts)
(unaudited)
 Three Months EndedSix Months Ended
June 30,June 30,
 2023202220232022
Revenue(1)
$680,766 $591,207 $1,336,110 $1,128,341 
Cost and expenses:
Cost of revenue(1)(2)
162,029 143,157 313,870 278,789 
Developer exchange fees165,843 143,148 348,283 290,270 
Infrastructure and trust & safety225,039 158,235 436,083 299,590 
Research and development315,319 211,757 590,856 389,519 
General and administrative96,197 78,676 193,771 136,448 
Sales and marketing30,328 26,501 57,083 55,603 
Total cost and expenses994,755 761,474 1,939,946 1,450,219 
Loss from operations(313,989)(170,267)(603,836)(321,878)
Interest income34,764 4,197 65,846 4,442 
Interest expense(10,129)(9,891)(20,141)(19,890)
Other income/(expense), net3,277 (3,051)2,837 (3,430)
Loss before income taxes(286,077)(179,012)(555,294)(340,756)
Provision for/(benefit from) income taxes(1,236)(278)(505)(2)
Consolidated net loss(284,841)(178,734)(554,789)(340,754)
Net loss attributable to noncontrolling interests(2,064)(2,294)(3,699)(4,112)
Net loss attributable to common stockholders$(282,777)$(176,440)$(551,090)$(336,642)
Net loss per share attributable to common stockholders, basic and diluted$(0.46)$(0.30)$(0.90)$(0.57)
Weighted-average shares used in computing net loss per share attributable to common stockholders—basic and diluted612,689 593,928 609,680 591,252 
(1)In the first quarter of 2022, we updated our estimated paying user life from 23 months to 25 months, which was subsequently updated again to 28 months in the third quarter of 2022, where it remained through the second quarter of 2023. Based on the carrying amount of deferred revenue and deferred cost of revenue as of December 31, 2021, the change in estimate in the first quarter of 2022 resulted in a decrease in revenue during the three and six months ended June 30, 2022 of $40.9 million and $123.5 million, respectively, and a decrease in cost of revenue during the same periods by $9.4 million and $29.0 million, respectively.
(2)Depreciation of servers and infrastructure equipment included in infrastructure and trust & safety.


ROBLOX CORPORATION
CONDENSED CONSOLIDATED STATEMENTS OF CASH FLOWS
(in thousands)
(unaudited)
 
Three Months Ended June 30,
Six Months Ended June 30,
 2023202220232022
Cash flows from operating activities:
Consolidated net loss$(284,841)$(178,734)$(554,789)$(340,754)
Adjustments to reconcile net loss including noncontrolling interests to net cash and cash equivalents provided by operations:
Depreciation and amortization52,599 28,996 100,011 53,493 
Stock-based compensation expense212,362 146,388 397,266 258,683 
Operating lease non-cash expense23,509 16,303 44,753 30,300 
(Accretion)/amortization on marketable securities, net(19,623)— (31,745)— 
Amortization of debt issuance costs327 311 651 622 
Impairment expense, (gain)/loss on investment and other asset sales, and other, net(2,067)2,048 6,169 1,481 
Changes in operating assets and liabilities, net of effect of acquisitions:
Accounts receivable9,435 (9,865)122,628 118,318 
Accounts payable(16,731)(6,867)1,576 (10,635)
Prepaid expenses and other current assets2,200 (15,983)(6,159)(26,923)
Other assets(4,533)1,199 (6,691)764 
Developer exchange liability(7,291)(2,624)(11,156)(16,714)
Accrued expenses and other current liabilities(5,340)6,406 (22,344)4,340 
Other long-term liability316 (579)2,286 (579)
Operating lease liabilities(18,844)(10,021)(30,843)(21,730)
Deferred revenue105,372 52,140 229,155 148,937 
Deferred cost of revenue(18,460)(2,621)(38,597)(16,670)
Net cash and cash equivalents provided by operating activities28,390 26,497 202,171 182,933 
Cash flows from investing activities:
Acquisition of property and equipment(110,915)(83,812)(202,274)(135,602)
Payments related to business combination, net of cash acquired— (6,165)— (6,165)
Purchases of intangible assets(13,000)— (13,500)— 
Purchases of investments(702,560)— (3,042,760)— 
Maturities of investments324,010 — 324,010 — 
Sales of investments145,000 — 229,279 — 
Net cash and cash equivalents used in investing activities(357,465)(89,977)(2,705,245)(141,767)
Cash flows from financing activities:
Proceeds from issuance of common stock5,635 5,548 31,107 29,876 
Payment of withholding taxes related to net share settlement of restricted stock units— — — (150)
Proceeds from debt issuances14,700 — 14,700 — 
Payment of debt issuance costs— — — (154)
Payments related to business combination, after acquisition date — — (750)— 
Payment of term license related obligations— (420)— (420)
Net cash and cash equivalents provided by financing activities20,335 5,128 45,057 29,152 
Effect of exchange rate changes on cash and cash equivalents875 863 807 857 
Net increase/(decrease) in cash and cash equivalents(307,865)(57,489)(2,457,210)71,175 
Cash and cash equivalents
Beginning of period828,129 3,132,964 2,977,474 3,004,300 
End of period$520,264 $3,075,475 $520,264 $3,075,475 


Use of Non-GAAP Financial Measures
This press release and the accompanying table contain the non-GAAP financial measure bookings.
We use this non-GAAP financial information to evaluate our ongoing operations and for internal planning and forecasting purposes. We believe that this non-GAAP financial information may be helpful to investors because it provides consistency and comparability with past financial performance.
Bookings is defined as revenue plus the change in deferred revenue during the period and other non-cash adjustments. Substantially all of our bookings are generated from sales of virtual currency, which can be converted to virtual items on the Roblox Platform. Sales of virtual currency reflected as bookings include one-time purchases or monthly subscriptions purchased via payment processors or through prepaid cards. Bookings also include an insignificant amount from advertising and licensing arrangements. We believe bookings provide a timelier indication of trends in our operating results that are not necessarily reflected in our revenue as a result of the fact that we recognize the majority of revenue over the estimated average lifetime of a paying user. The change in deferred revenue constitutes the vast majority of the reconciling difference from revenue to bookings. By removing these non-cash adjustments, we are able to measure and monitor our business performance based on the timing of actual transactions with our users and the cash that is generated from these transactions.
Non-GAAP financial measures have limitations in their usefulness to investors because they have no standardized meaning prescribed by GAAP and are not prepared under any comprehensive set of accounting rules or principles. In addition, other companies, including companies in our industry, may calculate similarly titled non-GAAP financial measures differently or may use other measures to evaluate their performance, all of which could reduce the usefulness of our non-GAAP financial information as a tool for comparison. As a result, our non-GAAP financial information is presented for supplemental informational purposes only and should not be considered in isolation from, or as a substitute for financial information presented in accordance with GAAP.
A reconciliation table of the most comparable GAAP financial measure to the non-GAAP financial measure used in this press release is included below. We encourage investors and others to review our business, results of operations, and financial information in their entirety, not to rely on any single financial measure, and to view this non-GAAP measure in conjunction with the most directly comparable GAAP financial measure.
The following table presents a reconciliation of revenue, the most directly comparable financial measure calculated in accordance with GAAP, to bookings, for each of the periods presented (in thousands):
Three Months Ended June 30,Six Months Ended June 30,
2023202220232022
Reconciliation of revenue to bookings:
Revenue$680,766 $591,207 $1,336,110 $1,128,341 
Add (deduct):
Change in deferred revenue105,372 52,140 229,155 148,937 
Other(5,452)(3,445)(10,760)(6,170)
Bookings$780,686 $639,902 $1,554,505 $1,271,108 


About Roblox
Roblox’s vision is to reimagine the way people come together. Every day, tens of millions of people around the world connect, communicate and explore millions of immersive experiences together with their friends on Roblox. All of these experiences are built by the Roblox community, made up of millions of creators. We believe in building a safe, civil, and diverse community—one that inspires and fosters creativity and positive relationships between people around the world. For more information, please visit corp.roblox.com.
CONTACTS
Stefanie Notaney
Roblox Corporate Communications
[email protected]
ROBLOX and the Roblox logo are among the registered and unregistered trademarks of Roblox Corporation in the United States and other countries. © 2023 Roblox Corporation. All rights reserved.
Source: Roblox Corporation
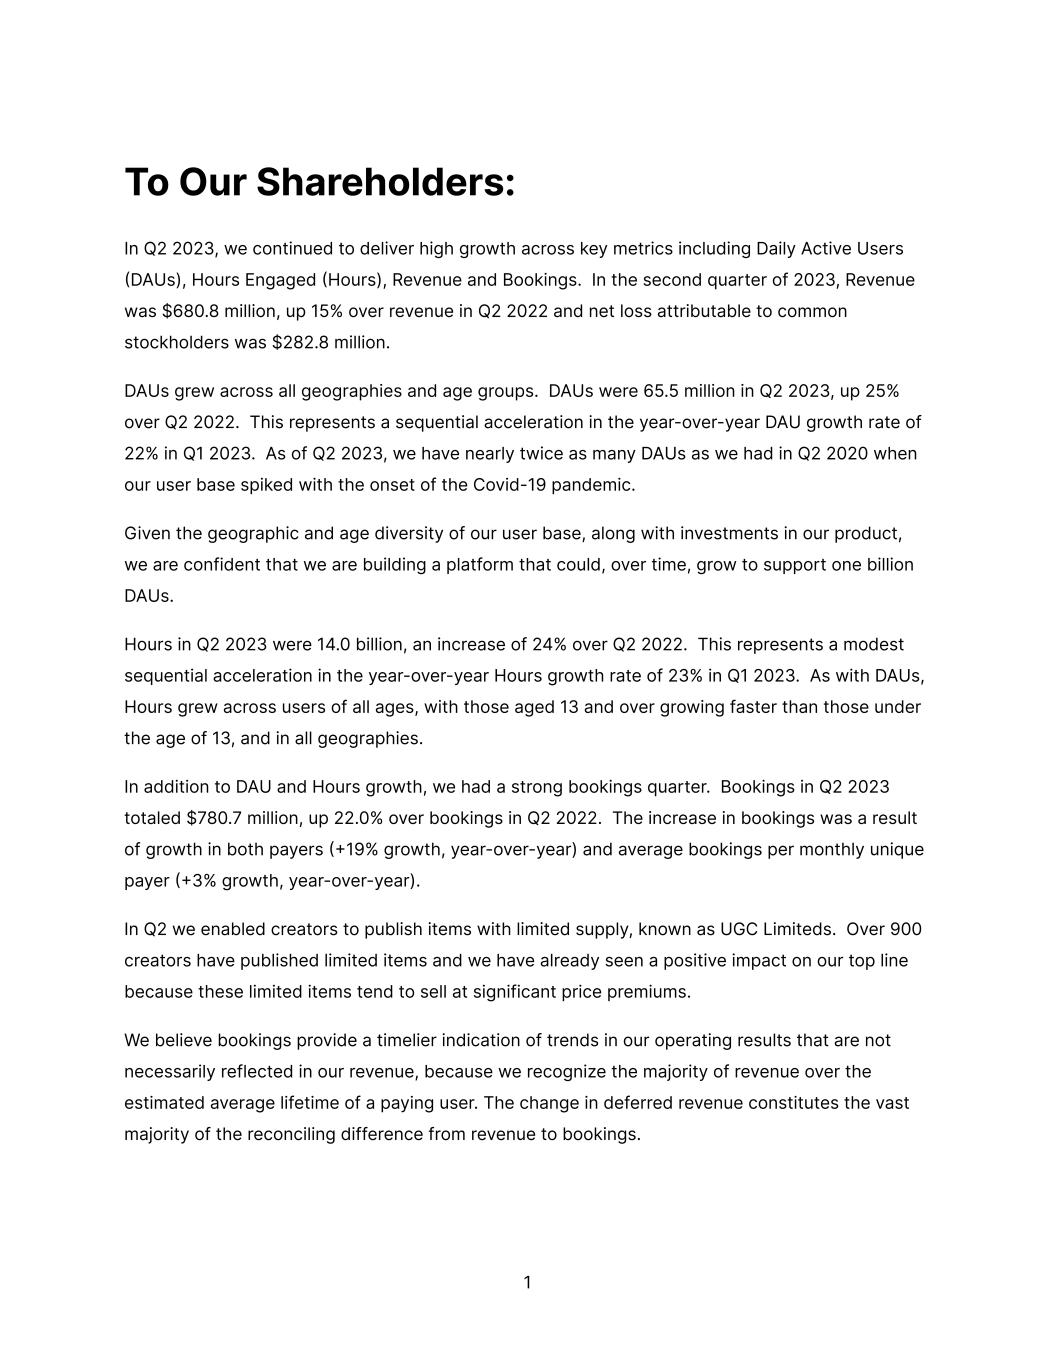
Exhibit 99.2


To Our Shareholders: In Q2 2023, we continued to deliver high growth across key metrics including Daily Active Users �DAUs), Hours Engaged �Hours), Revenue and Bookings. In the second quarter of 2023, Revenue was $680.8 million, up 15% over revenue in Q2 2022 and net loss attributable to common stockholders was $282.8 million. DAUs grew across all geographies and age groups. DAUs were 65.5 million in Q2 2023, up 25% over Q2 2022. This represents a sequential acceleration in the year-over-year DAU growth rate of 22% in Q1 2023. As of Q2 2023, we have nearly twice as many DAUs as we had in Q2 2020 when our user base spiked with the onset of the Covid-19 pandemic. Given the geographic and age diversity of our user base, along with investments in our product, we are confident that we are building a platform that could, over time, grow to support one billion DAUs. Hours in Q2 2023 were 14.0 billion, an increase of 24% over Q2 2022. This represents a modest sequential acceleration in the year-over-year Hours growth rate of 23% in Q1 2023. As with DAUs, Hours grew across users of all ages, with those aged 13 and over growing faster than those under the age of 13, and in all geographies. In addition to DAU and Hours growth, we had a strong bookings quarter. Bookings in Q2 2023 totaled $780.7 million, up 22.0% over bookings in Q2 2022. The increase in bookings was a result of growth in both payers ��19% growth, year-over-year) and average bookings per monthly unique payer ��3% growth, year-over-year). In Q2 we enabled creators to publish items with limited supply, known as UGC Limiteds. Over 900 creators have published limited items and we have already seen a positive impact on our top line because these limited items tend to sell at significant price premiums. We believe bookings provide a timelier indication of trends in our operating results that are not necessarily reflected in our revenue, because we recognize the majority of revenue over the estimated average lifetime of a paying user. The change in deferred revenue constitutes the vast majority of the reconciling difference from revenue to bookings. 1


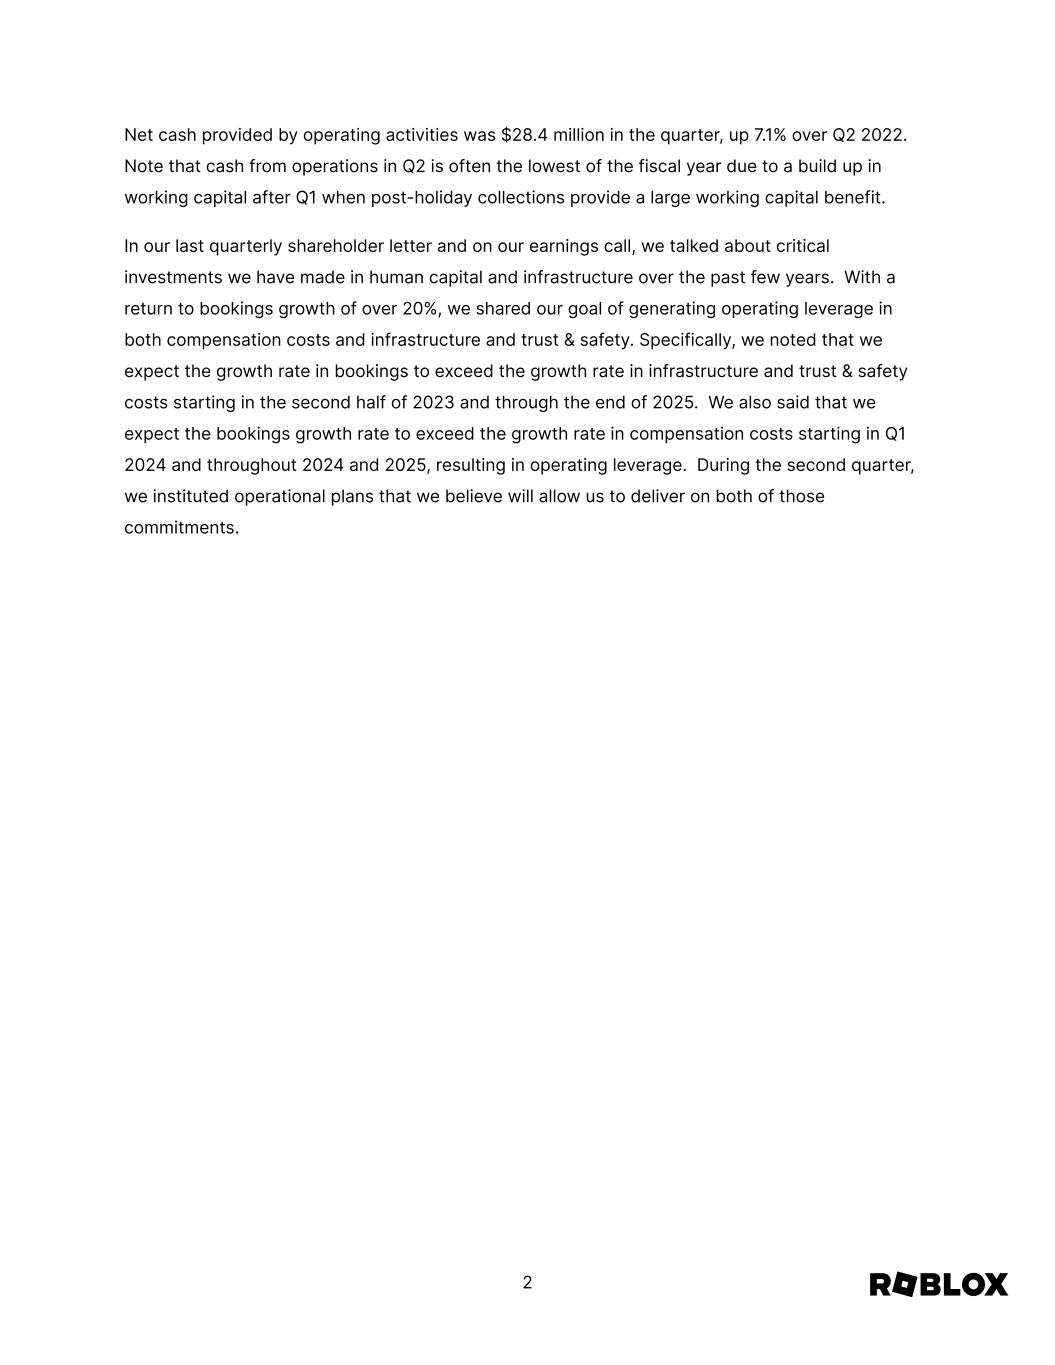
Net cash provided by operating activities was $28.4 million in the quarter, up 7.1% over Q2 2022. Note that cash from operations in Q2 is often the lowest of the fiscal year due to a build up in working capital after Q1 when post-holiday collections provide a large working capital benefit. In our last quarterly shareholder letter and on our earnings call, we talked about critical investments we have made in human capital and infrastructure over the past few years. With a return to bookings growth of over 20%, we shared our goal of generating operating leverage in both compensation costs and infrastructure and trust & safety. Specifically, we noted that we expect the growth rate in bookings to exceed the growth rate in infrastructure and trust & safety costs starting in the second half of 2023 and through the end of 2025. We also said that we expect the bookings growth rate to exceed the growth rate in compensation costs starting in Q1 2024 and throughout 2024 and 2025, resulting in operating leverage. During the second quarter, we instituted operational plans that we believe will allow us to deliver on both of those commitments. 2


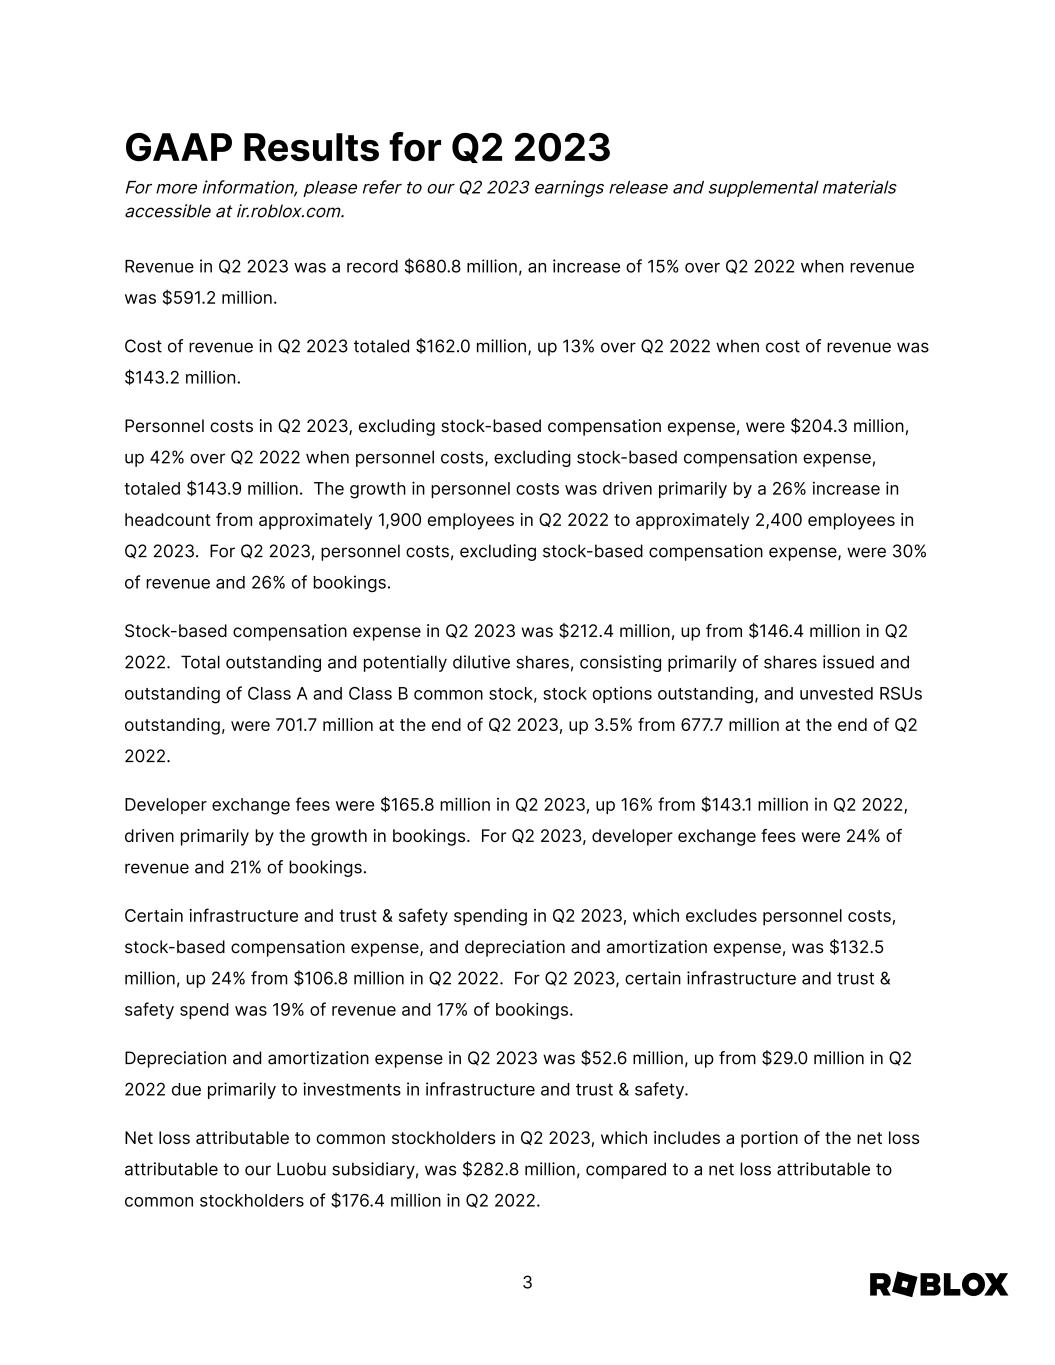
GAAP Results for Q2 2023 For more information, please refer to our Q2 2023 earnings release and supplemental materials accessible at ir.roblox.com. Revenue in Q2 2023 was a record $680.8 million, an increase of 15% over Q2 2022 when revenue was $591.2 million. Cost of revenue in Q2 2023 totaled $162.0 million, up 13% over Q2 2022 when cost of revenue was $143.2 million. Personnel costs in Q2 2023, excluding stock-based compensation expense, were $204.3 million, up 42% over Q2 2022 when personnel costs, excluding stock-based compensation expense, totaled $143.9 million. The growth in personnel costs was driven primarily by a 26% increase in headcount from approximately 1,900 employees in Q2 2022 to approximately 2,400 employees in Q2 2023. For Q2 2023, personnel costs, excluding stock-based compensation expense, were 30% of revenue and 26% of bookings. Stock-based compensation expense in Q2 2023 was $212.4 million, up from $146.4 million in Q2 2022. Total outstanding and potentially dilutive shares, consisting primarily of shares issued and outstanding of Class A and Class B common stock, stock options outstanding, and unvested RSUs outstanding, were 701.7 million at the end of Q2 2023, up 3.5% from 677.7 million at the end of Q2 2022. Developer exchange fees were $165.8 million in Q2 2023, up 16% from $143.1 million in Q2 2022, driven primarily by the growth in bookings. For Q2 2023, developer exchange fees were 24% of revenue and 21% of bookings. Certain infrastructure and trust & safety spending in Q2 2023, which excludes personnel costs, stock-based compensation expense, and depreciation and amortization expense, was $132.5 million, up 24% from $106.8 million in Q2 2022. For Q2 2023, certain infrastructure and trust & safety spend was 19% of revenue and 17% of bookings. Depreciation and amortization expense in Q2 2023 was $52.6 million, up from $29.0 million in Q2 2022 due primarily to investments in infrastructure and trust & safety. Net loss attributable to common stockholders in Q2 2023, which includes a portion of the net loss attributable to our Luobu subsidiary, was $282.8 million, compared to a net loss attributable to common stockholders of $176.4 million in Q2 2022. 3


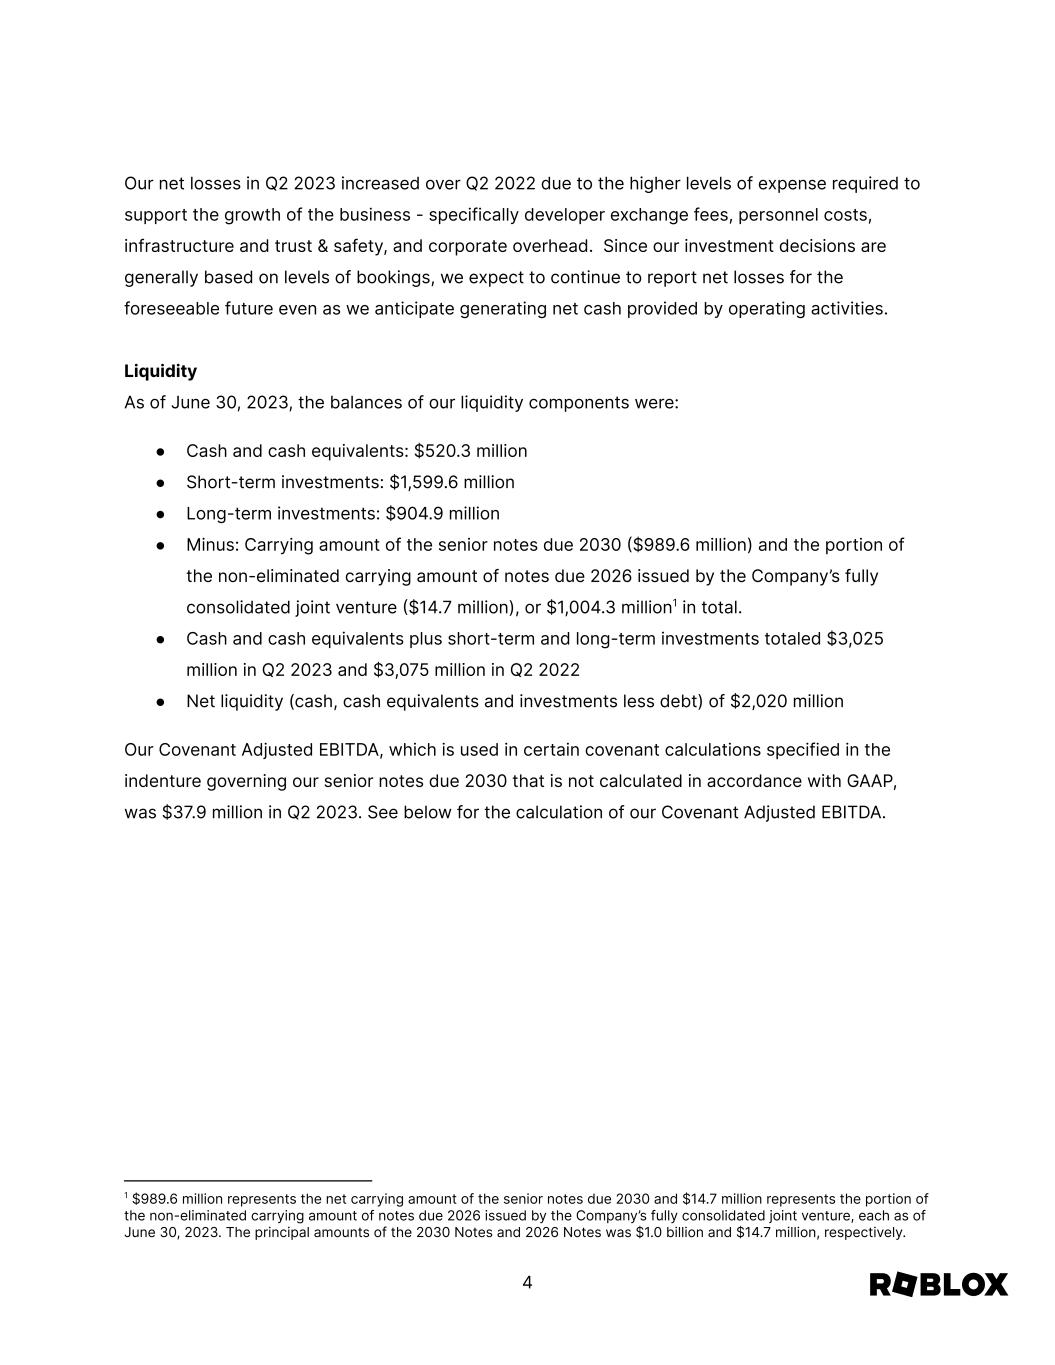
Our net losses in Q2 2023 increased over Q2 2022 due to the higher levels of expense required to support the growth of the business - specifically developer exchange fees, personnel costs, infrastructure and trust & safety, and corporate overhead. Since our investment decisions are generally based on levels of bookings, we expect to continue to report net losses for the foreseeable future even as we anticipate generating net cash provided by operating activities. Liquidity As of June 30, 2023, the balances of our liquidity components were: ● Cash and cash equivalents: $520.3 million ● Short-term investments: $1,599.6 million ● Long-term investments: $904.9 million ● Minus: Carrying amount of the senior notes due 2030 �$989.6 million) and the portion of the non-eliminated carrying amount of notes due 2026 issued by the Company’s fully consolidated joint venture �$14.7 million), or $1,004.3 million1 in total. ● Cash and cash equivalents plus short-term and long-term investments totaled $3,025 million in Q2 2023 and $3,075 million in Q2 2022 ● Net liquidity (cash, cash equivalents and investments less debt) of $2,020 million Our Covenant Adjusted EBITDA, which is used in certain covenant calculations specified in the indenture governing our senior notes due 2030 that is not calculated in accordance with GAAP, was $37.9 million in Q2 2023. See below for the calculation of our Covenant Adjusted EBITDA. 1 $989.6 million represents the net carrying amount of the senior notes due 2030 and $14.7 million represents the portion of the non-eliminated carrying amount of notes due 2026 issued by the Company’s fully consolidated joint venture, each as of June 30, 2023. The principal amounts of the 2030 Notes and 2026 Notes was $1.0 billion and $14.7 million, respectively. 4


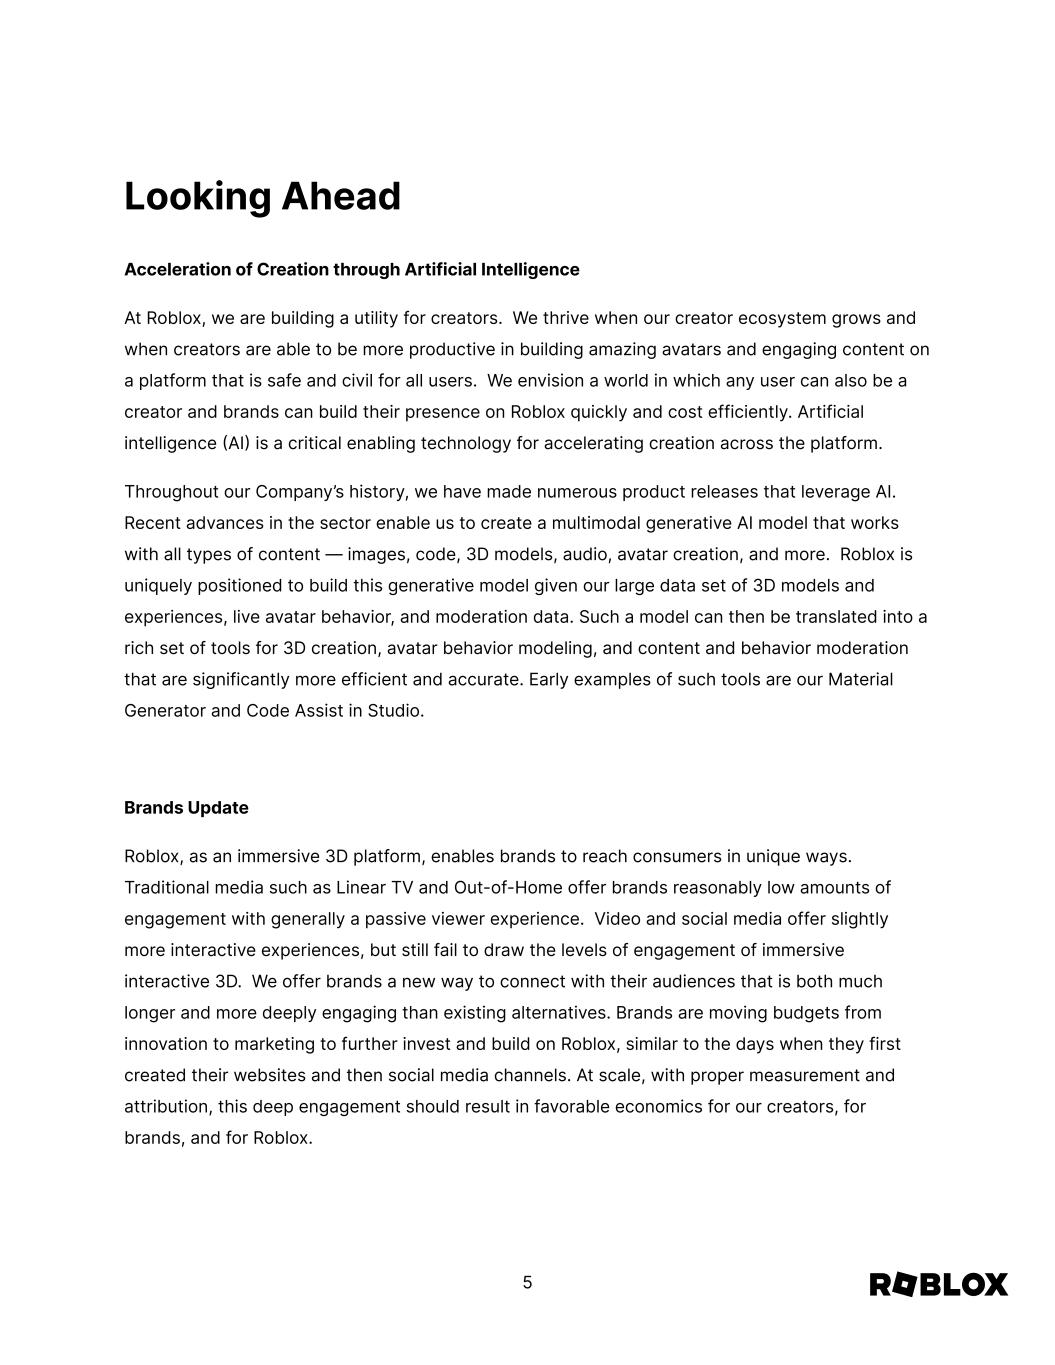
Looking Ahead Acceleration of Creation through Artificial Intelligence At Roblox, we are building a utility for creators. We thrive when our creator ecosystem grows and when creators are able to be more productive in building amazing avatars and engaging content on a platform that is safe and civil for all users. We envision a world in which any user can also be a creator and brands can build their presence on Roblox quickly and cost efficiently. Artificial intelligence �AI� is a critical enabling technology for accelerating creation across the platform. Throughout our Company’s history, we have made numerous product releases that leverage AI. Recent advances in the sector enable us to create a multimodal generative AI model that works with all types of content — images, code, 3D models, audio, avatar creation, and more. Roblox is uniquely positioned to build this generative model given our large data set of 3D models and experiences, live avatar behavior, and moderation data. Such a model can then be translated into a rich set of tools for 3D creation, avatar behavior modeling, and content and behavior moderation that are significantly more efficient and accurate. Early examples of such tools are our Material Generator and Code Assist in Studio. Brands Update Roblox, as an immersive 3D platform, enables brands to reach consumers in unique ways. Traditional media such as Linear TV and Out-of-Home offer brands reasonably low amounts of engagement with generally a passive viewer experience. Video and social media offer slightly more interactive experiences, but still fail to draw the levels of engagement of immersive interactive 3D. We offer brands a new way to connect with their audiences that is both much longer and more deeply engaging than existing alternatives. Brands are moving budgets from innovation to marketing to further invest and build on Roblox, similar to the days when they first created their websites and then social media channels. At scale, with proper measurement and attribution, this deep engagement should result in favorable economics for our creators, for brands, and for Roblox. 5


We continue to show early signs of momentum with brands. As of the end of Q2 2023, we have had over 200 brand activations on the Roblox platform2, with brands connecting with their audiences in new, immersive ways. To scale the number of brands on the platform, we announced the Partner Program at Cannes Lions in June, bringing together an incredible group of brands, agencies and creators. Century Games, dentsu, Dubit, Playwire, Sawhorse, The Gang Group, and Vayner3 have all demonstrated long-term commitments to supporting brands that want to enter this new space with each investing in building out internal teams to educate their clients and help scale brand innovation on the platform. Our ultimate goal is to run a self-service platform for brands and creators – and agencies will be key partners in driving capital-efficient growth of this business over time. In order to take this business to the next level, last month we announced the appointment of Christina Wootton as chief partnerships officer bringing our partnerships and product organization closer together to accelerate these investments. Christina is a 10-year Roblox veteran who has spent much of that time educating brands about the power of immersive experiences. She has also personally managed brand relationships with companies such as Netflix, Disney, Universal Pictures, Warner Bros, Gucci, and Nike. 2 Brand activations are the number of brand activities on the Roblox platform that are either facilitated by our creator community or directly by the brand. A brand or partner can have more than one activation at any given time. 6


EARNINGS Q&A SESSION Roblox will host a live Q&A session to answer questions regarding their second quarter 2023 results on Wednesday, August 9, 2023 at 5�30 a.m. Pacific Time/8�30 a.m. Eastern Time. The live webcast and Q&A session will be open to the public at ir.roblox.com and we invite you to join us and to visit our investor relations website at ir.roblox.com to review supplemental information. Roblox will be hosting its 3rd annual Investor Day on November 15, 2023 in the Bay Area. Be sure to save the date in your calendar. We will be providing more details in the coming weeks. 7


Forward-Looking Statements This letter and the live webcast and Q&A session which will be held at 5�30 a.m. Pacific Time/8�30 a.m. Eastern Time on Wednesday, August 9, 2023 contain “forward-looking statements” within the meaning of the “safe harbor” provisions of the Private Securities Litigation Reform Act of 1995, including but not limited to, statements regarding our vision to connect our users, our efforts to improve the Roblox Platform, our immersive advertising efforts, the use of AI on our platform, branding and new partnerships, our business, product, strategy and user growth, our investment strategy, including our opportunities for and expectations of improvements in financial and operating metrics, including operating leverage, our expectation of successfully executing such strategies and plans, disclosures and future growth rates, and our expectations of future net losses and net cash generation from operating activities, and statements by our Chief Executive Officer and Chief Financial Officer. These forward-looking statements are made as of the date they were first issued and were based on current plans, expectations, estimates, forecasts, and projections as well as the beliefs and assumptions of management. Words such as “expect,” “vision,” “envision,” “anticipate,” “maintain,” “should,” “believe,” “continue,” “plan,” “goal,” “opportunity,” “estimate,” “predict,” “may,” “will,” “could,” and “would,” and variations of these terms or the negative of these terms and similar expressions are intended to identify these forward-looking statements. Forward-looking statements are subject to a number of risks and uncertainties, many of which involve factors or circumstances that are beyond our control. Our actual results could differ materially from those stated or implied in forward-looking statements due to a number of factors, including but not limited to risks detailed in our filings with the Securities and Exchange Commission (the “SEC”), including our annual reports on Form 10�K, our quarterly reports on Form 10�Q and other filings and reports we make with the SEC from time to time. In particular, the following factors, among others, could cause results to differ materially from those expressed or implied by such forward-looking statements: our ability to successfully execute our business and growth strategy; the sufficiency of our cash and cash equivalents to meet our liquidity needs, including the repayment of our senior notes; the demand for our platform in general; our ability to retain and increase our number of users, developers, and creators; the impact of the COVID�19 pandemic and the easing of restrictions related to the COVID�19 pandemic; the impact of inflation and global economic conditions on our operations; the impact of changing legal and regulatory requirements on our business; our ability to develop enhancements to our platform, and bring them to market in a timely manner; our ability to develop and protect our brand and build new partnerships; any misuse of user data or other undesirable activity by third parties on our platform; our ability to maintain the security and availability of our platform; our ability to detect and minimize unauthorized use of our platform; and the impact of AI on our platform, users, creators, and developers. Additional information regarding these and other risks and uncertainties that could cause actual results to differ materially from our expectations is included in the reports we have filed or will file with the SEC, including our annual reports on Form 10�K and our quarterly reports on Form 10�Q. 8


The forward-looking statements included in this letter represent our views as of the date of this letter. We anticipate that subsequent events and developments will cause our views to change. However, we undertake no intention or obligation to update or revise any forward-looking statements, whether as a result of new information, future events or otherwise. These forward-looking statements should not be relied upon as representing our views as of any date subsequent to the date of this letter. 9


Non-GAAP Financial Measures This letter contains the non-GAAP financial measure bookings. We use this non-GAAP financial information to evaluate our ongoing operations and for internal planning and forecasting purposes. We believe that this non-GAAP financial information may be helpful to investors because it provides consistency and comparability with past financial performance. Bookings is defined as revenue plus the change in deferred revenue during the period and other non-cash adjustments. Substantially all of our bookings are generated from sales of virtual currency, which can be converted to virtual items on the Roblox Platform. Sales of virtual currency reflected as bookings include one-time purchases and monthly subscriptions purchased via payment processors or through prepaid cards. Bookings also include an insignificant amount from advertising and licensing arrangements. We believe bookings provide a timelier indication of trends in our operating results that are not necessarily reflected in our revenue as a result of the fact that we recognize the majority of revenue over the estimated average lifetime of a paying user. The change in deferred revenue constitutes the vast majority of the reconciling difference from revenue to bookings. By removing these non-cash adjustments, we are able to measure and monitor our business performance based on the timing of actual transactions with our users and the cash that is generated from these transactions. Non-GAAP financial measures have limitations in their usefulness to investors because they have no standardized meaning prescribed by GAAP and are not prepared under any comprehensive set of accounting rules or principles. In addition, other companies, including companies in our industry, may calculate similarly titled non-GAAP financial measures differently or may use other measures to evaluate their performance, all of which could reduce the usefulness of our non-GAAP financial information as a tool for comparison. As a result, our non-GAAP financial information is presented for supplemental informational purposes only and should not be considered in isolation from, or as a substitute for financial information presented in accordance with GAAP. A reconciliation table of the most comparable GAAP financial measure to the non-GAAP financial measure used in this letter is included at the end of this letter. We encourage investors and others to review our business, results of operations, and financial information in their entirety, not to rely on any single financial measure, and to view this non-GAAP measure in conjunction with the most directly comparable GAAP financial measure. 10


Liquidity Covenant Adjusted EBITDA is used in certain covenant calculations specified in the indenture governing our senior notes due 2030 that is not calculated in accordance with GAAP and may not conform to the calculation of EBITDA or adjusted EBITDA by other companies. Covenant Adjusted EBITDA should not be considered as a substitute for net loss as determined in accordance with GAAP and by other companies. We believe that, when considered together with reported amounts, Covenant Adjusted EBITDA is useful for our investors and management for purposes of analyzing our compliance with certain covenants specified in the indenture governing our senior notes due 2030 and may influence our ability to issue additional debt and enter into certain other transactions in the future. Covenant Adjusted EBITDA should be considered in connection with our condensed consolidated financial statements and results presented in accordance with GAAP. Refer to the Liquidity and Capital Resources of our Form 10�Q for the quarter ended June 30, 2023 for more information. 11


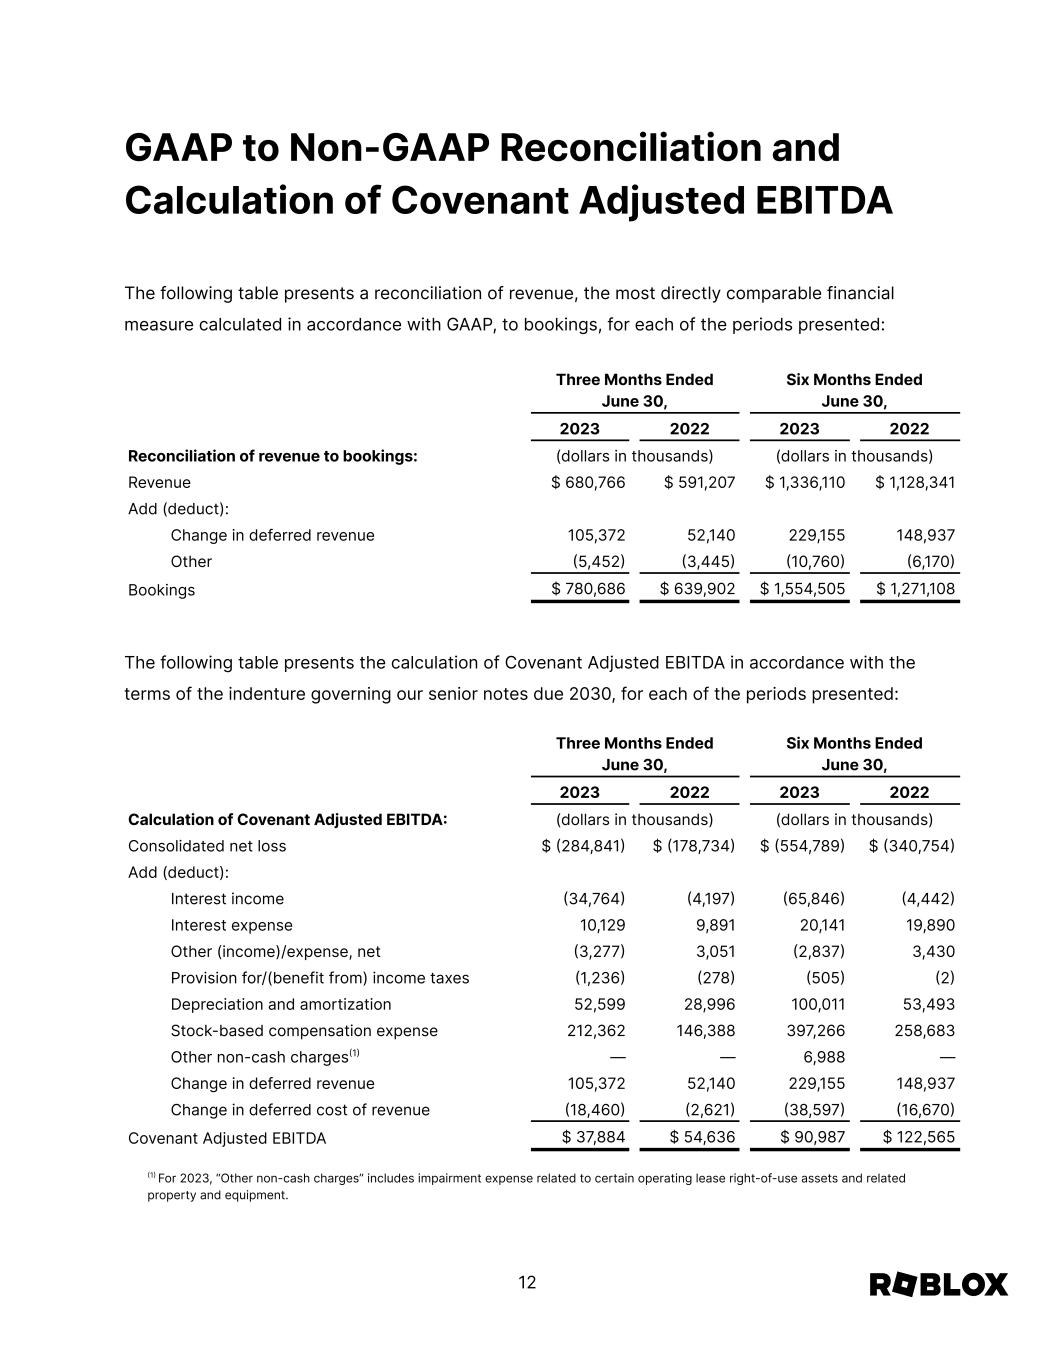
GAAP to Non-GAAP Reconciliation and Calculation of Covenant Adjusted EBITDA The following table presents a reconciliation of revenue, the most directly comparable financial measure calculated in accordance with GAAP, to bookings, for each of the periods presented: Three Months Ended June 30, Six Months Ended June 30, 2023 2022 2023 2022 Reconciliation of revenue to bookings: (dollars in thousands) (dollars in thousands) Revenue $ 680,766 $ 591,207 $ 1,336,110 $ 1,128,341 Add (deduct): Change in deferred revenue 105,372 52,140 229,155 148,937 Other �5,452� �3,445� �10,760� �6,170� Bookings $ 780,686 $ 639,902 $ 1,554,505 $ 1,271,108 The following table presents the calculation of Covenant Adjusted EBITDA in accordance with the terms of the indenture governing our senior notes due 2030, for each of the periods presented: Three Months Ended June 30, Six Months Ended June 30, 2023 2022 2023 2022 Calculation of Covenant Adjusted EBITDA� (dollars in thousands) (dollars in thousands) Consolidated net loss $ �284,841� $ �178,734� $ �554,789� $ �340,754� Add (deduct): Interest income �34,764� �4,197� �65,846� �4,442� Interest expense 10,129 9,891 20,141 19,890 Other (income)/expense, net �3,277� 3,051 �2,837� 3,430 Provision for/(benefit from) income taxes �1,236� �278� �505� �2� Depreciation and amortization 52,599 28,996 100,011 53,493 Stock-based compensation expense 212,362 146,388 397,266 258,683 Other non-cash charges�1� — — 6,988 — Change in deferred revenue 105,372 52,140 229,155 148,937 Change in deferred cost of revenue �18,460� �2,621� �38,597� �16,670� Covenant Adjusted EBITDA $ 37,884 $ 54,636 $ 90,987 $ 122,565 �1�For 2023, “Other non-cash charges” includes impairment expense related to certain operating lease right-of-use assets and related property and equipment. 12