Exhibit 99.1

Roblox Reports Second Quarter 2022 Financial Results
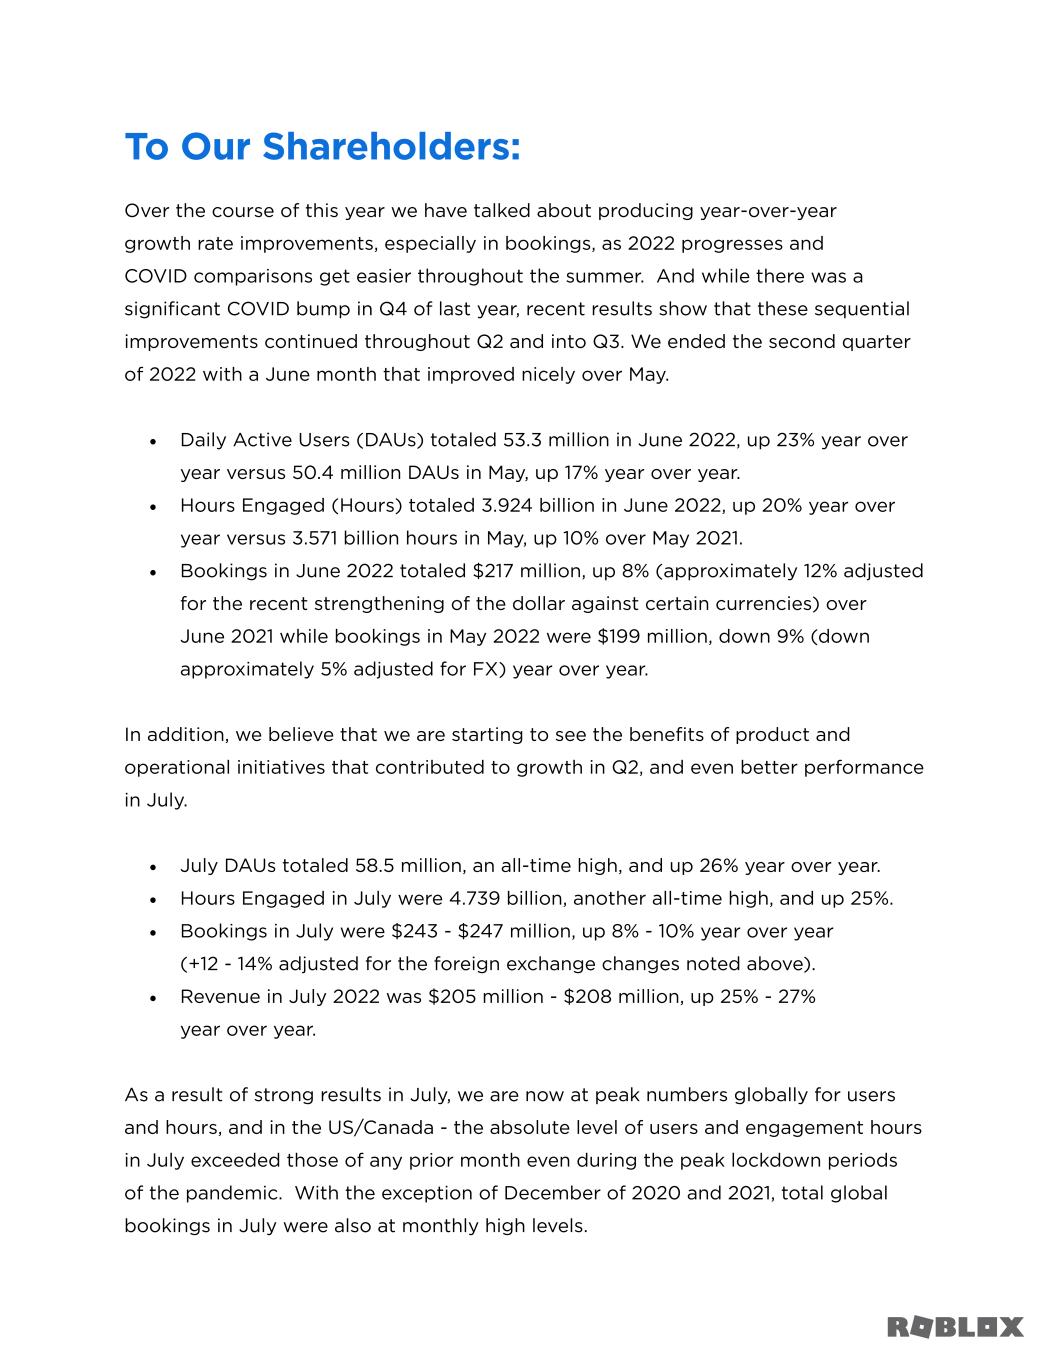
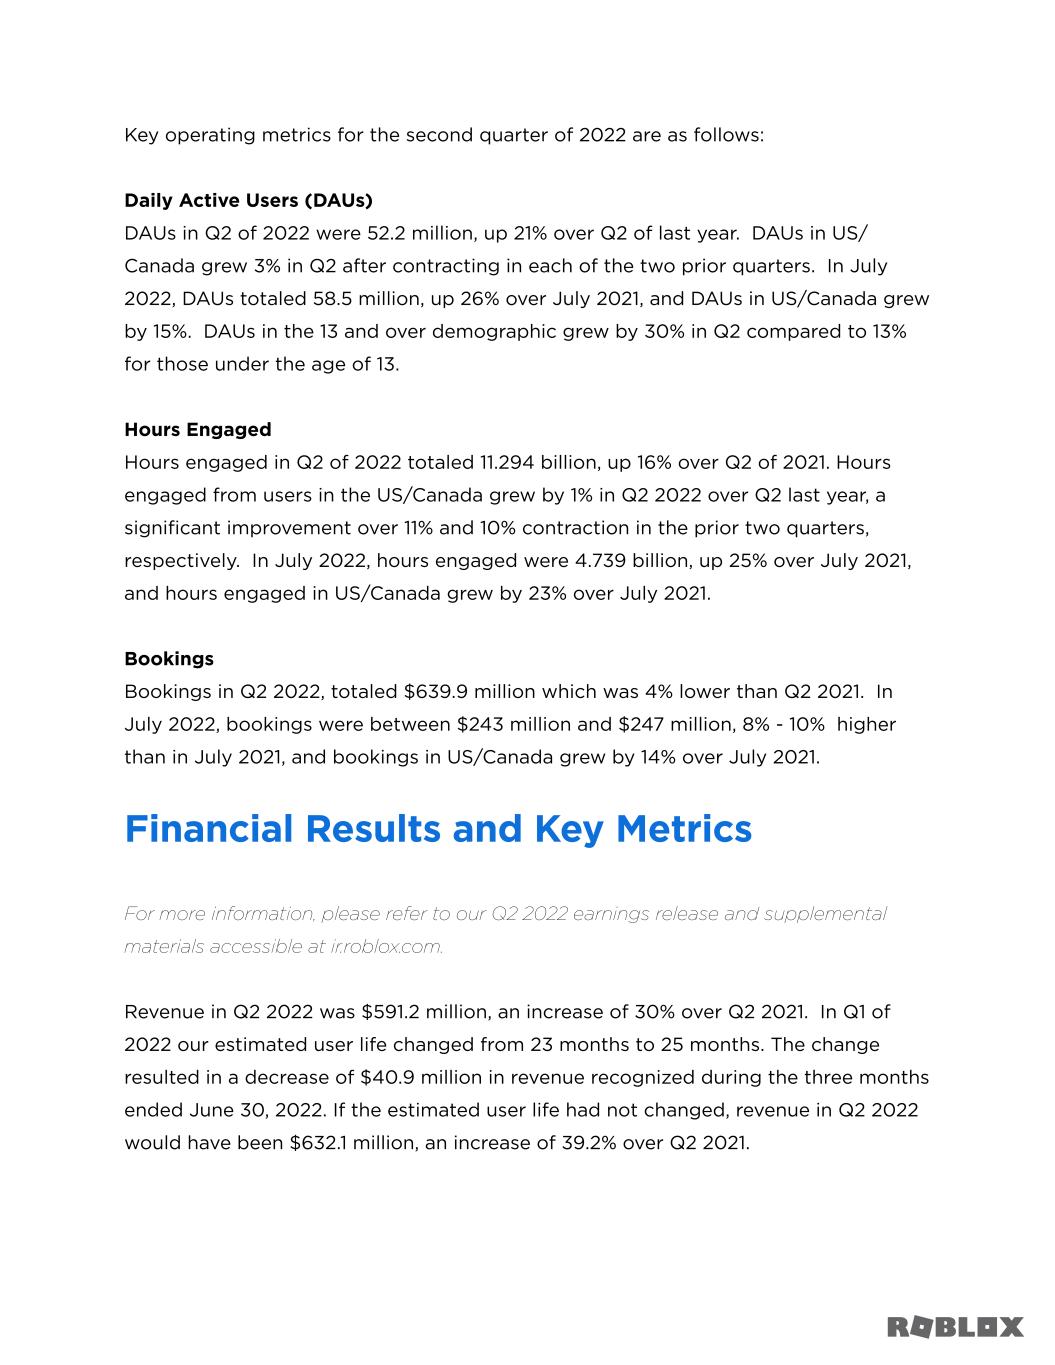
Revenue up 30% over prior year to $591.2 million
Strong year over year growth in Daily Active Users and Hours Engaged, up 21% and 16%, respectively
Growth across DAUs, Hours Engaged and Bookings accelerated in July
SAN MATEO, Calif., August 9, 2022 - Roblox Corporation (NYSE: RBLX), a global platform bringing millions of people together through shared experiences, released its second quarter 2022 financial results today as well as key metrics for the month of July 2022. Separately, Roblox posted a letter to shareholders and supplemental materials on the Roblox investor relations website at ir.roblox.com.
Second Quarter 2022 Financial Highlights
•Revenue was $591.2 million, up 30% year over year
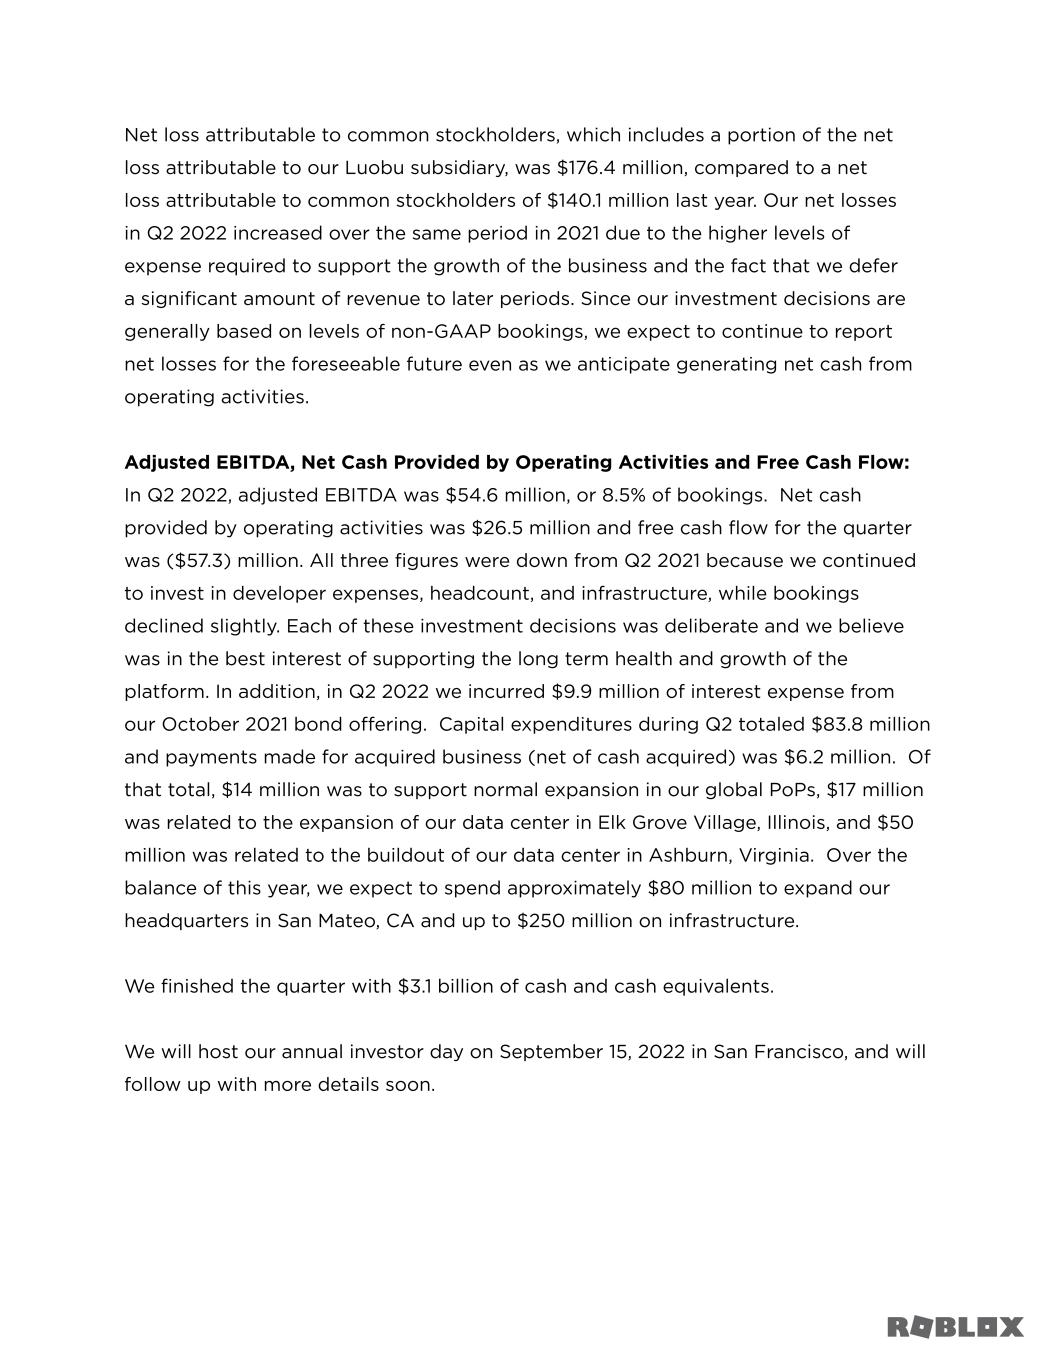
•Net cash provided by operating activities of $26.5 million; Free cash flow was $(57.3) million
•Bookings were $639.9 million, down 4% year over year
•Average Daily Active Users (DAUs) were 52.2 million, up 21% year over year
•Hours Engaged were 11.3 billion, up 16% year over year
•Average Bookings per DAU (ABPDAU) was $12.25, down 21% year over year
July 2022 Key Metric Estimates
•Revenue was between $205 million - $208 million, up 25% - 27% year over year
•Bookings were between $243 million and $247 million, up 8% - 10% year over year
•DAUs were 58.5 million, up 26% year over year
•Hours Engaged were 4.7 billion, up 25% year over year
•ABPDAU was between $4.15 - $4.22, down 12% - 14% year over year
“We are driving record levels of users and engagement globally as we execute on our innovation roadmap and broaden the appeal of Roblox across geographies and age groups,” said David Baszucki, chief executive officer of Roblox. “We continue to make progress on key operational and product initiatives to enhance the long-term value of the Roblox platform.”
“We remain focused on investing in strategic areas that we believe will drive platform growth and monetization,” said Michael Guthrie, chief financial officer of Roblox. “We have a tremendous opportunity as we continue to define the future of this new immersive co-experience category.”
Earnings Q&A Session
Roblox will host a live Q&A session to answer questions regarding their second quarter 2022 results on Wednesday, August 10, 2022 at 5:30 a.m. Pacific Time. The webcast will be open to the public at ir.roblox.com or by clicking here.
Forward-Looking Statements
This press release contains “forward-looking statements” within the meaning of the “safe harbor” provisions of the Private Securities Litigation Reform Act of 1995, including but not limited to, statements regarding our business, product, strategy and user growth plans, our investment strategy, our continuation of improvements in growth rate, particularly bookings, the benefits of our product and operational initiatives, our expectation of successfully executing such strategies and plans, and our and our brand strength on our recruiting efforts, our employee recruitment plans, our anticipations of certain financial results, our commitment to contain share dilution, our expectations for July 2022 financial and operational results and future growth rates, our estimates of real estate and infrastructure expenses for the balance of 2022, and our expectations of future net losses. These forward-looking statements are made as of the date they were first issued and were based on current expectations, estimates, forecasts, and projections as well as the beliefs and assumptions of management. Words such as “expect,” “anticipate,” “should,” “believe,” “hope,” “target,” “continue,” “project,” “plan,” “goals,” “opportunity,” “appeal,” “estimate,” “potential,” “predict,” “may,” “will,” “might,” “could,” “intend,” “shall,” and “suggest,” and variations of these terms or the negative of these terms and similar expressions are intended to identify these forward-looking statements. Forward-looking statements are subject to a number of risks and uncertainties, many of which involve factors or circumstances that are beyond our control. Our actual results could differ materially from those stated or implied in forward-looking statements due to a number of factors, including but not limited to risks detailed in our filings with the Securities and Exchange Commission (the “SEC”), including our Quarterly Report on Form 10-Q for the fiscal quarter ended March 31, 2022 and other filings and reports we make with the SEC from time to time. In particular, the following factors, among others, could cause results to differ materially from those expressed or implied by such forward-looking statements: our ability to successfully execute our business and growth strategy; the sufficiency of our cash and cash equivalents to meet our liquidity needs; the impact of our senior notes and any future indebtedness on our business, financial condition and results of operations; the demand for our platform in general; our ability to increase our number of new users and revenue generated from users; our ability to retain and expand our user base; the impact of the COVID-19 pandemic and other macro economic trends on our business and the easing of restrictions related to the COVID-19 pandemic; the fluctuation of our results of operations and our key business measures on a quarterly basis in future periods, including as a result of changes in our accounting estimates; our ability to successfully develop and deploy new technologies to address the needs of our users; our ability to maintain and enhance our brand and reputation; our ability to hire and retain talent; news or social media coverage about Roblox, including but not limited to coverage that presents, or relies on, inaccurate, misleading, incomplete, or otherwise damaging information; any breach or access to user or third-party data; and our ability to maintain the security and availability of our platform. Additional information regarding these and other risks and uncertainties that could cause actual results to differ materially from our expectations is included in the reports we have filed or will file with the SEC, including our Quarterly Report on Form 10-Q for the fiscal quarter ended March 31, 2022.
The forward-looking statements included in this press release represent our views as of the date of this press release. We anticipate that subsequent events and developments will cause our views to change. We undertake no intention or obligation to update or revise any forward-looking statements, whether as a result of new information, future events or otherwise. These forward-looking statements should not be relied upon as representing our views as of any date subsequent to the date of this press release. Past performance is not necessarily indicative of future results.
ROBLOX CORPORATION
CONDENSED CONSOLIDATED BALANCE SHEETS
(in thousands, except par values)
(unaudited)
| As of | |||||||||||
| June 30, 2022 | December 31, 2021 | ||||||||||
| Assets | |||||||||||
| Current assets: | |||||||||||
| Cash and cash equivalents | $ | 3,075,475 | $ | 3,004,300 | |||||||
| Accounts receivable—net of allowances | 186,825 | 307,349 | |||||||||
| Prepaid expenses and other current assets | 57,595 | 32,091 | |||||||||
| Deferred cost of revenue, current portion | 405,891 | 406,025 | |||||||||
| Total current assets | 3,725,786 | 3,749,765 | |||||||||
| Property and equipment—net | 425,950 | 271,352 | |||||||||
| Operating lease right-of-use assets | 424,416 | 221,285 | |||||||||
| Deferred cost of revenue, long-term | 154,328 | 137,524 | |||||||||
| Intangible assets, net | 56,317 | 59,666 | |||||||||
| Goodwill | 130,453 | 118,071 | |||||||||
| Other assets | 2,170 | 2,933 | |||||||||
| Total assets | $ | 4,919,420 | $ | 4,560,596 | |||||||
| Liabilities and Stockholders’ Equity | |||||||||||
| Current liabilities: | |||||||||||
| Accounts payable | $ | 77,509 | $ | 64,395 | |||||||
| Accrued expenses and other current liabilities | 231,199 | 180,769 | |||||||||
| Developer exchange liability | 147,192 | 163,906 | |||||||||
| Deferred revenue—current portion | 1,807,639 | 1,758,022 | |||||||||
| Total current liabilities | 2,263,539 | 2,167,092 | |||||||||
| Deferred revenue—net of current portion | 716,154 | 616,834 | |||||||||
| Operating lease liabilities | 399,776 | 194,616 | |||||||||
| Long-term debt, net | 988,345 | 987,723 | |||||||||
| Other long-term liabilities | 13 | 1,408 | |||||||||
| Total liabilities | 4,367,827 | 3,967,673 | |||||||||
| Commitments and contingencies (Note 11) | |||||||||||
| Stockholders’ Equity | |||||||||||
Common stock, $0.0001 par value; 5,000,000 and 5,000,000 authorized as of June 30, 2022, and December 31, 2021, respectively, 596,622 and 585,878 shares issued and outstanding as of June 30, 2022, and December 31, 2021, respectively; Class A common stock—4,935,000 and 4,935,000 shares authorized as of June 30, 2022, and December 31, 2021, respectively, 545,285 and 534,541 shares issued and outstanding as of June 30, 2022, and December 31, 2021, respectively; Class B common stock—65,000 and 65,000 shares authorized as of June 30, 2022, and December 31, 2021, respectively, 51,337 and 51,337 shares issued and outstanding as of June 30, 2022, and December 31, 2021, respectively | 59 | 58 | |||||||||
| Additional paid-in capital | 1,867,204 | 1,568,638 | |||||||||
Accumulated other comprehensive income/(loss) | 408 | 62 | |||||||||
| Accumulated deficit | (1,320,583) | (983,941) | |||||||||
| Total Roblox Corporation stockholders’ equity | 547,088 | 584,817 | |||||||||
| Noncontrolling interests | 4,505 | 8,106 | |||||||||
| Total stockholders’ equity | 551,593 | 592,923 | |||||||||
| Total liabilities and stockholders’ equity | $ | 4,919,420 | $ | 4,560,596 | |||||||
ROBLOX CORPORATION
CONDENSED CONSOLIDATED STATEMENTS OF OPERATIONS
(in thousands, except per share amounts)
(unaudited)
| Three Months Ended June 30, | Six Months Ended June 30, | ||||||||||||||||||||||
| 2022 | 2021 | 2022 | 2021 | ||||||||||||||||||||
Revenue(1) | $ | 591,207 | $ | 454,100 | $ | 1,128,341 | $ | 841,076 | |||||||||||||||
| Cost and expenses: | |||||||||||||||||||||||
Cost of revenue(1)(2) | 143,157 | 116,930 | 278,789 | 214,867 | |||||||||||||||||||
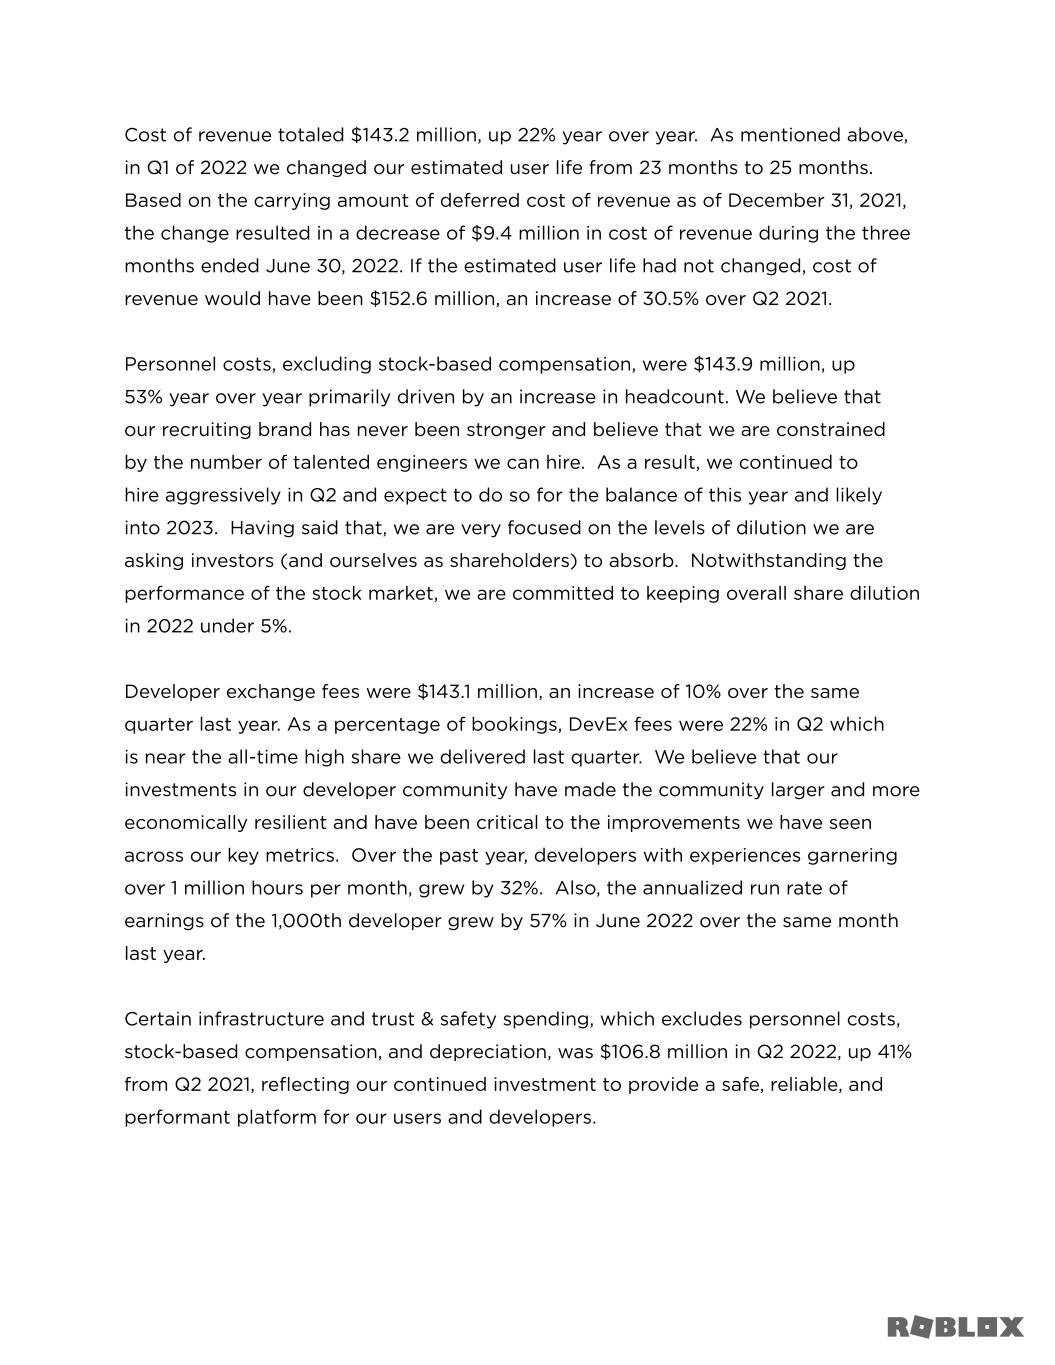
| Developer exchange fees | 143,148 | 129,714 | 290,270 | 248,652 | |||||||||||||||||||
| Infrastructure and trust & safety | 158,235 | 108,986 | 299,590 | 203,122 | |||||||||||||||||||
| Research and development | 211,757 | 124,748 | 389,519 | 221,392 | |||||||||||||||||||
| General and administrative | 78,676 | 97,678 | 136,448 | 192,053 | |||||||||||||||||||
| Sales and marketing | 26,501 | 18,990 | 55,603 | 38,992 | |||||||||||||||||||
| Total cost and expenses | 761,474 | 597,046 | 1,450,219 | 1,119,078 | |||||||||||||||||||
| Loss from operations | (170,267) | (142,946) | (321,878) | (278,002) | |||||||||||||||||||
| Interest income | 4,197 | 26 | 4,442 | 31 | |||||||||||||||||||
| Interest expense | (9,891) | — | (19,890) | — | |||||||||||||||||||
| Other income/(expense), net | (3,051) | 10 | (3,430) | (1,040) | |||||||||||||||||||
| Loss before income taxes | (179,012) | (142,910) | (340,756) | (279,011) | |||||||||||||||||||
| Provision for/(benefit from) income taxes | (278) | 20 | (2) | 22 | |||||||||||||||||||
| Consolidated net loss | (178,734) | (142,930) | (340,754) | (279,033) | |||||||||||||||||||
| Net loss attributable to the noncontrolling interest | (2,294) | (2,796) | (4,112) | (4,682) | |||||||||||||||||||
| Net loss attributable to common stockholders | $ | (176,440) | $ | (140,134) | $ | (336,642) | $ | (274,351) | |||||||||||||||
| Net loss per share attributable to common stockholders, basic and diluted | $ | (0.30) | $ | (0.25) | $ | (0.57) | $ | (0.63) | |||||||||||||||
| Weighted-average shares used in computing net loss per share attributable to common stockholders—basic and diluted | 593,928 | 571,300 | 591,252 | 432,159 | |||||||||||||||||||
(1)In Q1 of 2022, our estimated user life changed from 23 months to 25 months. Based on the carrying amount of deferred revenue and deferred cost of revenue as of December 31, 2021, the change resulted in a decrease in revenue during the three and six months ended June 30, 2022 by $40.9 million and $123.5 million, respectively, and a decrease in cost of revenue during the same periods by $9.4 million and $29.0 million, respectively.
(2)Depreciation of servers and infrastructure equipment included in infrastructure and trust & safety.
ROBLOX CORPORATION
CONDENSED CONSOLIDATED STATEMENTS OF CASH FLOWS
(in thousands)
(unaudited)
| Three Months Ended June 30, | Six Months Ended June 30, | ||||||||||||||||||||||
| 2022 | 2021 | 2022 | 2021 | ||||||||||||||||||||
| Cash flows from operating activities: | |||||||||||||||||||||||
| Consolidated net loss | $ | (178,734) | $ | (142,930) | $ | (340,754) | $ | (279,033) | |||||||||||||||
| Adjustments to reconcile net loss including noncontrolling interests to net cash provided by operations: | |||||||||||||||||||||||
| Depreciation and amortization | 28,996 | 17,790 | 53,493 | 34,410 | |||||||||||||||||||
| Stock-based compensation expense | 146,388 | 81,659 | 258,683 | 132,403 | |||||||||||||||||||
| Operating lease non-cash expense | 16,303 | 10,500 | 30,300 | 20,544 | |||||||||||||||||||
| Other non-cash charges/(credits) | 2,048 | 68 | 1,481 | 16 | |||||||||||||||||||
| Amortization of debt issuance costs | 311 | — | 622 | — | |||||||||||||||||||
| Changes in operating assets and liabilities, net of effect of acquisitions | |||||||||||||||||||||||
| Accounts receivable | (9,865) | 16,704 | 118,318 | 29,960 | |||||||||||||||||||
| Accounts payable | (6,867) | 3,095 | (10,635) | 2,313 | |||||||||||||||||||
| Prepaid expenses and other current assets | (15,983) | (16,297) | (26,923) | (27,264) | |||||||||||||||||||
| Other assets | 1,199 | (3,075) | 764 | (6,476) | |||||||||||||||||||
| Developer exchange liability | (2,624) | 6,278 | (16,714) | 9,703 | |||||||||||||||||||
| Accrued expenses and other current liabilities | 6,406 | 57,856 | 4,340 | 74,129 | |||||||||||||||||||
| Other long-term liability | (579) | 280 | (579) | 584 | |||||||||||||||||||
| Operating lease liabilities | (10,021) | (10,573) | (21,730) | (12,642) | |||||||||||||||||||
| Deferred revenue | 52,140 | 215,497 | 148,937 | 484,936 | |||||||||||||||||||
| Deferred cost of revenue | (2,621) | (45,601) | (16,670) | (107,863) | |||||||||||||||||||
| Net cash provided by operating activities | 26,497 | 191,251 | 182,933 | 355,720 | |||||||||||||||||||
| Cash flows from investing activities: | |||||||||||||||||||||||
| Acquisition of property and equipment | (83,812) | (23,235) | (135,602) | (45,368) | |||||||||||||||||||
| Payments related to business combination, net of cash acquired | (6,165) | — | (6,165) | — | |||||||||||||||||||
| Purchases of intangible assets | — | — | — | (256) | |||||||||||||||||||
| Net cash used in investing activities | (89,977) | (23,235) | (141,767) | (45,624) | |||||||||||||||||||
| Cash flows from financing activities: | |||||||||||||||||||||||
| Proceeds from issuance of common stock | 5,548 | 11,668 | 29,876 | 41,889 | |||||||||||||||||||
| Payment of term license related obligations | (420) | — | (420) | — | |||||||||||||||||||
| Payment of withholding taxes related to net share settlement of restricted stock units | — | — | (150) | — | |||||||||||||||||||
| Net proceeds from issuance of preferred stock | — | — | — | 534,286 | |||||||||||||||||||
| Payment of debt issuance cost | — | — | (154) | — | |||||||||||||||||||
| Net cash provided by financing activities | 5,128 | 11,668 | 29,152 | 576,175 | |||||||||||||||||||
| Effect of exchange rate changes on cash and cash equivalents | 863 | 48 | 857 | 48 | |||||||||||||||||||
| Net increase in cash and cash equivalents | (57,489) | 179,732 | 71,175 | 886,319 | |||||||||||||||||||
| Cash and cash equivalents | |||||||||||||||||||||||
| Beginning of period | 3,132,964 | 1,600,530 | 3,004,300 | 893,943 | |||||||||||||||||||
| End of period | $ | 3,075,475 | $ | 1,780,262 | $ | 3,075,475 | $ | 1,780,262 | |||||||||||||||
| Supplemental disclosure of cash flow information: | |||||||||||||||||||||||
| Cash paid for interest | $ | 19,590 | — | $ | 19,590 | — | |||||||||||||||||
| Cash paid for income taxes | — | — | — | — | |||||||||||||||||||
| Supplemental disclosure of noncash investing and financing activities: | |||||||||||||||||||||||
| Property and equipment additions in accounts payable and accrued expenses | $ | 114,610 | $ | 10,820 | $ | 114,610 | $ | 10,820 | |||||||||||||||
| Fair value of common stock and unregistered restricted stock units issued as consideration for business combination | $ | 10,138 | — | $ | 10,138 | — | |||||||||||||||||
| Conversion of convertible preferred stock to common stock upon direct listing | — | $ | 879,113 | — | $ | 879,113 | |||||||||||||||||
Use of Non-GAAP Financial Measures
This press release and the accompanying tables contain the non-GAAP financial measures bookings, free cash flow, and Adjusted EBITDA.
We use this non-GAAP financial information to evaluate our ongoing operations, for internal planning and forecasting purposes, and ongoing operating trends for purposes of analyzing the covenants specified in the indenture governing our senior notes due 2030. We believe that this non-GAAP financial information may be helpful to investors because it provides consistency and comparability with past financial performance.
Bookings is defined as revenue plus the change in deferred revenue during the period and other non-cash adjustments. Bookings is equal to the amount of virtual currency purchased by users in a given period of measurement. We believe bookings provide a timelier indication of trends in our operating results that are not necessarily reflected in our revenue as a result of the fact that we recognize the majority of revenue over the estimated average lifetime of a paying user. The change in deferred revenue constitutes the vast majority of the reconciling difference from revenue to bookings. By removing these non-cash adjustments, we are able to measure and monitor our business performance based on the timing of actual transactions with our users and the cash that is generated from these transactions. Free cash flow represents the net cash provided by operating activities less purchases of property, equipment, and intangible assets. We believe that free cash flow is a useful indicator of our unit economics and liquidity that provides information to management and investors about the amount of cash generated from our core operations that, after the purchases of property, equipment, and intangible assets, can be used for strategic initiatives, including investing in our business, making strategic acquisitions, and strengthening our balance sheet. Adjusted EBITDA is a measure of operating performance used in certain covenant calculations specified in the indenture governing our senior notes due 2030 that is not calculated in accordance with GAAP and may not conform to the calculation of EBITDA in other circumstances. Adjusted EBITDA should not be considered as a substitute for net loss as determined in accordance with GAAP. We believe that, when considered together with reported amounts, Adjusted EBITDA is useful to investors and management in understanding our ongoing operations and ongoing operating trends for purposes of analyzing the covenants specified in the indenture governing our senior notes due 2030.
Non-GAAP financial measures have limitations in their usefulness to investors because they have no standardized meaning prescribed by GAAP and are not prepared under any comprehensive set of accounting rules or principles. In addition, other companies, including companies in our industry, may calculate similarly titled non-GAAP financial measures differently or may use other measures to evaluate their performance, all of which could reduce the usefulness of our non-GAAP financial information as a tool for comparison. As a result, our non-GAAP financial information is presented for supplemental informational purposes only and should not be considered in isolation from, or as a substitute for financial information presented in accordance with GAAP.
A reconciliation table of the most comparable GAAP financial measure to each non-GAAP financial measure used in this press release is included at the end of this release. We encourage investors and others to review our business, results of operations, and financial information in their entirety, not to rely on any single financial measure, and to view these non-GAAP measures in conjunction with the most directly comparable GAAP financial measure.
| Three Months Ended June 30, | Six Months Ended June 30, | ||||||||||||||||||||||
| 2022 | 2021 | 2022 | 2021 | ||||||||||||||||||||
| (dollars in thousands) | (dollars in thousands) | ||||||||||||||||||||||
| Bookings | $ | 639,902 | $ | 665,480 | $ | 1,271,108 | $ | 1,317,757 | |||||||||||||||
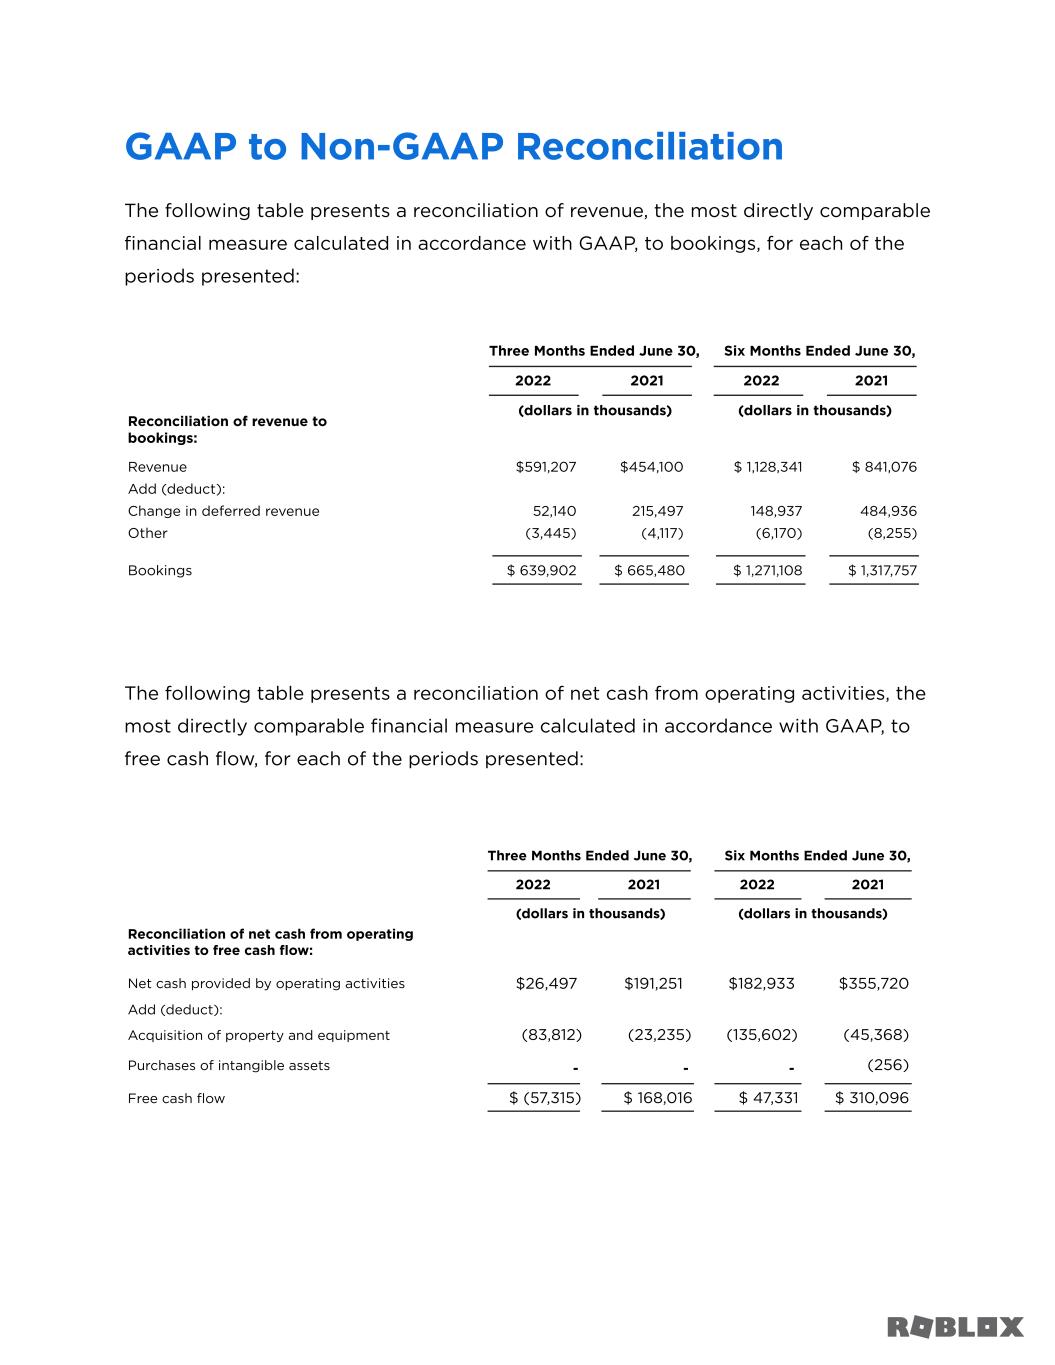
The following table presents a reconciliation of revenue, the most directly comparable financial measure calculated in accordance with GAAP, to bookings, for each of the periods presented:
| Three Months Ended June 30, | Six Months Ended June 30, | ||||||||||||||||||||||
| 2022 | 2021 | 2022 | 2021 | ||||||||||||||||||||
| (dollars in thousands) | (dollars in thousands) | ||||||||||||||||||||||
| Reconciliation of revenue to bookings: | |||||||||||||||||||||||
| Revenue | $ | 591,207 | $ | 454,100 | $ | 1,128,341 | $ | 841,076 | |||||||||||||||
| Add (deduct): | |||||||||||||||||||||||
| Change in deferred revenue | 52,140 | 215,497 | 148,937 | 484,936 | |||||||||||||||||||
| Other | (3,445) | (4,117) | (6,170) | (8,255) | |||||||||||||||||||
| Bookings | $ | 639,902 | $ | 665,480 | $ | 1,271,108 | $ | 1,317,757 | |||||||||||||||
| Three Months Ended June 30, | Six Months Ended June 30, | ||||||||||||||||||||||
| 2022 | 2021 | 2022 | 2021 | ||||||||||||||||||||
| (dollars in thousands) | (dollars in thousands) | ||||||||||||||||||||||
| Free cash flow | $ | (57,315) | $ | 168,016 | $ | 47,331 | $ | 310,096 | |||||||||||||||
The following table presents a reconciliation of net cash from operating activities, the most directly comparable financial measure calculated in accordance with GAAP, to free cash flow, for each of the periods presented:
| Three Months Ended June 30, | Six Months Ended June 30, | ||||||||||||||||||||||
| 2022 | 2021 | 2022 | 2021 | ||||||||||||||||||||
| (dollars in thousands) | (dollars in thousands) | ||||||||||||||||||||||
| Reconciliation of net cash from operating activities to free cash flow: | |||||||||||||||||||||||
| Net cash provided by operating activities | $ | 26,497 | $ | 191,251 | $ | 182,933 | $ | 355,720 | |||||||||||||||
| Add (deduct): | |||||||||||||||||||||||
| Acquisition of property and equipment | (83,812) | (23,235) | (135,602) | (45,368) | |||||||||||||||||||
| Purchases of intangible assets | — | — | — | (256) | |||||||||||||||||||
| Free cash flow | $ | (57,315) | $ | 168,016 | $ | 47,331 | $ | 310,096 | |||||||||||||||
Acquisition of property and equipment primarily includes servers, infrastructure equipment and tenant improvements.
| Three Months Ended June 30, | Six Months Ended June 30, | ||||||||||||||||||||||
| 2022 | 2021 | 2022 | 2021 | ||||||||||||||||||||
| (dollars in thousands) | (dollars in thousands) | ||||||||||||||||||||||
| Adjusted EBITDA | $ | 54,636 | $ | 180,071 | $ | 122,565 | $ | 370,245 | |||||||||||||||
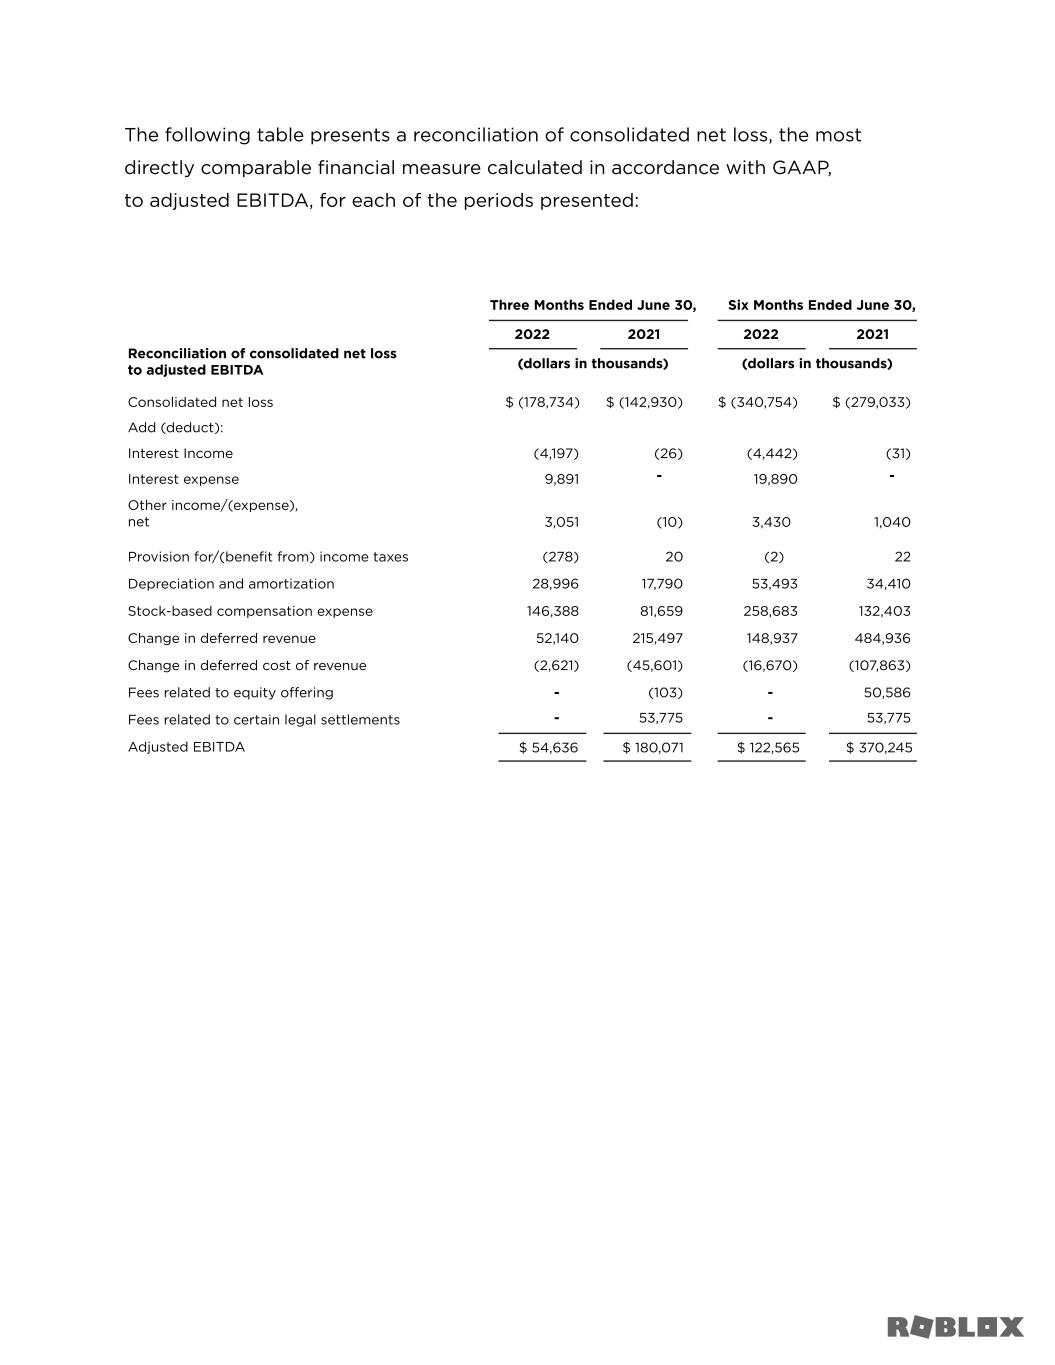
The following table presents a reconciliation of consolidated net loss, the most directly comparable financial measure calculated in accordance with GAAP, to adjusted EBITDA, for each of the periods presented:
| Three Months Ended June 30, | Six Months Ended June 30, | ||||||||||||||||||||||
| 2022 | 2021 | 2022 | 2021 | ||||||||||||||||||||
| (dollars in thousands) | (dollars in thousands) | ||||||||||||||||||||||
| Reconciliation of consolidated net loss to adjusted EBITDA: | |||||||||||||||||||||||
| Consolidated net loss | $ | (178,734) | $ | (142,930) | $ | (340,754) | $ | (279,033) | |||||||||||||||
| Add (deduct): | |||||||||||||||||||||||
| Interest income | (4,197) | (26) | (4,442) | (31) | |||||||||||||||||||
| Interest expense | 9,891 | — | 19,890 | — | |||||||||||||||||||
| Other income/(expense), net | 3,051 | (10) | 3,430 | 1,040 | |||||||||||||||||||
| Provision for/(benefit from) income taxes | (278) | 20 | (2) | 22 | |||||||||||||||||||
| Depreciation and amortization | 28,996 | 17,790 | 53,493 | 34,410 | |||||||||||||||||||
| Stock-based compensation expense | 146,388 | 81,659 | 258,683 | 132,403 | |||||||||||||||||||
| Change in deferred revenue | 52,140 | 215,497 | 148,937 | 484,936 | |||||||||||||||||||
| Change in deferred cost of revenue | (2,621) | (45,601) | (16,670) | (107,863) | |||||||||||||||||||
| Fees related to equity offering | — | (103) | — | 50,586 | |||||||||||||||||||
| Fees related to certain legal settlements | — | 53,775 | — | 53,775 | |||||||||||||||||||
| Adjusted EBITDA | $ | 54,636 | $ | 180,071 | $ | 122,565 | $ | 370,245 | |||||||||||||||
###
About Roblox
Roblox is reimagining the way people come together to connect, create and express themselves through immersive, interactive shared experiences. Every day, millions of people around the world play, learn, communicate, and expand their friendships as they explore millions of user-generated digital experiences, all built by creators on the platform. Our mission is to connect billions of users with civility and optimism and support a safe and diverse community — one that inspires and fosters creativity and positive relationships among people around the world. For more information, please visit corp.roblox.com.
CONTACTS
Stefanie Notaney
Roblox Corporate Communications
ROBLOX and the Roblox logo are among the registered and unregistered trademarks of Roblox Corporation in the United States and other countries. © 2022 Roblox Corporation. All rights reserved.
Source: Roblox Corporation