Exhibit 99.1

Chicago Atlantic Real Estate Finance
Announces Third Quarter 2025 Financial Results
CHICAGO— (November 4, 2025) Chicago Atlantic
Real Estate Finance, Inc. (NASDAQ: REFI) (“Chicago Atlantic” or the “Company”), a commercial mortgage real estate
investment trust, today announced its results for the quarter ended September 30, 2025.
Peter Sack, Co-Chief Executive Officer, noted,
“Our loan portfolio and earnings performance this quarter continue to benefit from a focus on proven operators in limited-license
states, strong underwriting, and disciplined deployment of available liquidity. We also remain well-insulated from potential adjustments
in the Prime rate with 86% of our current loans structured with interest rate floors greater than or equal to the prevailing Prime rate.
With a strong pace of originations during the quarter, a pipeline of over $415 million in new opportunities, and management of our upcoming
maturities, we are on track to generate net growth in the loan portfolio for 2025. Our focus is on delivering strong, risk-adjusted returns
to our stockholders, and we reinforced that commitment once again through recent purchases of the Company’s stock in the open market.”
Results of Operations
| | |
For the three months ended | |
| | |
September 30, 2025 | | |
June 30, 2025 | | |
September 30, 2024 | |
| | |
Total Amount | | |
Per Share | | |
Total Amount | | |
Per Share | | |
Total Amount | | |
Per Share | |
| OPERATING RESULTS | |
| | |
| | |
| | |
| | |
| | |
| |
| Net interest income | |
$ | 13,685,274 | | |
$ | 0.64 | | |
$ | 14,424,987 | | |
$ | 0.67 | | |
$ | 14,459,393 | | |
$ | 0.72 | |
| Total expenses before provision for expected credit losses | |
$ | 4,193,515 | | |
$ | 0.20 | | |
$ | 4,565,322 | | |
$ | 0.21 | | |
$ | 4,237,354 | | |
$ | 0.21 | |
| Net income - diluted | |
$ | 8,934,539 | | |
$ | 0.42 | | |
$ | 8,877,375 | | |
$ | 0.41 | | |
$ | 11,211,636 | | |
$ | 0.56 | |
| (Benefit) provision for current expected credit losses | |
$ | 557,220 | | |
$ | 0.03 | | |
$ | 1,147,290 | | |
$ | 0.05 | | |
$ | (989,597 | ) | |
$ | (0.05 | ) |
| Distributable earnings – basic | |
$ | 10,522,142 | | |
$ | 0.50 | | |
$ | 10,850,941 | | |
$ | 0.52 | | |
$ | 11,159,241 | | |
$ | 0.57 | |
| Diluted weighted average shares of common stock outstanding | |
| 21,485,776 | | |
| - | | |
| 21,487,106 | | |
| - | | |
| 20,058,417 | | |
| - | |
| Regular dividends declared (per share) | |
| - | | |
$ | 0.47 | | |
| - | | |
$ | 0.47 | | |
| - | | |
$ | 0.47 | |
| | |
| | | |
| | | |
| | | |
| | | |
| | | |
| | |
| PORTFOLIO PERFORMANCE | |
| | | |
| | | |
| | | |
| | | |
| | | |
| | |
| Total loan principal outstanding | |
$ | 399,948,492 | | |
| | | |
$ | 421,918,148 | | |
| | | |
$ | 356,285,780 | | |
| | |
| Portfolio companies | |
| 26 | | |
| | | |
| 30 | | |
| | | |
| 29 | | |
| | |
| Unfunded commitments | |
$ | 29,761,667 | | |
| | | |
$ | 16,595,000 | | |
| | | |
$ | 6,000,000 | | |
| | |
| Gross unlevered weighted average yield to maturity | |
| 16.5 | % | |
| | | |
| 16.8 | % | |
| | | |
| 18.2 | % | |
| | |
| Aggregate loan portfolio bearing a variable interest rate | |
| 63.3 | % | |
| | | |
| 59.3 | % | |
| | | |
| 62.2 | % | |
| | |
| Book value per share | |
$ | 14.71 | | |
| | | |
$ | 14.71 | | |
| | | |
$ | 15.05 | | |
| | |
| Debt/equity ratio | |
| 32.8 | % | |
| | | |
| 38.8 | % | |
| | | |
| 18.3 | % | |
| | |
Subsequent Portfolio Activity
| ● | During the subsequent period from October 1, 2025, to November
4, 2025, the Company advanced approximately $3.3 million to existing borrowers on delayed draw term loan facilities. |
Capital Activity
| ● | As of September 30, 2025, the Company had approximately $101.7 million of total leverage, comprised of $52.4 million drawn on the Revolving
Loan and $49.3 million, at carrying value, of notes payable due 2028. |
| ● | On August 5, 2025, Chicago Atlantic Lincoln, LLC (“CAL”), a wholly-owned financing subsidiary
of the Company, amended its secured revolving credit facility (the “Revolving Loan”) to extend the contractual maturity for
an additional two-year period, from June 30, 2026, to June 30, 2028. The Company retained its option to extend the term of the Revolving
Loan for an additional one-year period, provided no events of default exist and the Company provides 365 days’ notice of the extension.
No other material terms of the Revolving Loan were modified as a result of the execution of this Amendment. |
| ● | As of November 4, 2025, the Company has $69.1 million available on its secured revolving credit facility, and total liquidity, net
of estimated liabilities, of approximately $63 million. |
2025 Outlook
Chicago Atlantic affirmed its outlook previously
issued on March 12, 2025.
Conference Call and Quarterly Earnings Supplemental Details
Chicago Atlantic will host a conference call and
live audio webcast, both open for the general public to hear, later today at 9:00 a.m. Eastern Time. The number to call for this interactive
teleconference is (833) 630-1956 (international callers: 412-317-1837). The live audio webcast of the Company’s quarterly conference
call will be available online in the Investor Relations section of the Company’s website at www.refi.reit. The online replay will
be available approximately one hour after the end of the call and archived for one year.
Chicago Atlantic posted its Third Quarter 2025
Earnings Supplemental on the Investor Relations page of its website. Chicago Atlantic routinely posts important information for investors
on its website, www.refi.reit. The Company intends to use this website as a means of disclosing material information, for complying with
our disclosure obligations under Regulation FD and to post and update investor presentations and similar materials on a regular basis.
The Company encourages investors, analysts, the media and others interested in Chicago Atlantic to monitor the Investor Relations page
of its website, in addition to following its press releases, SEC filings, publicly available earnings calls, presentations, webcasts and
other information posted from time to time on the website. Please visit the IR Resources section of the website to sign up for email notifications.
About Chicago Atlantic Real Estate Finance,
Inc.
Chicago Atlantic Real Estate Finance, Inc.
(NASDAQ: REFI) is a market-leading commercial mortgage REIT utilizing significant real estate, credit and cannabis expertise to originate
senior secured loans primarily to state-licensed cannabis operators in limited-license states in the United States. REFI is part of the
Chicago Atlantic platform, which has offices in Chicago, Miami, New York, and London.
Forward-Looking Statements
This release contains forward-looking statements
within the meaning of the Private Securities Litigation Reform Act of 1995 that reflect our current views and projections with respect
to, among other things, future events and financial performance. Words such as “believes,” “expects,” “will,”
“intends,” “plans,” “guidance,” “estimates,” “projects,” “anticipates,”
and “future” or similar expressions are intended to identify forward- looking statements. These forward-looking statements,
including statements about our future growth and strategies for such growth, are subject to the inherent uncertainties in predicting future
results and conditions and are not guarantees of future performance, conditions or results. More information on these risks and other
potential factors that could affect our business and financial results is included in our filings with the SEC. New risks and uncertainties
arise over time, and it is not possible to predict those events or how they may affect us. We do not undertake any obligation to publicly
update or revise any forward-looking statements, whether as a result of new information, future events or otherwise, except as required
by law.
Contact:
Tripp Sullivan
SCR Partners
IR@REFI.reit
CHICAGO ATLANTIC REAL ESTATE FINANCE, INC.
CONSOLIDATED BALANCE SHEETS
| | |
September 30,
2025 | | |
December 31,
2024 | |
| | |
(unaudited) | | |
| |
| Assets | |
| | |
| |
| Loans held for investment | |
$ | 379,132,272 | | |
$ | 364,238,847 | |
| Loans held for investment - related party (Note 8) | |
| 18,918,950 | | |
| 38,238,199 | |
| Loans held for investment, at carrying value | |
| 398,051,222 | | |
| 402,477,046 | |
| Current expected credit loss reserve | |
| (4,990,988 | ) | |
| (4,346,869 | ) |
| Loans held for investment at carrying value, net | |
| 393,060,234 | | |
| 398,130,177 | |
| Loans, at fair value - related party (amortized cost of $0 and $5,500,000, respectively) | |
| - | | |
| 5,335,000 | |
| Cash and cash equivalents | |
| 28,920,537 | | |
| 26,400,448 | |
| Other receivables and assets, net | |
| 581,815 | | |
| 459,187 | |
| Interest receivable | |
| 4,488,146 | | |
| 1,453,823 | |
| Related party receivables | |
| 26,432 | | |
| 3,370,339 | |
| Total Assets | |
$ | 427,077,164 | | |
$ | 435,148,974 | |
| | |
| | | |
| | |
| Liabilities | |
| | | |
| | |
| Revolving loan | |
$ | 52,400,000 | | |
$ | 55,000,000 | |
| Notes payable, net | |
| 49,274,644 | | |
| 49,096,250 | |
| Dividend payable | |
| 9,905,390 | | |
| 13,605,153 | |
| Related party payables | |
| 3,073,015 | | |
| 2,043,403 | |
| Management and incentive fees payable | |
| 1,435,071 | | |
| 2,863,158 | |
| Accounts payable and other liabilities | |
| 1,059,768 | | |
| 2,285,035 | |
| Interest reserve | |
| 14,597 | | |
| 1,297,878 | |
| Total Liabilities | |
| 117,162,485 | | |
| 126,190,877 | |
| Commitments and contingencies (Note 9) | |
| | | |
| | |
| | |
| | | |
| | |
| Stockholders’ equity | |
| | | |
| | |
| Common stock, par value $0.01 per share, 100,000,000 shares authorized and 21,075,298 and 20,829,228 shares issued and outstanding, respectively | |
| 210,753 | | |
| 208,292 | |
| Additional paid-in-capital | |
| 322,226,137 | | |
| 318,886,768 | |
| Accumulated deficit | |
| (12,522,211 | ) | |
| (10,136,963 | ) |
| Total stockholders’ equity | |
| 309,914,679 | | |
| 308,958,097 | |
| | |
| | | |
| | |
| Total liabilities and stockholders’ equity | |
$ | 427,077,164 | | |
$ | 435,148,974 | |
CHICAGO ATLANTIC REAL ESTATE FINANCE, INC.
CONSOLIDATED STATEMENTS OF INCOME
(UNAUDITED)
| | |
For the three months ended
September 30, | | |
For the nine months ended
September 30, | |
| | |
2025 | | |
2024 | | |
2025 | | |
2024 | |
| Revenues | |
| | |
| | |
| | |
| |
| Interest income | |
$ | 15,250,866 | | |
$ | 16,258,744 | | |
$ | 46,860,217 | | |
$ | 46,624,842 | |
| Interest expense | |
| (1,565,592 | ) | |
| (1,799,351 | ) | |
| (5,708,022 | ) | |
| (5,742,333 | ) |
| Net interest income | |
| 13,685,274 | | |
| 14,459,393 | | |
| 41,152,195 | | |
| 40,882,509 | |
| | |
| | | |
| - | | |
| | | |
| - | |
| Expenses | |
| | | |
| | | |
| | | |
| | |
| Management and incentive fees, net | |
| 1,435,071 | | |
| 1,669,116 | | |
| 5,103,561 | | |
| 5,198,738 | |
| General and administrative expense | |
| 1,298,910 | | |
| 1,254,062 | | |
| 3,766,140 | | |
| 3,898,864 | |
| Professional fees | |
| 530,880 | | |
| 468,652 | | |
| 1,503,939 | | |
| 1,327,659 | |
| Stock based compensation | |
| 928,654 | | |
| 845,524 | | |
| 2,459,094 | | |
| 2,213,150 | |
| Provision (benefit) for current expected credit losses | |
| 557,220 | | |
| (989,597 | ) | |
| 631,233 | | |
| (884,789 | ) |
| Total expenses | |
| 4,750,735 | | |
| 3,247,757 | | |
| 13,463,967 | | |
| 11,753,622 | |
| Change in unrealized gain (loss) on investments | |
| - | | |
| - | | |
| 165,000 | | |
| (75,604 | ) |
| Realized gain on debt securities, at fair value | |
| - | | |
| - | | |
| - | | |
| 72,428 | |
| Net Income before income taxes | |
| 8,934,539 | | |
| 11,211,636 | | |
| 27,853,228 | | |
| 29,125,711 | |
| Income tax expense | |
| - | | |
| - | | |
| - | | |
| - | |
| Net Income | |
$ | 8,934,539 | | |
$ | 11,211,636 | | |
$ | 27,853,228 | | |
$ | 29,125,711 | |
| | |
| | | |
| | | |
| | | |
| | |
| Earnings per common share: | |
| | | |
| | | |
| | | |
| | |
| Basic earnings per common share | |
$ | 0.42 | | |
$ | 0.57 | | |
$ | 1.33 | | |
$ | 1.53 | |
| Diluted earnings per common share | |
$ | 0.42 | | |
$ | 0.56 | | |
$ | 1.30 | | |
$ | 1.49 | |
| | |
| | | |
| | | |
| | | |
| | |
| Weighted average number of common shares outstanding: | |
| | | |
| | | |
| | | |
| | |
| Basic weighted average shares of common stock outstanding | |
| 21,074,771 | | |
| 19,625,190 | | |
| 20,979,467 | | |
| 19,094,462 | |
| Diluted weighted average shares of common stock outstanding | |
| 21,485,776 | | |
| 20,058,417 | | |
| 21,413,422 | | |
| 19,531,691 | |
Distributable Earnings
In addition to using certain financial metrics
prepared in accordance with GAAP to evaluate our performance, we also use Distributable Earnings to evaluate our performance. Distributable
Earnings is a measure that is not prepared in accordance with GAAP. We define Distributable Earnings as, for a specified period, the net
income (loss) computed in accordance with GAAP, excluding (i) non-cash equity compensation expense, (ii) depreciation and amortization,
(iii) any unrealized gains, losses or other non-cash items recorded in net income (loss) for the period, regardless of whether such items
are included in other comprehensive income or loss, or in net income (loss); provided that Distributable Earnings does not exclude, in
the case of investments with a deferred interest feature (such as OID, debt instruments with PIK interest and zero coupon securities),
accrued income that we have not yet received in cash, (iv) provision for current expected credit losses and (v) one-time events pursuant
to changes in GAAP and certain non-cash charges, in each case after discussions between our Manager and our independent directors and
after approval by a majority of such independent directors. We believe providing Distributable Earnings on a supplemental basis to our
net income as determined in accordance with GAAP is helpful to stockholders in assessing the overall performance of our business. As a
REIT, we are required to distribute at least 90% of our annual REIT taxable income and to pay tax at regular corporate rates to the extent
that we annually distribute less than 100% of such taxable income. Given these requirements and our belief that dividends are generally
one of the principal reasons that stockholders invest in our common stock, we generally intend to attempt to pay dividends to our stockholders
in an amount equal to our net taxable income, if and to the extent authorized by our Board. Distributable Earnings is one of many factors
considered by our Board in authorizing dividends and, while not a direct measure of net taxable income, over time, the measure can be
considered a useful indicator of our dividends.
In our Annual Report on Form 10-K, we defined
Distributable Earnings so that, in addition to the exclusions noted above, the term also excluded from net income Incentive Compensation
paid to our Manager. We believe that revising the term Distributable Earnings so that it is presented net of Incentive Compensation, while
not a direct measure of net taxable income, over time, can be considered a more useful indicator of our ability to pay dividends. This
adjustment to the calculation of Distributable Earnings has no impact on period-to-period comparisons. Distributable Earnings should not
be considered as substitutes for GAAP net income. We caution readers that our methodology for calculating Distributable Earnings may differ
from the methodologies employed by other REITs to calculate the same or similar supplemental performance measures, and as a result, our
reported Distributable Earnings may not be comparable to similar measures presented by other REITs.
| | |
Three months ended | | |
Three months ended | | |
Nine months ended | | |
Nine months ended | |
| | |
September 30, 2025 | | |
September 30, 2024 | | |
September 30, 2025 | | |
September 30, 2024 | |
| Net Income | |
$ | 8,934,539 | | |
$ | 11,211,636 | | |
$ | 27,853,228 | | |
$ | 29,125,711 | |
| Adjustments to net income | |
| | | |
| | | |
| | | |
| | |
| Stock based compensation | |
| 928,654 | | |
| 845,524 | | |
| 2,459,094 | | |
| 2,213,150 | |
| Amortization of debt issuance costs | |
| 101,729 | | |
| 91,678 | | |
| 322,186 | | |
| 182,593 | |
| Provision (benefit) for current expected credit losses | |
| 557,220 | | |
| (989,597 | ) | |
| 631,233 | | |
| (884,789 | ) |
| Change in unrealized gain (loss) on investments | |
| - | | |
| - | | |
| (165,000 | ) | |
| 75,604 | |
| Distributable Earnings | |
$ | 10,522,142 | | |
$ | 11,159,241 | | |
$ | 31,100,741 | | |
$ | 30,712,269 | |
| Basic weighted average shares of common stock outstanding (in shares) | |
| 21,074,771 | | |
| 19,625,190 | | |
| 20,979,467 | | |
| 19,094,462 | |
| Basic Distributable Earnings per Weighted Average Share | |
$ | 0.50 | | |
$ | 0.57 | | |
$ | 1.48 | | |
$ | 1.61 | |
| Diluted weighted average shares of common stock outstanding (in shares) | |
| 21,485,776 | | |
| 20,058,417 | | |
| 21,413,422 | | |
| 19,531,691 | |
| Diluted Distributable Earnings per Weighted Average Share | |
$ | 0.49 | | |
$ | 0.56 | | |
$ | 1.45 | | |
$ | 1.57 | |
Exhibit 99.2
CONFIDENTIAL | Chicago Atlantic Advisers, LLC REAL ESTATE FINANCE EARNINGS SUPPLEMENTAL For the quarter ended September 30, 2025
Forward Looking Statements This presentation contains forward - looking statements, within the meaning of the Private Securities Litigation Reform Act of 1995 and Section 21 E of the Securities and Exchange Act of 1934 , as amended (the “Exchange Act”), regarding future events and the future results of Chicago Atlantic Real Estate Finance, Inc . (“Chicago Atlantic”, “REFI”, the “Company”, and “we”, “us”, and “our”) that are based on current expectations, estimates, forecasts, projections about the industry in which the Company operates and the beliefs and assumptions of the management of the Company . Words such as “address,” “anticipate,” “believe,” “consider,” “continue,” “develop,” “estimate,” “expect,” “further,” “goal,” “intend,” “may,” “plan,” “potential,” “project,” “seek,” “should,” “target,” “will,” variations of such words and similar expressions are intended to identify such forward - looking statements . Such statements reflect the current views of the Company and its management with respect to future events and are subject to certain risks, uncertainties and assumptions . Should one or more of these risks or uncertainties materialize, or should underlying assumptions prove incorrect, the Company’s actual results, performance or achievements could differ materially from the results expressed in, or implied by, these forward - looking statements . Summaries of documents contained in this presentation may not be complete . The Company does not represent that the information herein is complete . The information in this presentation is current only as of September 30 , 2025 , or such other date noted in this presentation, and the Company’s business or financial condition and other information in this presentation may change after that date . The Company undertakes no obligation to update any forward - looking statements in order to reflect any event or circumstance occurring after the date of this presentation or currently unknown facts or conditions . You are urged to review and carefully consider any cautionary statements and other disclosures, including the statements under the heading “Risk Factors” and elsewhere in the Company’s filings with the Securities and Exchange Commission . Factors that may cause actual results to differ materially from current expectations include, among others : the Company’s business and investment strategy ; global conflicts, such as the war between Russia and Ukraine and the war between Israel and Hamas and market volatility resulting from such conflicts ; the ability of Chicago Atlantic REIT Manager, LLC (the “Manager”) to locate suitable loan opportunities for the Company and allocate such opportunities among the Company and affiliates with similar investment strategies, monitor and actively manage the Company’s loan portfolio and implement the Company’s investment strategy ; allocation of loan opportunities to the Company by the Manager ; the Company’s projected operating results ; actions and initiatives of the U . S . or state governments and changes to government policies and the execution and impact of these actions, initiatives and policies, including the fact that cannabis remains illegal under federal law ; the estimated growth in and evolving market dynamics of the cannabis market ; the demand for cannabis cultivation and processing facilities ; shifts in public opinion regarding cannabis ; the state of the U . S . economy generally or in specific geographic regions ; economic trends and economic recoveries ; the amount and timing of the Company’s cash flows, if any, from the Company’s loans ; the Company’s ability to obtain and maintain financing arrangements ; the Company’s leverage ; changes in the value of the Company’s loans ; the Company’s investment and underwriting process ; rates of default or decreased recovery rates on the Company’s loans ; the degree to which any interest rate or other hedging strategies may or may not protect the Company from interest rate volatility ; changes in interest rates and impacts of such changes on the Company’s results of operations, cash flows and the market value of the Company’s loans ; interest rate mismatches between the Company’s loans and the Company’s borrowings used to fund such loans ; the impact of inflation on our operating results ; the departure of any of the executive officers or key personnel supporting and assisting the Company from the Manager or its affiliates ; impact of and changes in governmental regulations, tax law and rates, accounting guidance and similar matters ; the Company’s ability to maintain the Company’s exclusion or exemption from registration under the Investment Company Act of 1940 ; the Company’s ability to qualify and maintain such qualification as a real estate investment trust (“REIT”) for U . S . federal income tax purposes ; estimates relating to the Company’s ability to make distributions to its stockholders in the future ; the Company’s understanding of its competition ; and market trends in the Company’s industry, interest rates, real estate values, the securities markets or the economy in general . The information contained in this presentation should be read in conjunction with our financial statements and notes thereto appearing elsewhere in our annual report on Form 10 - K for the year ended December 31 , 2024 , and other documents we file from time to time with the SEC . You are advised to consult any additional disclosures that we may make through reports that we have filed or in the future may file with the SEC, including annual reports on Form 10 - K, quarterly reports on Form 10 - Q, and current reports on Form 8 - K . Chicago Atlantic Real Estate Finance, Inc 2 Important Disclosure Information
Market and Industry Data In this presentation, the Company relies on and refers to certain information and statistics obtained from third - party sources which it believes to be reliable, including reports by market research firms . The Company has not independently verified the accuracy or completeness of any such third - party information . Because the cannabis industry is relatively new and rapidly evolving, such market and industry data may be subject to significant change in a relatively short period . Important Notices This presentation is by Chicago Atlantic Real Estate Finance, Inc . , (“REFI” or the “Company”) a publicly traded company that has elected to be taxed as a REIT for federal income tax purposes . This presentation is provided for informational purposes only and is not an offer to sell, or a solicitation of an offer to buy, any security or instrument . REFI is not a registered investment adviser and is managed by Chicago Atlantic REIT Manager, LLC (our “Manager”) . This presentation is not a communication by our Manager and is not designed to maintain any existing client or investor or solicit new clients or investors of the Manager . We routinely post important information for investors on our website, refi . reit . We intend to use this webpage as a means of disclosing material information, for complying with our disclosure obligations under Regulation FD and to post and update investor presentations and similar materials on a regular basis . REFI encourages investors, analysts, the media and others interested in REFI to monitor the Investor Relations section of our website, in addition to following our press releases, SEC filings, public conference calls, presentations, webcasts and other information we post from time to time on our website . Past performance is no guarantee of future results . There is no guarantee that any investment strategy referenced herein will work under all market conditions . You alone assume the responsibility of evaluating the merits and risks associated with any potential investment or investment strategy referenced herein . The information contained herein is not intended to provide, and should not be relied upon for accounting, legal or tax advice or investment recommendations for REFI or any of its affiliates . Non - GAAP Financial Measures This presentation includes certain non - GAAP financial measures, including Distributable Earnings, to evaluate our performance excluding the effects of certain transactions and certain GAAP adjustments that we believe are not necessarily indicative of our current loan activity and operations . We believe the non - GAAP financial measures are useful for management, investors, analysts, and other interested parties in evaluating our performance but should not be viewed in isolation and are not a substitute for financial measures computed in accordance with GAAP . We define Distributable Earnings as, for a specified period, the net income (loss) computed in accordance with GAAP, excluding (i) non - cash equity compensation expense, (ii) depreciation and amortization, (iii) any unrealized gains, losses or other non - cash items recorded in net income (loss) for the period, regardless of whether such items are included in other comprehensive income or loss, or in net income (loss) ; provided that Distributable Earnings does not exclude, in the case of investments with a deferred interest feature (such as OID, debt instruments with PIK interest and zero coupon securities), accrued income that we have not yet received in cash, (iv) provision for current expected credit losses and (v) one - time events pursuant to changes in GAAP and certain non - cash charges, in each case after discussions between our Manager and our independent directors and after approval by a majority of such independent directors . We believe providing Distributable Earnings on a supplemental basis to our net income as determined in accordance with GAAP is helpful to stockholders in assessing the overall performance of our business . As a REIT, we are required to distribute at least 90 % of our annual REIT taxable income and to pay tax at regular corporate rates to the extent that we annually distribute less than 100 % of such taxable income . Given these requirements and our belief that dividends are generally one of the principal reasons that stockholders invest in our common stock, we generally intend to attempt to pay dividends to our stockholders in an amount equal to our net taxable income, if and to the extent authorized by our Board . Distributable Earnings is one of many factors considered by our Board in authorizing dividends and, while not a direct measure of net taxable income, over time, the measure can be considered a useful indicator of our dividends . Chicago Atlantic Real Estate Finance, Inc 3 Important Disclosure Information
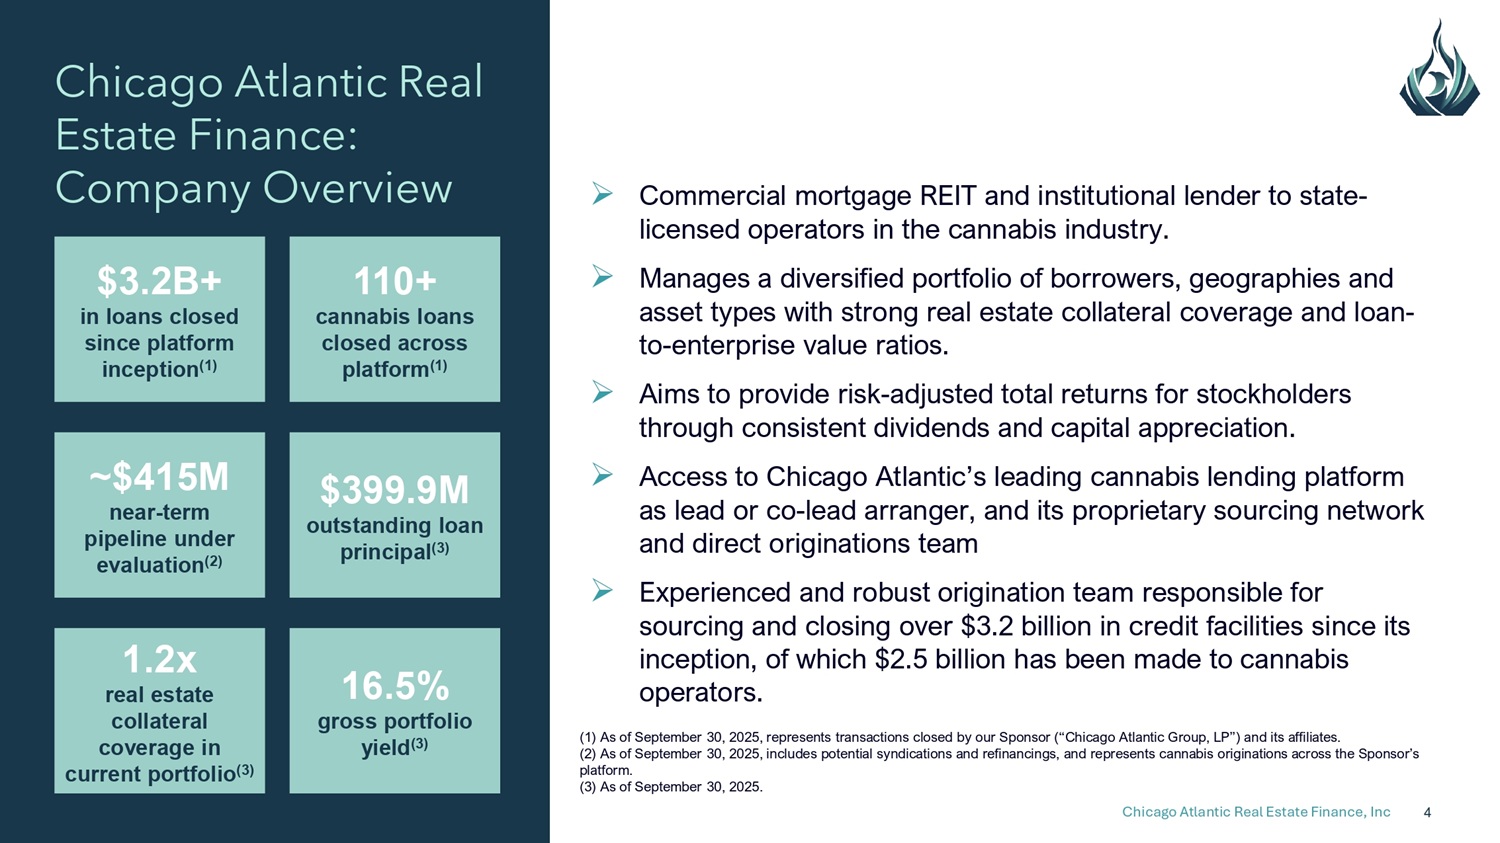
Chicago Atlantic Real Estate Finance: Company Overview Chicago Atlantic Real Estate Finance, Inc 4 » Commercial mortgage REIT and institutional lender to state - licensed operators in the cannabis industry. » Manages a diversified portfolio of borrowers, geographies and asset types with strong real estate collateral coverage and loan - to - enterprise value ratios. » Aims to provide risk - adjusted total returns for stockholders through consistent dividends and capital appreciation. » Access to Chicago Atlantic’s leading cannabis lending platform as lead or co - lead arranger, and its proprietary sourcing network and direct originations team » Experienced and robust origination team responsible for sourcing and closing over $3.2 billion in credit facilities since its inception, of which $2.5 billion has been made to cannabis operators. (1) As of September 30, 2025, represents transactions closed by our Sponsor (“Chicago Atlantic Group, LP”) and its affiliates. (2) As of September 30, 2025, includes potential syndications and refinancings, and represents cannabis originations across the Sponsor’s platform. (3) As of September 30, 2025. ~$415M near - term pipeline under evaluation (2) $3.2B+ in loans closed since platform inception (1) 110+ cannabis loans closed across platform (1) $399.9M outstanding loan principal (3) 16.5% gross portfolio yield (3) 1.2x real estate collateral coverage in current portfolio (3)

P e t e r S a c k ( 1 ) C o - C E O Tony Cappell (1) Co - CEO John Mazarakis (1) Executive Chairman ▪ ▪ Debt investor with over 15 years of experience, beginning at Wells Fargo Foothill ▪ Completed over 150 deals, comprising over $5bn in total credit ▪ MBA from Chicago Booth and BA from University of Wisconsin ▪ Originated over $500mm in cannabis credit transactions ▪ Developed and owns over 1mm sf of real estate across 4 states ▪ Founded restaurant group with 30+ units and 1,200+ employees Industry - Leading Management and Investment Team Deep Cannabis, Credit and Real Estate Expertise With Entrepreneurial Approach (1) Denotes member of Investment Committee Chicago Atlantic Real Estate Finance, Inc 5

Elizabeth Stavola Michael Steiner Brandon Konigsberg Jason Papastavrou ▪ Founder & President of MPX Bioceutical Corp (MPX) which went public in 2017 ▪ Founder & Creator of the brands CBD for Life, Melting Point Extracts (MPX), Health for Life AZ, GreenMart of Maryland & Nevada ▪ Former CSO & Board Member of iAnthus Capital Management ▪ Former Top Institutional Equities Salesperson at Jefferies & Co. ▪ Founder and President of Service Energy and Petroleum Equipment, which are engaged in the energy, transportation and environmental services business. ▪ Expert in highly regulated industries ▪ BA in History from Wake Forest University and MBA from University of Delaware ▪ Former CFO at J.P. Morgan Securities and Managing Director at JPMorgan Chase ▪ Current member of board of directors of GTJ REIT, SEC - registered equity REIT ▪ Former auditor at Goldstein, Golub and Kessler ▪ CPA and BA in Accounting from University of Albany and MBA from New York University’s Stern School of Business ▪ Lead Independent Director ▪ Founder and CIO of ARIS Capital Management ▪ Current member of board of directors of GXO Logistics (NYSE:GXO); and previous board member of XPO Logistics (NYSE:XPO) and United Rentals (NYSE:URI) ▪ BS in Mathematics and MS and PhD in Electrical Engineering and Computer Science from MIT Veteran Independent Directors Significant Public Board, REIT, Financial and Corporate Governance Expertise Chicago Atlantic Real Estate Finance, Inc 6
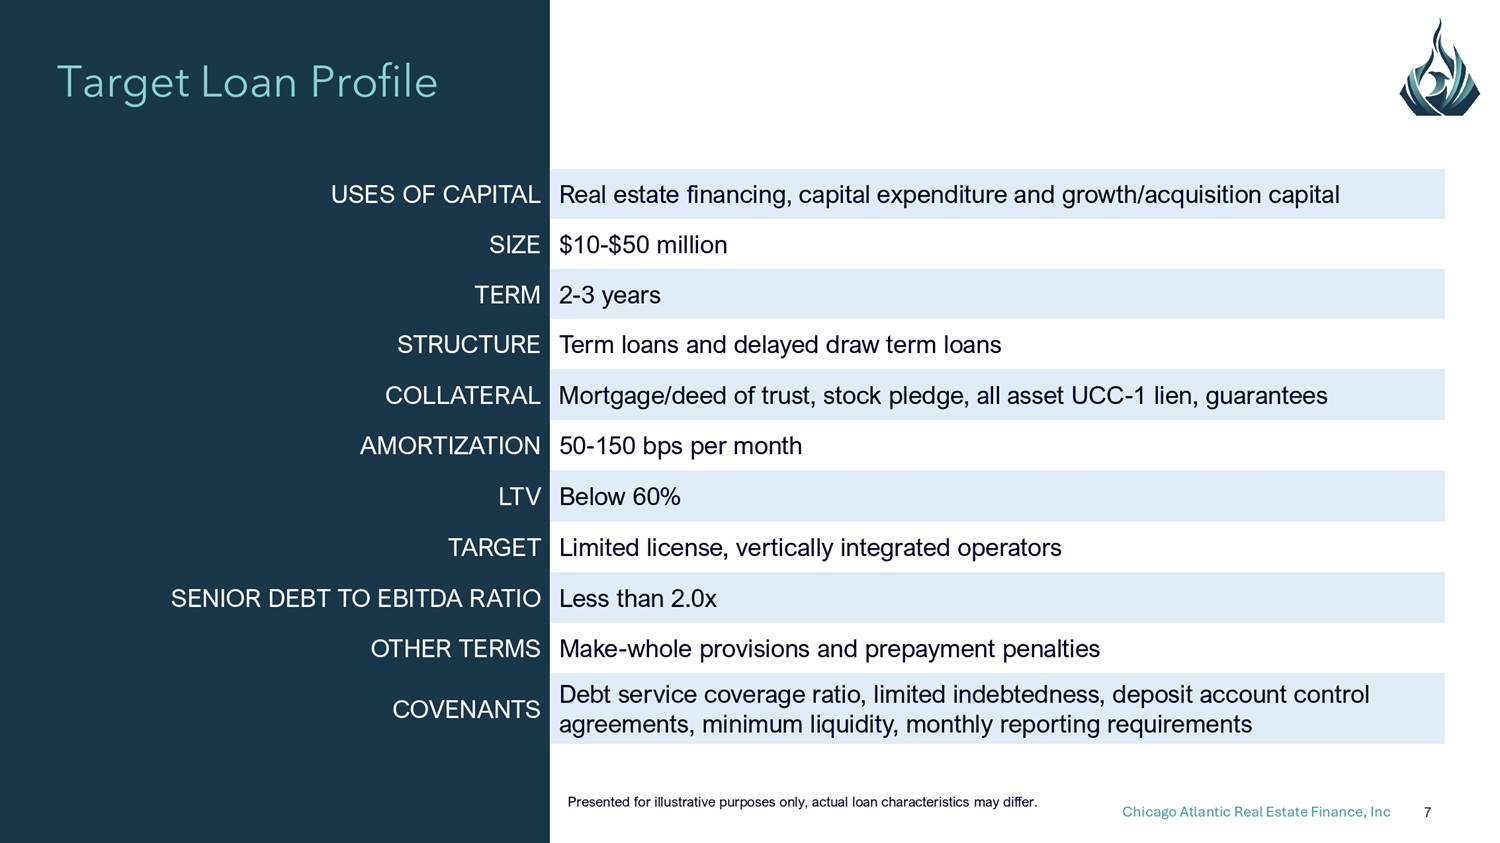
Target Loan Profile Presented for illustrative purposes only, actual loan characteristics may differ. Chicago Atlantic Real Estate Finance, Inc 7 Real estate financing, capital expenditure and growth/acquisition capital USES OF CAPITAL $10 - $50 million SIZE 2 - 3 years TERM Term loans and delayed draw term loans STRUCTURE Mortgage/deed of trust, stock pledge, all asset UCC - 1 lien, guarantees COLLATERAL 50 - 150 bps per month AMORTIZATION Below 60% LTV Limited license, vertically integrated operators TARGET Less than 2.0x SENIOR DEBT TO EBITDA RATIO Make - whole provisions and prepayment penalties OTHER TERMS Debt service coverage ratio, limited indebtedness, deposit account control agreements, minimum liquidity, monthly reporting requirements COVENANTS
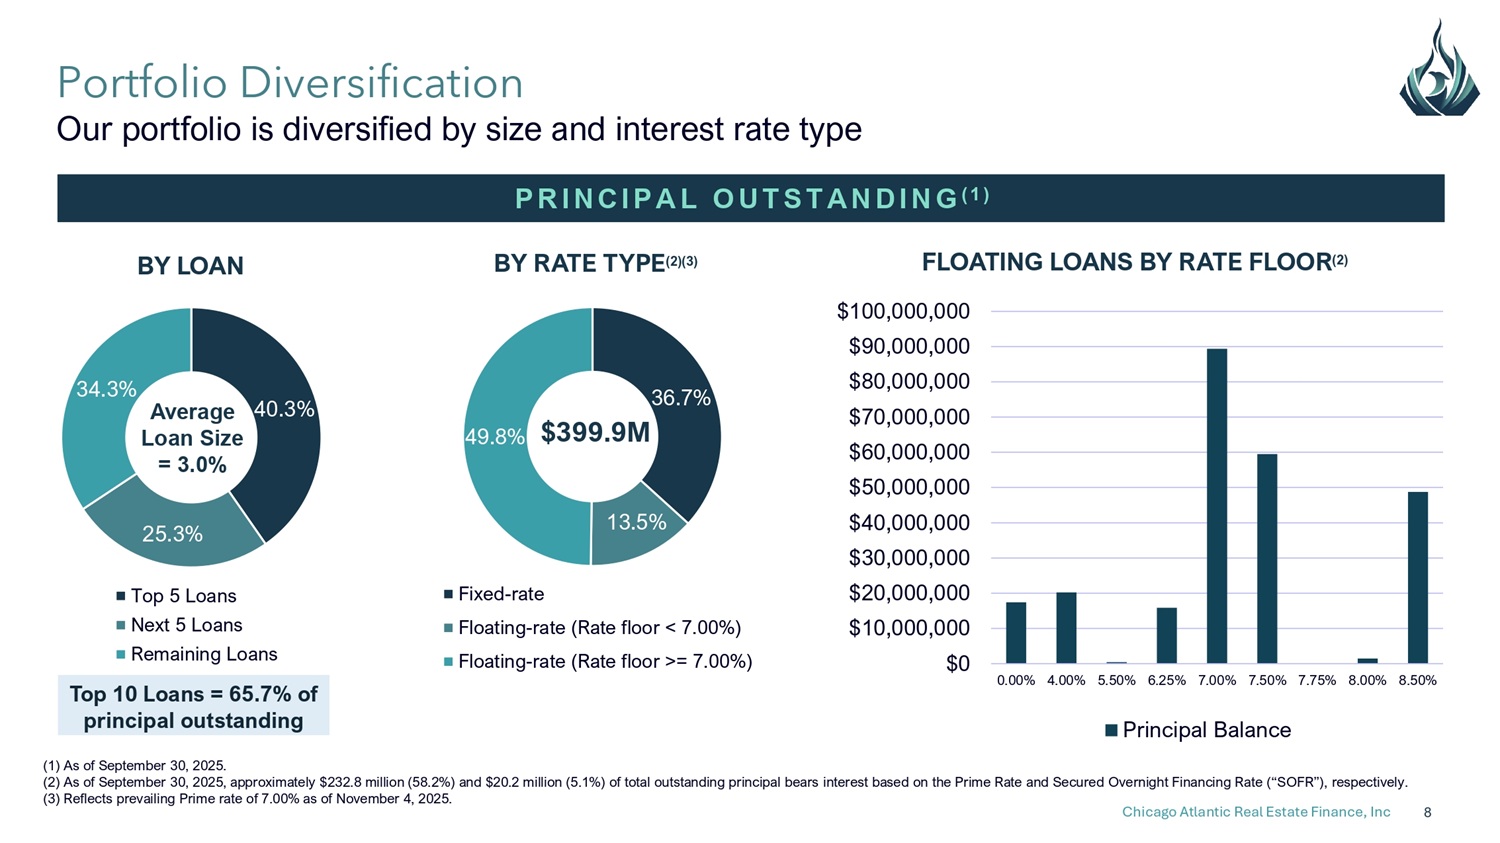
(1) As of September 30, 2025. (2) As of September 30, 2025, approximately $232.8 million (58.2%) and $20.2 million (5.1%) of total outstanding principal bears interest based on the Prime Rate and Secured Overnight Financing Rate (“SOFR”), respectively. (3) Reflects prevailing Prime rate of 7.00% as of November 4, 2025. Chicago Atlantic Real Estate Finance, Inc 8 P RI NCI P AL O UT S T ANDI NG ( 1 ) Portfolio Diversification Our portfolio is diversified by size and interest rate type 40.3% 25.3% 34.3% Top 5 Loans Next 5 Loans Remaining Loans Average Loan Size = 3.0% 36.7% 13.5% 49.8% Fixed - rate Floating - rate (Rate floor < 7.00%) Floating - rate (Rate floor >= 7.00%) BY RATE TYPE (2)(3) FLOATING LOANS BY RATE FLOOR (2) $80,000,000 $70,000,000 $60,000,000 $50,000,000 $40,000,000 $30,000,000 $20,000,000 $10,000,000 $0 $100,000,000 $90,000,000 0.00% 4.00% 5.50% 6.25% 7.00% 7.50% 7.75% 8.00% 8.50% Principal Balance $399.9M Top 10 Loans = 65.7% of principal outstanding BY LOAN
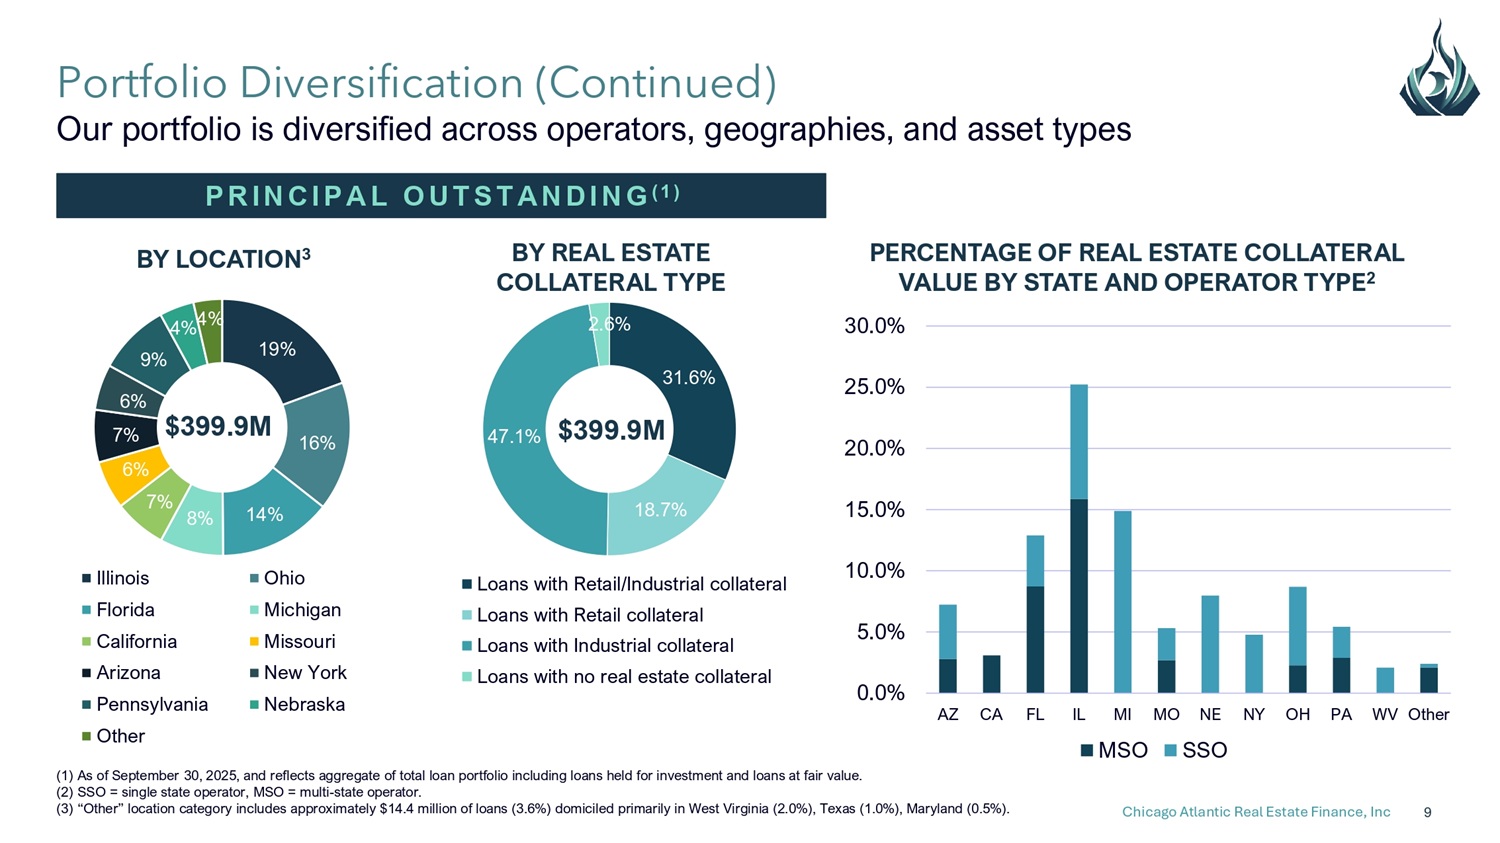
Chicago Atlantic Real Estate Finance, Inc 9 (1) As of September 30, 2025, and reflects aggregate of total loan portfolio including loans held for investment and loans at fair value. (2) SSO = single state operator, MSO = multi - state operator. (3) “Other” location category includes approximately $14.4 million of loans (3.6%) domiciled primarily in West Virginia (2.0%), Texas (1.0%), Maryland (0.5%). Portfolio Diversification (Continued) Our portfolio is diversified across operators, geographies, and asset types P RI NCI P AL O UT S T ANDI NG ( 1 ) 19% 16% 14% 7% 8% 6% 7% 6% 9% 4% 4% Ohio Michigan Missouri New York Nebraska Illinois Florida California Arizona Pennsylvania Other $399.9M BY LOCATION 3 31.6% 18.7% 47.1% Loans with Retail/Industrial collateral Loans with Retail collateral Loans with Industrial collateral Loans with no real estate collateral $399.9M BY REAL ESTATE COLLATERAL TYPE 2.6% PERCENTAGE OF REAL ESTATE COLLATERAL VALUE BY STATE AND OPERATOR TYPE 2 0.0% 5.0% 10.0% 15.0% 20.0% 25.0% 30.0% OH PA WV Other AZ CA FL IL MI MO NE NY MSO SSO
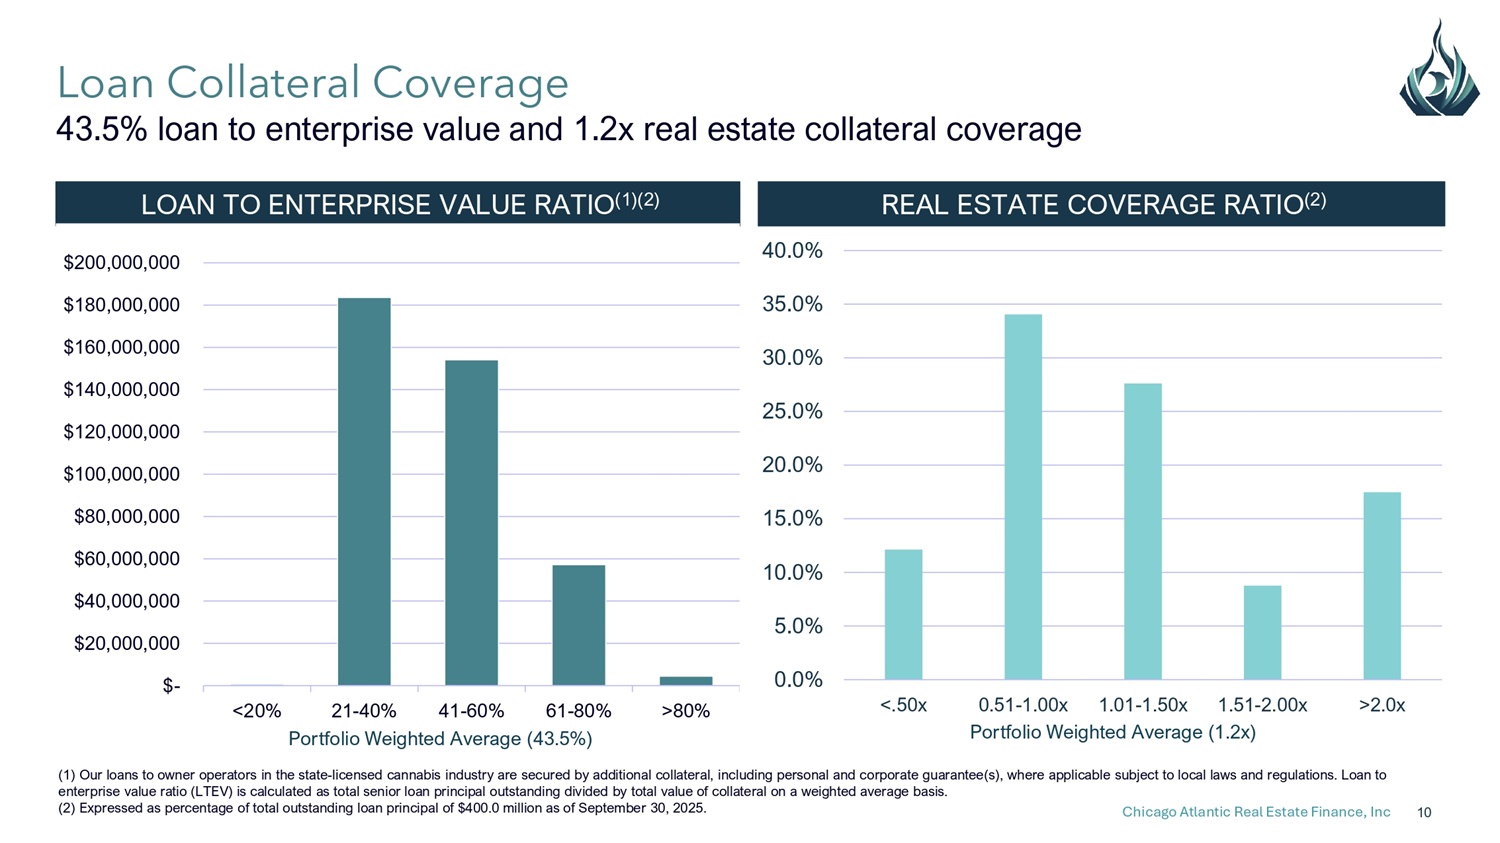
Chicago Atlantic Real Estate Finance, Inc 10 (1) Our loans to owner operators in the state - licensed cannabis industry are secured by additional collateral, including personal and corporate guarantee(s), where applicable subject to local laws and regulations. Loan to enterprise value ratio (LTEV) is calculated as total senior loan principal outstanding divided by total value of collateral on a weighted average basis. (2) Expressed as percentage of total outstanding loan principal of $400.0 million as of September 30, 2025. LOAN TO ENTERPRISE VALUE RATIO (1)(2) REAL ESTATE COVERAGE RATIO (2) Loan Collateral Coverage 43.5% loan to enterprise value and 1.2x real estate collateral coverage $200,000,000 $180,000,000 $160,000,000 $140,000,000 $120,000,000 $100,000,000 $80,000,000 $60,000,000 $40,000,000 $20,000,000 $ - <20% >80% 21 - 40% 41 - 60% 61 - 80% Portfolio Weighted Average (43.5%) 0.0% 5.0% 10.0% 15.0% 20.0% 25.0% 30.0% 35.0% 40.0% <.50x 0.51 - 1.00x 1.01 - 1.50x 1.51 - 2.00x Portfolio Weighted Average (1.2x) >2.0x
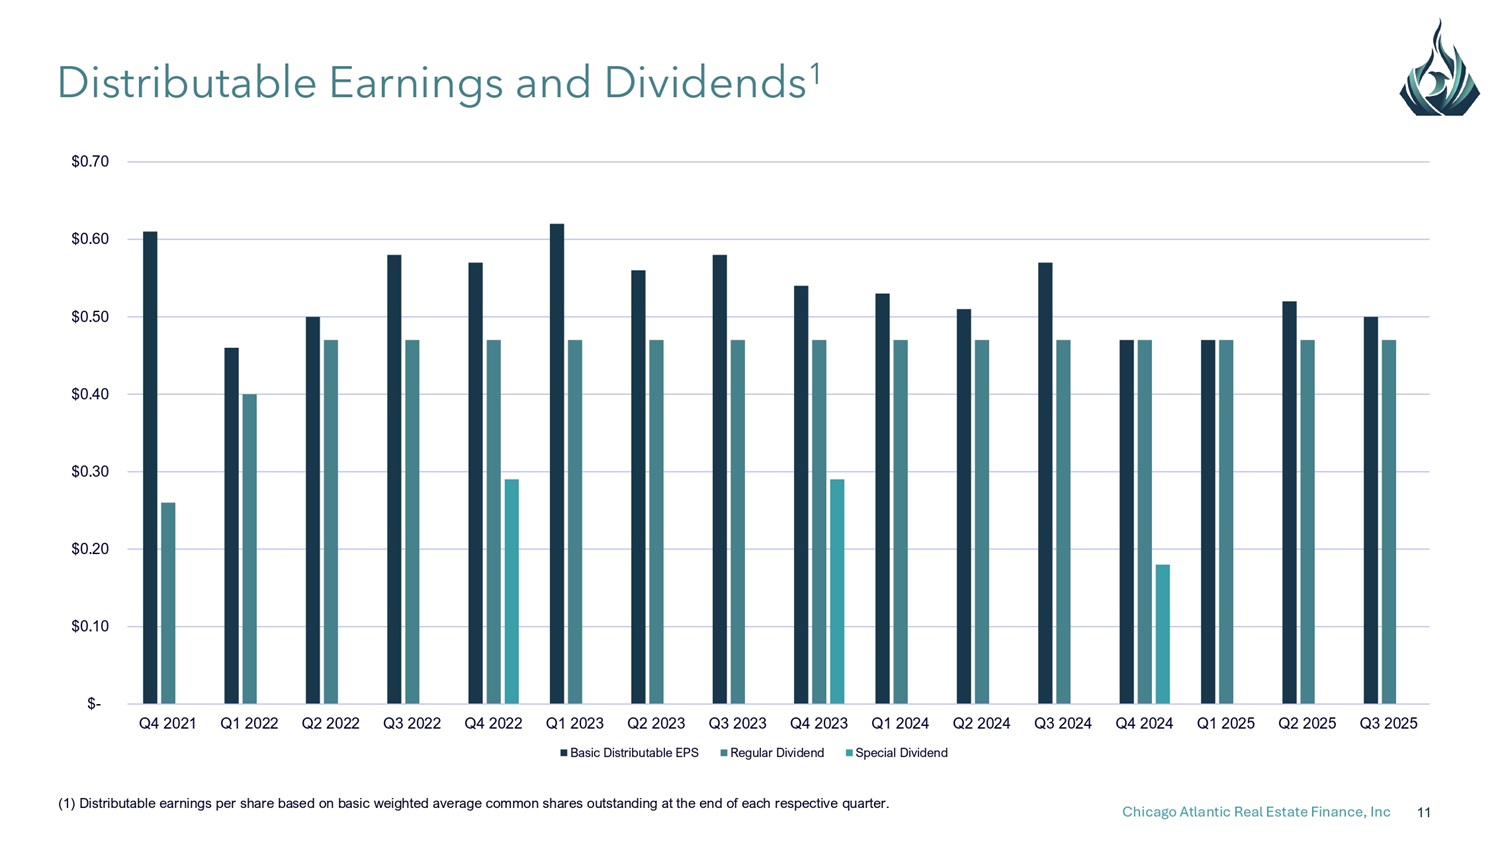
Chicago Atlantic Real Estate Finance, Inc 11 (1) Distributable earnings per share based on basic weighted average common shares outstanding at the end of each respective quarter. Distributable Earnings and Dividends 1 $ - $0.10 $0.20 $0.30 $0.40 $0.50 $0.60 $0.70 Q4 2021 Q1 2022 Q2 2022 Q3 2022 Q4 2022 Q1 2023 Q2 2023 Q3 2023 Q4 2023 Q1 2024 Q2 2024 Q3 2024 Q4 2024 Q1 2025 Q2 2025 Q3 2025 Special Dividend Basic Distributable EPS Regular Dividend
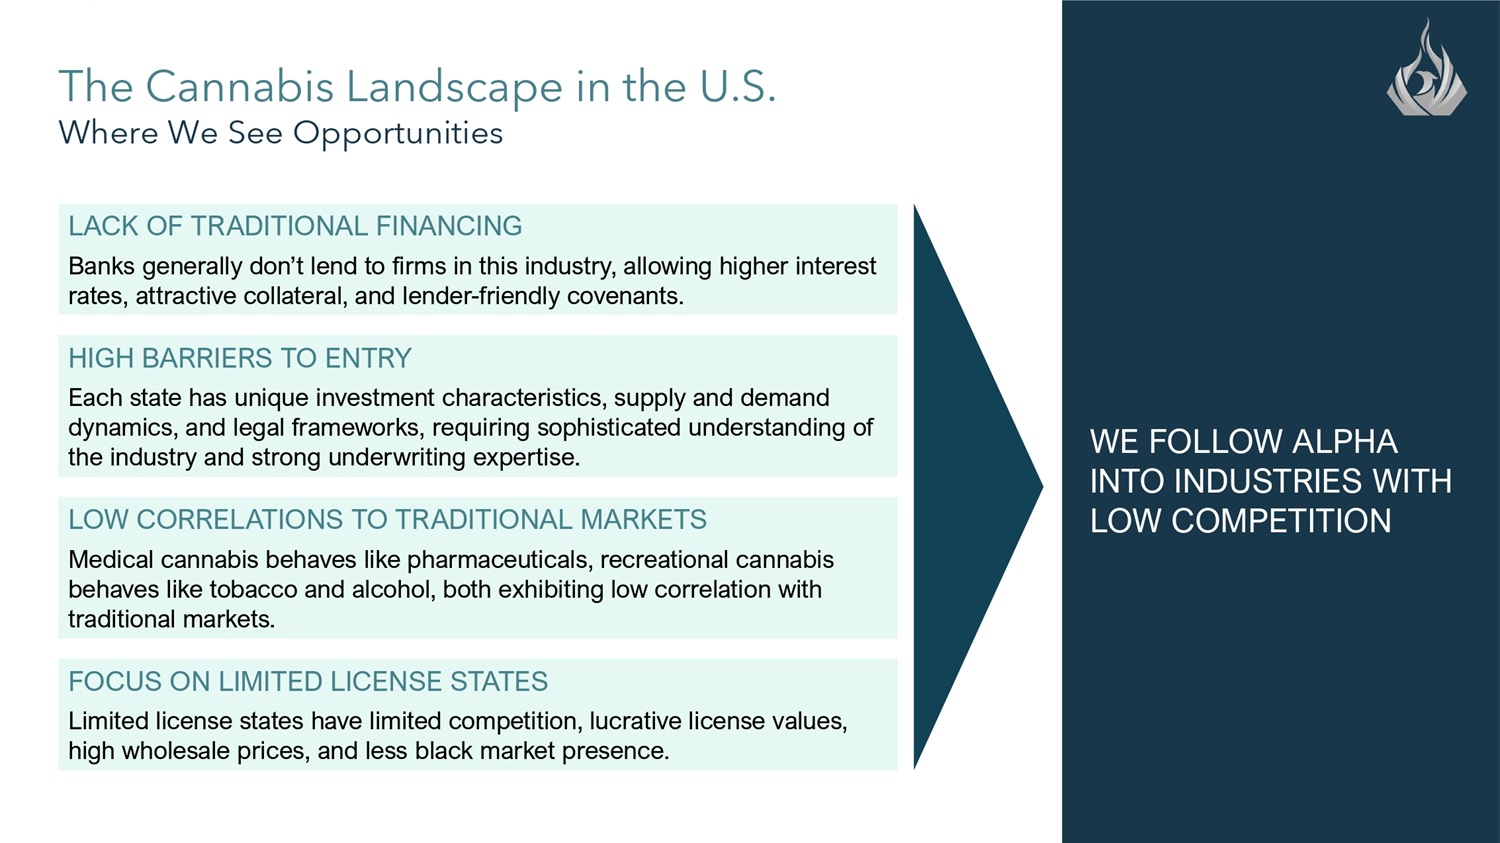
Chicago Atlantic Real Estate Finance, Inc 12 The Cannabis Landscape in the U.S. Where We See Opportunities WE FOLLOW ALPHA INTO INDUSTRIES WITH LOW COMPETITION LACK OF TRADITIONAL FINANCING Banks generally don’t lend to firms in this industry, allowing higher interest rates, attractive collateral, and lender - friendly covenants. LOW CORRELATIONS TO TRADITIONAL MARKETS Medical cannabis behaves like pharmaceuticals, recreational cannabis behaves like tobacco and alcohol, both exhibiting low correlation with traditional markets. HIGH BARRIERS TO ENTRY Each state has unique investment characteristics, supply and demand dynamics, and legal frameworks, requiring sophisticated understanding of the industry and strong underwriting expertise. FOCUS ON LIMITED LICENSE STATES Limited license states have limited competition, lucrative license values, high wholesale prices, and less black market presence.
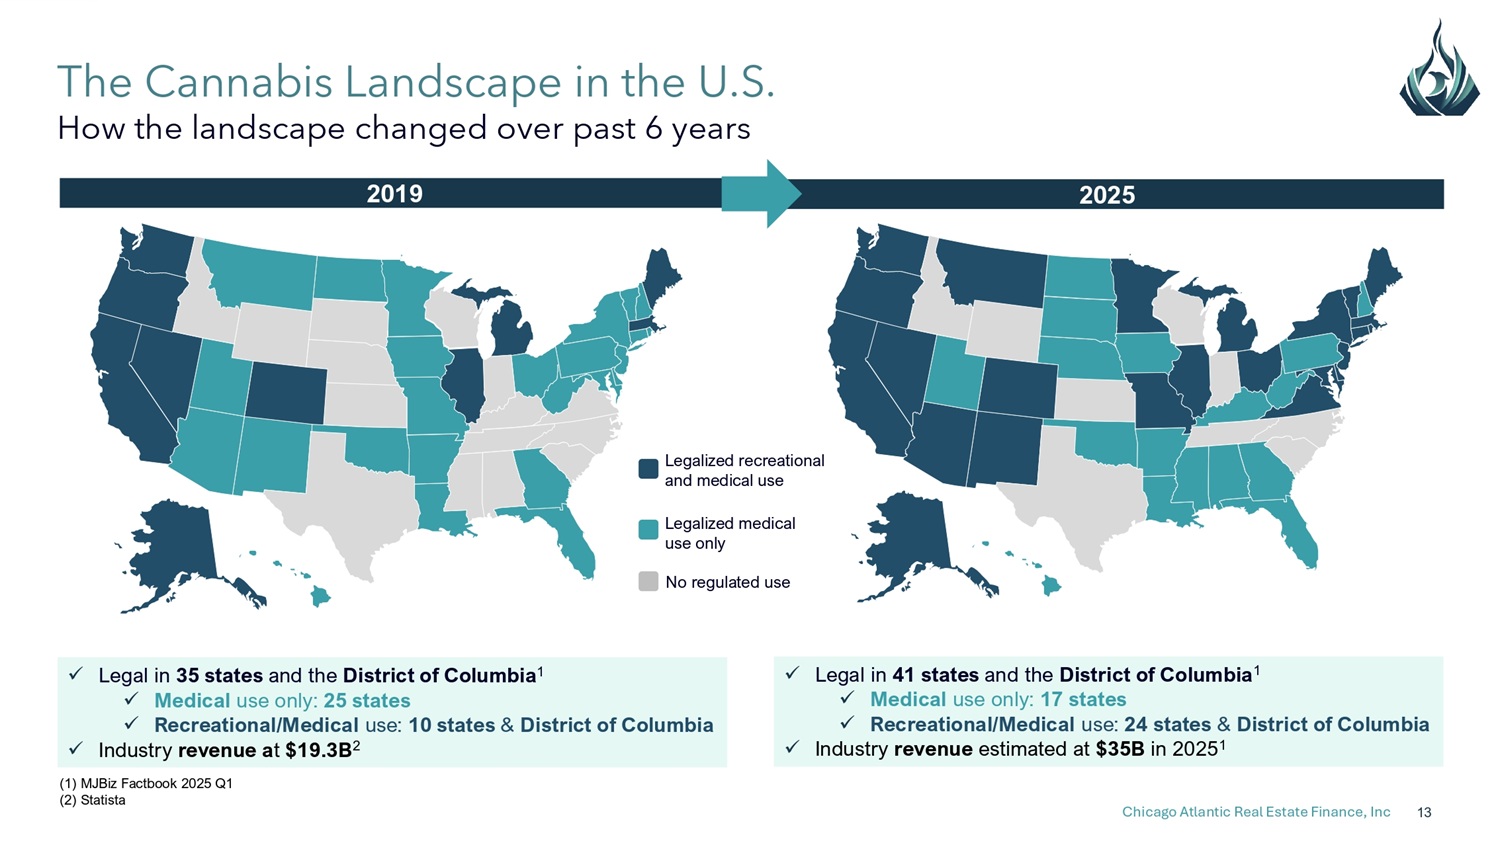
The Cannabis Landscape in the U.S. How the landscape changed over past 6 years 2019 2025 (1) MJBiz Factbook 2025 Q1 (2) Statista x Legal in 41 states and the District of Columbia 1 x Medical use only: 17 states x Recreational/Medical use: 24 states & District of Columbia x Industry revenue estimated at $35B in 2025 1 x Legal in 35 states and the District of Columbia 1 x Medical use only: 25 states x Recreational/Medical use: 10 states & District of Columbia x Industry revenue a t $19.3B 2 Legalized recreational and medical use Legalized medical use only No regulated use Chicago Atlantic Real Estate Finance, Inc 13
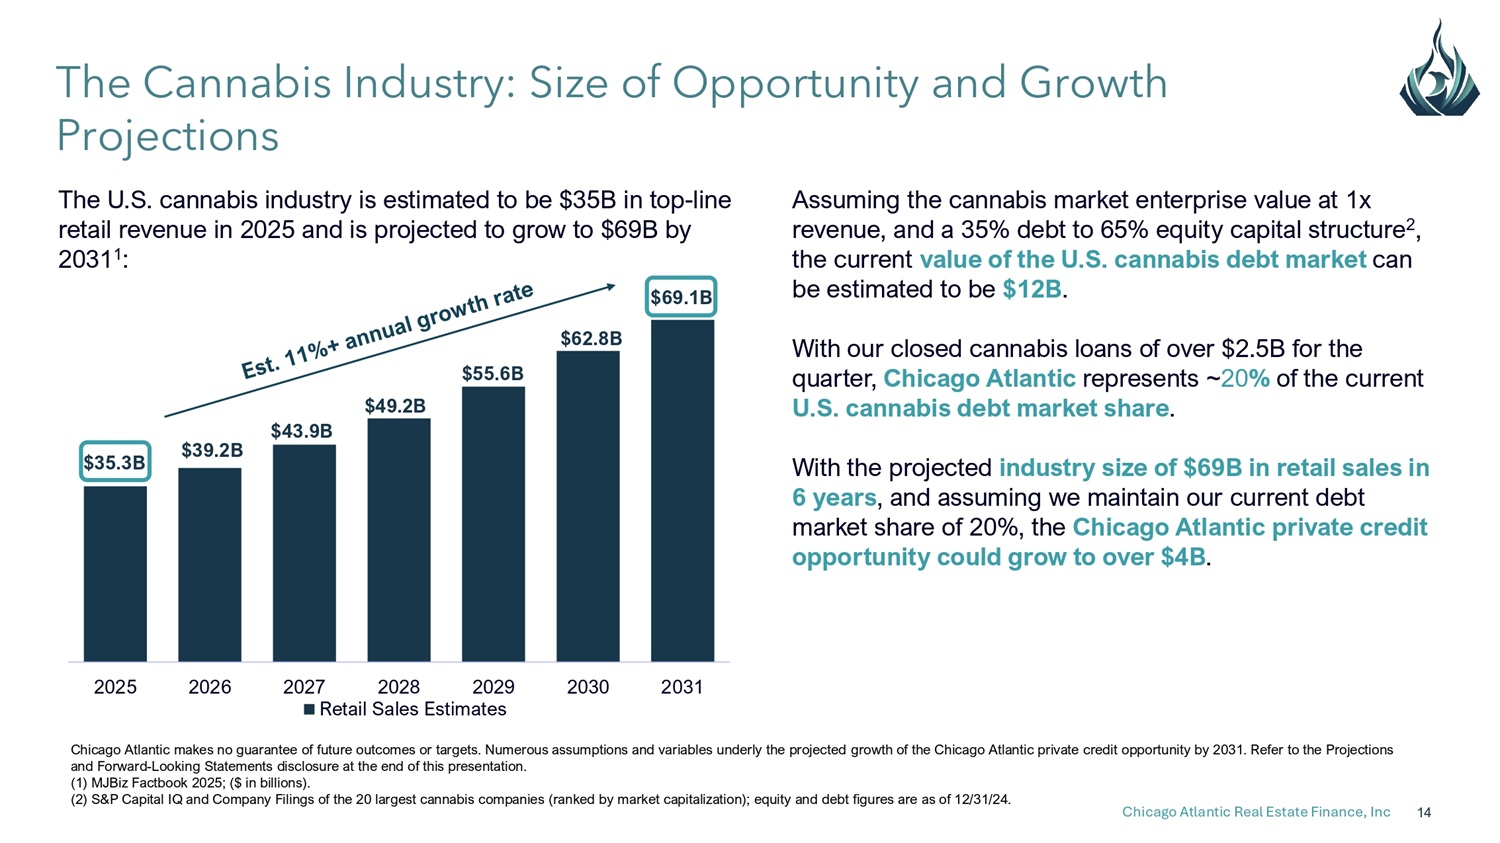
The Cannabis Industry: Size of Opportunity and Growth Projections Assuming the cannabis market enterprise value at 1x revenue, and a 35% debt to 65% equity capital structure 2 , the current value of the U.S. cannabis debt market can be estimated to be $12B . With our closed cannabis loans of over $2.5B for the quarter, Chicago Atlantic represents ~ 20 % of the current U.S. cannabis debt market share . With the projected industry size of $69B in retail sales in 6 years , and assuming we maintain our current debt market share of 20%, the Chicago Atlantic private credit opportunity could grow to over $4B . 2025 2026 2027 2028 2029 2030 2031 Retail Sales Estimates Chicago Atlantic makes no guarantee of future outcomes or targets. Numerous assumptions and variables underly the projected growth of the Chicago Atlantic private credit opportunity by 2031. Refer to the Projections and Forward - Looking Statements disclosure at the end of this presentation. (1) MJBiz Factbook 2025; ($ in billions). (2) S&P Capital IQ and Company Filings of the 20 largest cannabis companies (ranked by market capitalization); equity and debt figures are as of 12/31/24. $35.3B $39.2B $43.9B $49.2B $55.6B $62.8B The U.S. cannabis industry is estimated to be $35B in top - line retail revenue in 2025 and is projected to grow to $69B by 2031 1 : $69.1B Chicago Atlantic Real Estate Finance, Inc 14
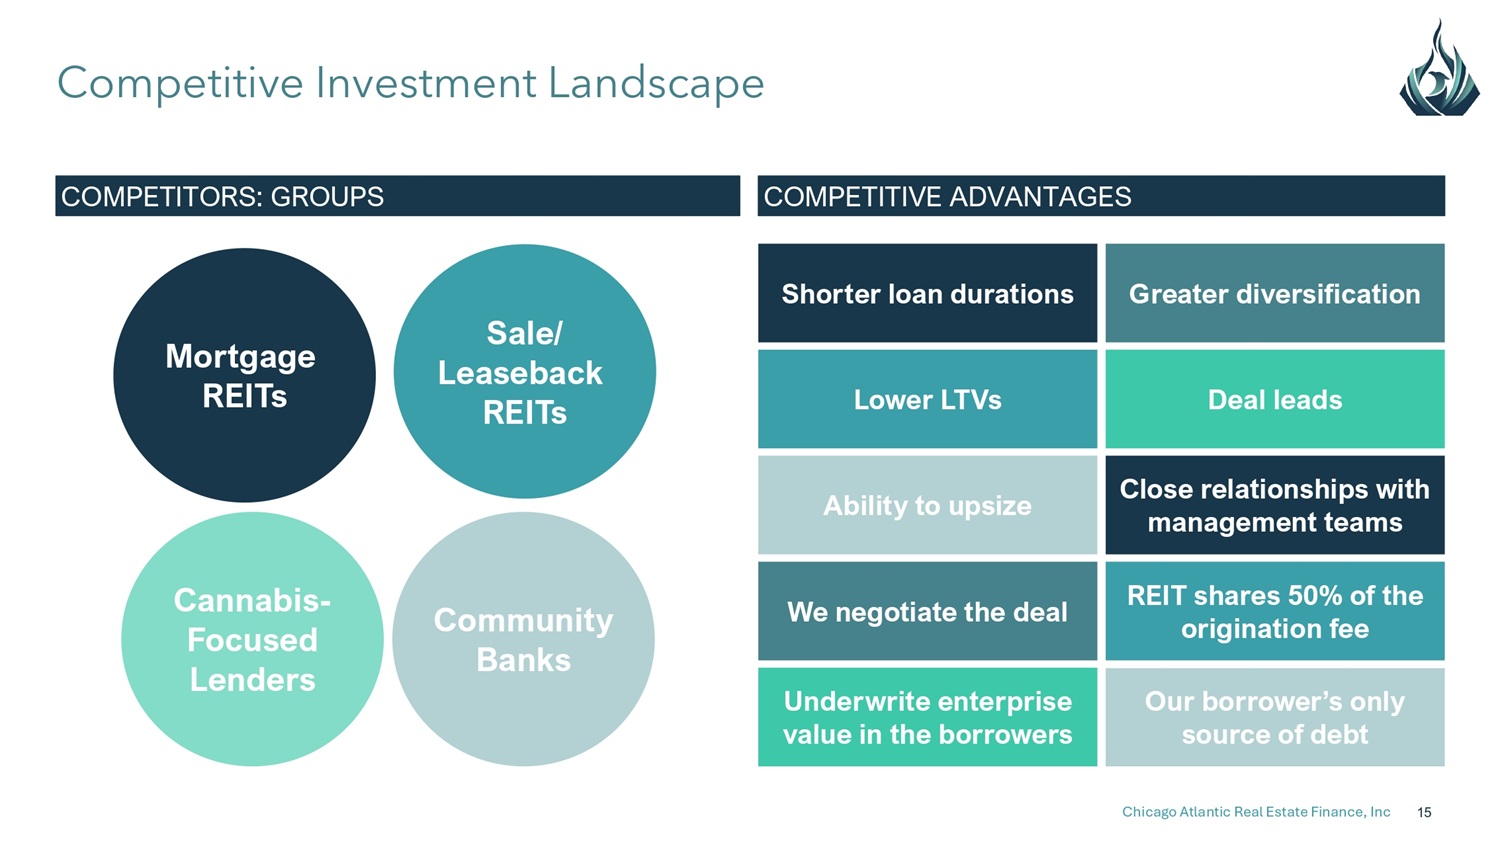
COMPETITORS: GROUPS COMPETITIVE ADVANTAGES Competitive Investment Landscape Mortgage REITs Sale/ Leaseback REITs Cannabis - Focused Lenders Community Banks Chicago Atlantic Real Estate Finance, Inc 15 Greater diversification Shorter loan durations Deal leads Lower LTVs Close relationships with management teams Ability to upsize REIT shares 50% of the origination fee We negotiate the deal Our borrower’s only source of debt Underwrite enterprise value in the borrowers
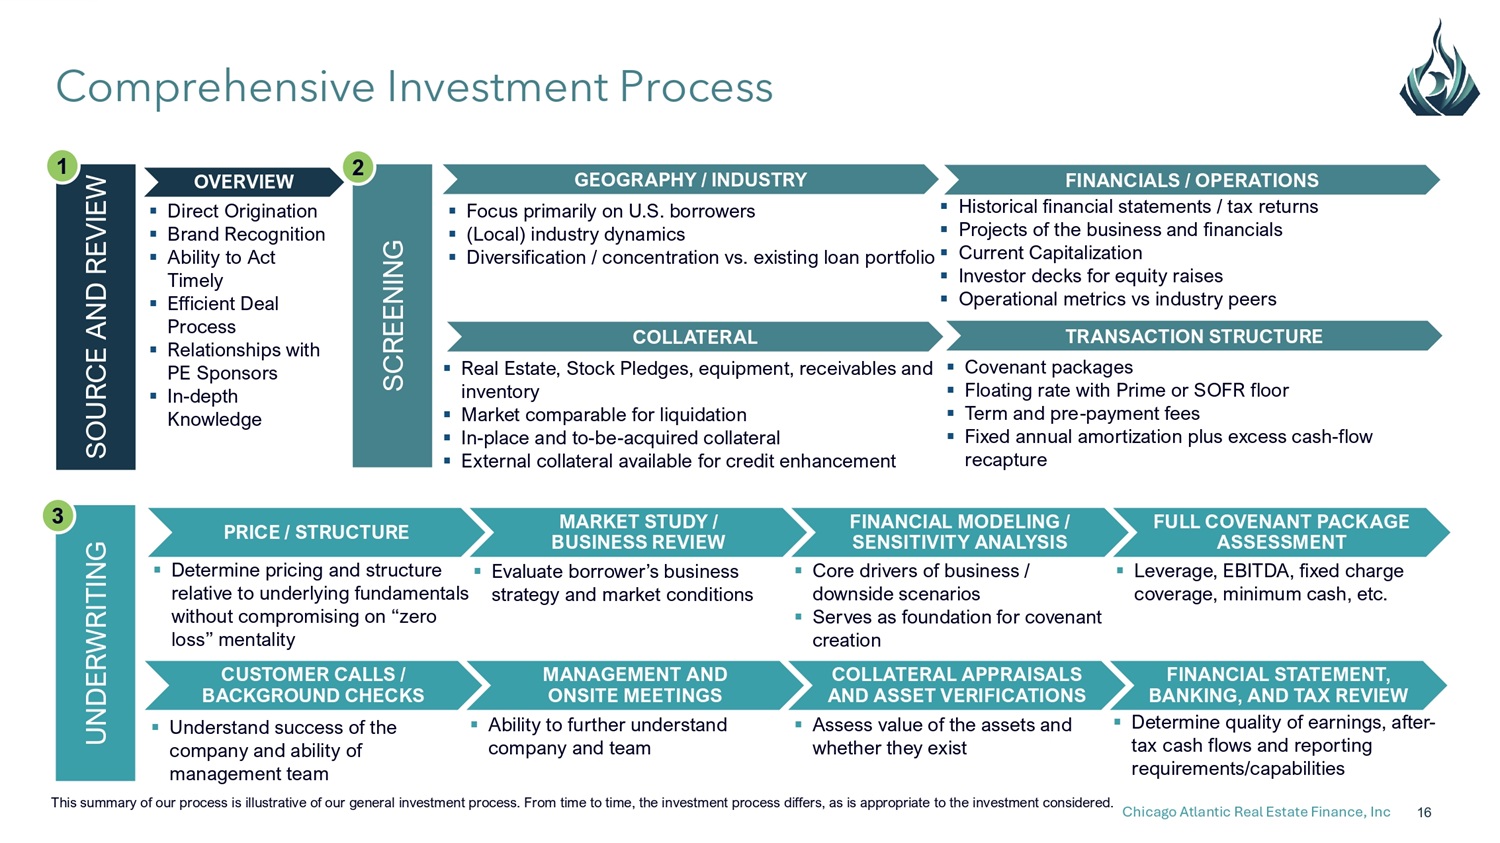
MANAGEMENT AND ONSITE MEETINGS Comprehensive Investment Process SOURCE AND REVIEW 1 SCREENING 2 GEOGRAPHY / INDUSTRY ▪ Focus primarily on U.S. borrowers ▪ (Local) industry dynamics FINANCIALS / OPERATIONS ▪ Historical financial statements / tax returns ▪ Projects of the business and financials ▪ Diversification / concentration vs. existing loan portfolio ▪ Current Capitalization COLLATERAL ▪ Real Estate, Stock Pledges, equipment, receivables and inventory ▪ Market comparable for liquidation ▪ In - place and to - be - acquired collateral ▪ External collateral available for credit enhancement ▪ Investor decks for equity raises ▪ Operational metrics vs industry peers TRANSACTION STRUCTURE ▪ Covenant packages ▪ Floating rate with Prime or SOFR floor ▪ Term and pre - payment fees ▪ Fixed annual amortization plus excess cash - flow recapture UNDERWRITING 3 MARKET STUDY / BUSINESS REVIEW ▪ Evaluate borrower’s business strategy and market conditions FULL COVENANT PACKAGE ASSESSMENT ▪ Leverage, EBITDA, fixed charge coverage, minimum cash, etc. ▪ Ability to further understand company and team FINANCIAL MODELING / SENSITIVITY ANALYSIS ▪ Core drivers of business / downside scenarios ▪ Serves as foundation for covenant creation COLLATERAL APPRAISALS AND ASSET VERIFICATIONS ▪ Assess value of the assets and whether they exist OVERVIEW ▪ Direct Origination ▪ Brand Recognition ▪ Ability to Act Timely ▪ Efficient Deal Process ▪ Relationships with PE Sponsors ▪ In - depth Knowledge PRICE / STRUCTURE ▪ Determine pricing and structure relative to underlying fundamentals without compromising on “zero loss” mentality CUSTOMER CALLS / BACKGROUND CHECKS ▪ Understand success of the company and ability of management team FINANCIAL STATEMENT, BANKING, AND TAX REVIEW ▪ Determine quality of earnings, after - tax cash flows and reporting requirements/capabilities This summary of our process is illustrative of our general investment process. From time to time, the investment process differs, as is appropriate to the investment considered. Chicago Atlantic Real Estate Finance, Inc 16
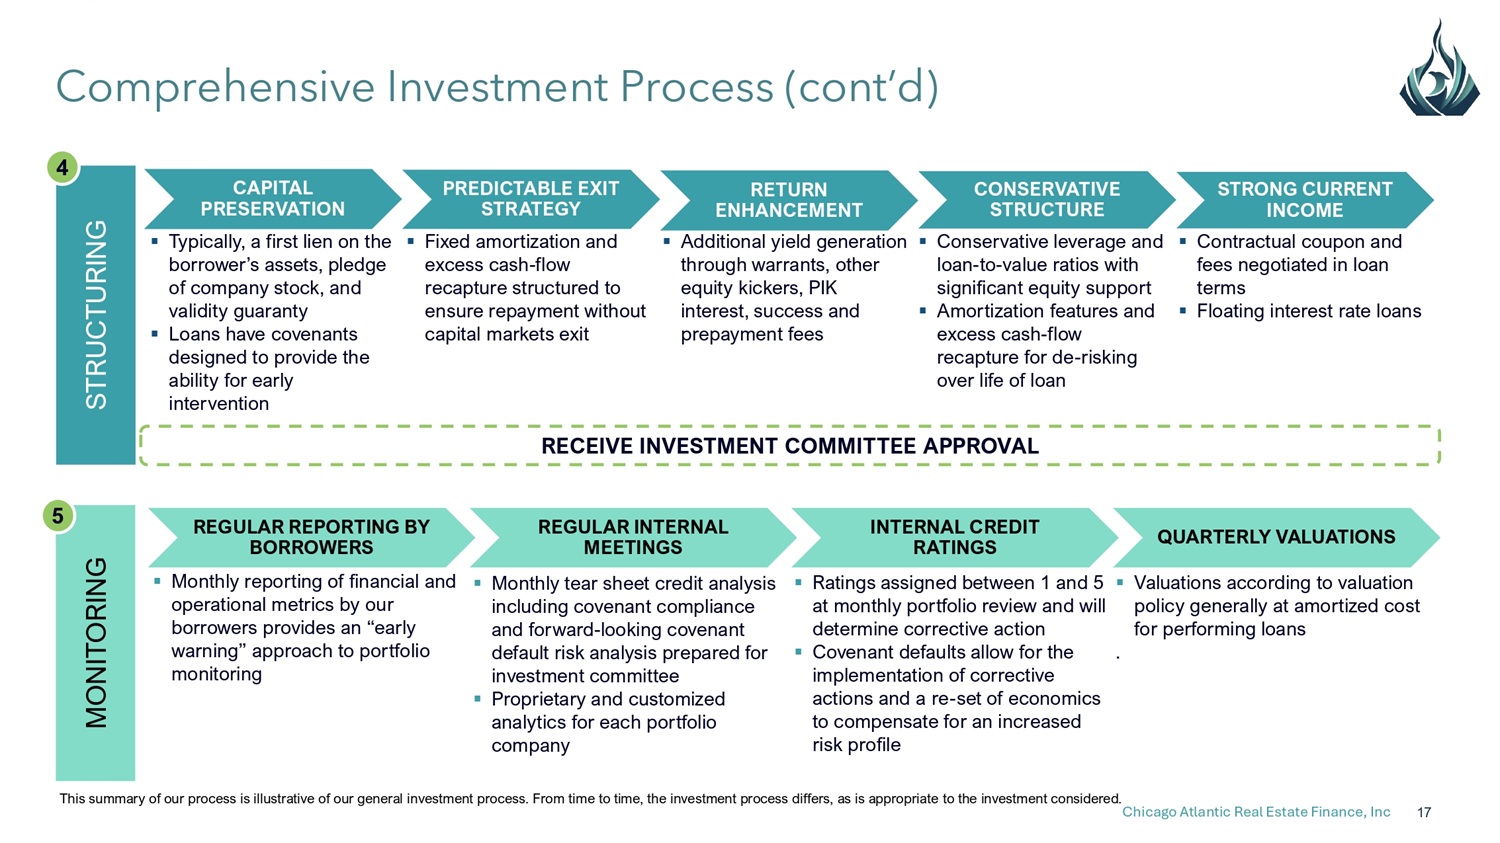
Comprehensive Investment Process (cont’d) STRUCTURING 4 MONITORING 5 QUARTERLY VALUATIONS REGULAR REPORTING BY BORROWERS ▪ Monthly reporting of financial and operational metrics by our borrowers provides an “early warning” approach to portfolio monitoring REGULAR INTERNAL MEETINGS ▪ Monthly tear sheet credit analysis including covenant compliance and forward - looking covenant default risk analysis prepared for investment committee ▪ Proprietary and customized analytics for each portfolio company INTERNAL CREDIT RATINGS ▪ Ratings assigned between 1 and 5 at monthly portfolio review and will determine corrective action ▪ Covenant defaults allow for the implementation of corrective actions and a re - set of economics to compensate for an increased risk profile ▪ Valuations according to valuation policy generally at amortized cost for performing loans . CAPITAL PRESERVATION ▪ Typically, a first lien on the borrower’s assets, pledge of company stock, and validity guaranty ▪ Loans have covenants designed to provide the ability for early intervention RETURN ENHANCEMENT CONSERVATIVE STRUCTURE STRONG CURRENT INCOME ▪ Contractual coupon and fees negotiated in loan terms ▪ Floating interest rate loans loan - to - value ratios with significant equity support ▪ Amortization features and excess cash - flow recapture for de - risking over life of loan ▪ Additional yield generation ▪ Conservative leverage and through warrants, other equity kickers, PIK interest, success and prepayment fees PREDICTABLE EXIT STRATEGY ▪ Fixed amortization and excess cash - flow recapture structured to ensure repayment without capital markets exit RECEIVE INVESTMENT COMMITTEE APPROVAL This summary of our process is illustrative of our general investment process. From time to time, the investment process differs, as is appropriate to the investment considered. Chicago Atlantic Real Estate Finance, Inc 17

Appendix Financial Overview For the three months ended September 30, 2025
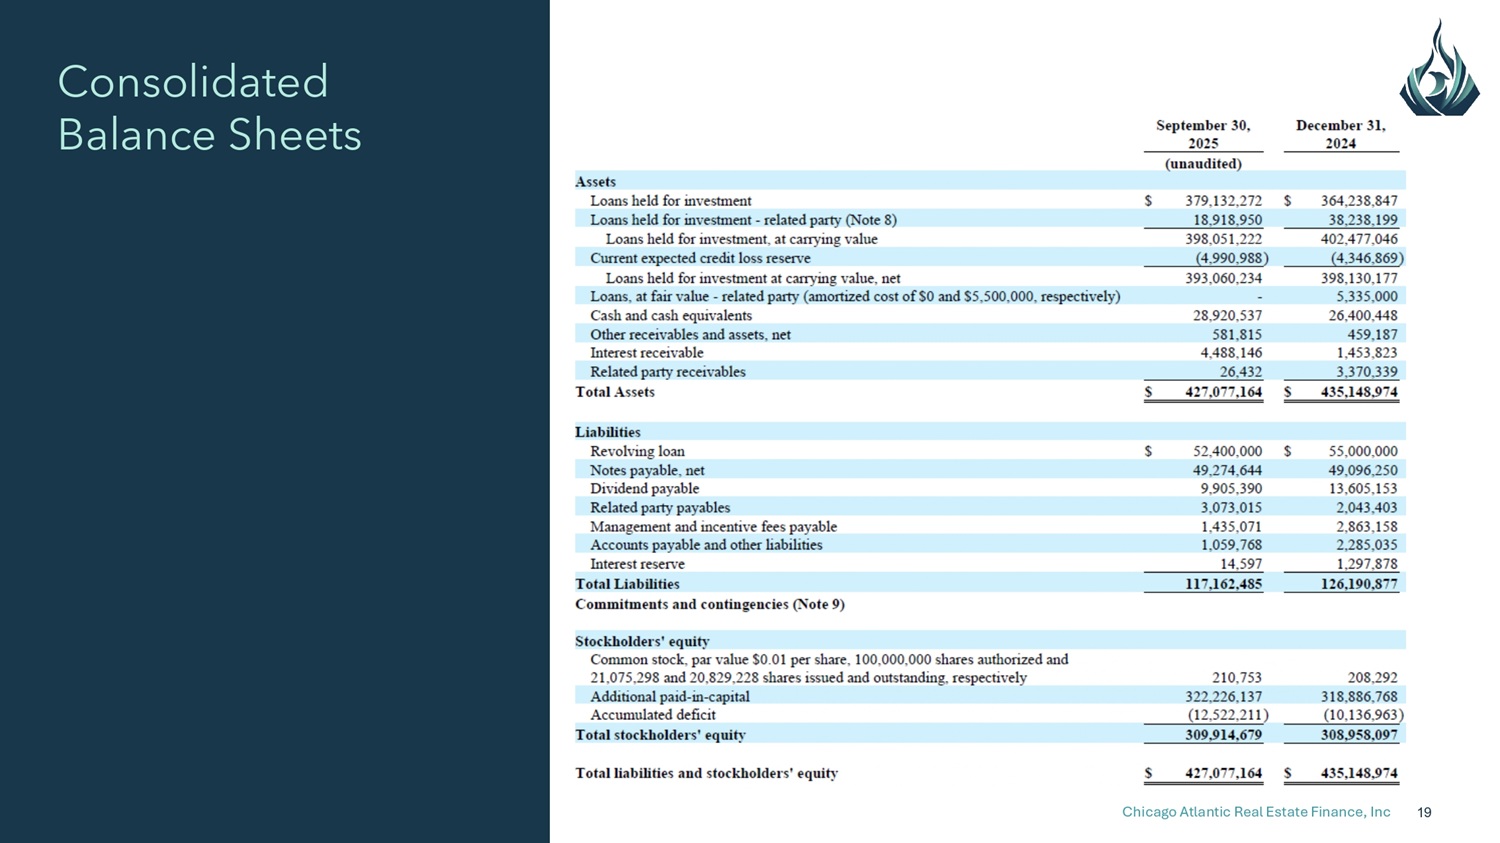
Consolidated Balance Sheets Chicago Atlantic Real Estate Finance, Inc 19
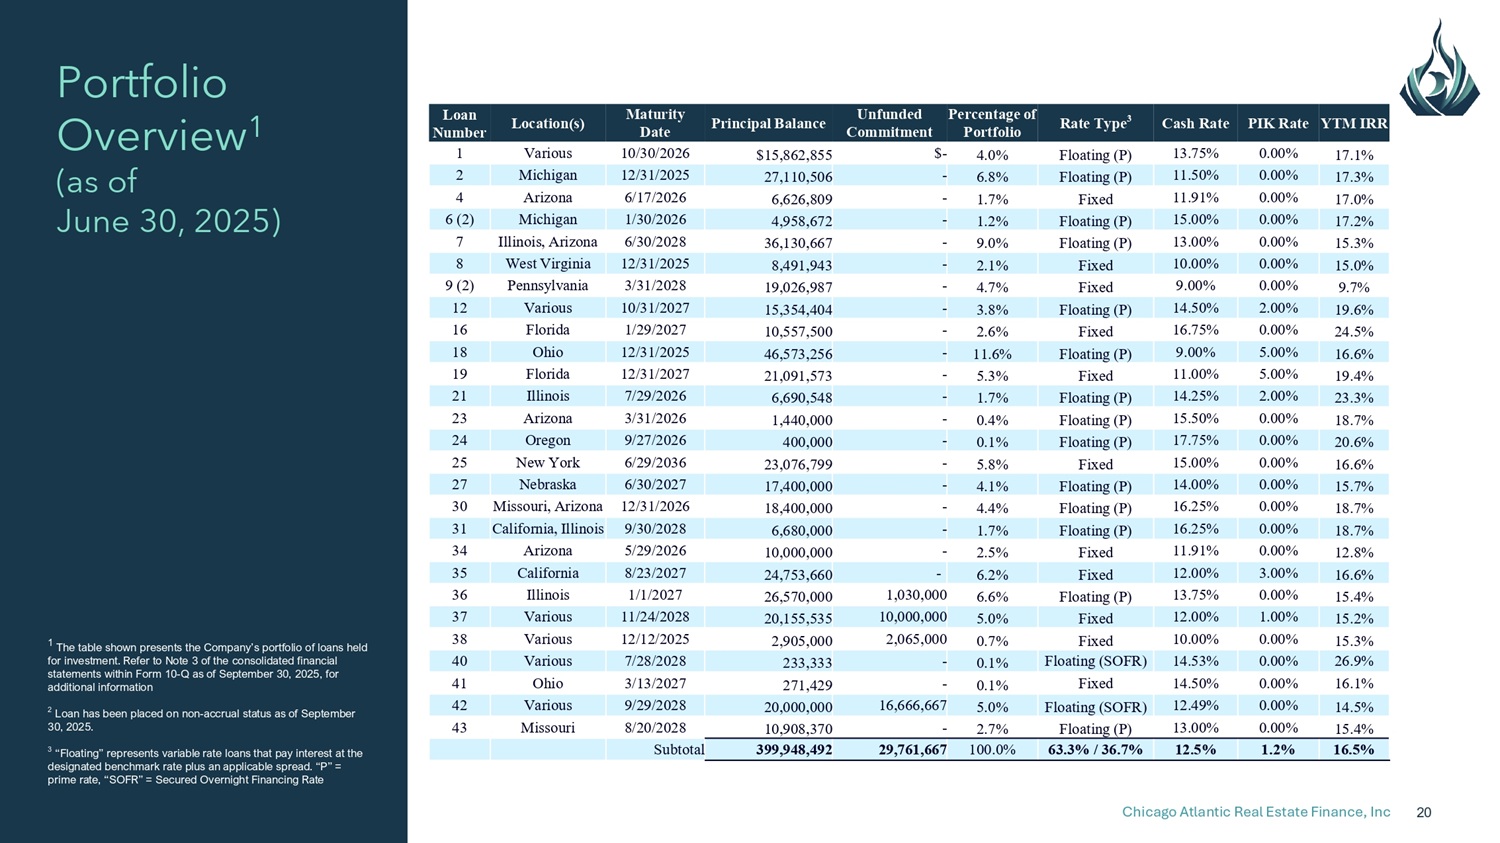
1 The table shown presents the Company’s portfolio of loans held for investment. Refer to Note 3 of the consolidated financial statements within Form 10 - Q as of September 30, 2025, for additional information 2 Loan has been placed on non - accrual status as of September 30, 2025. 3 “Floating” represents variable rate loans that pay interest at the designated benchmark rate plus an applicable spread. “P” = prime rate, “SOFR” = Secured Overnight Financing Rate Chicago Atlantic Real Estate Finance, Inc 20 Portfolio Overview 1 (as of June 30, 2025) YTM IRR PIK Rate Cash Rate Rate Type 3 Percentage of Portfolio Unfunded Commitment Principal Balance Maturity Date Location(s) Loan Number 17.1% 0.00% 13.75% Floating (P) 4.0% $ - $15,862,855 10/30/2026 Various 1 17.3% 0.00% 11.50% Floating (P) 6.8% - 27,110,506 12/31/2025 Michigan 2 17.0% 0.00% 11.91% Fixed 1.7% - 6,626,809 6/17/2026 Arizona 4 17.2% 0.00% 15.00% Floating (P) 1.2% - 4,958,672 1/30/2026 Michigan 6 (2) 15.3% 0.00% 13.00% Floating (P) 9.0% - 36,130,667 6/30/2028 Illinois, Arizona 7 15.0% 0.00% 10.00% Fixed 2.1% - 8,491,943 12/31/2025 West Virginia 8 9.7% 0.00% 9.00% Fixed 4.7% - 19,026,987 3/31/2028 Pennsylvania 9 (2) 19.6% 2.00% 14.50% Floating (P) 3.8% - 15,354,404 10/31/2027 Various 12 24.5% 0.00% 16.75% Fixed 2.6% - 10,557,500 1/29/2027 Florida 16 16.6% 5.00% 9.00% Floating (P) 11.6% - 46,573,256 12/31/2025 Ohio 18 19.4% 5.00% 11.00% Fixed 5.3% - 21,091,573 12/31/2027 Florida 19 23.3% 2.00% 14.25% Floating (P) 1.7% - 6,690,548 7/29/2026 Illinois 21 18.7% 0.00% 15.50% Floating (P) 0.4% - 1,440,000 3/31/2026 Arizona 23 20.6% 0.00% 17.75% Floating (P) 0.1% - 400,000 9/27/2026 Oregon 24 16.6% 0.00% 15.00% Fixed 5.8% - 23,076,799 6/29/2036 New York 25 15.7% 0.00% 14.00% Floating (P) 4.1% - 17,400,000 6/30/2027 Nebraska 27 18.7% 0.00% 16.25% Floating (P) 4.4% - 18,400,000 12/31/2026 Missouri, Arizona 30 18.7% 0.00% 16.25% Floating (P) 1.7% - 6,680,000 9/30/2028 California, Illinois 31 12.8% 0.00% 11.91% Fixed 2.5% - 10,000,000 5/29/2026 Arizona 34 16.6% 3.00% 12.00% Fixed 6.2% - 24,753,660 8/23/2027 California 35 15.4% 0.00% 13.75% Floating (P) 6.6% 1,030,000 26,570,000 1/1/2027 Illinois 36 15.2% 1.00% 12.00% Fixed 5.0% 10,000,000 20,155,535 11/24/2028 Various 37 15.3% 0.00% 10.00% Fixed 0.7% 2,065,000 2,905,000 12/12/2025 Various 38 26.9% 0.00% 14.53% Floating (SOFR) 0.1% - 233,333 7/28/2028 Various 40 16.1% 0.00% 14.50% Fixed 0.1% - 271,429 3/13/2027 Ohio 41 14.5% 0.00% 12.49% Floating (SOFR) 5.0% 16,666,667 20,000,000 9/29/2028 Various 42 15.4% 0.00% 13.00% Floating (P) 2.7% - 10,908,370 8/20/2028 Missouri 43 16.5% 1.2% 12.5% 63.3% / 36.7% 100.0% 29,761,667 399,948,492 Subtotal
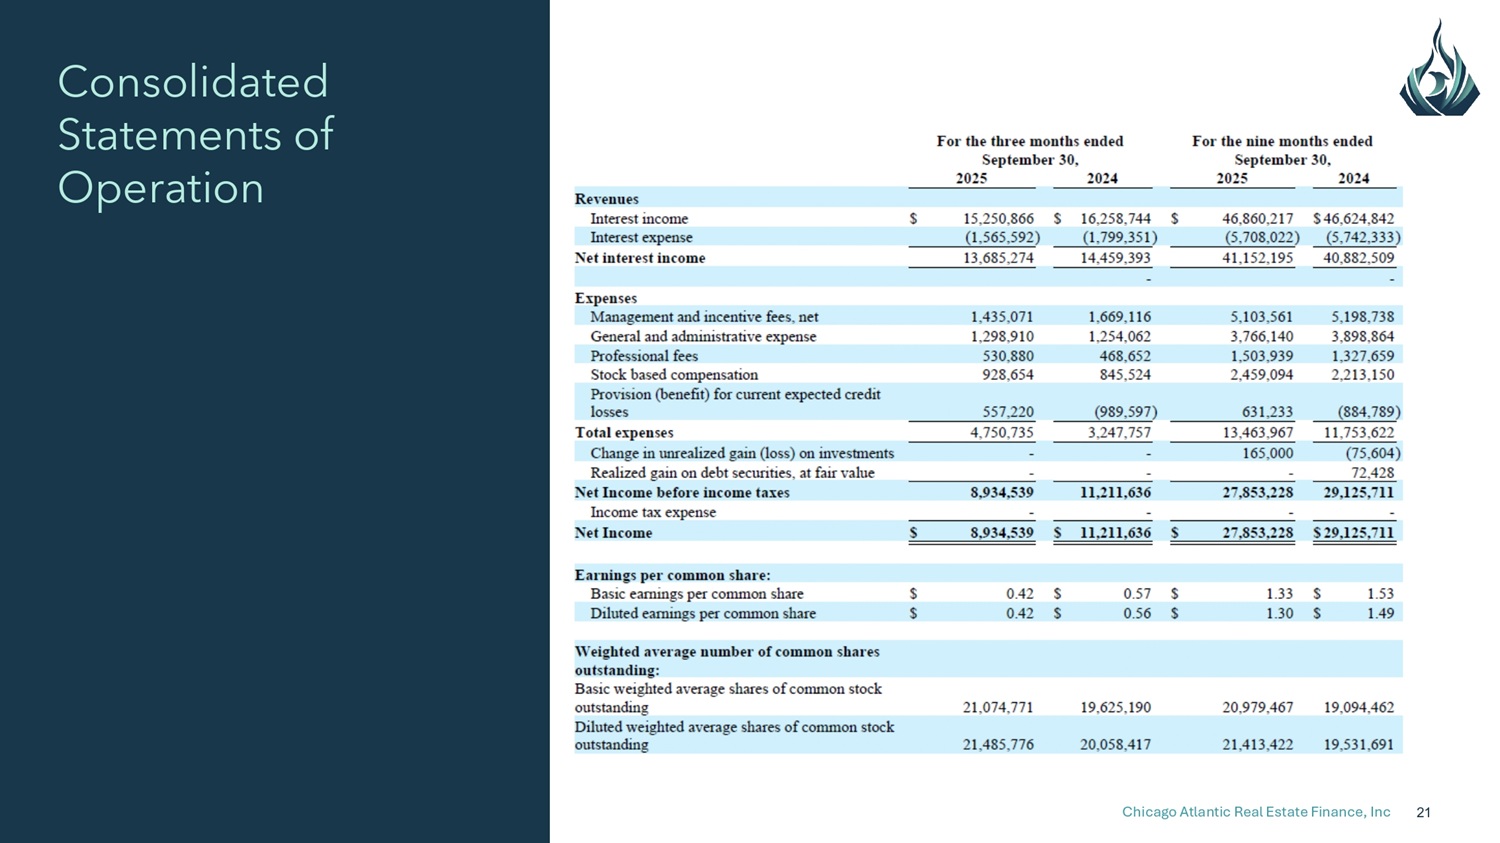
Consolidated Statements of Operation Chicago Atlantic Real Estate Finance, Inc 21
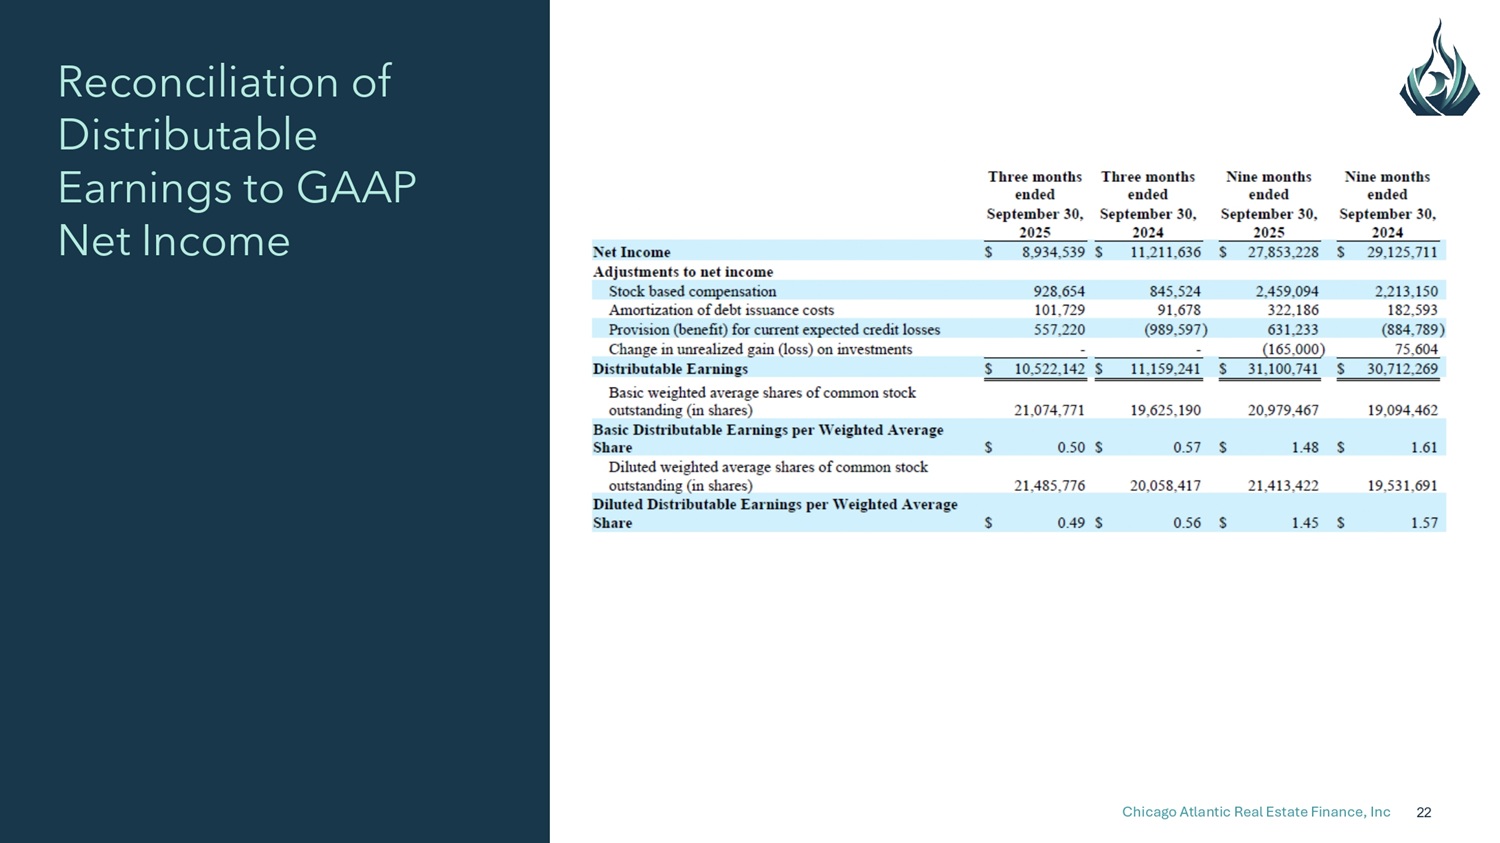
Reconciliation of Distributable Earnings to GAAP Net Income Chicago Atlantic Real Estate Finance, Inc 22
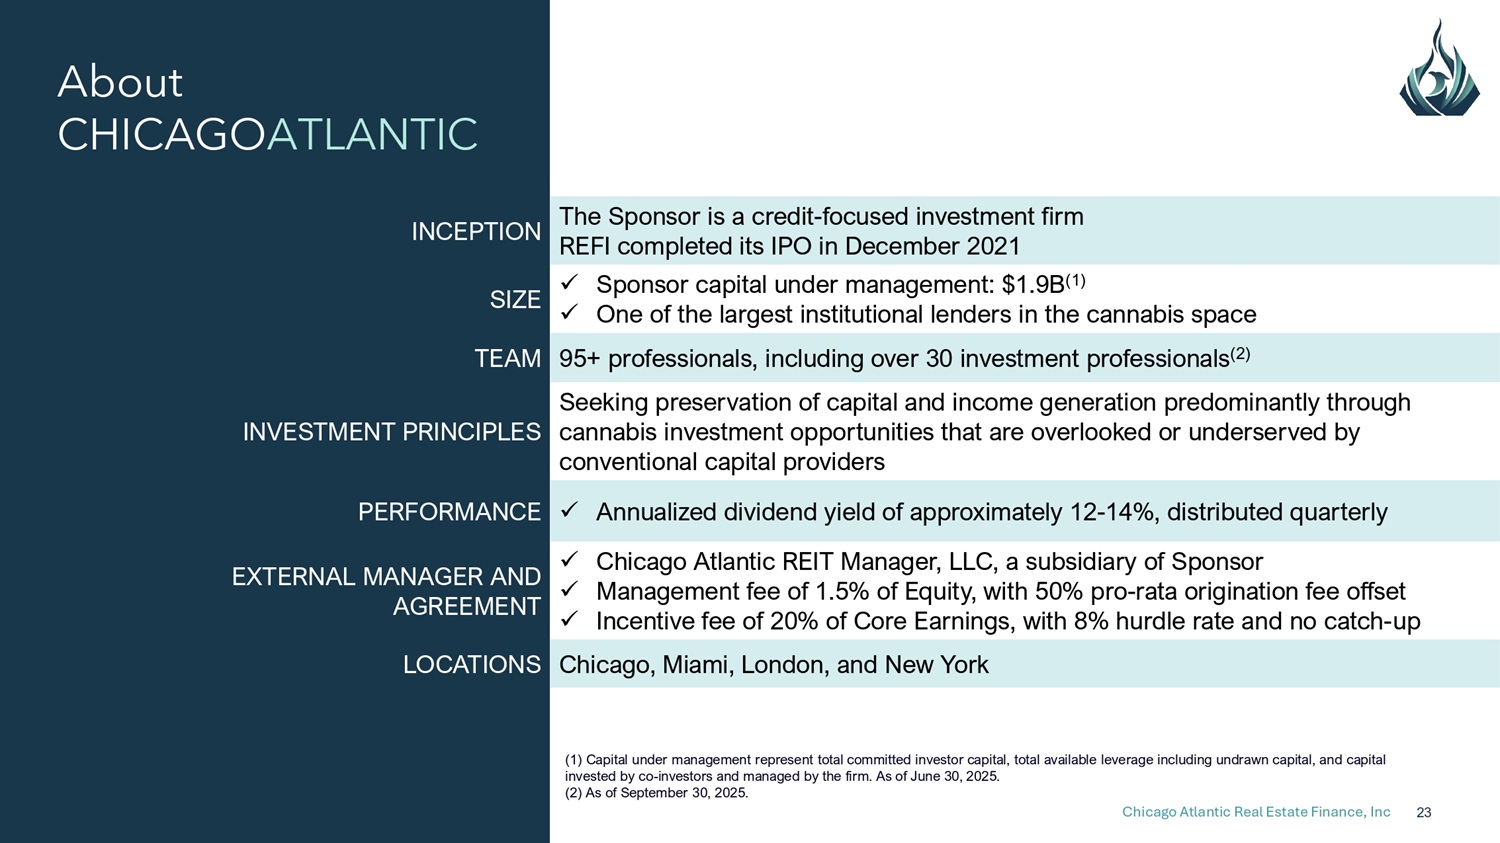
About CHICAGO ATLANTIC Chicago Atlantic Real Estate Finance, Inc 23 (1) Capital under management represent total committed investor capital, total available leverage including undrawn capital, and capital invested by co - investors and managed by the firm. As of June 30, 2025. (2) As of September 30, 2025. The Sponsor is a credit - focused investment firm REFI completed its IPO in December 2021 INCEPTION x Sponsor capital under management: $1.9B (1) x One of the largest institutional lenders in the cannabis space SIZE 95+ professionals, including over 30 investment professionals (2) TEAM Seeking preservation of capital and income generation predominantly through cannabis investment opportunities that are overlooked or underserved by conventional capital providers INVESTMENT PRINCIPLES x Annualized dividend yield of approximately 12 - 14%, distributed quarterly PERFORMANCE x Chicago Atlantic REIT Manager, LLC, a subsidiary of Sponsor x Management fee of 1.5% of Equity, with 50% pro - rata origination fee offset x Incentive fee of 20% of Core Earnings, with 8% hurdle rate and no catch - up EXTERNAL MANAGER AND AGREEMENT Chicago, Miami, London, and New York LOCATIONS